Correcting Common Errors in Identifying Cancer-Specific Serum Peptide Signatures
27
Correcting Common Errors in Identifying Cancer-Specific Serum Peptide Signatures † Josep Villanueva ‡,§ , John Philip ‡ , Carlos A. Chaparro ‡ , Yongbiao Li || , Ricardo Toledo- Crow §,|| , Lin DeNoyer ^ , Martin Fleisher ⊥ , Richard J. Robbins # , and Paul Tempst *,‡,§ Protein Center, Molecular Biology Program, Engineering Resource Laboratory, Department of Clinical Laboratories, Department of Medicine, Memorial Sloan-Kettering Cancer Center, New York, New York 10021; Spectrum Square Associates, Ithaca, New York 14850 Abstract ‘Molecular signatures’ are the qualitative and quantitative patterns of groups of biomolecules (e.g., mRNA, proteins, peptides, or metabolites) in a cell, tissue, biological fluid, or an entire organism. To apply this concept to biomarker discovery, the measurements should ideally be noninvasive and performed in a single read-out. We have therefore developed a peptidomics platform that couples magnetics-based, automated solid-phase extraction of small peptides with a high-resolution MALDI- TOF mass spectrometric readout (Villanueva, J.; Philip, J.; Entenberg, D.; Chaparro, C. A.; Tanwar, M. K.; Holland, E. C.; Tempst, P. Anal. Chem. 2004, 76, 1560–1570). Since hundreds of peptides can be detected in microliter volumes of serum, it allows to search for disease signatures, for instance in the presence of cancer. We have now evaluated, optimized, and standardized a number of clinical and analytical chemistry variables that are major sources of bias; ranging from blood collection and clotting, to serum storage and handling, automated peptide extraction, crystallization, spectral acquisition, and signal processing. In addition, proper alignment of spectra and user-friendly visualization tools are essential for meaningful, certifiable data mining. We introduce a minimal entropy algorithm, ‘Entropycal’, that simplifies alignment and subsequent statistical analysis and increases the percentage of the highly distinguishing spectral information being retained after feature selection of the datasets. Using the improved analytical platform and tools, and a commercial statistics program, we found that sera from thyroid cancer patients can be distinguished from healthy controls based on an array of 98 discriminant peptides. With adequate technological and computational methods in place, and using rigorously standardized conditions, potential sources of patient related bias (e.g., gender, age, genetics, environmental, dietary, and other factors) may now be addressed. Keywords serum; biomarkers; peptides; patterns; bias; mass spectrometry; peak alignment; specimen collection; sample processing † Part of the Biomarkers special issue. * To whom correspondence should be addressed: Memorial Sloan-Kettering Cancer Center, 1275 York Avenue, New York, NY 10021. E-mail: [email protected].. ‡ Protein Center. § Molecular Biology Program. || Engineering Resource Laboratory. ⊥ Department of Clinical Laboratories. # Department of Medicine. ^ Spectrum Square Associates. NIH Public Access Author Manuscript J Proteome Res. Author manuscript; available in PMC 2007 April 17. Published in final edited form as: J Proteome Res. 2005 ; 4(4): 1060–1072. NIH-PA Author Manuscript NIH-PA Author Manuscript NIH-PA Author Manuscript
-
Upload
independent -
Category
Documents
-
view
0 -
download
0
Transcript of Correcting Common Errors in Identifying Cancer-Specific Serum Peptide Signatures

Correcting Common Errors in Identifying Cancer-Specific SerumPeptide Signatures†
Josep Villanueva‡,§, John Philip‡, Carlos A. Chaparro‡, Yongbiao Li||, Ricardo Toledo-Crow§,||, Lin DeNoyer^, Martin Fleisher⊥, Richard J. Robbins#, and Paul Tempst*,‡,§Protein Center, Molecular Biology Program, Engineering Resource Laboratory, Department ofClinical Laboratories, Department of Medicine, Memorial Sloan-Kettering Cancer Center, New York,New York 10021; Spectrum Square Associates, Ithaca, New York 14850
Abstract‘Molecular signatures’ are the qualitative and quantitative patterns of groups of biomolecules (e.g.,mRNA, proteins, peptides, or metabolites) in a cell, tissue, biological fluid, or an entire organism.To apply this concept to biomarker discovery, the measurements should ideally be noninvasive andperformed in a single read-out. We have therefore developed a peptidomics platform that couplesmagnetics-based, automated solid-phase extraction of small peptides with a high-resolution MALDI-TOF mass spectrometric readout (Villanueva, J.; Philip, J.; Entenberg, D.; Chaparro, C. A.; Tanwar,M. K.; Holland, E. C.; Tempst, P. Anal. Chem. 2004, 76, 1560–1570). Since hundreds of peptidescan be detected in microliter volumes of serum, it allows to search for disease signatures, for instancein the presence of cancer. We have now evaluated, optimized, and standardized a number of clinicaland analytical chemistry variables that are major sources of bias; ranging from blood collection andclotting, to serum storage and handling, automated peptide extraction, crystallization, spectralacquisition, and signal processing. In addition, proper alignment of spectra and user-friendlyvisualization tools are essential for meaningful, certifiable data mining. We introduce a minimalentropy algorithm, ‘Entropycal’, that simplifies alignment and subsequent statistical analysis andincreases the percentage of the highly distinguishing spectral information being retained after featureselection of the datasets. Using the improved analytical platform and tools, and a commercial statisticsprogram, we found that sera from thyroid cancer patients can be distinguished from healthy controlsbased on an array of 98 discriminant peptides. With adequate technological and computationalmethods in place, and using rigorously standardized conditions, potential sources of patient relatedbias (e.g., gender, age, genetics, environmental, dietary, and other factors) may now be addressed.
Keywordsserum; biomarkers; peptides; patterns; bias; mass spectrometry; peak alignment; specimen collection;sample processing
†Part of the Biomarkers special issue.* To whom correspondence should be addressed: Memorial Sloan-Kettering Cancer Center, 1275 York Avenue, New York, NY 10021.E-mail: [email protected]..‡Protein Center.§Molecular Biology Program.||Engineering Resource Laboratory.⊥Department of Clinical Laboratories.#Department of Medicine.^Spectrum Square Associates.
NIH Public AccessAuthor ManuscriptJ Proteome Res. Author manuscript; available in PMC 2007 April 17.
Published in final edited form as:J Proteome Res. 2005 ; 4(4): 1060–1072.
NIH
-PA Author Manuscript
NIH
-PA Author Manuscript
NIH
-PA Author Manuscript

1. IntroductionSerum proteomics and peptidomics are gaining popularity among oncologists in their quest forcancer biomarkers with high diagnostic accuracy. This is based on the premise that sera fromcancer patients contain small proteins and peptides, detectable by mass spectrometry (MS),that reflect the presence and the biology of a tumor. Since the first report1 that serumpolypeptide profiling could serve as a diagnostic method for ovarian cancer, many papers haveappeared in the literature using similar approaches.2–5 In a number of these publications,discovery of several biomarker patterns are reported, for various cancers, that have diagnosticsensitivities and specificities approaching 100%. If these early results are as robust andreproducible as they seem, then serum proteomics will undoubtedly attain a prominent andlasting position in the future of cancer diagnostics.
Despite initial excitement, skepticism about the methodology and the results is mounting inthe scientific community.6–10 The simple fact that different research groups have founddifferent discriminatory markers when analyzing similar samples suggests that the serumproteomics methodology may not be reproducible and/or the MS data have been incorrectlyinterpreted. Several lines of evidence indicate that uncontrolled variables related to bothclinical and analytical chemistry may have tainted the published results. Some of the observed“differences” may represent artifacts of blood sample collection and serum preparation, orstorage and handling. In addition, patient related variables such as gender, age, genetic,environmental, dietary, and psychological factors could introduce bias. As many serumproteomic studies have been conducted outside of traditional peptide chemistry/MSlaboratories, key variables affecting sample processing, mass analysis and associated signalprocessing may have been overlooked. Instead, a ‘black box’ approach has usually been takenwhereby serum samples were analyzed using a turnkey, commercial platform and the massdata obtained for large cohorts processed without adequate alignment of the spectra. Such‘blind’ sample processing and analysis, with little or no operator control and without interactivedata reduction, may not be the best way to uncover novel disease markers.
Serum peptidomic profiling has also stimulated bioinformaticists to develop models to analyzeand compare large numbers of data points. Most groups employ ‘training’ and validation setsof both cancer and control samples, or at the very least cross-validation among a single cohortof cases and controls,1–3,11,12 combined with machine learning methods such as supportvector machines (SVM),13 K-nearest neighbor (K-NN)14 or decision trees.12,15 Earlier workutilized entire spectra (≥20 000 data points) as input data 1 but given the paucity of true peptidepeaks, the vast majority of the data points represented instrument noise and made analysisunnecessarily complicated. Extracting ‘real’ peaks, while relatively simple to the expert eye,has now become the focus of considerable informatics effort.7,16,17 Several early reportsclearly illustrate that peptide profiling done with minimal knowledge of protein chemistry andMS can easily result in artifactual findings.
We have previously reported a technology platform for the simultaneous measurement of largenumbers of serum polypeptides.18 It uses magnetic bead-based, solid-phase extraction ofmainly small peptides and a MALDI-TOF MS read-out. The technology is automated on aliquid handling robot in a 96-well microtiter plate format for throughput and reproducibility.The current version utilizes reversed-phase batch processing, although multidimensionalchromatographic procedures could be implemented. The system is intrinsically more sensitivethan any surface capture on chips as spherical particles have larger combined surface areasthan small-diameter spots. When combined with high-resolution MS, hundreds of peptides aredetected in a single droplet of serum. Using our system, we have analyzed several thousandserum samples obtained from cancer patients.
Villanueva et al. Page 2
J Proteome Res. Author manuscript; available in PMC 2007 April 17.
NIH
-PA Author Manuscript
NIH
-PA Author Manuscript
NIH
-PA Author Manuscript

From these observations, and from further studies, we have identified additional uncontrolledvariables in the clinical and analytical chemistry components and in MS signal processing(prior to statistical analysis) that have misled us in the early days, as well as the authors ofsome of the recently published papers, into arriving at falsely positive conclusions. Here, wehighlight some of these pitfalls, and offer simple recommendations to avoid or correctsystematic bias. We also present an improved spectral alignment program and software toolsfor data visualization and interactive analysis.
2. Materials and Methods2.1. Materials
Acetonitrile was obtained from Burdick and Jackson (Muskegon, WI), trifluoroacetic acid(TFA) from Pierce (Rockford, IL). Premade a-cyano-4-hydroxycinnamic acid (ACCA) matrixsolution was purchased from Agilent (Palo Alto, CA). SiMAG-C8/K superparamagnetic,silica-based particles (≤1 micron diameter; 80% iron oxide; nonporous), bearing C8 reversed-phase (RP) ligands, were obtained from Chemicell (Berlin, Germany). Other batches of C8particles (Chemicell) with variously modified properties have also been used for comparativepurposes. Human serum control (# S-7023, lot 034K8937) was obtained from Sigma (St Louis,MO). Serum peptide processing was done in 0.2-mL polypropylene tubes (8-tube strips; or 8× 12-tube ‘Temp Plate II’) from USA Scientific (Ocala, FL).
2.2. Serum SamplesBlood samples from volunteer subjects with no known malignancies and from patientsdiagnosed with metastatic thyroid carcinoma were collected following a clinical protocol. Allcollections were approved by the MSKCC Institutional Review and Privacy Board. Bloodsamples were collected in 8.5-mL, BD Vacutainer SST ‘tiger-top’ tubes (Becton Dickinson #367988, Franklin Lakes, NJ), allowed to clot at room temperature for 1 h, and centrifuged at1400–2000 RCF for 10 min, at RT. Sera (upper phase) were transferred to four 4-mL cryovials(Fisher # 0566966), ~1 mL serum in each, and stored frozen at −80 °C until further use. Thestandard procedure is summarized in Table 1. Upon arrival at the mass spectrometry (MS) lab,the cryovials (source vials) were barcoded using the MSKCC Clinical Proteomics LIMS (seebelow) and a Z4M barcode printer (Zebra Technologies, Vernon Hills, IL). One cryovial ofeach sample was thawed on ice and used to generate nine smaller aliquots (50 μL each) inmicro-eppendorf tubes that were also barcoded and stored at −80 °C in barcoded freezer boxesbefore analysis. Each serum sample had therefore been frozen and thawed twice before it wassubjected to solid-phase peptide extraction and MS (see below).
In selected cases, the standard blood collection and serum preparation protocol was modifiedfor investigative purposes:
2.2.1. Sera Prepared in ‘Red-Top’ Tubes—Blood samples were collected from fromhealthy volunteers in 8.5-mL, BD Vacutainer, glass ‘red-top’ tubes (BD # 366430), and serawere prepared with the same protocol used for the blood collected in SST blood collectiontubes (Table 1).
2.2.2. Clotting Times—Blood samples were collected in 8.5-mL, BD Vacutainer SST tubesand allowed to clot at room temperature for 5 min. (‘t = 0’), 1 and 5 h. The rest of the bloodcollection protocol was the same as in Table 1.
2.2.3. Freeze-Thaw Cycles—Frozen sera were thawed on wet ice and then immediatelyrefrozen on dry ice and returned to −80 °C for 30 min; this procedure was repeated up to 5
Villanueva et al. Page 3
J Proteome Res. Author manuscript; available in PMC 2007 April 17.
NIH
-PA Author Manuscript
NIH
-PA Author Manuscript
NIH
-PA Author Manuscript

times. Aliquots were taken after each freeze-thaw cycle and subjected to automatic solid-phaseextraction and MS.
2.3. Automated, Solid-Phase Peptide ExtractionThe reversed-phase (RP) batch extraction protocol is automated using a ‘Genesis Freedom100’ (Tecan; Research Triangle Park, NC) liquid handling work station 18. Magnetic beadswere generally pulled to the side of the tubes (during ‘binding’, ‘washing’, and ‘elution’). Tothis end, magnetic strips were embedded in the 96-tube holding plates, between the rows-of-eight. This device was constructed using epoxy-coated, Neodymium-iron-boron (NdFeB)magnets (2 3/4"/1/4"/1/8"; L/W/H) from K&D Magnetics (Boca Raton, FL). To resuspend thebeads in a minimal volume of elution solvent, they must first be collected at the bottom of thetubes, requiring the magnets to be positioned directly underneath in a 96-well micro titer platelayout. A plate holder containing 96 NdFeB-magnetic disks, 1/4" in diameter and 1/4" thick(obtained from Force field; Fort Collins, CO), was therefore constructed. A 96-well plate cooler(Eppendorf, Westbury, NY) was incorporated into the system to reduce solvent evaporation.
The Gemini 100 system was programmed either directly via its standard software or, whenindividual wells needed to be accessed independently, indirectly through its work-listercapability. Once in the 96-well format, this system automates all of the liquid-handling steps,including magnetic separation via a robotic manipulating arm, mixing of eluates with MALDImatrix and deposition onto the Bruker 384-spot MALDI target plates.
2.4. MSK Clinical Proteomics LIMSThe large number of samples that can now be processed by the automated system createsproblems in locating and accessing both the physical samples and their associated data. Incollaboration with the North Shore Long Island Jewish Health System (Manhasset, NY)biorepository group, we have developed a complete Laboratory Information ManagementSystem (LIMS). By characterizing and standardizing the entire sample collection and serumpreparation process, we designed a SQL server database with a webpage based interface. ThisLIMS provides (i) a physical sample inventory control system with bar coding capabilities foreasy identification of samples, (ii) a database storing clinical and nonclinical sampleinformation, and (iii) the generation of ‘AutoX’ files, necessary to operate the AutoFlexMALDI-TOF mass spectrometer automatically through the ‘AutoXecute’ function. The webinterface enables platform independent entry and access to data and other control features.Together, these capabilities make the LIMS a complete information solution. It tracks thehandling of samples from storage to the final mass spectra.
2.5. Mass SpectrometryPeptide profiles were analyzed with an Autoflex MALDI-TOF mass spectrometer (Bruker;Bremen, Germany) equipped with a 337 nm nitrogen laser, a gridless ion source, delayed-extraction (DE) electronics, a high-resolution timed ion selector (TIS), and a 2 GHz digitizer.The standard protocol, except where modified for investigative and optimization purposes, wasas follows. Separate spectra were obtained for two restricted mass-to-charge (m/z) ranges,corresponding to polypeptides with molecular mass of 0.7–4 kDa (“≤4kD”) and 4–15 kDa(“≥4kD”) (assuming z = 1), under specifically optimized instrument settings. Each spectrumwas the result of 400 laser shots, per m/z segment per sample, delivered in four sets of 100shots (at 50-Hz frequency) to each of four different locations on the surface of the matrix spot.The effective laser energy delivered to the target was carefully controlled to be 16 μJ (± 10%)per shot (see below). A weekly performance test with a control commercial human serum isdone and the effective laser energy delivered to the target is modified accordingly. The entireirradiation program was automated using the instrument’s ‘AutoXecute’ function. Spectra wereacquired in linear mode geometry under 20 kV (18.6 kV during DE) of ion accelerating and
Villanueva et al. Page 4
J Proteome Res. Author manuscript; available in PMC 2007 April 17.
NIH
-PA Author Manuscript
NIH
-PA Author Manuscript
NIH
-PA Author Manuscript

−1.3 kV multiplier potentials, and with gating of mass ions ≤ 400 m/z (≤ 4kD segment) or ≤3000 m/z (≥4kD segment). DE was maintained for 80 (≤4kD) or 50 nanoseconds (≥4kD) togive appropriate time-lag focusing after each laser shot. Peptide samples were always mixedwith two volumes of premade a-cyano-4-hy-droxycinnamic acid (ACCA) matrix solution(Agilent; Palo Alto, CA), deposited onto the stainless steel target surface, in every other columnof the 384-spot layout, and allowed to dry at room temperature. Thirty fmols (per peptide) and500 fmols (per protein) of commercially available calibration standards (Bruker Daltonics #206195 (<4kD) and # 206355 (>4kD)) were also mixed with ACCA matrix and separatelydeposited onto the target plates, adjacent to each spotted serum sample (one sample/onestandard), in the alternating columns.
2.6. Laser Pulse Energy MeasurementsThe Bruker AutoFlex MALDI-TOF instrument does not provide a direct measurement of thelaser energy that is delivered to the sample. Instead, it features an uncalibrated setting (‘controlbar’) of the laser power, that ranges from 0 to 100% on an arbitrary scale without providingan absolute value. The instrument does have a power/energy monitoring probe at the output ofthe nitrogen laser, and the beam is attenuated in the path to the sample by means of a matchedpair of counter-rotating optical flats. The attenuation control provided to the user rotates thetwo flats from a position of maximum reflectance (set to 0%) to a position of maximumtransmittance (set to 100%).
The nitrogen laser (MNL 200-C; Lasertechnik, Berlin, Germany) in the AutoFlex instrumenthas a manufacturer specified, nominal output energy of 105 μJ per pulse. The value reportedby the laser monitor of the instrument, before the attenuator, was 108 μJ. We measured thelaser energy per pulse, by integrating 100 pulses, with a J9-484 pyroelectric joulemeter probe(18.8 VJ−1 responsivity) (Molectron Detector Inc., Portland, OR) before and after the attenuatorset at maximum transmittance (100% on the control bar). Our readings were 1.8 mV and 1.47mV, respectively, indicating that the effective maximum transmittance of the attenuator is only82%. The difference between our measurement with the pyroelectric detector (1.8 mV/18.8VJ−1 = 96 μJ) and that of the laser monitor (108 μJ) can be attributed to a lack of accuratecalibration of our detector. Nonetheless, it is the relative measurements (before/after theattenuator) that are relevant.
We then measured the laser energy after the attenuating device as a function of the usercontrollable attenuator settings. These measurements were done with a USB2000 fiber coupledspectrometer (Ocean Optics, Dunedin, FL). This instrument was used because it provides goodsensitivity and signal-to-noise to measure the 337.1 nm laser line down to the 20% attenuatorsetting, as well as providing a convenient optical fiber probe to position inside the instrument.The measurements were normalized and scaled to the maximum transmittance value of 82%.The laser setting that had been empirically determined was now measured in this way to yield16-μJ energy per pulse, post-attenuation. Since we now know all the interconversion factors,we can readily calculate the laser energy delivered to the target per shot by a simply readingthe instrument’s laser monitor. This is done once a week and adjustments are made accordinglyto compensate for fading laser energy over time.
2.7. Signal Processing2.7.1. Setup—Once acquired, the data are stored with a naming convention that allows eachsample to be associated with its calibrant. The spectra are converted from Bruker’s binaryformat to ASCII files containing two columns of data (x: m/z, y: intensity) by a custom writtenmacro in FlexAnalysis (Bruker). For the lower mass range (700–4000 Da), about 48 000 x,ypoints were generated while for the upper mass range (4–15 kDa), there were about 77 000points.
Villanueva et al. Page 5
J Proteome Res. Author manuscript; available in PMC 2007 April 17.
NIH
-PA Author Manuscript
NIH
-PA Author Manuscript
NIH
-PA Author Manuscript
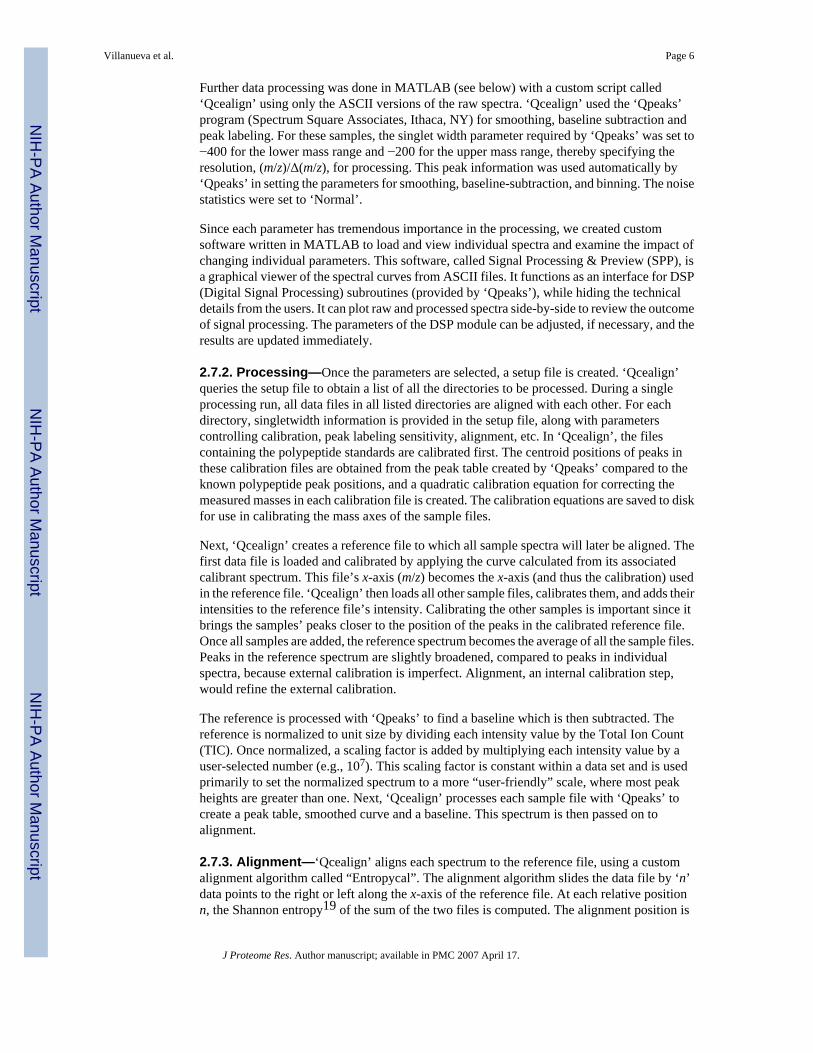
Further data processing was done in MATLAB (see below) with a custom script called‘Qcealign’ using only the ASCII versions of the raw spectra. ‘Qcealign’ used the ‘Qpeaks’program (Spectrum Square Associates, Ithaca, NY) for smoothing, baseline subtraction andpeak labeling. For these samples, the singlet width parameter required by ‘Qpeaks’ was set to−400 for the lower mass range and −200 for the upper mass range, thereby specifying theresolution, (m/z)/Δ(m/z), for processing. This peak information was used automatically by‘Qpeaks’ in setting the parameters for smoothing, baseline-subtraction, and binning. The noisestatistics were set to ‘Normal’.
Since each parameter has tremendous importance in the processing, we created customsoftware written in MATLAB to load and view individual spectra and examine the impact ofchanging individual parameters. This software, called Signal Processing & Preview (SPP), isa graphical viewer of the spectral curves from ASCII files. It functions as an interface for DSP(Digital Signal Processing) subroutines (provided by ‘Qpeaks’), while hiding the technicaldetails from the users. It can plot raw and processed spectra side-by-side to review the outcomeof signal processing. The parameters of the DSP module can be adjusted, if necessary, and theresults are updated immediately.
2.7.2. Processing—Once the parameters are selected, a setup file is created. ‘Qcealign’queries the setup file to obtain a list of all the directories to be processed. During a singleprocessing run, all data files in all listed directories are aligned with each other. For eachdirectory, singletwidth information is provided in the setup file, along with parameterscontrolling calibration, peak labeling sensitivity, alignment, etc. In ‘Qcealign’, the filescontaining the polypeptide standards are calibrated first. The centroid positions of peaks inthese calibration files are obtained from the peak table created by ‘Qpeaks’ compared to theknown polypeptide peak positions, and a quadratic calibration equation for correcting themeasured masses in each calibration file is created. The calibration equations are saved to diskfor use in calibrating the mass axes of the sample files.
Next, ‘Qcealign’ creates a reference file to which all sample spectra will later be aligned. Thefirst data file is loaded and calibrated by applying the curve calculated from its associatedcalibrant spectrum. This file’s x-axis (m/z) becomes the x-axis (and thus the calibration) usedin the reference file. ‘Qcealign’ then loads all other sample files, calibrates them, and adds theirintensities to the reference file’s intensity. Calibrating the other samples is important since itbrings the samples’ peaks closer to the position of the peaks in the calibrated reference file.Once all samples are added, the reference spectrum becomes the average of all the sample files.Peaks in the reference spectrum are slightly broadened, compared to peaks in individualspectra, because external calibration is imperfect. Alignment, an internal calibration step,would refine the external calibration.
The reference is processed with ‘Qpeaks’ to find a baseline which is then subtracted. Thereference is normalized to unit size by dividing each intensity value by the Total Ion Count(TIC). Once normalized, a scaling factor is added by multiplying each intensity value by auser-selected number (e.g., 107). This scaling factor is constant within a data set and is usedprimarily to set the normalized spectrum to a more “user-friendly” scale, where most peakheights are greater than one. Next, ‘Qcealign’ processes each sample file with ‘Qpeaks’ tocreate a peak table, smoothed curve and a baseline. This spectrum is then passed on toalignment.
2.7.3. Alignment—‘Qcealign’ aligns each spectrum to the reference file, using a customalignment algorithm called “Entropycal”. The alignment algorithm slides the data file by ‘n’data points to the right or left along the x-axis of the reference file. At each relative positionn, the Shannon entropy19 of the sum of the two files is computed. The alignment position is
Villanueva et al. Page 6
J Proteome Res. Author manuscript; available in PMC 2007 April 17.
NIH
-PA Author Manuscript
NIH
-PA Author Manuscript
NIH
-PA Author Manuscript

the shift n that produced the minimum Shannon entropy of the configuration. The data file isthen returned with the x-axis shifted. These data shift is equivalent to adjusting the zero-pointof time in the TOF spectrometer. Once aligned, the smoothed spectrum, which is produced asa byproduct of the ‘Qpeaks’ processing, is then updated to reflect the aligned m/z values andsaved to disk after baseline-subtraction, normalization and scaling. This final processed ASCIIdata is later visually inspected in a custom built Mass Spectra Viewer.
The previously generated peak table is updated to reflect the baseline-subtraction,normalization, scaling and alignment. The peak information is added to a column of a mastermatrix. Rows in the matrix represent integer m/z values; peaks are written to the row closestto the calibrated m/z position of the peak; columns represent samples. This matrix is neededlater for the ‘binning’ process. Separate peaklists with the peak intensities and m/z values aresaved to disk. This process from the invoking of ‘Qpeaks’ to the saving of peak lists is repeatedfor all samples. After all sample files are processed, the master matrix of peak positions isqueried, and positions of peaks in the matrix are ‘binned’ to create a spreadsheet that can beused for statistical analysis. This binning is done using the declared resolution (m/z)/Δ(m/z);all peaks in rows within Δ(m/z) of the strongest peak at a given value of m/z are binned together.Finally, the binned results are written to disk.
To study the impact of this methodology, we analyzed the same data in two additional ways.In the first, we processed raw spectra without calibration and alignment. In the second, weadded calibration, leaving out the alignment step. The results of all three analyses were thentaken for similar statistical analysis to examine the impact of each step. To implement the twoadditional analyses, a custom MATLAB script was written called “process_and_save.” Thisscript is an earlier variant of ‘Qcealign’ that does not include alignment or binning. Using thisscript, the first additional analysis was processed without calibration. ‘Qpeaks’ was used withthe same parameters as described earlier. Baseline-subtraction, smoothing, normalization andscaling was also done. The results of these two additional steps were aligned by using a custom-made File-maker Pro (Claris Corporation, Santa Clara, CA) database to transform the peaklistsinto a spreadsheet format for statistical analysis. The peaklists were imported into the databaseand peaks from all related samples were then binned at 1500 ppm, as described.18 Peaklistsfrom the aligned samples were also binned using 1500 ppm, allowing us to compare binningusing ppm and singletwidth.
2.8. MATLAB Software ToolsMATLAB (MathWorks, Natick, MA) was chosen as a developing platform because of its high-level programming language for quick deployment of applications. The current versioncontains three modules of visualization and analysis tools:
2.8.1. Signal Processing & Preview—SPP functions as an interface for signal processingsubroutines (Qcealign), while hiding the technical details from the users. SPP works in eitherSingle Mode or Batch Mode. In the single mode, raw and processed spectral curves will bedisplayed side by side for review. The investigator loads one or more representative spectraldata, fine-tunes the parameters of the DSP subroutine, and examines the outcomes. Wheneverprocessed data is not available, the program will automatically call ‘Qcealign’ to generate them.Furthermore, the user can modify the DSP parameters that are passed on to ‘Qcealign’. Aftersettling on optimal parameters, a script will be generated automatically to work in the batchmode, which processes large number of spectral data in one command.
2.8.2. Mass Spectra Viewer—MSV is a visualization interface for processed spectral data.MSV plots the spectra as X-Y curves (mass vs magnitude) for examining the signatures ofseveral groups of samples. It provides flexible browsing functions such as scroll, zoom,
Villanueva et al. Page 7
J Proteome Res. Author manuscript; available in PMC 2007 April 17.
NIH
-PA Author Manuscript
NIH
-PA Author Manuscript
NIH
-PA Author Manuscript

highlighting, etc. Besides visualization, the second critical design is to provide the datamanagement for querying and categorization of large numbers of samples. We incorporatedthe database design, which uses a unique identification number (Sample_ID) for each entry.All attributes associated with the spectra are identified by this ID. Users can then search andclassify single samples or groups of samples based on their properties. The third aim of thisprogram is to handle large data sets (thousands of spectra) with good responsiveness duringloading, visualizing and saving procedures. This is achieved by merging all processed spectra,along with the unique Sample IDs, into an internal multidimensional data storage (matrix).Disk operations are very rapid because, instead of loading/writing thousands of spectra, MSVreads from or writes to a single file. The speed of browse function is also improved by plottingall the spectral curves once and then rescaling the axis of the window. In this way, stress onthe video card and memory bus is reduced, because only a small portion of data needs to berendered. The optimization is further enhanced by optional Resolution Control, which allowsthe user to control the number of points per pixel plotted in the graph. For Matlab programs,these optimizations improve performance significantly.
2.8.3. HeatMap—HM is a module specifically designed to display the binned spreadsheet ofspectral peaks coming from the DSP subroutines. Peaks are plotted as a 2D heat map imagewith sample names and normalized ion intensity values as the X- and Y-position coordinates,in which the magnitudes of the m/z are color coded on a gradient scale. In addition to theordinary browsing functions such as zoom and scroll, the user has the option to reorganize therank of X- and Y-position coordinates, without the constraints of statistical correlation that areenforced by most heat map commercial software packages.
2.9. Statistical AnalysisThe binned spreadsheet, containing data from spectra obtained for all samples of cancer patientsor healthy subjects (59 samples total; 549 m/z values, with normalized intensities for eachsample; >33 000 data points), was imported into the ‘GeneSpring’ program (Agilent; Palo Alto,CA) and analyzed using various statistical algorithms such as ANOVA, PCA, hierarchicalclustering, K-NN and SVMs. In ‘Genespring’, an “experiment” was created to represent themasses. No normalizations were applied to the experiment since the masses were normalizedby QceaLign. In the parameter section of the experiment, a parameter called “Cancertype” wascreated to label samples as either Thryoid cancer or Control. In Experiment’s Interpretationsection, the Analysis mode was set to “Ratio (signal/control)” and all measurements were used.No Cross-Gene Error model was used either.
2.9.1. Mann–Whitney U Test—Once the experiment was created, the m/z values (“peaks”)were filtered by using a nonparametric test (Mann–Whitney U test). The Benjamini andHochberg method was used to adjust p-values for multiple comparisons. The threshold forsignificance was an expected false discovery rate less than 1 × 10⁻⁵. These tests are meant tofind peaks that show statistically significant differences between the two groups studied.
2.9.2. Hierarchical Clustering—All the masses as well as the ones selected from the Mann–Whitney test were then subjected to clustering analysis using the available tool in ‘Gene-spring’. The peaks were organized by creating mock-phylogenetic trees (dendrograms) called“gene trees” and “experiment tree” in the software. The trees were displayed with the samplesalong the X-axis and the masses along the Y-axis. The clustering method for both trees alsomeasured similarity by Standard Correlation (also known as “Pearson correlation aroundzero”).
2.9.3. Class Prediction—K-nearest-neighbor (K-NN) analysis was done by using the ClassPrediction Tool in ‘Genespring’. The training group was set to experiment created earlier. The
Villanueva et al. Page 8
J Proteome Res. Author manuscript; available in PMC 2007 April 17.
NIH
-PA Author Manuscript
NIH
-PA Author Manuscript
NIH
-PA Author Manuscript

Parameter to Predict was set to Cancertype. The Gene selection was set to use all 549 masses.The number of neighbors was set to five with a p-value decision cutoff of 1. The K-NN wasused to cross-validate (using the ‘leave one out’ cross-validation method) the training set. TheSVM was done with the same training set and parameters and set to cross-validate. The kernelused was polynomial dot product (Order 1) with a diagonal scaling of 0.
3. Results and Discussion3.1. Serum Preparation and Handling
A comparison of different serum preparations revealed that the type of tube used for bloodcollection, the clotting times and clotting temperatures all have a significant impact on the massspectra of peptide populations extracted from several cohorts of samples. Our results showedthat “biomarker patterns” with diagnostic accuracies of 100% in leave-one-out cross validation(LOOCV; using k-NN or SVM) analysis could be discovered when comparing the spectragenerated from two identical sets of 32 different blood (control) samples prepared in either BDglass (‘red-top’) or BD SST (‘tiger-top’) tubes (Figure 1A). As further shown in Figure 1(panels B and C), nonsupervised cluster analysis and principal component analysis (see‘Methods’ and the ‘GeneSpring’ user manual) allowed easy segregation of the two sample sets.A number of m/z values (‘peptides’) exhibited remarkable “biomarker” potential; five of those(all with adjusted p-values < 1 × 10⁻¹³) are shown in Figure 1D as color-coded spectraloverlays, together with one example (m/z = 1742; p-value = 0.23) of other peptide peaks thatdid not segregate the groups.
In a separate study, four blood samples from different persons were collected in SST tubes andwere allowed to clot at RT for 5 min (‘t = 0’), 1 h and 5 h, followed by sample processing,peptide extraction and MS. As illustrated in Figure 2 for five different m/z peaks, intensitiesdid vary in a time-dependent manner, likely reflecting changes in abundance. Sometimesintensity diminished (m/z = 1062, 1077, 1352), but in other cases it increased (m/z = 1703,2272). A possible explanation is the degradation of plasma peptides or, on the other hand,formation/accumulation of new peptides during and after the clotting process.
Storage details of the samples are also critical. As shown in Figure 3, the number of freeze-thaw cycles of sera (e.g., 2 versus 4) dramatically affects the resulting patterns observed byMS, most likely due to peptide aggregation, precipitation and adsorption to surfaces. At ourinstitution, serum samples are always frozen and thawed twice; the second thawing stepimmediately before peptide extraction and MS analysis (see Table 1).
In sum, any systematic bias in serum preparation and/or storage between two or more groupsof samples can result in a statistically relevant, yet clinically useless diagnostic tool. All theabove examples illustrate the importance of strict adherence to a standardized protocol whentest samples from patients and healthy controls have been obtained from different sources. Wehave therefore made a concerted effort to instruct nurses, phlebotomists, messenger servicestaff, and clinical technicians about the importance of strictly adhering to the standard protocol.
3.1.1. Automated Solid-Phase Extraction—We also tested how peptide extraction mightaffect the final results. Capturing serum peptides on either a (hydrophobic) SELDI chip or RP-magnetic particles is a critical process. We have previously shown the effects of carbon chainlength and the sample-to-magnetic bead ratio (v/w).18 We have since observed that in orderto obtain total reproducibility, extraction of the peptides must be done using the exact samebatch of magnetic particles and in a totally automated, randomized fashion. The spectra shownin Figure 4 are derived from six identical aliquots of a single serum sample, processedseparately using the standard automated protocol but with different batches of ChemicellSiMAG-C8/K particles (arbitrarily designated C8_1 to 6). Note that the tests were done under
Villanueva et al. Page 9
J Proteome Res. Author manuscript; available in PMC 2007 April 17.
NIH
-PA Author Manuscript
NIH
-PA Author Manuscript
NIH
-PA Author Manuscript

collaborative agreement with the manufacturer and that none of the particles used here are anylonger commercially available. However, our laboratory has acquired bulk quantities of the‘C8_1’ batch, and those beads have been used throughout all the tests and analyses describedherein. As illustrated in Figure 4, profound differences were observed in peak patterns. Wehighly recommended that anyone planning to use solid-phase RP extraction of serum peptidesfor profiling purposes verify potential batch-dependent differences of the particles of choice.This also applies to SELDI-TOF MS; any one project should be done in its entirety with thesame lot of chips and the serum samples should ideally be processed automatically as well.
After previously incorporating a liquid handler for fully automated analyses, serum samplesfrom patients and control subjects were typically processed in consecutive runs and/or weredispensed in the 96- or 384-format microvials, and similarly applied to the target plates, arrayedas ‘blocks’. We noticed that this approach could also lead to systematic bias (data not shown).In our current procedure, a randomization program (part of the LIMS) is used to position caseand control samples for processing. There are also no noticeable day-today differences, asillustrated by the experiment shown in Figure 5. Seven samples, taken from a single batch ofcommercially available human serum, were analyzed in the presence of calibration standardsover the course of seven weeks; each sample every week, all randomized on the plate. Samplesanalyzed on any particular day where then treated as a group during subsequent data processingand nonsupervised hierarchical clustering. Color-coding in Figure 5A,B is by day and, clearly,there is no bias. All colors are scrambled in the dendrogram (Figure 5A) and in the single, tightcluster resulting from PCA (Figure 5B). Spectral overlay analysis of selected peaks furthersuggests the absence of day-to-day bias (Figure 5C).
3.1.2. MALDI-TOF Mass Spectrometry—Another factor affecting the results is the actualacquisition of the mass spectra. Once the serum peptides are captured, they are eluted andmixed with a UV-absorbing matrix in a fashion conducive to laser-induced ionization anddesorption. To this end, cocrystals must be formed that are suitable for the production ofdetectable peptide ions upon irradiation with a pulsed nitrogen laser. This process is not entirelyunderstood and must therefore be optimized empirically for each type of sample.
Matrix-solvent composition has a major effect on sample crystallization for MALDI, organicsolvent type/concentration and pH being the most important features 20. Different solventcompositions have been previously evaluated, including varying concentrations (in water) ofMeCN, 2-propanol and mixtures of MeCN/methanol, all with and without 0.1% TFA. Wefound that mixtures of 40% acetonitrile/50% methanol/10% water, without TFA, gave themaximum number of serum peptide peaks in the spectra. This composition is similar to acommercially available, premade matrix solution (Agilent) which, in our hands, givesconsistently satisfactory spectra. Another key variable is crystal ‘stability’. We have noticedan adverse effect of increasing the time between crystallization and mass spectra acquisition.While we have no ready explanation for this unexpected observation, we can easily control theeffect by taking all spectra within a maximum of 1–2 h after completion of robotic sampleprocessing.
The number of laser shots averaged for each mass spectrum, which determines the signal-to-noise ratios for the serum peptide ions, must also be pre-selected. From examining 36 publishedstudies all utilizing SELDI-TOF to develop diagnostic patterns of disease, it appears that thenumber of shots averaged to produce a spectrum varied from 50 to 192, delivered in 1 to 13sets. Consequently, although these studies all used the same biological fluid, they are virtuallyincomparable. In addition, the authors never mention whether the samples from the differentcase and control groups had been randomized in space (e.g., on the target plates/strips; seeabove) and over time for unbiased mass analysis. Each of the above could potentially haveskewed the data.
Villanueva et al. Page 10
J Proteome Res. Author manuscript; available in PMC 2007 April 17.
NIH
-PA Author Manuscript
NIH
-PA Author Manuscript
NIH
-PA Author Manuscript

We conducted several experiments to evaluate the effects of the number of averaged laser shotsand the laser energy delivered to the target per shot. Figure 6 gives the summary of an extensiveinvestigation, by comparing the empirically determined optimal set of conditions (4 × 100 lasershots; 100 each in 4 different locations on the sample spot; laser shots delivered on the targetat 16 μJ (±10%) per shot—see below) with suboptimal ones. Insufficient numbers of laser shotsresulted in very noisy spectra, even after smoothing and baseline subtraction (Figure 6; toppanel; ‘processed’). More than 100 laser shots per location depletes the crystal and is thereforeineffective; hence the 4 × 100 arrangement. Averaging still more laser shots, e.g., 1000 (10 ×100) or more, did not further improve the quality of the spectra (data not shown). Note that thespectra in Figure 6 have been scaled to the same size; in actuality, signals in the spectra resultingfrom averaging 10 or 50 laser shots were much lower than those obtained under standardconditions. Somewhat different results were obtained when changing the laser energy, whereboth higher and lower settings than the empirically determined optimal conditions resulted indeterioration of the spectra (Figure 6; bottom panel). This observation has some consequencesfor the way laser energy should be controlled. The Bruker AutoFlex MALDI-TOF instrument(like most others) does not have a direct read-out of the laser energy delivered to the target;instead it has probe at the output of the laser, before the attenuator. We verified the accuracyof this monitoring device and then calibrated the settings of the attenuator (displayed on thecomputer screen as an arbitrary scale of 100–0%) by measuring transmitted energy at varying%. This allowed us to generate a calibration curve to convert before-to-after attenuation laserenergy. Laser output energy is measured and documented on a weekly basis. The gradualdecrease in energy over time is then offset by selecting a higher setting on the control. Forexample, the setting had to be increased from an arbitrary 30% to 40% over a six month timeperiod to maintain an effective laser energy of ~16 μJ at the target plate.
Molecular mass calibration is another key issue. In nearly all published reports on MS-basedbiomarker discovery, the authors used some version of external calibration but exact detailsare not mentioned. In one particular report, it is stated that the external calibration was doneon a weekly basis. In our experience, it is simply not possible to have 0.1% (1000 ppm) massaccuracy when analyzing human serum peptides in the linear mode of MALDI-TOF, as statedin most of the SELDI-TOF papers, unless external calibration is done for each sample bydepositing peptide standards on the nearest-neighbor spot location (see ‘Methods’). The effecton subsequent, uncorrected alignment in spectral overlays is clearly illustrated in Figure 7 (toptwo panels), and it further improves the results of computational alignment as well (see below).
3.1.3. Signal Processing—The final step before statistical analysis is signal processing ofthe mass spectra. There are several components to this step: smoothing, baseline correction,normalization, calibration/alignment, and peak labeling. As long as the same signal processingis applied to all the samples in a data set, there will be no systematic bias to confound thestatistical analysis. However, it is possible that suboptimal signal processing will suppress orobscure the true signal/information in the data.
One means to optimal signal processing is to employ software in which an expert user (with apriori knowledge of what the data should look like) can fine-tune as many parameters aspossible. This may lead to good results but could be time-consuming and would be difficult toreproduce without expertise. Another approach is to use an algorithm that requires few inputsfrom the user and makes few assumptions about the data. The software that we used here,‘Qpeaks’ (see also under ‘Methods’), finds peaks in a spectrum and outputs variousinformation, including a peak table, smoothed trace and an optional baseline. This tablecontains peak parameters (apex positions, centroids, widths, areas), and standard errors in theparameters. The peak-finding function rzrpic is based on a Bayesian second derivative of thedata. Smoothing is accomplished with the Maximum Entropy (Maxent) smoothing functionrzresm. Both the Bayesian second derivative and the Maxent smoothing are optimal in that
Villanueva et al. Page 11
J Proteome Res. Author manuscript; available in PMC 2007 April 17.
NIH
-PA Author Manuscript
NIH
-PA Author Manuscript
NIH
-PA Author Manuscript
they produce the best possible results using only a single assumption: namely, a width for peaksin the data (‘singletwidth’). They do not require any additional parameters, such as polynomialdegree used by Savitsky-Golay algorithms. Bayesian and Maxent algorithms are self-adjustingto the noise, so no “degree of smoothing” parameter is required. This handling of noise meansthat the Bayesian and Maxent functions cannot compromise resolution by oversmoothing.Thus, the use of primarily one parameter simplifies data processing without compromisingdata quality. Additionally Qpeaks works well with low resolution data such as the kind acquiredin MALDI TOF linear mode, unlike many other standard peak labeling algorithms which areoptimized for isotopically resolved spectra.
Once processed, the spectra need to be aligned to compare similar peptides across samples, anoperation that may be the most difficult task in peptide profiling studies. A common approachis to perform external calibration; i.e., peptides of known molecular mass are analyzedalongside the samples. A calibration curve is then calculated to adjust the x-axis of the calibrantspectrum so that its known peaks fit their known values. This curve can be applied to spectraof samples that were spotted in nearby positions on the MALDI target. Ideally, each sampleposition on the target plate has an adjacent calibrant spot. But despite the best possible externalcalibration, m/z peaks representing identical peptides in different samples deviate to variousextents from the theoretical molecular mass. They are slightly shifted to the left or right in thespectra, which makes strict ‘numerical’ alignment (e.g., a spectrum divided in 1-Da,consecutive segments) all but impossible. Usually to correct this shift, a mass percentagewindow (estimated accuracy of the data set, e.g., 0.15%) is applied along the mass rangeinstead, and common peaks across samples are binned in this way. As a result, a compositepeak list comprising all samples is generated for statistical analysis. Detailed investigationrevealed, however, that even such spectral alignments can be the source of artifacts or noise,in particular leading to an inflated number of peaks.
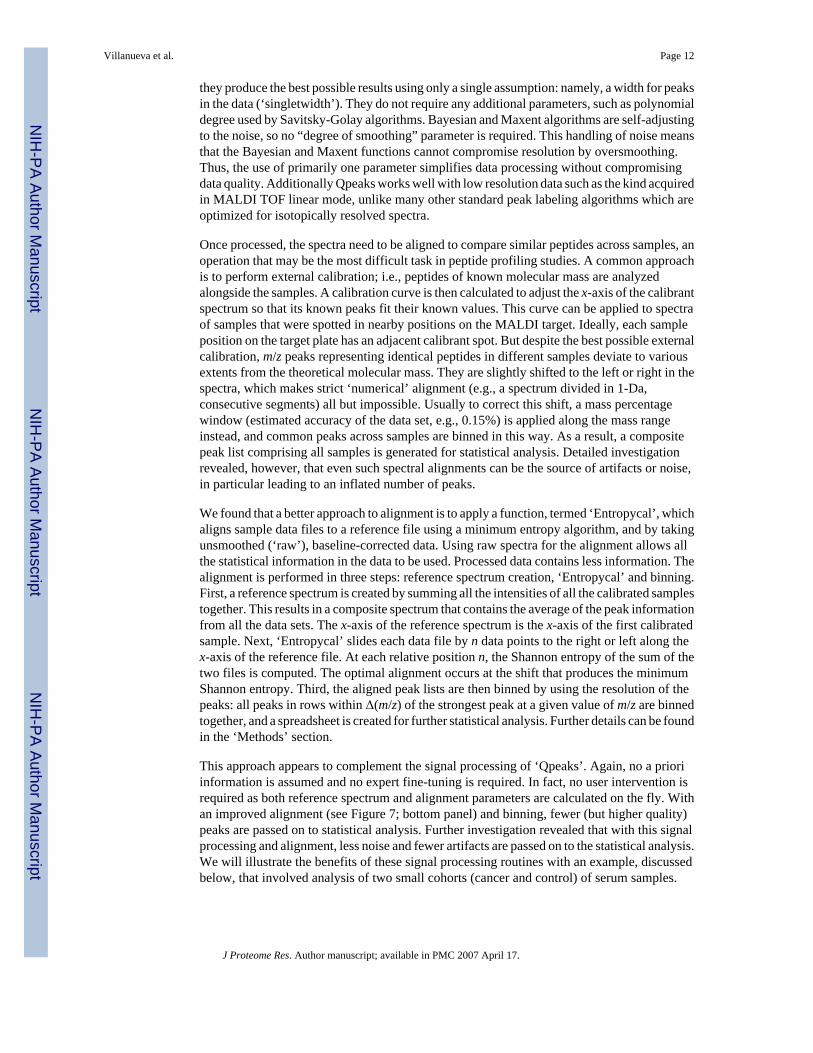
We found that a better approach to alignment is to apply a function, termed ‘Entropycal’, whichaligns sample data files to a reference file using a minimum entropy algorithm, and by takingunsmoothed (‘raw’), baseline-corrected data. Using raw spectra for the alignment allows allthe statistical information in the data to be used. Processed data contains less information. Thealignment is performed in three steps: reference spectrum creation, ‘Entropycal’ and binning.First, a reference spectrum is created by summing all the intensities of all the calibrated samplestogether. This results in a composite spectrum that contains the average of the peak informationfrom all the data sets. The x-axis of the reference spectrum is the x-axis of the first calibratedsample. Next, ‘Entropycal’ slides each data file by n data points to the right or left along thex-axis of the reference file. At each relative position n, the Shannon entropy of the sum of thetwo files is computed. The optimal alignment occurs at the shift that produces the minimumShannon entropy. Third, the aligned peak lists are then binned by using the resolution of thepeaks: all peaks in rows within Δ(m/z) of the strongest peak at a given value of m/z are binnedtogether, and a spreadsheet is created for further statistical analysis. Further details can be foundin the ‘Methods’ section.
This approach appears to complement the signal processing of ‘Qpeaks’. Again, no a prioriinformation is assumed and no expert fine-tuning is required. In fact, no user intervention isrequired as both reference spectrum and alignment parameters are calculated on the fly. Withan improved alignment (see Figure 7; bottom panel) and binning, fewer (but higher quality)peaks are passed on to statistical analysis. Further investigation revealed that with this signalprocessing and alignment, less noise and fewer artifacts are passed on to the statistical analysis.We will illustrate the benefits of these signal processing routines with an example, discussedbelow, that involved analysis of two small cohorts (cancer and control) of serum samples.
Villanueva et al. Page 12
J Proteome Res. Author manuscript; available in PMC 2007 April 17.
NIH
-PA Author Manuscript
NIH
-PA Author Manuscript
NIH
-PA Author Manuscript

3.1.4. Serum Peptide Profiling to Detect Thyroid Carcinoma—Most thyroid cancersurvivors are in surveillance programs to detect tumor recurrences. The MSKCC EndocrineService performs in-depth evaluations on more than 350 high-risk patients each year involvingphysical exams, blood work, ultrasounds, and a variety of radiological procedures. Over thepast 10 years, on average, metastatic disease is found in approximately one-third. Bloodsamples are routinely drawn for a tumor marker (thyroglobulin). In a preliminary study, wecollected sera from 27 patients who had clear evidence for residual metastatic (MET) thyroidcarcinoma and from 32 healthy volunteers (mixed gender; ages between 22 and 50). Specimensare linked to database records but were anonymized and stripped of any patient identifiers tomeet HIPPA guidelines. We have analyzed the peptide patterns in these sera to determine ifthey can identify those who harbor metastatic lesions with high diagnostic accuracy.
Blood collection, sera preparation, storage and handling, automated peptide solid-phaseextraction and mass spectrometry were exactly as listed in Table 1, as described in the various‘Methods’ and ‘Results’ sections herein, and as shown in the diagram in Figure 10 depictingthe entire serum peptidomics operation. The main objective was to explore the impact of signalprocessing on statistical analysis. First, using the ‘standard’ approach, external calibration andpeak binning across all 59 spectra, using an m/z tolerance of 0.15%, resulted in 938 uniquebins or ‘peaks’. The resulting spreadsheet contains 55 342 entries listed as normalizedintensities that vary over roughly 4 orders of magnitude on an arbitrary scale. The readout issimilar to that of microarray gene expression profiling and commercial ‘GeneSpring’ softwarewas therefore used to evaluate peptidomic data. The spreadsheet was used to create ahierarchical cluster, using the Pearson correlation (Figure 8A; left side panel), and for principalcomponent analysis (PCA; data not shown). A fairly good, but not perfect, segregation of‘Thyroid Cancer’ and control samples was obtained. We then performed a nonparametricMann–Whitney test at the p < 1.0 × 10⁻⁵ level. Interestingly, 23 unique peptides (~2.5% oftotal) passed this selection whereas less than one was expected by chance only (938 × 1.0 ×10−5). To get a visual representation of the signal strength, these results were also taken forhierarchical clustering and PCA analysis (Figure 8B and C; left side).
When calibrated spectra were additionally subjected to the ‘Entropycal’ alignment and binningfunction, all peaks across all 59 spectra could be merged into just 549 m/z bins. The resultingdata set allowed near perfect segregation of the Thyroid cancer and control samples withoutany prior statistical test to select the most discriminatory peaks; i.e., in a totally unsupervisedmanner (Figure 8A; right side panel). Furthermore, 98 peptides (~18% of total) passed a Mann–Whitney test at p < 1 × 10⁻⁵. Clustering analysis and PCA using this highly selected set ofpeaks (Figure 8B,C; right side) resulted in a markedly improved result as compared to a dataset obtained by classical binning using % (m/z) tolerances. We conclude that a much higherpercentage (18 vs 2.5%) of highly distinguishing spectral information is retained after a Mann–Whitney test of data sets derived from well-aligned peak patterns. By contrast, some of thesepeaks become spread out over two to three bins during ‘standard’ binning, thereby dilutingmarker potential. This was confirmed by comparing the hierarchical clustering results for thetwo approaches (Figure 8A).
To individually verify the above findings, the 98 selected m/z peaks were visually inspectedin color-coded overlays (using the MSV) of all spectra of both sample cohorts. As can be readilyobserved for 8 out of the 10 selected examples shown in Figure 9, peak intensities may differdramatically between the two groups; sometimes consistently higher in all the cancer samples,sometimes higher in all controls. The corresponding adjusted p-values are all below 1.0 ×10⁻⁵. Two peaks shown in Figure 9, at m/z = 1868 and 2772, were not part of the selected groupof 98 and have little to no biomarker potential. Note that some of the peaks shown in Figure9, are also shown in Figure 7, both in aligned and unaligned (‘raw’) overlays.
Villanueva et al. Page 13
J Proteome Res. Author manuscript; available in PMC 2007 April 17.
NIH
-PA Author Manuscript
NIH
-PA Author Manuscript
NIH
-PA Author Manuscript

4. Conclusions‘Molecular signatures’, a recent concept in biology and medicine, are derived from qualitativeand quantitative patterns of entire groups of biomolecules (e.g., mRNA, proteins, peptides, ormetabolites) in a cell, tissue, biological fluid or an organism. To apply this concept to biomarkerdiscovery, the measurements should ideally be noninvasive and performed in a single read-out. In a previous report, we described a prototype, MS-based technology platform forautomated, solid-phase extraction of peptides from biological fluids, coupled to a directMALDI-TOF read-out.18 We have since explored whether this platform can reproduciblydefine peptide patterns in human serum to look for ‘signatures’ that may indicate disease, suchas the presence of cancer. While many analytical variables had already been optimized andinitial tests suggested possible diagnostic potential, recent observations by us and others havediscovered previously unrecognized sources of bias.6–10
Diagnostic peptide profiling must be rigorous, extremely reproducible and free of bias to haveany future clinical utility. We have now evaluated, optimized, and standardized a number ofvariables that may affect final spectral patterns; from specimen collection, storage andhandling, throughout all steps of analytical chemistry and MS signal processing. Also, properalignment of spectra is essential to have any chance of subsequent meaningful data mining. Infact, it makes biomarker pattern detection a task for which common statistical tools are as goodor even better suited than some of the recent pattern recognition algorithms. Overall, the resultshave guided us to outline a uniform sample preparation protocol (Table 1), to develop adequateinfrastructure, procedures, and software tools (Figure 10), and to establish expertise, training,and organizational structure within Memorial Sloan-Kettering’s serum peptidomics program.
Using this improved analytical platform and a commercial statistics program, we found thatsera from patients with metastatic thyroid carcinoma can be distinguished from healthy controlsbased on an array of 98 discriminant peptides. This limited application provides further proofthat sera from patients with solid tumors contain peptides, detectable by MALDI-TOF MS,that reflect presence of cancer. We speculate that serum peptide signatures similarly derivedfrom much larger study sets could eventually rival diagnostic accuracy of conventional cancerbiomarkers. As we will increase the stringency of statistical tests to select peptides thatdiscriminate between groups, fewer peptides will meet the criteria, but it should push diagnosticaccuracy higher. For instance, to distinguish cancer subgroups or stages, to define the rate ofdisease progression, or to predict and monitor responsiveness to therapy, including recurrence.
To completely validate the prospect of serum peptide profiling as a means to diagnostic markeror marker pattern discovery, another major source of potential bias must first be analyzed.Many patient related variables, such as gender, age, genetic factors, drug treatment, andenvironmental, dietary, behavioral, and psychological factors have never been systematicallyinvestigated. It is also not known whether patterns are unique to each individual, and whetherthey can change with physiological events or stay constant over time. We believe that with theadequate technological and computational means as well as the expertise now in place, andwhen using rigorously standardized conditions, these issues can be addressed in relatively shortorder. The ultimate proof of the value of this new approach will be in the ability of otherlaboratories to reproduce either the entire peptidomic patterns or to show that the highlydiscriminatory peptides have the same amino acid sequences.
Acknowledgements
We are indebted to Andrew Martorella for assistance, and to Eric Holland, David Shaffer and Hans Lilja for the giftof control specimens. We also thank them and other colleagues in the Protein Center and the Clinical Sevices forsupport and discussion. Supported by the Himanshu Vakil Research Fund, an ABC2 award and Developmental Fundsfrom NCI Core Grant P30 CA08748.
Villanueva et al. Page 14
J Proteome Res. Author manuscript; available in PMC 2007 April 17.
NIH
-PA Author Manuscript
NIH
-PA Author Manuscript
NIH
-PA Author Manuscript

References1. Petricoin EF, Ardekani AM, Hitt BA, Levine PJ, Fusaro VA, Steinberg SM, Mills GB, Simone C,
Fishman DA, Kohn EC, Liotta LA. Lancet 2002;359(9306):572–577. [PubMed: 11867112]2. Adam BL, Qu Y, Davis JW, Ward MD, Clements MA, Cazares LH, Semmes OJ, Schellhammer PF,
Yasui Y, Feng Z, Wright GL Jr. Cancer Res 2002;62(13):3609–3614. [PubMed: 12097261]3. Li J, Zhang Z, Rosenzweig J, Wang YY, Chan DW. Clin Chem 2002;48(8):1296–1304. [PubMed:
12142387]4. Borozdenkova S, Westbrook JA, Patel V, Wait R, Bolad I, Burke MM, Bell AD, Banner NR, Dunn
MJ, Rose ML. J Proteome Res 2004;3(2):282–288. [PubMed: 15113105]5. Ebert MP, Meuer J, Wiemer JC, Schulz HU, Reymond MA, Traugott U, Malfertheiner P, Rocken C.
J Proteome Res 2004;3(6):1261–1266. [PubMed: 15595736]6. Diamandis EP. Mol Cell Proteomics 2004;3(4):367–378. [PubMed: 14990683]7. Baggerly KA, Morris JS, Coombes KR. Bioinformatics 2004;20(5):777–785. [PubMed: 14751995]8. Check E. Nature 2004;429(6991):496–497. [PubMed: 15175721]9. Ransohoff DF. Nat Rev Cancer 2005;5(2):142–149. [PubMed: 15685197]10. Villanueva J, Tempst P. Nature 2004;430(7000):611. [PubMed: 15295571]11. Rosenblatt KP, Bryant-Greenwood P, Killian JK, Mehta A, Geho D, Espina V, Petricoin EF, Liotta
LA. Annu Rev Med 2004;55:97–112. [PubMed: 14746511]12. Qu Y, Adam BL, Yasui Y, Ward MD, Cazares LH, Schellhammer PF, Feng Z, Semmes OJ, Wright
GL Jr. Clin Chem 2002;48(10):1835–1843. [PubMed: 12324514]13. Furey TS, Cristianini N, Duffy N, Bednarski DW, Schummer M, Haussler D. Bioinformatics 2000;16
(10):906–914. [PubMed: 11120680]14. Wagner M, Naik D, Pothen A. Proteomics 2003;3(9):1692–1698. [PubMed: 12973727]15. Wu B, Abbott T, Fishman D, McMurray W, Mor G, Stone K, Ward D, Williams K, Zhao H.
Bioinformatics 2003;19(13):1636–1643. [PubMed: 12967959]16. Zhu W, Wang X, Ma Y, Rao M, Glimm J, Kovach JS. Proc Natl Acad Sci USA 2003;100(25):14666–
14671. [PubMed: 14657331]17. Yasui Y, Pepe M, Thompson ML, Adam BL, Wright GL Jr, Qu Y, Potter JD, Winget M, Thornquist
M, Feng Z. Biostatistics 2003;4(3):449–463. [PubMed: 12925511]18. Villanueva J, Philip J, Entenberg D, Chaparro CA, Tanwar MK, Holland EC, Tempst P. Anal Chem
2004;76(6):1560–1570. [PubMed: 15018552]19. Shannon CE. Bell System Tech J 1948;27:379–423.20. Cohen SL, Chait BT. Anal Chem 1996;68(1):31–37. [PubMed: 8779435]
Villanueva et al. Page 15
J Proteome Res. Author manuscript; available in PMC 2007 April 17.
NIH
-PA Author Manuscript
NIH
-PA Author Manuscript
NIH
-PA Author Manuscript

Figure 1.Effect of the blood collection tube on MS-based serum peptide profiling. Blood from 32 healthyvolunteers was collected in both red-top and SST tubes following the protocol described inTable 1. A. Red-top and SST tubes. B. Hierarchical clustering of 32 serum samples preparedin both red-top (red) and SST tubes (green). All 608 m/z peaks were used in the comparison.C. Principal Component Analysis (PCA) of the 2 × 32 samples. D. Overlay of mass spectraobtained from two groups of 32 samples. All spectra were processed as described in themethods section, and are displayed using Mass Spectra Viewer (MSV) (see Methods). Thecentroid of the bin and its Mann–Whitney adjusted p-value to separate the two groups (red-topvs SST) are shown for each peak.
Villanueva et al. Page 16
J Proteome Res. Author manuscript; available in PMC 2007 April 17.
NIH
-PA Author Manuscript
NIH
-PA Author Manuscript
NIH
-PA Author Manuscript

Figure 2.Effect of clotting time on MS-based serum peptide profiling. Blood samples from 4 healthyvolunteers were collected in 8.5-mL, BD Vacutainer SST tubes and allowed to clot at roomtemperature for 5 min (orange), 1 h (green) and 5 h (blue). The rest of the blood collectionprotocol was the same as in Table 1. All spectra were processed as described in the methodssection, and are displayed using Mass Spectra Viewer (MSV) (see Methods). The centroid ofthe bin is shown for 5 representative m/z peaks.
Villanueva et al. Page 17
J Proteome Res. Author manuscript; available in PMC 2007 April 17.
NIH
-PA Author Manuscript
NIH
-PA Author Manuscript
NIH
-PA Author Manuscript

Figure 3.Effect of freeze-thaw cycles on serum peptide profiling using RP magnetic particles andMALDI TOF MS. Frozen sera (at −80 °C) were thawed on wet ice, sampled and immediatelyplaced at −80 °C for 30 min; this was repeated 4 times. Aliquots were taken after each freeze-thaw cycle and analyzed by the automated RP-protocol and MALDI-TOF MS. A. Massspectrum from serum submitted to 2 freeze-thaw cycles. B. Mass spectrum from serumsubmitted to 4 freeze-thaw cycles.
Villanueva et al. Page 18
J Proteome Res. Author manuscript; available in PMC 2007 April 17.
NIH
-PA Author Manuscript
NIH
-PA Author Manuscript
NIH
-PA Author Manuscript

Figure 4.Effect of different batches of C8/K magnetic particles on serum peptide profiling. Equalvolumes of serum were incubated with fixed-weight amounts of different batches of SiMAG-C8/K RP beads (with variously modified properties) in separate experiments. Beads werewashed, eluted with 50% acetonitrile in water, and the eluates analyzed, all as described under‘Methods’. Segments of the MALDI-TOF mass spectra corresponding to peptides in the 0.7–4 kDa mass range (assuming z = 1) are shown.
Villanueva et al. Page 19
J Proteome Res. Author manuscript; available in PMC 2007 April 17.
NIH
-PA Author Manuscript
NIH
-PA Author Manuscript
NIH
-PA Author Manuscript
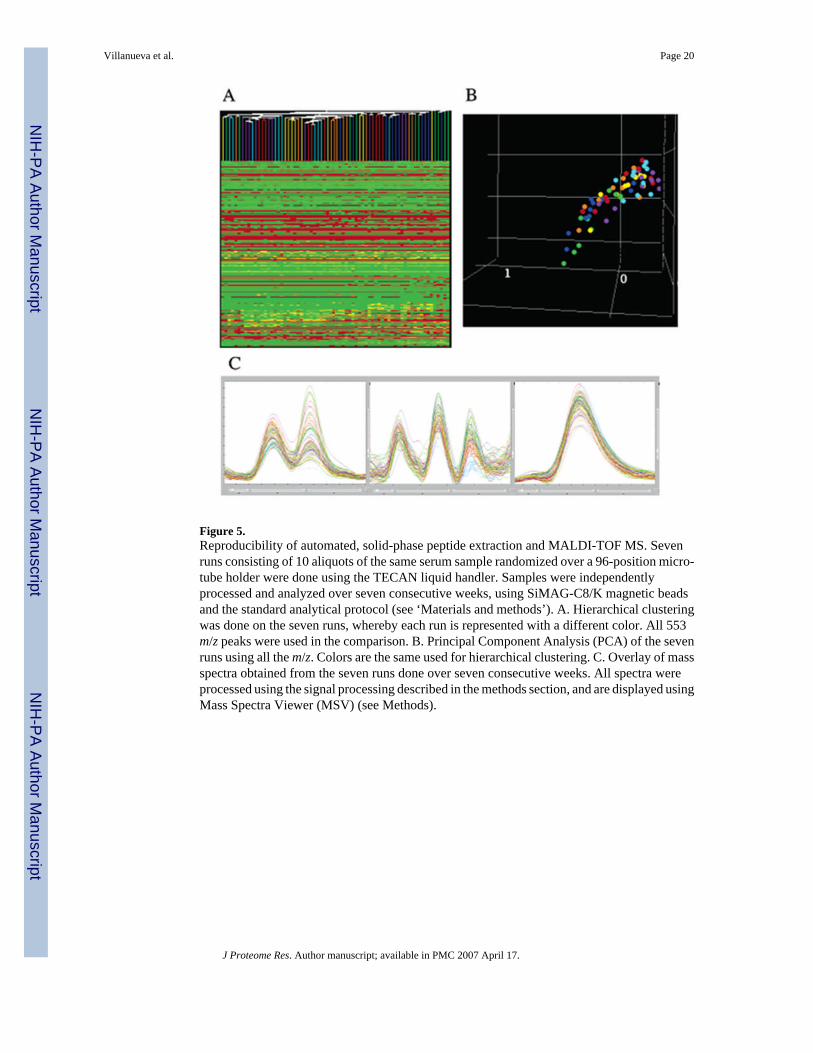
Figure 5.Reproducibility of automated, solid-phase peptide extraction and MALDI-TOF MS. Sevenruns consisting of 10 aliquots of the same serum sample randomized over a 96-position micro-tube holder were done using the TECAN liquid handler. Samples were independentlyprocessed and analyzed over seven consecutive weeks, using SiMAG-C8/K magnetic beadsand the standard analytical protocol (see ‘Materials and methods’). A. Hierarchical clusteringwas done on the seven runs, whereby each run is represented with a different color. All 553m/z peaks were used in the comparison. B. Principal Component Analysis (PCA) of the sevenruns using all the m/z. Colors are the same used for hierarchical clustering. C. Overlay of massspectra obtained from the seven runs done over seven consecutive weeks. All spectra wereprocessed using the signal processing described in the methods section, and are displayed usingMass Spectra Viewer (MSV) (see Methods).
Villanueva et al. Page 20
J Proteome Res. Author manuscript; available in PMC 2007 April 17.
NIH
-PA Author Manuscript
NIH
-PA Author Manuscript
NIH
-PA Author Manuscript

Figure 6.Effects of MALDI-TOF mass spectral acquisition variables on serum peptide profiling. Equalvolumes of serum were incubated with fixed-weight amounts of magnetic SiMAG-C8/K beads,beads washed, eluted with 50% acetonitrile in water, and prepared for MALDI-TOF MS.Spectra were acquired in linear mode geometry. Segments of the MALDI-TOF mass spectracorresponding to peptides in the 0.7–4 kDa mass range (assuming z = 1) are shown. All thespectra derive from the same sample, at different locations in a single deposit on the target. Allthe spectra were processed using the signal processing described in the methods section. A.Three spectra were generated averaging different number of laser shots (indicated). The rawand processed spectra are displayed using Mass Spectra Viewer (MSV) (see Methods). B.Three spectra were generated using different effective laser energy (indicated) delivered to thetarget. Both the raw and processed spectra are displayed using Mass Spectra Viewer (MSV)(see Methods).
Villanueva et al. Page 21
J Proteome Res. Author manuscript; available in PMC 2007 April 17.
NIH
-PA Author Manuscript
NIH
-PA Author Manuscript
NIH
-PA Author Manuscript
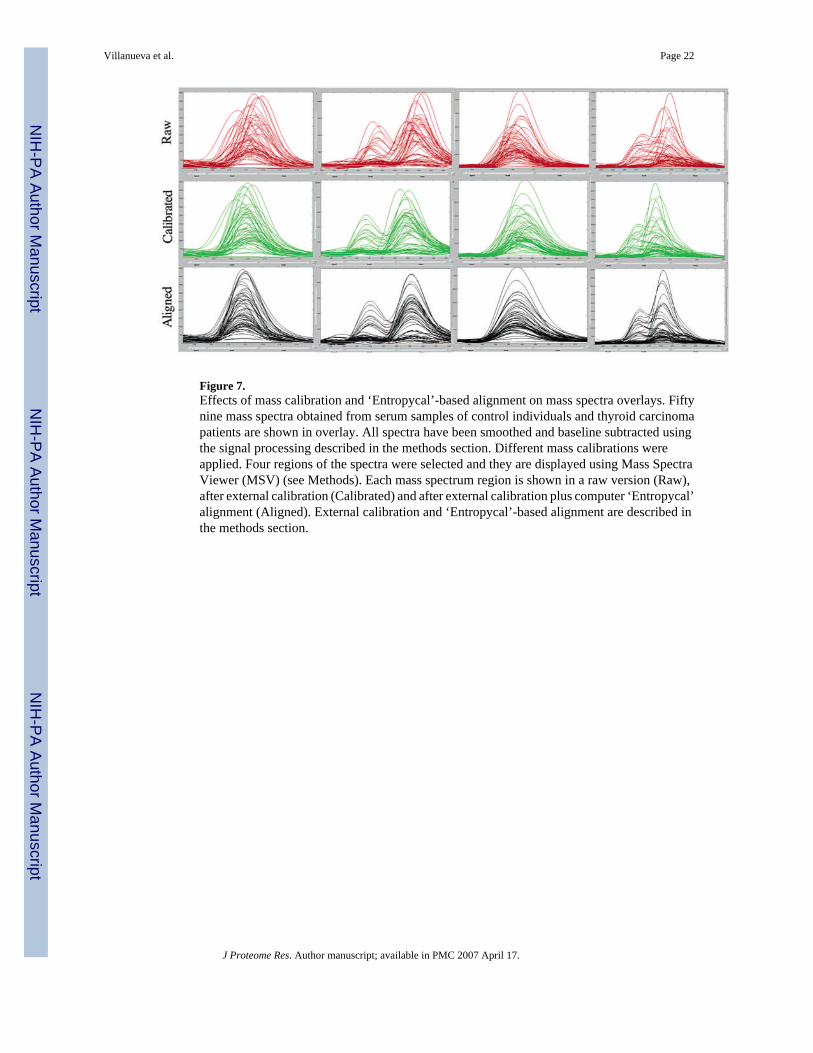
Figure 7.Effects of mass calibration and ‘Entropycal’-based alignment on mass spectra overlays. Fiftynine mass spectra obtained from serum samples of control individuals and thyroid carcinomapatients are shown in overlay. All spectra have been smoothed and baseline subtracted usingthe signal processing described in the methods section. Different mass calibrations wereapplied. Four regions of the spectra were selected and they are displayed using Mass SpectraViewer (MSV) (see Methods). Each mass spectrum region is shown in a raw version (Raw),after external calibration (Calibrated) and after external calibration plus computer ‘Entropycal’alignment (Aligned). External calibration and ‘Entropycal’-based alignment are described inthe methods section.
Villanueva et al. Page 22
J Proteome Res. Author manuscript; available in PMC 2007 April 17.
NIH
-PA Author Manuscript
NIH
-PA Author Manuscript
NIH
-PA Author Manuscript
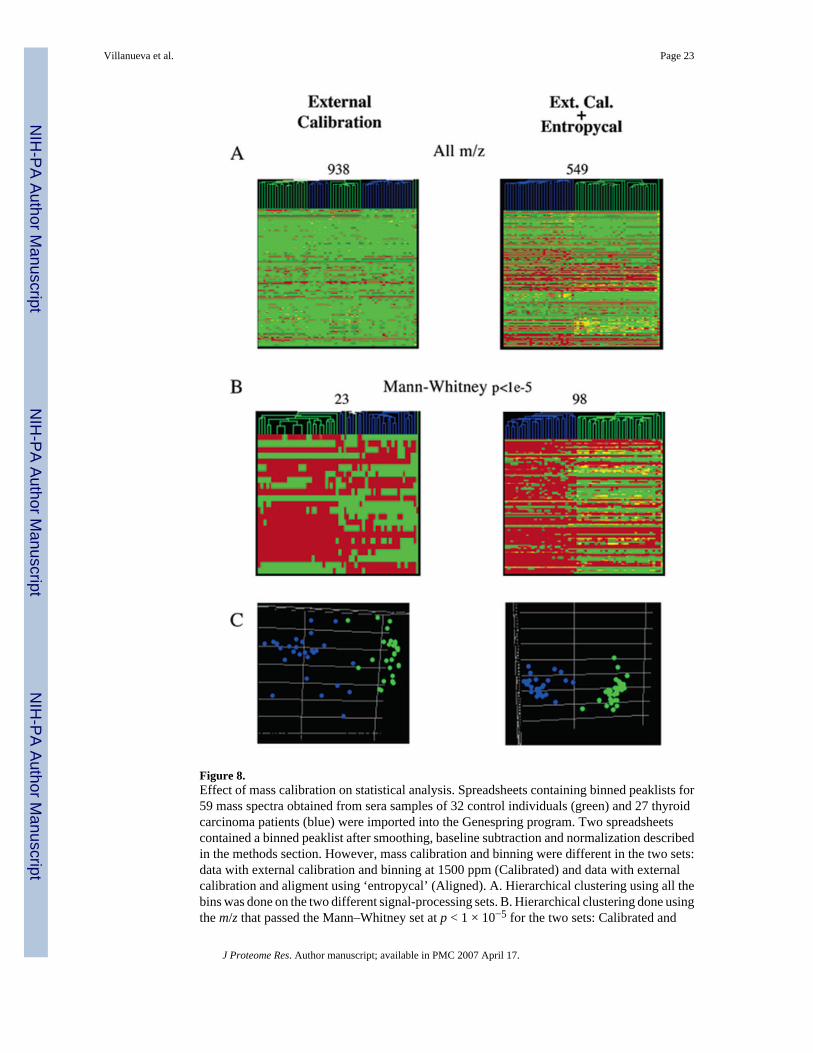
Figure 8.Effect of mass calibration on statistical analysis. Spreadsheets containing binned peaklists for59 mass spectra obtained from sera samples of 32 control individuals (green) and 27 thyroidcarcinoma patients (blue) were imported into the Genespring program. Two spreadsheetscontained a binned peaklist after smoothing, baseline subtraction and normalization describedin the methods section. However, mass calibration and binning were different in the two sets:data with external calibration and binning at 1500 ppm (Calibrated) and data with externalcalibration and aligment using ‘entropycal’ (Aligned). A. Hierarchical clustering using all thebins was done on the two different signal-processing sets. B. Hierarchical clustering done usingthe m/z that passed the Mann–Whitney set at p < 1 × 10⁻⁵ for the two sets: Calibrated and
Villanueva et al. Page 23
J Proteome Res. Author manuscript; available in PMC 2007 April 17.
NIH
-PA Author Manuscript
NIH
-PA Author Manuscript
NIH
-PA Author Manuscript

Aligned. C. Principal Component Analysis (PCA) of the two sets using only the m/z that passedthe Mann–Whitney test at p < 1 × 10⁻⁵.
Villanueva et al. Page 24
J Proteome Res. Author manuscript; available in PMC 2007 April 17.
NIH
-PA Author Manuscript
NIH
-PA Author Manuscript
NIH
-PA Author Manuscript

Figure 9.Serum peptide signatures of thyroid tumor patients. Overlay of mass spectra obtained fromserum samples of 32 control individuals (green) and 27 thyroid carcinoma patients (blue). Allspectra were processed using the signal processing described in the methods section. Somem/z with either very small or large p-values, calculated using the Mann–Whitney test, wereselected and are displayed using Mass Spectra Viewer (MSV). The centroid of the peak andits Mann–Whitney p-value to separate the two groups (controls and thyroid carcinoma) areshown for each peak.
Villanueva et al. Page 25
J Proteome Res. Author manuscript; available in PMC 2007 April 17.
NIH
-PA Author Manuscript
NIH
-PA Author Manuscript
NIH
-PA Author Manuscript
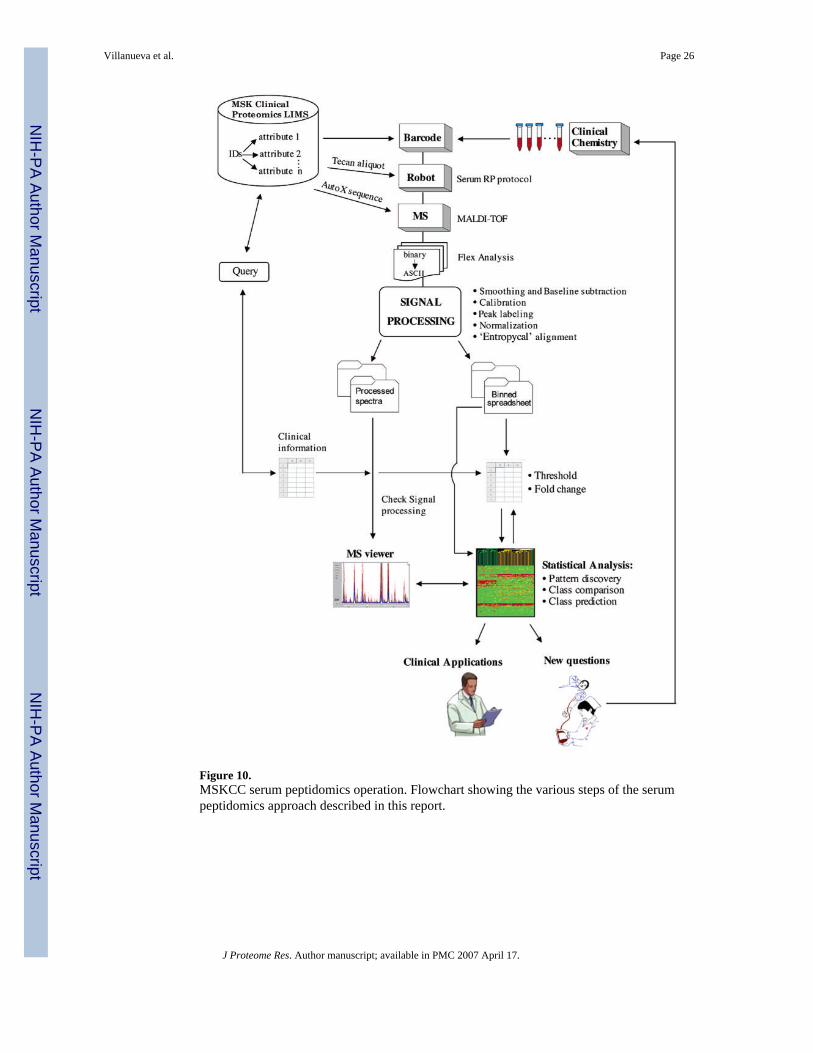
Figure 10.MSKCC serum peptidomics operation. Flowchart showing the various steps of the serumpeptidomics approach described in this report.
Villanueva et al. Page 26
J Proteome Res. Author manuscript; available in PMC 2007 April 17.
NIH
-PA Author Manuscript
NIH
-PA Author Manuscript
NIH
-PA Author Manuscript

NIH
-PA Author Manuscript
NIH
-PA Author Manuscript
NIH
-PA Author Manuscript
Villanueva et al. Page 27
Table 1Protocol for Serum Peptide Sample Preparation
Clinical Services:1. Collect venous blood into one BD Vacutainer SST tube, aka tiger-top (Becton Dickinson # 367988). Fill tube to top (8.5 mL).
2. Following the manufacturer’s instructions:
• Gently invert the tube 5 times to mix clot activator with blood.
• Allow blood to clot for 1 hour at room temp (RT) in vertical position.
3. Place the SST tubes on wet ice in vertical position until transport.
• Put tubes in color-coded bag (PROTEOMICS).
• Put in a cooler for transportation to the Clinical Chemistry Lab.
• Delivery should be within 2 hrs after clotting.Clinical Chemistry Lab:
4. Spin SST tubes in centrifuge at 1400–2000 RCF for 10 min, at RT.
5. Transfer the serum (upper phase) to 4-mL cryovials (Fisher Scientific # 0566966).
• Tubes labeled in advance.
• Volume of serum per cryovial should be approximately 1 mL.
6. Immediately store all samples at −80 °C. Avoid freeze-thawing cycles.
7. Transport samples on dry ice to the Mass Spectrometry Lab.Mass Spectrometry Lab:
8. LIMS and Barcoding:
• Enter all sample information into LIMS system before samples arrive.
• Barcode nine empty 0.25-mL micro-eppendorf tubes for each sample.
• Barcode incoming cryovials (see #7). Samples must remain frozen on dry ice.
9. Store all cryovial samples again at −80 °C. Avoid freeze-thawing cycles.
10. Prepare small aliquots for one-time use:
• Thaw cryovial samples on wet ice.
• Aliquot 9 × 50 μL of each sample in the 9 micro-tubes.
• Put in barcoded freezer boxes.
• Immediately return all to −80 °C storage. Avoid freeze-thawing cycles.
11. Randomize all samples to be analyzed and generate layouts for the individual runs.
12. Solid-phase extraction and MALDI plate spotting:
• Thaw one 50-μL aliquot of each sample on wet ice.
• Put in the correct location of the 96-well tube holder.
• Immediately start the automated, solid-phase peptide extraction.
• Take MALDI plate to MS instrument and start spectra acquisition within 1–2 hrs.
J Proteome Res. Author manuscript; available in PMC 2007 April 17.