Bipolar Role for Myelo-Monocytic Cells
130
Bipolar Role for Myelo-Monocyc Cells in Autoimmune Diseases and Psychiatric Disorders Wouter Beumer
-
Upload
khangminh22 -
Category
Documents
-
view
0 -
download
0
Transcript of Bipolar Role for Myelo-Monocytic Cells
Bipolar Role for Myelo-Monocytic Cellsin Autoimmune Diseases and Psychiatric Disorders
Wouter Beumer

The studies described in this thesis were mainly performed at the Department of Immunology, Erasmus MC, University Medical Center Rotterdam, The Netherlands – and partly performed at the Institut de Biologie de l’Ecole Normale Supérieure, Paris, France – and at the Department of Physiology and School of Medicine, Trinity College Institute of Neuroscience, Trinity College, Dublin, Ireland.
The studies described in the thesis were supported by EU FP7-HEALTH-2007-B. Acronym: Moodinflame, Grant Agreement no. 222963, the Juvenile Diabetes Research Foundation (JDRF) and The Netherlands Organisation for Health Research and Development (ZonMw) grants 950-10-626 and 903-40-193.
Cover: Wouter BeumerIllustrations: Wouter Beumer, Hemmo Drexhage, Lorena Pont-Lezica and Alain BessisLay-out: Legatron Electronic Publishing, RotterdamPrinting: Ipskamp Drukkers BV, Enschede
ISBN/EAN: 978-94-6191-977-9
Copyright ©2013 by Wouter Beumer. All rights reserved. No part of this thesis may be reproduced, stored in a retrieval system or transmitted in any form or by any means, without written permission of the author or, when appropriate, of the publishers of the publications.
Bipolar Role for Myelo-Monocytic Cellsin Autoimmune Diseases and Psychiatric Disorders
Bipolaire rol van myelo-monocytaire cellenin auto-immuunziekten en psychiatrische aandoeningen
Proefschrift
ter verkrijging van de graad van doctor aan de
Erasmus Universiteit Rotterdam
op gezag van de
rector magnificus
prof.dr. H.A.P. Pols
en volgens besluit van het College voor Promoties.
De openbare verdediging zal plaatsvinden op
woensdag 27 november 2013 om 11.30 uur
Wouter Beumer
geboren te ‘s-Gravenhage

PRoMotieCoMMissie:
Promotor: Prof.dr. H.A. Drexhage
overige leden: Prof.dr. H. Hooijkaas Dr. E.F.C. van Rossum Dr. A. Harkin Copromotor: Dr. M.A. Versnel

Contents
Chapter 1 introduction 7J Leukoc Biol. 2012 Nov; 92(5): p. 959-75.
Chapter 2 Microglia shape corpus callosum axon tract fasciculation: 35 functional impact of prenatal inflammation
Submitted
Chapter 3 the altered gene expression profile of microglia of the noD mouse 49 Abnormalities in genes involved in neuronal support and indications for an enhanced iFn type 1 skewed inflammatory machinery
Manuscript will be adjusted for publication
Chapter 4 the gene expression profile of CD11c+CD8α- dendritic cells in the 73 pre-diabetic pancreas of the noD mouse
Submitted
Chapter 5 Changes in serum adhesion molecules, chemokines, cytokines and tissue 97 remodelling factors in euthyroid women without thyroid antibodies who are at risk for autoimmune thyroid disease
A hypothesis on the early phases of the endocrine autoimmune reactionPublished in: J Clin Endocrinol Metab. 2013 Jun;98(6):2460-8.
Chapter 6 increased level of serum cytokines, chemokines and adipokines in patients 115 with schizophrenia is associated with disease and metabolic syndrome
Published in: Psychoneuroendocrinology. 2012 Dec;37(12):1901-11
Chapter 7 General discussion 143
summary 157 samenvatting 161 Abbreviations 165 Dankwoord 167 Curriculum vitae 171 List of publications 173 PhD Portfolio 175


Chapter 1
introduction
Adapted from: The immune theory of psychiatric diseases: a key role for activated microglia and circulating monocytes [1]. By: Beumer W, Gibney SM, Drexhage RC, Pont-Lezica L, Doorduin J, Klein HC, Steiner J, Connor TJ, Harkin A, Versnel MA, Drexhage HA. J Leukoc Biol. 2012 Nov; 92(5): p. 959-75.

8 | Chapter 1
GeneRAL intRoDuCtion
This thesis focusus on the dual janus-faced role of myelo-monocytic cells in the early and late phases of endocrine autoimmune diseases, such as diabetes mellitus type 1 (T1DM) and autoimmune thyroid disease (AITD), and psychiatric disorders such as schizophrenia (SZ) and bipolar disorder (BD). First, a short introduction on the immune system, followed by a brief description of the studied diseases. Therafter I will zoom in on the myelo-monocytic cells and their known role in endocrine autoimmune disease and psychiatric disorders. This chapter will finish with the aims of the studies carried out for this thesis work.
the immune systemThe immune system is a complex system of tissue with cells and messenger molecules interacting to protect an organism against pathogens. It must recognize bacteria, viruses and parasites and should be able to distinguish these pathogenic invaders from the organisms own (healthy) cells and tissues. The innate arm of the immune system represents an immediate but non-specific response. The first layers of defense to protect the organism from infection are mechanical and biological barriers such as the skin and the mucus in the lungs and intestine. After these barriers are breached, innate immune cells are triggered by recognition of molecules on the microbe via the so called pattern recognition receptors. Also signals of damaged and stressed cells can activate innate immune cells. Characteristics of the innate immune response are recruitment and activation of immune cells by cytokines, activation of the complement system, recognition and clearance of pathogens in tissue and induction of an adaptive immune response via antigen presentation. Innate immune cells are phagocytes such as macrophages (MØ), and dendritic cells (DCs) collectively called the myelo-monocytic cells, and neutrophils, but also neutrophils, mast cells, eosinophils, basophils and natural killer cells are part of the innate immune system.
table 1. The two arms of the immune system
Innate Adaptive
Non antigen/pathogen specific response Pathogen and antigen specific response
Immediate maximal response Lag time between exposure and maximal response
Cell-mediated and humoral components Cell-mediated and humoral components
No immunological memory Exposure leads to immunological memory
Found in nearly all forms of life Found only in jawed vertebrates
The adaptive arm of the immune system evokes a strong and specific immune response and also encompasses immunological memory to recognize specific pathogens when encountered for a second time. A key step in the adaptive immune response is the recognition and presentation

Chapter
1
9General introduction |
of antigens by antigen presenting cells such as DCs to T cells. This results in a specific response to the antigen and the induction of memory cells. Cells of the adaptive immune response are lymphocytes, which can be divided into two major subclasses: T cells and B cells. T cells can be subdivided in cytotoxic T cells and T helper cells. Cytotoxic T cells characterized by the expression of CD8 and recognize cells infected with pathogens, whereas T helper cells are characterized by expression of CD4 and are involved in the regulation of both the adaptive as well as the innate immune response. T helper cells can be subdivided in several subtypes based on the expression of specific surface markers or production of cytokines. T helper cells include: a) th1 cells; these cells produce IFN-γ and are involved in the clearance of intracellular bacteria and protozoa by activating cytotoxic T cells and MØs; b) th2 cells; these cells produce IL-4 and are involved in helping B cells to produce specific antibodies against multicellular organisms; and c) th17 cells; these cells produce pro-inflammatory cytokines such as TNF-α, IL-6 and IL-17 and are involved in the response against extracellular bacteria and fungi. Finally, regulatory t (treg) cells suppress the immune response and maintaining tolerance to self-antigens e.g. by producing anti-inflammatory cytokines such as IL-10 and TGF-β. B cells produce after activation by Th2 cells specific antibodies (also called the humoral response) that can recognize and bind to specific antigens. Upon binding, these antibodies trigger the activation of the complement system and facilitate the recognition by phagocytes. Table 1 shows the main characteristics of both arms of the immune response. Autoimmunity is the failure of the immune system to recognize its own constituent parts as harmless self and therefore it leads to an immune response against its own cells and tissues. Diseases that are a results of autoimmunity are called autoimmune diseases. Autoimmune diseases that will be discussed in this thesis are autoimmune thyroid disease, where thyrocytes of the thyroid gland are the target of the immune system and type 1 diabetes mellitus (T1DM), characterized by the autoimmune destruction of the insulin-producing β cells in the Islets of Langerhans in the pancreas. Both autoimmune diseases belong to the so-called endocrine organ-specific autoimmune diseases.
Autoimmune thyroid diseaseAutoimmune thyroid disease (AITD) encompasses a diverse range of clinical entities including Hashimoto’s thyroiditis, atrophic autoimmune thyroiditis, postpartum thyroiditis, Graves’ disease and Graves’ associated opthalmopathy. Hashimoto’s thyroiditis (HT) and Graves’ disease (GD) are the archetypical clinical entities and differ in clinical phenotype (hypothyroidism versus hyperthyroidism), but resemble each other in the histological features of thyroid lymphocytic infiltration, although in HT this infiltration is generally more severe than in GD. Furthermore, without surgical or radioactive iodine ablation, the natural course of GD leads not uncommonly to hypothyroidism [2]. Also, HT and GD run in the same families, implying a shared genetic background of both diseases [3].

10 | Chapter 1
In Graves’ disease autoantibodies directed against the TSH receptor stimulate the thyroid cells to grow and to produce more thyroid hormone leading to goiter formation and hyperthyroidism respectively [4]. Ophtalmopathy (a protrusion of one or both eyes) is often part of the clinical picture of GD in about 30-50% of cases; it is histologically characterized by edematous swelling and leukocyte infiltration of the retrobulbar tissues and fat accumulation behind the eye balls [5]. Retrobulbar adipose tissue consists of special adipocytes/fibroblasts. These cells express the TSH-receptor together with the IGF-receptor. A cell- and autoantibody-mediated reaction to these receptors is thought to induce a stimulation of these receptors leading to fibroblast/adipocyte proliferation and enhanced production of water-attracting glycosaminoglycans by the adipocytes/fibroblasts This in turn leads to a pathological leukocyte infiltration and swelling of the retro-orbital tissues (fat and eye muscles). Studies in Western Europe put the incidence of GD at 1 to 2 cases per 1000 population per year. It occurs much more frequently in women than in men. The disease frequently presents itself during early adolescence or begins gradually in adult women, often after childbirth, and is progressive until treatment. Hashimoto’s thyroiditis is characterised by a gradual destruction of the thyroid gland by a T cell-mediated autoimmune process leading to low levels of thyroid hormone (hypothyroidism). HT is serologically characterized by the presence of autoantibodies against thyroid peroxidase (TPO) [4]. The other main auto antigen is thyroglobulin (Tg). This disorder is believed to be the most common cause of goiter and primary hypothyroidism in North America. An average of 1 to 1.5 out of 1000 people has this disease. It occurs far more often in women than in men (between 10:1 and 20:1), and is most prevalent between 45 and 65 years of age. In European countries, the atrophic, non-goitrous form of autoimmune thyroiditis is more common than Hashimoto’s goiter. Although the clinical manifest disorder has a prevalence of 1 to 1.5 per 1000, serological positivity for anti-TPO antibodies (TPO-abs) occurs in about 10% of the general population. These TPO-antibody positive individuals do have minor leukocyte infiltrations (focal thyroiditis, see below) in the thyroid and have a higher risk of developing clinically overt AITD. This serological positivity is dependent of gender and age: older females of over 30 years of age are in particular serologically positive (up to 30%).
Autoimmune diabetesAutoimmune diabetes or Type 1 diabetes (T1DM) is the other well-known organ-specific endocrine autoimmune disease [6]. In T1DM the insulin producing β cells in the islets of Langerhans in the pancreas are destroyed or silenced by an autoimmune process. Because of this β cell hypo function, the production of insulin diminishes and finally comes to an end. This will lead to hyperglycaemia. Abrupt insulin shortage can cause ketoacidosis which is, when untreated, a fatal outcome of autoimmune diabetes. Several auto antigens have been reported to play a role in autoimmune diabetes, including insulin, GAD65 (65 kDA glutamic acid decarboxylase), the protein tyrosine phosphatase-like antigen IA2 and ICA 69 (69 kDa islet cell antigen) [7]. Of these auto-antigens insulin is the most important one. Antibodies against the above mentioned
Chapter
1
11General introduction |
auto antigens are not only frequently present in patients but also in their 1st degree relatives [8]. However, these autoantibodies do not have an active role in the pathogenesis of diabetes; β cell destruction is caused mainly by CD8+ T cells and MØ infiltrating the islets [9]. Prevalence rates for T1DM are increasing and vary widely by country. In Finland, the incidence is a high of 35 per 100,000 per year, in Japan and China a low of 1-3 per 100,000 per year, and in Northern Europe and the U.S., an intermediate of 8-17 per 100,000 per year [10]. Serological positivity for GAD65 is more prevalent in the general population and ranges around the 1-2%, serological positive individuals do have a higher risk to develop T1DM.
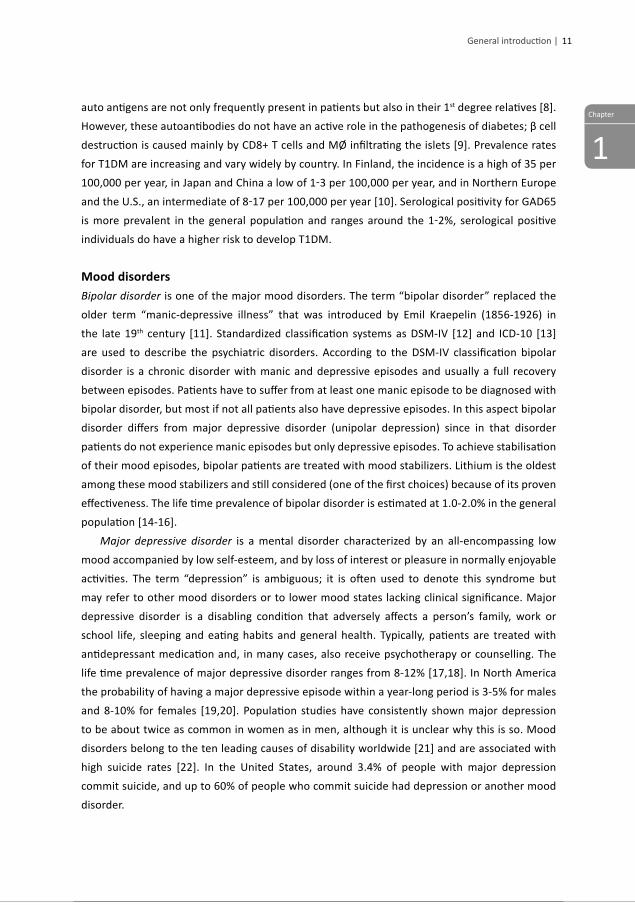
Mood disorders Bipolar disorder is one of the major mood disorders. The term “bipolar disorder” replaced the older term “manic-depressive illness” that was introduced by Emil Kraepelin (1856-1926) in the late 19th century [11]. Standardized classification systems as DSM-IV [12] and ICD-10 [13] are used to describe the psychiatric disorders. According to the DSM-IV classification bipolar disorder is a chronic disorder with manic and depressive episodes and usually a full recovery between episodes. Patients have to suffer from at least one manic episode to be diagnosed with bipolar disorder, but most if not all patients also have depressive episodes. In this aspect bipolar disorder differs from major depressive disorder (unipolar depression) since in that disorder patients do not experience manic episodes but only depressive episodes. To achieve stabilisation of their mood episodes, bipolar patients are treated with mood stabilizers. Lithium is the oldest among these mood stabilizers and still considered (one of the first choices) because of its proven effectiveness. The life time prevalence of bipolar disorder is estimated at 1.0-2.0% in the general population [14-16]. Major depressive disorder is a mental disorder characterized by an all-encompassing low mood accompanied by low self-esteem, and by loss of interest or pleasure in normally enjoyable activities. The term “depression” is ambiguous; it is often used to denote this syndrome but may refer to other mood disorders or to lower mood states lacking clinical significance. Major depressive disorder is a disabling condition that adversely affects a person’s family, work or school life, sleeping and eating habits and general health. Typically, patients are treated with antidepressant medication and, in many cases, also receive psychotherapy or counselling. The life time prevalence of major depressive disorder ranges from 8-12% [17,18]. In North America the probability of having a major depressive episode within a year-long period is 3-5% for males and 8-10% for females [19,20]. Population studies have consistently shown major depression to be about twice as common in women as in men, although it is unclear why this is so. Mood disorders belong to the ten leading causes of disability worldwide [21] and are associated with high suicide rates [22]. In the United States, around 3.4% of people with major depression commit suicide, and up to 60% of people who commit suicide had depression or another mood disorder.

12 | Chapter 1
schizophreniaSchizophrenia is the other major psychiatric disorder next to bipolar disorder and major depressive disorder. Schizophrenia was first described as Dementia Preacox by Emil Kraepelin. A few years after the original description, Eugen Bleuler suggested rephrasing the disorder into schizophrenia (“fragmented mind”) [23]. According to the DSM-IV classification schizophrenia is a mixture of positive and negative psychiatric signs and symptoms [12]. Positive symptoms reflect an excess or distortion of normal perceptive function such as delusions and hallucinations. Negative symptoms reflect a diminution or loss of normal function such as affective flattening and lack of initiative. Patients with schizophrenia are usually treated with antipsychotic medication for the positive symptoms such as psychosis and delusions [24]. There is so far hardly medication for the negative symptoms. In general the effect of medication is not totally satisfactory and there are numerous serious side effects [25]. Schizophrenia is present worldwide and the prevalence is in the range of 0.5%-1.5%. There are geographic differences in prevalence, e.g. the incidence is higher in urban areas [24]. Also migrant groups have a higher incidence: In the Netherlands 1st and especially 2nd generation immigrants from Morocco and Surinam have a 5.8 times and 2.8 higher chance respectively for the development of schizophrenia [26].
Co-occurrence of thyroid autoimmune disease, type 1 diabetes, mood disorders and schizophrenia It is well known that AITD and autoimmune diabetes co-occur more frequently within patients and their families than in the normal population. The co-occurrence of these two organ specific autoimmune diseases is described as Autoimmune Polyendocrine Syndrome (APS), subtype 3A [27,28]. With regard to the pathogenesis of AITD and T1DM shared factors are evident: The same gene polymorphisms such as particular MHC class II subtypes (DR3) and polymorphisms in the CTLA4 and PTPN22 genes are linked to both diseases, and in both diseases there is destruction and/or silencing of the target endocrine tissue by auto reactive CD8+ T cells and Th1 activated MØ. Hypothyroidism, often the consequence of HT is commonly accompanied by depressive symptoms and this is, in part, due to a lack of thyroid hormone; thyroid hormone is needed for brain cells to function optimally. However subjects positive for TPO-antibodies without evidence of hypothyroidism were also shown to have a higher risk to develop mood disorders [29,30]. Vice-versa, mood disorder patients and their relatives are 3-4 times more prone to develop thyroid autoantibodies and in fact up to one third of bipolar patients, their first degree relatives and post-partum psychosis patients show positive thyroid auto-antibodies. It was shown in several studies that this was not related to the use of lithium and irrespective of psychiatric symptoms [31-34]. Also, bipolar patients have a 3-4 times higher prevalence of endocrine autoantibodies other than thyroid autoantibodies, i.e. autoantibodies to gastric parietal endocrine cells and to the diabetes related antigen GAD-65 [35].

Chapter
1
13General introduction |
A large Danish national study also showed the association of psychiatric disease with endocrine (and other organ-specific) autoimmune diseases and showed an association of bipolar disorder with pernicious anemia in the family. In addition, there was also an association found between Guillain-Barré syndrome, inflammatory bowel disease and autoimmune hepatitis in the individual [36]. The Danish national studies in addition showed that patients with schizophrenia had a 45% higher chance of developing an autoimmune disease, amongst which thyroid autoimmune disease [37]. Moreover, these autoimmune diseases were also more prevalent in the parents of patients with schizophrenia, showing that family members have a higher chance of developing such autoimmune disease. Collectively these findings of a high prevalence of psychiatric disorders and endocrine and other (organ-specific) autoimmune diseases in patients and/or their family members refute the concept that psychiatric disorders and endocrine autoimmune disease are cause or consequence of each other. The findings rather imply a shared immune pathogenesis for bipolar disorder, schizophrenia and endocrine autoimmune diseases. The research group I worked in has evidence that this shared immune factor is the presence of a hyper reactive inflammatory MØ or myelo-monocytic cell system.
the myelo-monocytic cell systemThe myelo-monocytic cell system encompasses progenitors in the bone marrow, blood monocytes and the various form of tissue MØs and DCs. The cells have a single nucleus. Phagocytosis and pinocytosis of foreign material, recognition of this material by pattern recognition receptors and elimination of the material are archetypical functions of the cells. However, these cells and processes are also important for the adaptive immune response. An overview of the cell system is shown in figure 1. More specific examples of tissue-residing MØs are the microglia in the brain, the Kuppfer cells in the liver and MØ that reside in the peritoneal cavity, lung, splenic red pulp and bone marrow. These tissue residing MØ play important roles in tissue homeostasis under steady-state conditions [38]. Recent advances in so-called fate mapping experiments demonstrated that these tissue MØ and microglia do not originate from bone marrow derived precursors but were during embryogenesis derived from primitive yolk-sac MØ [39,40]. Still, many similarities between bone marrow derived monocytes/ MØs, tissue MØ and these cell types are present. All express the surface markers CD11b, CD14 and CFS1R and require the transcription factor PU.1 for development and function [41]. In addition, gene expression profiling shows a close relationship between bone-marrow derived MØ and microglia in the C57BL/6 mouse model [42]. Under steady-state conditions, tissue MØ are maintained independently from circulating monocytes [43]. However, under pathological conditions such as metabolic disease and atherosclerosis, monocytes infiltrate the tissue from the bloodstream and subsequently differentiate into tissue MØ (reviewed in [44,45]) or after viral CNS infection into microglia [46]. A schematic overview of the lineage is shown in figure 1.

14 | Chapter 1
the endocrine regulatory role of tissue MØs and DC under steady state conditions Under steady state conditions tissue MØs (the histiocytes) and tissue immature DC (iDC) are mainly derived from local precursors. The tissue MØs and iDC are primarily involved in functions of tissue homoiostasis and growth- and function-regulation of neighboring parenchyma and not in functions of defense when there are no dangerous microbes or compounds around. To give a few examples: iDC in the anterior pituitary are known as folliculo-stellate cells and involved in the build up of the architecture of the anterior pituitary (nests of endocrine cells) and the regulation of the secretion of FSH, LH, GH and TSH by gonadotrophs, somatotrophs and thyrotrophs [47]. iDC and MØs in the thyroid, the islets of Langerhans and the ovaries are involved in the regulation of endocrine cell proliferation, e.g. follicle and islet formation, and in the dampening of the secretion of thyroid hormones and insulin [48-50]. IL-1 and IL-6 produced by these steady state iDC and tissue MØs play important roles in these endocrine regulatory processes.
Figure 1. Overview of the lineage of myelo-monocytic cells [53]. Primitive yolk-sac (YS) MØs give rise to microglia (or microglia progenitors) from embryonic day 9.5 (E9.5) and tissue MØs [39,40, 42]. Circulating monocytes do not contribute to the microglia or tissue MØ pool under steady state conditions [43]. Under pathological conditions (red arrows) monocytes enter the tissue and differentiate into MØs and microglia [44-46]. Abbreviations in figure: HSC: Hematopoietic stem cell, CMP: common myeloid progenitor, GMP: granulocyte and MØ progenitor, MDP: MØ and DC progenitor, CDP: common DC progenitor.
Under steady state conditions the endocrine iDC also take up – due to their strong endocytic capability – the compounds present in their vicinity, such as insulin when in the islets,
Chapter
1
15General introduction |
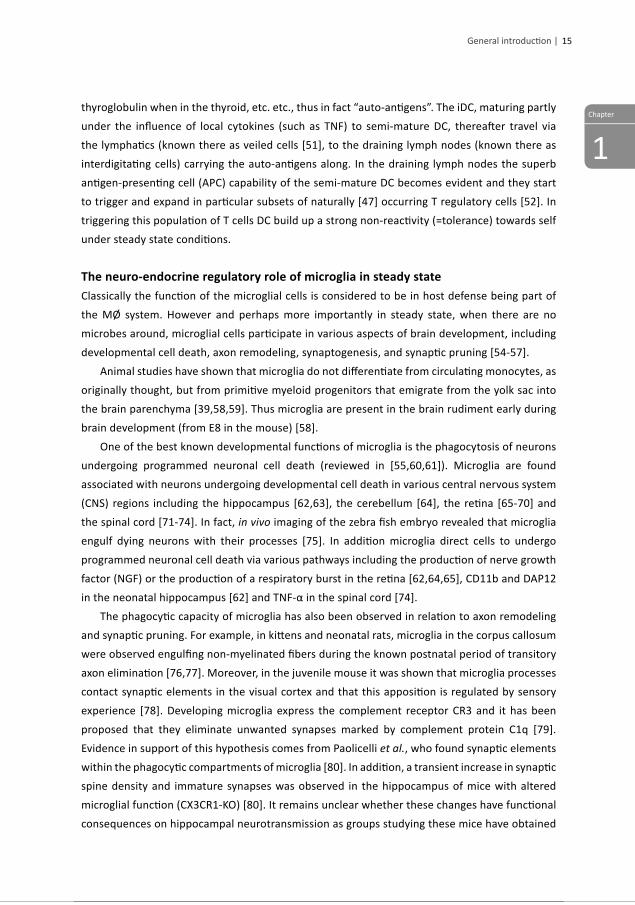
thyroglobulin when in the thyroid, etc. etc., thus in fact “auto-antigens”. The iDC, maturing partly under the influence of local cytokines (such as TNF) to semi-mature DC, thereafter travel via the lymphatics (known there as veiled cells [51], to the draining lymph nodes (known there as interdigitating cells) carrying the auto-antigens along. In the draining lymph nodes the superb antigen-presenting cell (APC) capability of the semi-mature DC becomes evident and they start to trigger and expand in particular subsets of naturally [47] occurring T regulatory cells [52]. In triggering this population of T cells DC build up a strong non-reactivity (=tolerance) towards self under steady state conditions.
the neuro-endocrine regulatory role of microglia in steady state Classically the function of the microglial cells is considered to be in host defense being part of the MØ system. However and perhaps more importantly in steady state, when there are no microbes around, microglial cells participate in various aspects of brain development, including developmental cell death, axon remodeling, synaptogenesis, and synaptic pruning [54-57]. Animal studies have shown that microglia do not differentiate from circulating monocytes, as originally thought, but from primitive myeloid progenitors that emigrate from the yolk sac into the brain parenchyma [39,58,59]. Thus microglia are present in the brain rudiment early during brain development (from E8 in the mouse) [58]. One of the best known developmental functions of microglia is the phagocytosis of neurons undergoing programmed neuronal cell death (reviewed in [55,60,61]). Microglia are found associated with neurons undergoing developmental cell death in various central nervous system (CNS) regions including the hippocampus [62,63], the cerebellum [64], the retina [65-70] and the spinal cord [71-74]. In fact, in vivo imaging of the zebra fish embryo revealed that microglia engulf dying neurons with their processes [75]. In addition microglia direct cells to undergo programmed neuronal cell death via various pathways including the production of nerve growth factor (NGF) or the production of a respiratory burst in the retina [62,64,65], CD11b and DAP12 in the neonatal hippocampus [62] and TNF-α in the spinal cord [74]. The phagocytic capacity of microglia has also been observed in relation to axon remodeling and synaptic pruning. For example, in kittens and neonatal rats, microglia in the corpus callosum were observed engulfing non-myelinated fibers during the known postnatal period of transitory axon elimination [76,77]. Moreover, in the juvenile mouse it was shown that microglia processes contact synaptic elements in the visual cortex and that this apposition is regulated by sensory experience [78]. Developing microglia express the complement receptor CR3 and it has been proposed that they eliminate unwanted synapses marked by complement protein C1q [79]. Evidence in support of this hypothesis comes from Paolicelli et al., who found synaptic elements within the phagocytic compartments of microglia [80]. In addition, a transient increase in synaptic spine density and immature synapses was observed in the hippocampus of mice with altered microglial function (CX3CR1-KO) [80]. It remains unclear whether these changes have functional consequences on hippocampal neurotransmission as groups studying these mice have obtained

16 | Chapter 1
conflicting results [81,82]. Microglia may also participate in synaptogenesis via the secretion of neurotropic factors such as thrombospondins [83], a family of extracellular matrix proteins [84]. Finally, a role for microglia in neuronal development is also suggested by in vitro work with microglia-conditioned medium and primary neuronal cultures. It was shown that microglia-conditioned medium enhances neuronal survival [85-88], increases neurite growth and complexity [86,87] and, in the case of catecholaminergic neurons, promotes neuronal maturation [85]. More generally, microglia secrete an array of chemokines, cytokines, gliotransmitters and neurotrophic factors that have been implicated in various aspects of neuronal function [89-92]. Microglia are present in the neurogenic niches of both the embryonic and adult brains [93, 94], and their role has been found to be either beneficial or detrimental depending on the paradigm (enriched environment, injury, inflammation) [95]. In support of a permissive role in neurogenesis, several in vitro studies carried out in non-inflammatory conditions have shown that microglia, or microglia conditioned medium, stimulate proliferation and differentiation of both embryonic and adult neural progenitor cells (NPCs) [94,96,97]. Adult mice with altered microglial function (CX3CR1 KO) were found to have impaired neurogenesis compared to wild type [81, 98], also supporting the role for microglia in neurogenesis. In the adult hippocampus only a subset of the sub-granular zone -generated neurons are integrated into the mature circuitry; the remaining apoptotic newborn neurons are eliminated by microglia [93]. These findings show the importance of the microglial phagocytic function within the neurogenic niche. Despite the in vitro and in vivo evidence for a functional role of microglia in neurogenesis, the signals governing these mechanisms remain to be uncovered. Figure 2 shows a schematic overview of the homeostatic roles of microglia in neuron growth and function.
Figure 2. Homeostatic role of microglia in the normal brain. Microglia produce neurotrophic factors such as nerve growth factor (NGF), glial cell line-derived neurotrophic factor (GNDF), fibroblast growth factor (FGF), Transforming growth factor-beta 2 (TGF-β2), neurotrophin 4/5 (NT) [41,42,99,100]. NGF, TNF-α and Nitric Oxide (NO-) are involved in programmed neuronal cell death (PNCD). Interactin of fractalkine produced by neurons and CX3CR1 plays a role in removing unwanted synapses [80]. More recently, it has been shown that C1q is also involved in regulation of synapse formation, probably through CR3 on microglia [100].

Chapter
1
17General introduction |
the role of myelo-monocytic cells in the onset of endocrine autoimmunityThere are only limited detailed immune histochemistry studies on the infiltration and activation of DCs and MØ in thyroids and retro-bulbar tissue of patients with active autoimmune thyroid disease (AITD). Most of these studies are not of recent date. The studies show that the number of DCs and MØ is increased in the thyroids of patients with HT and GD [101]. The intra-thyroidal DCs showed signs of activation, i.e. an up regulation of the maturation marker RFD1 (fashionable at the time of these studies), this in contrast to DCs in not-affected, healthy thyroid glands. Also MØ engaged in colloidophagy were often seen to infiltrate the thyroid follicles particularly in Hashimoto’s thyroiditis; this was taken as a sign of thyrocyte destruction. With regard to active Graves’ ophtalmopathy, the studies showed that the retro-bulbar tissues hardly contained activated RFD1 positive DCs [102]. More recent studies show that activated MØ are clearly present in the retro-bulbar tissues and over produce growth factors like PDGF-BB which are capable of stimulating the fibroblasts to grow. The MØs also produce pro-inflammatory cytokines/chemokines contributing to the inflammatory process [103]. Studies on the infiltration and activation of DCs and MØ in the human pancreas of recent onset T1DM cases are even rarer than the studies on human AITD tissues. There is a study on an increased number of TNF and IL-1 containing DCs in the pancreas [104] as well as a study on a high number of RFD1 positive DCs in the pancreas of an 8 month old child that died of a keto-acidotic diabetic coma [105]. Histo-morphological studies showing higher numbers of MØ in recent onset T1DM pancreases are more numerous, these studies indicate that MØ form the predominant infiltrating population of cells next to CD8+ lymphocytes [106]. Interestingly new imaging approaches also show an activation of intra-pancreatic MØ in early onset T1DM [107].
the role of myelo-monocytic cells in the onset of mood disorders and schizophrenia As indicated above, DCs and MØ are pro-inflammatory activated in the target organs of patients with autoimmune thyroid disease and autoimmune diabetes. This abnormal activation of the cells most likely plays a role in breaking T cell tolerance to induce an excessive Th1, Th17 and B cell autoimmune response towards thyrocytes and β cells. An intrinsic defect in T regulatory cell function adds to this, leading to a further imbalance between T effector and T regulator forces. Precisely such an activated state of the DCs, MØ and T cells is presently thought to underlie major mental disorders, and this concept is generally referred to as the “Macrophage-T cell Theory of Major Mental Disorders” proposed in 1992 and adapted in 1995 [108,109]. This theory states that chronically activated MØ (and their counterparts in the brain, i.e. microglia) and T cells produce cytokines and inflammatory compounds impacting brain development and predisposing the brain in such way that genetic and environmental influences are able to precipitate the symptoms of schizophrenia and mania/depression. Although there are reports of an involvement of the immune system in major mental illnesses already in the first decade of the 20th century, it was not until the last decade of the 20th century that detailed studies on an involvement of the immune system in these disorders became more numerous. These studies reported aberrant

18 | Chapter 1
levels of pro-inflammatory cytokines in the serum, plasma and cerebrospinal fluid of patients with schizophrenia and major mood disorders [110-113] and were recently reviewed by us [114,5]. On the basis of these reports it was hypothesized that a pro-inflammatory state of the cytokine network induces psychopathologic symptoms and is involved in the pathogenesis and pathophysiology of these major mental illnesses.
MØ-related pro-inflammatory cytokinesA recent meta-analysis of cytokine studies in schizophrenia [115] confirmed that cytokines such as IL-12, TNF-α, IFN-γ and sCD25 are trait markers of schizophrenia, while IL-1β, IL-6 and TGF-β appeared to be state markers of acute schizophrenia in that study. In a recent meta-analysis on cytokines in major depression IL-6 and TNF-α were found increased [116]. The listed pro-inflammatory cytokines are primarily produced by activated cells of the immune system; such as activated endothelial cells, MØ, DCs and T cells. In the “Macrophage-T cell theory of major mental disorders” it was indeed proposed that chronically activated MØ and T cells produce these cytokines, which would cross the blood-brain barrier and impact brain development, destabilizing the brain functionally in such a way that other genetic and environmental influences are able to precipitate the signs and symptoms of schizophrenia and mania/depression. Cytokines are relatively large molecules, and not all of them cross the blood-brain barrier readily [117,118]. However, there are several (known) mechanisms and routes through which cytokines might enter and act in the brain. These routes have recently been reviewed by us and others [119,120]. In short, after entering the brain parenchyma, it has been shown that these cytokines bind to their receptors on neurons, microglia and other glia cells of various brain nuclei [121], where they can trigger/produce/initiate deregulations of major neurotransmitter and neurodevelopmental systems to facilitate development of psychiatric symptoms [117]. An abnormal inflammatory activation of microglia can be detrimental to neurogenesis and synaptogenesis through lack of provision of neuronal trophic factors or by producing neurotoxic factors and cytokines [95]. Mutant mice in which microglia are in an altered activation state during prenatal development (CD200KO and DAP12KO mice) have impaired hippocampal synaptic transmission, including an increased contribution of AMPA receptors to synaptic currents and altered long-term potentiation relative to wild type animals [122-124]. In favour of a direct detrimental action of inflammatory cytokines on neuronal development, in vitro work has shown that cytokines, such as IL-6, TNF-α, and IL-18, can affect neuronal proliferation, survival, and aspects of differentiation like neurite outgrowth and gene expression patterns [125,126].
Circuating monocytesThe majority of reports on activated meylo-monocytic cells in psychiatric disease evidently deals with the circulating cells, i.e. the blood monocytes, since circulating cells are easily obtainable via venapuncture. Indeed there are strong indications for a pro-inflammatory activation of circulating monocytes in 50-60% of patients with an active psychiatric disease.
Chapter
1
19General introduction |
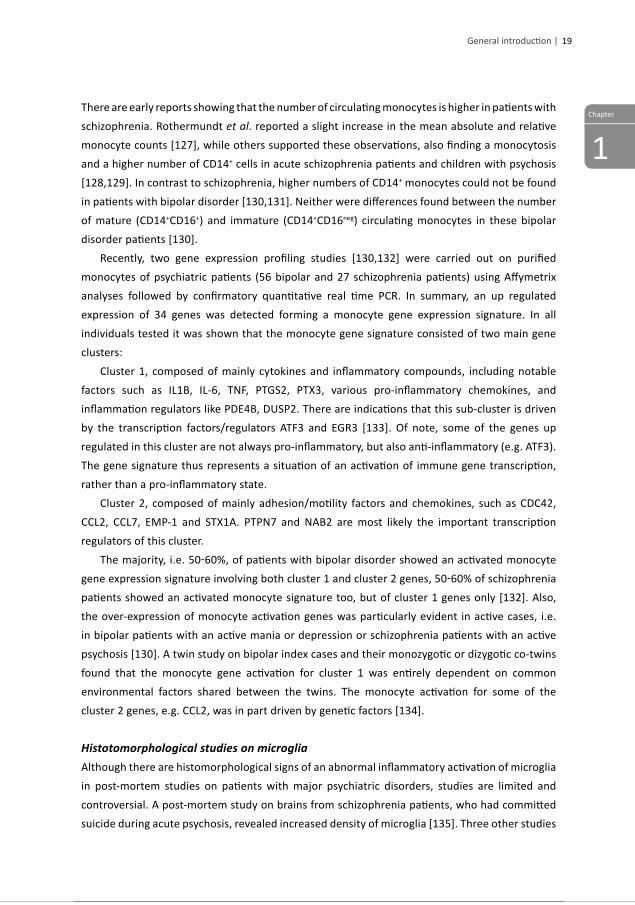
There are early reports showing that the number of circulating monocytes is higher in patients with schizophrenia. Rothermundt et al. reported a slight increase in the mean absolute and relative monocyte counts [127], while others supported these observations, also finding a monocytosis and a higher number of CD14+ cells in acute schizophrenia patients and children with psychosis [128,129]. In contrast to schizophrenia, higher numbers of CD14+ monocytes could not be found in patients with bipolar disorder [130,131]. Neither were differences found between the number of mature (CD14+CD16+) and immature (CD14+CD16neg) circulating monocytes in these bipolar disorder patients [130]. Recently, two gene expression profiling studies [130,132] were carried out on purified monocytes of psychiatric patients (56 bipolar and 27 schizophrenia patients) using Affymetrix analyses followed by confirmatory quantitative real time PCR. In summary, an up regulated expression of 34 genes was detected forming a monocyte gene expression signature. In all individuals tested it was shown that the monocyte gene signature consisted of two main gene clusters: Cluster 1, composed of mainly cytokines and inflammatory compounds, including notable factors such as IL1B, IL-6, TNF, PTGS2, PTX3, various pro-inflammatory chemokines, and inflammation regulators like PDE4B, DUSP2. There are indications that this sub-cluster is driven by the transcription factors/regulators ATF3 and EGR3 [133]. Of note, some of the genes up regulated in this cluster are not always pro-inflammatory, but also anti-inflammatory (e.g. ATF3). The gene signature thus represents a situation of an activation of immune gene transcription, rather than a pro-inflammatory state. Cluster 2, composed of mainly adhesion/motility factors and chemokines, such as CDC42, CCL2, CCL7, EMP-1 and STX1A. PTPN7 and NAB2 are most likely the important transcription regulators of this cluster. The majority, i.e. 50-60%, of patients with bipolar disorder showed an activated monocyte gene expression signature involving both cluster 1 and cluster 2 genes, 50-60% of schizophrenia patients showed an activated monocyte signature too, but of cluster 1 genes only [132]. Also, the over-expression of monocyte activation genes was particularly evident in active cases, i.e. in bipolar patients with an active mania or depression or schizophrenia patients with an active psychosis [130]. A twin study on bipolar index cases and their monozygotic or dizygotic co-twins found that the monocyte gene activation for cluster 1 was entirely dependent on common environmental factors shared between the twins. The monocyte activation for some of the cluster 2 genes, e.g. CCL2, was in part driven by genetic factors [134].
Histotomorphological studies on microgliaAlthough there are histomorphological signs of an abnormal inflammatory activation of microglia in post-mortem studies on patients with major psychiatric disorders, studies are limited and controversial. A post-mortem study on brains from schizophrenia patients, who had committed suicide during acute psychosis, revealed increased density of microglia [135]. Three other studies

20 | Chapter 1
reported increased microglial activation in schizophrenia patients [136-138], while another three did not find an activation state of microglia [139-141]. A drawback of some of these post-mortem studies is that they were performed on old to very old individuals after the process of dying. The increased density of microglia might therefore not reflect the pathophysiology of acute psychotic exacerbation, but the process of dying. Thus far, only two histological studies have analysed patients with affective disorders. A qualitative study of HLA-DR expression showed increased expression of this surface marker on microglia of the hippocampus and prefrontal cortex of depressed patients [138]. Supporting the view of an activation of cells of the mononuclear phagocytes in the brain of psychiatric patients is the observation that there is an accumulation of monocytes and MØ in the cerebrospinal fluid of patients with schizophrenia during acute psychotic episodes [142]. Table 2 summarizes studies on post-mortem brains of psychiatric patients.
table 2. Summary of histological post-mortem studies on microglia.
study Analyzed brain regions Main findings
Arnold et al. [139] hippocampus, prefrontal, orbitofrontal, and calcarine cortex
CD68 expression unchanged in SZ compared to controls
Bayer et al. [138] hippocampus and prefrontal cortex “stronger” HLA-DR expression (qualitative evaluation) in SZ and MD compared to controls
Falke et al. [141] mediodorsal thalamus and caudate nucleus
CD68 unchanged in SZ compared to controls
Radewicz et al. [136]
prefrontal, anterior cingulate, and temporal cortex
Increased HLA-DR expression in elderly patients with SZ compared to controls
Steiner et al. [143,144]
hippocampus, mediodorsal thalamus, prefrontal, anterior cingulate cortex
HLA-DR unchanged in the whole group of SZ and depression cases compared to controls, but increased in acutely ill suicidal patients
Steiner et al. [145] subregions of the anterior cingulate cortex (sACC, aMCC, pACC)
Quinolinic acid immunoreactivity increased in microglial cells of sACC and aMCC of depressed patients compared to controls (particularly in MD, but not in BD)
Togo et al. [140] hippocampus and temporal cortex CD40 and HLA-DP/DQ/DR unchanged in SZ compared to controls
Wierzba-Bobrowicz et al. [137,146]
anterior cingulate and temporal cortex
“stronger” HLA-DP/DQ/DR expression (qualitative evaluation) in SZ compared to controls
Brain scans detecting activated microgliaDevelopments in the field of positron emission tomography (PET) allow researchers to study microglia activation in patients in real time. A PET-tracer ([11C]-PK11195) binds to the mitochondrial translocator protein (TSPO), whose expression is increased in activated microglia and interestingly also in pro-inflammatory activated cells of other lineages [147]. This technique has already successfully been applied in several patient and animal studies of neuropsychiatric

Chapter
1
21General introduction |
disorders [148]. These studies show that immune activation (“inflammatory”) lesions occur in brain regions that are related to the specific disease process. For example, in schizophrenia microglia activation is found in the hippocampal area where functions (immediate memory, sensory/emotional integration) are impaired. Interestingly these focal changes are found only in acute psychotic patients with prominent cognitive impairment [149] and not in patients that recovered from psychosis [150], these acute psychotic patients showed a global brain inflammation effect. In addition to the novel PET tracers for the translocator protein, PET tracers are under development that allow imaging of other components of the immune system, such as other markers of neuro-inflammation (β-glucuronidase by 18F-FEAnGA, [151]), and activated T and B cells. For example, it was recently shown that activated microglia and MØ can also be imaged with the PET tracer [11C]-ketoprofen methyl ester that binds to COX-1 (and not to COX-2), an enzyme that plays an important role in the regulation of neuro-inflammation [152].
Animal modelsIn addition to epidemiological studies in patient studies, there is also evidence from animal models that an inflammatory state of myelo-monocytic cells has an effect on the normal function of the brain causing an altered behavior. Animal models allow study of the early stages of disease in all organs (i.e. brain, pancreas and thyroid). The two models discussed in this thesis are the Maternal Immune Activation (MIA) model and the Non-Obese Diabetic (NOD) mouse. In both models, aberrancies of myelo-monocytic cells have been described. The animal models allow us to monitor activation of the myelo-monocytic cells in both the periphery as well as in the brain.
the maternal immune activation animal modelEpidemiological studies in humans have revealed a strong, positive correlation between prenatal infection and an increased risk of developing psychiatric disorder. For example, the children of mothers who suffered from influenza in the first trimester of pregnancy have a 7 times higher chance of developing schizophrenia; this was 3 times higher for an infection in the second trimester. Another study showed that mothers who are seropositive for HSV-2 during pregnancy have a 2 times higher chance that their offspring develops schizophrenia. Moreover, in a cohort study, IgG antibodies to Toxoplasma were twice as high in mothers who gave birth to a child with schizophrenia [153]. Generally, it has been proven that Toxoplasma, HSV, rubella and cytomegalovirus cross the placenta and cause congenital brain anomalies directly. However, a role for inflammation and immune activation in general should not be neglected. Indeed, it has also been shown that levels of pro-inflammatory cytokines were higher in the serum of mothers during the pregnancy of a child who later developed a psychiatric disorder [153]. Studies using the maternal immune activation model vary widely in what species and immunogens are used (LPS for TLR4 activation or poly I:C for TLR3 activation), how the immunogen is administered, at what dose, as well as the timing and length of exposure. Similarly, there are numerous behavioral, anatomical and molecular readouts that have been evaluated and this at

22 | Chapter 1
various postnatal ages. Several detailed and comprehensive reviews of the results obtained from rodent maternal immune activation models have recently been published [154-156]. In addition, studies where the immunogen was directly administered into the uterus or the fetus have also been reviewed [157,158]. Studies using these various versions of the maternal immune activation model resulted in offspring that display behavioral deficits reminiscent of symptoms associated with psychiatric disorders, such as impaired pre-pulse inhibition, impaired latent inhibition, increased anxiety, impaired locomotor activity, altered social behavior, and deficits in learning and memory [154-156,159]. The particular power of the maternal immune activation models is that they can be used to investigate the mechanisms that lead to the reported changes in behavior and brain function, and in particular how the maternal and fetal immune systems might influence fetal brain development. Initially, studies focused on identifying the characteristics of the activated immune response in the mother and fetus. Thus it was observed that maternal immune activation results in increased levels of various pro-inflammatory molecules not only in the pregnant dam, but also in the placenta, amniotic fluid and the fetus itself [155-159]. Moreover, there is evidence that this fetal immune response has long-lasting effects on the immune system of the offspring as they grow [155,160]. More specifically, LPS- and poly I:C-induced maternal immune activation in the rat and mouse have been linked to elevated circulating levels of TNF-α, IL-1β, IL-6, iNOS, IL-10, MCP1, VEGF protein and/or mRNA after stimulation [155,156,161-165]. In addition, there are reports that maternal immune activation can change the levels of neurotrophic and other neuronal development factors such as NGF, BDNF [161, 166], semaphorin 5B and groucho [163] in the neonatal brain. A direct role for many of these cytokines has been established using techniques such as the administration of blocking antibodies or injection of the pregnant dam with the purified cytokine itself. Much attention has focused on IL-6, because exposure of pregnant dams to IL-6 late during pregnancy results in deficits similar to those observed in LPS and poly I:C-induced maternal immune activation models. These deficits include impaired spatial learning and other hippocampal abnormalities such as neuronal loss, astrogliosis, and changes in neurotransmitter receptor expression [167]. In support for a central role of IL-6, treatment of inflamed dams with anti-IL6 antibodies protects against the development of these abnormal behaviors [168], and IL-6KO animals that were exposed to prenatal immune activation have normal behavior [154-156]. Another important cytokine is TNF-α, a gene implicated in the risk of schizophrenia [159]. Elevated concentrations of TNF-α have been linked to fetal loss and growth restriction by showing that these effects could be limited by the administration of anti-TNF-α antibodies and reproduced by direct treatment of pregnant dams [156,169,170]. Other cytokines might also mediate the effects of prenatal inflammation: for example, prenatal exposure to EGF, IL-1β or leukemia inhibitory factor leads to reduced pre-pulse inhibition and impaired social interaction in rats [159]. Finally, some cytokines have been found to be neuroprotective: treatment with
Chapter
1
23General introduction |
IL-10 can protect against the white matter damage observed in maternal immune activation models [171]. Apart from the changes in cytokine levels found, maternal immune activation models have often been associated with increased neuronal cell death (regional or whole brain) and/or decreased neurogenesis resulting in region-specific or whole brain size reduction [155,156,158]. Another common feature of maternal immune activation are white matter lesions with reduced numbers of oligodendrocytes and hypomyelination [155,156,158]. Finally, a characteristic found in these animal models and that is common to psychiatric disorders is increased astrogliosis and microglial activation [155,156,158]. Interestingly, some of the most affected areas of the brain are those innervated by the dopaminergic system, and the pyramidal cells of the cortex and the hippocampus. Regarding the dopaminergic system, the majority of studies show that prenatal inflammation leads to dopaminergic hyper-function in animal models, similar to what is observed in schizophrenia [154,156]. The majority of work has been done using the viral mimic model (poly I:C), where immune staining showed increased numbers of tyrosine hydroxylase and dopamine-transporter+ cells in mesencephalon, as well as increased tyrosine hydroxylase immune reactivity in dopamine-innervated regions. Interestingly, although investigators found raised dopamine levels in the prefrontal cortex, this area had decreased dopamine 1 and 2 receptor immune reactivity [154-156]. In the case of LPS-mediated maternal immune activation, several studies in the rat have shown that chronic LPS-induced maternal immune activation results in increased levels of dopamine and tyrosine hydroxylase reactivity in the nucleus accumbens of the offspring [160, 172,173], whereas a more acute treatment has the opposite effect, decreasing the dopamine concentration and tyrosine hydroxylase reactivity [155,174,175]. The discrepancies in some of these results might reflect the differences in maternal immune activation models used (different immunogens administered to different species at different time points in gestation).
the noD mouse animal model The NOD mouse model is considered an excellent model of human T1DM and spontaneously develops an autoimmune insulitis and an autoimmune thryroiditis similar to T1DM/AITD patients [176,177]. This includes the presence of organ-specific autoantibodies, autoreactive T cells and genetic aberrancies in MHC and various non-MHC alleles. The autoimmune insulitis of the NOD mouse has been studied in much more detail than the autoimmune thyroiditis and therefore we will focus mostly on the NOD autoimmune insulitis. With regard to the early phases of the NOD autoimmune insulitis. Diana et al. recently showed a transient accumulation of a small number of plasmacytoid DCs, lymphocytes and B cells in the pancreatic islets of NOD mice at 2 weeks of age [178]. An interaction between these infiltrating cells was shown to be involved in the onset of autoimmunity against the β cells. For this very early time point small transient accumulations of DCs and MØ around the islets have been reported on before [179,180], as well as on apoptosis abnormalities in the pancreas of the NOD mouse [181].

24 | Chapter 1
This first relatively mild intra-islet and peri-islet accumulation of immune cells at 2 weeks of age is followed by a second wave of a larger para- and peri-islet immune cell accumulation starting at 5 weeks of age consisting predominantly of cDCs and MØ, later followed (7-8 weeks) by a massive lymphocyte accumulation [182,183] and a second wave of pDCs. At the time of this larger para- and peri-islet immune cell accumulation there is also a steady increase of dispersed cDCs and MØ in the exocrine pancreas [182]. A key role for the peri-islet and pancreas accumulating cDCs and MØ in the pathogenesis of the destructive insulitis is indicated by the demonstration that a temporal depletion of cDCs and MØ at 5 weeks of age before the onset of lymphocytic insulitis blocks or significantly delays the diabetes onset in NOD mice [184,185]. Also, there are signs that these early accumulating MØ and DCs tend to have an immune activated set point, they lack surface CCR5 expression (CCR5 ligation is essential to dampen IL-12 production) [186], and the composition of the accumulating population of MØ and DCs lacks a prototypic tolerogenic DC population, the CD8α+CD103+Langerin+ DCs [187]. With regard to circulating monocytes in the NOD mouse, there is abnormal maturation and differentiation of monocytes from precursors resulting in an abnormally high number of mature Ly6Clow monocytes (the murine counterpart of CD14+CD16+ monocytes) [188,164]. This imbalance is also found in the non-diabetic strains NOR and NODH2b, suggesting that this feature is intrinsic of its genetic background and not a consequence of disease. Secondly, these mature monocytes display a high adhesion to fibronectin and ICAM-1. Third, results from in vitro cultures showed that NOD monocytes preferentially differentiate into inflammatory MØ-like cells instead of tolerogenic DCs. This might be related to the dysfunction of STAT5 in the monocytes/MØ of the NOD mouse resulting in aberrantly high prostaglandin E2 (PGE2), COX-2 and GM-CSF production [189,165]. These findings were partially supported by a more recent study, where they found, after in vitro LPS stimulation, an increased expression of COX-2 mRNA and PGE2 secretion by the monocytes obtained from NOD mice compared to C57BL/6 mice [190,166]. Interestingly – and importantly for the clinical association between endocrine autoimmunity and psychiatric disease – there are indications of an abnormal behavior of and neurodevelopment in the NOD mouse. Several reports indicate an abnormal behavior in NOD mice as compared to C57BL6 mice. An early study by Amrani et al., found increased activity of NOD mice in the open field. In addition NOD mice showed a decreased response to a psychological stressor, but not to a metabolic stressor as compared to C57BL/6 mice [191,167]. The finding of increased activity in the open field was supported by a study of Buthe et al., where they compared 14 inbred mouse strains in the open field and the NOD was among the most active strains [192,168,168]. Limitation of these studies is that they do not take into account the different genetic background of the strains as a possible cause of this abnormal behavior. Nevertheless the NOD mouse model opens avenues to study the association of autoimmunity and psychiatric disease and gene-environment interactions in this association. Although there are many similarities between peripheral MØ/DC, monocytes and microglia (see before), they nevertheless belong to different sub-lineages. It remains therefore to be

Chapter
1
25General introduction |
established, whether the abnormalities found in the peripheral counterparts of the myelo-monocytic cell lineage in the NOD mouse are also present in the microglia. A the study of Bluthé et al., where they also injected NOD and CD-1 mice with IL-1β and LPS to induce sickness behavior, indicated that NOD mice are particularly sensitive to the behavioral effects of IL-1β compared to CD-1 mice even though the distribution of IL-1 receptors in the dentate gyrus, choroid plexus, meninges, and anterior pituitary of NOD and CD-1 mice was found the same [193,170]. Interestingly, NOD MØs and DCs have been described as defective for IDO activity after IFN-γ stimulation [194]. Excessive IDO activity has been linked to depressive-like behavior and is considered to be associated with chronic low grade inflammation of the brain. Apparently, the IDO pathway does not play a role in the NOD mouse model under steady-state conditions, but might be applicable under LPS or IL-1 stress. Overall, the NOD mouse is a unique and interesting model to study gene-environment relationships between peripheral and brain myelo-monocytic cell activation and abnormal behavior.
AiM AnD outLine oF the thesis
The overall aim of this thesis was to investigate the role of myelo-monocytic cells in the onset and pathogenesis of autoimmune endocrine and psychiatric disease. The main focus of the first part of this thesis (chapter 2 to 4) is on the role of myelo-monocytic cells in the early stages of autoimmune endocrine disease and brain development in mouse models. Myelo-monocytic cells (DC and MØ) were isolated by flow cytometic sorting and microarrays were used to study genome-wide gene expression profiles in chapters 2-4. Chapter 2 describes a study aiming to elucidate the implications of microglia activation on the development of the corpus callosum in mouse embryos. Microglia were challenged both chemically (maternal immune activation by LPS at embryonic day 15) or genetically (DAP12 loss of function mutation). In chapter 3, the goal was to study the microglia in the NOD mouse under both steady-state as well as inflammatory conditions. To provide more insight on the role of DCs in the onset of diabetes the properties of the major pancreatic subset of DCs in pre-diabetic NOD were studied by flow cytometry and microarray analysis in chapter 4. The second part of this thesis (chapter 5 and 6) describes two large patient studies on MØ-related serum factors in AITD and chronic SZ patients. Serum factor analysis included monocyte/MØ related cytokines, growth factors and tissue remodeling factors, which were measured and assessed as biomarkers for the prediction of sero-conversion in AITD in chapter 5. The immune activation indicated by increased levels of cytokines, chemokines and adipokines and the effect of comorbidities such as metabolic syndrome were studied in chronic SZ patients in chapter 6. Finally, in chapter 7 we discuss the significance and implications of these studies, its limitations and directions for future research.

26 | Chapter 1
ReFeRenCes
1. Beumer, W., et al., The immune theory of psychiatric diseases: a key role for activated microglia and circulating monocytes. J Leukoc Biol, 2012. 92(5): p. 959-75.
2. Wood, L.C. and S.H. Ingbar, Hypothyroidism as a late sequela in patient with Graves’ disease treated with antithyroid agents. J Clin Invest, 1979. 64(5): p. 1429-1436.
3. Weetman, A.P., The genetics of autoimmune thyroid disease. Horm Metab Res, 2009. 41(6): p. 421-425.
4. Klecha, A.J., et al., Immune-endocrine interactions in autoimmune thyroid diseases. Neuroimmuno-modulation, 2008. 15(1): p. 68-75.
5. Smith, T.J., Pathogenesis of Graves’ orbitopathy: a 2010 update. J Endocrinol Invest, 2010. 33(6): p. 414-421.
6. Betterle, C., F. Lazzarotto, and F. Presotto, Autoimmune polyglandular syndrome Type 2: the tip of an iceberg? Clin Exp Immunol, 2004. 137(2): p. 225-233.
7. Zhang, L., M. Nakayama, and G.S. Eisenbarth, Insulin as an autoantigen in NOD/human diabetes. Curr Opin Immunol, 2008. 20(1): p. 111-118.
8. Karaguzel, G., et al., Screening of diabetes, thyroid, and celiac diseases-related autoantibodies in a sample of Turkish children with type 1 diabetes and their siblings. Diabetes Res Clin Pract, 2008. 80(2): p. 238-243.
9. Lehuen, A., et al., Immune cell crosstalk in type 1 diabetes. Nat Rev Immunol, 2010. 10(7): p. 501-513.10. Nakayama, M., et al., Prime role for an insulin epitope in the development of type 1 diabetes in NOD
mice. Nature, 2005. 435(7039): p. 220-223.11. Kraepelin, E., Manic-depressive insanity and paranoia. Journal of Nervous & Mental Disease, 1921.
53(4).12. American Psychiatric Association., Diagnostic criteria from DSM-IV-TR. 2000, Washington, D.C.:
American Psychiatric Association. xii, 370 p.13. WHO, International statistical classification of diseases and related health problems. - 10th revision,
edition 2007. 2007.14. Pini, S., et al., Prevalence and burden of bipolar disorders in European countries. Eur Neuro-
psychopharmacol, 2005. 15(4): p. 425-434.15. Merikangas, K.R., et al., Lifetime and 12-month prevalence of bipolar spectrum disorder in the National
Comorbidity Survey replication. Arch Gen Psychiatry, 2007. 64(5): p. 543-52.16. Regeer, E.J., et al., Prevalence of bipolar disorder in the general population: a Reappraisal Study of the
Netherlands Mental Health Survey and Incidence Study. Acta Psychiatr Scand, 2004. 110(5): p. 374-82.17. Andrade, L., et al., The epidemiology of major depressive episodes: results from the International
Consortium of Psychiatric Epidemiology (ICPE) Surveys. Int J Methods Psychiatr Res, 2003. 12(1): p. 3-21.
18. Kessler, R.C., et al., The epidemiology of major depressive disorder: results from the National Comorbidity Survey Replication (NCS-R). JAMA, 2003. 289(23): p. 3095-3105.
19. Kessler, R.C., et al., Lifetime prevalence and age-of-onset distributions of DSM-IV disorders in the National Comorbidity Survey Replication. Arch Gen Psychiatry, 2005. 62(6): p. 593-602.
20. Murphy, J.M., et al., A 40-year perspective on the prevalence of depression: the Stirling County Study. Arch Gen Psychiatry, 2000. 57(3): p. 209-15.
21. Kupfer, D.J., The increasing medical burden in bipolar disorder. JAMA, 2005. 293(20): p. 2528-2530.22. Novick, D.M., H.A. Swartz, and E. Frank, Suicide attempts in bipolar I and bipolar II disorder: a review
and meta-analysis of the evidence. Bipolar Disord, 2010. 12(1): p. 1-9.23. Bleuler, E., Dementia praecox. 1950, New York,: International Universities Press. 548 p.24. van Os, J. and S. Kapur, Schizophrenia. Lancet, 2009. 374(9690): p. 635-645.25. Muench, J. and A.M. Hamer, Adverse effects of antipsychotic medications. Am Fam Physician, 2010.
81(5): p. 617-622.
Chapter
1
27General introduction |
26. Veling, W., et al., Incidence of schizophrenia among ethnic minorities in the Netherlands: a four-year first-contact study. Schizophr Res, 2006. 86(1-3): p. 189-93.
27. Lam-Tse, W.K., et al., The association between autoimmune thyroiditis, autoimmune gastritis and type 1 diabetes. Pediatr Endocrinol Rev, 2003. 1(1): p. 22-37.
28. Betterle, C. and R. Zanchetta, Update on autoimmune polyendocrine syndromes (APS). Acta Biomed, 2003. 74(1): p. 9-33.
29. Carta, M.G., et al., A case control study on psychiatric disorders in Hashimoto disease and Euthyroid Goitre: not only depressive but also anxiety disorders are associated with thyroid autoimmunity. Clin Pract Epidemiol Ment Health, 2005. 1: p. 23.
30. Carta, M.G., et al., The link between thyroid autoimmunity (antithyroid peroxidase autoantibodies) with anxiety and mood disorders in the community: a field of interest for public health in the future. BMC Psychiatry, 2004. 4: p. 25.
31. Kupka, R.W., et al., High rate of autoimmune thyroiditis in bipolar disorder: lack of association with lithium exposure. Biol Psychiatry, 2002. 51(4): p. 305-311.
32. Hillegers, M.H.J., et al., Signs of a higher prevalence of autoimmune thyroiditis in female offspring of bipolar parents. Eur Neuropsychopharmacol, 2007. 17(6-7): p. 394-399.
33. Vonk, R., et al., Is autoimmune thyroiditis part of the genetic vulnerability (or an endophenotype) for bipolar disorder? Biol Psychiatry, 2007. 62(2): p. 135-40.
34. Bergink, V., et al., Prevalence of autoimmune thyroid dysfunction in postpartum psychosis. Br J Psychiatry, 2011. 198(4): p. 264-8.
35. Padmos, R.C., et al., A high prevalence of organ-specific autoimmunity in patients with bipolar disorder. Biol Psychiatry, 2004. 56(7): p. 476-82.
36. Eaton, W.W., et al., Association of schizophrenia and autoimmune diseases: linkage of Danish national registers. Am J Psychiatry, 2006. 163(3): p. 521-528.
37. Eaton, W.W., et al., Autoimmune diseases, bipolar disorder, and non-affective psychosis. Bipolar Disord, 2010. 12(6): p. 638-646.
38. Murray, P.J. and T.A. Wynn, Protective and pathogenic functions of macrophage subsets. Nat Rev Immunol, 2011. 11(11): p. 723-37.
39. Ginhoux, F., et al., Fate mapping analysis reveals that adult microglia derive from primitive macrophages. Science, 2010. 330(6005): p. 841-5.
40. Schulz, C., et al., A lineage of myeloid cells independent of Myb and hematopoietic stem cells. Science, 2012. 336(6077): p. 86-90.
41. Kettenmann, H., et al., Physiology of microglia. Physiol Rev, 2011. 91(2): p. 461-553.42. Saijo, K. and C.K. Glass, Microglial cell origin and phenotypes in health and disease. Nat Rev Immunol,
2011. 11(11): p. 775-87.43. Hashimoto, D., et al., Tissue-resident macrophages self-maintain locally throughout adult life with
minimal contribution from circulating monocytes. Immunity, 2013. 38(4): p. 792-804.44. Ingersoll, M.A., et al., Monocyte trafficking in acute and chronic inflammation. Trends Immunol, 2011.
32(10): p. 470-7.45. Chawla, A., K.D. Nguyen, and Y.P. Goh, Macrophage-mediated inflammation in metabolic disease. Nat
Rev Immunol, 2011. 11(11): p. 738-49.46. Getts, D.R., et al., Ly6c+ “inflammatory monocytes” are microglial precursors recruited in a pathogenic
manner in West Nile virus encephalitis. J Exp Med, 2008. 205(10): p. 2319-37.47. Hoek, A., et al., Dendritic cells and macrophages in the pituitary and the gonads. Evidence for their role
in the fine regulation of the reproductive endocrine response. Eur J Endocrinol, 1997. 136(1): p. 8-24.48. Geutskens, S.B., et al., Macrophages in the murine pancreas and their involvement in fetal endocrine
development in vitro. J Leukoc Biol, 2005. 78(4): p. 845-52.49. Simons, P.J., F.G. Delemarre, and H.A. Drexhage, Antigen-presenting dendritic cells as regulators of
the growth of thyrocytes: a role of interleukin-1beta and interleukin-6. Endocrinology, 1998. 139(7): p. 3148-56.
28 | Chapter 1
50. Simons, P.J., F.G. Delemarre, and H.A. Drexhage, A functional and phenotypic study on immune accessory cells isolated from the thyroids of Wistar and autoimmune-prone BB-DP rats. J Autoimmun, 2000. 15(4): p. 417-24.
51. Ruwhof, C., et al., Accessory cells with a veiled morphology and movement pattern generated from monocytes after avoidance of plastic adherence and of NADPH oxidase activation. A comparison with GM-CSF/IL-4-induced monocyte-derived dendritic cells. Immunobiology, 2002. 205(3): p. 247-66.
52. Sakaguchi, S., et al., Regulatory T cells and immune tolerance. Cell, 2008. 133(5): p. 775-87.53. Gordon, S. and P.R. Taylor, Monocyte and macrophage heterogeneity. Nat Rev Immunol, 2005. 5(12):
p. 953-64.54. Pont-Lezica, L., et al., Physiological roles of microglia during development. J Neurochem, 2011. 119(5):
p. 901-8.55. Schlegelmilch, T., K. Henke, and F. Peri, Microglia in the developing brain: from immunity to behaviour.
Curr Opin Neurobiol, 2011. 21(1): p. 5-10.56. Tremblay, M.E. and A.K. Majewska, A role for microglia in synaptic plasticity? Commun Integr Biol,
2011. 4(2): p. 220-2.57. Tremblay, M.E., et al., The role of microglia in the healthy brain. J Neurosci, 2011. 31(45): p. 16064-9.58. Alliot, F., I. Godin, and B. Pessac, Microglia derive from progenitors, originating from the yolk sac, and
which proliferate in the brain. Brain Res Dev Brain Res, 1999. 117(2): p. 145-52.59. Herbomel, P., B. Thisse, and C. Thisse, Zebrafish early macrophages colonize cephalic mesenchyme and
developing brain, retina, and epidermis through a M-CSF receptor-dependent invasive process. Dev Biol, 2001. 238(2): p. 274-88.
60. Bessis, A., et al., Microglial control of neuronal death and synaptic properties. Glia, 2007. 55(3): p. 233-8.
61. Mallat, M., J.L. Marin-Teva, and C. Cheret, Phagocytosis in the developing CNS: more than clearing the corpses. Curr Opin Neurobiol, 2005. 15(1): p. 101-7.
62. Wakselman, S., et al., Developmental neuronal death in hippocampus requires the microglial CD11b integrin and DAP12 immunoreceptor. J Neurosci, 2008. 28(32): p. 8138-43.
63. Dalmau, I., et al., Development of microglia in the prenatal rat hippocampus. J Comp Neurol, 1997. 377(1): p. 70-84.
64. Marin-Teva, J.L., et al., Microglia promote the death of developing Purkinje cells. Neuron, 2004. 41(4): p. 535-47.
65. Frade, J.M. and Y.A. Barde, Microglia-derived nerve growth factor causes cell death in the developing retina. Neuron, 1998. 20(1): p. 35-41.
66. Ashwell, K., Development of microglia in the albino rabbit retina. J Comp Neurol, 1989. 287(3): p. 286-301.
67. Ashwell, K.W., et al., The appearance and distribution of microglia in the developing retina of the rat. Vis Neurosci, 1989. 2(5): p. 437-48.
68. Cuadros, M.A., et al., Haemopoietic phagocytes in the early differentiating avian retina. J Anat, 1991. 177: p. 145-58.
69. Cuadros, M.A., et al., First appearance, distribution, and origin of macrophages in the early development of the avian central nervous system. J Comp Neurol, 1993. 330(1): p. 113-29.
70. Moujahid, A., et al., Macrophages during avian optic nerve development: relationship to cell death and differentiation into microglia. Anat Embryol (Berl), 1996. 193(2): p. 131-44.
71. Rezaie, P., K. Patel, and D.K. Male, Microglia in the human fetal spinal cord--patterns of distribution, morphology and phenotype. Brain Res Dev Brain Res, 1999. 115(1): p. 71-81.
72. Caldero, J., et al., Development of microglia in the chick embryo spinal cord: implications in the regulation of motoneuronal survival and death. J Neurosci Res, 2009. 87(11): p. 2447-66.
73. Rigato, C., et al., Pattern of invasion of the embryonic mouse spinal cord by microglial cells at the time of the onset of functional neuronal networks. Glia, 2011. 59(4): p. 675-95.
74. Sedel, F., et al., Macrophage-derived tumor necrosis factor alpha, an early developmental signal for motoneuron death. J Neurosci, 2004. 24(9): p. 2236-46.

Chapter
1
29General introduction |
75. Peri, F. and C. Nusslein-Volhard, Live imaging of neuronal degradation by microglia reveals a role for v0-ATPase a1 in phagosomal fusion in vivo. Cell, 2008. 133(5): p. 916-27.
76. Ling, E.A., Some aspects of amoeboid microglia in the corpus callosum and neighbouring regions of neonatal rats. J Anat, 1976. 121(Pt 1): p. 29-45.
77. Innocenti, G.M., S. Clarke, and H. Koppel, Transitory macrophages in the white matter of the developing visual cortex. II. Development and relations with axonal pathways. Brain Res, 1983. 313(1): p. 55-66.
78. Tremblay, M.E., R.L. Lowery, and A.K. Majewska, Microglial interactions with synapses are modulated by visual experience. PLoS Biol, 2010. 8(11): p. e1000527.
79. Stevens, B., et al., The classical complement cascade mediates CNS synapse elimination. Cell, 2007. 131(6): p. 1164-78.
80. Paolicelli, R.C., et al., Synaptic pruning by microglia is necessary for normal brain development. Science, 2011. 333(6048): p. 1456-8.
81. Rogers, J.T., et al., CX3CR1 deficiency leads to impairment of hippocampal cognitive function and synaptic plasticity. J Neurosci, 2011. 31(45): p. 16241-50.
82. Maggi, L., et al., CX(3)CR1 deficiency alters hippocampal-dependent plasticity phenomena blunting the effects of enriched environment. Front Cell Neurosci, 2011. 5: p. 22.
83. Chamak, B., A. Dobbertin, and M. Mallat, Immunohistochemical detection of thrombospondin in microglia in the developing rat brain. Neuroscience, 1995. 69(1): p. 177-87.
84. Christopherson, K.S., et al., Thrombospondins are astrocyte-secreted proteins that promote CNS synaptogenesis. Cell, 2005. 120(3): p. 421-33.
85. Nagata, K., et al., Microglial conditioned medium promotes survival and development of cultured mesencephalic neurons from embryonic rat brain. J Neurosci Res, 1993. 34(3): p. 357-63.
86. Chamak, B., V. Morandi, and M. Mallat, Brain macrophages stimulate neurite growth and regeneration by secreting thrombospondin. J Neurosci Res, 1994. 38(2): p. 221-33.
87. Zhang, S.C. and S. Fedoroff, Neuron-microglia interactions in vitro. Acta Neuropathol, 1996. 91(4): p. 385-95.
88. Morgan, S.C., D.L. Taylor, and J.M. Pocock, Microglia release activators of neuronal proliferation mediated by activation of mitogen-activated protein kinase, phosphatidylinositol-3-kinase/Akt and delta-Notch signalling cascades. J Neurochem, 2004. 90(1): p. 89-101.
89. Lucin, K.M. and T. Wyss-Coray, Immune activation in brain aging and neurodegeneration: too much or too little? Neuron, 2009. 64(1): p. 110-22.
90. Kim, S.U. and J. de Vellis, Microglia in health and disease. J Neurosci Res, 2005. 81(3): p. 302-13.91. Garden, G.A. and T. Moller, Microglia biology in health and disease. J Neuroimmune Pharmacol, 2006.
1(2): p. 127-37.92. Ben Achour, S. and O. Pascual, Glia: the many ways to modulate synaptic plasticity. Neurochem Int,
2010. 57(4): p. 440-5.93. Sierra, A., et al., Microglia shape adult hippocampal neurogenesis through apoptosis-coupled
phagocytosis. Cell Stem Cell, 2010. 7(4): p. 483-95.94. Antony, J.M., et al., Endogenous microglia regulate development of embryonic cortical precursor cells.
J Neurosci Res, 2011. 89(3): p. 286-98.95. Ekdahl, C.T., Z. Kokaia, and O. Lindvall, Brain inflammation and adult neurogenesis: the dual role of
microglia. Neuroscience, 2009. 158(3): p. 1021-1029.96. Walton, N.M., et al., Microglia instruct subventricular zone neurogenesis. Glia, 2006. 54(8): p. 815-25.97. Aarum, J., et al., Migration and differentiation of neural precursor cells can be directed by microglia.
Proc Natl Acad Sci U S A, 2003. 100(26): p. 15983-8.98. Bachstetter, A.D., et al., Fractalkine and CX 3 CR1 regulate hippocampal neurogenesis in adult and
aged rats. Neurobiol Aging, 2011. 32(11): p. 2030-44.99. Kettenmann, H., F. Kirchhoff, and A. Verkhratsky, Microglia: new roles for the synaptic stripper. Neuron,
2013. 77(1): p. 10-8.100. Schafer, D.P., et al., Microglia sculpt postnatal neural circuits in an activity and complement-dependent
manner. Neuron, 2012. 74(4): p. 691-705.

30 | Chapter 1
101. Kabel, P.J., et al., Intrathyroidal dendritic cells. J Clin Endocrinol Metab, 1988. 66(1): p. 199-207.102. Quadbeck, B., et al., Dysregulation of TNF/TNFR superfamily members: a systemic link between intra-
and extrathyroidal manifestations in Graves’ disease. Scand J Immunol, 2006. 64(5): p. 523-530.103. van Steensel, L., et al., Orbit-infiltrating mast cells, monocytes, and macrophages produce PDGF
isoforms that orchestrate orbital fibroblast activation in Graves’ ophthalmopathy. J Clin Endocrinol Metab, 2012. 97(3): p. E400-8.
104. Uno, S., et al., Macrophages and dendritic cells infiltrating islets with or without beta cells produce tumour necrosis factor-alpha in patients with recent-onset type 1 diabetes. Diabetologia, 2007. 50(3): p. 596-601.
105. Jansen, A., et al., An immunohistochemical study on organized lymphoid cell infiltrates in fetal and neonatal pancreases. A comparison with similar infiltrates found in the pancreas of a diabetic infant. Autoimmunity, 1993. 15(1): p. 31-38.
106. Richardson, S.J., et al., Immunopathology of the human pancreas in type-I diabetes. Semin Immuno-pathol, 2011. 33(1): p. 9-21.
107. Gaglia, J.L., et al., Noninvasive imaging of pancreatic islet inflammation in type 1A diabetes patients. J Clin Invest, 2011. 121(1): p. 442-445.
108. Smith, R.S., A comprehensive macrophage-T-lymphocyte theory of schizophrenia. Med Hypotheses, 1992. 39(3): p. 248-257.
109. Smith, R.S. and M. Maes, The macrophage-T-lymphocyte theory of schizophrenia: additional evidence. Med Hypotheses, 1995. 45(2): p. 135-141.
110. Drexhage, R.C., et al., Patients with schizophrenia show raised serum levels of the pro-inflammatory chemokine CCL2: association with the metabolic syndrome in patients? Schizophr Res, 2008. 102(1-3): p. 352-5.
111. Padmos, R.C., et al., A discriminating messenger RNA signature for bipolar disorder formed by an aberrant expression of inflammatory genes in monocytes. Arch Gen Psychiatry, 2008. 65(4): p. 395-407.
112. Potvin, S., et al., Inflammatory cytokine alterations in schizophrenia: a systematic quantitative review. Biol Psychiatry, 2008. 63(8): p. 801-8.
113. Garver, D.L., R.L. Tamas, and J.A. Holcomb, Elevated interleukin-6 in the cerebrospinal fluid of a previously delineated schizophrenia subtype. Neuropsychopharmacology, 2003. 28(8): p. 1515-20.
114. Drexhage, R.C., et al., The mononuclear phagocyte system and its cytokine inflammatory networks in schizophrenia and bipolar disorder. Expert Rev Neurother, 2010. 10(1): p. 59-76.
115. Miller, B.J., et al., Meta-analysis of cytokine alterations in schizophrenia: clinical status and antipsychotic effects. Biol Psychiatry, 2011. 70(7): p. 663-671.
116. Dowlati, Y., et al., A meta-analysis of cytokines in major depression. Biol Psychiatry, 2010. 67(5): p. 446-457.
117. Anisman, H., Cascading effects of stressors and inflammatory immune system activation: implications for major depressive disorder. J Psychiatry Neurosci, 2009. 34(1): p. 4-20.
118. Kastin, A.J., et al., Peptides crossing the blood-brain barrier: some unusual observations. Brain Res, 1999. 848(1-2): p. 96-9100.
119. Beumer, W., et al., The immune theory of psychiatric diseases: a key role for activated microglia and circulating monocytes. J Leukoc Biol, 2012. 92(5): p. 959-975.
120. Quan, N. and W.A. Banks, Brain-immune communication pathways. Brain Behav Immun, 2007. 21(6): p. 727-35.
121. Chesnokova, V. and S. Melmed, Minireview: Neuro-immuno-endocrine modulation of the hypothalamic-pituitary-adrenal (HPA) axis by gp130 signaling molecules. Endocrinology, 2002. 143(5): p. 1571-1574.
122. Roumier, A., et al., Impaired synaptic function in the microglial KARAP/DAP12-deficient mouse. J Neurosci, 2004. 24(50): p. 11421-11428.
123. Roumier, A., et al., Prenatal activation of microglia induces delayed impairment of glutamatergic synaptic function. PLoS One, 2008. 3(7).

Chapter
1
31General introduction |
124. Costello, D.A., et al., Long term potentiation is impaired in membrane glycoprotein CD200-deficient mice: a role for Toll-like receptor activation. J Biol Chem, 2011. 286(40): p. 34722-34732.
125. Patterson, P.H., Maternal infection: window on neuroimmune interactions in fetal brain development and mental illness. Curr Opin Neurobiol, 2002. 12(1): p. 115-118.
126. Liu, Y.-P., H.-I. Lin, and S.-F. Tzeng, Tumor necrosis factor-alpha and interleukin-18 modulate neuronal cell fate in embryonic neural progenitor culture. Brain Res, 2005. 1054(2): p. 152-158.
127. Rothermundt, M., et al., Immunological dysfunction in schizophrenia: a systematic approach. Neuropsychobiology, 1998. 37(4): p. 186-193.
128. Drexhage, R.C., et al., An activated set point of T-cell and monocyte inflammatory networks in recent-onset schizophrenia patients involves both pro- and anti-inflammatory forces. Int J Neuropsychopharmacol, 2011. 14(6): p. 746-755.
129. Zorrilla, E.P., et al., Leukocytes and organ-nonspecific autoantibodies in schizophrenics and their siblings: markers of vulnerability or disease? Biol Psychiatry, 1996. 40(9): p. 825-833.
130. Padmos, R.C., et al., A discriminating messenger RNA signature for bipolar disorder formed by an aberrant expression of inflammatory genes in monocytes. Arch Gen Psychiatry, 2008. 65(4): p. 395-407.
131. Drexhage, R.C., et al., The activation of monocyte and T cell networks in patients with bipolar disorder. Brain Behav Immun, 2011. 25(6): p. 1206-13.
132. Drexhage, R.C., et al., Inflammatory gene expression in monocytes of patients with schizophrenia: overlap and difference with bipolar disorder. A study in naturalistically treated patients. Int J Neuropsychopharmacol, 2010. 13(10): p. 1369-1381.
133. Weigelt, K., et al., TREM-1 and DAP12 expression in monocytes of patients with severe psychiatric disorders. EGR3, ATF3 and PU.1 as important transcription factors. Brain Behav Immun, 2011. 25(6): p. 1162-9.
134. Padmos, R.C., et al., Genetic and environmental influences on pro-inflammatory monocytes in bipolar disorder: a twin study. Arch Gen Psychiatry, 2009. 66(9): p. 957-965.
135. Steiner, J., et al., Immunological aspects in the neurobiology of suicide: elevated microglial density in schizophrenia and depression is associated with suicide. J Psychiatr Res, 2008. 42(2): p. 151-157.
136. Radewicz, K., et al., Increase in HLA-DR immunoreactive microglia in frontal and temporal cortex of chronic schizophrenics. J Neuropathol Exp Neurol, 2000. 59(2): p. 137-150.
137. Wierzba-Bobrowicz, T., et al., Quantitative analysis of activated microglia, ramified and damage of processes in the frontal and temporal lobes of chronic schizophrenics. Folia Neuropathol, 2005. 43(2): p. 81-9.
138. Bayer, T.A., et al., Evidence for activation of microglia in patients with psychiatric illnesses. Neurosci Lett, 1999. 271(2): p. 126-128.
139. Arnold, S.E., et al., Absence of neurodegeneration and neural injury in the cerebral cortex in a sample of elderly patients with schizophrenia. Arch Gen Psychiatry, 1998. 55(3): p. 225-232.
140. Togo, T., et al., Expression of CD40 in the brain of Alzheimer’s disease and other neurological diseases. Brain Res, 2000. 885(1): p. 117-121.
141. Falke, E., L.Y. Han, and S.E. Arnold, Absence of neurodegeneration in the thalamus and caudate of elderly patients with schizophrenia. Psychiatry Res, 2000. 93(2): p. 103-110.
142. Nikkila, H.V., et al., Accumulation of macrophages in the CSF of schizophrenic patients during acute psychotic episodes. Am J Psychiatry, 1999. 156(11): p. 1725-1729.
143. Steiner, J., et al., Immunological aspects in the neurobiology of suicide: elevated microglial density in schizophrenia and depression is associated with suicide. J Psychiatr Res, 2008. 42(2): p. 151-7.
144. Steiner, J., et al., Distribution of HLA-DR-positive microglia in schizophrenia reflects impaired cerebral lateralization. Acta Neuropathol, 2006. 112(3): p. 305-316.
145. Steiner, J., et al., Severe depression is associated with increased microglial quinolinic acid in subregions of the anterior cingulate gyrus: Evidence for an immune-modulated glutamatergic neurotransmission? J Neuroinflammation, 2011(submitted).

32 | Chapter 1
146. Wierzba-Bobrowicz, T., et al., Degeneration of microglial cells in frontal and temporal lobes of chronic schizophrenics. Folia Neuropathol, 2004. 42(3): p. 157-165.
147. Cosenza-Nashat, M., et al., Expression of the translocator protein of 18 kDa by microglia, macrophages and astrocytes based on immunohistochemical localization in abnormal human brain. Neuropathol Appl Neurobiol, 2009. 35(3): p. 306-328.
148. Doorduin, J., et al., PET imaging of the peripheral benzodiazepine receptor: monitoring disease progression and therapy response in neurodegenerative disorders. Curr Pharm Des, 2008. 14(31): p. 3297-3315.
149. Doorduin, J., et al., Neuroinflammation in schizophrenia-related psychosis: a PET study. J Nucl Med, 2009. 50(11): p. 1801-1807.
150. van Berckel, B.N., et al., Microglia activation in recent-onset schizophrenia: a quantitative (R)-[11C]PK11195 positron emission tomography study. Biol Psychiatry, 2008. 64(9): p. 820-822.
151. Owen, D.R.J., et al., Mixed-affinity binding in humans with 18-kDa translocator protein ligands. J Nucl Med, 2011. 52(1): p. 24-32.
152. Shukuri, M., et al., In vivo expression of cyclooxygenase-1 in activated microglia and macrophages during neuroinflammation visualized by PET with 11C-ketoprofen methyl ester. J Nucl Med, 2011. 52(7): p. 1094-101.
153. Brown, A.S. and E.J. Derkits, Prenatal infection and schizophrenia: a review of epidemiologic and translational studies. Am J Psychiatry, 2010. 167(3): p. 261-80.
154. Meyer, U. and J. Feldon, Neural basis of psychosis-related behaviour in the infection model of schizophrenia. Behav Brain Res, 2009. 204(2): p. 322-34.
155. Boksa, P., Effects of prenatal infection on brain development and behavior: a review of findings from animal models. Brain Behav Immun, 2010. 24(6): p. 881-97.
156. Patterson, P.H., Immune involvement in schizophrenia and autism: etiology, pathology and animal models. Behav Brain Res, 2009. 204(2): p. 313-21.
157. Patterson, P.H., Maternal infection: window on neuroimmune interactions in fetal brain development and mental illness. Curr Opin Neurobiol, 2002. 12(1): p. 115-8.
158. Wang, X., et al., Lipopolysaccharide-induced inflammation and perinatal brain injury. Semin Fetal Neonatal Med, 2006. 11(5): p. 343-53.
159. Nawa, H. and N. Takei, Recent progress in animal modeling of immune inflammatory processes in schizophrenia: implication of specific cytokines. Neurosci Res, 2006. 56(1): p. 2-13.
160. Romero, E., et al., Neurobehavioral and immunological consequences of prenatal immune activation in rats. Influence of antipsychotics. Neuropsychopharmacology, 2007. 32(8): p. 1791-804.
161. Golan, H.M., et al., Specific neurodevelopmental damage in mice offspring following maternal inflammation during pregnancy. Neuropharmacology, 2005. 48(6): p. 903-17.
162. Cai, Z., et al., Cytokine induction in fetal rat brains and brain injury in neonatal rats after maternal lipopolysaccharide administration. Pediatr Res, 2000. 47(1): p. 64-72.
163. Liverman, C.S., et al., Altered expression of pro-inflammatory and developmental genes in the fetal brain in a mouse model of maternal infection. Neurosci Lett, 2006. 399(3): p. 220-5.
164. Urakubo, A., et al., Prenatal exposure to maternal infection alters cytokine expression in the placenta, amniotic fluid, and fetal brain. Schizophr Res, 2001. 47(1): p. 27-36.
165. Ashdown, H., et al., The role of cytokines in mediating effects of prenatal infection on the fetus: implications for schizophrenia. Mol Psychiatry, 2006. 11(1): p. 47-55.
166. Gilmore, J.H., L.F. Jarskog, and S. Vadlamudi, Maternal infection regulates BDNF and NGF expression in fetal and neonatal brain and maternal-fetal unit of the rat. J Neuroimmunol, 2003. 138(1-2): p. 49-55.
167. Samuelsson, A.M., et al., Prenatal exposure to interleukin-6 results in inflammatory neurodegeneration in hippocampus with NMDA/GABA(A) dysregulation and impaired spatial learning. Am J Physiol Regul Integr Comp Physiol, 2006. 290(5): p. R1345-56.
168. Smith, S.E., et al., Maternal immune activation alters fetal brain development through interleukin-6. J Neurosci, 2007. 27(40): p. 10695-702.

Chapter
1
33General introduction |
169. Silver, R.M., et al., Lipopolysaccharide-induced fetal death: the role of tumor-necrosis factor alpha. Biol Reprod, 1994. 50(5): p. 1108-12.
170. Xu, D.X., et al., Tumor necrosis factor alpha partially contributes to lipopolysaccharide-induced intra-uterine fetal growth restriction and skeletal development retardation in mice. Toxicol Lett, 2006. 163(1): p. 20-9.
171. Pang, Y., et al., Suppression of glial activation is involved in the protection of IL-10 on maternal E. coli induced neonatal white matter injury. Brain Res Dev Brain Res, 2005. 157(2): p. 141-9.
172. Borrell, J., et al., Prenatal immune challenge disrupts sensorimotor gating in adult rats. Implications for the etiopathogenesis of schizophrenia. Neuropsychopharmacology, 2002. 26(2): p. 204-15.
173. Romero, E., et al., Ontogeny of sensorimotor gating and immune impairment induced by prenatal immune challenge in rats: implications for the etiopathology of schizophrenia. Mol Psychiatry, 2010. 15(4): p. 372-83.
174. Bakos, J., et al., Prenatal immune challenge affects growth, behavior, and brain dopamine in offspring. Ann N Y Acad Sci, 2004. 1018: p. 281-7.
175. Girard, S., et al., Developmental motor deficits induced by combined fetal exposure to lipopolysaccharide and early neonatal hypoxia/ischemia: a novel animal model for cerebral palsy in very premature infants. Neuroscience, 2009. 158(2): p. 673-82.
176. Anderson, M.S. and J.A. Bluestone, The NOD mouse: a model of immune dysregulation. Annu Rev Immunol, 2005. 23: p. 447-85.
177. Leiter, E.H., M. Prochazka, and D.L. Coleman, The non-obese diabetic (NOD) mouse. Am J Pathol, 1987. 128(2): p. 380-3.
178. Diana, J., et al., Crosstalk between neutrophils, B-1a cells and plasmacytoid dendritic cells initiates autoimmune diabetes. Nat Med, 2013. 19(1): p. 65-73.
179. Charre, S., et al., Abnormalities in dendritic cell and macrophage accumulation in the pancreas of nonobese diabetic (NOD) mice during the early neonatal period. Histol Histopathol, 2002. 17(2): p. 393-401.
180. Homo-Delarche, F. and H.A. Drexhage, Immune cells, pancreas development, regeneration and type 1 diabetes. Trends Immunol, 2004. 25(5): p. 222-9.
181. Durant, S., et al., Proapoptosis and antiapoptosis-related molecules during postnatal pancreas development in control and nonobese diabetic mice: relationship with innervation. Lab Invest, 2003. 83(2): p. 227-39.
182. Jansen, A., et al., Immunohistochemical characterization of monocytes-macrophages and dendritic cells involved in the initiation of the insulitis and beta-cell destruction in NOD mice. Diabetes, 1994. 43(5): p. 667-75.
183. Rosmalen, J.G., et al., Islet abnormalities associated with an early influx of dendritic cells and macrophages in NOD and NODscid mice. Lab Invest, 2000. 80(5): p. 769-77.
184. Nikolic, T., et al., Dendritic cells and macrophages are essential for the retention of lymphocytes in (peri)-insulitis of the nonobese diabetic mouse: a phagocyte depletion study. Lab Invest, 2005. 85(4): p. 487-501.
185. Saxena, V., et al., The countervailing actions of myeloid and plasmacytoid dendritic cells control autoimmune diabetes in the nonobese diabetic mouse. J Immunol, 2007. 179(8): p. 5041-53.
186. Wildenberg, M.E., et al., Lack of CCR5 on dendritic cells promotes a proinflammatory environment in submandibular glands of the NOD mouse. J Leukoc Biol, 2008. 83(5): p. 1194-200.
187. Welzen-Coppens, J.M., et al., Reduced numbers of dendritic cells with a tolerogenic phenotype in the prediabetic pancreas of NOD mice. J Leukoc Biol, 2012. 92(6): p. 1207-13.
188. Nikolic, T., et al., Diabetes-prone NOD mice show an expanded subpopulation of mature circulating monocytes, which preferentially develop into macrophage-like cells in vitro. J Leukoc Biol, 2005. 78(1): p. 70-9.
189. Litherland, S.A., et al., Signal transduction activator of transcription 5 (STAT5) dysfunction in auto-immune monocytes and macrophages. J Autoimmun, 2005. 24(4): p. 297-310.

34 | Chapter 1
190. Beyan, H., et al., Altered monocyte cyclo-oxygenase response in non-obese diabetic mice. Clin Exp Immunol, 2009. 155(2): p. 304-310.
191. Amrani, A., et al., Glucose, insulin, and open field responses to immobilization in nonobese diabetic (NOD) mice. Physiol Behav, 1994. 56(2): p. 241-6.
192. Bothe, G.W., et al., Behavioral differences among fourteen inbred mouse strains commonly used as disease models. Comp Med, 2005. 55(4): p. 326-34.
193. Bluth, et al., Increased sensitivity of prediabetic nonobese diabetic mouse to the behavioral effects of IL-1. Brain Behav Immun, 1999. 13(4): p. 303-14.
194. Grohmann, U., et al., A defect in tryptophan catabolism impairs tolerance in nonobese diabetic mice. J Exp Med, 2003. 198(1): p. 153-60.

Chapter 2
Microglia shape corpus callosum axon tract fasciculation: functional impact of prenatal inflammation
Lorena Pont-Lezica1,2,3, Wouter Beumer4, Sabrina Colasse1,2,3, Hemmo Drexhage4, Marjan Versnel4, Alain Bessis1,2,3
1: Institut de Biologie de l’Ecole Normale Supérieure, F-75005 Paris, France;2: Institut National de la Santé et de la Recherche Médicale U1024, F-75005 Paris, France;3: Centre National de la Recherche Scientifique, Unité Mixte de Recherche 8197, F-75005 Paris, France;4: Department of Immunology, Erasmus MC, Rotterdam, The Netherlands
Submitted

36 | Chapter 2
ABstRACt
Microglia colonize the brain parenchyma at early stages of development and accumulate in specific regions where they participate in cell death, angiogenesis, neurogenesis and synapse elimination. A recurring feature of embryonic microglial is their association with developing axon tracts, which together with in vitro data, supports the idea of a physiological role for microglia in neurite development. Yet the demonstration of this role of microglia is still lacking. Here, we have studied the consequences of microglial dysfunction on the formation of the corpus callosum, the largest commissure of the mammalian brain, which shows consistent microglial accumulation during development. We studied two models of microglial dysfunction: the loss-of-function of DAP12, a key microglial-specific signaling molecule, and a model of maternal inflammation by peritoneal injection of LPS at E15.5. We also took advantage of the Pu.1-/- mouse line, which is devoid of microglia. We performed transcriptional profiling of maternally inflamed and Dap12-mutant microglia at E17.5. We found that both treatments principally down-regulated genes involved in nervous system development and function, particularly in neurite formation. We then analyzed the developmental consequences of these microglial dysfunctions on the formation of the corpus callosum. We show that all three models of altered microglial activity resulted in the defasciculation of dorsal callosal axons. Our study demonstrates that microglia display a neurite-development promoting function and are genuine actors of corpus callosum development. It further shows that microglial activation impinges on this function, thereby revealing that prenatal inflammation impairs neuronal development through a loss of trophic support.

Chapter
2
37Microglia shape corpus callosum axon tract fasciculation: functional impact of prenatal inflammation |
intRoDuCtion
Microglia differentiate from primitive myeloid progenitors produced by the yolk sac that migrate into the developing brain parenchyma [1,2]. This colonization occurs early in CNS embryogenesis and in a highly stereotyped manner in all species examined, supporting the notion that microglia have important physiological roles in development. During development microglia can be found throughout the brain but tend to preferentially reside at specific locations where they actively contribute to such processes as cell death, angiogenesis, synapse elimination and neurogenesis (references in [3]). A consistent feature of embryonic microglia distribution is their close association with developing axon tracts. Such recurring association has been found in rodent [4], birds [5], fish [1] and humans [6], and raised the question of whether microglia might contribute to tract formation. Under physiological conditions, it has been proposed that in agreement with their phagocytic function, microglia clear a path for developing axons or eliminate transient axonal projections [4,7]. Yet this contrasts with the morphological observation of microglia associated with non-transient axons [5] and with in vitro studies suggesting a trophic role in neurite extension [8,9]. Despite these compelling in vitro data and circumstantial in vivo evidence, there has been no in vivo proof of a definitive role for microglia in neurite development. In addition, microglia might be involved in developmental white matter diseases given that prenatal inflammation and mutations affecting the function of DAP12, a microglial specific signalling molecule, result in adult white matter alterations including lesions and hypomyelination [10,11]. The corpus callosum (CC) is the largest brain commissural structure between the cerebral hemispheres. Corpus callosum formation occurs towards the end of embryogenesis and involves multiple steps including midline crossing, axon guidance and fasciculation, and the elimination of exuberant axons [12]. The abundant presence of microglia during callogenesis and the tract’s susceptibility to prenatal inflammation make it a relevant system to decipher the role of microglia in shaping developing tracts. To study the functional relationship between microglia and corpus callosum development, we changed their activity pharmacologically and genetically. We then combined transcriptome and morphological analyses to conclude that microglia are actively involved in the fasciculation of corpus callosum axons.
MAteRiALs AnD MethoDs
Mouse lines and treatments.Cx3cr1+/gfp [13], Dap12-/- [14] and Pu.1+/- mice [15] were maintained on a C57Bl/6j background. C57Bl/6j or heterozygous embryos were used as controls. The day of vaginal plug formation was considered as embryonic day (E)0.5. The protocols were approved by the Charles Darwin committee in Animal experiment (Ce5/2012/017). Pregnant dams were given LPS (0.12mg/g in

38 | Chapter 2
PBS; InVivoGen) by a single intra-peritoneal injection at E15.5. Injection of sterile PBS and needle prick were used as controls.
immunohistochemistry, image acquisition and statistical analysisImmunostaining was carried out on C57Bl/6j, Dap12-/- and Pu.1-/- embryos as described [16]. Primary antibodies: rat CD68 (AbD Serotec); chicken GFP (Aves); goat nrp1 (R&D Systems), rat L1 (Millipore) and rabbit Iba1 (Wako). Secondary antibodies were from Jackson ImmunoResearch. Hoechst (Invitrogen) was used for nuclear staining. Images were acquired with Leica microscopes (MZ16F and TCS SP5). Image analysis was carried out using ImageJ software. Briefly, a stack of 10 images per section was Z-projected and the ratio of the Nrp1-positive tract to the total CC width (L1-positive tract) calculated. Graphpad, R and SPSS statistical software were used for statistical analysis.
Microglia isolation and transcriptome analysisMedial cortical regions including the hippocampus, the surrounding fiber tracts (fimbria, corpus callosum) and the overlying prospective cingulate cortex were isolated from Cx3cr1+/gfp and Dap12-/- (on Cx3cr1+/gfp background) E17.5 embryos, and dissociated by incubation with 0.25% trypsin, then DNaseI (10 mg/ml). Microglia were sorted on a FACSAria II (Becton Dickinson) directly into QIAzol (Qiagen) for RNA isolation. Flow cytometric analysis was used to phenotype the CX3CR1-GFP+ cells, by labeling them with antibodies against the CD11b (BD) and CD45 (eBioscience). The expression of these cell surface makers was analyzed with Flowjo software (Tree Star). RNA was isolated with the miRNeasy Mini Kit according to manufacturer’s protocol. The RNA was processed with the Ovation Pico WTA v2 and Encore Biotin Module (NuGEN Technologies) and hybridized on Mouse Genome 430 2.0 Arrays (Affymetrix) according to manufacturer’s protocols. The gene expression data is accessible through GEO Series accession number GSE49079. The .CEL files were processed with Partek genomics suite and gene expression data normalized using Robust Multichip Average with GC background correction [17]. Differentially expressed genes were identified by ANOVA linear contrasts model with multiple testing corrections using the false discovery rate method [18] with a p<0.05 cut off. Ingenuity pathway analysis (Ingenuity® Systems) was used for mapping of DEG to biological functions. Q-PCR validation was performed with a commercially available mix (TaqMan Universal PCR Master Mix) according to manufacturer’s protocol. All probes and primers were pre-formulated and designed by the manufacturer (TaqMan Gene Expression Assays; Applied Biosystems).
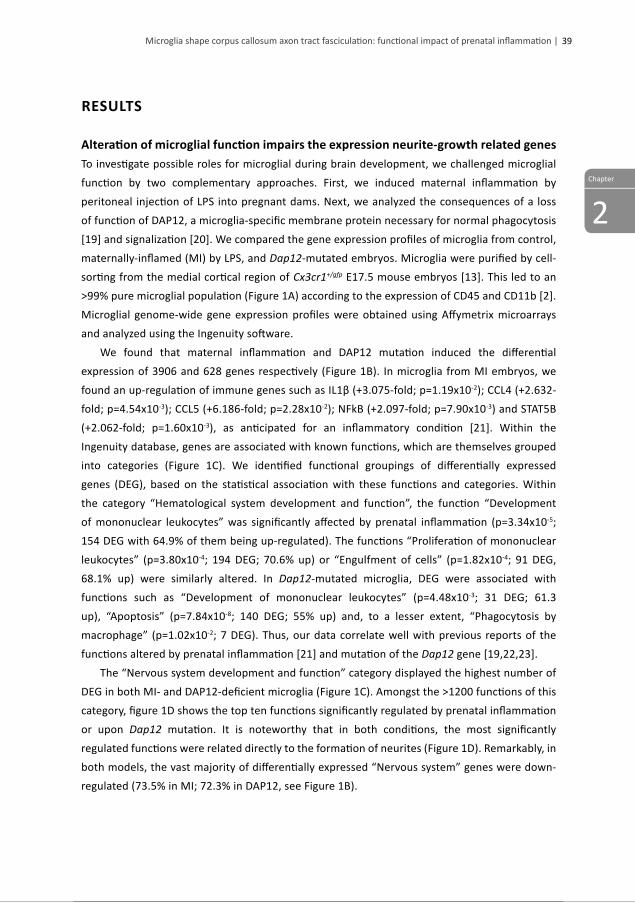
Chapter
2
39Microglia shape corpus callosum axon tract fasciculation: functional impact of prenatal inflammation |
ResuLts
Alteration of microglial function impairs the expression neurite-growth related genesTo investigate possible roles for microglial during brain development, we challenged microglial function by two complementary approaches. First, we induced maternal inflammation by peritoneal injection of LPS into pregnant dams. Next, we analyzed the consequences of a loss of function of DAP12, a microglia-specific membrane protein necessary for normal phagocytosis [19] and signalization [20]. We compared the gene expression profiles of microglia from control, maternally-inflamed (MI) by LPS, and Dap12-mutated embryos. Microglia were purified by cell-sorting from the medial cortical region of Cx3cr1+/gfp E17.5 mouse embryos [13]. This led to an >99% pure microglial population (Figure 1A) according to the expression of CD45 and CD11b [2]. Microglial genome-wide gene expression profiles were obtained using Affymetrix microarrays and analyzed using the Ingenuity software. We found that maternal inflammation and DAP12 mutation induced the differential expression of 3906 and 628 genes respectively (Figure 1B). In microglia from MI embryos, we found an up-regulation of immune genes such as IL1β (+3.075-fold; p=1.19x10⁻²); CCL4 (+2.632-fold; p=4.54x10⁻³); CCL5 (+6.186-fold; p=2.28x10⁻²); NFkB (+2.097-fold; p=7.90x10⁻³) and STAT5B (+2.062-fold; p=1.60x10⁻³), as anticipated for an inflammatory condition [21]. Within the Ingenuity database, genes are associated with known functions, which are themselves grouped into categories (Figure 1C). We identified functional groupings of differentially expressed genes (DEG), based on the statistical association with these functions and categories. Within the category “Hematological system development and function”, the function “Development of mononuclear leukocytes” was significantly affected by prenatal inflammation (p=3.34x10⁻⁵; 154 DEG with 64.9% of them being up-regulated). The functions “Proliferation of mononuclear leukocytes” (p=3.80x10⁻⁴; 194 DEG; 70.6% up) or “Engulfment of cells” (p=1.82x10⁻⁴; 91 DEG, 68.1% up) were similarly altered. In Dap12-mutated microglia, DEG were associated with functions such as “Development of mononuclear leukocytes” (p=4.48x10⁻³; 31 DEG; 61.3 up), “Apoptosis” (p=7.84x10⁻⁸; 140 DEG; 55% up) and, to a lesser extent, “Phagocytosis by macrophage” (p=1.02x10⁻²; 7 DEG). Thus, our data correlate well with previous reports of the functions altered by prenatal inflammation [21] and mutation of the Dap12 gene [19,22,23]. The “Nervous system development and function” category displayed the highest number of DEG in both MI- and DAP12-deficient microglia (Figure 1C). Amongst the >1200 functions of this category, figure 1D shows the top ten functions significantly regulated by prenatal inflammation or upon Dap12 mutation. It is noteworthy that in both conditions, the most significantly regulated functions were related directly to the formation of neurites (Figure 1D). Remarkably, in both models, the vast majority of differentially expressed “Nervous system” genes were down-regulated (73.5% in MI; 72.3% in DAP12, see Figure 1B).

40 | Chapter 2
Figu
re 1
. Tra
nscr
ipto
me
anal
ysis
of E
17.5
-sor
ted
mic
rogl
ia. A
. Gati
ng st
rate
gy o
f mic
rogl
ia d
isse
cted
from
cor
tical
are
as; G
ate-
out c
ellu
lar d
ebris
in R
1, g
ate
R2
sele
cts
CX3C
R1-G
FP+ m
icro
glia
cel
ls. F
low
cyt
omet
ric a
naly
sis
indi
cate
d th
at >
99%
of a
ll CX
3CR1
-GFP
+ cel
ls in
gat
e R2
exp
ress
ed th
e m
icro
glia
mar
kers
CD1
1b
and
CD45
in b
oth
cont
rol (
PBS)
as
wel
l as
the
MI (
LPS)
mic
e. B
. Ven
n di
agra
ms
show
ing
the
num
ber o
f sha
red
and
uniq
ue D
EG u
pon
MI o
r Da
p12
mut
ation
fo
r al
l gen
es (l
eft) a
nd fo
r ge
nes
belo
ngin
g to
the
“Ner
vous
sys
tem
dev
elop
men
t and
func
tion”
cat
egor
y (r
ight
). C.
Top
four
Inge
nuity
func
tiona
l cat
egor
ies
affec
ted
by M
I or D
ap12
mut
ation
. The
col
umns
sho
w th
e nu
mbe
r of D
EG a
nd th
e pe
rcen
tage
of g
enes
dow
n-re
gula
ted.
D. T
op te
n fu
nctio
ns a
ltere
d by
MI
(left
in re
d) o
r Dap
12 m
utati
on (r
ight
in b
lue)
. The
col
umns
sho
w th
e p-
valu
e ca
lcul
ated
usi
ng th
e rig
ht-t
aile
d Fi
sher
Exa
ct T
est,
the
num
ber o
f DEG
and
the
perc
enta
ge o
f gen
es d
own-
regu
late
d.

Chapter
2
41Microglia shape corpus callosum axon tract fasciculation: functional impact of prenatal inflammation |
Several genes known to be involved in neuritogenesis that are down-regulated both by prenatal inflammation and by Dap12 mutation: Sema3C (LPS: -2.7x, p=0.028; Dap12-/-: -2.9x, p=6.09x10⁻³), Vcan (LPS: -3.1x, p=1.6x10⁻⁴; Dap12-/-: -4.1x, p=2.9x10⁻²), PlxnA2 (LPS: -4.1x, p=4.2x10⁻²; Dap12-/-: -5.4x, p=3.08x10⁻²) or NFIA (LPS: -3.8, p=1.1x10⁻³; Dap12-/-: -2.6x, p=1.8x10⁻²). Thus, altering microglial function during embryonic development by inducing an inflammatory response or genetic mutation leads to the up-regulation of immune genes, but it also alters, primarily by down-regulation, the expression of genes related to neuritogenesis. These results raised the provocative hypothesis that prenatal inflammation would lead to the loss of a neurite development function in microglia. This led us to examine more closely the relationship of microglia to the developing axon tracts.
Alteration of microglial function impairs the fasciculation of corpus callosum dorsal tractThe corpus callosum is the largest commissure of the brain. Callogenesis in the mouse begins at E15.5 and the first callosal axons cross the midline at E16.5 [24]. The coincidence of the early stages of CC development with the microglial expression of genes involved in neurite formation led us to study the relationship between microglia and callogenesis. Investigation of the localization of microglia at E15.5 shows that microglia accumulate at the site of the future corpus callosum (Figure 2A). At E17.5, microglia can be seen at high density in the midline zipper, the subcallosal sling (SCS) and in the induseum griseum (IG) (Figure 2B). Closer examination at E17.5 shows two morphological populations of microglia (Figure 2C, D): round microglia with high expression of CD68 are accumulated mostly outside the tracts in the ventral region. In contrast, ramified microglia, with low expression of CD68 are located within the callosal tract, their processes lining up parallel to the fibers (Figure 2C). The accumulation of microglia ventral to the corpus callosum suggests that they may contribute to callogenesis. We therefore compared callogenesis in controls, MI and Dap12-/-mutant embryos. As we were interested by a putative loss of microglial function, we also analyzed CC development in the absence of microglia using Pu.1-/- embryos, in which the inactivation of the transcription factor PU.1 disrupts the generation of all myeloid cells, including microglia [15]. Microglia in the corpus callosum of MI and Dap12-/- embryos displayed the same morphology and distribution than in the control embryos (Figure 3), with round CD68-expressing microglia located ventrally to the tract and ramified low CD68-expressing cells within the axon tract. We first studied the organization of callosal axons by analysing the expression of L1-CAM, an adhesion protein expressed by all callosal fibres [25]. The overall organization of the corpus callosum was not altered at E17.5 in any of the conditions examined, with callosal axons crossing the midline. These results show that microglia are not necessary for axon midline crossing during callogenesis. The corpus callosum width was similar under all conditions (Figure 3). We next analyzed the fasciculation of the callosal axons by measuring the width of the Neuropilin 1 (Nrp1)-positive dorsal tract of the corpus callosum [25] as compared to the width

42 | Chapter 2
of the L1-positive fibres. In MI-embryo, the ratio Nrp1/L1 shows a 12% increase relative to controls (Figure 3). The increase was even more striking in the Dap12-/ -and Pu.1-/- mutants with an average 40% and 70% thickening of the Nrp1 tract respectively (Figure 3). In some mutant animals, the Nrp1+ tract was not dorsally restricted but spread out over the whole width of the corpus callosum (Dap12-/- n=3/15; and Pu.1-/- n=3/7); no such events were observed in controls. This increase in the width of the Nrp1+ tract shows that in maternally inflamed and in animals with altered microglial function, there is a defasciculation of the dorsal tract within the corpus callosum.
Figure 2. Coronal section of Cxcr3cr1+/gfp brains at E15.5 (A) and E17.5 (B-D). A. At E15.5, GFP+ microglia accumulate at the site of the future corpus callosum. B. At E17.5, microglia accumulate at the induseum griseum (ig), in the medial zipper (mz), and in the subcallosal sling (scs). C. In the induseum griseum and the scs, GFP-labeled microglia (green) display mostly a round morphology (arrows) whereas in the tract of the corpus callosum (cc), they display a ramified morphology (arrowheads) with their processes lining up parallel to the axon fibers (small arrows). Blue staining: DAPI. D. Most microglia display CD68 immunoreactivity. Scale bars: A, B: 250mm: C, D: 50mm. Ncx: Neocortex; Str: Striatum.

Chapter
2
43Microglia shape corpus callosum axon tract fasciculation: functional impact of prenatal inflammation |
Figure 3. Defasciculation of the corpus callosum upon alteration of microglial function. Coronal sections of E17.5 brains from A. untreated (UT); B. Maternally inflamed (LPS); C. Dap12-/- and D. Pu.1-/- mice immunostained for L1-CAM (left), Nrp1 (right; purple) and Iba1 (right, green). ig: induseum griseum; scs: subcallosal sling. Scale bar: 25mm. E. Quantification of the L1 width in untreated (UT, n=18), needle prick (Prick, n=16), PBS-injected (PBS, n=16), MI (LPS, n=15), Dap12-/- (n=15) and Pu.1-/- (n=7) E17.5 embryos. No significant differences. F. Quantification of the Nrp1/L1 ratio. No significant difference in the Nrp1/L1 ratio was found between PBS-injected, needle prick and untreated controls (ANOVA, p=0.846). PBS vs. LPS, Student’s t-test p=0.00056 (***). Dap12-/-; Pu.1-/-; UT: ANOVA p<0.0001 (###), Games-Howell post-hoc test: UT vs. Dap12-/-p=0.001; UT vs. Pu.1-/- p=0.023; Dap12-/ - vs. Pu.1-/- p=0.578). Shown are means ± 2SEM.

44 | Chapter 2
DisCussion
In this study, we show that alteration of prenatal microglial preferentially alters genes involved in neurite formation, and induces a defasciculation of axonal tracts within the corpus callosum. In order to address the potential roles of microglia during late CNS development we specifically isolated and carried out transcriptional profiling on cortical microglia in two models of altered microglial function, maternal inflammation by LPS (MI) and Dap12 mutation. Microglia purification by cell-sorting combines all microglial phenotypes. The transcriptional profile of sorted microglia is thus probably biased toward the most abundant populations and functions. The microarray data shows that in microglia from both the MI and Dap12-mutant embryos, immune function is strongly affected, with the expression of the majority of immune genes being up-regulated. These results are in accordance with previous findings that demonstrated an activation of the fetal immune system in response to maternal inflammation [21,26]. Similarly, Dap12-mutant microglia were shown to secrete higher levels of pro-inflammatory cytokines and to have impaired phagocytosis [19,20]. The transcriptional profiling of E17.5 microglia revealed that the largest proportion of DEG in MI and Dap12-mutant microglia belonged to the “Nervous system development and function” category, and more specifically to genes involved in the formation of neurites. Microglia are known to secrete molecules involved in axon growth [9] as well as neurotrophic factors [27]. Our microarray data show that altering microglia function by pharmacological or genetic means during late embryonic development leads to the anticipated induction of a microglial immune response, but also the unexpected down-regulation of a neurite development function. The abundance of microglia at the level of the corpus callosum is striking. Neither MI, nor Dap12 mutation altered microglia morphology or distribution in the region. Moreover, corpus callosum formation was largely normal in all three models (MI, Dap12-/- and Pu.1-/- mice), with axons effectively crossing the midline and total corpus callosum width being similar all around. Closer inspection, however, showed that Nrp1-positive axons are no longer restricted to the dorsal part of the corpus callosum but defasciculate and in some cases spread out over the whole structure. It is of note that the severity of the defasciculation phenotype varies between models, with MI-embryos being the least affected and Dap12-mutant, then Pu.1-mutants being progressively more severe. The varied penetrance of the phenotype may be due to the timing of the altered microglial function. Indeed, maternal inflammation was induced at E15.5 and the consequences were observed at E17.5, affecting developmental processes in a short time frame. On the other hand, Dap12 mutation likely affects microglial function from an earlier time point (expression from E14 [28]), and so might result in a greater developmental effect. Along the same continuum, Pu.1-/- embryos have the most severe callosal phenotype and they lack microglial function from the onset of embryogenesisneutrophils. There appears to be a discrepancy between the severity of the callosal tract phenotype in MI and Dap12-mutant embryos, and the number of DEG identified in each case (3906 and 628 respectively). In the case of MI, microglia

Chapter
2
45Microglia shape corpus callosum axon tract fasciculation: functional impact of prenatal inflammation |
respond to a variety of signals produced by maternal inflammation [21, 26]. In Dap12-mutants on the other hand, the number of affected pathways is likely restricted, thus altering fewer genes. The difference between phenotype severity and number of DEG suggests that only a small number of key genes and pathways are responsible for the observed defasciculation. The best described function of microglia during development is phagocytosis of progenitors [29] and neurons [23]. Microglia located at meeting points of major white matter tracts are thought to contribute to axon growth by utilizing their phagocytic capacity to clear a path for developing axons [8,30], as well as eliminating exuberant and transient axons [7]. Microglia also associate with developing white matter tracts in the absence of neuronal cell death or axon degeneration [5]. Such association, in conjunction with their ability to stimulate neuronal differentiation and neurite growth in vitro, led to the hypothesis that microglia might contribute to axon growth and guidance via the release of trophic factors ([27] and references in [3]). We find the same defasciculation phenotype in animals with immune activation, in which microglial phagocytosis is increased, as in Dap12-/- animals, in which it is impaired [19], and in Pu.1-/- animals that lack microglia. The fact that the defasciculation phenotype does not correlate with the changes in phagocytosis suggests that defasciculation is not purely phagocytosis-dependent. The transcriptional profiling of microglia revealed that they express genes involved in neurite formation and that these are down-regulated in microglia from MI and Dap12-mutant animals. Moreover, the mild defasciculation seen in MI embryos is comparable to that observed in mice with impaired Sema3A signaling [25,31] supporting the notion that impairment of microglial function may affect trophic support. We thus hypothesize that microglia participate in axon growth and guidance via the modulation of neurite formation pathways. At this stage, however, we cannot exclude that microglia indirectly control the development of corpus callosum axonal tracts via engulfment of guidepost glia and neurons, or by endocytosis of guidance molecules themselves. Prenatal inflammation is a known risk factor for the development of psychiatric conditions, such as schizophrenia and bipolar disorder, which often feature abnormal connectivity, hypomyelination and atrophy of axon tracts [32]. DAP12 mutations in humans induces Nasu-Hakola disease which is characterized by presenile dementia and leukodystrophy [10]. Both MI and Dap12-mutation lead to changes in microglial activity during CNS embryogenesis and our study sheds new light on the patho-physiological mechanisms by which microglia influence tract development and contribute to the development of mood disorders.
AcknowledgmentsWe thank Drs S. Garel, C. Béchade and S. Marty for critical reading of the manuscript. The work was supported by a grant from the 7th Framework Program Moodinflame (222963).

46 | Chapter 2
ReFeRenCes
1. Herbomel, P., B. Thisse, and C. Thisse, Zebrafish early macrophages colonize cephalic mesenchyme and developing brain, retina, and epidermis through a M-CSF receptor-dependent invasive process. Dev Biol, 2001. 238(2): p. 274-88.
2. Ginhoux, F., et al., Fate mapping analysis reveals that adult microglia derive from primitive macrophages. Science, 2010. 330(6005): p. 841-5.
3. Pont-Lezica, L., et al., Physiological roles of microglia during development. J Neurochem, 2011. 119(5): p. 901-8.
4. Ling, E.A., Some aspects of amoeboid microglia in the corpus callosum and neighbouring regions of neonatal rats. J Anat, 1976. 121(Pt 1): p. 29-45.
5. Cuadros, M.A., et al., First appearance, distribution, and origin of macrophages in the early development of the avian central nervous system. J Comp Neurol, 1993. 330(1): p. 113-29.
6. Verney, C., et al., Early microglial colonization of the human forebrain and possible involvement in periventricular white-matter injury of preterm infants. J Anat, 2010. 217(4): p. 436-48.
7. Innocenti, G.M., S. Clarke, and H. Koppel, Transitory macrophages in the white matter of the developing visual cortex. II. Development and relations with axonal pathways. Brain Res, 1983. 313(1): p. 55-66.
8. David, S., et al., Macrophages can modify the nonpermissive nature of the adult mammalian central nervous system. Neuron, 1990. 5(4): p. 463-9.
9. Chamak, B., V. Morandi, and M. Mallat, Brain macrophages stimulate neurite growth and regeneration by secreting thrombospondin. J Neurosci Res, 1994. 38(2): p. 221-33.
10. Paloneva, J., et al., CNS manifestations of Nasu-Hakola disease: a frontal dementia with bone cysts. Neurology, 2001. 56(11): p. 1552-8.
11. Dean, J.M., et al., Delayed cortical impairment following lipopolysaccharide exposure in preterm fetal sheep. Ann Neurol, 2011. 70(5): p. 846-56.
12. Fame, R.M., J.L. MacDonald, and J.D. Macklis, Development, specification, and diversity of callosal projection neurons. Trends Neurosci, 2011. 34(1): p. 41-50.
13. Jung, S., et al., Analysis of fractalkine receptor CX(3)CR1 function by targeted deletion and green fluorescent protein reporter gene insertion. Mol Cell Biol, 2000. 20(11): p. 4106-14.
14. Tomasello, E., et al., Combined natural killer cell and dendritic cell functional deficiency in KARAP/DAP12 loss-of-function mutant mice. Immunity, 2000. 13(3): p. 355-64.
15. Back, J., et al., PU.1 determines the self-renewal capacity of erythroid progenitor cells. Blood, 2004. 103(10): p. 3615-23.
16. Deck, M., et al., Pathfinding of corticothalamic axons relies on a rendezvous with thalamic projections. Neuron, 2013. 77(3): p. 472-84.
17. Wu, Z. and R.A. Irizarry, Preprocessing of oligonucleotide array data. Nat Biotechnol, 2004. 22(6): p. 656-8; author reply 658.
18. Benjamini, Y.H., Y., Controlling the False Discovery Rate: A Practical and Powerful Approach to Multiple Testing. J. Roy. Statist. Soc. Ser. B, 1995. 57(1): p. 11.
19. Takahashi, K., C.D. Rochford, and H. Neumann, Clearance of apoptotic neurons without inflammation by microglial triggering receptor expressed on myeloid cells-2. J Exp Med, 2005. 201(4): p. 647-57.
20. Roumier, A., et al., Prenatal activation of microglia induces delayed impairment of glutamatergic synaptic function. PLoS One, 2008. 3(7): p. e2595.
21. Boksa, P., Effects of prenatal infection on brain development and behavior: a review of findings from animal models. Brain Behav Immun, 2010. 24(6): p. 881-97.
22. Hamerman, J.A., et al., Enhanced Toll-like receptor responses in the absence of signaling adaptor DAP12. Nat Immunol, 2005. 6(6): p. 579-86.

Chapter
2
47Microglia shape corpus callosum axon tract fasciculation: functional impact of prenatal inflammation |
23. Wakselman, S., et al., Developmental neuronal death in hippocampus requires the microglial CD11b integrin and DAP12 immunoreceptor. J Neurosci, 2008. 28(32): p. 8138-43.
24. Ozaki, H.S. and D. Wahlsten, Timing and origin of the first cortical axons to project through the corpus callosum and the subsequent emergence of callosal projection cells in mouse. J Comp Neurol, 1998. 400(2): p. 197-206.
25. Piper, M., et al., Neuropilin 1-Sema signaling regulates crossing of cingulate pioneering axons during development of the corpus callosum. Cereb Cortex, 2009. 19 suppl 1: p. i11-21.
26. Wang, X., et al., Lipopolysaccharide-induced inflammation and perinatal brain injury. Semin Fetal Neonatal Med, 2006. 11(5): p. 343-53.
27. Kim, S.U. and J. de Vellis, Microglia in health and disease. J Neurosci Res, 2005. 81(3): p. 302-13.28. Thrash, J.C., B.E. Torbett, and M.J. Carson, Developmental regulation of TREM2 and DAP12 expression
in the murine CNS: implications for Nasu-Hakola disease. Neurochem Res, 2009. 34(1): p. 38-45.29. Cunningham, C.L., V. Martinez-Cerdeno, and S.C. Noctor, Microglia regulate the number of neural
precursor cells in the developing cerebral cortex. J Neurosci, 2013. 33(10): p. 4216-33.30. Valentino, K.L. and E.G. Jones, The early formation of the corpus callosum: a light and electron
microscopic study in foetal and neonatal rats. J Neurocytol, 1982. 11(4): p. 583-609.31. Zylbersztejn, K., et al., The vesicular SNARE Synaptobrevin is required for Semaphorin 3A axonal
repulsion. J Cell Biol, 2012. 196(1): p. 37-46.32. Beumer, W., et al., The immune theory of psychiatric diseases: a key role for activated microglia and
circulating monocytes. J Leukoc Biol, 2012. 92(5): p. 959-75.


Chapter 3
the altered gene expression profile of microglia of the noD mouse
Abnormalities in genes involved in neuronal support and indications for an enhanced IFN type 1 skewed inflammatory machinery
W. Beumer, M.A. Versnel, H.A. Drexhage, S.M. Gibney
Department of Immunology, Erasmus Medical Center, Rotterdam, The Netherlands
Manuscript will be adjusted for publication
EMBARGO - UNTIL PUBLISHED
EMBARGO - UNTIL PUBLISHED
EMBARGO - UNTIL PUBLISHED

Chapter 4
the gene expression profile of CD11c+CD8α- dendritic cells in the pre-diabetic pancreas of the noD mouse
W. Beumer1, J.M.C. Welzen-Coppens1, C.G. van Helden-Meeuwsen, S.M. Gibney, H.A. Drexhage, M.A. Versnel
Department of Immunology, Erasmus Medical Center, Rotterdam, The Netherlands1: W. Beumer and J.M.C. Welzen-Coppens share first authorship.
Submitted
EMBARGO - UNTIL PUBLISHED
EMBARGO - UNTIL PUBLISHED
EMBARGO - UNTIL PUBLISHED
Chapter 5
Changes in serum adhesion molecules, chemokines, cytokines and tissue remodelling factors in euthyroid women without thyroid antibodies who are at risk for autoimmune thyroid disease
A hypothesis on the early phases of the endocrine autoimmune reaction
W. Beumera,1, G. Effraimidisa, 2, R.C. Drexhage1, W.M. Wiersinga2 and H.A. Drexhage1
1 Department of Immunology, Erasmus Medical Center, Erasmus University, Rotterdam; 2 Department of Endocrinology and Metabolism, Academical Medical Center, University of Amsterdam, Amsterdam Zuidoost, The Netherlandsa Shared first authorship
Published in: J Clin Endocrinol Metab. 2013 Jun;98(6):2460-8.

98 | Chapter 5
ABstRACt
Background: The target glands in spontaneous animal models of endocrine autoimmune disease show – prior to the autoimmune reaction – growth and connective tissue abnormalities, while the autoimmune reaction is initiated by an early accumulation of macrophages and dendritic cells in the target glands.
Aim: To test the hypothesis that serum factors related to these growth and connective tissue abnormalities and the early accumulation of immune cells, i.e. tissue growth/remodelling factors, adhesion molecules, chemokines and pro- and anti-inflammatory cytokines, are related to TPO-Ab sero-conversion in subjects at risk to develop autoimmune thyroid disease (AITD).
Design: A controlled study on 64 TPO-Ab negative euthyroid female relatives with at least one 1st or 2nd degree relative with documented autoimmune hyper- or hypothyroidism, 32 of whom did and 32 did not seroconvert to TPO-Abs positivity in 5 year follow-up. The relatives were compared to 32 healthy controls. In all subjects we measured serum levels of CCL2, CCL3, CCL4, sVCAM-1, sICAM-1, THBS-1, VEGF-A, TIE-2, MMP13, PDGF-BB, Fibronectin (FN), IL-1β, IL-6, TNF-α, IL-10 and GDF-15 by multiplex (Cytometric Bead Array, eBioscience) or single commercial ELISA.
Results: Both sero-converting and non-sero-converting family members showed an up regulation of FN and a down regulation of PDGF-BB and of the adhesion and migration factors CCL2, CCL4, sVCAM-1, TIE-2 and MMP-13. The sero-converters differed from the non-sero-converters by up regulation of the pro-inflammatory compounds Il-1β, IL-6 and CCL3.
Conclusion: This study shows that euthyroid females within AITD families show a characteristic pattern of abnormalities in serum levels of tissue remodelling factors, growth factors, chemokines, (vascular) adhesion molecules and cytokines prior to the occurrence of TPO-Abs in serum. The results provide proof of principle that pre-sero-conversion stages and sero-conversion to AITD might be predicted using serum analytes related to growth/connective tissue abnormalities and migration/accumulation abnormalities of macrophages and dendritic cells.

Chapter
5
99A hypothesis on the early phases of the endocrine autoimmune reaction |
intRoDuCtion
The aetiology of autoimmune thyroid disease (AITD), encompassing Graves’ hyperthyroidism and Hashimoto’s thyroiditis, is multifactorial [1]. Genetics play an important role in the development of AITD, illustrated by the concordance rate for Graves’ disease and Hashimoto’s hypothyroidism in monozygotic twins, which is higher than in dizygotic twins [2,3]. In addition, many patients with AITD have family members affected by this disorder. However it has been estimated that at best 79% of the liability to develop AITD can be attributed to genetics [3] and therefore environmental risk factors must also be involved [4]. In the early 2000’s we initiated a follow-up cohort study (the Amsterdam AITD Cohort) to determine risk factors involved in newly incident cases of AITD. To increase the likelihood of diagnosing new patients during a 5-year follow-up, we included only women who had at least one relative with documented AITD and who were in self-proclaimed good health. Evidence for thyroid autoimmunity, i.e. presence of thyroid peroxidase autoantibodies (TPO-Abs), was found at baseline in 24% of the cohort [5]. In the 5 year follow-up 10.2% of participants developed de novo TPO-Abs (so- called SeroConverters, SC), while 6.5% progressed to overt autoimmune hypothyroidism or hyperthyroidism, particularly in the TPO-Abs positive subjects. Taken together, our findings in the Amsterdam cohort are thus in agreement with the generally accepted view that subjects with a family history of AITD are at increased risk for autoimmune thyroid disease and that TPO-Abs are acceptable markers to predict progression to clinical disease [5-7]. Markers to predict the risk for AITD in very early stages of the autoimmune disease and before TPO-Abs are detectable in serum are limited and comprise genetic polymorphisms of immune-related genes (MHC class II molecules, CTLA4, PTPN22) and of genes related to thyroid antigens (the TSH receptor and thyroglobulin) [1,8]. For this study we hypothesized that other early prediction markers might be found in a set of molecules related to the accumulation and activation of macrophages and dendritic cells (DC) in the thyroid gland just prior to thyroid autoimmunization. In animal models of spontaneously developing AITD, i.e. the NOD mouse and BB-DP rat, macrophages and DC play a key role in the initiation of the thyroid autoimmune reaction [9,10]. Extensive data gathered in these animal models show that the actual process starts with the accumulation and clustering of macrophages and DC in the target organs, shortly followed by a T and B cell reaction in the draining lymph nodes. The initial accumulation of macrophages and DC in the target glands-to-be is thought to occur via infiltration of monocytes from the blood stream. Diapedesis of monocytes from the blood stream via endothelium into and through the tissues requires chemokines [11], such as e.g. Chemokine (C-C motif) ligand 2 (CCL2), CCL3 and CCL4. Apart from chemokines, the attachment of the cells to endothelium is important for diapedesis, and after diapedesis an interaction of the cells with extracellular matrix proteins is essential [12]. Vascular factors and adhesion molecules, such as integrins, Vascular cell adhesion protein 1 (VCAM-1) and thrombospondin-1 (THBS-1) [13], play important roles in these adhesive interactions. Evidence of the important role of chemokines and integrins has
100 | Chapter 5
been found previously in AITD in the up regulation of CCL2 [14] and that of Soluble Intercellular Adhesion Molecule-1 (sICAM-1 or sCD54) in the serum of patients [15,16]. There are also indications that the Angiopoietin-1 receptor (TIE-2) system has a role in the recruitment of monocytes to the thyroid gland in AITD [17]. Apart from adhesive processes a remodeling of the connective tissue is a prerequisite for monocytes, macrophages and dendritic cells to travel through the tissues. Matrix metalloproteinases (MMPs) and platelet-derived growth factors (PDGFs) produced by the cells of the mononuclear phagocyte system are instrumental in this remodeling [18]. Finally to initiate the thyroid autoimmune response DC and macrophages need to switch to a pro-inflammatory non-tolerogenic state. Cytokines, such as IL-1β, IL-6, TNF-α, IL-10 and Growth differentiation factor 15 (GDF-15) secreted by these pro-inflammatory mononuclear phagocytes are positive and negative regulators of such inflammatory set point change of the cells. In this study we investigated putative abnormalities in above listed chemokines, adhesion molecules, tissue remodelling factors, growth factors and pro- and anti-inflammatory cytokines in humans at risk for the development of AITD, taking advantage of the Amsterdam AITD cohort [5]. We compared serum levels of CCL2, CCL3, CCL4, sVCAM-1, sICAM-1, THBS-1, VEGF-A, TIE-2, MMP13, PDGF-BB, FN, IL-1β, IL-6, TNF-α, IL-10 and GDF-15 between three groups: 32 euthyroid family members of AITD patients who developed de novo TPO-Abs during 5 years follow-up (SeroConverters, SC), 32 euthyroid family members of AITD patients who did not develop TPO-Abs in the follow-up (Non-SeroConverters, NSC) and 32 healthy controls (HC), the latter 2 control groups of subjects were matched to the SC for age, smoking habits and current estrogen medication. We previously reported that current smoking prevented the development of TPO-Abs in the cohort [19]; the use of oral contraceptives was also negatively associated with TPO-Abs development [20].
suBjeCts AnD MethoDs
subjects The present studies were carried out among the 803 subjects from the Amsterdam AITD Cohort. The cohort has previously been described in detail [20]. In short, the cohort consisted of women between 18 and 65 years of age in self-proclaimed good health without a history of thyroid disease, who had at least one 1st or 2nd degree relative with documented autoimmune hyper- or hypothyroidism. Results of thyroid function tests at study entrance revealed overt hypothyroidism in 10 subjects and overt hyperthyroidism in 3 subjects, leaving 790 subjects to be included in the present study. Subjects were followed for five years, or shorter when overt hyper- or hypothyroidism had occurred (defined as TSH <0.4 mU/l in combination with FT4>20.1 pmol/l, or TSH>5.7 mU/l in combination with FT4<9.3 pmol/l respectively). At each annual visit to our

Chapter
5
101A hypothesis on the early phases of the endocrine autoimmune reaction |
institution blood samples were collected to measure TSH, FT4, TPO-Ab, Tg-Ab and Thyrotrophin Binding Inhibiting Immunoglobulin (TBII). All subjects were asked to fill in questionnaires on smoking habits (current and past) and use of oral contraceptives or other estrogens (current and past). Current pregnancy is an exclusion criterion for the present studies. Current smoking is defined as smoking now, or having stopped smoking within one year before visiting our institution clinic. Current estrogen usage is defined as presently on exogenous estrogen medication. The population who qualified for this study was selected from the inception cohort of the 790 euthyroid subjects after excluding subjects who had any serological sign of AITD at baseline i.e. abnormal TSH and/or thyroid antibodies at baseline (TPO-Ab of 100 kU/l or greater, Tg- Ab of 100 kU/l or greater, or TBII of 12U/L or greater). Consequently, 521 euthyroid participants without any serological sign of AITD at baseline were thus enrolled. The actual selection of subjects for the present study from these 521 participants was performed as follows: at first 81 euthyroid subjects who were TPO-Ab and Tg-Ab negative at baseline but developed TPO-Ab during follow-up (so-called Sero-Converters, SC) were identified. The end-point for a seroconverter was the time at which she had become positive for the first time for TPO-Ab without developing abnormal TSH. Each selected sero-converter was matched with a euthyroid subject who was TPO-Ab and Tg-Ab negative at baseline and did not develop TPO-Ab up to the time at which the seroconverter they were matched to, had received her end-point. Seroconverters and Non-Sero-Converters (NSC) were matched for age, current smoking, current estrogen and duration of follow up. Because the cost of measuring all compounds in all samples is very high, for reasons of cost-effectiveness we then randomly selected 32 seroconverters and their corresponding 32 non-seroconverters. The mean age of the selected subjects was 36,8 years (range 20-58 years). As a control group, we used 32 female subjects between 20 and 69 years of age, who were recruited through advertisements in local newspapers, to participate in an ongoing program within our institution for delineating reference values of endocrine function tests. They were also in self-proclaimed good health, had no family or personal history of thyroid disease and had normal TSH and no thyroid antibodies. Blood samples were collected over the same period of time as those of the Amsterdam AITD cohort, and processed in the same manner. All subjects gave informed written consent and the Medical Ethics committee of the Academic Medical Center in Amsterdam and the Medical Ethics committee of Erasmus MC in Rotterdam approved the study.
tsh, Ft4, tPo-Ab determinationsSerum samples were stored at -20°C until determination of the study parameters. Serum TSH and FT4 were measured using time-resolved fluoroimmunoassay (Delphia, Turku, Finland). Reference values are for TSH 0.4-5.7 mU/l and for FT4 9.3-20.1 pmol/l. TPO-Ab and thyroglobulin (Tg) antibodies were measured by chemiluminescence immunoassays (LUMI-test anti-TPO and

102 | Chapter 5
LUMI-test anti-Tg respectively, Brahms, Berlin, Germany). Improved versions of both assays became available during follow-up: detection limits of these new assays were for TPO-Ab 30 kU/l and for Tg-Ab 20 kU/l. TPO-Ab concentrations obtained with the old assay were multiplied by a factor 0.72 to obtain comparative values in the new assay. TPO-Ab and Tg-Ab concentrations were considered to be positive at values >100 kU/l. TSH receptor antibodies were determined as TSH binding inhibitory immunoglobulins (TBII) using the TRAK assay (Brahms, Berlin, Germany); detection limits in the 1st and 2nd generation TRAK assays were 5 and 1 IU/l respectively, and values above 12 and 1.5 U/l respectively were considered as positive.
serum analytes The levels of TNF-α, IL-10, IL-6, IL-1β, MMP-13, CCL3, CCL4, VEGF-A, PDGF-BB, CCL2, sVCAM-1, sICAM-1 were measured using the FlowCytomix Multiple Analyte Detection System (eBioscience, San Diego, USA) a bead-based multiplex immunoassay according to the manufacturer’s protocol. Samples were analyzed with a BD LSR II flow cytometer (BD Biosciences, San Diego, USA) and the raw data were further converted with FlowCytomix Pro 3.0 software (eBioscience, San Diego, USA). ELISA technology was used for single analyte detection of FN and TIE-2 (Platinum ELISA, eBioscience, San Diego, USA) and GDF-15 and THBS-1 (Quantikine Colorimetric Sandwich ELISA, R&D systems, Abingdon, UK) according to the manufacturer’s protocol. Undetectable serum analyte levels were considered as 0 pg/ml and included in the statistical analysis.
statisticsStatistical analysis was performed using the SPSS 20 (IBM) package for Windows. Data were tested for normal distribution using the Kolmogorov-Smirnov test. Depending on the distribution pattern, parametric (Students T test and one-way ANOVA) or nonparametric group comparisons (Mann-Whitney U and Kruskal-Wallis H tests) were applied. Correlations were determined by Spearman-correlation. Dendrograms were constructed by SPSS using hierarchical cluster analysis of the serum analytes using the between-groups linkage method. The heat map was designed using Java Treeview (by Alok Saldanha). Levels of significance were set at p=0.05 (two-tailed). The specific tests and group size are mentioned in table footnotes and in figure legends. Graphs were designed with Graphpad Prism 5.04 (Graphpad Software) for windows.
ResuLts
In order to select subjects without serological signs of thyroid autoimmunity at baseline we included women from the inception cohort who were in self-proclaimed good health, had a normal TSH, normal free T4 and were negative for TPO-Ab, Tg-Ab and TBII at study entrance. With regard to the Sero-Converters (SC) 6 of the 32 women (19%) who developed TPO-Ab during follow-up were also TgAb positive at the time of seroconversion to TPO-Ab (Tg-Ab levels were

Chapter
5
103A hypothesis on the early phases of the endocrine autoimmune reaction |
235, 180, 135, 120, 115, 100 kU/l). With regard to the Non-Sero-Converters (NSC), just 2 of the 32 women (6%) were Tg-Ab positive (levels 150 and 125 kU/L) at the time their corresponding SC developed TPO-Ab. As expected and as a result of the randomization and stratification procedure Sero-Converters (SC), Non-Sero-Converters (NSC) and healthy controls (HC) were not different regarding age, current smoking behavior and current estrogen medication (Table 1). In NSC subjects, as compared to HC, an up regulation of cluster C compounds was found, namely a statistically significant strong up regulation of FN (see also Figure 4). The up regulation of FN occurred in the vast majority of the relatives, i.e. in 84% of subjects (defined as the proportion of values above the mean plus SD of the HC, Figure 4). With regard to cluster B compounds we found in NSC subjects a strong down regulation (Figure 3). These reductions were in particular evident for PDGF-BB (94% of the values below the IQR of the HC of subjects), sVCAM-1 (97% of subjects values below the mean minus SD of the HC of subjects) and CCL2 (81% of subjects values below the IQR of the HC of subjects). With regard to cluster A compounds, the levels of the inflammatory cytokines/chemokines IL-1β, IL-6 and CCL3 were also reduced and most frequently not detectable in our cytometric bead array (Figure 2). With regard to the compounds found outside the clusters (Figure 4), the TIE-2 levels were strongly reduced as well in the group of NSC (100% of subjects values below the IQR of the HC of subjects).
table 1. Characteristics of healthy controls, and of female euthyroid relatives of AITD patients grouped for TPO antibody conversion during 5 year follow-up. HC, healthy controls; SC, sero-converters; NSC, non-sero-converters.
hC nsC sC hC vs nsCP-value
hC vs sCP-value
nsC vs sCP-value
n 32 32 32
Age mean (range) 35 (22-61) 33 (19-62) 33 (18-61) 0.401 0.399 0.999
BMI mean (range) 23.8 (18.1-33.7) 24.0 (18.7-42.1) 24.2 (19.1-40.8) 0.840 0.744 0.902
TSH median (IQR) 1.50 (1.20-2.00) 1.20 (1.00-1.65) 1.40 (1.20-2.00) 0.473 0.141 0.265
FT4 median (IQR) 13.0 (12.2-14.7) 13.5 (12.3-14.6) 12.0 (11.9-14.5) 0.894 0.533 0.653
Current smoking (%) 15 (47%) 15 (47%) 15 (47%)
Current estrogen use (%) 6 (19%) 12 (38%) 12 (38%)
Figure 2-5 and Supplemental Table I show the results of analyte measurements in the serum of the SC, NSC and HC. But first, we performed a cluster analysis (Figure 1) and found in essence three clusters of mutually in-expression-level correlating compounds, i.e. a cluster A containing most of the inflammatory cytokines/chemokines (TNF-α, IL-10, IL-6, IL-1β, MMP-13 and CCL3), a cluster B containing the vascular adhesion, growth and migration factors (CCL4, VEGF-A, PDGF-BB, CCL2, sVCAM-1) and a small cluster C containing FN and sICAM-1. The other tested compounds

104 | Chapter 5
(GDF-15, THBS-1 and TIE-2) did hardly correlate to the expression levels of the other compounds. Results in Figure 2-5 and Supplemental Table 1 are presented according to the cluster analysis as groups of compounds.
Dendrogram2520151050 T
NF-
α
IL-1
0
IL-6
IL-1
β
MM
P-1
3
CC
L3
CC
L4
VE
GF-
A
PD
GF-
BB
CC
L2
sV
CA
M-1
sIC
AM
-1
Fib
rone
ctin
GD
F-15
TIE
-2
TH
BS
1
TNF-α
IL-10
IL-6
IL-1β
MMP-13
CCL3
CCL4
VEGF-A
PDGF-BB
CCL2
sVCAM-1
sICAM-1
Fibronectin
GDF-15
TIE-2
THBS1
Figure 1. Heat map of hierarchical cluster analysis of the tested serum levels of cytokines, chemokines, adhesion molecules and tissue remodelling factors. Colour-coded correlation matrix illustrates Spearman’s correlation coefficients between the serum levels of the indicated compounds. Significant positive correlations (p<0.05) are given in the red scale (darkest red are correlation coefficients >0.50), significant negative correlations are given by the green scale. Lighter fields are not significant. Also a dendrogram is presented as a result of the hierarchical clustering. The dendrogram and heat map show in essence three major clusters of mutually correlating compounds: One cluster of inflammatory compounds (Cluster A: TNF-α, IL-10, IL-6, IL-1β, MMP13 and CCL3); a second cluster of vascular adhesion, growth and migration factors (Cluster B: CCL4, VEGF-A, PDGF-BB, CCL2 and s-VCAM) and a small cluster C containing s-ICAM1 and Fibronectin (FN).

Chapter
5
105A hypothesis on the early phases of the endocrine autoimmune reaction |
IL-1β
pg/m
l
HC NSC SC
0
500
8005800
0.004 0.0120.824
17 28 19
IL-6
pg/m
lHC NSC SC
0
10
2020
400
0.011 0.0410.474
9 16 10
TNF-α
pg/m
l
HC NSC SC
0
20
40
60
200400600
0.406 0.1610.600
24 27 22
IL-10
pg/m
l
HC NSC SC
0
10
20
30200400600800
0.862 0.1580.124
27 26 22
MMP13
ng/m
l
HC NSC SC
0
5
10
15<0.001 0.266
0.001
0 8 5
CCL3
pg/m
l
HC NSC SC
0
1000
20002000
550000.012 0.009
0.743
9 19 11
Cluster A
Figure 2. The figure represents the outcomes of serum measurements of all Cluster A compounds. Medians with IQR are shown for each group of serum measurement in healthy controls (HC), non-sero-converting (NSC) and sero-converting (SC) family members. Bars represent p values between groups (see also Supplementary Table 1); the number of undetectable (0) concentrations is shown below the dots for each study group.
Comparing SC to HC, the picture was the same as in the NSC for cluster C compounds (namely FN up regulated in 84% of individuals above the mean plus SD of the HC of subjects) and for cluster B compounds (down regulated, in 85% to 100% of cases below the IQR of the HC of subjects) (see Figure 4 and 3). When comparing SC and NSC, SC however differed from the NSC for cluster A compounds (Figure 2): These inflammatory compounds were not down regulated, but were at the same level as in healthy controls but significantly up regulated as compared to the NSC subjects for the pro-inflammatory cytokines Il-1β and IL-6 and the pro-inflammatory chemokine CCL3. There were no differences observed between SC and NSC in the other clusters of compounds. We also investigated the analyte patterns of the smoking/non-smoking and oral contra-conceptive-using/non-oral contra-conceptive-using women separately, since we previously reported that smoking and usage of oral contraceptives decreased vulnerability for AITD [19,20]. Smoking did not have any effect on the levels of the here tested analytes. However, the use of

106 | Chapter 5
oral contraceptives did, but only for FN. Figure 5 shows that with regard to FN the use of oral contraceptives led to a smaller increase in the level of FN in all groups (the SC, NSC and HC, though in the latter just not significant at p=0.06).
CCL4
pg/m
l
HC NSC SC
0
50
100
150
200200400600800
<0.001 0.126<0.001
1 23 28
VEGFA
pg/m
l
HC NSC SC
0
500
1000
1500
60008000
100001200014000
0.898 0.2450.304
2 28 19
PDGF-BB
pg/m
l
HC NSC SC
0
1000
2000
3000
4000
50005000
10000<0.001 0.124
<0.001
CCL2
pg/m
l
HC NSC SC
0
200
400
600
800<0.001 0.317
0.271
sVCAM-1
ng/m
l
HC NSC SC
0
500
1000
1500
2000
2500<0.001 0.926
<0.001
0 1 1
Cluster B
Figure 3. The figure represents the outcomes of serum measurements of all Cluster B compounds. Medians with IQR are shown for each group of serum measurement in healthy controls (HC), non-sero-converting (NSC) and sero-converting (SC) family members. In addition, sVCAM-1 was normally distributed, therefore the mean with SD are shown. Bars represent p values between groups (see also Supplementary Table 1); the number of undetectable (0) concentrations is shown below the dots for each study group.

Chapter
5
107A hypothesis on the early phases of the endocrine autoimmune reaction |
sICAM-1
ng/m
l
HC NSC SC
0
500
1000
15000.101 0.920
0.304
Fibronectin
µg/m
lHC NSC SC
0
500
1000
<0.001 0.21<0.001
Cluster C
GDF-15
pg/m
l
HC NSC SC
0
500
1000
5000
100000.083 0.155
0.946
TIE-2
pg/m
l
HC NSC SC
0
5
10
1515202530
<0.001 0.363<0.001
THBS1
µg/
ml
HC NSC SC
0
5000
10000
15000
20000
250000.803 0.692
0.919
Other
Figure 4. The figure represents the outcomes of serum measurements of all Cluster C and other compounds. Medians with IQR are shown for each group of serum measurement in healthy controls (HC), non-sero-converting (NSC) and sero-converting (SC) family members. In addition, Fibronectin and THBS-1 were normally distributed, therefore the mean with SD are shown. Bars represent p values between groups (see also Supplementary Table 1).
Fibronectin
µ g/m
l
NSC
NSC OAC SC
SC OAC HC
HC OAC
0
200
400
600
800
1000
1200
14000.0650.01 <0.001
PDGF-BB
pg/m
l
NSC
NSC OAC SC
SC OAC HC
HC OAC
0
1000
2000
3000
4000
50005000
10000
0.5300.129 0.311
A B
Figure 5. Means with SD are shown for the serum Fibronectin (A) and median with IQR for the serum PDGF-BB (B) levels in the tested groups, i.e. healthy controls (HC), non-sero-converting (NSC) and sero-converting (SC) family members, grouped according to the use of oral contraceptives (OAC = using oral contraceptives). Bars represent p values between groups. As can be seen serum Fibronectin levels are reduced in subjects using oral contraceptives.

108 | Chapter 5
DisCussion
This study shows that euthyroid females with at least one 1st or 2nd degree relative with a documented autoimmune hyper- or hypothyroidism show a characteristic pattern of abnormalities in serum levels of tissue remodelling factors, growth factors, chemokines, (vascular) adhesion molecules and cytokines, giving proof of principle that very early stages of AITD (still no TPO-Ab in serum) are detectable in individuals at risk by testing peripheral blood for these compounds. The levels of FN (up regulated in over 80%) and PDGF-BB (down regulated in over 90%) were strong determinants characterizing the 1st or 2nd degree relatives, irrespective of later sero-conversion to TPO-Ab positivity. The abnormalities suggest growth and connective tissue abnormalities in individuals with an inborn risk for AITD. Interestingly there is an early report [21] on abnormalities in the growth of skin fibroblasts of 1st degree relatives of T1D individuals (these individuals are also known to have a higher risk for AITD) [6,22]. The observed high FN and reduced PDGF-BB levels in subjects at risk for AITD are reminiscent of the connective tissue and endocrine growth abnormalities which have been observed in the pre-autoimmune stage in animal models of spontaneously developing endocrine autoimmune disease, such as the OS chicken, the BB-DP rat and the NOD mouse. Pre-thyroiditis abnormalities in the BB-DP rat involve a smaller thyroid volume (prior to lymphocytic infiltration) and a hampered growth of thyrocytes [23]. Similar thyrocyte growth defects have been described for the Obese Strain of chicken, even as early as in fetal life [24]. The thyroids of NOD mice have only accidentally been studied for abnormalities in growth, and in these studies a high frequency of intra-thyroidal ectopic thymus tissue was found [25]. However, the pre-weaning NOD pancreas has been studied in more detail. Irregularly shaped islets are a hallmark of the pre-weaning NOD pancreas [26] and these irregularly shaped islets show in addition an excessive FN content predominantly at the islet vascular pole [27]. Interestingly autoimmune insulitis starts in this model with an accumulation of macrophages and DC essentially at these sites of high FN expression [27]. In the here reported study we additionally found that the use of oral contraceptives resulted in a reduced increase in the serum level of FN. Since oral-contraceptives also reduced the risk for TPO-Ab sero-conversion in the Amsterdam cohort [20], it is tempting to speculate that oral contraceptives reduce the FN content in the target glands thereby reducing the macrophage and DC accumulation leading to a reduced incidence of sero-conversion. With regard to the chemokines, adhesion and migration factors CCL2, CCL4, sVCAM-1, MMP-13 and TIE-2 we found these reduced in serum of 1st or 2nd degree relatives, irrespective of later sero-conversion. Particularly the levels of sVCAM-1, CCL2 and TIE-2 were strong determinants and were reduced in 80 to 100% of relatives. Interestingly reduced CCL2 levels have also been reported in individuals genetically at risk for T1D [28]. The reduced levels of chemokines, adhesion and migration factors suggest a reduced general infiltration and migration of immune cells into and through the tissues of individuals with an

Chapter
5
109A hypothesis on the early phases of the endocrine autoimmune reaction |
inborn risk to develop an endocrine autoimmune disease. This in contrast to patients with clinically overt AITD or T1D, who have been reported to have raised serum levels of CCL2 [14] and normal or even higher expression levels of soluble adhesion molecules and immune cellular infiltrations in their glandular tissue [29,30]. The here reported data on generally reduced levels of chemokines, adhesion and migration factors in relatives of AITD patients are again reminiscent of the reduced migration we have observed in the pre-phases of the autoimmune process in the animal models of spontaneously developing endocrine autoimmune disease. Particularly NOD macrophages show a hampered migration in these stages [31] and it is difficult to recruit (inflammatory) monocytes from the circulation to sites of inflammation in the NOD mouse [32]. The here reported study finally suggests that the levels of the pro-inflammatory cytokines and chemokines might make a distinction possible between SC and NSC, since IL-1β, IL-6, and CCL3 did differ between NSC and SC (though it must be admitted that the sensitivity of the IL-1β assay was low). Reduced levels of the pro-inflammatory cytokines/chemokines as compared to healthy controls were measured in the family members, who did not seroconvert in a follow-up of 5 years and levels of IL-1β, IL-6, and CCL3 were reduced. In family members who did sero-convert to TPO-Ab positivity this pattern was different, and IL-1β, IL-6 and CCL3 were significantly raised as compared NSC subjects and reached equal values as found in comparison to healthy controls. We like to explain this pattern of differences by assuming 1) that in NSC family members of AITD patients leukocytes are not only systemically down regulated with regard to adhesion and migration (see before), but also with regard to the production of pro-inflammatory cytokines/chemokines, and 2) that in SC family members the auto-inflammation in the thyroid had already started and that intra-thyroidal pro-inflammatory macrophages and DC secrete pro-inflammatory cytokines raising the levels above the systemically down regulated levels generally found in the NSC family members. Again parallels with the NOD mouse model are striking. There are indeed indications that DC and macrophages in the endocrine tissues of the NOD mouse are prior to the actual autoimmunization at a reduced maturation set point producing less chemokines and inflammatory cytokines, but that at the time of sero-conversion and the start of the autoimmune reaction this reduced set point of DC and macrophages turns over to a high inflammatory set point [33-38]. In addition there is evidence that these abnormal inflammatory DCs and macrophages do not support T cell tolerance mechanisms sufficiently, thus tipping the balance towards autoimmunization [39-42]. In conclusion, the here reported study is a limited study on a relatively small group of family members of AITD patients. The study also has its technical limitations. A limitation of the cytometric bead array test which we used for this study is that for some of the compounds sensitivity was low, such as for IL-1β, TNF-α and IL-10. For these compounds serum levels of many patients were below the detection limit. Also, because this is an explorative study we did not take type I errors into account. Applying Bonferroni correction will result in loss of significance
110 | Chapter 5
between the subject groups for some of the cluster A compounds. Indeed further validation studies in a larger cohort of subjects with more sensitive detection methods are needed. Despite these limitations, our study represents a first report on the levels of tissue remodeling factors, adhesion molecules, chemokines and cytokines in individuals at risk for thyroid autoimmune disease and data suggest a characteristic pattern of abnormalities in growth and composition of endocrine tissues and in immune activation state prior to the auto-reactive state and reminiscent of the pre-autoimmune state found in the animal models of endocrine autoimmune disease. An early identification of individuals at risk for a thyroid autoimmune disease and an exquisite knowledge on the abnormalities in immune-endocrine functioning in the very early stages are the basis for future rational approaches to prevent endocrine autoimmune disease. Therefore outcomes of this study urge on the one hand for a further profiling of the serum of individuals at risk in a multi-analyte approach using assays with sufficient sensitivity and on the other hand for the determination of the size of the thyroid gland prior to autoimmunization as well as the patterns of infiltration with macrophages and dendritic cells using ultrasound and novel imaging techniques respectively [43].
AcknowledgementsThe excellent technical assistance of Thomas H. Hoogenboezem is gratefully acknowledged. This work was supported by the The Netherlands Organisation for Health Research and Development (ZonMw) grants 950-10-626 and 903-40-193.

Chapter
5
111A hypothesis on the early phases of the endocrine autoimmune reaction |
ReFeRenCes
1. Eschler, D.C., A. Hasham, and Y. Tomer, Cutting edge: the etiology of autoimmune thyroid diseases. Clin Rev Allergy Immunol, 2011. 41(2): p. 190-7.
2. Brix, T.H., et al., Evidence for a major role of heredity in Graves’ disease: a population-based study of two Danish twin cohorts. J Clin Endocrinol Metab, 2001. 86(2): p. 930-4.
3. Brix, T.H., K.O. Kyvik, and L. Hegedus, A population-based study of chronic autoimmune hypothyroidism in Danish twins. J Clin Endocrinol Metab, 2000. 85(2): p. 536-9.
4. Prummel, M.F., T. Strieder, and W.M. Wiersinga, The environment and autoimmune thyroid diseases. Eur J Endocrinol, 2004. 150(5): p. 605-18.
5. Strieder, T.G., et al., Prediction of progression to overt hypothyroidism or hyperthyroidism in female relatives of patients with autoimmune thyroid disease using the Thyroid Events Amsterdam (THEA) score. Arch Intern Med, 2008. 168(15): p. 1657-63.
6. Bilimoria, K.Y., O.H. Pescovitz, and L.A. DiMeglio, Autoimmune thyroid dysfunction in children with type 1 diabetes mellitus: screening guidelines based on a retrospective analysis. J Pediatr Endocrinol Metab, 2003. 16(8): p. 1111-7.
7. Muller, A.F., H.A. Drexhage, and A. Berghout, Postpartum thyroiditis and autoimmune thyroiditis in women of childbearing age: recent insights and consequences for antenatal and postnatal care. Endocr Rev, 2001. 22(5): p. 605-30.
8. Brand, O.J. and S.C. Gough, Immunogenetic mechanisms leading to thyroid autoimmunity: recent advances in identifying susceptibility genes and regions. Curr Genomics, 2011. 12(8): p. 526-41.
9. Voorby, H.A., et al., Dendritic cells and class II MHC expression on thyrocytes during the autoimmune thyroid disease of the BB rat. Clin Immunol Immunopathol, 1990. 55(1): p. 9-22.
10. Many, M.C., et al., Two-step development of Hashimoto-like thyroiditis in genetically autoimmune prone non-obese diabetic mice: effects of iodine-induced cell necrosis. J Endocrinol, 1995. 147(2): p. 311-20.
11. Kemp, E.H., et al., Detection and localization of chemokine gene expression in autoimmune thyroid disease. Clin Endocrinol (Oxf), 2003. 59(2): p. 207-13.
12. Martin, J., et al., The dialogue between endothelial cells and monocytes/macrophages in vascular syndromes. Curr Pharm Des, 2007. 13(17): p. 1751-9.
13. Kirsch, T., et al., Endothelial-derived thrombospondin-1 promotes macrophage recruitment and apoptotic cell clearance. J Cell Mol Med, 2010. 14(7): p. 1922-34.
14. van der Heul-Nieuwenhuijsen, L., et al., An inflammatory gene-expression fingerprint in monocytes of autoimmune thyroid disease patients. J Clin Endocrinol Metab, 2010. 95(4): p. 1962-71.
15. Witkowska, A.M. and M.H. Borawska, Soluble intercellular adhesion molecule-1 (sICAM-1): an overview. Eur Cytokine Netw, 2004. 15(2): p. 91-8.
16. De Bellis, A., et al., Soluble intercellular adhesion molecule-1 (sICAM-1) concentrations in Graves’ disease patients followed up for development of ophthalmopathy. J Clin Endocrinol Metab, 1998. 83(4): p. 1222-5.
17. Figueroa-Vega, N., et al., Tie-2 is overexpressed by monocytes in autoimmune thyroid disorders and participates in their recruitment to the thyroid gland. J Clin Endocrinol Metab, 2009. 94(7): p. 2626-33.
18. Kohno, Y., et al., GM-CSF activates RhoA, integrin and MMP expression in human monocytic cells. Pathol Int, 2004. 54(9): p. 693-702.
19. Effraimidis, G., J.G. Tijssen, and W.M. Wiersinga, Discontinuation of smoking increases the risk for developing thyroid peroxidase antibodies and/or thyroglobulin antibodies: a prospective study. J Clin Endocrinol Metab, 2009. 94(4): p. 1324-8.
20. Strieder, T.G., et al., Risk factors for and prevalence of thyroid disorders in a cross-sectional study among healthy female relatives of patients with autoimmune thyroid disease. Clin Endocrinol (Oxf), 2003. 59(3): p. 396-401.

112 | Chapter 5
21. Goldstein, S., et al., Diabetes mellitus and genetic prediabetes. Decreased replicative capacity of cultured skin fibroblasts. J Clin Invest, 1979. 63(3): p. 358-70.
22. Lam-Tse, W.K., et al., The association between autoimmune thyroiditis, autoimmune gastritis and type 1 diabetes. Pediatr Endocrinol Rev, 2003. 1(1): p. 22-37.
23. Simons, P.J., et al., Pre-autoimmune thyroid abnormalities in the biobreeding diabetes-prone (BB-DP) rat: a possible relation with the intrathyroid accumulation of dendritic cells and the initiation of the thyroid autoimmune response. J Endocrinol, 1998. 157(1): p. 43-51.
24. Truden, J.L., et al., The decreased growth rate of obese strain chicken thyroid cells provides in vitro evidence for a primary target organ abnormality in chickens susceptible to autoimmune thyroiditis. Clin Immunol Immunopathol, 1983. 29(2): p. 294-305.
25. Many, M.C., H.A. Drexhage, and J.F. Denef, High frequency of thymic ectopy in thyroids from autoimmune prone nonobese diabetic female mice. Lab Invest, 1993. 69(3): p. 364-7.
26. Rosmalen, J.G., et al., Islet abnormalities in the pathogenesis of autoimmune diabetes. Trends Endocrinol Metab, 2002. 13(5): p. 209-14.
27. Geutskens, S.B., et al., Extracellular matrix distribution and islet morphology in the early postnatal pancreas: anomalies in the non-obese diabetic mouse. Cell Tissue Res, 2004. 318(3): p. 579-89.
28. Hanifi-Moghaddam, P., et al., Altered chemokine levels in individuals at risk of Type 1 diabetes mellitus. Diabet Med, 2006. 23(2): p. 156-63.
29. Jungheim, K., et al., Lymphocyte homing in xenotransplanted human thyroid tissue can be inhibited by LFA-1 and ICAM-1 antibodies. Thyroid, 2004. 14(1): p. 3-11.
30. Marazuela, M., Lymphocyte traffic and homing in autoimmune thyroid disorders. Eur J Endocrinol, 1999. 140(4): p. 287-90.
31. Bouma, G., et al., Evidence for an enhanced adhesion of DC to fibronectin and a role of CCL19 and CCL21 in the accumulation of DC around the pre-diabetic islets in NOD mice. Eur J Immunol, 2005. 35(8): p. 2386-96.
32. Bouma, G., et al., NOD mice have a severely impaired ability to recruit leukocytes into sites of inflammation. Eur J Immunol, 2005. 35(1): p. 225-35.
33. Poligone, B., et al., Elevated NF-kappaB activation in nonobese diabetic mouse dendritic cells results in enhanced APC function. J Immunol, 2002. 168(1): p. 188-96.
34. Marleau, A.M. and B. Singh, Myeloid dendritic cells in non-obese diabetic mice have elevated costimulatory and T helper-1-inducing abilities. J Autoimmun, 2002. 19(1-2): p. 23-35.
35. Sen, P., et al., NF-kappa B hyperactivation has differential effects on the APC function of nonobese diabetic mouse macrophages. J Immunol, 2003. 170(4): p. 1770-80.
36. Stoffels, K., et al., NOD macrophages produce high levels of inflammatory cytokines upon encounter of apoptotic or necrotic cells. J Autoimmun, 2004. 23(1): p. 9-15.
37. Rothe, H., et al., Abnormal TNF-alpha production in diabetes-prone BB rats: enhanced TNF-alpha expression and defective PGE2 feedback inhibition. Immunology, 1994. 81(3): p. 407-13.
38. Wildenberg, M.E., et al., Lack of CCR5 on dendritic cells promotes a proinflammatory environment in submandibular glands of the NOD mouse. J Leukoc Biol, 2008. 83(5): p. 1194-200.
39. Tarbell, K.V., et al., CD25+ CD4+ T cells, expanded with dendritic cells presenting a single autoantigenic peptide, suppress autoimmune diabetes. J Exp Med, 2004. 199(11): p. 1467-77.
40. Cheatem, D., et al., Modulation of dendritic cells using granulocyte-macrophage colony-stimulating factor (GM-CSF) delays type 1 diabetes by enhancing CD4+CD25+ regulatory T cell function. Clin Immunol, 2009. 131(2): p. 260-70.
41. Delemarre, F.G., et al., Signs of immaturity of splenic dendritic cells from the autoimmune prone biobreeding rat: consequences for the in vitro expansion of regulator and effector T cells. J Immunol, 1999. 162(3): p. 1795-801.
42. Radosevic, K., et al., Splenic dendritic cells from the non-obese diabetic mouse induce a prolonged proliferation of syngeneic T cells. A role for an impaired apoptosis of NOD T cells? J Autoimmun, 1999. 13(4): p. 373-82.
43. Gaglia, J.L., et al., Noninvasive imaging of pancreatic islet inflammation in type 1A diabetes patients. J Clin Invest, 2011. 121(1): p. 442-5.

Chapter
5
113A hypothesis on the early phases of the endocrine autoimmune reaction |
suPP
LeM
entA
L tA
BLe
supp
lem
enta
l tab
le 1
. Ser
um le
vels
of c
ytok
ines
, che
mok
ines
and
gro
wth
fact
ors
of h
ealth
y co
ntro
ls (H
C), N
on-S
ero-
Conv
ertin
g (N
SC) a
nd S
ero-
conv
ertin
g (S
C) fa
mily
mem
bers
. the
med
ian
(M) a
nd in
terq
uarti
le r
ange
(IQ
R) a
re g
iven
for
para
met
ers
with
a n
on-n
orm
al d
istrib
ution
and
non
-par
amet
ric s
tatis
tical
te
sting
was
app
lied;
nor
mal
ly d
istrib
uted
par
amet
ers a
re g
iven
with
mea
ns (M
) and
stan
dard
dev
iatio
ns (S
D) a
nd in
dica
ted
with
*. T
he la
st c
olum
ns re
pres
ent
p-va
lues
of d
iffer
ence
s be
twee
n te
st g
roup
s. C
ytok
ines
, che
mok
ines
and
gro
wth
fact
ors
are
grou
ped
acco
rdin
g to
the
clus
ter a
naly
sis
(Fig
ure
1).
n
sCsC
hC v
s nsC
nsC
vs s
ChC
vs s
CKr
uska
l-wal
lis h
M
IQR
MIQ
RM
IQR
p-va
lue
p-va
lue
p-va
lue
X2p-
valu
eCL
UST
ER A
IL-1
B (p
g/m
l)0.
127
3.9
0.1
0.0
0.1
290.
60.
004
0.01
20.
824
8.7
0.01
3
IL-6
(pg/
ml)
2.2
6.4
0.2
1.8
1.8
4.5
0.01
10.
041
0.47
47.
40.
025
TNF-
a (p
g/m
l)0.
111
.80.
10.
00.
116
.20.
406
0.16
10.
600
1.9
0.38
5
IL-1
0 (p
g/m
l)0.
10.
00.
10.
00.
120
.90.
862
0.15
80.
124
3.2
0.20
6
MM
P-13
(ng/
ml)
1.2
1.9
0.5
0.7
0.6
0.8
<0.0
010.
266
0.00
122
<0.0
01
CCL3
(pg/
ml)
268.
491
1.1
0.1
351.
651
4.8
1103
.30.
012
0.00
90.
743
8.6
0.01
4
CLU
STER
B
CCL4
(pg/
ml)
29.8
56.1
0.1
0.8
0.1
0.0
<0.0
010.
126
<0.0
0154
.3<0
.001
VEGF
-A (p
g/m
l)20
9.8
359.
623
9.2
257.
528
4.8
191.
10.
898
0.24
50.
304
1.6
0.44
8
PDGF
-BB
(pg/
ml)
2352
.011
28.9
1062
.529
9.7
1001
.433
2.0
<0.0
010.
124
<0.0
0139
.1<0
.001
CCL2
(pg/
ml)
428.
926
0.3
136.
514
5.0
113.
110
4.9
<0.0
010.
317
0.27
142
.9<0
.001
sVCA
M-1
(µg/
ml)*
1.2
0.4
0.5
0.2
0.5
0.2
<0.0
010.
926
<0.0
0156
.7<0
.001
CLU
STER
C
sICA
M-1
(ng/
ml)
457.
413
8.2
560.
935
2.7
525.
748
5.1
0.10
10.
920
0.30
42.
50.
283
Fibr
onec
tin (µ
g/m
l)*36
1.7
200.
564
7.2
184.
159
3.8
151.
3<0
.001
0.21
<0.0
0122
.8<0
.001
OTH
ERS
GDF-
15 (p
g/m
l)41
0.9
94.5
481.
225
3.0
416.
725
8.5
0.08
30.
155
0.94
63.
30.
188
TIE-
2 (n
g/m
l)7.
79.
70.
80.
70.
91.
2<0
.001
0.36
3<0
.001
44.3
<0.0
01
THBS
1 (µ
g/m
l)*10
.74.
811
.02.
710
.64.
30.
803
0.69
20.
919
0.1
0.93
6


Chapter 6
increased level of serum cytokines, chemokines and adipokines in patients with schizophrenia is associated with disease and metabolic syndrome
W. Beumer1, R.C. Drexhage1, H. De Wit1, M.A. Versnel1, H.A. Drexhage1, D. Cohen2
1 Department of Immunology, Erasmus MC, Rotterdam; 2 Department of Severe Mental Illness, Mental health Organization North-Holland North, Heerhugowaard, The Netherlands
Published in: Psychoneuroendocrinology. 2012 Dec;37(12):1901-11

116 | Chapter 6
ABstRACt
At present there are strong indications of a shared vulnerability factor for schizophrenia (SZ), diabetes and the metabolic syndrome (metS). In this study we focus on an aberrantly activated monocyte/macrophage system as the shared factor. We measured in SZ patients (n=144), the serum levels of monocyte/macrophage cytokines/chemokines/adipokines CCL2, CCL4, IL-1β, TNF-α, IL-6, PTX3, leptin, adiponectin, PAI-1, OPG and ICAM-1 and compared these levels to healthy controls (HC) (n=138). Using multivariate analysis, we studied the effect of the presence of the disease SZ, the components of the metS including BMI, the levels of lipids (HDL Cholesterol and triglycerides (TG)), diabetes (hyperglycemia) and the use of antipsychotic medication, on the serum levels of these immune compounds. We found all measured immune compounds with the exception of PAI-1 and OPG to be elevated in the SZ patient population. Multivariate analysis showed that elevations were linked to gender (ICAM-1, leptin, TNF-α and adiponectin), an increased BMI (leptin, adiponectin), hyperglycemia/diabetes (CCL4, and OPG), reduced HDL-cholesterol or increased levels of TG (adiponectin and PTX3) or the metS (CCL2, leptin and adiponectin). IL-1β and IL-6 were the only immune compounds raised in the serum of patients not affected by any of the included factors. Although many of the immune compounds were found linked to (components of) the metS, the most dominant linkage was found with the disease schizophrenia, confirming earlier reports on increased monocyte/macrophage activation as a key component for understanding the pathogenesis of schizophrenia.

Chapter
6
117Increased level of immune compounds in patients with schizophrenia |
intRoDuCtion
Increased prevalence of both components and the metS itself has been a systematic finding in metabolic research in SZ [1]. It is well-known that one year of antipsychotic drug treatment in the first episode of schizophrenia induces clinical relevant weight gain and rise of fasting plasma glucose levels [2]. In a cross-sectional study of 200 Caucasian patients with SZ or schizoaffective disorder (mean age 41 years) the prevalence of hyperglycemia was 7% and that of type 2 DM 14.5%, being significantly increased compared to the general population [3]. However, the development of diabetes was unrelated to duration of antipsychotic treatment or to a specific antipsychotic drug [4], suggesting that disease-related instead of treatment-related effects determined the higher risk for diabetes. Studies in drug-naïve SZ patients suggests that diabetes and the metS are linked to the to the disease state schizophrenia itself [5]. This direct linkage was already suggested in 1879 by Sir Maudsley in his paper ”Diabetes and Insanity” far before the era of antipsychotic medication, where he noted that diabetes was more prevalent in psychotic patients and their family members [6]. A more recent paper found increased diabetes prevalence and increased IL-6 blood concentrations in drug-naïve recent onset SZ patients, irrespective of BMI, gender, age and other confounding factors [7]. Presently there are strong indications that several vulnerability factors for schizophrenia, diabetes and the metS are shared [8,9] and possibly interlinked. We focus in this report on the contribution of an aberrantly activated monocyte/macrophage system. Evidence is accumulating that an aberrantly activated monocyte/macrophage system found in SZ patients is a key to the understanding of the disease. We previously reported on monocytosis and an up regulated inflammatory gene expression profile in circulating monocytes of SZ patients involving genes such as IL-1β, TNF-α, IL-6, PTX3, CCL2 and CCL4 [10]. Also increases in the serum concentrations of these cytokines and chemokines have been reported in SZ patients (data reviewed in [11]). It is thought that these excessively produced immune compounds destabilize the brain in such a way that other genetic and environmental influences are capable of precipitating the signs and symptoms of SZ [12,13]. Indeed, receptors for inflammatory cytokines are expressed in various brain nuclei [14] and via their triggering, deregulations of important neurotransmitter and neuro-developmental systems are introduced, facilitating the development of psychiatric signs and symptoms. Moreover, infusion with pro-inflammatory cytokines (such as IFN-α and TNF-α) are capable of inducing psychiatric symptoms [15,16]. Anti-inflammatory therapies, such as anti-TNF [17], COX-2 inhibitors [18-20], aspirin [21] and strong macrophage-dampening anti-oxidants, such as n-acetyl cysteine (NAC) [22,23], are capable of alleviating symptoms of depression and SZ. Furthermore, increased levels of the osteoclastogenesis factor OPG have been described in SZ patients [24]. OPG is a member of the tumor necrosis factor receptor family and known to act as a competitive decoy receptor for

118 | Chapter 6
RANKL preventing the genesis of the macrophages of the bone, the osteoclasts. Interestingly SZ patients also have a higher frequency of osteoporosis [25,26]. An aberrantly activated monocyte/macrophage system is also a key player in T2D and the metS. In T2D monocytes/macrophages are involved by excessively secreting inflammatory cytokines (such as CCL2 and TNF-α), which are capable of inducing insulin-resistance in muscle and liver cells [27,28]. In patients with obesity, macrophages in the white adipose tissue are in a chronic inflamed state and produce an array of (pro-inflammatory) cytokines including ICAM-1, CCL2, CCL4, IL-1β, TNF-α, IL-6, leptin, adiponectin, PAI-1 [29,30]. PAI-1 is considered to be an anti-fibrinolytic adipokine synthesized by macrophages in adipose tissue and the level of PAI-1 in serum is known to be increased in individuals with obesity [31]. Increased PAI-1 expression that accompanies abdominal obesity is the most well documented abnormality associated with the metS. Interestingly, we have found the PAI gene overexpressed in the monocytes of SZ patients [10]. With regard to dyslipidemia, reduced HDL levels are correlated to a high inflammatory set point of monocytes and macrophages [32]. The aim of this study was to investigate, using an array-based system, whether monocyte/macrophage related “inflammatory” cytokines/chemokines/adipokines were raised in the serum of SZ patients as compared to HC. We focused in particular on those compounds which have been described in the literature as abnormal or which we found previously as abnormally expressed in the monocytes of SZ and diabetes patients [10,33,34]. We therefore tested for the chemokines CCL2, CCL4, the cytokines IL-1β, TNF-α, IL-6, PTX3 OPG, the adipokines leptin, adiponectin and PAI-1 and the adhesion factor ICAM-1 and studied whether putative elevations in the serum of SZ patients were related to the disease, to the BMI, the levels of lipids (HDL, TG), diabetes (hyperglycemia) or the use of antipsychotic medication.
MAteRiALs AnD MethoDs
The study protocols for the inclusion of both the study patients’ samples and HC were reviewed and approved by two independent medical ethical review committees METIGG (Utrecht, The Netherlands) and Utrecht University respectively.
Patients with schizophreniaChronic stable SZ patients between the ages of 19 and 65 years, with minimum disease duration of 5 years, were recruited from the mental health care organizations Rijngeestgroep (Oegstgeest, Voorhout, and Noordwijkerhout), De Grote Rivieren (Dordrecht) and Anoiksis, the Dutch organization for patients with schizophrenia. Most participants of the study were recruited from the semirural part of the Dutch province Zuid-Holland.

Chapter
6
119Increased level of immune compounds in patients with schizophrenia |
After providing written informed consent, the M.I.N.I. Plus [35], a structured diagnostic interview for DSM-IV (Diagnostic and Statistical Manual of Mental Disorders, 4th edition) diagnosis [36], and the available medical records were used for a DSM-IV diagnosis of schizophrenia or schizoaffective disorder. The study design as well as the demographic data of the study population has been described before [3]. Patients were classified as on typical (n=39/144) and atypical (n=94/144) medication. The two treatment groups did not differ in age, BMI, or waist to-hip ratio. Although the group of SZ patients share a long history of antipsychotic medication use, a small subgroup (n=11) were currently drug-free. This subgroup did not use anti-psychotic medication for at least 3 months. The drug-free population had significantly lower BMI and higher HDL (Table S3). The demographic data for the SZ patients are listed in table 1.
healthy controlsHC (n=138) were laboratory staff, medical staff and medical students at the Erasmus MC. The inclusion criteria for HC were an absence of any major psychiatric disorder including schizophrenia, bipolar and major depressive disorder and an absent history of these disorders in first-degree family members. The HC had to be in good health and free of any diagnosed medical disorder or illness for at least 2 weeks before blood withdrawal. The demographic data for the HC are listed in Table 1.
Clinical variablesClinical variables including TG, HDL, mean fasting glucose levels were only determined in the SZ patient group. BMI was determined only in 43 of 144 HC. Overall, the HC were considered lean. The metabolic syndrome (metS) was defined according to a modified definition of the NCEP-ATP III [37]. Hyperglycemia was diagnosed when the mean fasting glucose plasma level was between 6.1 and 7.0 mmol/l, or when the oral glucose tolerance test (OGTT) plasma glucose levels at T=120 min were between 7.8 and <11.1 mmol/l. The glucose measurements were performed in the morning between 0900h and 1100h. In addition, we also determined the metS according to International Diabetes Federation guidelines [38], but this did not result in a change of the total number of SZ patients with metS.
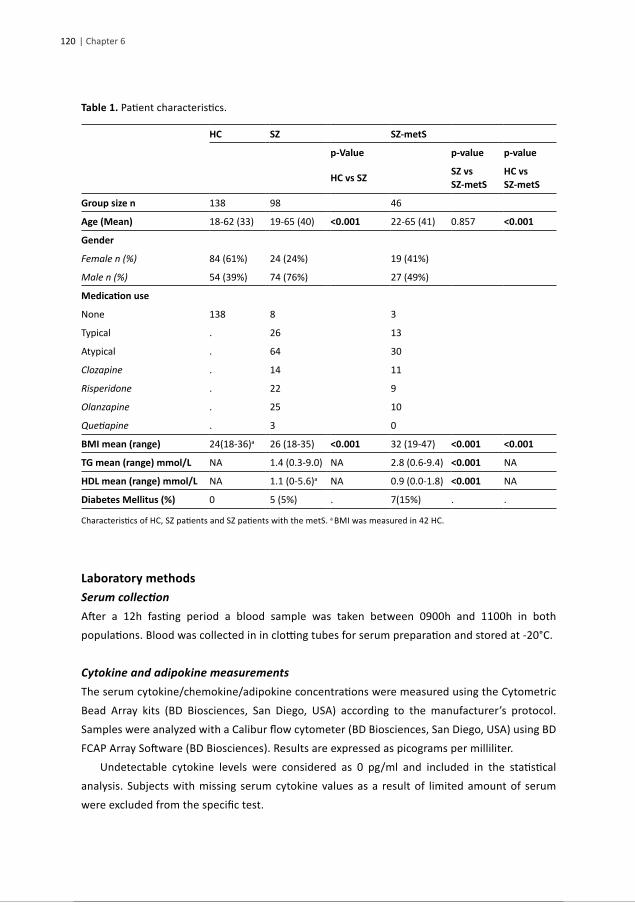
120 | Chapter 6
table 1. Patient characteristics.
hC sZ sZ-mets
p-Value p-value p-value
hC vs sZ sZ vs sZ-mets
hC vs sZ-mets
Group size n 138 98 46
Age (Mean) 18-62 (33) 19-65 (40) <0.001 22-65 (41) 0.857 <0.001
Gender
Female n (%) 84 (61%) 24 (24%) 19 (41%)
Male n (%) 54 (39%) 74 (76%) 27 (49%)
Medication use
None 138 8 3
Typical . 26 13
Atypical . 64 30
Clozapine . 14 11
Risperidone . 22 9
Olanzapine . 25 10
Quetiapine . 3 0
BMI mean (range) 24(18-36)a 26 (18-35) <0.001 32 (19-47) <0.001 <0.001
tG mean (range) mmol/L NA 1.4 (0.3-9.0) NA 2.8 (0.6-9.4) <0.001 NA
hDL mean (range) mmol/L NA 1.1 (0-5.6)a NA 0.9 (0.0-1.8) <0.001 NA
Diabetes Mellitus (%) 0 5 (5%) . 7(15%) . .
Characteristics of HC, SZ patients and SZ patients with the metS. a BMI was measured in 42 HC.
Laboratory methodsSerum collectionAfter a 12h fasting period a blood sample was taken between 0900h and 1100h in both populations. Blood was collected in in clotting tubes for serum preparation and stored at -20°C.
Cytokine and adipokine measurementsThe serum cytokine/chemokine/adipokine concentrations were measured using the Cytometric Bead Array kits (BD Biosciences, San Diego, USA) according to the manufacturer’s protocol. Samples were analyzed with a Calibur flow cytometer (BD Biosciences, San Diego, USA) using BD FCAP Array Software (BD Biosciences). Results are expressed as picograms per milliliter. Undetectable cytokine levels were considered as 0 pg/ml and included in the statistical analysis. Subjects with missing serum cytokine values as a result of limited amount of serum were excluded from the specific test.

Chapter
6
121Increased level of immune compounds in patients with schizophrenia |
StatisticsStatistical analysis was performed using the SPSS 20 (IBM, Inc.) package for Windows. Data were tested for normal distribution using the Kolmogorov-Smirnov test. Depending on the distribution pattern and the total number of subjects, parametric (normal distribution) or nonparametric group comparison (Mann-Whitney U and Kruskal-Wallis H tests) were applied. Correlations were determined by Spearman-correlation. The effect of components of the metS on the serum cytokine/chemokine/adipokine concentrations were determined by generalized linear models with bootstrapping to improve model fit. Levels of significance were set at p=0.05 (two-tailed). The specific tests and group size are mentioned in tables, footnotes and in figure legends. Graphs were designed with Graphpad Prism 5.04 (Graphpad Software, Inc) for windows.
ResuLts
We compared the serum cytokines/chemokines/adipokines concentrations between the study groups, i.e. HC, SZ patients with and without the metS. The studied serum proteins appeared not normally distributed according to the Kolmogorov-Smirnov test; therefore we used non-parametric tests for group comparison and correlation. According to the Kruskal-Wallis H test (Table 2) there are significant differences in serum levels between the study groups for CCL2, CCL4, IL-1β, TNF-α, IL-6, PTX3, leptin and adiponectin. There was a significant difference in age between the HC and SZ patient groups (Table 1, p<0.001). Generalized linear models applied to our data set demonstrated that age had a significant, but small effect on adiponectin serum concentrations in HC and SZ patients (Table S1, β=3.9). However, the regression coefficient of age was smaller than the beta of the disease presence (β=13.2), indicating that the effect of age on the adiponectin concentrations was smaller than the effect of disease. In addition, no significant correlation between age and the studied clinical variables was found by Spearman correlation (Table S2). Similarly, we studied the effect of gender on the serum protein concentrations with generalized linear models. A negative beta value corresponding to gender means an increase in cytokine/chemokine/adipokine concentration in males, whereas a positive beta corresponds to an increase of the specific immune compound in females. There was a significant effect of gender on ICAM-1, TNF-α, leptin and adiponectin (Table S1). Our finding of higher leptin concentration in the serum of females compared to males is supported by literature [39,40]. For ICAM-1 such literature data is not available. Only in the case of ICAM-1 and Leptin the effect of gender was larger than the disease presence and we therefore stratified ICAM-1 and leptin into male and female groups. For each of the immune compounds the individual study groups were thereafter compared using Mann-Whitney U tests. Group size, median, interquartile range (IQR) and p-values are summarized in Table 2.

122 | Chapter 6
tabl
e 2.
Cyt
okin
es/c
hem
okin
es/a
dipo
kine
s in
HC,
SZ
and
SZ-m
etS
patie
nts.
hCsZ
sZ-m
ets
Krus
kal-W
allis
h
nM
edia
n(IQ
R)n
Med
ian(
IQR)
P-va
lue
(hC
vs s
Z)n
Med
ian(
IQR)
P-va
lue
(hC
vs s
Z-m
ets)
P-va
lue
(sZ
vs s
Z-M
ets)
hP-
valu
e
CCL2
8914
9.5
(83.
2)98
179.
0 (1
10.8
)<0
.001
4622
1.9
(228
.8)
<0.0
010.
017
28.3
< 0.
001
CCL4
9355
.6 (3
3.2)
8779
.7 (3
8.0)
<0.0
0136
93.7
(49.
0)<0
.001
0.07
42.0
< 0.
001
IL-1
β89
0.0
(11)
949.
3 (1
4.8)
<0.0
0144
11.3
(12.
8)<0
.001
0.82
424
.8<
0.00
1
TNF-
α83
0.0
(22.
2)89
24.0
(65.
4)<0
.001
4122
.2 (3
1.8)
0.00
50.
323
18.6
< 0.
001
IL-6
830.
0 (3
8.9)
8931
.9 (6
4.2)
0.00
138
40.8
(56.
3)0.
002
0.86
214
.90.
001
PTX3
9621
3.6
(524
.0)
9843
0.4
(523
.0)
<0.0
0145
388.
2 (5
04.1
)0.
001
0.99
20.0
< 0.
001
Lepti
n
fem
ale
480.
0 (2
3.2)
2080
.5 (9
5.2)
<0.0
0113
98.7
(120
.2)
<0.0
010.
169
40.0
< 0.
001
mal
e36
0.0
(0.0
)67
0.0
(0.0
)0.
129
230.
0 (6
6.9)
<0.0
01<0
.001
21.7
< 0.
001
Adip
onec
tin93
75.4
(32.
4)87
90.6
(26.
4)<0
.001
3610
9.7
(37.
1)<0
.001
<0.0
0145
.90.
001
PAI-1
939.
7 (2
.6)
879.
8 (2
.2)
0.78
336
9.8
(2.4
)0.
850.
962
0.9
0.06
3
OPG
9379
.4 (5
4.66
)87
87.0
(39.
2)0.
334
3689
.0 (3
2.5)
0.01
70.
125
5.5
0.95
8
ICAM
-1
fem
ale
4837
2.7
(486
.4)
2059
2.2
(699
.5)
0.02
613
545.
9 (7
26.7
)0.
149
0.62
45.
80.
054
mal
e36
501.
9 (3
60.6
)67
656.
8 (4
69.3
)0.
136
2366
1.0
(546
.3)
0.03
60.
456
4.3
0.11
8
Gro
up s
ize, m
edia
n w
ith IQ
R, p
-val
ues
obta
ined
by
Man
n-W
hitn
ey U
test
and
Kru
skal
-Wal
lis te
st. P
-val
ues
in b
old
deno
te s
igni
fican
t diff
eren
ces
betw
een
grou
ps a
fter B
onfe
rron
i cor
recti
on fo
r 3
grou
ps. S
imila
r ana
lysi
s ex
clud
ing
the
11 c
urre
nt d
rug-
free
pati
ents
is s
how
n in
tabl
e S4
.

Chapter
6
123Increased level of immune compounds in patients with schizophrenia |
CCL2 and CCL4We found a significant increase of CCL2 (Figure 1A) and CCL4 (Figure 1B) in the serum of SZ patients without the metS as compared to HC (p<0.001 for both chemokines), indicating a significant effect of disease on these chemokines. SZ patients with the metS had an even more and significantly raised serum level (p=0.017) of CCL2 in comparison to the serum levels found in patients without the metS. For CCL4 there was also such increase, but this did not reach statistical significance in comparison to the patients without the metS. Outcomes of the generalized linear model showed that none of the components of the metS did have a significant effect on the CCL2 levels. There was a significant effect of a disturbed OGTT on the CCL4 serum concentration in the SZ patient group (Table 3; βOGTT=28.4, p=0.035) and we therefore checked whether there was a correlation between the CCL4 serum concentrations and fasting glucose serum levels (Spearman correlation). There was no such correlation (Rs=0.215, p=0.017).
Figure 1. A. CCL2 and B. CCL4 serum concentrations. Dots depict individual study subjects, the line represents the median and the whiskers depict the interquartile range (summarized in Table 2). P-values were obtained by Mann-Whitney U tests *p<0.05, ***p<0.001.
IL-1β, TNF-α, IL-6 and PTX3We measured significant rises in the serum levels of IL-1β (Figure 2A: p<0.001), TNF-α (Figure 2B; p<0.001), IL-6 (Figure 2C; p=0.001) and PTX3 (figure 2D; p<0.001) in SZ patients without the metS in comparison to the HC. The presence of the metS and its components in SZ patients had no further effect on the raised serum levels of IL-1β, TNF-α and IL-6. Decreased HDL had a significant effect on the serum concentration of PTX3 (Table 3: βHDL=-78.6, p=0.05).

124 | Chapter 6
Figure 2. A. IL-1β, B. TNF-α, C. IL-6 and D. PTX3 serum concentrations. Dots depict individual study subjects, the line represents the median and the whiskers depict the interquartile range (summarized in Table 2). P-values were obtained by Mann-Whitney U tests **P<0.01, ***p<0.001.
LeptinFemales with SZ (without the metS) had a significantly higher level of leptin as compared to female HC (Figure 3A: p<0.001). This increase was not present in male patients, indicating that a disease effect was only noticeable in the female gender. For both genders the additional presence of the metS resulted in higher leptin levels, but values only reached statistical significance for males (p<0.001). Gender and BMI appeared to be components of the metS showing the strongest effect on the serum leptin levels (table 3: βgender=73.4, p=0.001; βBMI=31.1, p=0.003).
AdiponectinWe found a significant increase in adiponectin levels in the serum of SZ patients without the metS as compared to HC (Figure 3B; p<0.001), indicating an effect of presence of SZ on the expression of this adipokine in serum. SZ patients with the metS had an even more and statistically raised serum level of adiponectin in comparison to patients without the metS. Gender, BMI and TG had the strongest effect on adiponectin serum levels (Table 3: βgender=-9.4, p=0.049; βBMI=8.7, p=0.001; βTG=6.3, p=0.020).
PAI-1There was no increase of PAI-1 in the serum of SZ patients compared to HC irrespective of the absence or presence of the metS (Figure 3C). In addition, we did not find any effect of the components of the metS on serum PAI-1 levels (Table 3).
OPGWe did not find differences in OPG serum levels between HC and SZ patients. However, we did find a significant difference between HC and SZ patients with the metS (Figure 4A: p=0.017) There was an effect noticeable of a disturbed OGTT on OPG levels (table 3: βOGTT=46.9, p=0.001).

Chapter
6
125Increased level of immune compounds in patients with schizophrenia |
Figure 3. A. Leptin, B. Adiponectin and C. PAI-1 serum concentrations. Dots depict individual study subjects, the line represents the median and the whiskers depict the interquartile range (summarized in table 2). P-values were obtained by Mann-Whitney U tests ***p<0.001.
ICAM-1Females with SZ and without the metS had a higher level of serum ICAM-1 as compared to female HC (p=0.026). There was no difference between the ICAM-1 levels in males, indicating that a small disease effect was only noticeable in the female gender (Figure 4B). For both genders the additional presence of the metS and its components (Table 3) did not have any effect on ICAM-1 levels.
Figure 4. A. OPG, B. ICAM-1 serum concentrations. Dots depict individual study subjects, the line represents the median and the whiskers depict the interquartile range (summarized in Table 2). P-values were obtained by Mann-Whitney U tests *p<0.05.

126 | Chapter 6
tabl
e 3.
Effe
ct o
f com
pone
nts
of th
e m
etS
on s
erum
cyt
okin
es/c
hem
okin
es/a
dipo
kine
s in
SZ
patie
nts.
G
ende
rAg
eaBM
IahD
LaTG
aO
GTT
Be
ta(9
5% C
I)Be
ta(9
5% C
I)Be
ta(9
5% C
I)Be
ta(9
5% C
I)Be
ta(9
5% C
I)Be
ta(9
5% C
I)
CCL2
(n=1
43)
-3.8
(-53.
5,56
.4)
-13.
4(-3
5.6,
9.9)
15.1
(-18.
2,44
.8)
-15.
2(-7
0.4,
-1.2
)-1
8.5(
-40.
3,7.
8)48
.9(-3
0.8,
142.
1)
CCL4
(n=1
22)
-14.
9(-3
0,0,
2.4)
-1.6
(-10.
6,8.
9)2.
7(-7
.0,1
2.3)
-5.3
(-22.
1,3.
7)0.
5(-8
.6,1
1.9)
28.4
(-4.1
,52.
4)*
IL-1
β (n
=137
)-3
.3(-7
.5,1
.5)
0.8(
-1.3
,3.0
)2.
0(-0
.9,4
.8)
-0.3
(-6.9
,1.1
)-1
.4(-4
.4,0
.2)
0.7(
-4.9
,6.7
)
TNF-
α (n
=129
)-2
3.4(
-39.
6,-5
.5)*
2.3(
-6.4
,11.
7)7.
9(-3
.9,1
9.8)
1.5(
-19.
5,6.
8)-6
.9(-1
9.6,
0.6)
-1.7
(-26.
2,21
.1)
IL-6
(n=1
26)
-15.
7(-4
8.9,
11.4
)2.
9(-6
.5,1
2.8)
13.2
(-2.1
,35.
1)0.
3(-1
7.0,
9.3)
-7.3
(-26.
1,3.
3)-1
2.7(
-43.
5,11
.0)
PTX3
(n=1
42)
73.3
(-104
.8,2
92.0
)-8
.1(-7
9.8,
75.8
)-9
.8(-1
12.9
,95.
3)-7
8.4(
-266
.1,-3
8.8)
*-1
7.9(
-103
.6,4
5.0)
-38.
9(-2
40.4
,146
.6)
Lepti
n (n
=122
)74
.3(4
7.1,
103.
2)**
-7.1
(-19.
1,3.
5)31
.3(1
2.5,
47.6
)*-0
.9(-1
8.1,
17.2
)-8
.3(-1
8.8,
2.1)
35.4
(6.6
,75.
4)
Adip
onec
tin (n
=122
)-9
.4(-1
8.4,
-0.5
)*-1
.9(-5
.7,2
.6)
8.7(
2.9,
13.4
)**
-1.9
(-15.
3,0.
4)6.
3(0.
9,12
.8)*
7.8(
-19.
6,3.
4)
PAI-1
(n=1
22)
-0.5
(-1.3
,0.4
)-0
.0(-0
.4,0
.4)
0.4(
0.1,
0.8)
0.1(
-0.7
,0.3
)0.
2(-0
.1,0
.5)
-0.3
(-1.3
,0.7
)
OPG
(n=1
22)
13.6
(-8.6
,36)
-0.1
(-10.
5,10
.5)
7.7(
-6.7
,21.
9)-1
.2(-2
5.4,
8.9)
2.8(
-8.4
,13.
3)46
.9(2
1.6,
76.3
)**
ICAM
-1 (n
=122
)-2
34.7
(-434
.4,-1
3.6)
*-4
1.4(
-150
.3,6
8.6)
-65.
7(-1
95.0
,59.
9)-7
4.4(
-355
.0,-2
0.2)
-25.
7(-1
43.5
,41.
6)22
1.5(
530.
9,10
1.7)
Gen
eral
ized
linea
r mod
el to
iden
tify
the
effec
t of g
ende
r, ag
e an
d co
mpo
nent
s of t
he m
etS
on th
e se
rum
cyt
okin
e/ch
emok
ine/
adip
okin
e co
ncen
trati
ons w
ithin
the
SZ p
atien
t gro
up. A
neg
ative
be
ta v
alue
cor
resp
ondi
ng to
gen
der
mea
ns a
n in
crea
se in
cyt
okin
e/ch
emok
ine/
adip
okin
e co
ncen
trati
on in
mal
es, w
here
as a
pos
itive
bet
a co
rres
pond
s to
an
incr
ease
of t
he s
peci
fic im
mun
e co
mpo
und
in fe
mal
es. S
imila
r ana
lysi
s ex
clud
ing
the
11 c
urre
nt d
rug-
free
pati
ents
is s
how
n in
tabl
e S5
. P-v
alue
s ar
e de
pict
ed a
s: *
p<0.
05, *
*p<0
.01.
a Ag
e, B
MI,
HDL
and
TG
wer
e st
anda
rdize
d as
z-s
core
s to
cor
rect
for t
he e
ffect
size
of e
ach
cofa
ctor
.

Chapter
6
127Increased level of immune compounds in patients with schizophrenia |
effect of antipsychotic medicationWe studied the effect of antipsychotic medication use (users vs. currently 11 non-users) as well as the type of antipsychotic medication (as summarized in Table 1) on the serum cytokine/chemokine/adipokine levels and did notfind a correlation with the measured levels (Table S3). The use of antipsychotic medication did correlate weakly, but significantly with HDL (Rs=-0.174, p=0.03) and the BMI (Rs=0.209, p=0.012). Omission of the 11 drug-free cases (Table S4) from the statistical analysis did not change the outcome of the study group comparison shown in table 3. Furthermore, generalized linear models to study the effect of the components of the metS on the serum cytokine/chemokine/adipokine levels did not reveal any major changes when removing the 11 drug-free patients from the analysis (Table S5). However, the effect of HDL levels on PTX3 serum levels, the effect of TG on serum adiponectin levels and the effect of a positive outcome of the OGTT on CCL4 lost significance. Since the use of antipsychotic medication resulted in a higher BMI (Table S3, p=0.012) and a reduced HDL (Table S3, p=0.039) in our series, the omission of the drug-free patients (and thus of the leanest patients with the most favorable lipid spectrum) might have influenced indirectly the loss of correlation between the lipid levels/OGTT on PTX3, adiponectin and CCL4 levels. Since it has been found that clozapine treatment increases serum IL-6 concentrations [41] and since clozapine mobilized CD34 progenitor cells [42], we tested for clozapine correlation separately in our group of SZ patients. A considerable proportion of SZ patients in this study were taking clozapine (n=25). Spearman correlation indicated that the use of clozapine did not correlate with any of the serum cytokine/chemokine/adipokine levels (Table S6). In addition no differences in serum cytokine/chemokine/adipokine levels between clozapine users and users of other anti-psychotic medication were detected (Table S7).
DisCussion
Although many studies report increased serum levels of monocyte/macrophage related cytokines IL-1β, IL-6, TNF-α in SZ patients [10], the majority of studies did not take confounders such as age, gender, BMI, medication and presence of the metS into account. This study shows an elevation of the monocyte/macrophage cytokines IL-1β, TNF-α, IL-6, PTX3, the chemokines CCL2 and CCL4 and the adipokines leptin and adiponectin in the serum of patients with chronic schizophrenia (for synopsis of findings see table 4). Multivariate analysis showed that these elevations were linked to both the disease state itself as well as to confounders such as gender (ICAM-1, leptin, TNF-α and adiponectin), a high BMI (leptin, adiponectin), hyperglycemia (CCL4 and to some extent OPG), reduced levels of HDL/high levels of TG (adiponectin and PTX3) and/or the presence of metS in general (CCL2, leptin and adiponectin).

128 | Chapter 6
IL-1β and IL-6 were the only cytokines raised in the serum of SZ patients not affected by any of the here studied confounding factors.
table 4. Results synopsis.
Disease Age Gender mets BMI TG hDL OGTT
Chemokines
CCL2 +++ . . + . . . .
CCL4 +++ . . . . . . ++
Pro-inflammatory cytokines
IL-1β +++ . . . . . . .
TNF-α +++ . + (♂) . . . . .
IL-6 ++ . . . . . . .
PTX3 +++ . . . . . + .
Adipokines
Leptin +++ (♀) . +++ (♀) ++ (♂) + . . .
Adiponectin +++ . + (♂) +++ ++ + . .
PAI-1 . . . . . . . .
OPG (+)b . . . . . . ++
Adhesion factor
ICAM-1 (+)a (♀) . +++ (♂) . . . . .
Synopsis of results obtained from the statistical models. + represent the effect of each component on the serum cytokine/chemokine/adipokine concentration. (♀): effect in females, (♂) effect in males. a Not significant after Bonferroni correction. b Significant difference in OPG serum concentration between HC and SZ patients suffering from the metS.
PAI-1 was not raised in the serum of chronic schizophrenia patients. Carrizo et al. did not find significant differences in serum PAI-1 levels between SZ patients and their healthy relatives [43]; however, they did find a strong correlation of PAI-1 levels and BMI and antipsychotic medication use, something we did not find. OPG was slightly elevated in SZ patients, but only the difference between HC and SZ-metS was significant and a prime role for hyperglycemia in this subgroup of patients is likely (Table 3 and 4) [24] did find increased OPG levels in SZ patients, but these authors did not take the presence of the metS into account (Hope et al., 2010). Monocyte migration into the tissues is – besides on the action of chemokines – also dependent on the action of integrins and the ICAM-1 system is important in this. The concentration of the adhesion molecule ICAM-1 was elevated in SZ patients, but with only a p-value of 0.026 and linked to gender. It is questionable whether we should apply Bonferroni testing on this limited array of cytokines/chemokines/adipokines/ adhesion factors studied here (in particular since we focused on monocyte/ macrophage compounds from a hypothesis-driven approach), but in

Chapter
6
129Increased level of immune compounds in patients with schizophrenia |
doing so the significance for ICAM-1 levels was lost (see legend Table 2, not for the other studied compounds). Despite the questionable significance for the rise in ICAM-1, it is in line with results from a previous study [44], where also increased ICAM-1 levels were detected in SZ patients. However elevations in ICAM-1 were found in that study in medicated patients, while drug-naïve patients did not show such increase. Therefore the authors suggested that the anti-psychotic medication was responsible for the rise in serum ICAM-1 levels. Only a small group of our SZ patients (n=11/144) did not use antipsychotic medication at the time of serum collection, but they had used such medication in the past. Although we did not find any difference in serum levels of the immune compounds in this study between medicated versus currently-non-medicated chronic SZ patients (including clozapine), it is possible that long term medication in the presently 11 drug-free patients may have had a long lasting stimulating influence on the immune system being responsible for a long-lasting rise in the level of the immune compounds. It must be noted however, that antipsychotic medication, has in general an immune suppressive effect [45], confirmed by a meta-analysis of [46], who found significantly decreased IL-1β and IL-6 levels after initiation of antipsychotic treatment. Suffice to say that more in depth studies on the effects of anti-psychotic medication on the levels of the here reported cytokines/chemokines/adhesion molecules is indicated. Our study has several limitations. First, the drug-free group of patients is of insufficient size and insufficient length of – drug-free – time. Secondly, the HC group composed of laboratory and hospital staff was not only younger than the SZ patients and had a lower BMI than the SZ patients, but maybe even more important, they had a higher socioeconomic status (SES) than the SZ patients. Because of the normal BMI, we assume that these healthy hospital and medical faculty staff were not or hardly suffering from the metS, though exact data are not available on the HDL, TG and OGTT values in the healthy control group. In comparison to the levels found in this HC group, the levels CCL4, IL-1β, TNF-α, IL-6, PTX3, leptin (females) and adiponectin were significantly raised in the serum of SZ patients without the metS. If the prevalence of the metS in our healthy controls would have been considerable and would have had an impact, it would have bIurred the difference between the two groups (since the metS has an increasing effect on the cytokine/chemokine/adipokine levels). We are therefore confident that our data strongly suggest that the higher expression of CCL4, IL-1β, TNF-α, IL-6, PTX3, leptin and adiponectin are linked to the disease state of SZ itself and not to the presence of the metS. A low SES was found to be correlated to higher levels of circulating inflammatory markers including IL-6 and TNF-α [47]. However, strong association of smoking, drinking, less exercise and obesity with low SES might explain this increase in inflammatory makers. Schizophrenia is associated with a greater probability of ever daily smoking compared to other mood disorders and the general population [48]. Tobacco smoking leads to increased IL-6 levels in the serum; decreased TNF-α however, was found to be associated with smoking in females only [49].

130 | Chapter 6
Suffice to say, that our data should be verified in new cohorts with healthy controls matched for age, gender, signs and symptoms of the metabolic syndrome, smoking habits and particularly socioeconomic status. In a previous study of serum cytokine levels, using the same assay, but in younger (mean age 24) psychotic recent-onset SZ patients with a treatment duration under 3 months, the levels of CCL2, IL-1β, TNF-α, IL-6 and PTX3 were found to be normal [50]. However, we did find in this young group of SZ patients an up regulation in the circulating monocytes for CCL2, IL-1β, TNF-α, IL-6 and PTX3 mRNA and we then argued that there must be a control over the excessively up regulated monocyte genes not to result in excessive protein production. The present data suggest that during the development of the disease to the chronic phase, these control factors are lost. However our data did not clearly indicate which conditions were responsible for breaking control, since the presence of the metS did not influence the expression of the studied cytokines apart from that of CCL2, Leptin (in males) and adiponectin. It might be that the cumulative treatment with antipsychotic medication resulting in obesity (this report confirmed the correlation of antipsychotic medication with the BMI) has an indirect increasing effect on serum cytokine levels; macrophages in fat are producers of (pro-inflammatory) cytokines including ICAM-1, CCL2, CCL4, IL-1β, TNF-α, IL-6 and adipokines leptin, adiponectin and PAI-1 [29,30]. However, we were unable to find an effect of increased BMI on the serum levels of the mentioned cytokines (Table 3). Also in a separately small series study of morbid obese non-SZ patients, we could not find higher serum levels of the above mentioned inflammatory cytokines in comparison to lean controls [51]. The diabetes found in antipsychotic treated SZ patients has three outstanding characteristics. First it occurs at a younger age [1,4]. Second, it might develop into a diabetic form of ketoacidosis (DKA) or a hyperglycemic hyperosmolar state (HHS) [52-55]. Third, the increased incidence of DKA/HHS notwithstanding, no indications of autoimmune origin were found: antibodies and antibodies to GAD65 are not present in SZ patients with diabetes [56]. Although we did not find a direct correlation between CCL4 serum levels and fasting glucose or glucose levels after the OGTT, we did find a small, but significant effect of CCL4 levels on the outcome of the OGTT, indicating that the increase of CCL4 is linked to the presence of impaired glucose tolerance or (pre)-diabetes in SZ patients. In addition, CCL4 was encountered as a predominant T2D-expressed monocyte gene of T2D patients in a preliminary set of gene-finding experiments in monocytes of T2D patients (unpublished data). Collectively these data support a view that CCL4 is an important gene in both SZ and T2D. In conclusion, chronic schizophrenia patients clearly show an activated monocyte/macrophage system as evidenced by raised serum levels of the chemokines CCL2 and CCL4, the cytokines IL-1β, TNF-α, IL-6 and PTX3, the adipokines leptin and adiponectin. Although many of these immune compounds were found linked to gender, the metS and hyperglycemia/diabetes, the most dominant linkage was found with the disease state of schizophrenia itself supporting our earlier expressed view (studying psychotic patients with recent onset schizophrenia) that

Chapter
6
131Increased level of immune compounds in patients with schizophrenia |
immune system activation is a key to understand the pathogenesis of schizophrenia [50]. These findings support the rational for an (add-on) anti-inflammatory treatment in patients with chronic SZ.
AcknowledgementsWe thank Gerard Borsboom, Caspar Looman and Zana Brkic for statistical advice.

132 | Chapter 6
ReFeRenCes
1. De Hert, M., et al., Prevalence of diabetes, metabolic syndrome and metabolic abnormalities in schizophrenia over the course of the illness: a cross-sectional study. Clin Pract Epidemiol Ment Health, 2006. 2: p. 14.
2. Kahn, R.S., et al., Effectiveness of antipsychotic drugs in first-episode schizophrenia and schizophreniform disorder: an open randomised clinical trial. Lancet, 2008. 371(9618): p. 1085-97.
3. Cohen, D., et al., Hyperglycemia and diabetes in patients with schizophrenia or schizoaffective disorders. Diabetes Care, 2006. 29(4): p. 786-91.
4. Cohen, D., et al., Prevalence of diabetes mellitus in chronic schizophrenic inpatients in relation to long-term antipsychotic treatment. Eur Neuropsychopharmacol, 2006. 16(3): p. 187-94.
5. Ryan, M.C.M., P. Collins, and J.H. Thakore, Impaired Fasting Glucose Tolerance in First-Episode, Drug-Naive Patients With Schizophrenia. Am J Psychiatry, 2003. 160(2): p. 284-289.
6. Maudsley, H., The pathology of mind. 3rd ed. 1879, London: Macmillan and Co. x, 580 p.7. Fernandez-Egea, E., et al., Metabolic profile of antipsychotic-naive individuals with non-affective
psychosis. Br J Psychiatry, 2009. 194(5): p. 434-8.8. Mitchell, A.J. and D. Malone, Physical health and schizophrenia. Curr Opin Psychiatry, 2006. 19(4): p.
432-7.9. De Hert, M., et al., Physical illness in patients with severe mental disorders. II. Barriers to care,
monitoring and treatment guidelines, plus recommendations at the system and individual level. World Psychiatry, 2011. 10(2): p. 138-51.
10. Drexhage, R.C., et al., Inflammatory gene expression in monocytes of patients with schizophrenia: overlap and difference with bipolar disorder. A study in naturalistically treated patients. Int J Neuropsychopharmacol, 2010: p. 1-13.
11. Drexhage, R.C., et al., The mononuclear phagocyte system and its cytokine inflammatory networks in schizophrenia and bipolar disorder. Expert Rev Neurother, 2010. 10(1): p. 59-76.
12. Smith, R.S., A comprehensive macrophage-T-lymphocyte theory of schizophrenia. Med Hypotheses, 1992. 39(3): p. 248-57.
13. Smith, R.S. and M. Maes, The macrophage-T-lymphocyte theory of schizophrenia: additional evidence. Med Hypotheses, 1995. 45(2): p. 135-41.
14. Silberstein, S., et al., Immunology, signal transduction, and behavior in hypothalamic-pituitary-adrenal axis-related genetic mouse models. Ann N Y Acad Sci, 2009. 1153: p. 120-30.
15. Keefe, B., Interferon-induced depression in hepatitis C: an update. Curr Psychiatry Rep, 2007. 9(3): p. 255-61.
16. Khairova, R.A., et al., A potential role for pro-inflammatory cytokines in regulating synaptic plasticity in major depressive disorder. Int J Neuropsychopharmacol, 2009. 12(4): p. 561-78.
17. Soczynska, J.K., et al., The effect of tumor necrosis factor antagonists on mood and mental health-associated quality of life: novel hypothesis-driven treatments for bipolar depression? Neurotoxicology, 2009. 30(4): p. 497-521.
18. Akhondzadeh, S., et al., Celecoxib as adjunctive therapy in schizophrenia: a double-blind, randomized and placebo-controlled trial. Schizophr Res, 2007. 90(1-3): p. 179-85.
19. Muller, N., et al., Celecoxib treatment in an early stage of schizophrenia: results of a randomized, double-blind, placebo-controlled trial of celecoxib augmentation of amisulpride treatment. Schizophr Res, 2010. 121(1-3): p. 118-24.
20. Muller, N., et al., Beneficial antipsychotic effects of celecoxib add-on therapy compared to risperidone alone in schizophrenia. Am J Psychiatry, 2002. 159(6): p. 1029-34.
21. Laan, W., et al., Adjuvant aspirin therapy reduces symptoms of schizophrenia spectrum disorders: results from a randomized, double-blind, placebo-controlled trial. J Clin Psychiatry, 2010. 71(5): p. 520-7.

Chapter
6
133Increased level of immune compounds in patients with schizophrenia |
22. Dean, O., F. Giorlando, and M. Berk, N-acetylcysteine in psychiatry: current therapeutic evidence and potential mechanisms of action. J Psychiatry Neurosci, 2011. 36(2): p. 78-86.
23. Dodd, S., et al., N-acetylcysteine for antioxidant therapy: pharmacology and clinical utility. Expert Opin Biol Ther, 2008. 8(12): p. 1955-62.
24. Hope, S., et al., Osteoprotegerin levels in patients with severe mental disorders. J Psychiatry Neurosci, 2010. 35(5): p. 304-10.
25. Meyer, J.M. and D. Lehman, Bone mineral density in male schizophrenia patients: a review. Ann Clin Psychiatry, 2006. 18(1): p. 43-8.
26. Hummer, M., et al., Osteoporosis in patients with schizophrenia. Am J Psychiatry, 2005. 162(1): p. 162-7.
27. Drexhage, R.C., et al., Patients with schizophrenia show raised serum levels of the pro-inflammatory chemokine CCL2: association with the metabolic syndrome in patients? Schizophr Res, 2008. 102(1-3): p. 352-5.
28. Kamei, N., et al., Overexpression of Monocyte Chemoattractant Protein-1 in Adipose Tissues Causes Macrophage Recruitment and Insulin Resistance. Journal of Biological Chemistry, 2006. 281(36): p. 26602-26614.
29. Weisberg, S.P., et al., Obesity is associated with macrophage accumulation in adipose tissue. J Clin Invest, 2003. 112(12): p. 1796-808.
30. Xu, H., et al., Chronic inflammation in fat plays a crucial role in the development of obesity-related insulin resistance. J Clin Invest, 2003. 112(12): p. 1821-30.
31. De Taeye, B., L.H. Smith, and D.E. Vaughan, Plasminogen activator inhibitor-1: a common denominator in obesity, diabetes and cardiovascular disease. Curr Opin Pharmacol, 2005. 5(2): p. 149-54.
32. Sarov-Blat, L., et al., Predominance of a proinflammatory phenotype in monocyte-derived macrophages from subjects with low plasma HDL-cholesterol. Arterioscler Thromb Vasc Biol, 2007. 27(5): p. 1115-22.
33. Padmos, R.C., et al., A discriminating messenger RNA signature for bipolar disorder formed by an aberrant expression of inflammatory genes in monocytes. Arch Gen Psychiatry, 2008. 65(4): p. 395-407.
34. Padmos, R.C., et al., Distinct monocyte gene-expression profiles in autoimmune diabetes. Diabetes, 2008. 57(10): p. 2768-73.
35. Sheehan, D.V., et al., The Mini-International Neuropsychiatric Interview (M.I.N.I.): the development and validation of a structured diagnostic psychiatric interview for DSM-IV and ICD-10. J Clin Psychiatry, 1998. 59 suppl 20: p. 22-33;quiz 34-57.
36. American Psychiatric Association., Diagnostic criteria from DSM-IV-TR. 2000, Washington, D.C.: American Psychiatric Association. xii, 370 p.
37. National Cholesterol Education Program (U.S.). Expert Panel on Detection Evaluation and Treatment of High Blood Cholesterol in Adults., Third report of the National Cholesterol Education Program (NCEP) Expert Panel on Detection, Evaluation, and Treatment of High Blood Cholesterol in Adults (adult treatment panel III): final report. NIH publication. 2002, Washington, D.C.: The Program.
38. Alberti, K.G., P. Zimmet, and J. Shaw, The metabolic syndrome--a new worldwide definition. Lancet, 2005. 366(9491): p. 1059-62.
39. Rosenbaum, M., et al., Effects of gender, body composition, and menopause on plasma concentrations of leptin. J Clin Endocrinol Metab, 1996. 81(9): p. 3424-7.
40. Saad, M.F., et al., Sexual dimorphism in plasma leptin concentration. J Clin Endocrinol Metab, 1997. 82(2): p. 579-84.
41. Maes, M., et al., In vivo immunomodulatory effects of clozapine in schizophrenia. Schizophr Res, 1997. 26(2-3): p. 221-5.
42. Loffler, S., et al., Clozapine mobilizes CD34+ hematopoietic stem and progenitor cells and increases plasma concentration of interleukin 6 in patients with schizophrenia. J Clin Psychopharmacol, 2010. 30(5): p. 591-5.

134 | Chapter 6
43. Carrizo, E., et al., Coagulation and inflammation markers during atypical or typical antipsychotic treatment in schizophrenia patients and drug-free first-degree relatives. Schizophr Res, 2008. 103(1-3): p. 83-93.
44. Schwarz, M.J., et al., Decreased levels of soluble intercellular adhesion molecule-1 (sICAM-1) in unmedicated and medicated schizophrenic patients. Biol Psychiatry, 2000. 47(1): p. 29-33.
45. Janssen, D.G., et al., A psychoneuroimmunological review on cytokines involved in antidepressant treatment response. Hum Psychopharmacol, 2010. 25(3): p. 201-15.
46. Miller, B.J., et al., Meta-analysis of cytokine alterations in schizophrenia: clinical status and antipsychotic effects. Biol Psychiatry, 2011. 70(7): p. 663-71.
47. O’Connor, M.F., et al., To assess, to control, to exclude: effects of biobehavioral factors on circulating inflammatory markers. Brain Behav Immun, 2009. 23(7): p. 887-97.
48. de Leon, J., et al., Initiation of daily smoking and nicotine dependence in schizophrenia and mood disorders. Schizophr Res, 2002. 56(1-2): p. 47-54.
49. Haddy, N., et al., Biological variations, genetic polymorphisms and familial resemblance of TNF-alpha and IL-6 concentrations: STANISLAS cohort. Eur J Hum Genet, 2005. 13(1): p. 109-17.
50. Drexhage, R.C., et al., An activated set point of T-cell and monocyte inflammatory networks in recent-onset schizophrenia patients involves both pro- and anti-inflammatory forces. Int J Neuropsychopharmacol, 2011. 14(6): p. 746-55.
51. van der Weerd, K., et al., Morbidly obese human subjects have increased peripheral blood CD4+ T cells with skewing toward a Treg- and Th2-dominated phenotype. Diabetes, 2012. 61(2): p. 401-8.
52. Koller, E.A. and P.M. Doraiswamy, Olanzapine-associated diabetes mellitus. Pharmacotherapy, 2002. 22(7): p. 841-52.
53. Koller, E., et al., Clozapine-associated diabetes. Am J Med, 2001. 111(9): p. 716-23.54. Koller, E.A., et al., Risperidone-associated diabetes mellitus: a pharmacovigilance study.
Pharmacotherapy, 2003. 23(6): p. 735-44.55. Koller, E.A., et al., A survey of reports of quetiapine-associated hyperglycemia and diabetes mellitus. J
Clin Psychiatry, 2004. 65(6): p. 857-63.56. Cohen, D., M.R. Batstra, and C.C. Gispen-de Wied, Immunological characteristics of diabetes in
schizophrenia. Diabetologia, 2005. 48(9): p. 1941-2.

Chapter
6
135Increased level of immune compounds in patients with schizophrenia |
suPPLeMentARY tABLes
table s1. Effect of disease, age and gender on serum cytokines/chemokines/adipokines in HC and SZ patients.
Disease Agea Gender
Beta(95% CI), p-value Beta(95% CI), p-value Beta(95% CI), p-value
CCL2(n=228)
87.8 (54.26,123.58),0.001
-5.7 (-41.6,32.9),0.759
2.4 (-14.0,32.9),0.756
CCL4 (n=207)
17.6 (0.6,32.8),0.023
6.2 (-0.9,14.2),0.115
-9.3 (-20.6,4.5),0.158
IL-1β(n=222)
6.0 (3.2,8.7),0.001
0.4 (-0.7,1.7),0.483
-0.8 (-3.5,2.0),0.569
TNF-α(n=208)
16.9 (7.1,26.4),0.001
1.1 (-4.0,6.6),0.698
-12.5 (-23.7,-2.3),0.016
IL-6(n=205)
17.3 (2.8,30.5),0.014
0.5 (-4.9,6.6),0.892
-6.7 (-22.7,6.6),0.380
PTX3(n=234)
259.1 (151.0,375.5),0.001
13.5 (-32.3,64.4),0.603
112.4 (2.3,225.3),0.055
Leptin(n=207)
49.7 (30.3,71.0),0.002
-0.9 (-10.5,9.0),0.842
55.3 (35.1,78.3),0.002
Adiponectin(n=207)
13.2 (5.2,21.8),0.003
3.9 (0.3,7.7),0.042
-9.1 (-16.1,-1.7),0.017
PAI-1(n=207)
-0.8 (-1.9,0.3),0.153
0.3 (-0.1,0.7),0.221
-0.7 (-1.5,0.2),0.122
OPG(n=207)
6.8 (-10.0,25.9),0.479
5.3 (-2.0,12.7),0.151
15.2 (-2.0,34.4),0.138
ICAM-1 (n=207)
197.8 (39.0,352.3), 0.014
-37.8 (-115.5,40.0),0.356
-247.9 (-384.7,-104.0),0.002
Generalized linear model to identify the effect of disease, age and gender on the serum cytokine/chemokine/adipokine concentrations in the HC, SZ and SZ-metS groups combined. A negative beta value corresponding to gender means an increase in concentration in males (ICAM-1, TNF-α and adiponectin), whereas a positive beta (leptin) corresponds to an increase in females. a Age was standardized as z-score to correct for the effect size.

136 | Chapter 6
table s2. Correlation between age and serum cytokine/chemokines/adipokine levels and clinical variables.
A. serum Cytokines B. Clinical variables
ICAM-1 Rs -0.007 Gender Rs -0.011
p-value 0.919 p-value 0.855
N 207 N 282
CCL2 Rs 0.143 BMI Rs 0.267
p-value 0.031 p-value 0.000
N 228 N 186
CCL4 Rs 0.255 TG Rs 0.157
p-value 0.000 p-value 0.061
N 207 N 143
IL-1β Rs 0.122 HDL Rs 0.042
p-value 0.070 p-value 0.615
N 222 N 143
TNF-α Rs 0.092 OGTT Rs 0.205
p-value 0.187 p-value 0.001
N 208 N 247
PTX3 Rs 0.192 MetS Rs 0.162
p-value 0.003 p-value 0.006
N 234 N 282
IL6 Rs 0.080
p-value 0.256
N 205
Leptin Rs 0.190
p-value 0.006
N 207
Adiponectin Rs 0.234
p-value 0.001
N 207
OPG Rs 0.143
p-value 0.040
N 207
PAI1 Rs 0.029
p-value 0.678
N 207
Spearman correlation between age in the HC and SZ patient group and A. Serum cytokines/chemokines/adipokines and B. Clinical variables.

Chapter
6
137Increased level of immune compounds in patients with schizophrenia |
table s3. Cytokines/chemokines/adipokines and components of the metS in SZ patients currently drug-free and patients using anti-psychotic medication.
Drug-free Anti-psychotic medication
n Median(IQR) n Median(IQR) P-value
CCL2 11 169.2(70.3) 133 202.2(135.8) 0.520
CCL4 11 81.6(30.4) 113 84.2(44.4) 0.456
IL-1β 11 8.4(9.9) 127 10.8(14.2) 0.589
TNF-α 11 21.8(11.4) 119 23.2(57.2) 0.694
IL-6 11 38.8(30.1) 117 35.5(63.9) 0.662
PTX3 11 386.3(203.5) 132 441.3(528.8) 0.628
Leptin 10 0.0(12.4) 113 0.0(64.2) 0.175
Adiponectin 10 82.8(25.8) 113 97.7(28.6) 0.069
PAI-1 10 10.2(1.8) 113 9.8(2.2) 0.595
OPG 10 90.0(49.5) 113 87.8(35.2) 0.743
ICAM-1 10 550.1(241.5) 113 656.8(466.9) 0.165
Clinical variables
BMI 11 24.5(5.5) 133 28.0(7.0) 0.012
TG 11 1.5(1.6) 132 1.4(1.3) 0.542
hDL 11 1.2(0.7) 132 1.0(0.4) 0.039
Group size, median with IQR, p-values obtained by Mann-Whitney U test. We did not stratify the ICAM-1 and leptin into males and females, because of the small group size for the clozapine users.

138 | Chapter 6
tabl
e s4
. cyt
okin
es/c
hem
okin
es/a
dipo
kine
s in
HC,
SZ
and
SZ-m
etS
patie
nts
excl
udin
g th
e 11
SZ
drug
-free
pati
ents
.
HCSZ
SZ-m
etS
Krus
kal-W
allis
H
NM
edia
n(IQ
R)N
Med
ian(
IQR)
P-va
lue
(HC
vs S
Z)N
Med
ian(
IQR)
P-va
lue
(HC
vs S
Z-m
etS)
P-va
lue
(SZ
vs S
Z-M
etS)
HP-
valu
e
CCL2
8914
9.5
(83.
2)90
179.
1 (1
19.1
)<0
.001
4322
5.2
(262
.5)
<0.0
010.
029
27.3
<0.0
01
CCL4
9355
.6 (3
3.2)
7982
.2 (3
9.5)
<0.0
0134
98.4
(49.
2)<0
.001
0.06
941
.5<0
.001
IL-1
β89
0.0
(11.
0)86
9.9
(16.
3)<0
.001
4111
.3 (1
3.5)
<0.0
010.
830
24.5
<0.0
01
TNF-
α83
0.0
(22.
2)81
24.4
(74.
2)<0
.001
3822
.7 (3
2.8)
0.00
80.
349
17.6
<0.0
01
IL-6
830.
0 (3
8.9)
8131
.9 (6
4.6)
0.00
136
40.8
(56.
8)0.
004
0.85
213
.30.
001
PTX3
9621
3.6
(524
.0)
9044
7.0
(543
.4)
<0.0
0142
379.
4 (5
11.8
)0.
001
0.81
520
.2<0
.001
Lepti
n
fem
ale
480.
0 (2
3.2)
1891
.7 (1
03.1
0)<0
.001
1210
8.4
(138
.9)
<0.0
010.
211
40.6
<0.0
01
mal
e36
0.0
(0.0
)61
0.0
(0.0
)0.
101
220.
0 (7
0.4)
<0.0
01<0
.001
21.9
<0.0
01
Adip
onec
tin93
75.4
(32.
4)79
92.2
(27.
1)<0
.001
3410
9.8
(37.
8)<0
.001
<0.0
0146
.2<0
.001
PAI-1
939.
7 (2
.6)
799.
8 (2
.2)
0.83
334
9.8
(2.3
)0.
948
0.89
30.
50.
976
OPG
9379
.4 (5
4.66
)79
87.0
(38.
5)0.
311
3489
.0 (2
9.0)
0.02
20.
181
5.1
0.07
9
iCAM
-1
fem
ale
4837
2.7
(486
.4)
1863
5.6
(840
.6)
0.03
212
543.
3 (7
02.7
)0.
225
0.41
55.
30.
072
mal
e36
501.
9 (3
60.6
)61
667.
4 (4
86.7
)0.
098
2270
1.8
(615
.3)
0.03
40.
549
4.7
0.09
7
Gro
up s
ize, m
edia
n w
ith IQ
R, p
-val
ues
obta
ined
by
Man
n-W
hitn
ey U
test
and
Kru
skal
-Wal
lis te
st. T
he c
urre
ntly
dru
g-fr
ee p
atien
ts (n
=11)
wer
e ex
clud
ed fr
om th
is a
naly
sis.

Chapter
6
139Increased level of immune compounds in patients with schizophrenia |
tabl
e s5
. Effe
ct o
f com
pone
nts
of th
e m
etS
on s
erum
cyt
okin
es/c
hem
okin
es/a
dipo
kine
s in
SZ
patie
nts
excl
udin
g th
e 11
dru
g-fr
ee S
Z pa
tient
s.
Gen
der
Agea
BMIa
hDLa
TGa
OG
TT
Be
ta(9
5% C
I)Be
ta(9
5% C
I)Be
ta(9
5% C
I)Be
ta(9
5% C
I)Be
ta(9
5% C
I)Be
ta(9
5% C
I)
CCL2
(n=1
32)
-10.
9(-6
7.6,
51.7
)-1
4.0(
-39.
3,12
.2)
13.5
(-23.
9,43
.0)
-14.
5(-8
3.2,
0.3)
-18.
0(-4
2.7,
13.2
)52
.9(-4
3.8,
156.
3)
CCL4
(n=1
12)
-12.
2(-2
9.4,
4.3)
-0.1
(-10.
3,9.
5)3.
3(-6
.9, 1
3.4)
-6.6
(-27.
2,-2
.1)
0.9(
-1.3
,41.
3)20
.7(-1
.3,4
1.3)
IL-1
β (n
=126
)12
.7(-7
.5,1
.5)
0.7(
-1.5
,3.3
)1.
8(-1
.2,3
.3)
-0.1
(-7.2
,1.3
)-1
.3(-4
.5,0
.5)
1.0(
-5.5
,7.9
)
TNF-
α (n
=118
)-2
6.9(
-44.
3,-7
.5)*
4.1(
-5.5
,16.
5)8.
0(-4
.4,1
9.7)
2.2(
-22.
2,7.
3)-7
.0(-2
0.5,
1.0)
-3.5
(-29.
4,22
.5)
IL-6
(n=1
16)
-26.
1(-6
0.1,
-2.0
)7.
7(-1
.0,1
7.5)
15.4
(0.7
,38.
9)1.
1(-1
8.4,
10.6
)-7
.2(-2
7.3,
4.0)
-13.
6(-4
7.6,
12.2
)
PTX3
(n=1
31)
97.7
(-93.
2,33
3.7)
-20.
4(-1
00.7
,72.
7)-1
8.4(
-123
.2,8
6.5)
-82.
4(-3
12.0
,-45.
2)-1
6.0(
-125
.4,5
4.3)
-28.
1(-2
69.6
,172
.7)
Lepti
n (n
=112
)78
.9(4
3.6,
111.
5)**
-8.9
(023
.2,4
.5)
30.8
(10.
3,48
.1)*
-0.8
(-18.
5,21
.5)
-9.0
(-20.
2,2.
9)37
.2(5
.3,7
6.2)
Adip
onec
tin (n
=112
)-1
0.0(
-19.
0,0.
3)*
-1.9
(-6.5
,2.6
)8.
4(2.
6,13
.1)*
*-1
.4(-1
7.1,
0.8)
5.9(
0.7,
11.8
)9.
7(-2
.8,2
2.4)
PAI-1
(n=1
12)
-0.5
(-1.3
,0.4
)0.
0(-0
.3,0
.5)
0.4(
-0.0
,0.9
)0.
1(-0
.7,0
.3)
0.2(
-0.2
,0.5
)-0
.4(-1
.4,0
.8)
OPG
(n=1
12)
11.3
(-11.
7,38
.6)
0.3(
-11.
0,11
.8)
9.1(
-6.2
,24.
4)-1
.4(-3
0.18
,10.
9)0.
8(-1
0.5,
12.4
)48
.5(1
9.2,
80.2
)*
ICAM
-1 (n
=112
)-2
49.8
(-472
.8,-4
.5)*
-46.
2(-1
55.4
,84.
5)-7
8.7(
-212
.4,6
8.3)
-69.
7(-3
91.5
,-15.
0)-2
1.1(
-152
.8,4
7.1)
238.
2(-1
25.1
,560
.2)
Gen
eral
ized
linea
r mod
el to
iden
tify
the
effec
t of e
ach
com
pone
nt o
f the
met
S on
the
seru
m c
ytok
ine/
chem
okin
e/ad
ipok
ine
conc
entr
ation
s with
in th
e SZ
pati
ent g
roup
exc
ludi
ng th
e 11
cur
rent
dr
ug-fr
ee p
atien
ts. A
neg
ative
bet
a va
lue
corr
espo
ndin
g to
gen
der
mea
ns a
n in
crea
se in
cyt
okin
e/ch
emok
ine/
adip
okin
e co
ncen
trati
on in
mal
es, w
here
as a
pos
itive
bet
a co
rres
pond
s to
an
incr
ease
of t
he s
peci
fic im
mun
e co
mpo
und
in fe
mal
es. P
-val
ues
are
depi
cted
as:
*p<
0.05
, **p
<0.0
1. a
Age,
BM
I, H
DL a
nd T
G w
ere
stan
dard
ized
as z
-sco
res
to c
orre
ct fo
r the
effe
ct s
ize o
f eac
h co
fact
or.

140 | Chapter 6
table s6. Correlation between Clozapine use and serum cytokine/chemokines/adipokine levels and clinical variables within the SZ patient group.
A. serum cytokines B. Clinical variables
iCAM-1 Rs 0.038 Age Rs 0.067
p-value 0.677 p-value 0.425
N 123 N 144
CCL2 Rs -0.012 Gender Rs -0.040
p-value 0.883 p-value 0.636
N 144 N 144
CCL4 Rs 0.146 BMI Rs 0.167
p-value 0.106 p-value 0.046
N 123 N 144
IL-1β Rs 0.019 TG Rs 0.152
p-value 0.829 p-value 0.070
N 138 N 143
TNF-α Rs 0.031 HDL Rs -0.159
p-value 0.729 p-value 0.058
N 130 N 143
PTX3 Rs 0.116 OGTT Rs 0.139
p-value 0.169 p-value 0.097
N 143 N 143
IL-6 Rs 0.002 MetS Rs 0.064
p-value 0.980 p-value 0.442
N 127 N 144
sIL-2R Rs 0.125
p-value 0.413
N 45
Leptin Rs 0.120
p-value 0.187
N 123
Adiponectin Rs 0.091
p-value 0.319
N 123
OPG Rs 0.102
p-value 0.259
N 123
PAI1 Rs 0.160
p-value 0.078
N 123
Spearman correlation between clozapine use (users/non-users) in the SZ patient group and A. Serum cytokines/chemokines/adipokines and B. Clinical variables.

Chapter
6
141Increased level of immune compounds in patients with schizophrenia |
table s7. Cytokines/chemokines/adipokines and components of the metS in clozapine users and users of other anti-psychotic medication.
other anti-psychotic medication Clozapine
N Median(IQR) N Median(IQR) P-value
CCL2 119 198.9 (154.9) 25 193.2 (97.2) 0.309
CCL4 106 80.1 (42.6) 17 90.3 (83.6) 0.165
IL-1β 115 10.8 (13.9) 23 9.1 (13.7) 0.922
TNF-α 108 22.5 (50.0) 22 23.2 (52.9) 0.768
IL-6 107 35.5 (64.2) 20 35.7 (59.8) 0.772
PTX3 119 437.2 (506.6) 24 384.5 (612.8) 0.974
Leptin 106 0.0 (47.1) 17 0.0 (94.3) 0.479
Adiponectin 106 96.8 (27.3) 17 102.2 (39.4) 0.671
PAI-1 106 9.7 (2.3) 17 10.4 (2.3) 0.135
OPG 106 87.0 (39.4) 17 88.6 (21.1) 0.466
ICAM-1 106 645.3 (436.5) 17 835.5 (445.0) 0.198
Clinical variables
BMI 119 28.0 (7.0) 25 29.0 (3.8) 0.369
TG 118 1.4 (1.2) 25 1.5 (2.4) 0.067
HDL 118 1.0 (0.4) 25 1.0 (0.4) 0.712
Group size, median with IQR, p-values obtained by Mann-Whitney U test. We did not stratify the ICAM-1 and leptin into males and females, because of the low group size for the clozapine users.


Chapter 7
General discussion

144 | Chapter 7
Cells derived from the myelo-monocytic cell lineage are essential for the normal functioning of the immune system. The data presented in this thesis and the theses of previous candidates (Rosmalen, 2000; Lam-Tse, 2003; Nikolic, 2004; Geutskens, 2004; Canning, 2005; Bouma, 2005; Sommandas, 2008; Wildenberg, 2008; Welzen-Coppens, 2013) show that these cells are not only involved in the recognition and clearance of invading pathogens (their classical function), but that these cells also play a crucial role in tissue development (e.g. of the brain, the thyroid and the pancreas islets). And in addition play a crucial role in the preservation of immune homeostasis, most notably in the preservation of tolerance to neuro-endocrine auto-antigens. As stated in the introduction of this thesis various studies have shown the association of psychiatric disease with endocrine (and other organ-specific) autoimmune diseases, not only in patients, but also and independently in not-affected family members of patients [1]. This suggests a common underlying abnormality responsible for both the autoimmune endocrine and mental disorders. This thesis (and the other previous theses) provide strong evidence that aberrantly inflammatory activated microglial cells in the brain of patients with major psychiatric disease and aberrantly inflammatory activated, non-tolerogenic DCs/MØs in the thyroids/pancreases of patients with AITD/T1DM constitute to this common underlying abnormality. The data of this and the other theses point to the view that it is caused by an intrinsically aberrant proliferation/differentiation of cells of the myelo-monocytic lineage in animals and individuals prone to endocrine autoimmunity and psychiatric disease, which make their progeny (DCs/MØs) excessively prone for inflammatory over stimulation and lack of tolerogenic capability.
ConCLusions FRoM the AniMAL stuDies in this thesis
In steady state microglia are involved in synapse formation, they produce growth factors for developing neurons and blood vessels and execute programmed neuronal cell death (reviewed in [2,3]). Microglia colonize the brain parenchyma at early stages of development and accumulate in specific regions where they actively participate in cell death, angiogenesis, neurogenesis and synapse elimination during embryogenesis. A recurring feature of embryonic microglial distribution is their association with developing axon tracts, which together with in vitro data, supports the idea of a physiological role for microglia in neurite development. Yet the demonstration of this role of microglia is still lacking. In Chapter 2 of this thesis, we have studied the consequences of microglial dysfunction on the formation of the corpus callosum, the largest commissure of the mammalian brain, which shows consistent microglial accumulation during development. We studied two models of microglial dysfunction: the loss-of-function of DAP12, a key microglial-specific signaling molecule, and a model of maternal inflammation by peritoneal injection of LPS at E15.5. We also took advantage of the Pu.1-/- mouse line, which is devoid of microglia. We performed transcriptional profiling of maternally inflamed and Dap12-

Chapter
7
145General discussion |
mutant microglia at E17.5. We found that both treatments principally down-regulated genes involved in nervous system development and function, particularly in neurite formation. We then analyzed the developmental consequences of these microglial dysfunctions on the formation of the corpus callosum. We now show in this thesis that all three models of altered microglial activity resulted in the defasciculation of dorsal callosal axons. Our study demonstrates that microglia display a neurite-growth promoting function and are genuine actors of corpus callosum development. It further shows that microglial inflammatory activation impinges on this function, thereby revealing that prenatal inflammation can impair neuronal development. In Chapter 3 of this thesis, we used the Non-Obese Diabetic (NOD) mouse as another model of putative microglial inflammatory activation. The NOD mouse is a model of spontaneously developing endocrine autoimmune disease (autoimmune thyroiditis and autoimmune diabetes), in addition NOD mice are highly anxiogenic at steady state and show an exaggerated depressive-like behavioral response to LPS. Since there is also increasing evidence that microglia plays a role in the etiology of major depression, we compared the genotype of NOD microglia (at steady state and after LPS injection) to its background control strain CD1 to determine if these cells are significantly inflammatory altered in the NOD mouse. Microglia were isolated, FACS sorted (SSClowCD11b+CD45low) and Affymetrix microarray analysis was performed on the microglia. Genome-wide expression data were analyzed by BRB-Arraytools, Ingenuity analysis and a detailed literature search using PubMed for the top over- and under-expressed genes. At steady state, microglia in the NOD mouse showed an altered gene profile characterized by a differential expression of genes involved in neuronal support (e.g. GADD45A, PHGDH and SHMT1). In addition there was an altered expression of genes involved in the inflammatory process: NOD microglia showed an IFN type 1 skewed inflammatory machinery in steady state (over expressed genes such as IRF3 and SP110), and an alternative IFN-driven activation pattern in response to LPS (the CD1 microglia showed a ‘classic’ inflammatory response to LPS). We concluded that the differential expression in steady state of genes involved in neuronal support supports a view of an altered development in NOD mice of brain regions critical for mood regulation, while the alternative IFN type 1 driven inflammatory reaction of microglia of LPS stimulated NOD mice supports a view in which IFN type 1 plays a critical role in LPS driven depressive-like behavior. It has been shown before that DCs and MØs play a crucial role in the onset of T1DM in the NOD mouse [4-6] and in patients [7,8]. Prior to the onset of lymphocytic insulitis, DCs accumulate at the islet edges. Our recent work indicates that these local DCs may derive from proliferating local precursor cells, similar to the situation in the brain where microglia mainly derives from local precursors under steady state conditions [9]. These local precursors give rise, amongst other cells, to CD8α+and CD8α- DC. As CD8α+ DCs play a role in tolerance induction in steady-state conditions, we hypothesized in previous work that the autoimmune phenotype might associate with deficiencies in CD8α+ DCs in the pre-diabetic NOD mouse pancreas. Indeed we reported that the frequency of CD8α+CD103+Langerin+ (tolerogenic phenotype) cells was significantly reduced in the
146 | Chapter 7
pre-diabetic NOD pancreas compared with control mice [10]. In addition, NOD pancreatic CD8α+CD103+Langerin+ DCs expressed reduced levels of CCR5, CLEC9A, and IL-10 as compared with control DCs. We took these data as suggesting that an abnormal differentiation of pancreatic DCs from local precursors contributes to a loss of tolerance, hallmarking the development of autoimmune diabetes [10]. However, the tolerogenic CD8α+ DC population only constitutes a very small population in the mouse pancreas; the immunogenic CD8α- DC population is much larger. In chapter 4 we analyzed the larger subset of CD8α- DCs isolated from the pancreas of pre-diabetic NOD mice for genome-wide gene expression (validated by Q-PCR) to elucidate abnormalities in gene expression networks. CD11c+CD8α- DCs were isolated from 5 week old NOD and control C57BL/6 pancreas. The steady state pancreatic NOD CD11c+CD8α- DCs showed a reduced expression of several gene networks important for the prime functions of the cell, i.e. for cell renewal, immune tolerance induction, migration and for the provision of growth factors including those for β cell regeneration. A functional in vivo BrdU incorporation test showed the reduced proliferation of steady state pancreatic DC. Despite these deficiencies NOD CD11c+CD8α- pancreatic DCs showed a hyperreactive response to LPS, which resulted in an enhanced pro-inflammatory state characterized by a molecular profile of an enhanced expression of a number of classical inflammatory cytokines. The enhanced up regulation of inflammatory cytokines was functionally confirmed by an in vitro higher production of the cytokines. We concluded that our data showed that NOD pancreatic CD8α- DCs show various deficiencies in steady state, but are over-inflammatory when encountering a Pathogen-Associated Molecular Pattern such as LPS. Collectively the findings in these three chapters and of previous theses (see before) point to a crucial role of myelo-monocytic cells in tissue homeostasis and development, most notably in the organogenesis of the brain and the islets. In steady state the cells provide various growth factors and growth mechanisms for a proper development of important brain structures (this thesis), for β cells (this thesis) and for thyrocytes [11-13]. However, when these cells are inflammatory activated the provision of growth factors is hampered, leading to an abnormal development of brain structures (this thesis), islets [14,15] and thyroid tissue [16]. Such inflammatory activation may take place due to an environmental microbial or stressful event during pregnancy (this thesis, [3]), on the other hand the altered provision of growth supporting factors by myelo-monocytic cells may take place “spontaneously” in animals prone to develop endocrine autoimmunity, such as the NOD mouse (this thesis). Interestingly the precursors of the local myelo-monocytic cells in this model (the precursors for the NOD microglia and NOD pancreas DC and macrophages) show a reduced proliferation and renewal (a phenomenon also observed for the myelo-monocytic precursors in the NOD bone marrow [17,18]), while the progeny of the cells, the NOD DC and macrophages, show a diminished tolerogenic capacity, are hypersensitive to classical TLR4 agonists and/or show an alternative aberrant reaction to such classical agonists, i.e. an excessive local IFN-driven reaction.

Chapter
7
147General discussion |
inteGRAtion oF AniMAL DAtA
Figure 1A depicts a model that summarizes and integrates these animal findings. This hypothetical model shows the abnormalities in proliferation, cell renewal and differentiation of the precursors in the myelo-monocytic cell lineage (occurring at the level of the brain, bone marrow and endocrine tissues) as the key element underlying the pathogenesis of major psychiatric disorders, thyroid autoimmunity and autoimmune diabetes. The differentiation abnormality (either genetically or environmentally induced, or both) leads to a progeny of aberrant (“primed”) microglia, DC and macrophages with a reduced growth support potential for the surrounding parenchymal cells, leading to architectural changes in the organs, e.g. in the brain to defasciculation (this thesis) and in the islets to morphological changes such as a high fibronectin (FN) content, irregularly shaped islets and mega-islets [14,15,19]. These morphological and growth abnormalities characterize the pre-stages of the disorders which only become clinically evident after second hits.
Figure 1A. Summary scheme integrating the data from animal experiments carried out in this thesis and those of previous theses (see text).
The differentiation abnormality of the local precursors also leads to a reduced number of local tolerogenic DC (suggested in this thesis and by [9] at the level of the islets in the NOD) as well

148 | Chapter 7
as an abnormal and often excessive inflammatory response of the local progeny (the microglia, DC and macrophages) to TLR stimulation. This will contribute to the loss of tolerance induction after microbial or necrotic hits and together with the innate T regulatory cell defects in the NOD mouse [20] to the development of autoreactive T and B cells, ultimately leading to endocrine autoimmune disease. Also at the level of the bone-marrow NOD mice show myelo-monocytic cell differentiation abnormalities [17,18], leading – already in the pre-stage of the disease – to an abnormal apportioning between immature and mature circulating monocytes in the peripheral blood of the NOD mouse, with immature cells reduced and mature cells increased [21]. Preliminary unpublished data show that the immature NOD monocytes have a spontaneously reduced inflammatory gene expression, while the NOD mature monocytes have a spontaneously enhanced inflammatory gene expression. Interestingly the NOD monocyte population is also less capable of contributing to tissue inflammatory reactions due to a reduced migration capability [22].
ConCLusions FRoM the huMAn stuDies in this thesis
Apart from studying the pathogenic role of the myelo-monocytic cell lineage in the early phases of endocrine autoimmunity in animal models, we have also tried to study the cells in the early phases of autoimmune thyroid disease (AITD) in the human. Local thyroid DC and macrophages in human pre-AITD are difficult (and perhaps even unethical) to obtain, we therefore carried out a study described in chapter 5 to test the hypothesis that myelo-monocytic cell related serum factors involved in the growth and connective tissue abnormalities and the early accumulation of dendritic cells and macrophages in the thyroid gland can be used for this purpose. We measured tissue growth/remodeling factors, adhesion molecules, chemokines and pro- and anti-inflammatory cytokines in a controlled study on 64 TPO-Ab negative euthyroid female relatives with at least one 1st or 2nd degree relative with documented autoimmune hyper- or hypothyroidism, 32 of whom did and 32 did not seroconvert to TPO-Abs positivity in 5 year follow-up. The relatives were compared to 32 healthy controls. In all subjects we measured serum levels of CCL2, CCL3, CCL4, sVCAM-1, sICAM-1, THBS-1, VEGF-A, TIE-2, MMP13, PDGF-BB, Fibronectin (FN), IL-1β, IL-6, TNF-α, IL-10 and GDF-15 by multiplex (Cytometric Bead Array, eBioscience) or single commercial ELISA. We found that both sero-converting and non-sero-converting family members showed an up regulation of FN and a down regulation of PDGF-BB and of the adhesion and migration factors CCL2, CCL4, sVCAM-1, TIE-2 and MMP-13. The sero-converters differed from the non-sero-converters by up regulation of the pro-inflammatory compounds Il-1β, IL-6 and CCL3. We concluded that this study shows that euthyroid females within AITD families show a characteristic pattern of abnormalities in serum levels of myelo-monocytic-cell-related tissue

Chapter
7
149General discussion |
remodeling factors, growth factors, chemokines, (vascular) adhesion molecules and cytokines prior to the occurrence of TPO-Abs in serum. The results provide proof of principle that pre-sero-conversion stages and sero-conversion to AITD might be predicted using serum analytes related to growth/connective tissue abnormalities and migration/accumulation abnormalities of macrophages and dendritic cells. Further studies are indicated. In chapter 6 we measured in schizophrenia patients (n=144), the serum levels of the monocyte/macrophage cytokines/chemokines/adipokines CCL2, CCL4, IL-1β, TNF-α, IL-6, PTX3, leptin, adiponectin, PAI-1, OPG and ICAM-1 and compared the found levels to those found in healthy controls (HC) (n=138). Since there are strong indications that the levels of monocyte/macrophage pro-inflammatory cytokines/chemokines/adipokines are strongly confounded by components of the metabolic syndrome (MetS) we studied, using multivariate analysis, the effect of the presence of the disease schizophrenia itself; As well as the components of the MetS including BMI, the levels of lipids (HDL cholesterol and triglycerides (TG)), diabetes (hyperglycemia) and the use of antipsychotic medication, on the serum levels of these immune compounds. We found that all measured immune compounds, with the exception of PAI-1 and OPG, were elevated in the schizophrenia patient population. Multivariate analysis showed that elevations were linked to gender (ICAM-1, leptin, TNF-α and adiponectin), an increased BMI (leptin, adiponectin), hyperglycemia/diabetes (CCL4 and OPG), reduced HDL-cholesterol or increased levels of TG (adiponectin and PTX3) or the presence of the MetS (CCL2, leptin and adiponectin). IL-1β and IL-6 were the only immune compounds raised in the serum of patients not affected by any of the included confounding factors. We concluded that although many of the monocyte/macrophage pro-inflammatory cytokines/chemokines/adipokines were found linked to (components of) the MetS, the most dominant linkage was found with the disease schizophrenia, confirming earlier reports on increased monocyte/macrophage activation as a key component for understanding the pathogenesis of schizophrenia (see also introduction).
inteGRAteD vieW
If we now put these human serum inflammatory compound data in the integrating Figure 1A on the pathogenesis derived from animal data we arrive at a unifying hypothesis depicted in Figure 1B. This figure shows, in addition to Figure 1A, that the pre-disease stages of the autoimmune endocrine diseases (and probably also of the psychiatric diseases) can in principle be predicted by detecting the abnormalities in the growth and differentiation of the myelo-monocytic cell lineage, the neuro-endocrine cells and the connective tissue compartments by finding abnormalities in the serum levels of:

150 | Chapter 7
1. Growth and differentiation factors reflecting the neuro-endocrine growth abnormalities, e.g. in PDGF-BB (this thesis). Regarding psychiatric disorders there is ample literature data showing altered serum concentrations of myeloid growth factors, such as of G-CSF [23] and of various other growth factors, including SCF, GM-CSF and IGFBP2 [24]. Also polymorphisms in the IL-3R have been described determining the prevalence of schizophrenia [25], suggesting an important role for the macrophage growth factor IL-3.
2. Immune compounds reflecting the poor development of DC and macrophages, such as reduced chemokines (this thesis) and cytokines (this thesis),
3. Factors reflecting the abnormal connective tissue composition, e.g. FN and MMPs (this thesis).
Figure 1B. Summary scheme integrating both data from animal experiments and human studies. The bottom panel summarizes the abnormalities of serum compounds during the pre-stages of the disease and during the psychiatric and endocrine diseases as found in this thesis.
The transition to overt autoimmune or psychiatric disease is -according to our limited set of data – heralded by an increase in pro-inflammatory cytokines and endocrine autoantibodies (a second hit). It must be noted here that the levels of these inflammatory compounds in serum are

Chapter
7
151General discussion |
strongly confounded by the BMI (macrophages in fat produce large quantities of inflammatory compounds, see Figure 1 B) and by the lipid profile of the patients. Nevertheless there is a large body of evidence that serum cytokines do reach the brain and are capable to stimulate important brain centers via a cascade like pathway, leading to behavioral abnormalities [3,26,27].
LiMitAtions oF the stuDies
The studies presented in this thesis have several limitations that should be taken into consideration. The main limitation for all animal model studies is that they only partly resemble the human disease. Especially, since the majority of mouse models discussed here are inbred mice and genetically identical, housed under very constant conditions minimalizing environmental influences. Humans are heterogeneous and there are clear indications supporting a major effect of environment on the development of disease. That itself is also a limitation of human studies. The heterogeneity between patients of a specific disease is high and this requires often a large number of study subjects to confirm findings. In chapter 2 we isolated the microglia from the total cerebral cortex not taking into account possible heterogeneity of microglia subtypes in different areas of the brain [28]. Similarly, in chapter 3, we analyzed microglia isolated on the expression of general microglia markers resulting in a heterogeneous microglia population for the microarray analysis. Limitations of the study described in chapter 3 are the relative small group size of mice used for the experiments. This affects the robustness of the microarray analysis, since the larger the study groups, the smaller chance for false-positives (type I error). In addition, there is discussion on a proper control for the NOD mouse, since this mouse is genetically different from the CD-1 outbred strain it was derived from [29]. However, the CD-1 mouse is genetically closest to the NOD mouse. Also, the relatively small number of microglia that can be isolated from the mouse brain was challenging for the microarray analysis. Extra RNA amplification steps were introduced to obtain enough RNA for a proper microarray analysis. This might results in more false-positives or false-negatives (type II error). High abundant transcripts might results in more type I errors and low abundant transcripts in type II errors [30]. This limitation holds also true for the studies in chapter 2 and 4 with RNA amplification steps. A general disadvantage of microarrays is the limited set of transcripts studies. In the chips used for microarray studies described in chapter 2, 3 and 4 miRNAs and other non-coding RNAs were not taken into account. It has been shown for example that these small non-coding RNAs are involved in the regulation of microglia and MØs function in the CNS [31]. A more unbiased approach such as next-general transcriptome sequencing would be preferred in future studies. In chapter 4, even though we isolated the major subset of DCs in the pancreas, the total number of sorted cells was very low. Pancreas is difficult to dissociate into single-cell suspensions seen the high concentrations of digestive enzymes resulting in a large number death cells and

152 | Chapter 7
cell waste. Therefore, flow cytometric analysis was challenging and limited the total number of cellular markers to be studied. In addition, we did not study the CD8α- DCs in the pancreatic lymph node where the actual T cell priming takes place. In chapter 5 and 6 multiplexing technology was used for cytokine measurements in serum. Most inflammatory cytokines had measurements below detection level. Cytometric bead array for cytokine measurements are very robust and able to measure a large panel of cytokines at the same time, however it lacks in sensitivity compared to ELISAs and Luminex technology. Also, since it was an exploratory study the number of relatives of AITD patients studied in chapter 5 is small. Still, the data obtained in this study has a very robust outcome and the very high significance levels provides a strong bases to proceed with further studies in a larger group of subjects. The limitation of the study in chronic schizophrenia patients in chapter 6 was the small number of drug-free patients. The majority of schizophrenia patients, especially the chronic patients, have a long history of medication use. The use of medication might have had an effect on the levels of cytokines measured. However, in general antipsychotic medication has anti-inflammatory properties and would therefore result in reduced levels of (pro)-inflammatory cytokines. In addition, the group of healthy controls had different demographic data in terms of age, education and social-economic status, BMI and presence of the metabolic syndrome. It goes thus without saying that data presented in this thesis need further study and confirmation in larger and more controlled data sets.
FutuRe PRosPeCts
The studies in this thesis reflect different diseases, organs and disease stages in both human and mouse models. It demonstrated that the NOD mouse is a good model for T1DM, AITD and possibly also for abnormal brain development related to psychiatric disease. More specifically, the NOD mouse has inborn abnormalities in myelo-monocytic cells and target organs including the brain, pancreas and thyroid. However, crucial information linking the different molecular and cellular processes in the onset of the pathogenesis of these diseases is still lacking. Current advances in the fields of next-generation sequencing, multiplex protein detection and flow cytometry platforms combined with a systems biology approach will provide a robust and powerful tool to detect all pathways and cell types involved in diseases. It would be informative to use such an approach in NOD mice where detection and isolation of different cell types by flow cytometry is combined with transcriptome analysis and serum/tissue protein detection at different ages and stages of disease development, rather than to focus on one small part in a very complex system of biological processes and environmental influences. In the end, it could provide us more insight into the pathological mechanism underlying autoimmune and psychiatric disease, but could also provide a set of biomarkers to be validated in patients. These biomarkers could be used for

Chapter
7
153General discussion |
early detection of autoimmune disease or more specific detection of psychiatric disease. Early detection and more insight in potential targets for therapy will allow novel therapeutics to be developed to better treat or prevent disease. Another emerging field is the use of scanning technologies such as MRI and PET for the non-invasive visualization of cells and molecular processes. An example of this is the use of magnetic nanoparticles to identify a subset of MØs involved in pancreas infiltration in the NOD mouse [32]. Also, PET tracers against a large number of cellular markers involved in autoimmune and psychiatric diseases are developed including PBR (activated MØs and microglia), COX-2, IL2R. Future developments of new PET tracers, magnetic nanoparticles and higher resolution scanners will provide useful tools for unraveling the mechanisms underlying disease and detection of early abnormalities in target organs of autoimmunity.

154 | Chapter 7
ReFeRenCes
1. Eaton, W.W., et al., Autoimmune diseases, bipolar disorder, and non-affective psychosis. Bipolar Disord, 2010. 12(6): p. 638-646.
2. Pont-Lezica, L., et al., Physiological roles of microglia during development. J Neurochem, 2011. 119(5): p. 901-8.
3. Beumer, W., et al., The immune theory of psychiatric diseases: a key role for activated microglia and circulating monocytes. J Leukoc Biol, 2012. 92(5): p. 959-75.
4. Nikolic, T., et al., Dendritic cells and macrophages are essential for the retention of lymphocytes in (peri)-insulitis of the nonobese diabetic mouse: a phagocyte depletion study. Lab Invest, 2005. 85(4): p. 487-501.
5. Saxena, V., et al., The countervailing actions of myeloid and plasmacytoid dendritic cells control autoimmune diabetes in the nonobese diabetic mouse. J Immunol, 2007. 179(8): p. 5041-53.
6. Diana, J., et al., Crosstalk between neutrophils, B-1a cells and plasmacytoid dendritic cells initiates autoimmune diabetes. Nat Med, 2013. 19(1): p. 65-73.
7. Uno, S., et al., Macrophages and dendritic cells infiltrating islets with or without beta cells produce tumour necrosis factor-alpha in patients with recent-onset type 1 diabetes. Diabetologia, 2007. 50(3): p. 596-601.
8. Jansen, A., et al., An immunohistochemical study on organized lymphoid cell infiltrates in fetal and neonatal pancreases. A comparison with similar infiltrates found in the pancreas of a diabetic infant. Autoimmunity, 1993. 15(1): p. 31-38.
9. Welzen-Coppens, J.M., et al., Abnormalities of dendritic cell precursors in the pancreas of the NOD mouse model of diabetes. Eur J Immunol, 2012. 42(1): p. 186-94.
10. Welzen-Coppens, J.M., et al., Reduced numbers of dendritic cells with a tolerogenic phenotype in the prediabetic pancreas of NOD mice. J Leukoc Biol, 2012.
11. Geutskens, S.B., et al., Macrophages in the murine pancreas and their involvement in fetal endocrine development in vitro. J Leukoc Biol, 2005. 78(4): p. 845-52.
12. Simons, P.J., F.G. Delemarre, and H.A. Drexhage, Antigen-presenting dendritic cells as regulators of the growth of thyrocytes: a role of interleukin-1beta and interleukin-6. Endocrinology, 1998. 139(7): p. 3148-56.
13. Simons, P.J., F.G. Delemarre, and H.A. Drexhage, A functional and phenotypic study on immune accessory cells isolated from the thyroids of Wistar and autoimmune-prone BB-DP rats. J Autoimmun, 2000. 15(4): p. 417-24.
14. Rosmalen, J.G., et al., Islet abnormalities in the pathogenesis of autoimmune diabetes. Trends Endocrinol Metab, 2002. 13(5): p. 209-14.
15. Geutskens, S.B., et al., Extracellular matrix distribution and islet morphology in the early postnatal pancreas: anomalies in the non-obese diabetic mouse. Cell Tissue Res, 2004. 318(3): p. 579-89.
16. Many, M.C., H.A. Drexhage, and J.F. Denef, High frequency of thymic ectopy in thyroids from autoimmune prone nonobese diabetic female mice. Lab Invest, 1993. 69(3): p. 364-7.
17. Nikolic, T., et al., Bone marrow precursors of nonobese diabetic mice develop into defective macrophage-like dendritic cells in vitro. J Immunol, 2004. 173(7): p. 4342-51.
18. Strid, J., et al., A defect in bone marrow derived dendritic cell maturation in the nonobesediabetic mouse. Clin Exp Immunol, 2001. 123(3): p. 375-81.
19. Goldstein, S., et al., Diabetes mellitus and genetic prediabetes. Decreased replicative capacity of cultured skin fibroblasts. J Clin Invest, 1979. 63(3): p. 358-70.
20. Wållberg, M. and A. Cooke, Immune mechanisms in type 1 diabetes. Trends in immunology, 2013.21. Nikolic, T., et al., Diabetes-prone NOD mice show an expanded subpopulation of mature circulating
monocytes, which preferentially develop into macrophage-like cells in vitro. J Leukoc Biol, 2005. 78(1): p. 70-9.

Chapter
7
155General discussion |
22. Bouma, G., et al., NOD mice have a severely impaired ability to recruit leukocytes into sites of inflammation. Eur J Immunol, 2005. 35(1): p. 225-35.
23. Lehto, S.M., et al., Serum IL-7 and G-CSF in major depressive disorder. Prog Neuropsychopharmacol Biol Psychiatry, 2010. 34(6): p. 846-51.
24. Schwarz, E., et al., Identification of a biological signature for schizophrenia in serum. Mol Psychiatry, 2012. 17(5): p. 494-502.
25. Chen, X. and K.S. Kendler, Interleukin 3 and schizophrenia. Am J Psychiatry, 2008. 165(1): p. 13-4.26. Anisman, H., Cascading effects of stressors and inflammatory immune system activation: implications
for major depressive disorder. J Psychiatry Neurosci, 2009. 34(1): p. 4-20.27. Kastin, A.J., et al., Peptides crossing the blood-brain barrier: some unusual observations. Brain Res,
1999. 848(1-2): p. 96-9100.28. de Haas, A.H., H.W.G.M. Boddeke, and K. Biber, Region-specific expression of immunoregulatory
proteins on microglia in the healthy CNS. Glia, 2008. 56(8): p. 888-894.29. Anderson, M.S. and J.A. Bluestone, The NOD mouse: a model of immune dysregulation. Annu Rev
Immunol, 2005. 23: p. 447-85.30. Clement-Ziza, M., et al., Evaluation of methods for amplification of picogram amounts of total RNA for
whole genome expression profiling. BMC Genomics, 2009. 10: p. 246.31. Ponomarev, E.D., T. Veremeyko, and H.L. Weiner, MicroRNAs are universal regulators of differentiation,
activation, and polarization of microglia and macrophages in normal and diseased CNS. Glia, 2013. 61(1): p. 91-103.
32. Fu, W., et al., Early window of diabetes determinism in NOD mice, dependent on the complement receptor CRIg, identified by noninvasive imaging. Nat Immunol, 2012. 13(4): p. 361-8.


157Summary |
summary
The immune system is a complex system of tissue with cells and messenger molecules interacting to protect an organism against pathogens. Autoimmunity is the failure of the immune system to recognize its own constituent parts as harmless self and therefore it leads to an immune response against its own cells and tissues. Diseases that are a result of autoimmunity are called autoimmune diseases. Autoimmune diseases discussed in this thesis are autoimmune thyroid disease (AITD), where thyrocytes of the thyroid gland are the target of the immune system and type 1 diabetes mellitus (T1DM), characterized by an autoimmune destruction of the insulin-producing β cells of the Islets of Langerhans in the pancreas. Various epidemiological studies have shown the association of psychiatric disease with AITD and T1D (and other autoimmune diseases), not only in patients, but also and independently in not affected family members of patients. This suggests a common underlying abnormality responsible for both the autoimmune endocrine diseases and mental afflictions. We hypothesized that dysfunctional cells of the myelo-monocytic cell lineage (monocytes, macrophages (MØ) and dendritic cells (DCs)) are this common underlying abnormality. The overall aim of this thesis was therefore to investigate the role of myelo-monocytic cells in the onset and pathogenesis of endocrine autoimmune diseases and psychiatric disease. We used several animal models of depressive and psychotic-like behavior and of T1DM to study the pre-stages of the disorders in chapter 2 to 4. We thereafter tested the hypothesis in chapter 5 and 6 that serum factors related to myelo-monocytic cell dysfunction can be used as tools to predict AITD and to detect the presence of schizophrenia. In Chapter 2 of this thesis, we studied the consequences of dysfunction of the MØ/DCs of the brain (the microglia) on the formation of the corpus callosum. We show in this chapter that microglia display a neurite-growth promoting function and are genuine actors of corpus callosum development. The chapter further shows that microglial inflammatory activation negatively impinges on this function. Microglial inflammatory activation was introduced by a loss-of-function of DAP12, or in the fetus by maternal inflammation via peritoneal injection of lipopolysaccharides (LPS) at embryonic day 15.5. These procedures resulted in fetal microglial activation and the defasciculation of dorsal callosal axons in the fetal brain, thereby revealing that prenatal inflammation can impair neuronal development. In Chapter 3 of this thesis, we used the Non-Obese Diabetic (NOD) mouse model and studied their putative microglial inflammatory activation. NOD mice are extensively used as a model of autoimmune T1DM and AITD. NOD mice are, however, also highly anxiogenic at steady state and show an exaggerated depressive-like behavioral response to LPS as compared to their parental strain, the CD1 mice. At steady state, we found that microglia of the NOD mouse displayed an altered gene profile characterized by a differential expression of genes involved in neuronal growth compared to CD1 mice. In addition NOD microglia showed an interferon (IFN) type 1

158 | Summary
skewed inflammatory machinery in steady state, and an alternative IFN-driven activation pattern in response to LPS. We concluded that the differential expression in steady state of genes involved in neuronal growth supports a view of an altered development in NOD mice of brain regions critical for mood regulation, while the alternative IFN type 1 driven inflammatory reaction of microglia of LPS stimulated NOD mice supports a view in which IFN type 1 plays a critical role in LPS driven depressive-like behavior. We not only studied in the NOD mouse model the myelo-monocytic cells of the brain, but also those of the pancreas. In the pancreas DCs and MØ are the first cells to accumulate around the islets initiating the lymphocytic insulitis ultimately destroying the pancreatic β cells leading to hypo-insulinemia in the NOD mouse model of T1DM. In chapter 4 we analyzed the proliferation potential and gene expression profiles of DCs (DCs) isolated from the pancreas of pre-insulitis and pre-diabetic NOD mice. The pancreatic NOD DCs showed a reduced proliferation potential and a reduced expression of several gene networks important for the prime functions of the cell, i.e. for cell renewal, immune tolerance induction, migration and for the provision of growth factors including those for β cell regeneration. Despite these deficiencies NOD pancreatic DCs showed a hyper reactive response to LPS, which resulted in an enhanced pro-inflammatory state characterized by a molecular profile of an enhanced expression of a number of classical inflammatory cytokines. Our observations support a view in which the myelo-monocytic cells of the pancreas show a poor proliferation and differentiation in steady state, leading to early architectural islet disturbances (previously described in the thesis of Rosmalen, 2000) and a poor tolerance induction. Under conditions of Toll-like receptor (TLR) stress (e.g. local infections, a high apoptosis of β cells,) the “deficient” DC would over-react with a strong inflammatory response tipping the balance over to islet autoimmunity. Collectively the findings in these three chapters and of previous theses of our group point to a crucial role of myelo-monocytic cells in tolerance induction and in tissue homeostasis and development, most notably in the organogenesis of the brain and the islets. In steady state the cells provide various growth factors and growth mechanisms for a proper development of important brain structures, for β cells and for thyrocytes. The cells also travel, in steady state, to the draining lymph nodes carrying important endocrine auto-antigens along (thyroglobulin, insulin) and induce tolerance in the draining lymph nodes to these antigens via expansion of antigen specific natural T regulator cells. However, when the local myelo-monocytic cells are inflammatory activated by a danger signal (through the TLR for example) the provision of growth factors is hampered, leading to an abnormal development of brain structures, islets and thyroid tissue. Also tolerance induction shifts over to immunization against the endocrine auto-antigens. In the discussion a model is presented (Figure 1A) that summarizes and integrates our animal findings with those of others. This hypothetical model shows the abnormalities in proliferation, cell renewal and differentiation of the precursors in the myelo-monocytic cell lineage (occurring at the level of the brain, bone marrow and endocrine tissues) as the key element underlying the pathogenesis of major psychiatric disorders, thyroid autoimmunity and autoimmune diabetes.
159Summary |
The differentiation abnormality (either genetically or environmentally induced, or both) leads to a progeny of aberrant (“primed”) microglia, DC and MØ with a reduced growth support potential for the surrounding parenchymal cells, leading to architectural changes in the organs, e.g. in the brain to defasciculation and in the islets to earlier described morphological changes such as a high fibronectin (FN) content, irregularly shaped islets and mega-islets. These morphological and growth abnormalities characterize the pre-stages of the disorders which only become clinically evident after second hits. The differentiation abnormality of the local precursors also leads to a reduced number of local tolerogenic DC (suggested in this thesis and by earlier work at the level of the islets in the NOD) as well as an abnormal and often excessive inflammatory response of the local progeny (the microglia, DC and MØ) to TLR stimulation. This will further contribute to the loss of tolerance induction after microbial or necrotic hits and together with the innate T regulatory cell defects in the NOD mouse to the development of autoreactive T and B cells, ultimately leading to endocrine autoimmune disease. In chapter 5 the idea was explored to use serum compounds related to growth and extracellular matrix disturbances of the endocrine tissues, as found in the pre-stages of endocrine autoimmunity in the animal models, to detect pre-stages of AITD in the human. In addition we explored for this purpose also serum compounds related to the deficiencies and the hyper-reactivity of myelo-monocytic cells, as found in the pre-stages of the animal models. We measured tissue growth/remodeling factors, adhesion molecules, chemokines and cytokines in 64 TPO-antibody negative Euthyroid female relatives with at least one 1st or 2nd degree relative with documented autoimmune hyper- or hypothyroidism, 32 of whom did and 32 did not seroconvert to TPO-Abs positivity in 5 year follow-up. The relatives were compared to 32 healthy controls. We found that both sero-converting and non-sero-converting family members showed an up-regulation of FN and a down-regulation of PDGF-BB and of the adhesion and migration factors CCL2, CCL4, sVCAM-1, TIE-2 and MMP-13. The sero-converters differed from the non-sero-converters by up-regulation of the pro-inflammatory compounds IL-1β, IL-6 and CCL3. The results provide proof of principle that pre-sero-conversion stages and sero-conversion to AITD might be predicted using serum analytes related to growth/connective tissue abnormalities and migration/accumulation abnormalities of MØ and DCs, though clearly more explorative work needs to be done. In chapter 6 we measured the serum levels of the myelo-monocytic cell related cytokines/chemokines/adipokines in 144 schizophrenia patients and compared levels to those found in age and gender matched healthy controls. We found that many of the myelo-monocytic factors were increased in the serum of schizophrenia patients. Levels of many factors were found to be linked to (components of) the metabolic syndrome, which is prevalent in schizophrenia. However, the most dominant linkage was found with the disease schizophrenia itself. The study further supported our idea that an increased myelo-monocytic cell activation as a key component for understanding the pathogenesis of schizophrenia.

160 | Summary
In conclusion, outcomes of chapter 5 and 6 (the human studies) indicate that the various (pre-disease) stages of autoimmune endocrine diseases (and probably also of the psychiatric diseases) can in principle be predicted by detecting the abnormalities in the growth and differentiation of the myelo-monocytic cell lineage, the neuroendocrine cells and the connective tissue compartments underlying the pathogenesis of the these disorders. This might be done by finding abnormalities in the serum levels of compounds reflecting these abnormalities, such as:1. Growth and differentiation factors reflecting the neuro-endocrine growth abnormalities, e.g.
in PDGF-BB. 2. Immune compounds reflecting the poor development of DC and MØ, such as reduced
chemokines (this thesis) and cytokines (this thesis),3. Factors reflecting the abnormal connective tissue composition, e.g. FN and MMPs (this
thesis).

161Samenvatting |
samenvatting
Het immuunsysteem is een complex systeem bestaande uit verschillende weefsels met witte bloedcellen en hun boodschapper-moleculen welke samen een organisme beschermen tegen vreemde binnendringende ziektekiemen. Normaal valt het immuunsysteem niet het eigen lichaam aan. Er is sprake van auto-immuniteit wanneer het immuunsysteem abusievelijk de lichaamseigen cellen en weefsels aanvalt. Ziektes die het gevolg zijn van een auto-immuunreactie worden auto-immuunziekten genoemd. De auto-immuunziekten welke worden besproken in dit proefschrift zijn schildklier auto-immuunziekte (of AITD naar ‘AutoImmune Thyroid Disease’), waarbij de schilkliercellen in de schildklier doelwit zijn van het immuunsysteem. De andere ziekte is diabetes mellitus type 1 (T1DM) waarbij de insulineproducerende β-cellen in de eilandjes van Langerhans in de pancreas het doelwit zijn van het immuunsysteem. Verschillende epidemiologische studies hebben aangetoond dat psychiatrische ziekten, AITD en T1DM meer dan bij gewoon toeval met elkaar voorkomen. Niet alleen in de patiënten zelf, maar ook onafhankelijk, in familieleden van deze patiënten; de ziekten zijn dus een “erfelijke” belasting van de families. Dit betekent dat waarschijnlijk een gezamenlijke onderliggende af-wijking verantwoordelijk is voor zowel de beide auto-immuunziektes alsook voor de psychiatrische aandoeningen. De hypothese voor dit proefschrift is geweest dat afwijkingen in een bepaalde soort witte bloedcellen, de zogenaamde myelo-monocytaire cellen (dat is de groep van monocyten, macrofagen en dendritische cellen) de onderliggende oorzaak van deze ziekten zijn. Het doel van dit proefschrift was daarom het bestuderen van de rol van myelo-monocytaire cellen in de ontstaanswijze van AITD, T1DM en psychiatrische aandoeningen. We hebben hiervoor in hoofdstuk 2 en 3 twee verschillende diermodellen onderzocht die een gedrag vertonen dat de hoofdkenmerken van psychiatrisch gedrag in de mens nabijkomt, bijvoorbeeld een zeer angstig en/of terug getrokkengedrag. De proefdier modellen die zijn onderzocht zijn het zogenaamde MIA (naar ‘Maternal Immune Activation’)-muismodel en het NOD (naar ‘Non-Obese Diabetic’)-muismodel. Dit laatste muismodel ontwikkelt ook AITD en T1DM. Wij hebben deze dieren onderzocht om de meest vroege fases (eigenlijk de voorfases) van de hierboven beschreven ziektes te bestuderen. In hoofdstuk 4 hebben wij ons geconcentreerd op de pancreas van de NOD-muis. Daarna hebben we in hoofdstuk 5 en 6 geprobeerd de bevindingen uit de muismodellen toe te passen op de menselijke ziekten. We hebben de hypothese getest of door het kijken naar het gehalte in serum van boodschappermoleculen van myelo-monocytaire cellen het uitbreken van AITD te voorspellen is of schizofrenie te diagnosticeren is. In hoofdstuk 2 van dit proefschrift hebben wij de gevolgen bestudeerd van het verkeerd afgesteld staan van de myelo-monocytaire cellen van het brein. Deze cellen worden microglia genoemd. We laten in dit hoofdstuk zien dat normale microglia bijdragen aan de groei van uitlopers van zenuwcellen en betrokken zijn bij de ontwikkeling van belangrijke hersenstructuren, zoals

162 | Samenvatting
het corpus callosum (de verbinding tussen de linker en rechterhelft van het brein). Daarnaast laten we in dit hoofdstuk zien dat ontstekingsactivatie van de microglia een negatief effect heeft op deze zenuwcel ondersteunende functies. Ontstekingsactivatie van microglia was geïnduceerd in de muizen door middel van genetische modificatie of door middel van het nabootsen van een ernstige infectie tijdens de zwangerschap van de muis (het in de buikholte injecteren van het kapseleiwit van bepaalde bacteriën, dit kapseleiwit wordt LPS genoemd). Beide methodes leiden tot ontstekingsactivatie van microglia. Het bleek dat dit ook effect – via de microglia – had op de opbouw en organisatie van zenuw bundels in het corpus callosum. Daarmee toonden we aan dat ontstekingsactivatie van microglia een negatief effect heeft op de ontwikkeling van de hersenen. In hoofdstuk 3 van dit proefschrift hebben we het NOD-muismodel gebruikt, en ook hier gekeken naar ontstekingsachtige microglia activatie. NOD-muizen worden zeer veel gebruikt als model voor T1DM en AITD. NOD-muizen vertonen daarnaast echter een zeer angstig gedrag. Bovendien vertonen zij een verhoogd terug getrokken (=“depressief”) gedrag na behandeling met LPS, dit in vergelijking tot de moederstam, de CD1-muis, van waaruit de NOD-muis is gefokt. De CD1-muis heeft geen AITD, T1DM en de hierboven beschreven gedragsstoornissen. We vonden dat al onder normale omstandigheden de microglia van de NOD-muizen anders waren en dat zij hun genen in een ander patroon afschrijven. Voornamelijk genen betrokken bij de groei van zenuwen werden anders afgeschreven. Verder vertoonden de NOD microglia een ander afschrijvingspatroon van genen betrokken bij ontsteking; een bepaalde boodschapperstof, namelijk interferon (IFN)-type 1 kwam prominent naar voren, vooral na LPS-injectie. We concludeerden dat mogelijk het afwijkende afschrijvingspatroon van genen betrokken bij de groei van zenuwen leidt tot een abnormale ontwikkeling van hersengebieden betrokken bij het zeer angstige gedrag van NOD-muizen. Daarnaast, zou de preferentiële afschrijving van IFN-type 1 gedreven genen in de microglia van NOD-muizen na behandeling met LPS een rol spelen in het met LPS-geïnduceerde “depressieve” gedrag. We hebben niet alleen gekeken naar de myelo-monocytaire cellen in de hersenen (de micro-glia), maar ook naar dit type cel in de pancreas van de NOD-muis. In de pancreas zijn dendritische cellen en macrofagen de eerste cellen die zich ophopen om de eilandjes van Langerhans in de pancreas om daarna de vernietigende afweerreactie tegen de insulineproducerende β-cellen aan te zwengelen. Dit leidt in de NOD-muis uiteindelijk tot vernietiging van de β-cellen met een absoluut gebrek aan het hormoon insuline (het hoofdkenmerk van T1DM). In hoofdstuk 4 hebben we de delingscapaciteit en het gen-afschrijvingspatroon van dendritische cellen bestudeerd die geïsoleerd waren uit de pancreas van NOD-muizen, nog voor de aanvang van de vernietigende ontstekingsreactie en de ontwikkeling van diabetes. De dendritische cellen in de pancreas van de NOD-muis vertoonden een verlaagde delingscapaciteit en een verlaagde afschrijving van genen betrokken bij belangrijke functies van de dendritische cel, zoals: celvernieuwing, het regelen van het niet-reageren op lichaamseigen stoffen (in de immunologie tolerantie genoemd), de migratie van witte bloedcellen en de productie van groeifactoren (inclusief groeifactoren betrokken bij β-cel groei). Ondanks deze verschillende gebreken, waren de dendritische cellen in

163Samenvatting |
de pancreas van de NOD-muis hyperreactief voor LPS. Zij reageerden met een verhoogde staat van ontsteking. Onze bevindingen waarbij myelo-monocytaire cellen allerlei gebreken vertonen (vooral in de productie van groeifactoren) suggereren dat dit waarschijnlijk kan leiden tot de vroege afwijkingen in de opbouw van de eilandjes (eerder beschreven in het proefschrift van Rosmalen, 2000), de stoornissen in de opbouw van immuuntolerantie en de overdreven reactie op LPS zouden een rol kunnen spelen bij het uitlokken van auto-immuniteit. De bevindingen beschreven in de drie hoofdstukken over de proefdiermodellen tonen - samen met de eerdere proefschriften van onze groep – aan dat onder normale omstandigheden een cruciale rol is weggelegd voor myelo-monocytaire cellen bij het opwekken van immuuntolerantie en de groei en ontwikkeling van de hersenen, de eilandjes van Langerhans en de schildklier. Myelo-monocytaire cellen dragen bij aan de productie van diverse groeifactoren en inductie van groeimechanismen betrokken bij de normale ontwikkeling van hersenstructuren, β-cellen en schildkliercellen. Daarnaast kunnen deze cellen ook afreizen naar de drainerende lymfeklier en belangrijke weefselstoffen (bijvoorbeeld thyreoglubuline en insuline) met zich mee slepen. In de lymfeklieren wekken zij tegen deze weefselstoffen immuuntolerantie op. Echter, wanneer de lokale myelo-monocytaire cellen abusievelijk ontstekingsachtig geactiveerd zijn door bijvoorbeeld een ontwikkelingsstoornis van de myelo-monocytaire cellen zelf, dan zal dit een verstoring van de productie van groeifactoren tot gevolg hebben. Dit kan juist leiden tot een abnormale ontwikkeling van hersenstructuren, eilandjes van Langerhans en schildklier. Ook zal de balans van immuuntolerantie verschuiven naar immunisatie tegen de belangrijke weefselstoffen en auto-immuniteit tegen thyreoglubuline en insuline is dan het gevolg (hoofdkenmerken van respectievelijk AITD en T1DM). In de discussie van dit proefschrift tonen wij een model (Figuur 1A) dat onze bevindingen (en die van anderen) samenvat en integreert. Dit hypothetisch model toont de abnormaliteiten in de groei, celvernieuwing en differentiatie van myelo-monocytaire voorlopercellen cellen als een belangrijke oorzaak in de ontstaanswijze van psychiatrische aandoeningen, AITD en T1DM. De abnormaliteiten in groei en differentiatie (genetisch of door middel van omgevingsfactoren, of beide) resulteren in een nageslacht van abnormale (“primed”) microglia, dendritische cellen en macrofagen met een verminderde ondersteuningscapaciteit voor groei van omliggende cellen in het parenchym en een verminderde tolerantie-inductie capaciteit. In hoofdstuk 5 hebben we onderzocht of de afwijkingen die we in het NOD-diermodel gevonden hebben in de vroegste stadia van T1DM, AITD en gedragsstoornissen, ook gereflecteerd zouden kunnen worden in afwijkingen in de gehaltes in het serum van boodschapperstoffen. Voornamelijk van boodschapperstoffen die een rol spelen bij groei- en ontwikkeling van organen en van boodschapperstoffen, die een rol spelen in de groei, de ontwikkeling en functie van myelo-monocytaire cellen. Wij hebben dit getest in mensen (waarvan serum redelijk gemakkelijk te verkrijgen is) met als doel om de vroegste stadia van AITD bij de mens te detecteren. We hebben daarbij gebruik gemaakt van het Amsterdam Cohort, een groep van vrouwelijke 1e of 2de graad familieleden van patiënten met een gekende AITD. Deze familiegroep heeft een sterk verhoogd

164 | Samenvatting
risico om zelf ook AITD te ontwikkelen, gezien de erfelijke belasting. Uit deze familiegroep hebben wij het serum van 32 familieleden geselecteerd die in het verloop van de studie (5 jaar) de eerste tekenen van AITD ontwikkelden (de SC groep). Deze sera hebben wij vergeleken met de sera van 32 familieleden die geen AITD ontwikkelden in het verloop van de studie (de NSC groep) en met de sera van 32 compleet gezonde personen (de HC groep). In de sera hebben wij een aantal boodschapperstoffen gemeten zoals hierboven vermeld. We vonden (ten opzichte van de HC groep) in het serum van zowel de SC- als de NSC-groep een verhoging van fibronectine en een verlaging van de groei factor PDGF-BB en een verlaging van myelo-monocytaire functiefactoren als CCL2, CCL4, sVCAM-1, TIE-2 en MMP-13. De SC-groep verschilde van de NSC-groep door een verhoging van ontstekingsboodschapperstoffen (IL-1β, IL-6 en CCL3) in het serum. Deze resultaten bieden een “proof of principle” dat zeer vroege fases van AITD voorspeld kunnen worden door middel van bepaling van abnormaliteiten in de serumspiegels van boodschapperstoffen betrokken bij groei en ontwikkeling van organen en de migratie/ophoping en ontstekingsactiviteit van dendritische cellen en macrofagen. Aangezien dit de eerste schoorvoetende pogingen zijn voor zo’n eerste en zeer vroege detectie, is verder onderzoek nodig om een en ander uit te diepen. In hoofdstuk 6 hebben we de serumwaarden van myelo-monocytaire celgerelateerde boodschapperstoffen in 144 schizofrenie patiënten gemeten en vergeleken met de waardes in gezonde controles. We vonden vrijwel alle gemeten factoren verhoogd in het serum van schizofreniepatiënten. De waardes van een groot aantal van deze factoren werden bepaald door niet-psychiatrische factoren zoals vetzucht en een verstoord bloedlipiden-profiel (bijvoorbeeld te veel cholesterol); deze stofwisselingsafwijkingen komen vaak voor bij schizofreniepatiënten. Echter, de sterkste relatie werd toch gevonden met de ziekte schizofrenie zelf. Deze studie ondersteund dus het idee dat een verhoogde ontstekingsachtige activiteit van myelo-monocytaire cellen een sleutelrol speelt in het ontstaan van schizofrenie. Concluderend uit de resultaten beschreven in hoofdstuk 5 en 6 (patiënten studies) zijn er sterke aanwijzingen dat de verschillende (voor) stadia van endocriene auto-immuun ziektes (en waarschijnlijk ook psychiatrische aandoeningen) voorspeld kunnen worden door middel van detectie van afwijkingen in de groei, differentiatie en functie van myelo-monocytaire cellen, zenuw cellen, hormoonproducerende cellen en steuncellen welke een rol spelen bij de patho-genese van deze ziektes.

165Abbreviations |
Abbreviations
Ab: AntibodyAITD: Autoimmune thyroid diseaseAPC: Antigen-presenting cellBD: Bipolar disorderBM: Bone marrowBrdU: BromodeoxyuridineCC: Corpus callosumCCL: Chemokine (C-C motif) ligandCCR: C-C chemokine receptor typeCD: Cluster of differentiationCDP: common Dendritic Cell progenitorCMP: common myeloid progenitor, CNS: Central nervous systemDAMP: Danger-associated molecular patternDAP12: DNAX-activation protein 12DC: Dendritic cellDEG: Differentially expressed genesE: Embryonic dayELISA: Enzyme-Linked Immunosorbent AssayFDR: False discovery rateFGF: fibroblast growth factor FN: FibronectinGD: Graves’ diseaseGMP: granulocyte and Macrophage progenitor, GNDF: glial cell line-derived neurotrophic factor HC: Healthy controlsHDL: High-density lipoproteinHSC: Hematopoietic stem cell, HT: Hashimoto’s thyroiditisICAM-1: Intercellular Adhesion Molecule-1IDO: Indoleamine-pyrrole 2,3-dioxygenaseIFN: InterferonIG: Induseum griseum IL-: Interleukin-
IQR: interquartile rangeLPS: LipopolysaccharideMD: Major depressive disorderMDP: Macrophage and Dendritic Cell progenitor metS: Metabolic syndromeMI: Maternal inflammation MIA: Maternal immune activationMMP: Matrix metalloproteinaseMØ: MacrophageNF-κB: nuclear factor kappa-light-chain-enhancer of activated B cellsNGF: Nerve growth factorNMDA: N-methyl-D-aspartateNO-: Nitric Oxide Nrp1: Neuropilin 1NSC: Non-SeroConvertersNT: neurotrophin OGTT: oral glucose tolerance testOX-LDL: Oxidized-Low-density lipoproteinPCA: Principle component analysisPDGF: Platelet-derived growth factorPET: Positron emission tomographyPNCD: programmed neuronal cell deathPoly (I:C): Polyinosinic:polycytidylic acidqPCR: Quantitative polymerase chain reactionQUIN: Quinolinic acidRMA: Robust Multichip AverageSC: SeroConvertersSCS: Subcallosal slingSTAT: Signal transducer and activator of transcriptionSZ: SchizophreniaT1DM: Type 1 diabetes mellitusTg: ThyroglobulinTG: triglycerides

166 | Abbreviations
TGF-β2: Transforming growth factor-beta 2Th: T helperTHBS-1: Thrombospondin-1TIE-2: Angiopoietin-1 receptorTLR: Toll like receptor
TNF-α: Tumor necrosis factor αTPO: Thyroid peroxidaseTreg: Regulatory T cellsTSPO: Translocator proteinVCAM-1: Vascular cell adhesion protein 1

167Dankwoord |
Dankwoord - Acknowledgements
Waarschijnlijk is dit voor de meeste mensen het meest interessante hoofdstuk (en zoals mijn voorgangers het vaak verwoorden, het meest gelezen hoofdstuk). Als eerste wil ik iedereen bedanken voor de inhoudelijke en morele steun tijdens de afgelopen 5 jaar. Hoewel ik blij ben dat mijn/ons onderzoek nu voor een groot deel is afgerond, heb ik dit met ontzettend veel plezier gedaan. Professor dr. Rob Benner en professor dr. herbert hooijkaas, ik wil u beiden bedanken voor de mogelijkheid om mijn promotieonderzoek op de afdeling immunologie te kunnen uitvoeren. Ik heb met zeer veel plezier op de afdeling immunologie gewerkt. Professor dr. Drexhage, beste hemmo, bedankt voor de 5 mooie jaren. Ik heb ontzettend veel van u geleerd. Ik wil u bedanken voor alle hulp bij het schrijven van de diverse papers en uiteraard dit boekje. Vooral uw inzicht in het combineren en integreren van de resultaten – van soms compleet verschillende studies – was ontzettend waardevol. Hoewel ik uiteindelijk een ander pad heb gekozen, wil ik u toch bedanken voor alle kansen die u mij hebt geboden om verder te gaan als wetenschappelijk onderzoeker. Ik hoop dat we samen in de toekomst nog diverse lopende studies kunnen afronden. Dr. Versnel, beste Marjan, ook jij bedankt voor de 5 mooie jaren. Ik vond het erg fijn om met je, als mijn mentor in het wetenschappelijk onderzoek, samen te werken. Hoewel mijn onderzoek deels buiten jouw vakgebied valt, heb je toch een onmisbare bijdrage kunnen leveren aan mijn promotieonderzoek. Ik weet niet hoe je het deed, maar als ik een artikel of presentatie naar je stuurde, had je deze meestal dezelfde dag al gelezen en van opmerkingen voorzien. Dat was erg prettig, want de meeste wetenschappers staan niet echt bekend om hun snelheid. Ik mis onze wekelijkse, of eigenlijk dagelijkse praatjes over van alles en nog wat (maar meestal over computers). I would like to thank the members of the reading committee: Dr. Liesbeth van Rossum, Professor Dr. Herbert Hooijkaas and Dr. Andrew Harkin. Thank you for your review of my thesis. In addition, I would like to thank Professor Dr. Steven Kushner, Dr. Alain Bessis, Dr. Tanja Nikolic and Dr. Pieter Leenen for participating in my dissertation committee. Lieve Corine, eindelijk na al die jaren kan ik je officieel bedanken voor je hulp en gezelligheid. Het was nooit saai met jou in het lab (met een vlieg in je schouder, knieblessures, cryostaatwonden enz.). Ik hoop wel dat je een volgende AiO toch een wat subtielere introductie in het EDC geeft. Want je uitspraak op mijn eerste werkdag: “Je gaat toch niet flauwvallen he, zoals de vorige AiO?!?” vergeet ik nooit meer. Ondanks alles () heb ik een hele leuk tijd (ik had het niet willen missen) samen op het lab en in het EDC gehad. Lieve jo, bedankt voor alle hulp, gezelligheid en de grote lol die we samen hebben gehad. Helaas heb ik je een jaartje moeten missen, maar gelukkig kwam je weer terug, sterker dan ooit. Ik heb alleen maar meer respect voor je gekregen op de manier hoe je het allemaal voor elkaar

168 | Dankwoord
heb gekregen nu ik zelf ook een kindje heb. Ik mis al ons geklooi (het juiste woord denk ik) op lab met droogijs, gehakte organen en mislukte perfusie’s. Lieve Zana, doctor/dokter Zana, bedankt voor al je medische adviezen door de jaren heen; ik heb zoveel nuttige medische feitjes van je geleerd. Daarnaast was je kennis van statistiek erg nuttig voor diverse hoofstukken van dit boekje! Bij ieder pijntje of plekje kan jij een lijst van zeker 10 zeer ernstige aandoeningen opnoemen; gelukkig viel het altijd mee. Het was geweldig om te zien met hoeveel passie en inzet jij je werk als arts en onderzoeker uitvoerde. Ik vond het erg gezellig om samen op de kamer te zitten en bijna dagelijks te discussiëren over van alles en nog wat. En als reactie op jouw dankwoord; het viel best mee om de enige man op de kamer te zijn ;-). Lieve Karin, “I hate my job, but love the gossip ;-)” Bedankt voor alle gezelligheid en wetenschappelijke discussies die we hadden op het werk en bijna dagelijks in de trein. Je bent in een korte tijd een echte Hagenees geworden. Het was grappig als jij weer met nieuwe plekken in Den Haag aankwam die zelfs voor mij nog onbekend waren. Ik hoop dat we ooit nog eens kunnen samenwerken, maar een biertje op de grote markt of aan het strand zal zeker snel gebeuren. Lieve naomi, ik vond het vanaf de eerste dag supergezellig om met je samen te werken! Hopelijk krijg ik volgend jaar jouw proefschrift! Je hebt in ieder geval in een korte tijd er een hoop ervaringsdeskundigen bijgekregen. Wij komen je hopelijk ooit een keer opzoeken op Curaçao om lekker een cocktailtje drinken op het strand! Beste harm, bedank voor al je hulp, inzicht en gezelligheid de afgelopen jaren. Ik denk dat jij de afgelopen jaren op bijna elke vraag een antwoord en voor elk probleem wel een oplossing had. Ik denk dat een heel groot aantal docenten een voorbeeld kunnen nemen aan jouw manier van lesgeven/uitleggen aan leerlingen en studenten. Jouw geduld en vrolijkheid stelde ik erg op prijs. Ik hoop dat ik je in de toekomst nog af en toe mag lastig vallen met diverse wetenschappelijk-technische problemen. Lieve Angelique, bedankt voor al je steun bij moeilijke beslissingen en administratieve problemen en natuurlijk je gezelligheid de afgelopen jaren. Het was ontzettend leuk om samen al die mooie steden te bezoeken tijdens onze jaarlijkse Moodinflame tripjes. Ik denk dat Parijs en Milaan wel een hoogtepunt waren. Lieve Annemarie, bedankt voor al je hulp, gezelligheid op het lab en tijdens onze vele Moodinflame reisjes. Beste thomas, bedankt voor alle discussies en de lol die we op het lab hebben gehad. Van droogijs bommen tot kapotte stikstofvaten. Lieve Karin B, onze trip naar Günzburg was echt supergezellig en zal ik nooit meer vergeten! Heel veel succes met de laatste loodjes van je proefschrift! Beste Pieter, bedankt voor je al je hulp. Of het nu over macrofagen, histologie of FACS-experimenten ging, jouw advies was altijd ontzettend nuttig. Normaals bedankt voor het plaatsnemen in mijn promotiecommissie.

169Dankwoord |
Dear sinead, it was nice to work together in Dublin and Rotterdam. I am sorry that I left before we could really start new cool experiments. Thank you for all your work on the NOD microglia chapter and looking forward to complete this manuscript! Dear Lorena and sabrina, it was very nice working with you. I really enjoyed spending time with you in the lab and the “after-work-time” at our favorite Belgian beer bar! It was fun and I promise to visit Paris very soon! Dear Dr. Alain Bessis, thank you for participating in my thesis defense committee. I loved working together studying the embryonic microglia and combining different scientific fields to unravel its mysteries. I guess we solved a few, but also created many new! I would also use this section to remember Professor Dr. tom Connor who passed away on 26th February 2013. It came to me as a shock hearing that the world lost a great scientist and very nice person. My thoughts go out to your family, friends, colleagues and students who all loved you very much. Dear Dr. Andrew harkin, thank you very much of participating both in my reading as well as in my dissertation committee. Thank you for the warm welcome during my visit to Dublin. Beste Dr. Dan Cohen, bedankt voor de prettige samenwerking. Ik wil ook alle dames van het secretariaat bedanken voor alle ondersteuning de afgelopen 5 jaar. Alle andere collega Aio’s, analisten en wetenschappers bedankt voor de gezelligheid, hulp en samenwerking. Vooral: edwin, Benjamin en halima voor alle ‘sorteerklussen’, zelfs tot na werktijd. A3 voor de mooie tijd op het lab! Roos het was supergezellig de eerste twee jaren samen op de kamer! joey, bedankt voor alle lol inclusief de vage YouTube filmpjes. Lucy, we miss you and hopefully I will be reading your thesis soon! Rosanne, ik vond het een eer om je stagebegeleider te mogen zijn. Het was echt supergezellig en ik kijk nu al uit naar jouw promotie. Professor Dr. jon Laman, bedankt voor uw interesse en goede discussies de afgelopen jaren. Thanks/bedankt: Chris my Apple fanboy, Ilker, Esther, Barry, Julia, Anjali, Jeroen, Prayer, Connie, Ruth, Wouter, Magda (2x), Jan-Piet, Patrick, Odelia, Bas, Ewout, Kim, Leendert, Hanna, Nicole, Anna, Prisca, Lizenka, Armanda, Hessel, Kim, Alice, Sandra, Wendy and ALL other colleagues! Dear colleagues and friends at ProQR, thank you for your moral and scientific support during the last few months. I go to work every day with a smile on my face; I love doing science at ProQR. Special thanks go out to Daniel and Tita for providing me a great opportunity to do top notch science and finding a cure for CF! Lieve Henriëtte, har, waarschijnlijk ben je de meest creatieve persoon die ik ken. Als je nu begint, heb je over 50 jaar misschien de complete structuur van het humane genoom bij elkaar gehaakt. Bedankt voor alles en natuurlijk je geweldige rol als onze ceremoniemeester. Mark, ergens heb ik het altijd wel jammer gevonden dat je ook niet de biologische kant op bent gegaan. Met jou nauwkeurigheid en doorzettingsvermogen had je een geweldige onderzoeker kunnen zijn. Ik mis onze vrijdag game/movie avonden en ik ben bang dat we daar

170 | Dankwoord
over misschien 25 jaar weer tijd voor hebben. Ik hoop dat we, samen met Patries en de kinderen, nog veel mooie dingen mogen meemaken. Mark, we hebben het altijd over de goede oude tijd (‘vroegah’). Maar we moeten niet vergeten dat eigenlijk elke dag weer een feest is. Zeker als we weer eens een keertje samen erop uit gaan. We moeten vaker afspreken, voor je het weet heb je kinderen ;-). We hebben een hoop meegemaakt en ik weet zeker dat we later met een hapje en een drankje (uit de wereldbol) kunnen terugkijken op een geweldige tijd. Ook jij Warscha, bedankt voor je vriendschap, hulp en alle afleiding van al het wetenschappelijke onderzoek. jenny, ondanks dat we totaal verschillende personen zijn, kunnen we niet zonder elkaar. Voor ‘baby-advies’ ben jij een van de eerste naar wie ik ga! Ik hoop dat we samen met Lola, jacky en Ruben nog veel leuke dingen mogen doen; misschien toch een keertje met z’n allen naar Lefkos? ton en joke, pap en mam, ik weet nog heel goed dat jullie tegen mij zeiden dat ik beter geen technische studie kon kiezen, omdat ik dan altijd zou moeten blijven leren om bij te blijven met de laatste ontwikkelingen. Ik ben nu bijna 30 en klaar met mijn studie, maar bang dat ik als wetenschapper nooit klaar ben met leren. Ik ben blij dat jullie me altijd heb gesteund in alle keuzes die ik heb gemaakt Ik hoop dat we nu weer tijd vinden om te gaan mountainbiken, 100km lopen, mijn huis afmaken en zo nu en dan naar Griekenland te gaan. Bedankt voor al jullie onvoorwaardelijke liefde en steun. Rani, mijn ‘sayang’, jij bent mijn grote liefde en steun sinds we elkaar leerden kennen tijdens onze studie. De laatste 5 jaar was voor ons ook een geweldige tijd. Van een hele kleine studentenkamer naar ons eerste huis; heel veel mooie reizen, onze trouwerij en natuurlijk de geboorte van Zoey! Ik hou van je. Zoey, mijn lieve schat, je hebt vooral de laatste loodjes van mijn promotie tot een uitdaging gemaakt. Gelukkig maakt alleen al jouw lach, zelfs om 4 uur in de nacht, alles weer goed. Ik zou het erg leuk vinden als je zelf ook ooit voor de ‘wetenschap’ kiest!

171Curriculum vitae |
Curriculum vitae
Wouter Beumer was born in The Hague in on the 25th of September in 1984. Wouter graduated in 2002 from secondary school at the Dalton Lyceum in The Hague. Wouter started in 2002 with his bachelor’s and master’s studies Life science & Technology at Leiden University and Delft University of technology. In 2006, he did his master thesis project at Organon N.V. in Oss entitled: ‘Transcriptional regulation of early BMP response genes and role of S1P2 in (pre-) osteoblast migration’. In 2007, he worked as part of the science based business program as a business development intern at Shanghai Genomics in Shanghai, China. He obtained his master degree (and engineering degree) cum laude in 2008. Wouter started with his PhD project in 2008 under the supervision of Dr. Marjan Versnel and Prof.dr. Hemmo Drexhage at the department of immunology in the Erasmus MC. He works, since March 2013, as a scientist responsible for the pre-clinical development and safety of a next-generation RNA correction therapy for cystic fibrosis at ProQR Therapeutics B.V. in Leiden.


173List of publications |
List of publications
Pont-Lezica L, Beumer W, Colasse S, Drexhage HA, Versnel MA, Bessis A. Microglia shape corpus callosum axon tract fasciculation: functional impact of prenatal inflammation. Submitted for publication.
Beumer W, Versnel MA, Drexhage HA, Gibney SM. The altered gene expression profile of microglia of the NOD mouse. Manuscript will be adjusted for publication.
Beumer W*, Welzen-Coppens JMC*, van Helden-Meeuwsen CG, Gibney SM, Drexhage HA, Versnel MA. The gene expression profile of CD11c+CD8α- dendritic cells in the pre-diabetic pancreas of the NOD mouse. Submitted for publication.
Beumer W*, Effraimidis G*, Drexhage RC, Wiersinga WM, Drexhage HA. Changes in serum adhesion molecules, chemokines, cytokines, and tissue remodeling factors in euthyroid women without thyroid antibodies who are at risk for autoimmune thyroid disease: a hypothesis on the early phases of the endocrine autoimmune reaction. J Clin Endocrinol Metab. 2013 Jun;98(6):2460-8
Beumer W, Gibney SM, Drexhage RC, Pont-Lezica L, Doorduin J, Klein HC, Steiner J, Connor TJ, Harkin A, Versnel MA, Drexhage HA. The immune theory of psychiatric diseases: a key role for activated microglia and circulating monocytes. J Leukoc Biol. 2012 Nov;92(5):959-75
Brkic Z, Maria NI, van Helden-Meeuwsen CG, van de Merwe JP, van Daele PL, Dalm VA, Wildenberg ME, Beumer W, Drexhage HA, Versnel MA. Prevalence of interferon type I signature in CD14 monocytes of patients with Sjogren’s syndrome and association with disease activity and BAFF gene expression. Ann Rheum Dis. 2013 May;72(5):728-35
Beumer W, Drexhage RC, De Wit H, Versnel MA, Drexhage HA*, Cohen D*. Increased level of serum cytokines, chemokines and adipokines in patients with schizophrenia is associated with disease and metabolic syndrome. Psychoneuroendocrinology. 2012 Apr 26.
The mononuclear phagocyte system and its cytokine inflammatory networks in schizophrenia and bipolar disorder. Drexhage RC, Knijff EM, Padmos RC, Heul-Nieuwenhuijzen L, Beumer W, Versnel MA, Drexhage HA. - Expert Rev Neurother. 2010 Jan;10(1):59-76.

174 | List of publications
Sphingosine-1-phosphate acts as a developmental stage specific inhibitor of platelet-derived growth factor-induced chemotaxis of osteoblasts. Roelofsen T*, Akkers R*, Beumer W, Apotheker M, Steeghs I, van de Ven J, Gelderblom C, Garritsen A, Dechering K. - J Cell Biochem. 2008 Nov 1;105(4):1128-38.
*Authors contributed equally.

175PhD Portfolio |
PhD Portfolio
Name PhD student: Wouter Beumer
Erasmus MC Department: Immunology
Research School: Molecular Medicine (MolMed)
PhD Period: July 2008 – November 2013
Promotor: Prof.dr. H. A. Drexhage
Copromotor: Dr. M. A. Versnel
PhD training Year
Courses and workshops
Course on Laboratory Animal Science (Utrecht University) 2008
Course on Neuro-Immuno-Endocrinology 2009
Molecular immunology 2009
The Workshop on Basic Data analysis on gene expression arrays II 2009
The course Molecular Diagnostics IV 2009
Scientific Writing in English for Publication 2010
The Photoshop CS3 Workshop for PhD-students and other researchers 2010
The Basic course on ‘R’ 2010
The course on the Analysis of microarray gene expression data using R/BioC and web tools 2011
The Next Generation Sequencing (NGS) Data analysis Course 2012
Teaching activities
Supervisor histology and immunology workshops for 1st and 2nd year medical students 2008-2012
Supervisor of master-student internship 2011-2012
Posters and presentations
Annual moodinflame meeting 2008 (Rotterdam): poster 2008
Annual moodinflame meeting 2009 (Günzburg): poster 2009
10th Psychoimmunology Expert meeting 2009 (Günzburg): poster 2009
Annual moodinflame meeting 2010 (Munster): poster 2010
2nd International Conference on Immune Tolerance (Amsterdam): poster 2011
Annual moodinflame meeting 2011 (Paris): poster 2011
Immune Tolerance and Autoimmune Disease Conference (Cambridge): poster 2012
11th Psychoimmunology Expert meeting 2012 (Günzburg): workshop presentation 2012
Annual moodinflame meeting 2012 (Milan): poster 2012