
Tunable bipolar optical interactions between guided lightwaves
15
Li, Pernice,Tang March 29, 2009 Tunable bipolar optical interactions between guided lightwaves Mo Li 1 , W. H. P. Pernice 1 , H. X. Tang 1 1 Departments of Electrical Engineering, Yale University, New Haven, CT 06511, USA The optical binding forces between guided lightwaves in dielectric waveguides can be either repulsive or attractive. So far only attractive force has been observed. Here we experimentally demonstrate a bipolar optical force between coupled nanomechanical waveguides. Both attractive and repulsive optical forces are obtained. The sign of the force can be switched reversibly by tuning the relative phase of the interacting lightwaves. This tunable, bipolar interaction forms the foundation for the operation of a new class of light force devices and circuits. State-of-the-art advances in nanophotonics allow light to be highly concentrated in nanoscale waveguides or resonators with high refractive index contrast. In closely spaced devices the coupling between the guided lightwaves gives rise to an optical force known as the “optical binding force”. According to recent theoretical predictions 1-4 , the polarity of this force is either attractive or repulsive depending on the relative phase between the interacting lightwaves. Recently, attractive-type optical force was experimentally demonstrated in suspended photonic structures 5 , whereas repulsive optical force has not been confirmed yet. However, repulsive optical force is indispensible for achieving reversible force control in a wide range of applications such as tunable photonic devices 6 , optomechanical signal processing and all-optical
Transcript of Tunable bipolar optical interactions between guided lightwaves

Li, Pernice,Tang March 29, 2009
Tunable bipolar optical interactions between guided lightwaves
Mo Li1, W. H. P. Pernice1, H. X. Tang1
1Departments of Electrical Engineering, Yale University, New Haven, CT 06511, USA
The optical binding forces between guided lightwaves in dielectric waveguides can be either
repulsive or attractive. So far only attractive force has been observed. Here we
experimentally demonstrate a bipolar optical force between coupled nanomechanical
waveguides. Both attractive and repulsive optical forces are obtained. The sign of the force
can be switched reversibly by tuning the relative phase of the interacting lightwaves. This
tunable, bipolar interaction forms the foundation for the operation of a new class of light
force devices and circuits.
State-of-the-art advances in nanophotonics allow light to be highly concentrated in
nanoscale waveguides or resonators with high refractive index contrast. In closely spaced
devices the coupling between the guided lightwaves gives rise to an optical force known as the
“optical binding force”. According to recent theoretical predictions1-4, the polarity of this force is
either attractive or repulsive depending on the relative phase between the interacting lightwaves.
Recently, attractive-type optical force was experimentally demonstrated in suspended
photonic structures5, whereas repulsive optical force has not been confirmed yet. However,
repulsive optical force is indispensible for achieving reversible force control in a wide range of
applications such as tunable photonic devices6, optomechanical signal processing and all-optical

-2-
switching7. In addition, future developments of cavity optomechanics8 will benefit from an
optomechanical force of tunable sign.
The optical force is a form of electrodynamic interaction that is of classical origin and
intrinsic to Maxwell equations. This classical force is closely related to the electrodynamic force
arising from vacuum quantum fluctuations, known as the Casimir force9-11. It was recently
demonstrated that the Casimir force can be bipolar if the dielectric properties of the interacting
media are carefully chosen12.
The challenge of obtaining the repulsive optical force lies in achieving independent phase
control of interacting lightwaves in coupled systems. In this work, we demonstrate repulsive
optical force between lightwaves guided in two coupled optical waveguides. We further
demonstrate in-situ bipolar tuning of this force, from repulsive to attractive and vice versa, by
adjusting the relative phase of the optical modes. This unified picture of optical forces represents
a significant advance from the previously observed unipolar optical force4 and verifies recent
theories1-4,13.
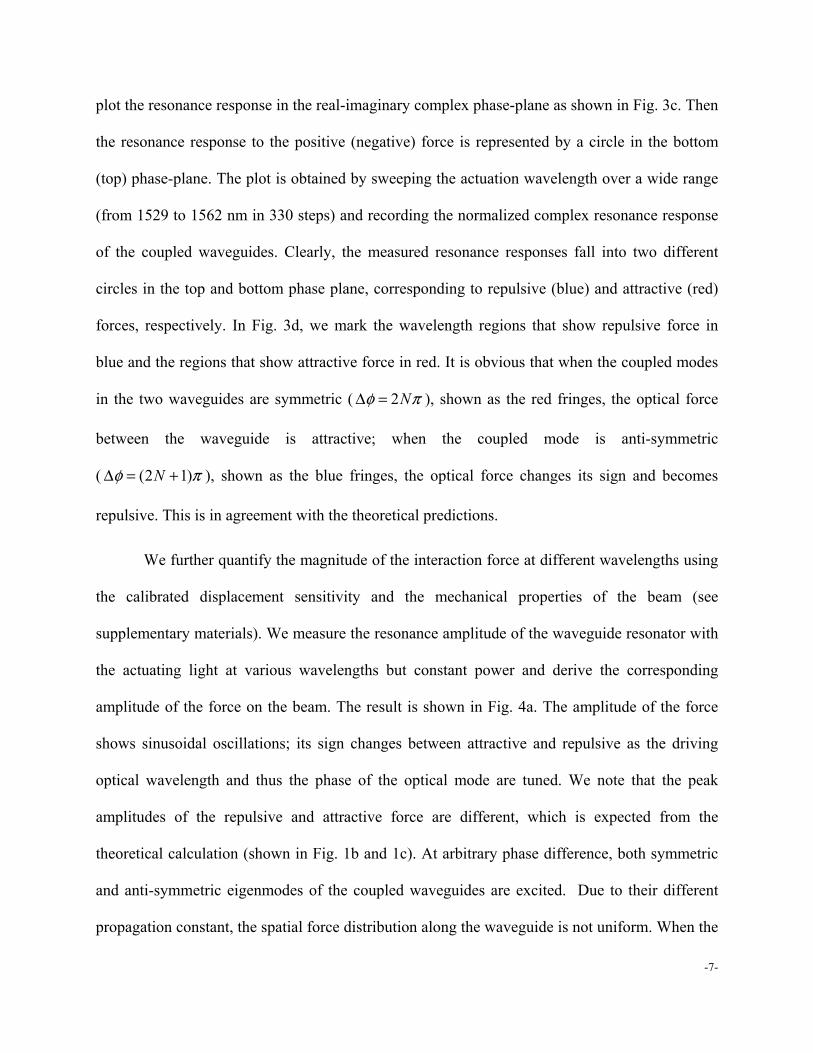
Considering two proximate dielectric waveguides separated by gap g as depicted in Fig.
1a, propagating lightwaves in each waveguide interact through the excitation of dipole
oscillations. The optically excited dipoles in one waveguide interact with the evanescent field of
the other waveguide and generate a force which is dependent on the separation of the
waveguides and the relative phase of optical modes. When the modes are in phase ( 0φ = ), the
optical force is always attractive; when the modes are out of phase ( πφ = ), the resulting force is
repulsive when the separation is larger than a critical value gc as shown in Fig. 1b. Here the
calculation is carried out for two identical single-mode silicon waveguides with a cross-section
of 300×220 nm2. Beyond gc, when the phase difference is varied, the sign of the force oscillates
-3-
between positive and negative values as shown in Fig. 1c. In Fig. 1d, we plot the calculated
amplitude of the force versus the separation g between the waveguides and the relative phase φ
between the optical modes.
When the two waveguides are free-standing, this interaction force causes mechanical
displacement of the beams: the attractive optical force pulls the two waveguides closer while the
repulsive force pushes them apart, as schematically shown in the insets of Fig.1b. By measuring
the amplitude of the relative nanomechanical motion in response to optical excitation, the
magnitude of the force between the waveguides can be precisely quantified. The sign of the force
is determined from the phase of the vector response.
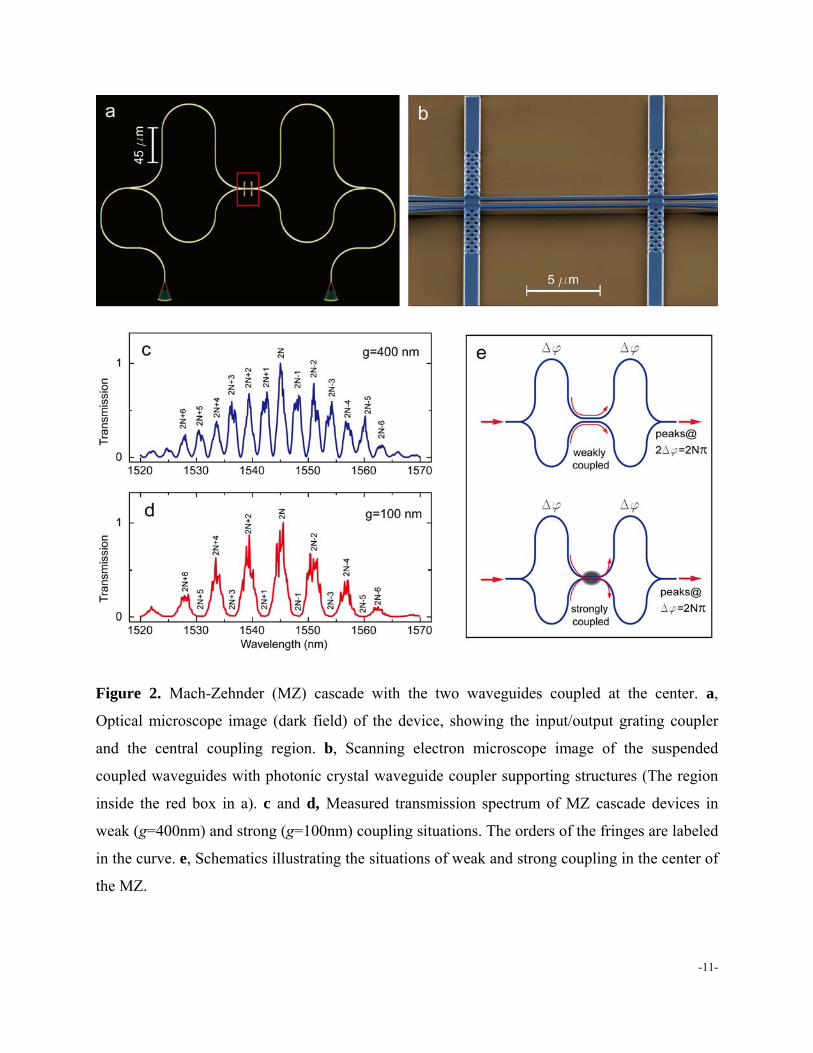
We employ a Mach-Zehnder (MZ) cascade configuration to control the phase difference
between the incoming lightwaves (Fig. 2a) by adjusting the input wavelength. The MZ is
separated into two symmetric halves, joined by a central coupling region (Fig. 2b). In each half
of the MZ, the path length of the top arm is 90 µm longer than the bottom arm. In the 12 µm long
coupling region, the top and bottom waveguides are brought together to allow the lightwaves to
overlap. As shown in the scanning electron microscope (SEM) image in Fig. 2b, the coupled
waveguides are suspended from the substrate so that they are free to move in-plane when a
interaction force arises between them. The unsuspended parts of the waveguides have a cross-
section of 500nm × 220nm, whereas in the suspended regime they are tapered down to 300nm ×
220nm to maximize in-plane optomechanical interactions. In order to provide precise control of
the beam length and to attain rigid mechanical support, the waveguides are joined through a pair
of 2×2 photonic crystal waveguide couplers. The couplers are optimized for low-loss
transmission and cause minimal perturbation of the waveguide modes. (Details of waveguide and
coupler designs are presented in the supplementary materials.)
-4-
After passing through the first half of the MZ, the lightwaves in the top and bottom arms
gain a phase difference of eff2π /n Lφ λΔ = ⋅ Δ . Here neff is the effective index of the waveguide,
ΔL is the path length difference and λ is the wavelength. After leaving the coupling region the
optical modes gain the same φΔ in the second half of the MZ before they are combined at the
output. Clear interference patterns can be measured in the transmission spectrum of the device,
as shown in Fig. 2c (g=400nm) and Fig. 2e (g=100nm). The separation g between the two
waveguides in the coupling region impacts the phase properties of the MZ. When g is large, the
coupling between the two waveguides is weak so that the phase difference of the lightwaves in
both waveguides is maintained in the coupling region, except for a small amount of phase shift
due to the coupling. However, when g is small, the optical modes in the two waveguides will
couple strongly. As a result the two halves of the MZ are decoupled and the transmission
spectrum is similar to that of two short MZs joined in series, with 90 μm path length difference
in each. These two situations are schematically shown in Fig. 2e. In Fig. 2c, the periodicity of the
fringes is ~3nm at 1550 nm wavelength, corresponding to a total path length difference of 180
µm and a group index of ~4 in the silicon waveguides. From the observed good extinction ratio it
is clear that the optical field intensity in the two arms is well balanced. The situation is changed
for the strongly coupled case shown in Fig. 2d, where every other of the interference fringes in
Fig. 2c disappears. Comparing the two spectra allows us to determine the order (even or odd) of
each interference fringe, as labeled in Fig. 2c and d. A detailed analysis of the coupling effect
using coupled mode theory (CMT) is described in supplementary materials.
In the following we focus on the weak coupling regime where the optical phase
difference in the two waveguides can be well controlled. At the peaks of the transmission
spectrum (Fig. 2c), the total phase difference at the output of the MZ cascade satisfies the
-5-
condition 2 2Mφ πΔ = , where M is an integer. Therefore due the symmetry, in each half of the
MZ, the phase difference is Mφ πΔ = . The orders of adjacent peaks in the interference pattern
are M=2N and M=2N+1, respectively. At the central coupling region, the optical modes are in-
phase (symmetric) if 2Nφ πΔ = and out-of-phase (anti-symmetric) if (2 1)Nφ πΔ = + . By tuning
the input wavelength we can thus selectively excite the in-phase or out-of-phase optical modes of
the central coupling region. This allows us to precisely control the sign of the interaction force,
which is negative for the symmetric mode and positive for the anti-symmetric mode.
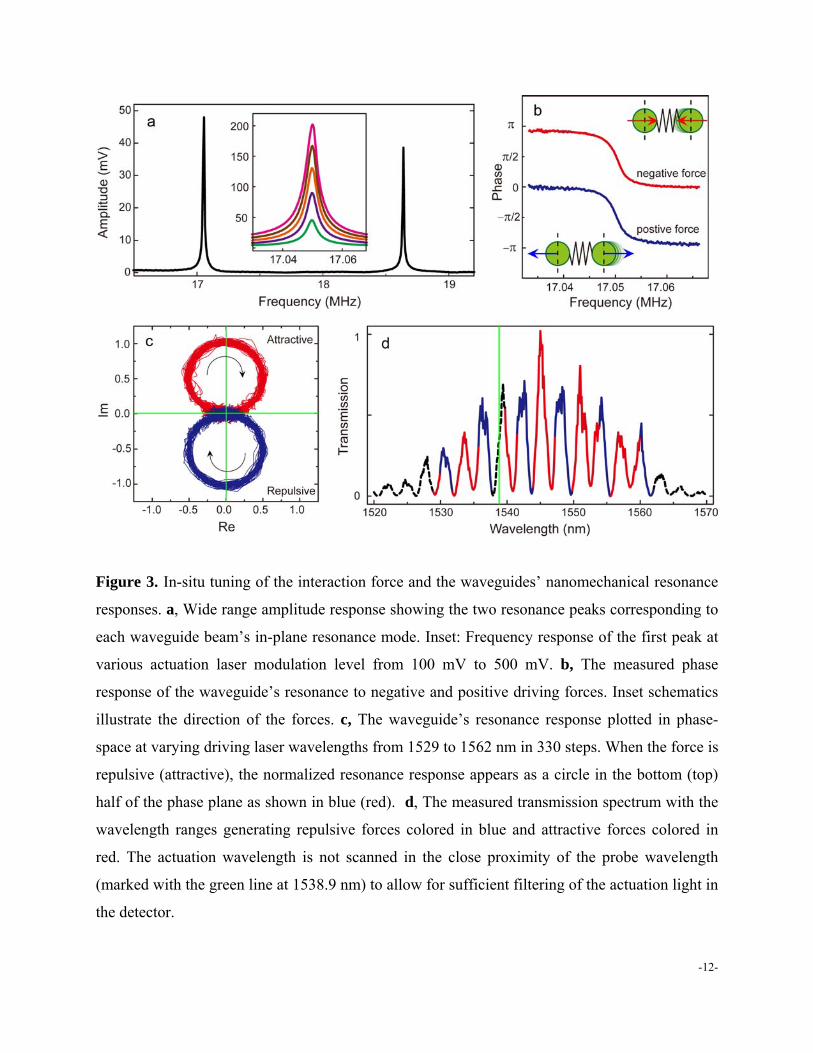
The optically excited mechanical responses of the suspended waveguides are then used to
measure the lightwave interaction forces. An actuating light is amplitude modulated, generating
dynamic interaction forces between the waveguides. A probing light of fixed wavelength, offset
from the actuating light, is applied at the maximal slope (the quadrature point) of the even order
interference fringe to detect the nanomechanical motion of the waveguides using an
interferometric method5. As shown in Fig. 3a, two prominent resonance peaks are observed at
frequencies of 17.05 and 18.64 MHz, with quality factors of 5300 and 5400, respectively. These
correspond to the in-plane fundamental vibration modes of each suspended waveguide; the very
weak out-of-plane fundamental resonances are found at lower frequencies of ~11 MHz. Because
the separation between the waveguides and substrate are intentionally large (~1 µm), the out-of-
plane gradient optical force is insignificant in this case5. The difference of the observed
resonance frequencies of the two waveguides is attributed to the unbalanced mechanical
clamping and fabrication imperfection (see supplementary materials).
To quantify the interaction force between the waveguides, the resonance of either
waveguide can be used, since we only measure their relative motion. Here, we focus on the
waveguide with lower resonance frequency. At this frequency, the higher frequency waveguide
-6-
is off-resonance and can be treated as quasi-stationary. In the linear regime, the waveguide’s
resonating amplitude is proportional to the modulation amplitude of the actuating light power
(inset, Fig. 3a). The resonator’s phase response to an external harmonic driving force can be used
to determine the sign of the driving force unambiguously. This can be seen from the simple
response function of a forced resonator14:
0 2 20 0
( ) ( )( / )
Fg g gm i Q
δ ω ωω ω ω ω
= − =− +
(1),
where ω is the angular frequency, ω0 is the resonance frequency, F is the driving force, m is the
mass, and Q is the quality factor. A positive sign of F indicates that the force pushes the beams
apart ( 0gδ > ); a negative sign of F indicates that the force pulls the beam closer ( 0gδ < ). By
matching above expression to the observed resonance curves in both amplitude and phase, we
can determine the sign of the force F. The observed optical signal is related to the displacement
gδ by a transduction factor 0( / ) /G T T gδ= Δ which has a constant positive value of 2.2 μm-1
when the probing light is fixed at the quadrature of an even order interference fringe (1538.9 nm
in Fig. 2c; the calibration procedure is described in supplementary materials.). However, the
exact value and sign of G will not affect the determination of the sign of the measured force F
because the detected signal is normalized to this factor in all the measurements. According to
equation (1), when F is positive, the resonator’s phase changes from 0 to –π when the actuation
frequency is swept through the resonance frequency from low to high frequencies. When F turns
negative, the phase will be shifted by π and thus evolve from π to 0. Such an effect is observed
and shown in Fig. 3b when the actuation laser wavelength is tuned from an even order fringe
(red) to the adjacent odd order fringe (blue). This π phase shift indicates that the direction of the
force has changed sign, from attractive (negative) to repulsive (positive). It is more illustrative to
-7-
plot the resonance response in the real-imaginary complex phase-plane as shown in Fig. 3c. Then
the resonance response to the positive (negative) force is represented by a circle in the bottom
(top) phase-plane. The plot is obtained by sweeping the actuation wavelength over a wide range
(from 1529 to 1562 nm in 330 steps) and recording the normalized complex resonance response
of the coupled waveguides. Clearly, the measured resonance responses fall into two different
circles in the top and bottom phase plane, corresponding to repulsive (blue) and attractive (red)
forces, respectively. In Fig. 3d, we mark the wavelength regions that show repulsive force in
blue and the regions that show attractive force in red. It is obvious that when the coupled modes
in the two waveguides are symmetric ( 2Nφ πΔ = ), shown as the red fringes, the optical force
between the waveguide is attractive; when the coupled mode is anti-symmetric
( (2 1)Nφ πΔ = + ), shown as the blue fringes, the optical force changes its sign and becomes
repulsive. This is in agreement with the theoretical predictions.
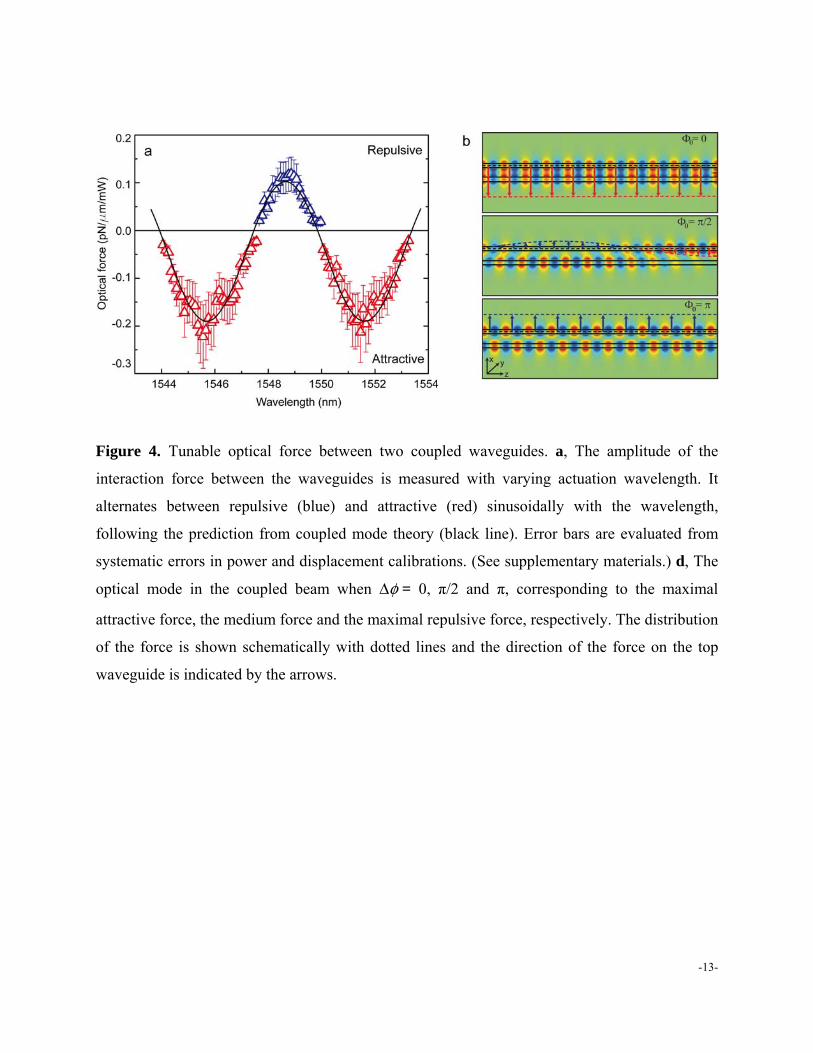
We further quantify the magnitude of the interaction force at different wavelengths using
the calibrated displacement sensitivity and the mechanical properties of the beam (see
supplementary materials). We measure the resonance amplitude of the waveguide resonator with
the actuating light at various wavelengths but constant power and derive the corresponding
amplitude of the force on the beam. The result is shown in Fig. 4a. The amplitude of the force
shows sinusoidal oscillations; its sign changes between attractive and repulsive as the driving
optical wavelength and thus the phase of the optical mode are tuned. We note that the peak
amplitudes of the repulsive and attractive force are different, which is expected from the
theoretical calculation (shown in Fig. 1b and 1c). At arbitrary phase difference, both symmetric
and anti-symmetric eigenmodes of the coupled waveguides are excited. Due to their different
propagation constant, the spatial force distribution along the waveguide is not uniform. When the
-8-
initial phase difference is not 0 or π, the direction of the force along the waveguides alternates
between repulsive and attractive. Thus, the observed net force is the integration of the distributed
optical force over the length of the coupled waveguides. This force distribution is modeled using
coupled mode theory (CMT). The numerical calculation results for φΔ =0, π/2, and π are
displayed in Fig. 4b, showing the evolution of the optical mode and the force distribution on the
waveguides. In Fig. 4a, the net optical force for arbitrary initial phase difference is calculated and
fitted with the data, showing quantitative agreement with the experimental result.
In summary, a bipolar optical force of classical origin has been observed through active
control of the phase fronts of coupled optical modes. The sign of the force is tunable in-situ by
adjusting the wavelength of the light. This planar optomechanical interaction promises
significant advantage for device integration and multiplexing15. Full exploitation of this tunable
force will enable a new class of light force driven devices and circuits to be realized on a
ubiquitous silicon platform in which mechanical components can interact with light routed
through waveguides in a layout similar to electronic circuits. Furthermore, the bipolarity of the
force is of great interest for cavity optomechanics16-19, where the sign of an optical spring could
be reversed simply by tuning the phase.
-9-
METHODS SUMMARY
The photonic devices are fabricated on silicon-on-insulator wafers with a 220 nm top silicon
layer and a 3 μm thick buried oxide layer. Electron beam lithography and plasma etching are
employed to pattern the waveguide structures. Release of the suspended waveguide is achieved
by wet chemical etching of the oxide layer using buffered oxide etchant (BOE). Since only the
in-plane coupling between waveguides is studied, the etching time is kept long enough to ensure
that the release gap is made larger than ~ 1 μm, in order to minimize substrate coupling. We note
that in our experiments, while we are able to achieve high precision device repeatability in the
photonic domain, the mechanical resonance frequency of the devices show deviations from the
expected values in a ±10% range. Several fabrication issues contribute to this distribution
including the lithographical repeatability, the residual stress and uncontrolled undercut and
clamping.
A pump-probe scheme employing an actuation laser and a probing laser is applied to
excite and measure the optical force induced nanomechanical motion of the waveguides. The
actuation laser is amplitude modulated with an electro-optical modulator. The response is
measured in the transmitted signal, after passing through a band-pass inline tunable filter (1nm -
3dB bandwidth) centered at the probing wavelength, using a high-speed photodetector (New
Focus 1811) and a vector network/spectrum analyzer.
-10-
Figures
Figure 1. Optical interaction between two coupled waveguides. a, Schematic illustration of
two suspended waveguides. b, The optical force between the waveguides as a function of their
separation for symmetric and anti-symmetric coupled modes. c, The amplitude of the optical
force oscillates with the relative phase between the modes in each waveguide at a fixed
separation of 400 nm. d, Numerical simulation result of the optical force as a function of both the
waveguide separation and the phase difference.
-11-
Figure 2. Mach-Zehnder (MZ) cascade with the two waveguides coupled at the center. a,
Optical microscope image (dark field) of the device, showing the input/output grating coupler
and the central coupling region. b, Scanning electron microscope image of the suspended
coupled waveguides with photonic crystal waveguide coupler supporting structures (The region
inside the red box in a). c and d, Measured transmission spectrum of MZ cascade devices in
weak (g=400nm) and strong (g=100nm) coupling situations. The orders of the fringes are labeled
in the curve. e, Schematics illustrating the situations of weak and strong coupling in the center of
the MZ.
-12-
Figure 3. In-situ tuning of the interaction force and the waveguides’ nanomechanical resonance
responses. a, Wide range amplitude response showing the two resonance peaks corresponding to
each waveguide beam’s in-plane resonance mode. Inset: Frequency response of the first peak at
various actuation laser modulation level from 100 mV to 500 mV. b, The measured phase
response of the waveguide’s resonance to negative and positive driving forces. Inset schematics
illustrate the direction of the forces. c, The waveguide’s resonance response plotted in phase-
space at varying driving laser wavelengths from 1529 to 1562 nm in 330 steps. When the force is
repulsive (attractive), the normalized resonance response appears as a circle in the bottom (top)
half of the phase plane as shown in blue (red). d, The measured transmission spectrum with the
wavelength ranges generating repulsive forces colored in blue and attractive forces colored in
red. The actuation wavelength is not scanned in the close proximity of the probe wavelength
(marked with the green line at 1538.9 nm) to allow for sufficient filtering of the actuation light in
the detector.
-13-
Figure 4. Tunable optical force between two coupled waveguides. a, The amplitude of the
interaction force between the waveguides is measured with varying actuation wavelength. It
alternates between repulsive (blue) and attractive (red) sinusoidally with the wavelength,
following the prediction from coupled mode theory (black line). Error bars are evaluated from
systematic errors in power and displacement calibrations. (See supplementary materials.) d, The
optical mode in the coupled beam when φΔ = 0, π/2 and π, corresponding to the maximal
attractive force, the medium force and the maximal repulsive force, respectively. The distribution
of the force is shown schematically with dotted lines and the direction of the force on the top
waveguide is indicated by the arrows.
-14-
Acknowledgement:
We acknowledge a seedling grant from DARPA/MTO. W.H.P.P. acknowledges support from the
Alexander von Humboldt postdoctoral fellowship program. H.X.T. acknowledges support from
Yale Institute of Nanoscience and Quantum Engineering and a career award from National
Science Foundation. The devices were fabricated at Yale University Microelectronic Center and
the NSF-sponsored Cornell Nanoscale Facility.
Reference:
1 Povinelli, M. L. et al. Evanescent-wave bonding between optical waveguides. Opt. Lett. 30, 3042-3044 (2005).
2 Ng, J., Chan, C. T., Sheng, P. & Lin, Z. F. Strong optical force induced by morphology-dependent resonances. Opt. Lett. 30, 1956-1958 (2005).
3 Mizrahi, A. & Schachter, L. Mirror manipulation by attractive and repulsive forces of guided waves. Opt. Express 13, 9804-9811 (2005).
4 Rakich, P. T., Popovic, M. A., Soljacic, M. & Ippen, E. P. Trapping, corralling and spectral bonding of optical resonances through optically induced potentials. Nat Photon 1, 658-665 (2007).
5 Li, M. et al. Harnessing optical forces in integrated photonic circuits. Nature 456, 480-484 (2008).
6 Huang, M. C. Y., Zhou, Y. & Chang-Hasnain, C. J. A nanoelectromechanical tunable laser. Nature Photon. 2, 180-184 (2008).
7 Vlasov, Y., Green, W. M. J. & Xia, F. High-throughput silicon nanophotonic wavelength-insensitive switch for on-chip optical networks. Nature Photon. 2, 242-246 (2008).
8 Kippenberg, T. J. & Vahala, K. J. Cavity opto-mechanics. Opt. Express 15, 17172-17205 (2007).
9 Casimir, H. B. G. & Polder, D. The Influence of Retardation on the London-Vanderwaals Forces. Physical Review 73, 360-372 (1948).
10 Lamoreaux, S. K. Demonstration of the casimir force in the 0.6 to 6 mu m range. Phys. Rev. Lett. 78, 5-8 (1997).
11 Chan, H. B. Quantum mechanical actuation of microelectromechanical systems by the Casimir force. Science 293, 1766-1766 (2001).
12 Munday, J. N., Capasso, F. & Parsegian, V. A. Measured long-range repulsive Casimir-Lifshitz forces. Nature 457, 170-173 (2009).
13 Mizrahi, A. & Schachter, L. Two-slab all-optical spring. Opt. Lett. 32, 692-694 (2007). 14 Feynman, R. P., Leighton, R. B. & Sands, M. L. The Feynman lectures on physics. Vol. I
(Addison-Wesley, 1989).

-15-
15 Masmanidis, S. C. et al. Multifunctional nanomechanical systems via tunably coupled piezoelectric actuation. Science 317, 780-783 (2007).
16 Kippenberg, T. J. & Vahala, K. J. Cavity optomechanics: Back-action at the mesoscale. Science 321, 1172-1176 (2008).
17 LaHaye, M. D., Buu, O., Camarota, B. & Schwab, K. C. Approaching the quantum limit of a nanomechanical resonator. Science 304, 74-77 (2004).
18 Wilson-Rae, I., Nooshi, N., Zwerger, W. & Kippenberg, T. J. Theory of Ground State Cooling of a Mechanical Oscillator Using Dynamical Backaction. Phys. Rev. Lett. 99, 093901 (2007).
19 Thompson, J. D. et al. Strong dispersive coupling of a high-finesse cavity to a micromechanical membrane. Nature 452, 72-75 (2008).