Spectral reflectance properties of carbonaceous chondrites: 1. CI chondrites
This article appeared in a journal published by Elsevier. The attachedcopy is furnished to the author for internal non-commercial researchand education use, including for instruction at the authors institution
and sharing with colleagues.
Other uses, including reproduction and distribution, or selling orlicensing copies, or posting to personal, institutional or third party
websites are prohibited.
In most cases authors are permitted to post their version of thearticle (e.g. in Word or Tex form) to their personal website orinstitutional repository. Authors requiring further information
regarding Elsevier’s archiving and manuscript policies areencouraged to visit:
http://www.elsevier.com/copyright
Author's personal copy
a n a l y t i c a c h i m i c a a c t a 6 3 0 ( 2 0 0 8 ) 141–149
avai lab le at www.sc iencedi rec t .com
journa l homepage: www.e lsev ier .com/ locate /aca
Benefits of applying combined diffuse reflectance FTIRspectroscopy and principal component analysis for thestudy of blue tempera historical painting
Natalia Navasa,∗, Julia Romero-Pastorb, Eloisa Manzanoa, Carolina Cardell b
a Dept. of Analytical Chemistry, University of Granada, Fuentenueva s/n, 18071 Granada, Spainb Dept. of Mineralogy and Petrology, University of Granada, Fuentenueva s/n, 18071 Granada, Spain
a r t i c l e i n f o
Article history:
Received 26 June 2008
Received in revised form
29 September 2008
Accepted 2 October 2008
Published on line 14 October 2008
Keywords:
Diffuse reflectance infrared Fourier
transform spectroscopy
Transmittance-spectroscopy
Principal component analysis
Blue tempera paintings
Painting heritage conservation
a b s t r a c t
This paper explores the application of diffuse reflectance infrared Fourier transform spec-
troscopy (DRIFTS) to the examination of historic blue pigments and blue tempera paintings
commonly found on works of art. The discussion is mainly focused on the practical benefits
of using this technique joined to principal component analysis (PCA), a powerful multivari-
ate analysis tool. Thanks to the study of several replica samples that contain either pure
blue pigments (azurite, lapis lazuli and smalt), or pure binder (rabbit glue) and mixtures of
each of the pigments with the binder (tempera samples), different aspects of these bene-
fits are highlighted. Comparative results of direct spectra and multivariate analysis using
transmittance-Fourier transform infrared spectroscopy (T-FTIR) are discussed throughout
this study. Results showed an excellent ability of PCA on DRIFT spectra for discriminat-
ing replica samples according to differing composition. Several IR regions were tested with
this aim; the fingerprint IR region exhibited the best ability for successfully clustering the
samples. The presence of the binder was also discriminated. Only using this approach it
was possible to completely separate all the studied replica samples. This demonstrates
the potential benefits of this approach in identifying historical pigments and binders for
conservation and restoration purposes in the field of Cultural Heritage.
© 2008 Elsevier B.V. All rights reserved.
1. Introduction
Scientific study of artwork is of interest in order to testthe suitability of analytical techniques on matrices differentfrom those classically examined. Historical paintings are oftenheterogeneous microlayered materials made of complex mix-tures of inorganic and organic compounds applied on diversesupports, as for instance stone, canvas, wood and paper. Sinceancient times, painters have tried out a variety of organicmaterials to mix with inorganic pigments. These componentscan be simultaneously present in different layers of paint
∗ Corresponding author. Tel.: +34 958 243388; fax: +34 958 243328.E-mail address: [email protected] (N. Navas).
stratigraphy, making the recognition of paint constituents adifficult challenge for chemists [1–3]. The identification of pig-ments and binders when mixed is one of the most importanttasks in the field of painting heritage, in order to establish suit-able actions for both restoration and conservation and allowproper preservation.
Spectroscopic techniques offer great potential to solvemany of the problems associated with the characterisationof the materials constituting works of art. Fourier transforminfrared spectroscopy in its traditional mode of transmit-tance (T-FTIR) is particularly important because of the variety
0003-2670/$ – see front matter © 2008 Elsevier B.V. All rights reserved.doi:10.1016/j.aca.2008.10.008
Author's personal copy
142 a n a l y t i c a c h i m i c a a c t a 6 3 0 ( 2 0 0 8 ) 141–149
of information contained in the spectra – i.e. data of bothorganic and inorganic compounds – and because of its varietyof possibilities for sample measurements. Therefore, T-FTIRspectroscopy has become one of the most important analyticaltechniques in the field of Cultural Heritage [4,5]. In addition,it is a reasonable low cost technique compared with otheranalytical methods. However, T-FTIR has limitations relatedto particle size (when minerals are present) and the nega-tive effect on spectrum baseline. On the other hand, samplingrestrictions imposed in artworks limit the amount of sampleto work with, which in the particular case of T-FTIR tech-nique makes it difficult to prepare the pellet and to acquirea standard spectrum. In the case of composite materials likeancient paintings, the interpretation of the T-FTIR spectramay be extremely arduous to resolve. By contrast, interest-ing results could be achieved by analysing the specimen inreflectance mode (diffuse reflectance infrared Fourier trans-form (DRIFT) spectroscopy) though at present this techniquehas been scarcely used in Cultural Heritage [6] contrary toother scientific fields [7–9]. Recently, reflectance spectroscopyin the UV–visible region has shown to be useful for environ-mental monitoring conditions in museums [10,11].
DRIFTS refers to a particular FTIR sampling techniquebased on reflectance measurements [12]. The increasing appli-cation of DRIFTS is related to the development of opticaldevices using special attachments for standard spectrometers[13]. This technique is particularly useful in the investigationsof powdered samples. Moreover, it is accepted to be a verylow impact method since only a very small quantity of pow-dered sample is needed (∼5–10 �g) unlike the T-FTIR mode(∼30–50 �g) [14]. This makes it very attractive in the field ofPainting Cultural Heritage, where non-destructive techniquesand/or micro-destructive techniques are preferred. Neverthe-less, in the specialised literature only one article has beenfound regarding the application of DRIFT spectroscopy to char-acterise paintings components, providing a diffuse reflectanceFTIR spectral database of 25 dyes and pigments [6]. Thus, thepresent work represents an advance in this research field,since for the first time a study of the application of factorialanalysis such as principal component analysis (PCA) is usedto compare T-FTIR and DRIFTS spectral data obtained fromhistorical pigments and binders. Application of chemometricstools for the characterisation and conservation of Cultural Her-itage is a well-established procedure [15]. Several works haverecently demonstrated the usefulness of these approachesfor calibrations [16], ageing detection [17–19], classification[20,21], and dating purposes [22].
This paper describes the benefits of using DRIFT spec-troscopy versus T-FTIR spectroscopy, each joined with PCA asa tool in Heritage Science. Three blue pigments, i.e. azurite(Cu3(CO3)2(OH)2), lapis lazuli (Na6Ca2(Al6Si6O24)S2) and smalt(Co-K silicate glass), and rabbit glue as binder (proteinaceousmedium) were selected to carry out this study since they havebeen widely used through historical epochs. Seven replicatesamples, i.e. pure pigment samples, pure glue sample and pig-ment/glue mixture samples (tempera samples), were preparedand measured with both molecular vibrational techniques,i.e. T-FTIR and DRIFT, which allowed direct evaluation of theobtained spectral data. Comparative discussion of the directspectra obtained by both spectroscopic modes is discussed
throughout this work. PCA was performed separately on thespectral data from both FTIR modes to evaluate the capabil-ity of this multivariate tool to discriminate between differentsample compositions. Only when the PCA was performed onthe spectral data from DRIFT, it was possible to successfullydiscriminate all replicate samples by their composition.
2. Experimental
2.1. Reagents
Reagents were chosen based on their widespread use throughhistory, in particular during the Middle Ages and Renaissance.Azurite is a non-expensive hydrated copper carbonate min-eral of composition Cu3(CO3)2(OH)2. It was the most importantpigment in European paintings until near the end of the17th century. Azurite has a bright blue colour that sometimesresembles lapis lazuli, and the two were often confused [23].In addition to azurite, by far the most important blue in theMiddle Ages was lapis lazuli. This vivid rich blue pigment ismade by grinding the semi-precious rock lapis lazuli whosemain constituent is the mineral lazurite (Na8–10Al6Si6O24S2-
-4). The first noted use of the stone as pigment was in 6th-and 7th-century AD cave paintings in Afghan temples. Lapislazuli pigment found its most extensive use in 14th and 15thcenturies, illuminating manuscripts and Italian panel paint-ings, often reserved for the cloaks of Christ and the Virgin.It is famous for having been the most expensive pigment[23]. Smalt is an artificial pigment made of fine to coarselyground potassium cobalt glass. The blue colour is due to smallamounts of cobalt added as cobalt oxide during manufacture.Since ancient times, smalt was used to colour and decorateglasses, though powdered cobalt glass was also employed aspigment. Smalt was an important pigment in European oilpaintings. In Italy it was little used in the 14th and 15th cen-turies but became a substitute for azurite and lapis lazuli inthe 17th century [24].
The azurite and smalt pigments were purchased fromKremer Pigments GmbH & Co. KG (Madrid, Spain). Pigmentreferences are: 10,200 natural azurite (CI: PB 30.77420) withparticle size 0–120 �m, and 10,010 blue smalt (CI: PB 32.77365)with particle size 0–80 �m. The lapis lazuli was supplied byCaremi Pigmentos (Sevilla, Spain). Pigment reference is natu-ral Lapis lazuli Afghanistan, medium blue.
The standard protein binder selected was rabbit skin glue(collagen). This binder has been used since ancient times,mostly in traditional woodworking, gilding and paintings dueto its high strength, viscosity and elasticity. It was purchasedfrom Sigma (Barcelona, Spain).
Potassium bromide was used as a non-absorbing referencematerial for the spectroscopic background measurement. Itwas purchased from Merck (Damstadt, Germany).
2.2. Replica samples
Seven painting replica samples were prepared to emulate realpaint layers according to old master recipes to obtain stan-dards similar to those used by medieval artists [25]. The first,second and third replicas comprise each of the three pure pig-

Author's personal copy
a n a l y t i c a c h i m i c a a c t a 6 3 0 ( 2 0 0 8 ) 141–149 143
Table 1 – Replica sample composition.
Replica sample Binder Pigment
Pure samples1 – Azurite2 – Lapis lazuli3 – Smalt4 Rabbit glue –
Tempera samples5 Rabbit glue Azurite6 Rabbit glue Lapis lazuli7 Rabbit glue Smalt
ments (azurite, lapis lazuli and smalt), and the fourth replicathe pure rabbit glue binder (Table 1). Preparation of the purepigment samples was as follows: 5 g of powder pigment wasformed as a crater-shaped mass and six drops of pure water(total volume of 30 �L) were added until a dense paste wasattained. Then, four layers of the obtained paste were sequen-tially spread out with a paintbrush in fine coats on a glassslide. Each layer needs to dry thoroughly before applying thenext. This is the traditional way to obtain an opaque paintedlayer and to guarantee full luminosity of the colour, otherwiseit immediately appears dead. The pure binder sample (fourthreplica) was prepared as follows: 10 g of rabbit glue was diluted10% in ultra pure water (MILIQ) by gently adding the glue to thewater during 24 h, and stirring periodically. Next the obtainedblend was gradually heated in a bain-marie below 50 ◦C toobtain a homogeneous mixture. Then the glue was carefullyspread on a glass slide with a paintbrush in six successivefine coats, each applied after the previous layer had dried to aconstant weight using a gel air dryer system.
The fifth, sixth and seventh replicas include mixturesbetween glue and each of the pure pigments, i.e. azurite, lapislazuli and smalt, thus blue tempera replicate samples wereobtained. They were prepared by blending the pigment withthe glue – both components elaborated as above – in a ratio5.2:1 (w/v) (Table 1). Next, mixtures were spread on glass slidesin three fine coats. This procedure was adapted to emulate realpaint layers as found in ancient paintings. Tempera is a paint-ing method in which finely ground pigments are mixed with asolidifying proteinaceous binding agent, such as egg, animalglue and casein [26]. Well known from antiquity, tempera wasthe exclusive panel medium in the Middle Ages and the earlyRenaissance, and in Italy it was not supplanted by oil untilca.1500.
2.3. Instrument and software
The FTIR spectra were collected using a NICOLET spectrome-ter 20SXB, working in transmission mode (T-FTIR) and diffusereflectance mode (DRIFT). The instrument was connected toa Pentium 200 and the instrument software was OMNIC v 4.1,running under Windows 2000 Professional (Microsoft Corpo-ration, USA).
The T-FTIR spectra were registered from 3999 to 400 cm−1
with a resolution of 2 cm−1 and 200 scans. Each replica sam-ple was characterised by 10 T-FTIR spectra, except the pureglue replica sample (25 T-FTIR spectra). These spectra wereobtained from KBr pellets prepared by homogeneously mixing
Fig. 1 – Sample compartment and optical accessories formeasuring diffuse reflection in the spectroscopicequipment.
aliquots removed from seven random locations on the glassslide (KBr in 1%). In this way, T-FTIR spectra were independentfrom the position where the powder micro-sample was takenfrom the glass slide. Baseline correction was performed in allT-FTIR spectra.
In order to better discriminate the Fresnel reflectance, theSPECTRA-TECH attachment Model COLLECTOR (Sutton, Sur-rey, England, SM1 1TH) was used to measure the diffusereflectance in the FTIR spectrometer. This optical accessoryuses a focusing mirror to collimate the beam on the sam-ple surface and collect the IR energy (Fig. 1). Aliquots werealso taken from seven random places from each replica sam-ple and later mixed with the potassium bromide used asdiluent and for the background spectra. The mixture (5% inKBr) was placed in a micro-sample cup (3 mm diameter). Inthis case, the sample consumed in the preparation of theKBr medium is reduced compare to that required for T-FTIRanalysis, using only 1–5 �g of powder sample. For comparisonpurposes, DRIFTS spectra were scanned at the same exper-imental conditions (resolving power 2 cm−1 and 200 scans)as in transmission mode. Likewise each replica sample wascharacterised by 10 DRIFT spectra, except for pure glue replicasample (25 DRIFT spectra). These spectra were converted toKubelka–Munk units [12].
Chemometric data analysis was done using StatisticalProduct and Service Solutions program (SPSS, for WindowsVer. 15, USA) and Excel 2000 (Microsoft Corporation, USA).
3. Results and discussion
3.1. Direct spectrometric analysis
Scientific examination and comparative investigation of his-torical pigments in the laboratory is fundamental to furtheranalyse and understand real painted artworks, in additionto be of particular usefulness for conservators. Furthermore,knowledge of the properties of ancient pigments and theirresponse and sensitivity to specific spectroscopic methods arerelevant in Science Heritage. In this context, the three bluepigments, i.e. azurite, lapis lazuli and smalt were investigatedby means of diffuse reflectance infrared spectroscopy (DRIFTS)and transmittance Fourier transform infrared spectroscopy forcomparison purposes.
Author's personal copy
144 a n a l y t i c a c h i m i c a a c t a 6 3 0 ( 2 0 0 8 ) 141–149
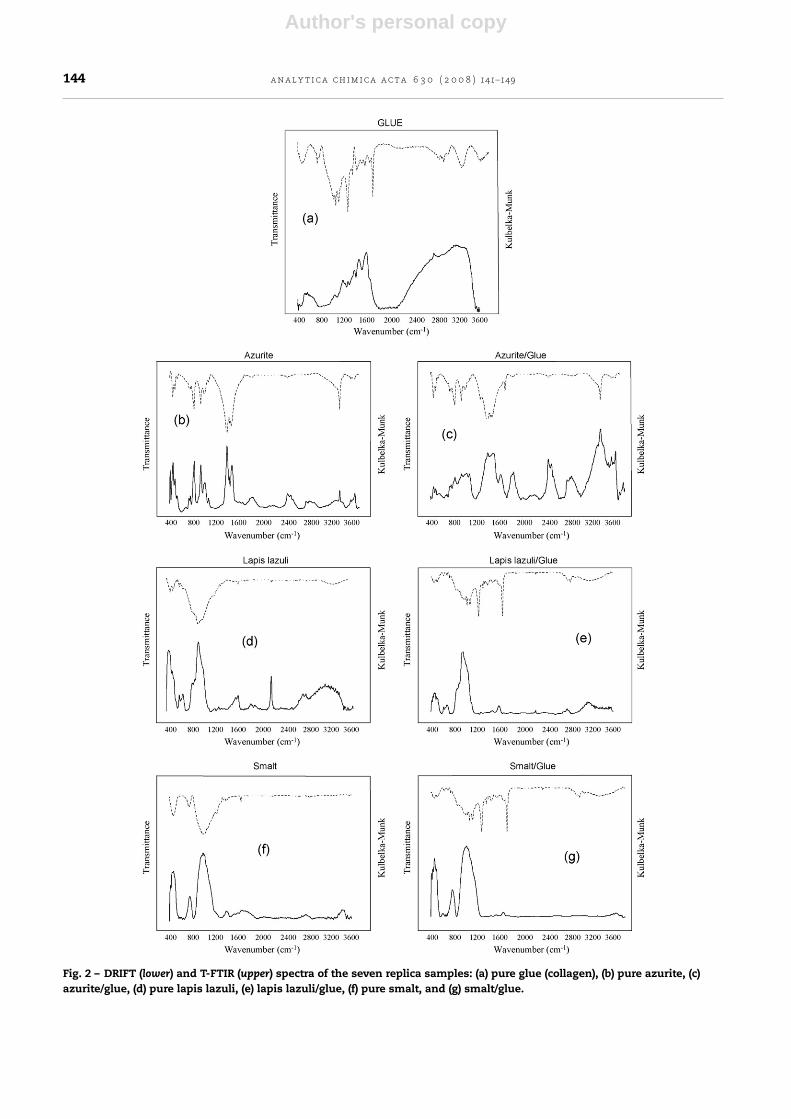
Fig. 2 – DRIFT (lower) and T-FTIR (upper) spectra of the seven replica samples: (a) pure glue (collagen), (b) pure azurite, (c)azurite/glue, (d) pure lapis lazuli, (e) lapis lazuli/glue, (f) pure smalt, and (g) smalt/glue.

Author's personal copy
a n a l y t i c a c h i m i c a a c t a 6 3 0 ( 2 0 0 8 ) 141–149 145
Table 2 – Main IR absorption bands of the blue pigments and their temperas for identifications purposes.
Replica sample Description Vibrational wavenumber (cm−1)
T-FTIR DRIFT
Pure rabbitglue
Collagen 700 (� (NH) wagging band) 680, 3000 [31]1290 (amide band II)1730 (amide band I)3310 (N–H stretching mode)
Pure azurite Cu3(CO3)2(OH)2 840 (carbonate stretching [28]) 840 (as in T-FTIR)1430 (carbonate stretching [28]) 1430 (as in T-FTIR)
Azurite/rabbitglue
Cu3(CO3)2(OH)2/collagen 840 (carbonate stretching [28]) 840 (as in T-FTIR)1430 (carbonate stretching [28]) 1430 (as in T-FTIR)
1890, 2510, 2890
Pure lapis lazuli Na8–10Al6Si6O24S2–4 460 (O–Si–O deformation mode [29,30]) 460 (as in T-FTIR)990 (O–Si–O anti-symmetric stretchingmode [29,30])
990 (as in T-FTIR)
Lapis lazuli/rabbitglue
Na8–10Al6Si6O24S2–4/collagen 460 (O–Si–O deformation mode [29,30]) 460 (as in T-FTIR)990 (O–Si–O anti-symmetric stretchingmode [29,30])
990 (as in T-FTIR)
1290 (amide band II)1730 (amide band I)
Pure smalt Potassium silicate glass with somecobalt oxide
480 (O–Si–O deformation mode [29,30]) 480 (as in T-FTIR)1030 (O–Si–O anti-symmetric stretchingmode [29,30])
1030 (as in T-FTIR)
Smalt/rabbitglue
Potassium silicate glass with somecobalt oxide/collagen
480 (O–Si–O deformation mode [29,30]) 480 (as in T-FTIR)1030 (O–Si–O anti-symmetric stretchingmode [29,30])
1030 (as in T-FTIR)
1290 (amide band II)1730 (amide band I)
Fig. 2 shows simultaneously both the DRIFT (lower) andthe T-FTIR (upper) spectra of the seven replica samples. Themain vibrational wavenumbers observed in all these spectraare recorded in Table 2.
For the replica samples studied in the present work, thecomparison of the DRIFT spectra with the T-FTIR in terms ofbaseline shows no clear advantage of one technique over theother, since the quality of both type of spectra were similar forboth pure replica samples and tempera replica samples. Theposition of the absorption bands was also similar in DRIFT andT-FTIR spectra, except in the case of pure glue replica sam-ple. However, the relative intensity of the bands was clearlydifferent, being more intense in the case of DRIFT spectra,particularly the secondary absorption bands [27]. This charac-teristic of DRIFT spectra, i.e. the most prominent vibrationalbands, reveals this technique more suitable for purposes ofidentification and characterisation of pigments, both whenpure or mixed with binder.
Specifically, pure azurite presents bands at 1430 and840 cm−1 that can be assigned to carbonate stretching [28]and a band at 3430 cm−1 related to the O–H stretching mode(Fig. 2b). Pure lapis lazuli and pure smalt present two promi-nent and specific bands that can be used as markers for thesilicate group [29,30]. The observed bands at 460 and 480 cm−1
respectively are related to the (O–Si–O) deformation mode,whereas the bands at 990 cm−1 (lapis lazuli) and 1030 cm−1
(smalt) are assigned to the (Si–O–Si) anti-symmetric stretchingmode.
DRIFT and T-FTIR spectra for the pure glue replica sampleswere not entirely complementary (Fig. 2a). T-FTIR showed a
prominent amide band I at 1730 cm−1 and the combined N–Hdeformation and C–N stretching vibration, the amide II of thesecondary amides, at 1290 cm−1 [31]. The band at 3310 cm−1
was assigned to the N–H stretching modes. In addition, thereis a very wide ı (NH) wagging band at around 700 cm−1. DRIFTspectra showed two wide bands in accordance with previouswork [31] located at around 1680 and 3200 cm−1.
The presence of glue in the replica pigment samples intro-duced several changes in both types of spectra, DRIFT andT-FTIR. The T-FTIR spectra of azurite when pure or mixedwith glue were similar, with only a small band at 1730 cm−1
(the amide band I) indicating the presence of the binder. Lapislazuli and smalt glue tempera samples can be distinguishedfrom their corresponding pure replica samples by the amidebands I and II in the T-FTIR spectra (1730 and 1290 cm−1,respectively) attributed to the presence of glue. These bandswere not detected in the corresponding DRIFT spectra. Byvisual examination of the lapis lazuli and smalt DRIFT spectra– the two silicate-based pigments – it was not possible to dis-tinguish the presence of glue in the replica samples. In the caseof azurite, the presence of glue in the replica sample could bedetected mainly by means of the DRIFT spectra, since bands ataround 1890, 2510, 2890 and 3430 cm−1 increased their relativeintensity with respect to the corresponding DRIFT spectra ofthe pure azurite samples.
Consistent with these results, direct analysis of the spectraobtained by the two spectroscopic FTIR modes showed thatDRIFT spectra better identify pigments, both when pure ormixed with binder. This ability was also extended to the identi-fication of the glue when mixed with azurite. This information

Author's personal copy
146 a n a l y t i c a c h i m i c a a c t a 6 3 0 ( 2 0 0 8 ) 141–149
is relevant since it will permit further investigation of the azu-rite/glue interaction by DRIFT spectra. Nevertheless in the caseof the silicate-based pigments (lapis and smalt), T-FTIR betteridentified the presence of glue. As is usual in Heritage Sciencedue to the complexity of the samples analysed, a combinationof analytical techniques provides better and more completeinformation [32].
3.2. PCA analysis on DRIFT and T-FTIR spectroscopicdata
Chemometric evaluation of spectral data is well accepted as apowerful tool for different purposes, including sample identifi-cation and recognition [33]. Among the different chemometrictools, PCA is a powerful data-mining technique that reducesdata dimensionality obtaining more interpretable represen-tation of the system under investigation [34,35]. In addition,valuable information about the most important variablesinvolved in the process studied is also obtained.
In this work aimed at evaluating the ability to extractinformation from DRIFT and T-FTIR spectral data, PCA wasperformed separately on each. Thus, a matrix was built foreach type of spectral data, DRIFT and T-FTIR, which includesthe seven replica samples. In this way, for multivariate analy-sis each matrix was formed by 85 IR spectra, since each samplewas characterised by 10 FT-IR and 10 DRIFT spectra (exceptpure glue replica samples characterised by 25 spectra of eachIR mode). The PCs were obtained using both the covariancedata matrices (scaling by mean-centered data) and the cor-relation data matrixes (scaling by unit variance). Similar toprevious work [19,36], results were better when PCA was per-formed on correlation data matrices, so the results shownand discussed here correspond to autoscaled data. A sim-ple centring data procedure is often adopted for spectral data[18,37] because the commonly applied autoscaling procedureassigns the same relevance to each IR spectral region. Thusspectral regions with small variation – no relevant IR bands– can acquire the same importance as large IR bands relatedto important functional groups. This problem was avoided inthis work because only IR regions containing absorption bandswere selected to apply PCA (not the whole IR spectrum). TheIR regions selected to perform the multivariate analysis are
Table 3 – IR regions studied by PCA.
IR intervals (cm−1)
600–1200 Fingerprint1200–2000 Azurite band2100–2700 Azurite band, lapis lazuli band2100–3600 Glue most informative IR regiona
a From previous work [19,36].
shown in Table 3. PCA was performed independently on theseIR regions. The fingerprint IR region was tested due to itsunique absorption pattern for every sample. The wavenum-ber interval 2100–3600 cm−1 was chosen according to resultsfrom previous work [19,36]. These studies found this IR regionquite informative when glue was present in the replica sam-ples, thus it was also tested in the present work. The other IRregions were selected from a visual examination of the IR spec-tra obtained with both T-FTIR and DRIFT, where an absorptionband was observed.
The highest quality information for the two FTIR modeswas obtained using the IR region in the wavenumber interval600–1200 cm−1, the fingerprint region. The main absorp-tion bands of the two silicate-based pigments (lapis andsmalt) are also found here. PCA on the wavenumber inter-val 1200–2000 cm−1 allowed separation according to chemicalclass, that is, glue, azurite (pure and mixed with glue) andthe silicate-based pigments (pure and mixed with glue). Thisresult is justified since absorption bands of azurite that sep-arate this pigment from the others compounds are found inthis IR region. The wavenumber interval 2100–2700 cm−1 alsoseparated the replica samples, although less clearly, despitecontaining information on the absorption bands of azurite andlapis lazuli. The last IR region tested, 2100–3600 cm−1, showedthe ability to separate replica samples, but again less clearlythan the fingerprint region. The results of the correspond-ing PCA in terms of explained variance (%) and cumulativeexplained variance (%) for each FTIR mode, and for the twoIR regions with the best ability to discriminate samples areshown in Table 4.
The results obtained by applying PCA separately on theDRIFT and T-FTIR spectral data in the fingerprint region aresummarised in Figs. 3 and 4. These figures show the score plot
Table 4 – PCA performed on DRIFT and T-FTIR spectral data.
IR region PC DRIFT T-FTIR
Varianceaccount (%)
Varianceaccumulated (%)
Varianceaccount (%)
Varianceaccumulated (%)
600–1200 cm−1 PC1 59.3 59.3 58.1 58.1PC2 23.0 82.4 34.3 92.4PC3 13.0 95.4 4.0 96.4PC4 2.4 97.8 2.0 98.4PC5 1.1 98.9 0.9 99.3
2900–3600 cm−1 PC1 58.9 58.9 47.4 47.4PC2 21.5 80.4 25.2 72.6PC3 9.9 90.4 11.1 83.6PC4 6.0 96.4 6.6 90.2PC5 1.5 97.9 5.2 95.4
Author's personal copy
a n a l y t i c a c h i m i c a a c t a 6 3 0 ( 2 0 0 8 ) 141–149 147
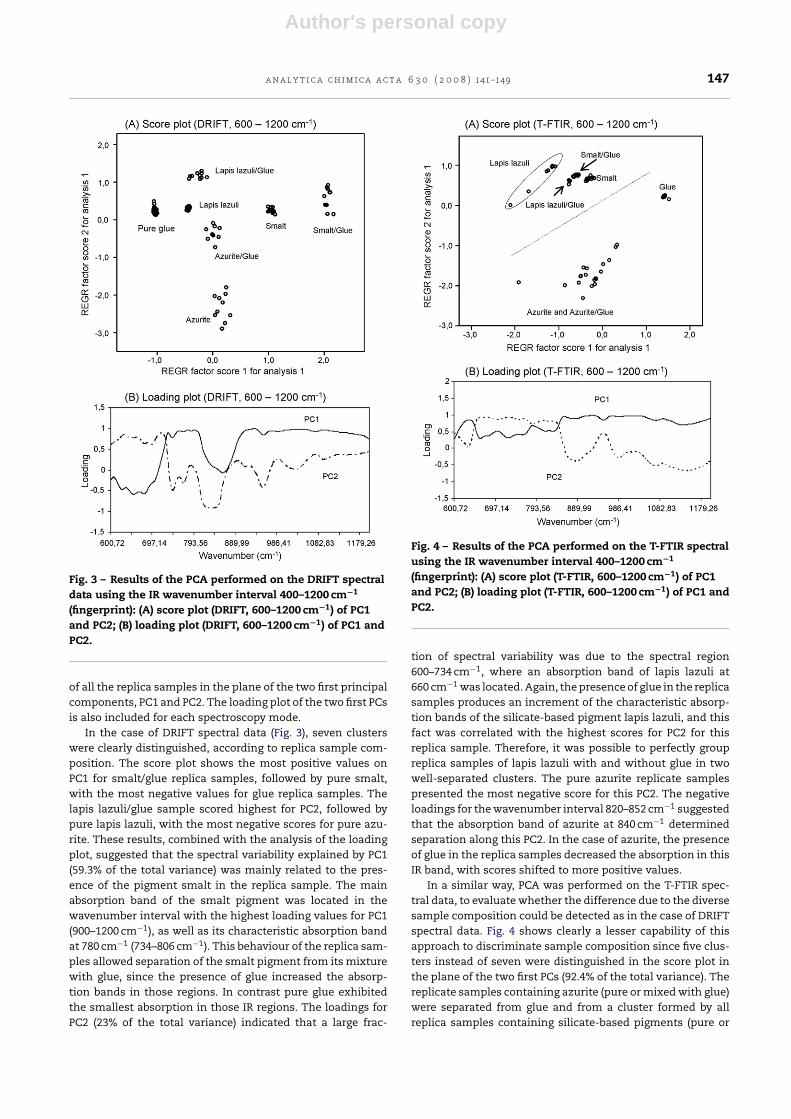
Fig. 3 – Results of the PCA performed on the DRIFT spectraldata using the IR wavenumber interval 400–1200 cm−1
(fingerprint): (A) score plot (DRIFT, 600–1200 cm−1) of PC1and PC2; (B) loading plot (DRIFT, 600–1200 cm−1) of PC1 andPC2.
of all the replica samples in the plane of the two first principalcomponents, PC1 and PC2. The loading plot of the two first PCsis also included for each spectroscopy mode.
In the case of DRIFT spectral data (Fig. 3), seven clusterswere clearly distinguished, according to replica sample com-position. The score plot shows the most positive values onPC1 for smalt/glue replica samples, followed by pure smalt,with the most negative values for glue replica samples. Thelapis lazuli/glue sample scored highest for PC2, followed bypure lapis lazuli, with the most negative scores for pure azu-rite. These results, combined with the analysis of the loadingplot, suggested that the spectral variability explained by PC1(59.3% of the total variance) was mainly related to the pres-ence of the pigment smalt in the replica sample. The mainabsorption band of the smalt pigment was located in thewavenumber interval with the highest loading values for PC1(900–1200 cm−1), as well as its characteristic absorption bandat 780 cm−1 (734–806 cm−1). This behaviour of the replica sam-ples allowed separation of the smalt pigment from its mixturewith glue, since the presence of glue increased the absorp-tion bands in those regions. In contrast pure glue exhibitedthe smallest absorption in those IR regions. The loadings forPC2 (23% of the total variance) indicated that a large frac-
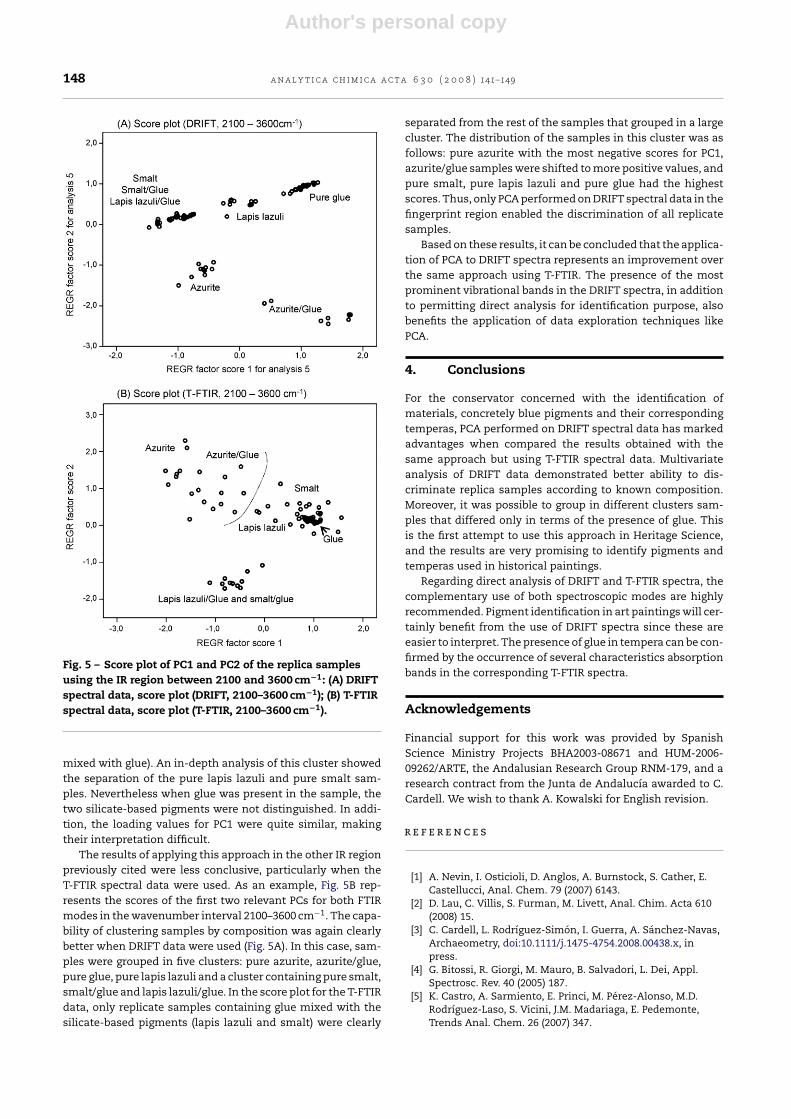
Fig. 4 – Results of the PCA performed on the T-FTIR spectralusing the IR wavenumber interval 400–1200 cm−1
(fingerprint): (A) score plot (T-FTIR, 600–1200 cm−1) of PC1and PC2; (B) loading plot (T-FTIR, 600–1200 cm−1) of PC1 andPC2.
tion of spectral variability was due to the spectral region600–734 cm−1, where an absorption band of lapis lazuli at660 cm−1 was located. Again, the presence of glue in the replicasamples produces an increment of the characteristic absorp-tion bands of the silicate-based pigment lapis lazuli, and thisfact was correlated with the highest scores for PC2 for thisreplica sample. Therefore, it was possible to perfectly groupreplica samples of lapis lazuli with and without glue in twowell-separated clusters. The pure azurite replicate samplespresented the most negative score for this PC2. The negativeloadings for the wavenumber interval 820–852 cm−1 suggestedthat the absorption band of azurite at 840 cm−1 determinedseparation along this PC2. In the case of azurite, the presenceof glue in the replica samples decreased the absorption in thisIR band, with scores shifted to more positive values.
In a similar way, PCA was performed on the T-FTIR spec-tral data, to evaluate whether the difference due to the diversesample composition could be detected as in the case of DRIFTspectral data. Fig. 4 shows clearly a lesser capability of thisapproach to discriminate sample composition since five clus-ters instead of seven were distinguished in the score plot inthe plane of the two first PCs (92.4% of the total variance). Thereplicate samples containing azurite (pure or mixed with glue)were separated from glue and from a cluster formed by allreplica samples containing silicate-based pigments (pure or
Author's personal copy
148 a n a l y t i c a c h i m i c a a c t a 6 3 0 ( 2 0 0 8 ) 141–149
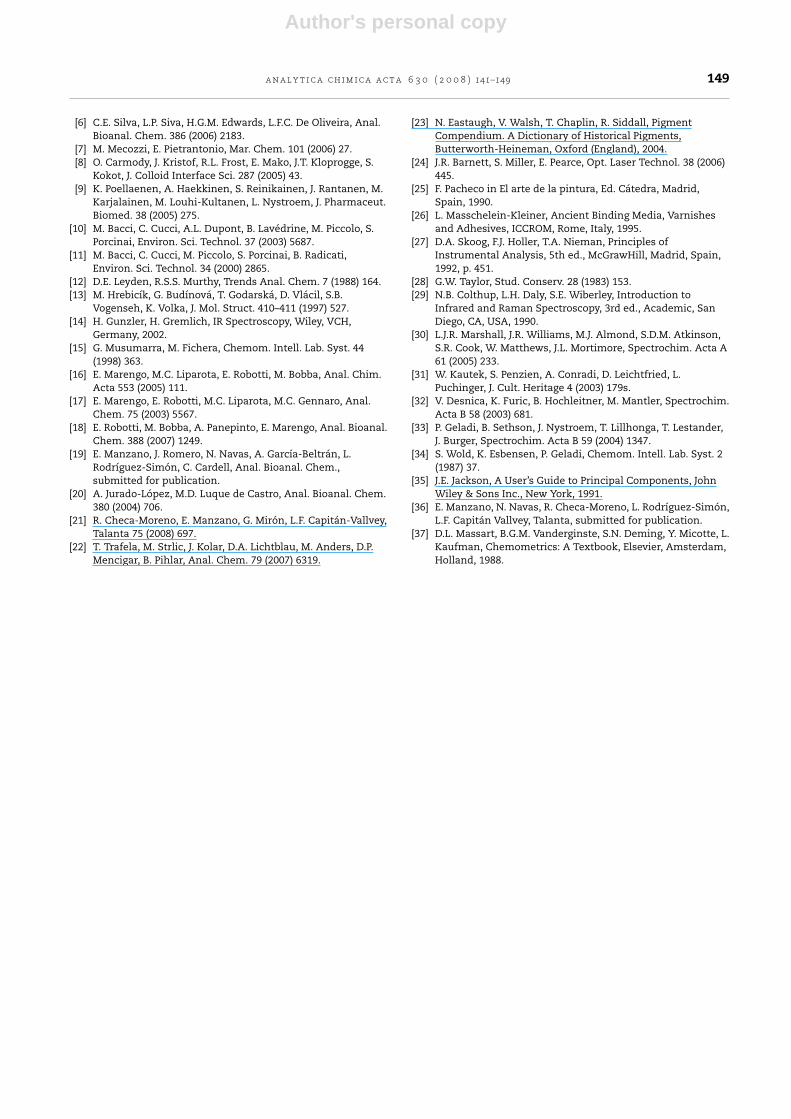
Fig. 5 – Score plot of PC1 and PC2 of the replica samplesusing the IR region between 2100 and 3600 cm−1: (A) DRIFTspectral data, score plot (DRIFT, 2100–3600 cm−1); (B) T-FTIRspectral data, score plot (T-FTIR, 2100–3600 cm−1).
mixed with glue). An in-depth analysis of this cluster showedthe separation of the pure lapis lazuli and pure smalt sam-ples. Nevertheless when glue was present in the sample, thetwo silicate-based pigments were not distinguished. In addi-tion, the loading values for PC1 were quite similar, makingtheir interpretation difficult.
The results of applying this approach in the other IR regionpreviously cited were less conclusive, particularly when theT-FTIR spectral data were used. As an example, Fig. 5B rep-resents the scores of the first two relevant PCs for both FTIRmodes in the wavenumber interval 2100–3600 cm−1. The capa-bility of clustering samples by composition was again clearlybetter when DRIFT data were used (Fig. 5A). In this case, sam-ples were grouped in five clusters: pure azurite, azurite/glue,pure glue, pure lapis lazuli and a cluster containing pure smalt,smalt/glue and lapis lazuli/glue. In the score plot for the T-FTIRdata, only replicate samples containing glue mixed with thesilicate-based pigments (lapis lazuli and smalt) were clearly
separated from the rest of the samples that grouped in a largecluster. The distribution of the samples in this cluster was asfollows: pure azurite with the most negative scores for PC1,azurite/glue samples were shifted to more positive values, andpure smalt, pure lapis lazuli and pure glue had the highestscores. Thus, only PCA performed on DRIFT spectral data in thefingerprint region enabled the discrimination of all replicatesamples.
Based on these results, it can be concluded that the applica-tion of PCA to DRIFT spectra represents an improvement overthe same approach using T-FTIR. The presence of the mostprominent vibrational bands in the DRIFT spectra, in additionto permitting direct analysis for identification purpose, alsobenefits the application of data exploration techniques likePCA.
4. Conclusions
For the conservator concerned with the identification ofmaterials, concretely blue pigments and their correspondingtemperas, PCA performed on DRIFT spectral data has markedadvantages when compared the results obtained with thesame approach but using T-FTIR spectral data. Multivariateanalysis of DRIFT data demonstrated better ability to dis-criminate replica samples according to known composition.Moreover, it was possible to group in different clusters sam-ples that differed only in terms of the presence of glue. Thisis the first attempt to use this approach in Heritage Science,and the results are very promising to identify pigments andtemperas used in historical paintings.
Regarding direct analysis of DRIFT and T-FTIR spectra, thecomplementary use of both spectroscopic modes are highlyrecommended. Pigment identification in art paintings will cer-tainly benefit from the use of DRIFT spectra since these areeasier to interpret. The presence of glue in tempera can be con-firmed by the occurrence of several characteristics absorptionbands in the corresponding T-FTIR spectra.
Acknowledgements
Financial support for this work was provided by SpanishScience Ministry Projects BHA2003-08671 and HUM-2006-09262/ARTE, the Andalusian Research Group RNM-179, and aresearch contract from the Junta de Andalucía awarded to C.Cardell. We wish to thank A. Kowalski for English revision.
r e f e r e n c e s
[1] A. Nevin, I. Osticioli, D. Anglos, A. Burnstock, S. Cather, E.Castellucci, Anal. Chem. 79 (2007) 6143.
[2] D. Lau, C. Villis, S. Furman, M. Livett, Anal. Chim. Acta 610(2008) 15.
[3] C. Cardell, L. Rodríguez-Simón, I. Guerra, A. Sánchez-Navas,Archaeometry, doi:10.1111/j.1475-4754.2008.00438.x, inpress.
[4] G. Bitossi, R. Giorgi, M. Mauro, B. Salvadori, L. Dei, Appl.Spectrosc. Rev. 40 (2005) 187.
[5] K. Castro, A. Sarmiento, E. Princi, M. Pérez-Alonso, M.D.Rodríguez-Laso, S. Vicini, J.M. Madariaga, E. Pedemonte,Trends Anal. Chem. 26 (2007) 347.
Author's personal copy
a n a l y t i c a c h i m i c a a c t a 6 3 0 ( 2 0 0 8 ) 141–149 149
[6] C.E. Silva, L.P. Siva, H.G.M. Edwards, L.F.C. De Oliveira, Anal.Bioanal. Chem. 386 (2006) 2183.
[7] M. Mecozzi, E. Pietrantonio, Mar. Chem. 101 (2006) 27.[8] O. Carmody, J. Kristof, R.L. Frost, E. Mako, J.T. Kloprogge, S.
Kokot, J. Colloid Interface Sci. 287 (2005) 43.[9] K. Poellaenen, A. Haekkinen, S. Reinikainen, J. Rantanen, M.
Karjalainen, M. Louhi-Kultanen, L. Nystroem, J. Pharmaceut.Biomed. 38 (2005) 275.
[10] M. Bacci, C. Cucci, A.L. Dupont, B. Lavédrine, M. Piccolo, S.Porcinai, Environ. Sci. Technol. 37 (2003) 5687.
[11] M. Bacci, C. Cucci, M. Piccolo, S. Porcinai, B. Radicati,Environ. Sci. Technol. 34 (2000) 2865.
[12] D.E. Leyden, R.S.S. Murthy, Trends Anal. Chem. 7 (1988) 164.[13] M. Hrebicík, G. Budínová, T. Godarská, D. Vlácil, S.B.
Vogenseh, K. Volka, J. Mol. Struct. 410–411 (1997) 527.[14] H. Gunzler, H. Gremlich, IR Spectroscopy, Wiley, VCH,
Germany, 2002.[15] G. Musumarra, M. Fichera, Chemom. Intell. Lab. Syst. 44
(1998) 363.[16] E. Marengo, M.C. Liparota, E. Robotti, M. Bobba, Anal. Chim.
Acta 553 (2005) 111.[17] E. Marengo, E. Robotti, M.C. Liparota, M.C. Gennaro, Anal.
Chem. 75 (2003) 5567.[18] E. Robotti, M. Bobba, A. Panepinto, E. Marengo, Anal. Bioanal.
Chem. 388 (2007) 1249.[19] E. Manzano, J. Romero, N. Navas, A. García-Beltrán, L.
Rodríguez-Simón, C. Cardell, Anal. Bioanal. Chem.,submitted for publication.
[20] A. Jurado-López, M.D. Luque de Castro, Anal. Bioanal. Chem.380 (2004) 706.
[21] R. Checa-Moreno, E. Manzano, G. Mirón, L.F. Capitán-Vallvey,Talanta 75 (2008) 697.
[22] T. Trafela, M. Strlic, J. Kolar, D.A. Lichtblau, M. Anders, D.P.Mencigar, B. Pihlar, Anal. Chem. 79 (2007) 6319.
[23] N. Eastaugh, V. Walsh, T. Chaplin, R. Siddall, PigmentCompendium. A Dictionary of Historical Pigments,Butterworth-Heineman, Oxford (England), 2004.
[24] J.R. Barnett, S. Miller, E. Pearce, Opt. Laser Technol. 38 (2006)445.
[25] F. Pacheco in El arte de la pintura, Ed. Cátedra, Madrid,Spain, 1990.
[26] L. Masschelein-Kleiner, Ancient Binding Media, Varnishesand Adhesives, ICCROM, Rome, Italy, 1995.
[27] D.A. Skoog, F.J. Holler, T.A. Nieman, Principles ofInstrumental Analysis, 5th ed., McGrawHill, Madrid, Spain,1992, p. 451.
[28] G.W. Taylor, Stud. Conserv. 28 (1983) 153.[29] N.B. Colthup, L.H. Daly, S.E. Wiberley, Introduction to
Infrared and Raman Spectroscopy, 3rd ed., Academic, SanDiego, CA, USA, 1990.
[30] L.J.R. Marshall, J.R. Williams, M.J. Almond, S.D.M. Atkinson,S.R. Cook, W. Matthews, J.L. Mortimore, Spectrochim. Acta A61 (2005) 233.
[31] W. Kautek, S. Penzien, A. Conradi, D. Leichtfried, L.Puchinger, J. Cult. Heritage 4 (2003) 179s.
[32] V. Desnica, K. Furic, B. Hochleitner, M. Mantler, Spectrochim.Acta B 58 (2003) 681.
[33] P. Geladi, B. Sethson, J. Nystroem, T. Lillhonga, T. Lestander,J. Burger, Spectrochim. Acta B 59 (2004) 1347.
[34] S. Wold, K. Esbensen, P. Geladi, Chemom. Intell. Lab. Syst. 2(1987) 37.
[35] J.E. Jackson, A User’s Guide to Principal Components, JohnWiley & Sons Inc., New York, 1991.
[36] E. Manzano, N. Navas, R. Checa-Moreno, L. Rodríguez-Simón,L.F. Capitán Vallvey, Talanta, submitted for publication.
[37] D.L. Massart, B.G.M. Vanderginste, S.N. Deming, Y. Micotte, L.Kaufman, Chemometrics: A Textbook, Elsevier, Amsterdam,Holland, 1988.
Copyright © 2022 FDOKUMEN