Current Trends in Integration of Nondestructive Testing ... - MDPI
Upload
independentCategory
view
0download
0
Computers and Electronics in Agriculture 85 (2012) 64–69
Contents lists available at SciVerse ScienceDirect
Computers and Electronics in Agriculture
journal homepage: www.elsevier .com/locate /compag
Reflectance Vis/NIR spectroscopy for nondestructive taste characterizationof Valencia oranges
Bahareh Jamshidi a, Saeid Minaei a,⇑, Ezzedin Mohajerani b, Hassan Ghassemian c
a Agricultural Machinery Engineering Department, Faculty of Agriculture, Tarbiat Modares University, Tehran, Iranb Laser and Plasma Research Institute, Shahid Beheshti University, Tehran, Iranc Faculty of Electrical and Computer Engineering, Tarbiat Modares University, Tehran, Iran
a r t i c l e i n f o
Article history:Received 14 March 2011Received in revised form 29 December 2011Accepted 12 March 2012
Keywords:NondestructiveVis/NIR spectroscopyValencia orangeTasteBrimA
0168-1699/$ - see front matter � 2012 Elsevier B.V. Ahttp://dx.doi.org/10.1016/j.compag.2012.03.008
⇑ Corresponding author. Tel.: +98 2148292466; faxE-mail address: [email protected] (S. Minaei)
a b s t r a c t
The feasibility of reflectance Vis/NIR spectroscopy was investigated for taste characterization of Valenciaoranges based on taste attributes including soluble solids content (SSC) and titratable acidity (TA), as wellas taste indices including SSC to TA ratio (SSC/TA) and BrimA. The robustness of multivariate analysis interms of prediction was also assessed. Several combinations of various preprocessing techniques withmoving average and Savitzky–Golay smoothing filters, standard normal variate (SNV) and multiplicativescatter correction (MSC) were used before calibration and the models were developed based on both par-tial least squares (PLS) and principle component regression (PCR) methods. The best models obtained withPLS method had root mean square errors of prediction (RMSEP) of 0.33 �Brix, 0.07%, 1.03 and 0.37, and pre-diction correlation coefficients (rp) of 0.96, 0.86, 0.87 and 0.92 for SSC, TA, SSC/TA, and BrimA, respectively.It was concluded that Vis/NIR spectroscopy combined with chemometrics could be an accurate and fastmethod for nondestructive prediction of taste attributes and indices of Valencia oranges. Moreover, theapplication of this technique was suggested for taste characterization, directly based on BrimA which isthe best index related to fruit flavor rather than determination of SSC or TA alone.
� 2012 Elsevier B.V. All rights reserved.
1. Introduction
Taste is one of the most important quality attributes of fruitsand vegetables in fresh consumption. Nowadays, number of con-sumers who attend to the better taste of fruit more than the priceis increasing. Fruit taste is composed of sour and sweet taste whichis related to titratable acidity (TA) and soluble solids content (SSC),respectively and a distinctive taste which is characteristic for thevariety provided by other chemicals (Abu-Khalaf and Bennedsen,2004). SSC and TA which are the most important attributes of fruittaste are still largely measured destructively and there is a need fordevelopment of a reliable and nondestructive method to predictfruit taste.
Near infrared (NIR) or visible/near infrared (Vis/NIR) spectros-copy in reflectance or transmittance mode is one of the applicablenondestructive techniques that has been used to measure SSC, TAor other quality attributes of smooth fruits and vegetables suchas apple (Abu-Khalaf and Bennedsen, 2004; Zude et al., 2006),apricot (Bureau et al., 2009; Camps and Christen, 2009), bell pep-per (Penchaiya et al., 2009), grape (Cao et al., 2010; Jarén et al.,2001), kiwifruit (Lü et al., 2010; McGlone and Kawano, 1998;Slaughter and Crisosto, 1998), mango (Saranwong et al., 2004;
ll rights reserved.
: +98 2144180537..
Subedi et al., 2007), peach (Golic and Walsh, 2006), tomato (Floreset al., 2009; He et al., 2005; Pedro and Ferreira, 2007). Transmit-tance is not a suitable mode for assessing large produce becausethe amount of light penetrating the fruit is often very small. Thismakes it difficult to obtain accurate transmission measurementsat grading line speeds. Reflectance mode is the easiest mode toobtain measurements, because they require no contact with thefruit and light levels are relatively high (Cayuela, 2008). Kawanoet al. (1993) noted that good results can be obtained in the fruitswith a thin peel using reflectance mode. However, it is more diffi-cult to achieve acceptable prediction of internal quality attributesfor rough and thick-skinned fruits such as citrus as compared tothe smooth and thin ones because of more light scattering and skinthickness effects. In spite of that, good prediction results have beenreported on SSC of citrus using reflectance Vis/NIR spectroscopy(Cayuela, 2008; Gómez et al., 2006; Liu et al., 2010) but not onTA because of the relatively low levels of organic acids in citrus(Cayuela, 2008; Guthrie et al., 2005; McGlone et al., 2003). More-over, the actual taste of each fruit is more closely related to thecomposite taste indices based on SSC and TA such as SSC to TA ratio(SSC/TA) which is currently used as a sensory acceptability index offruit taste. One of the drawbacks associated with use of this indexis that different levels of SSC and TA may result in the same ratio.Therefore, a new index named BrimA which is expressed as(SSC � k � TA) was proposed by Jordan et al. (2001). The constant

B. Jamshidi et al. / Computers and Electronics in Agriculture 85 (2012) 64–69 65
(k) reflects the tongue’s higher sensitivity to TA compared to SSC.The index allows smaller amounts of TA than SSC to make the samenumerical change to BrimA and in the opposite direction (Jordanet al., 2001). Therefore, it can be more useful to assess the correla-tion of these indices with Vis/NIR spectrum than solely SSC or TA tocharacterize fruit taste. Moreover, there is no report on NIR or Vis/NIR spectroscopy predictions of taste indices.
This research aims to use reflectance Vis/NIR spectroscopy fordetermination of taste attributes (SSC, TA) and to assess the feasi-bility of using the technique for prediction of taste indices (SSC/TA,BrimA) of Valencia oranges directly and nondestructively. In addi-tion, different multivariate analysis models including PLS and PCRwith various combinations of preprocessing methods were alsoinvestigated.
2. Material and methods
2.1. Fruit samples
A total of 120 Valencia oranges used for the experiments werepurchased from different local markets in different days (approxi-mately 10 samples each time) to obtain enough variability in therange of the samples. The fruits were stored at 25 �C for 1 daybefore Vis/NIR measurements to reach equilibrium temperaturewith laboratory environment. The weight and maximum equato-rial diameter of each sample were measured before spectroscopy.All reference measurements were carried out on the next day.
2.2. Vis/NIR spectroscopy set up and measurements
The spectroscopy equipment consisted of a USB2000 spectrom-eter with charge coupled device (CCD) detector (Oceanoptics Inc.,USA), tungsten halogen lamp (12 V–50 W) as a light source, an opti-cal fiber (SMA905) with diameter of 0.4 mm, and a sample holder.The wavelength range of the spectrometer was 350–1050 nm. Thefiber optic was placed vertically at a height of 100 mm from theholder. The light source was set up about 200 mm above the holdercenter at an angle of 45�. Before spectra acquisition, a white refer-ence was used to obtain the relative reflectance. For each sample,reflectance spectra at three positions around equatorial locations(approximately 120�) and six scans at each position were collectedby OOIBase32 software (Oceanoptics Inc., USA). Next, the meanspectrum was calculated from a total of 18 scans for each fruit.The acquired spectra were stored for later data analysis.
2.3. Taste reference analysis
After spectroscopy measurements, each sample was peeled andthe juice was extracted. SSC was measured using a digital refrac-tometer DR-A1 (Atago Co. Ltd., Japan). Moreover, TA was deter-mined by titration of 10 ml sample juice with 0.1 M NaOH usingphenolphthalein as an indicator and expressed as percentage ofcitric acid. Finally, the ratio of SSC/TA and BrimA (SSC � k � TA)indices were calculated. The constant (k) of four suggested byObenland et al. (2009), which provided the highest correlation be-tween the calculated BrimA and the hedonic flavor scores given bythe panelists for navel oranges, was used to determine the BrimAindex.
2.4. Chemometrics and data analysis
2.4.1. PreprocessingThe overall mean reflectance spectra of fruits were converted to
absorbance values (log1/R) to obtain linear correlation betweenthe spectrum and the sample molecular concentration. Also, the
first 50 and the last 50 wavelength values were ignored becauseof the existence of considerable noise in these regions. Thus, allthe spectra from 400 to 1000 nm were considered for preprocess-ing. The moving average filter with segment size of five for averag-ing and a Savitzky–Golay filter with five smoothing points andpolynomial order of two were used to smooth and remove randomnoise from Vis/NIR spectra. First derivative of the spectra based onSavitzky–Golay algorithm was also used to increase the spectralresolution and to interpret the spectra. To correct both multiplica-tive and additive effects of the spectra due to scattering, particlesize, and the change of light distance (Cen and He, 2007), the spec-tra were preprocessed using multiplicative scatter correction(MSC) and standard normal variate correction (SNV). MSC attemptsto remove these effects by linearizing each spectrum to the averagespectrum. Moreover, in SNV, each individual spectrum is normal-ized to zero mean and unit variance (Nicolaï et al., 2007). All pre-processing methods were conducted by the Unscramblersoftware v9.7 (CAMO Software AS, Norway).
2.4.2. Multivariate regression modelsBefore developing determination models, the sample data was
randomly divided to calibration set (75% of the whole samples)and prediction set (25% of the whole samples). Then, principalcomponent regression (PCR) and partial least squares (PLS) withcross validation based on 20 segments were used for obtainingthe calibration models. Finally, prediction set was used to evaluatethe robustness of the models.
PCR decomposes the spectral matrix X (X-variables) by a princi-pal component analysis (PCA) and then fits a multiple linearregression (MLR) model, using a small number of principal compo-nents (PCs) or latent variables (LVs) instead of the originalvariables as predictors. However, in PLS regression an orthogonalbasis of latent variables is constructed one by one in such a waythat they are oriented along directions of maximal covariance be-tween the spectra matrix X and the response value y (Y-variablesuch as SSC and TA) (Nicolaï et al., 2007).
The number of LVs investigated for both PLS and PCR modelswere 10 to avoid over-fitting and noise modeling. The outliersdue to chemical measurement errors were determined as large val-ues on the influence plot. After removing the outliers (three sam-ples), the sets of calibration and prediction were reconstructedand the models were developed again. The Unscrambler softwarev9.7 (CAMO Software AS, Norway) was also used for multivariateanalysis.
2.4.3. Evaluation of the modelsThe calibration models were mainly assessed in terms of corre-
lation coefficient of calibration and cross validation (rc and rcv), aswell as root mean squared error of calibration and cross validation(RMSEC and RMSECV). In assessing the soundness of calibrationperformance, the main considerations were correlation coefficientof prediction (rp) and root mean squared error of prediction(RMSEP). RMSEC, RMSECV or RMSEP are defined as follows (Nicolaïet al., 2007):
RMSEC ¼
ffiffiffiffiffiffiffiffiffiffiffiffiffiffiffiffiffiffiffiffiffiffiffiffiffiffiffiffiffiffiPnci¼1ðyi � yiÞ
2
nc
s
RMSECV or RMSEP ¼
ffiffiffiffiffiffiffiffiffiffiffiffiffiffiffiffiffiffiffiffiffiffiffiffiffiffiffiffiffiffiPnpi¼1ðyi � yiÞ
2
np
s
where nc is the number of observations in calibration set and np isthe number of validated objects. yi and yi are the predicted andmeasured values of the ith observation, respectively.

Table 1Statistics of both calibration and prediction sets for morphological properties, taste attributes and taste indices.
Calibration set (88 samples) Prediction set (29 samples)
Min Max Mean SD Min Max Mean SD
Diameter (mm) 69.000 87.900 76.175 0.309 72.400 87.00 77.662 0.336Weight (g) 186.090 283.290 229.014 23.220 198.120 282.000 241.126 22.980SSC (�Brix) 7.900 11.300 9.489 0.815 7.600 11.500 9.348 0.914TA (%) 0.538 1.088 0.807 0.151 0.538 1.082 0.737 0.135SSC/TA 8.681 17.113 12.142 2.352 9.153 17.241 12.988 2.111BrimA 4.583 8.535 6.260 0.940 4.928 8.454 6.400 0.856
66 B. Jamshidi et al. / Computers and Electronics in Agriculture 85 (2012) 64–69
The optimal number of LVs was determined by selection of theminimum on RMSECV versus LVs plot.
Fig. 1. Typical absorbance Vis/NIR spectrum of Valencia orange (a), and its firstderivative (b).
3. Results and discussion
3.1. Statistics of the samples
Table 1 shows the statistics of morphological properties, tasteattributes and indices of Valencia oranges for both calibrationand prediction sets. The weight and the maximum equatorialdiameter of the whole samples were in the range of 186.09–283.29 g and 69–87.9 mm, respectively. Therefore, the sampleswere quite varied in terms of morphology which was the main rea-son to use normalizing methods (MSC and SNV) and correct themultiplicative and additive effects on the spectra. The range ofSSC and TA were from 7.6 to 11.5 �Brix and 0.538% to 1.088%,respectively. The levels and standard deviation of TA were lowwhich is normal in citrus varieties. Moreover, the range of SSC/TA and BrimA were 8.681–17.241 and 4.583–8.535, respectively.
3.2. Vis/NIR spectra interpretation
Fig. 1(a) and (b) show the typical absorbance spectrum ofValencia orange and its first derivative in the wavelength rangeof 400–1000 nm, respectively. The spectrum had some absorbancepeaks in specific frequencies due to stretching vibration of theovertones of O–H, C–H or N–H functional groups relative to theconcentration of some inner compositions with these bands suchas sugars and acids. The absorbance in the range of 400–500 nmwas due to the pigments. In the visible region (after 500 nm), thecurve had decreasing trend and there was a perceptible peakaround 675 nm because of the absorption of chlorophyll a similarto that described for mandarin by Gómez et al. (2006) and forValencia orange by Cayuela (2008), respectively. Moreover, a broadpeak around 750 nm was found which could be due to the thirdovertone of O–H and the forth overtone of C–H. In NIR region,the curve had increasing trend and a broad peak was found around850 nm which could be due to the third overtone of C–H. Therewas also a perceptible peak around 970 nm because of the secondovertone of O–H similar to that described by Cayuela (2008) andGómez et al. (2006), and the second overtone of N–H. First deriva-tive of the spectrum confirmed all above absorbance peaks. Moredetails were also found in visible region regarding the absorbancearound 650 and 550 nm due to chlorophyll b and other pigments,respectively. In spite of that, the noises were become sharp inthe first and the end wavelength values using first derivative.
3.3. Preprocessing and multivariate analysis
The results of calibration and prediction of both PLS and PCRmodels with several combinations of preprocessing methods forSSC, TA, SSC/TA, and BrimA are also summarized in Table 2. Resultsindicated that PLS models had the potential to estimate not only
taste attributes but also taste indices. Although PCR models couldpredict SSC and BrimA as well as the PLS models but they didnot give an accurate prediction of TA and SSC/TA. Moreover, allPLS models obtained better prediction results of taste attributesand indices than the PCR models. This result was similar to that re-ported for SSC determination of Satsuma mandarin with PLS andPCR models and other different preprocessing techniques byGómez et al. (2006). This could be due to the drawback of PCRwhich uses the first irrelevant PCs for the regression model (Woldet al., 2001). Therefore, PLS was selected as the best model for char-acterization of all taste parameters studied.
3.3.1. Soluble solids content (SSC)PLS models could predict SSC as well and better than the other
taste characteristics. Withal, in each smoothing method, the PLSmodel with different normalizing techniques was evaluated and
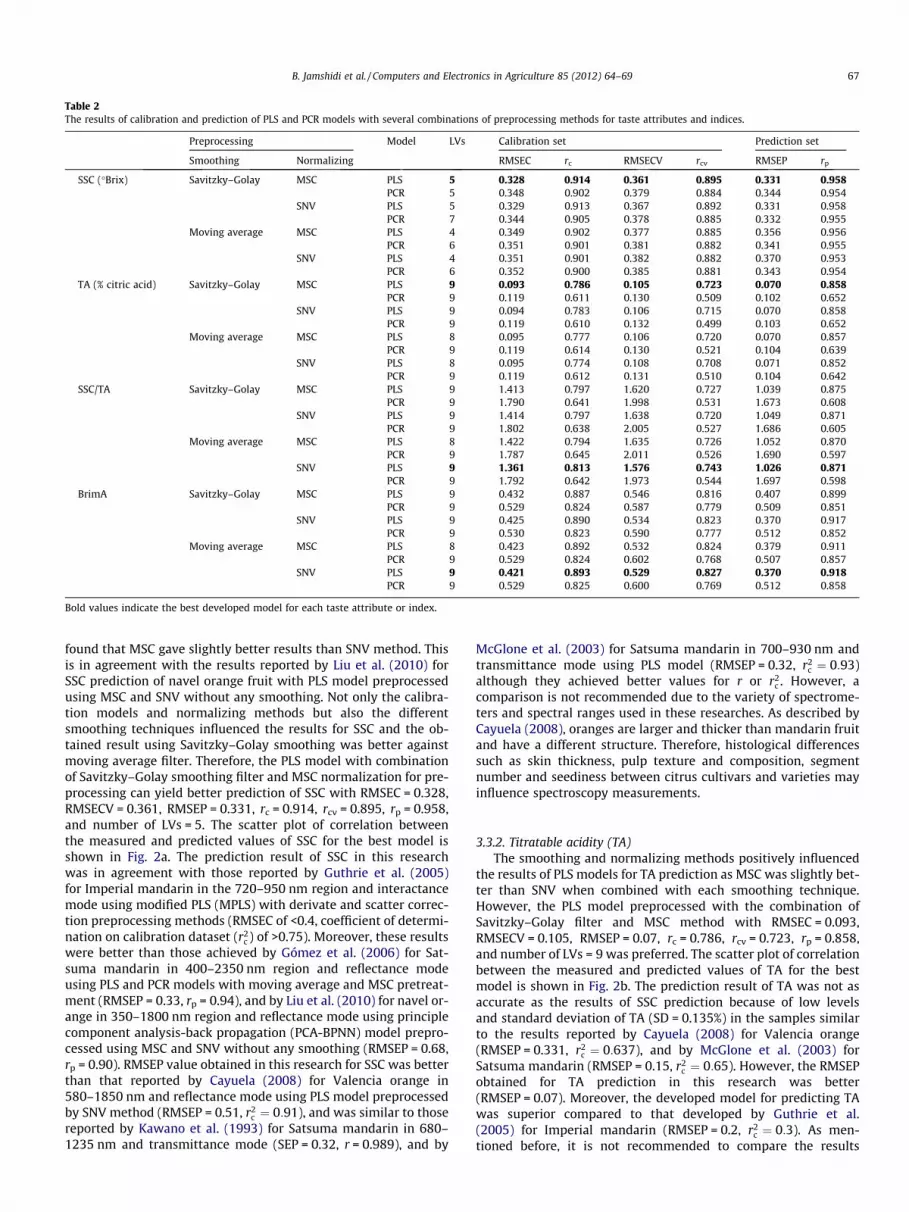
Table 2The results of calibration and prediction of PLS and PCR models with several combinations of preprocessing methods for taste attributes and indices.
Preprocessing Model LVs Calibration set Prediction set
Smoothing Normalizing RMSEC rc RMSECV rcv RMSEP rp
SSC (�Brix) Savitzky–Golay MSC PLS 5 0.328 0.914 0.361 0.895 0.331 0.958PCR 5 0.348 0.902 0.379 0.884 0.344 0.954
SNV PLS 5 0.329 0.913 0.367 0.892 0.331 0.958PCR 7 0.344 0.905 0.378 0.885 0.332 0.955
Moving average MSC PLS 4 0.349 0.902 0.377 0.885 0.356 0.956PCR 6 0.351 0.901 0.381 0.882 0.341 0.955
SNV PLS 4 0.351 0.901 0.382 0.882 0.370 0.953PCR 6 0.352 0.900 0.385 0.881 0.343 0.954
TA (% citric acid) Savitzky–Golay MSC PLS 9 0.093 0.786 0.105 0.723 0.070 0.858PCR 9 0.119 0.611 0.130 0.509 0.102 0.652
SNV PLS 9 0.094 0.783 0.106 0.715 0.070 0.858PCR 9 0.119 0.610 0.132 0.499 0.103 0.652
Moving average MSC PLS 8 0.095 0.777 0.106 0.720 0.070 0.857PCR 9 0.119 0.614 0.130 0.521 0.104 0.639
SNV PLS 8 0.095 0.774 0.108 0.708 0.071 0.852PCR 9 0.119 0.612 0.131 0.510 0.104 0.642
SSC/TA Savitzky–Golay MSC PLS 9 1.413 0.797 1.620 0.727 1.039 0.875PCR 9 1.790 0.641 1.998 0.531 1.673 0.608
SNV PLS 9 1.414 0.797 1.638 0.720 1.049 0.871PCR 9 1.802 0.638 2.005 0.527 1.686 0.605
Moving average MSC PLS 8 1.422 0.794 1.635 0.726 1.052 0.870PCR 9 1.787 0.645 2.011 0.526 1.690 0.597
SNV PLS 9 1.361 0.813 1.576 0.743 1.026 0.871PCR 9 1.792 0.642 1.973 0.544 1.697 0.598
BrimA Savitzky–Golay MSC PLS 9 0.432 0.887 0.546 0.816 0.407 0.899PCR 9 0.529 0.824 0.587 0.779 0.509 0.851
SNV PLS 9 0.425 0.890 0.534 0.823 0.370 0.917PCR 9 0.530 0.823 0.590 0.777 0.512 0.852
Moving average MSC PLS 8 0.423 0.892 0.532 0.824 0.379 0.911PCR 9 0.529 0.824 0.602 0.768 0.507 0.857
SNV PLS 9 0.421 0.893 0.529 0.827 0.370 0.918PCR 9 0.529 0.825 0.600 0.769 0.512 0.858
Bold values indicate the best developed model for each taste attribute or index.
B. Jamshidi et al. / Computers and Electronics in Agriculture 85 (2012) 64–69 67
found that MSC gave slightly better results than SNV method. Thisis in agreement with the results reported by Liu et al. (2010) forSSC prediction of navel orange fruit with PLS model preprocessedusing MSC and SNV without any smoothing. Not only the calibra-tion models and normalizing methods but also the differentsmoothing techniques influenced the results for SSC and the ob-tained result using Savitzky–Golay smoothing was better againstmoving average filter. Therefore, the PLS model with combinationof Savitzky–Golay smoothing filter and MSC normalization for pre-processing can yield better prediction of SSC with RMSEC = 0.328,RMSECV = 0.361, RMSEP = 0.331, rc = 0.914, rcv = 0.895, rp = 0.958,and number of LVs = 5. The scatter plot of correlation betweenthe measured and predicted values of SSC for the best model isshown in Fig. 2a. The prediction result of SSC in this researchwas in agreement with those reported by Guthrie et al. (2005)for Imperial mandarin in the 720–950 nm region and interactancemode using modified PLS (MPLS) with derivate and scatter correc-tion preprocessing methods (RMSEC of <0.4, coefficient of determi-nation on calibration dataset (r2
c ) of >0.75). Moreover, these resultswere better than those achieved by Gómez et al. (2006) for Sat-suma mandarin in 400–2350 nm region and reflectance modeusing PLS and PCR models with moving average and MSC pretreat-ment (RMSEP = 0.33, rp = 0.94), and by Liu et al. (2010) for navel or-ange in 350–1800 nm region and reflectance mode using principlecomponent analysis-back propagation (PCA-BPNN) model prepro-cessed using MSC and SNV without any smoothing (RMSEP = 0.68,rp = 0.90). RMSEP value obtained in this research for SSC was betterthan that reported by Cayuela (2008) for Valencia orange in580–1850 nm and reflectance mode using PLS model preprocessedby SNV method (RMSEP = 0.51, r2
c ¼ 0:91), and was similar to thosereported by Kawano et al. (1993) for Satsuma mandarin in 680–1235 nm and transmittance mode (SEP = 0.32, r = 0.989), and by
McGlone et al. (2003) for Satsuma mandarin in 700–930 nm andtransmittance mode using PLS model (RMSEP = 0.32, r2
c ¼ 0:93)although they achieved better values for r or r2
c . However, acomparison is not recommended due to the variety of spectrome-ters and spectral ranges used in these researches. As described byCayuela (2008), oranges are larger and thicker than mandarin fruitand have a different structure. Therefore, histological differencessuch as skin thickness, pulp texture and composition, segmentnumber and seediness between citrus cultivars and varieties mayinfluence spectroscopy measurements.
3.3.2. Titratable acidity (TA)The smoothing and normalizing methods positively influenced
the results of PLS models for TA prediction as MSC was slightly bet-ter than SNV when combined with each smoothing technique.However, the PLS model preprocessed with the combination ofSavitzky–Golay filter and MSC method with RMSEC = 0.093,RMSECV = 0.105, RMSEP = 0.07, rc = 0.786, rcv = 0.723, rp = 0.858,and number of LVs = 9 was preferred. The scatter plot of correlationbetween the measured and predicted values of TA for the bestmodel is shown in Fig. 2b. The prediction result of TA was not asaccurate as the results of SSC prediction because of low levelsand standard deviation of TA (SD = 0.135%) in the samples similarto the results reported by Cayuela (2008) for Valencia orange(RMSEP = 0.331, r2
c ¼ 0:637), and by McGlone et al. (2003) forSatsuma mandarin (RMSEP = 0.15, r2
c ¼ 0:65). However, the RMSEPobtained for TA prediction in this research was better(RMSEP = 0.07). Moreover, the developed model for predicting TAwas superior compared to that developed by Guthrie et al.(2005) for Imperial mandarin (RMSEP = 0.2, r2
c ¼ 0:3). As men-tioned before, it is not recommended to compare the results

6
8
10
12
6 7 8 9 10 11 12
Pre
dict
ed S
SC (
°Bri
x)
Measured SSC (°Brix)
Elements: 29 Slope: 1.134188Correlation: 0.957808 Offset: -1.298669RMSEP: 0.331672 Bias: -0.044246SEP: 0.334525
0.4
0.6
0.8
1
0.5 0.6 0.7 0.8 0.9 1 1.1
Pre
dict
ed T
A (
%)
Measured TA (%)
Elements: 29 Slope: 0.837750Correlation: 0.857799 Offset: 0.129349RMSEP: 0.070605 Bias: 0.009754SEP: 0.071166
9
12
15
9 10 11 12 13 14 15 16 17 18
Pre
dict
ed S
SC/T
A
Calculated SSC/TA
Elements: 29 Slope: 0.725577Correlation: 0.871156 Offset: 3.466382RMSEP: 1.026404 Bias: -0.097668SEP: 1.039832
4
5
6
7
8
9
4 5 6 7 8 9
Pre
dict
ed B
rim
A
Calculated BrimA
Elements: 29 Slope: 0.983650Correlation: 0.918436 Offset: 0.005668RMSEP: 0.370143 Bias: -0.097668SEP: 0.362980
(a) (b)
(c) (d)
Fig. 2. Vis/NIR prediction results for SSC (a) and TA (b) with PLS model preprocessed using Savitzky–Golay smoothing filter + MSC normalization, and for SSC/TA (c) andBrimA (d) with PLS model preprocessed using moving average smoothing filter + SNV normalization.
68 B. Jamshidi et al. / Computers and Electronics in Agriculture 85 (2012) 64–69
achieved from different wavelength ranges, instruments and citrusvarieties.
3.3.3. SSC to TA ratio (SSC/TA)For SSC/TA index, when Savitzky–Golay filter was used for
smoothing, MSC was preferable against SNV normalizing methodto develop the PLS model. In contrast, the moving average filtercombined with SNV obtained better results of PLS prediction thanusing MSC technique. However, between these two preprocessingcombinations, the PLS model preprocessed with moving averagefilter combined with SNV method had slightly better predictionresults as RMSEC = 1.361, RMSECV = 1.576, RMSEP = 1.026,rc = 0.813, rcv = 0.743, rp = 0.871, and number of LVs = 9. The scatterplot of the correlation between calculated (from measured SSC andTA) and predicted SSC/TA index using the best selected model isshown in Fig. 2c. Results indicated that Vis/NIR spectroscopy hadthe potential to predict SSC/TA directly as accurate as it predictsTA. The reason is that SSC/TA depends on SSC and TA, as well astheir chemical bands such as C-H and O-H groups. On the otherhand, when TA (acidity) is low, SSC/TA becomes high and becauseof its relation to SSC, has a higher standard deviation than TAwhich is good for modeling.
3.3.4. BrimA indexResults indicated that PLS models can predict BrimA well. In
terms of preprocessing methods, SNV was better against MSC topredict BrimA for each smoothing technique. Nevertheless, betterresults were achieved using a combination of moving average filter
and SNV for predicting BrimA by PLS model. Fig. 2d shows the scat-ter plot of calculated (from measured SSC and TA) and predictedBrimA when the best model with RMSEC = 0.421, RMSECV = 0.529,RMSEP = 0.370, rc = 0.893, rcv = 0.827, rp = 0.918, and number ofLVs = 9 was used. It was noted that BrimA as a taste index basedon SSC and TA is related to chemical bands (just a SSC/TA) whichmakes it possible to predict taste using NIR spectroscopy, directly.Moreover, the accuracy of BrimA prediction was much better thanthat of TA and SSC/TA. BrimA is a better taste index than SSC/TAbecause it is more closely related to flavor especially at low levelsof TA as reported by Jordan et al. (2001) and Obenland et al. (2009),and the good prediction results obtained in our research, it is con-cluded that Vis/NIR spectroscopy can be used for taste character-ization directly and nondestructively.
4. Conclusions
The feasibility of utilizing Vis/NIR spectroscopy using CCD spec-trometer combined with different preprocessing methods to non-destructively characterize the taste of Valencia oranges wasinvestigated. Taste attributes included SSC and TA as well as SSC/TA and BrimA indices. The prediction models were developed usingboth PCR and PLS with four different combinations of smoothing(moving average and Savitzky–Golay filters) and normalizing(MSC and SNV) techniques. Results indicated that all models, espe-cially PLS, had the potential to estimate taste characteristics andthat preprocessing methods influenced the results. The best ob-tained models for SSC (RMSEP = 0.331, rp = 0.958) and TA
B. Jamshidi et al. / Computers and Electronics in Agriculture 85 (2012) 64–69 69
(RMSEP = 0.07, rp = 0.858) with Savitzky–Golay + MSC, and for SSC/TA (RMSEP = 1.026, rp = 0.871) and BrimA (RMSEP = 0.37,rp = 0.918) with moving average + SNV showed the good predictionability of Vis/NIR spectroscopy. More accurate predictions wereachieved for SSC and BrimA compared to TA and SSC/TA. A notice-able result was the capability of this technique to predict orangefruit taste based on BrimA index directly and nondestructivelywhich could be used for taste characterization before or afterharvesting.
Acknowledgments
This research was supported by Tarbiat Modares University andLaser & Plasma Institute of Shahid Beheshti University. The authorsare grateful to Mrs. Afkhami for her help in spectral measurements.
References
Abu-Khalaf, N., Bennedsen, B.S., 2004. Near infrared (NIR) technology andmultivariate data analysis for sensing taste attributes of apples. Int. Agrophys.18, 203–211.
Bureau, S., Ruiz, D., Reich, M., Gouble, B., Bertrand, D., Audergon, J.M., Renard,C.M.G.C., 2009. Rapid and nondestructive analysis of apricot fruit quality usingFT-near-infrared spectroscopy. Food Chem. 113, 1323–1328.
Camps, C., Christen, D., 2009. Nondestructive assessment of apricot fruit quality byportable visible-near infrared spectroscopy. Food Sci. Technol. 42, 1125–1131.
Cao, F., Wu, D., He, Y., 2010. Soluble solids content and pH prediction and varietiesdiscrimination of grapes based on visible-near infrared spectroscopy. Comput.Electron. Agric. 71s, s15–s18.
Cayuela, J.A., 2008. VIS/NIR soluble solids prediction in intact oranges (Citrus sinensisL.) cv. Valencia Late by reflectance. Postharvest Biol. Technol. 47, 75–80.
Cen, H., He, Y., 2007. Theory and application of near infrared reflectancespectroscopy in determination of food quality. Trends Food Sci. Technol. 18,72–83.
Flores, K., Sánchez, M., Pérez-Marín, D., Guerrero, J., Garrido-Varo, A., 2009.Feasibility in NIRS instruments for predicting internal quality in intacttomato. J. Food Eng. 91, 311–318.
Golic, M., Walsh, K., 2006. Robustness of calibration models based on near infraredspectroscopy for the in-line grading of stone fruit for total soluble solidscontent. Anal. Chim. Acta 555, 286–291.
Gómez, A.H., He, Y., Pereira, A.G., 2006. Nondestructive measurement of acidity,soluble solids and firmness of Satsuma mandarin using VIS/NIR-spectroscopytechniques. J. Food Eng. 77, 313–319.
Guthrie, J.A., Walsh, K., Reid, D.J., Liebensberg, C.J., 2005. Assessment of internalquality attributes of mandarin fruit. 1. NIR calibration model development.Aust. J. Agric. Res. 56, 405–416.
He, Y., Zhang, Y., Pereira, A.G., Go9mez, A.H., Wang, J., 2005. Nondestructivedetermination of tomato fruit quality characteristics using VIS/NIRspectroscopy technique. Int. J. Info. Technol. 11 (11), 97–108.
Jarén, C., Ortuño, J.C., Arazuri, S., Arana, J.I., Salvadores, M.C., 2001. Sugardetermination in grapes using NIR technology. Int. J. Infrared Millimet. Waves22 (10), 1521–1530.
Jordan, R., Seelye, R., McGlone, A., 2001. A sensory-based alternative to brix/acidratio. Food Technol. 55 (6), 36–44.
Kawano, S., Fujiwara, T., Iwamoto, M., 1993. Determination of sugar content insatsuma mandarin using near infrared (NIR) transmittance. J. Jpn. Soc. Hort. Sci.62 (2), 465–470.
Liu, Y., Sun, X., Ouyang, A., 2010. Nondestructive measurement of soluble solidscontent of navel orange fruit by visible-NIR spectrometric technique with PLSRand PCA-BPNN. LWT-Food Sci. Technol. 43 (4), 602–607.
Lü, Q., Tang, M., Cai, J., Lu, H., 2010. Long-term prediction of Zhonghua kiwifruit drymatter by near infrared spectroscopy. Sci. Asia 36, 210–215.
McGlone, V.A., Kawano, S., 1998. Firmness, dry-matter and soluble solidsassessment of postharvest kiwifruit by NIR spectroscopy. Postharvest Biol.Technol. 13, 131–141.
McGlone, V.A., Fraser, D.G., Jordan, R.B., Künnemeyer, R., 2003. Internal qualityassessment of mandarin fruit by Vis/NIR spectroscopy. J. Near InfraredSpectrosc. 11, 323–332.
Nicolaï, B.M., Beullens, K., Bobelyn, E., Peirs, A., Saeys, W., Theron, K.I., Lammertyn, J.,2007. Nondestructive measurement of fruit and vegetable quality by means ofNIR spectroscopy: a review. Postharvest Biol. Technol. 46, 99–118.
Obenland, D., Collin, S., Mackey, B., Sievert, J., Fjeld, K., Arpaia, M.L., 2009.Determinants of flavor acceptability during the maturation of navel oranges.Postharvest Biol. Technol. 52, 156–163.
Pedro, A.M.K., Ferreira, M.M.C., 2007. Simultaneously calibrating solids, sugars andacidity of tomato products using PLS2 and NIR spectroscopy. Anal. Chim. Acta.595, 221–227.
Penchaiya, P., Bobelyn, E., Verlinden, B.E., Nicolaï, B.M., Saeys, W., 2009.Nondestructive measurement of firmness and soluble solids content in bellpepper using NIR spectroscopy. J. Food Eng. 94, 267–273.
Saranwong, S., Sornsrivichai, J., Kawano, S., 2004. Prediction of ripe-stage eatingquality of mango fruit from its harvest quality measured nondestructively bynear infrared spectroscopy. Postharvest Biol. Technol. 31, 137–145.
Slaughter, D.C., Crisosto, C.H., 1998. Nondestructive internal quality assessment ofkiwifruit using near-infrared spectroscopy. Semin. Food Anal. 3, 131–140.
Subedi, P.P., Walsh, K.B., Owens, G., 2007. Prediction of mango eating quality atharvest using short-wave near infrared spectroscopy. Postharvest Biol. Technol.43, 326–334.
Wold, S., Sjöström, M., Eriksson, L., 2001. PLS-regression: a basic tool ofchemometrics. Chemom. Intell. Lab. Syst. 58, 109–130.
Zude, M., Herold, B., Roger, J.M., Bellon-Maurel, V., Landahl, S., 2006. Nondestructivetests on the prediction of apple fruit flesh firmness and soluble solids content ontree and in shelf life. J. Food Eng. 77, 254–260.
Copyright © 2022 FDOKUMEN


![Marily LE NIR, Rememorări de istorie familială (I) [Recollections of Family History (I)]](https://static.fdokumen.com/doc/165x107/63152ace3ed465f0570b73e5/marily-le-nir-rememorari-de-istorie-familiala-i-recollections-of-family-history.jpg)