A nondestructive study of the identification of pigments on monuments by colorimetry
16
112 Int. J. Microstructure and Materials Properties, Vol. 4, No. 1, 2009 Copyright © 2009 Inderscience Enterprises Ltd. A nondestructive study of the identification of pigments on monuments by colorimetry E. Cheilakou* Materials Science and Engineering Section School of Chemical Engineering National Technical University of Athens Iroon Polytechniou 9, 15780 Zografou, Athens, Greece E-mail: [email protected] *Corresponding author M. Kartsonaki Arcelor Purchasing Energy Department Arcelor-Mittal Company 19 Avenue de la Libertè, L-2390, Luxembourg E-mail: [email protected] M. Koui Materials Science and Engineering Section School of Chemical Engineering National Technical University of Athens Iroon Polytechniou 9 15780 Zografou, Athens, Greece Fax: (+30210) 7723261 E-mail: [email protected] P. Callet Applied Mathematics and Systems Laboratory Ecole Centrale Paris Grande Voie des Vignes F-92295 Châtenay Malabry, Paris, France Fax: (33) +1 41 13 17 35 E-mail: [email protected] Abstract: The aim of this work was the identification of the pigments of the Philippe Dagobert monument (1222–1232) by spectrophotometry (Visible (VIS) region). Based on the bibliographic information about the pigments used in the Middle Ages, reference coloured samples were prepared in the laboratory. The study was based on the comparative analysis of VIS reflectance spectra, corresponding to laboratory measurements, with the in situ measurements. The obtained results allowed a primary identification of the
-
Upload
independent -
Category
Documents
-
view
3 -
download
0
Transcript of A nondestructive study of the identification of pigments on monuments by colorimetry

112 Int. J. Microstructure and Materials Properties, Vol. 4, No. 1, 2009
Copyright © 2009 Inderscience Enterprises Ltd.
A nondestructive study of the identification of pigments on monuments by colorimetry
E. Cheilakou* Materials Science and Engineering Section School of Chemical Engineering National Technical University of Athens Iroon Polytechniou 9, 15780 Zografou, Athens, Greece E-mail: [email protected] *Corresponding author
M. Kartsonaki Arcelor Purchasing Energy Department Arcelor-Mittal Company 19 Avenue de la Libertè, L-2390, Luxembourg E-mail: [email protected]
M. Koui Materials Science and Engineering Section School of Chemical Engineering National Technical University of Athens Iroon Polytechniou 9 15780 Zografou, Athens, Greece Fax: (+30210) 7723261 E-mail: [email protected]
P. Callet Applied Mathematics and Systems Laboratory Ecole Centrale Paris Grande Voie des Vignes F-92295 Châtenay Malabry, Paris, France Fax: (33) +1 41 13 17 35 E-mail: [email protected]
Abstract: The aim of this work was the identification of the pigments of the Philippe Dagobert monument (1222–1232) by spectrophotometry (Visible (VIS) region). Based on the bibliographic information about the pigments used in the Middle Ages, reference coloured samples were prepared in the laboratory. The study was based on the comparative analysis of VIS reflectance spectra, corresponding to laboratory measurements, with the in situ measurements. The obtained results allowed a primary identification of the

A nondestructive study of the identification of pigments on monuments 113
pigments: the blue stimuli came from a mixture of azurite and malachite, the green from a mixture of equal concentrations of malachite and green earth, while the red and yellow were obtained from red and yellow ochre, respectively, presenting signs of ageing. Finally, it was concluded from these measurements that VIS reflectance spectroscopy could be considered an appropriate nondestructive method for the investigation and characterisation of the chromatic identity of monuments when no sampling is allowed.
Keywords: artefacts; pigments; nondestructive identification; VIS reflectance spectroscopy.
Reference to this paper should be made as follows: Cheilakou, E., Kartsonaki, M., Koui, M. and Callet, P. (2009) ‘A nondestructive study of the identification of pigments on monuments by colorimetry’, Int. J. Microstructure and Materials Properties, Vol. 4, No. 1, pp.112–127.
Biographical notes: Eleni Cheilakou is a graduate of Chemical Engineering from the University of Patras, Greece, and received her MSc degree in the ‘Protection of Monuments: Materials and Techniques of Conservation Interventions’ from the National Technical University of Athens (NTUA), Greece. Currently she is a PhD student of NTUA and her scientific area of expertise is in the application of spectroscopic and NDT methods and techniques for the characterisation, control of deterioration and conservation-restoration of historical works. She is the author of three publications in international conference proceedings and two publications in Hellenic conference proceedings.
Milka Kartsonaki is a graduate of Chemical Engineering from the National Technical University of Athens, Greece, as well as a graduate of Ecole Centrale Paris, France. Currently she works for the company Arcelor-Mittal as a Buyer Engineer. She fluently speaks French, English and German. She has specialised in colorimetry-spectrophotometry (UV-VIS) for the identification of the colouring substances in monuments.
Maria Koui is a graduate of the University of Bologna, Italy. She received her PhD degree from the National Technical University of Athens (NTUA) of Athens, Greece. Professor Koui is a member of many scientific associations and has published over 90 publications on various aspects of liquid crystals and IR thermography and other spectroscopic and NDT methods and techniques for the characterisation of materials (UV-VIS, FT-IR, SEM-EDAX, XRD, AAS, ICP-AES, XRF, Digital Image Processing (DIP), Fibre Optics Microscopy (FOM), Ultrasonics (US) and Ground Penetrating Radar (GPR)). She is the owner of two patents in the field of LC thermography for the survey of breast cancer. She is the Director of the Materials Science and Engineering Section of the School of Chemical Engineering at the National Technical University of Athens.
Patrick Callet is a graduate of the University P & M Curie. He obtained a PhD in Building Sciences at ECP (1993) and a Habilitation to lead researches in Computer Graphics in 1998. Callet has broad experience in teaching in many schools and colleges. He collaborates in France with prestigious museums (the Louvre, the National Museum of Asiatic Arts, Saint-Denis Basilica) and schools for engineers. His research fields mainly concern physically based rendering and colour. A member of the AIC, he is also Vice-President of the Centre Français de la Couleur. He is the author of a famous book written in

114 E. Cheilakou, M. Kartsonaki, M. Koui and P. Callet
French, Couleur-lumière, couleur-matière – interaction lumière-matière et synthèse d'image (1998, Diderot). He is a co-author of books and articles in an esteemed engineering encyclopedia.
1 Introduction
Colour in general is a basic element of human perception and can be defined as the impression formed in the eye because of different luminous irradiations and wavelengths. For instance, a coloured surface is the result of the interaction of electromagnetic radiation with matter in the Visible (VIS) region of the spectrum (380–780 nm). Every colour corresponds to a precise wavelength and its image takes birth only in our brain, after the meaning given by the cortex of the eye to each optical sign received. Consequently, every chromatic impression is directly related to the optical sign of the eye and the human psychism (Malacara, 2002).
For the scientists, the concept of colour is relevant to the characterisation of spectral properties resulting from the diversion of luminous radiation when it interacts with matter. The most important one, which could also be defined as the fingerprint of each colour, is the reflectance factor R(λ), representing the percentage of reflected irradiation for a given wavelength. The reflectance factor contains information about the dominant wavelength and chromaticity of a pigment (Malacara, 2002; Noboru and Robertson, 2006).
All the pigments used in this work were in powder form. Some were very difficult to find and could be very expensive, while others were very easy to obtain. The pigments used by medieval craftsmen were composed mainly of mineral and vegetable substances. The confirmation of their compositions was based on old texts dealing with techniques used in the preparation and fabrication of colours. However, many of these texts were unfortunately destroyed by ageing and history. Modern technology for physical and chemical analyses of samples has provided the ability to define the types of products used and their origin, as well as to know their compositions with certainty (Loumyer, 1996).
For instance, for the determination of the chromatic identity of the monument that was studied, colorimetry was used, which is a method that visualises the result of the interaction of light with a coloured surface and is capable of reproducing correctly the three primary stimuli red (R), green (G) and blue (B) responsible for the excitation of human optical cells. For a given incidence angle and light source, the spectrum of the intensity of the reflected radiation gives access to the characteristics of the coloured surface. This spectrum is nothing more than a record of the energy propagated by the surface for every wavelength of light transmitted (ultraviolet, visible or infrared). Each spectrum is a function of the wavelength of the radiation, allowing the identification of the colours through spectral intensity comparisons. Thirty-two measurements, one for every 10 nm, are sufficient to give the visible spectrum of a luminous irradiation (Malacara, 2002; Noboru and Robertson, 2006; Orfanakos, 2004).
According to bibliographic research, the nondestructive technique of Fibre Optics Reflectance Spectroscopy (FORS) in the VIS and Near-Infrared (Near-IR) regions has provided scientists with useful data for the investigation of artworks. It can be considered as a useful and noninvasive tool for acquiring spectral information especially from

A nondestructive study of the identification of pigments on monuments 115
paintings and wall paintings for pigments’ identification, by correlating the sample spectrum to a suitable database (Picollo et al., 2000; Bacci et al., 2007), as well as for analysing colour changes in paintings (Bacci et al., 1997). In the past years, the FORS technique has also been proposed in the Near-IR spectra for the detection of alteration products (e.g., gypsum, calcium oxalates) on substrates made of carbonaceous materials such as frescoes and calcareous statues and monuments (Bacci et al., 1995; Chiari et al., 1996).
This work was carried out in the framework of a complete effort of maintenance, restoration and protection of the colours of the Philippe Dagobert monument (1222–1232) exhibited in the Saint Denis Cathedral in Paris. The ageing of the monument, as well as the great historical interest and its great value, did not allow any sampling for the chemical composition of materials. Thus, the analytical nondestructive technique of VIS reflectance spectroscopy with optical fibre was used for the investigation and characterisation of the chromatic identity of the monument.
2 Experimental procedure
According to the bibliographic sources found in the National Library François Mitterrand of France, the entire surface of the Monument of Philippe Dagobert was coloured. As shown in Figures 1(a) and 1(b), Dagobert is lying down and dressed with clothes characteristic of the Middle Ages. His head rests on two pillows, on the right and left of which there are two angels, while just below his feet there is a lion. Through the ages the greater part of the colours have disappeared. The colours that have been left, mainly on the dresses and other parts of the monument, are the following:
• yellow on Dagobert’s hair, the lion’s mane and the angels’ wings
• blue on the angels’ and Philippe’s dresses
• red on the upper pillow, Philippe’s elbow, the inside of Philippe’s dress and the lion’s body
• green on the lower pillow.
Figure 1 In situ measurement of red stimuli in the Saint Denis Cathedral taken from (a) the upper pillow; (b) lion’s body (see online version for colours)
(a) (b)
A B

116 E. Cheilakou, M. Kartsonaki, M. Koui and P. Callet
2.1 Materials and sample preparation
2.1.1 Materials
According to the bibliography, the monument was made of limestone originally coming from the Saint Maximin quarry, a region north of Paris. The limestone test plates that were used came from the same quarry. The selection of the pigments was based on bibliographic sources, and was the same as the ones used in the Middle Ages, which are described in Table 1.
Table 1 Pigments figuring in craftsmen’s work during the Middle Ages
Pigment Chemical type When discovered Origin Remarks
White
White lead 2PbCO3.Pb(OH)2 4th century BC Europe Very toxic
Black
Black Amorphous C Antiquity Europe Prepared from the charring of bones and grapes
Blue
Ultramarine blue or lazuli or lapis lazuli
Si6Al6Na10S2O24 3500 BC Afghanistan; Bedakshan quarry, Iran
Semiprecious stone, principally used for jewellery
Very good covering and plating capacity
Very expensive
Copper blue or azurite
2CuCO3.Cu(OH)2 Antiquity Russia, Africa, Hungary
May be extracted from mines or produced artificially
Green
Green earth Fe2SiO3 Antiquity Roman Empire Found in argillaceous ground, containing minerals such as glauconite and seladonite
Malachite CuCO3.Cu(OH)2 Antiquity Siberia, Central Europe, Russia, Africa
Varicoloured semiprecious stone
Nonmiscible
Product of the disintegration of azurite
Red
Minium Pb3O4 Antiquity Roman Empire Very toxic
Coming from the charring of white lead
Providing an orange red colour
Quickly darkening when exposed to light
A nondestructive study of the identification of pigments on monuments 117
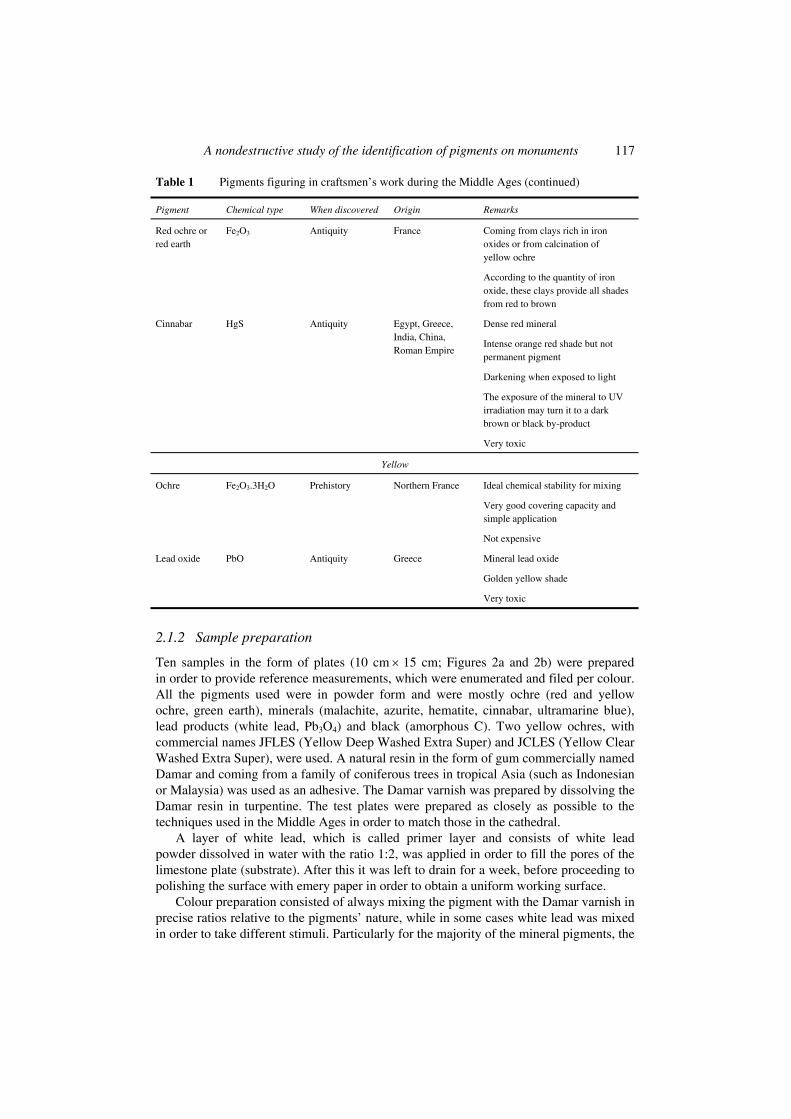
Table 1 Pigments figuring in craftsmen’s work during the Middle Ages (continued)
Pigment Chemical type When discovered Origin Remarks
Red ochre or red earth
Fe2O3 Antiquity France Coming from clays rich in iron oxides or from calcination of yellow ochre
According to the quantity of iron oxide, these clays provide all shades from red to brown
Cinnabar HgS Antiquity Egypt, Greece, India, China, Roman Empire
Dense red mineral
Intense orange red shade but not permanent pigment
Darkening when exposed to light
The exposure of the mineral to UV irradiation may turn it to a dark brown or black by-product
Very toxic
Yellow
Ochre Fe2O3.3H2O Prehistory Northern France Ideal chemical stability for mixing
Very good covering capacity and simple application
Not expensive
Lead oxide PbO Antiquity Greece Mineral lead oxide
Golden yellow shade
Very toxic
2.1.2 Sample preparation
Ten samples in the form of plates (10 cm × 15 cm; Figures 2a and 2b) were prepared in order to provide reference measurements, which were enumerated and filed per colour. All the pigments used were in powder form and were mostly ochre (red and yellow ochre, green earth), minerals (malachite, azurite, hematite, cinnabar, ultramarine blue), lead products (white lead, Pb3O4) and black (amorphous C). Two yellow ochres, with commercial names JFLES (Yellow Deep Washed Extra Super) and JCLES (Yellow Clear Washed Extra Super), were used. A natural resin in the form of gum commercially named Damar and coming from a family of coniferous trees in tropical Asia (such as Indonesian or Malaysia) was used as an adhesive. The Damar varnish was prepared by dissolving the Damar resin in turpentine. The test plates were prepared as closely as possible to the techniques used in the Middle Ages in order to match those in the cathedral.
A layer of white lead, which is called primer layer and consists of white lead powder dissolved in water with the ratio 1:2, was applied in order to fill the pores of the limestone plate (substrate). After this it was left to drain for a week, before proceeding to polishing the surface with emery paper in order to obtain a uniform working surface.
Colour preparation consisted of always mixing the pigment with the Damar varnish in precise ratios relative to the pigments’ nature, while in some cases white lead was mixed in order to take different stimuli. Particularly for the majority of the mineral pigments, the
118 E. Cheilakou, M. Kartsonaki, M. Koui and P. Callet
ratio of the pigment with the Damar varnish was 1:1, whereas for ochre and black it was 1:3. Black was used also as a second primer layer, in order to study its effect on the spectral reflectance intensity of the pigments. For multiple applications of colour layers, it was necessary to wait until complete drying of each layer and then to use a varnish layer of Damar between the layers that would isolate each one.
All formulations were prepared with pigments ground in a suitable agate mortar. The same process was followed for the Damar resin. Then the pigments and Damar varnish were mixed, adding spirit of turpentine stepwise in order to achieve suitable workability. The pigments were left to rest and form colloidal systems with time, where the dispersion medium was the Damar resin. Colour coating usually took place some days after colour preparation.
Three types of samples were prepared:
1 a plate divided into two different areas (Figure 2a), both of them covered with white lead and water, and one of them covered with a Damar varnish layer. Their compositions are shown in Table 2. This sample was used in order to study the effect of the Damar varnish layer on spectral reflectance intensity.
2 six plates, divided into eight different areas (Figure 2b) covered with different colours and their stimuli. Their compositions are shown in Tables 3–8. The primer layer of these plates consisted of white lead and water (ratio 1:2).
3 three test plates, divided into eight different areas (Figure 2b) covered with all examined colours (with different and without primer layers). Their compositions are shown in Tables 9–11. These samples were used in order to study the effect of the primer layer on spectral reflectance intensity.
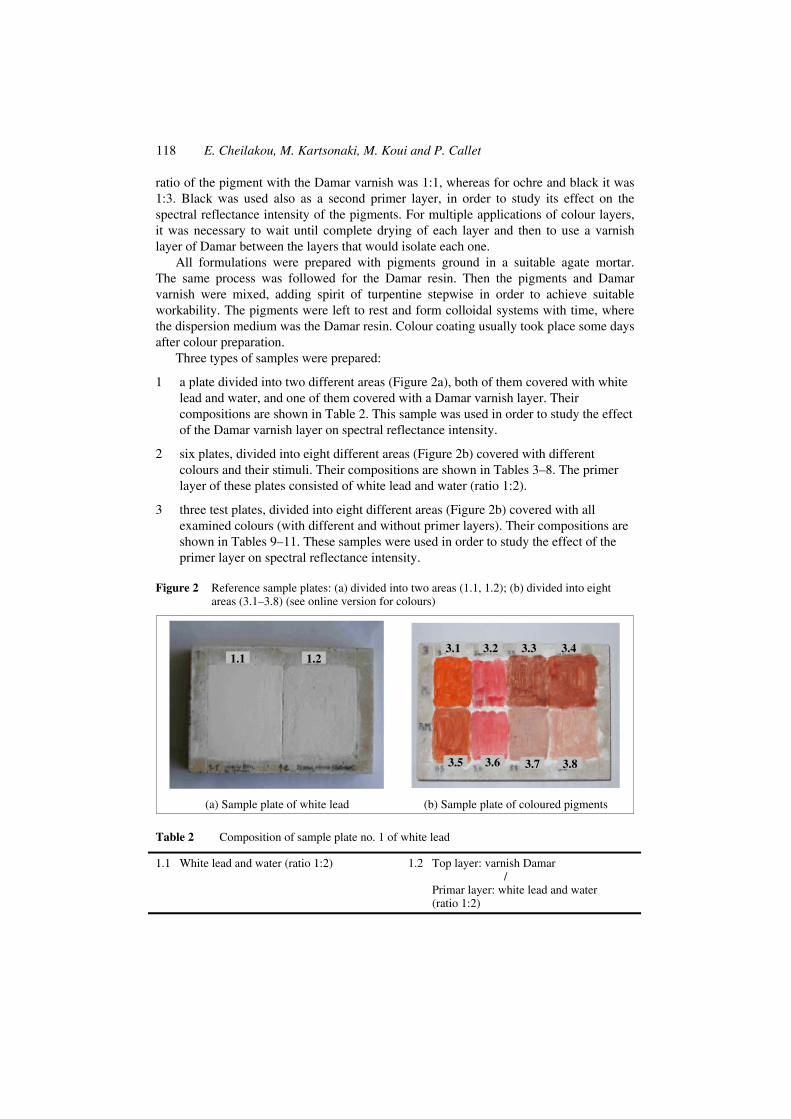
Figure 2 Reference sample plates: (a) divided into two areas (1.1, 1.2); (b) divided into eight areas (3.1–3.8) (see online version for colours)
(a) Sample plate of white lead (b) Sample plate of coloured pigments
Table 2 Composition of sample plate no. 1 of white lead
1.1 White lead and water (ratio 1:2) 1.2 Top layer: varnish Damar / Primar layer: white lead and water (ratio 1:2)
1.1 1.2 3.1 3.2 3.3
3.8
3.4
3.5 3.6 3.7

A nondestructive study of the identification of pigments on monuments 119
Table 3 Composition of sample plate no. 3 of red stimuli
3.1 Minium 3.2 Cinnabar 3.3 Hematite 3.4 Red ochre
3.5 Minium and red ochre (ratio 1:1)
3.6 Cinnabar and white lead (ratio 1:1)
3.7 Hematite and white lead (ratio 1:1)
3.8 Red ochre and white lead (ratio 1:1)
Table 4 Composition of sample plate no. 4 of red stimuli in black and white background
4.1 Minium 4.2 White lead and water (ratio 1:2)
4.3 Minium and white lead (ratio 1:1)
4.4 2nd colour layer: red ochre / 1st colour layer minium
4.5 Top layer: minium / primer layer: black
4.6 Top layer: red ochre / primer layer black
4.7 Cinnabar and red ochre (ratio 1:1)
4.8 2nd colour
layer: minium / 1st colour layer: red ochre
Table 5 Composition of sample plate no. 6 of blue stimuli
6.1 Ultramarine blue 6.2 Ultramarine blue and white lead (ratio 1:1)
6.3 Azurite 6.4 Azurite and white lead (ratio 1:1)
6.5 Top layer: azurite / primer layer: black
6.6 Azurite and malachite (ratio 1:1)
6.7 Ultramarine blue and malachite (ratio 1:1)
6.8 Top layer: ultramarine blue / primer layer: black
Table 6 Composition of sample plate no. 7 of yellow ochre
7.1 Yellow ochre (JFLES)
7.2 White lead and water (ratio 1:2)
7.3 Yellow ochre (JCLES)
7.4 White lead and water (ratio 1:2)
7.5 Top layer: yellow ochre (JFLES) / primer layer black
7.6 Yellow ochre (JFLES) and hematite (ratio 1:1)
7.7 Top layer: yellow ochre (JCLES) / primer layer: black
7.8 White lead and water (ratio 1:2)
Table 7 Composition of sample plate no. 8 of yellow lead oxide (PbO)
8.1 Lead oxide 8.2 Lead oxide and white lead (ratio 1:1)
8.3 Lead oxide and yellow ochre (JFLES) (ratio 1:1)
8.4 Lead oxide and yellow ochre (JCLES) (ratio 1:1)
8.5 White lead and water (ratio 1:2)
8.6 Top layer: lead oxide / primer layer: black
8.7 White lead and water (ratio 1:2)
8.8 White lead and water (ratio 1:2)

120 E. Cheilakou, M. Kartsonaki, M. Koui and P. Callet
Table 8 Composition of sample plate no. 9 of green stimuli
9.1 Green earth 9.2 Top layer: green earth / primer layer: black
9.3 Green earth and white lead (ratio 1:2)
9.4 Malachite and green earth (ratio 1:1)
9.5 Green earth and white lead (ratio 1:1)
9.6 Malachite 9.7 Top layer: malachite / primer layer: black
9.8 Malachite and white lead (ratio 1:1)
Table 9 Composition of test plate no. 15
15.1 Top layer: yellow ochre (JFLES) / primer layer: white lead and water
15.2 Top layer: red ochre / primer layer: white lead and water
15.3 Top layer: hematite / primer layer: white lead and water
15.4 Top layer: green earth / primer layer: white lead and water
15.5 Top layer: malachite / primer layer: white lead and water
15.6 Top layer: azurite / primer layer: white lead and water
15.7 Top layer: yellow ochre (JCLES) / primer layer: white lead and water
15.8 Top layer: black /
primer layer: white lead and water
Table 10 Composition of test plate no. 2
2.1 Top layer: yellow ochre (JFLES) / intermediate layer: varnish Damar / primer layer: white lead and water
2.2 Top layer: red ochre / intermediate layer: varnish Damar / primer layer: white lead and water)
2.3 Top layer: hematite / intermediate layer: varnish Damar / primer layer: white lead and water
2.4 Top layer: green earth / intermediate layer varnish Damar / primer layer: white lead and water
2.5 Top layer: malachite / intermediate layer: varnish Damar / primer layer: white lead and water
2.6 Top layer: azurite / intermediate layer: varnish Damar / primer layer: white lead and water
2.7 Top layer:
yellow ochre (JCLES) / intermediate layer: varnish Damar / primer layer: white lead and water
2.7 Top layer: black / intermediate layer varnish Damar / primer layer: white lead and water

A nondestructive study of the identification of pigments on monuments 121
Table 11 Composition of test plate no. 14
14.1 Yellow ochre (JFLES)
14.2 Red ochre 14.3 Hematite 14.4 Green earth
14.5 Malachite 14.6 Azurite 14.7 Yellow ochre (JCLES)
14.8 Black
2.2 Methods
Two series of measurements were made, one in situ in the Saint Denis Cathedral (Figures 1a and 1b) and one in the laboratory (Figure 3a). All the measurements were carried out with the use of a portable USB2000 (UV-VIS-NIR) fibre optic spectrophotometer of the company Ocean Optics (Figure 3b), which is preconfigured for applications from 200–1100 nm (Site Ocean Optics Co., 2007).
Figure 3 Measurements of the reference sample plates in the laboratory: (a) optical fibre (fixed on the improvised deposition) (1), light source (2), sample plate (3); (b) Spectrophotometer USB2000 (4) (see online version for colours)
(a) Experimental disposition (b) Spectrophotometer USB2000
Regarding the process of taking a reflectance colour measurement, two reference spectra should be recorded for the right processing of the measurements:
1 a dark spectrum, which is a spectrum of black colour and is taken with the light path blocked
2 a reference spectrum, which is a spectrum taken with the light source on and a reference blank reflectance standard in the sampling region.
Measurements in situ were taken in almost absolute darkness in order to increase the accuracy of the results by eliminating the effect of ambient light. Given the sensibility of the measurements, the error in measuring because of the unsteadiness of the human hand was minimised by using an improvised disposition, allowing a more precise and stable focus. The distance between the optical fibre and the measuring points, as well as the incidence angle, were kept constant during all the measurements. Due to the ageing of the colours, the optical fibre was focused as closely as possible to the measuring point,
1
2
3
4
122 E. Cheilakou, M. Kartsonaki, M. Koui and P. Callet
so as to acquire as much spectral information as possible. Concerning the manner of determining measuring points, the extant remains of colours appearing on the less exposed areas, such as on the cavities and folds of the monument, were measured.
Measurements of the sample plates in the laboratory (Figure 3a) were taken in absolute darkness as well as under the same measuring conditions as the ones mentioned above.
3 Results and discussion
The study of the reflectance spectra of all samples, as well as the comparative analysis of the reflectance spectral diagrams from both measurement series (taken in situ and in the laboratory) for each colour, led to the following observations and results.
3.1 Effect of various parameters on the reflectance spectra of the pigments
3.1.1 Effect of the Damar varnish layer
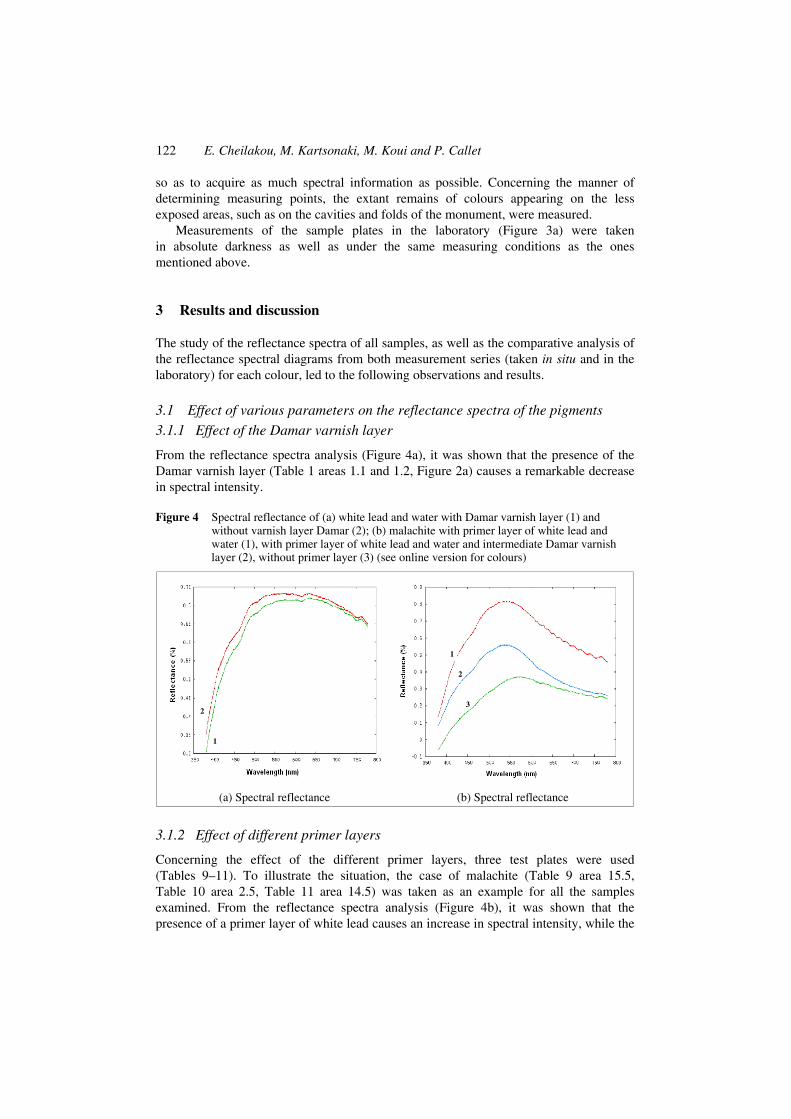
From the reflectance spectra analysis (Figure 4a), it was shown that the presence of the Damar varnish layer (Table 1 areas 1.1 and 1.2, Figure 2a) causes a remarkable decrease in spectral intensity.
Figure 4 Spectral reflectance of (a) white lead and water with Damar varnish layer (1) and without varnish layer Damar (2); (b) malachite with primer layer of white lead and water (1), with primer layer of white lead and water and intermediate Damar varnish layer (2), without primer layer (3) (see online version for colours)
(a) Spectral reflectance (b) Spectral reflectance
3.1.2 Effect of different primer layers
Concerning the effect of the different primer layers, three test plates were used (Tables 9–11). To illustrate the situation, the case of malachite (Table 9 area 15.5, Table 10 area 2.5, Table 11 area 14.5) was taken as an example for all the samples examined. From the reflectance spectra analysis (Figure 4b), it was shown that the presence of a primer layer of white lead causes an increase in spectral intensity, while the
1
2
1
2
3

A nondestructive study of the identification of pigments on monuments 123
absence of a primer layer causes the lowest intensity and a slight shift of the peak in higher wavelengths due to the light yellow colour of the limestone that interfered in the measurement. All the pigments, except the dark ones such as hematite and black, presented the same behaviour.
In the case of black colour (Table 9 area 15.8, Table 10 area 2.8, Table 11 area 14.8), the absence of a primer layer (Figure 5a) presents a higher reflectance intensity than the one with an intermediate Damar varnish layer. An explanation for this behaviour is that dark pigments usually consist of bigger particles than other pigments, blocking the penetration into the limestone pores.
Figure 5 Spectral reflectance of (a) black pigment with primer layer of white lead and water (1), without primer layer (2), with primer layer of white lead and water and intermediate Damar varnish layer (3); (b) azurite (1) and a 1:1 mix of azurite and white lead (2) (see online version for colours)
(a) Spectral reflectance (b) Spectral reflectance
3.1.3 Effect of mixing pigments with white lead
Concerning the effect of mixing pigments with white lead, the case of azurite (Table 5 areas 6.3 and 6.4) was taken as an example for all the samples examined. From the reflectance spectral analysis (Figure 5b), it was shown that mixing pigments with white lead causes a higher reflectance spectral intensity, while a slight shift of the peak in higher wavelengths is also observed.
3.1.4 Effect of the presence of a second (black) primer layer
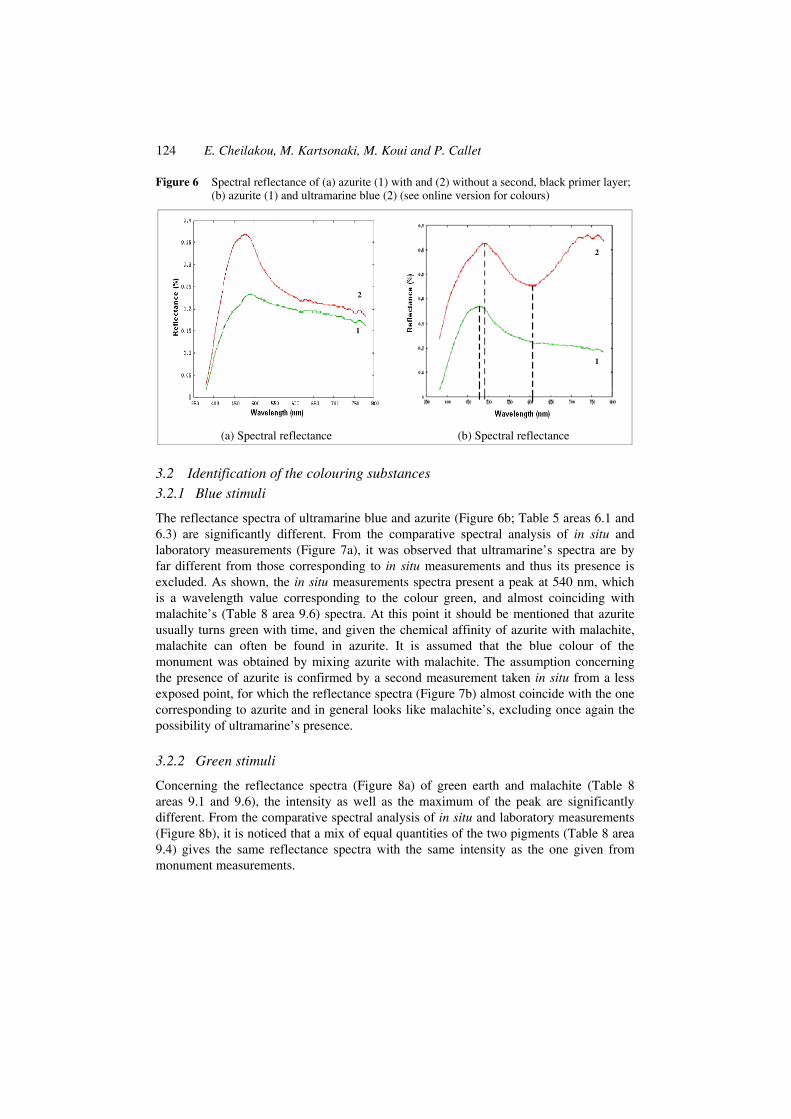
As expected, the presence of a second, black primer layer not only decreases the spectral intensity of the pigment, as shown in Figure 6(a) corresponding to azurite’s spectrum (Table 5 areas 6.3 and 6.5), but also tends to widen the peak. All the pigments presented the same behaviour.
1
2
3
2
1
124 E. Cheilakou, M. Kartsonaki, M. Koui and P. Callet
Figure 6 Spectral reflectance of (a) azurite (1) with and (2) without a second, black primer layer; (b) azurite (1) and ultramarine blue (2) (see online version for colours)
(a) Spectral reflectance (b) Spectral reflectance
3.2 Identification of the colouring substances 3.2.1 Blue stimuli
The reflectance spectra of ultramarine blue and azurite (Figure 6b; Table 5 areas 6.1 and 6.3) are significantly different. From the comparative spectral analysis of in situ and laboratory measurements (Figure 7a), it was observed that ultramarine’s spectra are by far different from those corresponding to in situ measurements and thus its presence is excluded. As shown, the in situ measurements spectra present a peak at 540 nm, which is a wavelength value corresponding to the colour green, and almost coinciding with malachite’s (Table 8 area 9.6) spectra. At this point it should be mentioned that azurite usually turns green with time, and given the chemical affinity of azurite with malachite, malachite can often be found in azurite. It is assumed that the blue colour of the monument was obtained by mixing azurite with malachite. The assumption concerning the presence of azurite is confirmed by a second measurement taken in situ from a less exposed point, for which the reflectance spectra (Figure 7b) almost coincide with the one corresponding to azurite and in general looks like malachite’s, excluding once again the possibility of ultramarine’s presence.
3.2.2 Green stimuli
Concerning the reflectance spectra (Figure 8a) of green earth and malachite (Table 8 areas 9.1 and 9.6), the intensity as well as the maximum of the peak are significantly different. From the comparative spectral analysis of in situ and laboratory measurements (Figure 8b), it is noticed that a mix of equal quantities of the two pigments (Table 8 area 9.4) gives the same reflectance spectra with the same intensity as the one given from monument measurements.
2
1
2
1

A nondestructive study of the identification of pigments on monuments 125
Figure 7 Spectral reflectance of (a) blue stimuli in situ (1, 2), azurite (3), malachite (4) and ultramarine blue (5); (b) blue stimuli in situ (1), azurite (2), malachite (3) and ultramarine blue (4) (see online version for colours)
(a) Spectral reflectance (b) Spectral reflectance
Figure 8 Spectral reflectance of (a) green earth (1) and malachite (2); (b) green stimuli in situ (1), malachite (2), green earth (3) and a 1:1 mix of malachite and green earth (4) (see online version for colours)
(a) Spectral reflectance (b) Spectral reflectance
3.2.3 Yellow stimuli
The reflectance spectra (Figure 9a) of the yellow ochres JFLES and JCLES (Table 6 areas 7.1 and 7.3) and of lead oxide (Table 7 area 8.1) present significant differences. In Figure 9(b) it is observed that the reflectance spectra of in situ measurements, in higher wavelengths, approach the shape corresponding to the 1:1 mix of lead oxide and the yellow ochre JFLES (Table 7 area 8.3), and in lower wavelengths that of the yellow ochre JFLES. The idea of mixing the yellow ochre JFLES with hematite (Table 6 area 7.6) came from the way that ochre changes with time. Finally, it was considered that the yellow stimuli of the monument were obtained from yellow ochre, which became darker due to the ageing of the colour.
5
1, 2
3
4
4
1
3
2
1
2
1 3
4
2

126 E. Cheilakou, M. Kartsonaki, M. Koui and P. Callet
Figure 9 Spectral reflectance of (a) Yellow ochre JFLES (1), JCLES (2) and lead oxide (4) (b) yellow stimuli in situ (1), 1:1 mix of lead oxide and yellow ochre JFLES (2), yellow ochre JFLES (3) and 1:1 mix of hematite and yellow ochre JFLES (4) (see online version for colours)
(a) Spectral reflectance (b) Spectral reflectance
3.2.4 Red stimuli
From the comparative spectral analysis of in situ and laboratory measurements (Figure 10), it is observed that the reflectance spectra of red ochre (Table 3 area 3.4) are similar to the ones of the in situ measurements that are slightly shifted. This is due to the ageing of the colours that become darker and present a lower spectral intensity.
Figure 10 Spectral reflectance of red stimuli in situ (1, 2), red ochre (3) and minium (4) (see online version for colours)
2
4
3 1
2
1
3
3 4 1
2

A nondestructive study of the identification of pigments on monuments 127
4 Conclusions
The above results led to the following conclusions about the identification of the pigments of the Philippe Dagobert monument:
• Blue stimuli come from a mixture of azurite and malachite.
• Green stimuli come from a mixture of equal concentrations of malachite and green earth.
• Red stimuli are obtained from red ochre that is presenting signs of ageing.
• Yellow stimuli are obtained from yellow ochre that is presenting signs of ageing.
Finally, it is concluded that VIS FORS can be considered an appropriate nondestructive method for the investigation and characterisation of the chromatic identity of monuments when no sampling is allowed.
References
Bacci, M., Baronti, S., Casini, A., Castagna, P., Linary, R., Orlando, A. and Radicati, B. (1995) ‘Detection of alternation products in artworks by non-destructive spectroscopic analysis’, Materials Research Society Symposium Proceedings, Vol. 352, pp.153–159.
Bacci, M., Picollo, M., Porcinai, S. and Radicati, B. (1997) ‘Non-destructive spectrophotometry and colour measurements applied to the study of the works of art’, Techne, Vol. 5, pp.28–33.
Bacci, M., Picollo, M., Trumpy, G., Tsukada, M. and Kunzelman, D. (2007) ‘Non-invasive identification of white pigments on 20th century oil paintings by using fiber optic reflectance spectroscopy’, Journal of the American Institute for Conservation, Vol. 46, pp.27–37.
Chiari, R., Picollo, M., Porcinai, S., Radicati, B. and Orlando, A. (1996) ‘Non destructive reflectance spectroscopy in the discrimination of two authigenic minerals: gypsum and weddellite’, Proceedings of the 2nd International Symposium: The Oxalate Films in the Conservation of Works of Art, pp.379–389.
Loumyer, G. (1996) Les Traditions Techniques de la Peinture Médiévale [in French], Reprint of the edition of 1920, Publication Nogent le Roi: J. Laget.
Malacara, D. (2002) Colour Vision and Colorimetry, Theory and Applications, USA: Spie Press Editions.
Noboru, O. and Robertson, A. (2006) Colorimetry (Fundamentals and Applications), USA: John Wiley & Sons Inc. Editions.
Orfanakos, V. (2004) Chromatometry: Basic Principles [in Greek], Athens: Stamuli Editions.
Picollo, M., Bacci, M., Casini, A., Lotti, F., Porcinai, S., Radicati, B. and Stefani, L. (2000) ‘Fiber optics reflectance spectroscopy, a non-destructive technique for the analysis of works of art’, in Martellucci, S. et al. (Eds.) Optical Sensors and Microsystems: New Concept, Materials, Technologies, New York: Kluwer Academic/Plenum Publishers, pp.259–265.
Site Ocean Optics Co. (2007) http://www.oceanoptics.com/products/usb2000.asp.