Narrowband Midinfrared Reflectance Filters Using Guided Mode Resonance
10
Narrowband Midinfrared Reflectance Filters Using Guided Mode Resonance Anil K. Kodali, †,‡,§ Matthew Schulmerich, ‡,§,| Jason Ip, §,| Gary Yen, §,⊥ Brian T. Cunningham, §,⊥ and Rohit Bhargava* ,‡,§,| Department of Mechanical Science and Engineering, Beckman Institute for Advanced Science and Technology, Micro and Nanotechnology Laboratory, Electrical and Computer Engineering, and Department of Bioengineering, University of Illinois at Urbana-Champaign, Urbana, Illinois, 61801 There is a need to develop mid-infrared (IR) spectrom- eters for applications in which the absorbance of only a few vibrational mode (optical) frequencies needs to be recorded; unfortunately, there are limited alterna- tives for the same. The key requirement is the develop- ment of a means to discretely access a small set of spectral positions from the wideband thermal sources commonly used for spectroscopy. We present here the theory, design, and practical realization of a new class of filters in the mid-infrared (IR) spectral regions based on using guided mode resonances (GMR) for narrow- band optical reflection. A simple, periodic surface-relief configuration is chosen to enable both a spectral response and facile fabrication. A theoretical model based on rigorous coupled wave analysis is developed, incorporating anomalous dispersion of filter materials in the mid-IR spectral region. As a proof-of-principle demonstration, a set of four filters for a spectral region around the C-H stretching mode (2600-3000 cm -1 ) are fabricated and responses compared to theory. The reflectance spectra were well-predicted by the developed theory and results were found to be sensitive to the angle of incidence and dispersion characteristics of the material. In summary, the work reported here forms the basis for a rational design of filters that can prove useful for IR absorption spectroscopy. Midinfrared (IR) vibrational spectroscopy is one of the most common molecular analysis techniques in use. IR spectral data is almost exclusively acquired using Fourier transform-infrared (FT- IR) spectrometers due to their multiplex advantage, ordinate precision, mature instrumentation, and versatility. 1 A major dif- ference from when FT-IR spectroscopy was being developed and the present day, however, is that IR spectroscopy has been largely supplanted by nuclear magnetic resonance (NMR) spectroscopy to identify molecular structure. Molecular structure verifications today usually consist of comparisons of measured spectra to databases, rather than to first principles elucidation, which is considerably less restrictive than acquiring high-resolution data for fundamental studies. At the same time, advances in instru- mentation and their user-friendliness have resulted in the use of IR spectroscopy for fairly routine tasks in process monitoring and quality control. For many of these applications, only a portion of the spectrum is often useful, for example, in reaction monitoring, and a low-resolution spectrum is often sufficient for database matching. The use of interferometers for these applications is contraindicated. IR interferometers are exceptionally useful, in contrast, for sophisticated experiments, including imaging, 2 cir- cular dichroism, 3 and perturbation-response 4 experiments. Even in these cases, the expense and time required argues against full spectral acquisition as it is often minimally more informative than selected spectral regions 5 and certain applications could be faster if smaller volumes of data were acquired, for example, for tissue identification in cancer pathology. 6 In FT-IR spectroscopy, large spectral regions are typically acquired. For large regions, the multiplexing advantage for signal- to-noise ratio (SNR) is also accompanied by a disadvantage for noise. 7,8 The noise is spectrally uniform while the signal is not; hence, increasing SNR for even a single feature requires substan- tial effort over the entire spectrum. For characterization of many biological systems, optimal spectral regions and features have recently been identified. 9,10 For example, in a recent application of IR spectral imaging to automated breast pathology, we were able to deduce the appropriate structure of breast tissue and the presence of cancer to high accuracy using only six spectral features. 11 With the limitation of the acquisition to these smaller optimal data sets, the SNR can be increased and acquisition time * To whom correspondence should be addressed. E-mail: [email protected]. † Department of Mechanical Science and Engineering. ‡ Beckman Institute for Advanced Science and Technology. § Micro and Nanotechnology Laboratory. | Department of Bioengineering. ⊥ Electrical and Computer Engineering. (1) Griffiths, P. R.; DeHaseth, J. A. Fourier Transform Infrared Spectrometry; John Wiley & Sons: Hoboken, NJ, 2007. (2) Lewis, E. N.; Treado, P. J.; Reeder, R. C.; Story, G. M.; Dowrey, A. E.; Marcott, C.; Levin, I. W. Anal. Chem. 1995, 67, 3377–3381. (3) Lipp, E. D.; Zimba, C. G.; Nafie, L. A. Chem. Phys. Lett. 1982, 90, 1–5. (4) Uhmann, W.; Becker, A.; Taran, C.; Siebert, F. Appl. Spectrosc. 1991, 45, 390–397. (5) Hamm, P.; Wiemann, S.; Zurek, M.; Zinth, W. Opt. Lett. 1994, 19, 1642– 1644. (6) Bhargava, R.; Fernandez, D. C.; Hewitt, S. M.; Levin, I. W. Biochim. Biophys. Acta 2006, 1758, 830–845. (7) Plankey, F. W.; Glenn, T. H.; Hart, L. P.; Wineforder, J. D. Anal. Chem. 1974, 46, 1000–1005. (8) Voigtman, E.; Winefordner, J. D. Appl. Spectrosc. 1987, 41, 1101–1261. (9) Fernandez, D. C.; Bharagava, R.; Hewitt, S. M.; Levin, I. W. Nat. Biotechnol. 2005, 23, 469–474. (10) Bhargava, R. Anal. Bioanal. Chem. 2007, 389, 1155–1169. (11) Pounder, F. N.; Reddy, R. K.; Bhargava, R. Submitted for publication. Anal. Chem. 2010, 82, 5697–5706 10.1021/ac1007128 2010 American Chemical Society 5697 Analytical Chemistry, Vol. 82, No. 13, July 1, 2010 Published on Web 06/07/2010
-
Upload
independent -
Category
Documents
-
view
0 -
download
0
Transcript of Narrowband Midinfrared Reflectance Filters Using Guided Mode Resonance

Narrowband Midinfrared Reflectance Filters UsingGuided Mode Resonance
Anil K. Kodali,†,‡,§ Matthew Schulmerich,‡,§,| Jason Ip,§,| Gary Yen,§,⊥ Brian T. Cunningham,§,⊥ andRohit Bhargava*,‡,§,|
Department of Mechanical Science and Engineering, Beckman Institute for Advanced Science and Technology, Microand Nanotechnology Laboratory, Electrical and Computer Engineering, and Department of Bioengineering, Universityof Illinois at Urbana-Champaign, Urbana, Illinois, 61801
There is a need to develop mid-infrared (IR) spectrom-eters for applications in which the absorbance of onlya few vibrational mode (optical) frequencies needs tobe recorded; unfortunately, there are limited alterna-tives for the same. The key requirement is the develop-ment of a means to discretely access a small set ofspectral positions from the wideband thermal sourcescommonly used for spectroscopy. We present here thetheory, design, and practical realization of a new classof filters in the mid-infrared (IR) spectral regions basedon using guided mode resonances (GMR) for narrow-band optical reflection. A simple, periodic surface-reliefconfiguration is chosen to enable both a spectralresponse and facile fabrication. A theoretical modelbased on rigorous coupled wave analysis is developed,incorporating anomalous dispersion of filter materialsin the mid-IR spectral region. As a proof-of-principledemonstration, a set of four filters for a spectral regionaround the C-H stretching mode (2600-3000 cm-1)are fabricated and responses compared to theory.The reflectance spectra were well-predicted by thedeveloped theory and results were found to besensitive to the angle of incidence and dispersioncharacteristics of the material. In summary, the workreported here forms the basis for a rational designof filters that can prove useful for IR absorptionspectroscopy.
Midinfrared (IR) vibrational spectroscopy is one of the mostcommon molecular analysis techniques in use. IR spectral data isalmost exclusively acquired using Fourier transform-infrared (FT-IR) spectrometers due to their multiplex advantage, ordinateprecision, mature instrumentation, and versatility.1 A major dif-ference from when FT-IR spectroscopy was being developed andthe present day, however, is that IR spectroscopy has been largelysupplanted by nuclear magnetic resonance (NMR) spectroscopyto identify molecular structure. Molecular structure verifications
today usually consist of comparisons of measured spectra todatabases, rather than to first principles elucidation, which isconsiderably less restrictive than acquiring high-resolution datafor fundamental studies. At the same time, advances in instru-mentation and their user-friendliness have resulted in the use ofIR spectroscopy for fairly routine tasks in process monitoring andquality control. For many of these applications, only a portion ofthe spectrum is often useful, for example, in reaction monitoring,and a low-resolution spectrum is often sufficient for databasematching. The use of interferometers for these applications iscontraindicated. IR interferometers are exceptionally useful, incontrast, for sophisticated experiments, including imaging,2 cir-cular dichroism,3 and perturbation-response4 experiments. Evenin these cases, the expense and time required argues against fullspectral acquisition as it is often minimally more informative thanselected spectral regions5 and certain applications could be fasterif smaller volumes of data were acquired, for example, for tissueidentification in cancer pathology.6
In FT-IR spectroscopy, large spectral regions are typicallyacquired. For large regions, the multiplexing advantage for signal-to-noise ratio (SNR) is also accompanied by a disadvantage fornoise.7,8 The noise is spectrally uniform while the signal is not;hence, increasing SNR for even a single feature requires substan-tial effort over the entire spectrum. For characterization of manybiological systems, optimal spectral regions and features haverecently been identified.9,10 For example, in a recent applicationof IR spectral imaging to automated breast pathology, we wereable to deduce the appropriate structure of breast tissue and thepresence of cancer to high accuracy using only six spectralfeatures.11 With the limitation of the acquisition to these smalleroptimal data sets, the SNR can be increased and acquisition time
* To whom correspondence should be addressed. E-mail: [email protected].† Department of Mechanical Science and Engineering.‡ Beckman Institute for Advanced Science and Technology.§ Micro and Nanotechnology Laboratory.| Department of Bioengineering.⊥ Electrical and Computer Engineering.
(1) Griffiths, P. R.; DeHaseth, J. A. Fourier Transform Infrared Spectrometry;John Wiley & Sons: Hoboken, NJ, 2007.
(2) Lewis, E. N.; Treado, P. J.; Reeder, R. C.; Story, G. M.; Dowrey, A. E.;Marcott, C.; Levin, I. W. Anal. Chem. 1995, 67, 3377–3381.
(3) Lipp, E. D.; Zimba, C. G.; Nafie, L. A. Chem. Phys. Lett. 1982, 90, 1–5.(4) Uhmann, W.; Becker, A.; Taran, C.; Siebert, F. Appl. Spectrosc. 1991, 45,
390–397.(5) Hamm, P.; Wiemann, S.; Zurek, M.; Zinth, W. Opt. Lett. 1994, 19, 1642–
1644.(6) Bhargava, R.; Fernandez, D. C.; Hewitt, S. M.; Levin, I. W. Biochim. Biophys.
Acta 2006, 1758, 830–845.(7) Plankey, F. W.; Glenn, T. H.; Hart, L. P.; Wineforder, J. D. Anal. Chem.
1974, 46, 1000–1005.(8) Voigtman, E.; Winefordner, J. D. Appl. Spectrosc. 1987, 41, 1101–1261.(9) Fernandez, D. C.; Bharagava, R.; Hewitt, S. M.; Levin, I. W. Nat. Biotechnol.
2005, 23, 469–474.(10) Bhargava, R. Anal. Bioanal. Chem. 2007, 389, 1155–1169.(11) Pounder, F. N.; Reddy, R. K.; Bhargava, R. Submitted for publication.
Anal. Chem. 2010, 82, 5697–5706
10.1021/ac1007128 2010 American Chemical Society 5697Analytical Chemistry, Vol. 82, No. 13, July 1, 2010Published on Web 06/07/2010

can be greatly decreased, especially for imaging applications.12 Ifsmall spectral regions were acquired, the dynamic range requiredto detect the signal for a given noise level will also be much lower,allowing for the use of simpler detectors.13 The advantages foracquiring smaller spectral regions and specific feature sets arethe primary arguments driving discrete frequency IR (DFIR)spectroscopy,14 in which a small set of spectral features areacquired to characterize the entire spectrum. While it is possibleto utilize the conventional grating/slit monochromator and selectindividual wavelengths for DFIR spectroscopy, light throughputis greatly reduced by the need to spatially restrict the beam andthe throughput decreases sharply with aperture size, in turndecreasing the SNR. The recent use of a focal plane array detectorfor grating based systems15 is very promising but requires anexpensive array detector and still measures a large bandwidth.Hence, it is advantageous to explore better and faster approachesto generate narrow-spectral band IR beams. Narrow line width,tunable IR quantum cascade lasers,16 and nanoscale modifiedemitters17,18 have been proposed as narrow band sources and canbe used for this purpose, but these are expensive and/or span asmaller wavelength range. Similarly, a combination of a fixedbandpass transmission filter and pyroelectric detectors can beused to acquire only one or two measurement wavelengths.19 Thethroughput in such cases is limited and the acquisition rate issuitable where only one or two wavelengths are of interest, limitingtheir application for measuring different spectral bands over alarge spectral region. Recently, tunable infrared detectors havebeen demonstrated using micromachined Fabry-Perot filters20
in the 3-5 µm spectral range with bandwidths close to 100 nm,but such devices are limited in the spectral range that could bespanned with a set and their fabrication can be cumbersome andexpensive. Hence, technologies that are based on inexpensivecomponents and are easy to deploy with common IR opticalelements are still needed.
Here, we propose optical reflection filters based on guidedmode resonances (GMR) to provide an inexpensive alternativeas a spectral resolution device that can be used with existingoptical components in the mid-IR. GMRs are typically observedin substrates with geometrically tailored multilayer thin films ofgrating and waveguide layers and are a result of couplingdiffraction and wave-guiding modes.21 While narrow bandwidthresonant reflection was first experimentally observed as early as1902,22 recent advances in theory, simulation,23 and microfabri-cation have made large-scale realization of the needed structures
feasible. The geometric parameters required to support GMR inthe mid-IR spectral region, further, are well within the dimensionsof routine contact lithography, making GMR filters (GMRF)feasible for inexpensive, mass production. Several groups haveexperimentally demonstrated filters based on GMR devices formicrowave,24 visible,25 and near-IR26,27 regimes. However, GMRoptical filters have not been extended to mid-IR as the regionrepresents a unique challenge in terms of fabrication due to strictlimits on materials and the extended spectral range. We demon-strate here the first mid-IR GMRFs. In the following sections, wefirst describe the theoretical framework for GMRF design basedon rigorous coupled wave analysis (RCWA). Second, we report alithography-based fabrication and successful realization of narrow-band reflectance filters. Finally, we compare predicted andrecorded responses of filters to validate the production of filtersfor spectroscopy.
Theory and Modeling. The typical design we propose isdepicted in Figure 1 and consists of a soda lime substrate with athin film of silicon nitride (Si3N4) on its surface. The top part ofthe silicon nitride film is periodically etched to provide a gratinglayer, while the bottom part acts as a waveguide layer. Theintroduced periodic modulation allows for phase-matching ofan external incident beam into modes that can be re-radiatedinto free space. These modes possess finite lifetimes and areoften referred to as “leaky modes”. An incident beam ofparticular wavelength and orientation undergoes a resonanceon coupling to these leaky modes, resulting in high reflectionefficiencies. The filter structure critically affects the couplingof incident light. The bandwidth and peak position of thereflected beam spectra can be tuned with parameters of thegrating structure, including the grating period (Λ), gratingdepth (dgr), duty cycle (f), and thickness of the waveguide layer(dwg) depicted in Figure 1. While the grating period can bechanged relatively easily for a set of GMRFs, the depth andthickness of layers are more difficult to change due to the natureof the fabrication process. Hence, we designed structures with
(12) Levin, I. W.; Bhargava, R. Annu. Rev. Phys. Chem. 2005, 56, 429–474.(13) Hoffmann, P.; Knozinger, E. Appl. Spectrosc. 1987, 41, 1303–1306.(14) Kodali, A. K.; Schulmerich, M.; Cunningham, B. T. Bhargava, R., in
preparation for submission.(15) Elmore, D. L.; Tsao, M. W.; Frisk, S.; et al. Appl. Spectrosc. 2002, 56, 145–
149.(16) Lee, B. G.; Belkin, M. A.; Audet, R.; MacArthur, J.; Diehl, L.; Pflugl, C.;
Capasso, F.; Oakley, D. C.; Chapman, D.; Napoleone, A. Appl. Phys. Lett.2007, 91, 231101.
(17) Greffet, J.-J.; Carminati, R.; Joulain, K.; Mulet, J.-P.; Mainguy, S.; Chen, Y.Lett. Nat. 2002, 416, 61–64.
(18) Marquier, F.; Joulain, K.; Mulet, J. P.; Carminati, R.; Greffet, J. Opt. Commun.2004, 237, 379–388.
(19) Wilks, P. A. Am. Lab. 1994, 26, B42.(20) Neumann, N.; Ebermann, M.; Kurth, S.; Hiller, K. J. Micro/Nanolithogr.,
MEMS, MEOMS 2008, 7, 021004.(21) Wang, S. S.; Magnusson, R. Appl. Opt. 1993, 32, 2606–2613.(22) Wood, R. W. Proc. Phys. Soc. 1902, 18, 269–275.(23) Tibuleac, S.; Magnusson, R. J. Opt. Soc. Am. A 1997, 14, 1617–1626.
(24) Magnusson, R.; Wang, S. S.; Black, T. D.; Sohn, A. IEEE Trans. Antennasand Propagation 1994, 42, 567–569.
(25) Priambodo, P. S.; Maldonado, T. A.; Magnusson, R. Appl. Phys. Lett. 2003,83, 3248–3250.
(26) Sharon, A.; Rosenblatt, D.; Friesem, A. A. J. Opt. Soc. Am. A 1997, 14,2985–2993.
(27) Dobbs, D. W.; Cunningham, B. T. Appl. Opt. 2006, 45, 7286–7293.
Figure 1. Geometrical configuration and illustration of light incidentat a generalized angle to the GMRF.
5698 Analytical Chemistry, Vol. 82, No. 13, July 1, 2010
different periods while keeping all other parameters constant toallow for simultaneous fabrication of all structures in our validationset.
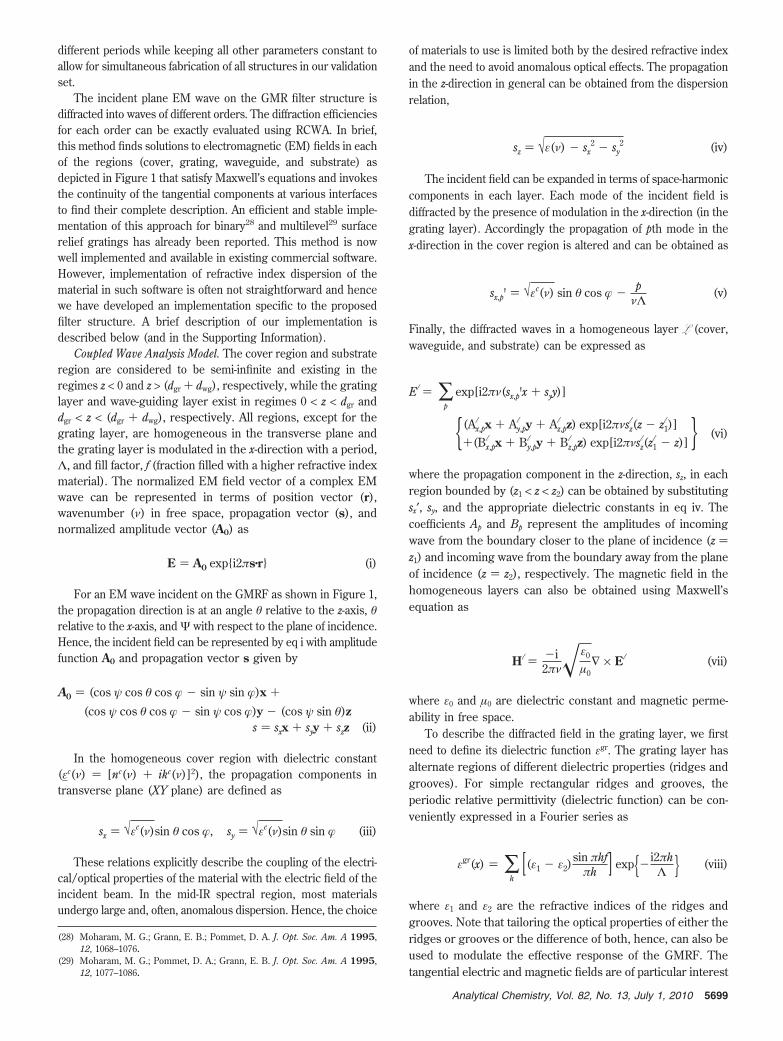
The incident plane EM wave on the GMR filter structure isdiffracted into waves of different orders. The diffraction efficienciesfor each order can be exactly evaluated using RCWA. In brief,this method finds solutions to electromagnetic (EM) fields in eachof the regions (cover, grating, waveguide, and substrate) asdepicted in Figure 1 that satisfy Maxwell’s equations and invokesthe continuity of the tangential components at various interfacesto find their complete description. An efficient and stable imple-mentation of this approach for binary28 and multilevel29 surfacerelief gratings has already been reported. This method is nowwell implemented and available in existing commercial software.However, implementation of refractive index dispersion of thematerial in such software is often not straightforward and hencewe have developed an implementation specific to the proposedfilter structure. A brief description of our implementation isdescribed below (and in the Supporting Information).
Coupled Wave Analysis Model. The cover region and substrateregion are considered to be semi-infinite and existing in theregimes z < 0 and z > (dgr + dwg), respectively, while the gratinglayer and wave-guiding layer exist in regimes 0 < z < dgr anddgr < z < (dgr + dwg), respectively. All regions, except for thegrating layer, are homogeneous in the transverse plane andthe grating layer is modulated in the x-direction with a period,Λ, and fill factor, f (fraction filled with a higher refractive indexmaterial). The normalized EM field vector of a complex EMwave can be represented in terms of position vector (r),wavenumber (ν) in free space, propagation vector (s), andnormalized amplitude vector (A0) as
E ) A0 exp{i2πs·r} (i)
For an EM wave incident on the GMRF as shown in Figure 1,the propagation direction is at an angle θ relative to the z-axis, θrelative to the x-axis, and Ψ with respect to the plane of incidence.Hence, the incident field can be represented by eq i with amplitudefunction A0 and propagation vector s given by
A0 ) (cos ψ cos θ cos � - sin ψ sin �)x +
(cos ψ cos θ cos � - sin ψ cos �)y - (cos ψ sin θ)zs ) sxx + syy + szz (ii)
In the homogeneous cover region with dielectric constant(εc(ν) ) [nc(ν) + ikc(ν)]2), the propagation components intransverse plane (XY plane) are defined as
sx ) √εc(ν)sin θ cos �, sy ) √εc(ν)sin θ sin � (iii)
These relations explicitly describe the coupling of the electri-cal/optical properties of the material with the electric field of theincident beam. In the mid-IR spectral region, most materialsundergo large and, often, anomalous dispersion. Hence, the choice
of materials to use is limited both by the desired refractive indexand the need to avoid anomalous optical effects. The propagationin the z-direction in general can be obtained from the dispersionrelation,
sz ) √ε(ν) - sx2 - sy
2 (iv)
The incident field can be expanded in terms of space-harmoniccomponents in each layer. Each mode of the incident field isdiffracted by the presence of modulation in the x-direction (in thegrating layer). Accordingly the propagation of pth mode in thex-direction in the cover region is altered and can be obtained as
sx,p' ) √εc(ν) sin θ cos � - pνΛ
(v)
Finally, the diffracted waves in a homogeneous layer L (cover,waveguide, and substrate) can be expressed as
El ) ∑p
exp[i2πν(sx,p'x + syy)]
{(Ax,pl x + Ay,p
l y + Az,pl z) exp[i2πνsz
l (z - z1l )]
+(Bx,pl x + By,p
l y + Bz,pl z) exp[i2πνsz
l (z1l - z)] } (vi)
where the propagation component in the z-direction, sz, in eachregion bounded by (z1 < z < z2) can be obtained by substitutingsx′, sy, and the appropriate dielectric constants in eq iv. Thecoefficients Ap and Bp represent the amplitudes of incomingwave from the boundary closer to the plane of incidence (z )z1) and incoming wave from the boundary away from the planeof incidence (z ) z2), respectively. The magnetic field in thehomogeneous layers can also be obtained using Maxwell’sequation as
Hl ) -i2πν�ε0
µ0∇ × El (vii)
where ε0 and µ0 are dielectric constant and magnetic perme-ability in free space.
To describe the diffracted field in the grating layer, we firstneed to define its dielectric function εgr. The grating layer hasalternate regions of different dielectric properties (ridges andgrooves). For simple rectangular ridges and grooves, theperiodic relative permittivity (dielectric function) can be con-veniently expressed in a Fourier series as
εgr(x) ) ∑h
[(ε1 - ε2)sin πhf
πh ] exp{- i2πhΛ } (viii)
where ε1 and ε2 are the refractive indices of the ridges andgrooves. Note that tailoring the optical properties of either theridges or grooves or the difference of both, hence, can also beused to modulate the effective response of the GMRF. Thetangential electric and magnetic fields are of particular interest
(28) Moharam, M. G.; Grann, E. B.; Pommet, D. A. J. Opt. Soc. Am. A 1995,12, 1068–1076.
(29) Moharam, M. G.; Pommet, D. A.; Grann, E. B. J. Opt. Soc. Am. A 1995,12, 1077–1086.
5699Analytical Chemistry, Vol. 82, No. 13, July 1, 2010

in the grating layer and they can be expanded in harmonicseries as
Egr ) ∑p
(Mxp(z)x + Myp(z)y +
Mzp(z)z) exp{i2πν(sx,p′x + syy)}
Hgr ) ∑p
(Nxp(z)x + Nyp(z)y +
Nzp(z)z) exp{i2πν(sx,p′x + syyx + syy)} (ix)
The normalized vector amplitude functions M and N can beexpressed as functions in position and uncoupled coefficients byrelating electric and magnetic fields using Maxwell’s equations,as described in the Supporting Information. The expansions givenby eq ix for the grating layer, eqs vi and vii for all the other layers,and eqs i-iv for the incident field can be related. Thus the problemsimply reduces to solving for the unknown amplitude coefficients(Ap and Bp in eq vii and Rp and �p defined in the SupportingInformation). Equations governing these quantities can beobtained by applying continuity conditions (as described in theSupporting Information).
The diffraction efficiency, DE, for each pth propagatingdiffracted order is the diffracted power divided by the incidentpower. With unit incident amplitude, the diffraction efficiency forreflection DEref,p can thus be obtained by using the spatiallyaveraged Poynting vector as follows:
DEref,p )
{|{-sin φpBx,pc + cos φpBy,p
c }|2Re( sz,pc
√εc(ν) cos θ)+|i{(pcos φpsz
c)Bx,pc - (sin φpsz
c)By,pc - (cos φpsx,p′ + sin φpsy)Bz,p
c }|2Re( sz,pc
εc(ν)
√εc(ν) cos θ) }(x)
The diffraction efficiency for transmission, DEtran,p can be ob-tained by substituting coefficients Bc with As in eq x.
Filter Design. The efficiency of each diffracted order can becalculated using RCWA. However, it is an informative first stepto analyze the filter structure as a bilayer waveguide to find a
range of parameters for the eventual GMRF structure. Accord-ingly, the effective average refractive index of the grating layerto a first order approximation can be written as
εgr ) εSiNf + εc(1 - f) (TEcase)1
εgr ) fεSiN + 1 - f
εc(TMcase) (xi)
For the surface-relief structure to resemble a waveguide, therefractive indices of grating and waveguide layers have to be suchthat (nwg, ngr > ns > nc). The materials are chosen to be siliconnitride and soda lime, and a duty cycle f is chosen to be 0.5 foreasier fabrication. For the same structure, the reflectionresonances are dependent on the polarization state of theincident wave and the angle at which it is incident. With a TEpolarized incident wave at angle θ, for a particular orderdiffracted wave to be a leaky Eigen mode, the introducedmodulation parameter should satisfy the inequality:30
max{nc, ns} e |nc sin θ - pνΛ | < max{ngr, nwg} (xii)
To maximize efficiency, we propose designing filters such thatonly zero-order propagating waves contribute to the reflected wavewhile all the higher orders become guided modes (evanescent).
Here, our focus was on fundamental studies involved invalidating a framework for GMRFs, rather than a fabrication anduse for spectroscopy. Hence, we focused on validations with asmall number of filters in the spectral region around the C-Hstretching vibrational mode (2600-3000 cm-1). Figure 2A rep-resents the inequality in eq xii for the first diffraction orders tobe evanescent in this range for different incident angles. Therefractive indices are assumed to be real constants for the spectralrange listed. At normal incidence, the parameter range overlapsfor p ) 1 and p ) -1 and approximately obeys 1.7 < Λ < 2.7 µm.Larger dimensions are preferred for simpler fabrication; accord-ingly, we chose 2.2, 2.3, 2.4, and 2.5 µm as Λ values for theproposed filter set. The thicknesses of the waveguide and grating
(30) Shin, D.; Tibuleac, S.; Maldonado, T. A.; Magnusson, R. SPIE Opt. Eng.1998, 37, 2634–2646.
Figure 2. (A) Parameter regimes for Λ, such that |p| ) 1 order (on the left, p ) 1 and on the right, p ) -1) can correspond to a guided modefor 2600 and 3000 cm-1 for TE polarized EM wave incident at angle θ. The dispersion characteristics are ignored, and the refractive indices areapproximated to be nc ) 1.0, nSi3N4 ) 2.0 and ns ) 1. (B) The maximum achievable reflectance of structures with chosen Λ values for a TEpolarized EM wave that is normally incident. Depth of the waveguide, dwg ) dgr and fill fraction, f ) 0.5 are arbitrarily chosen for simpler fabrication.The azimuthal angle of incidence is chosen to be � ) 0. The dispersion characteristics are ignored, and constant real values are chosen forrefractive indices as in part A.
5700 Analytical Chemistry, Vol. 82, No. 13, July 1, 2010

layers, subsequently, have to be appropriately chosen to maximizethe chosen resonances. Hence, for the selected Λ, we examineddifferent sets of values for dwg and dgr using RCWA to maximizezero order diffraction reflection efficiency. Figure 2B shows theresults obtained for normally incident TE polarized wave whendwg ) dgr. In these calculations, the refractive indices areassumed to be constant and are assigned values listed in thefigure. It can be observed that a minimum thickness of 0.3 µmis needed to achieve a reflectance peak in the desired spectralrange. We choose the minimum thickness possible to minimizelosses due to absorption.
EXPERIMENTAL METHODS: GMRFFABRICATION, MICROSCOPY, ANDSPECTROSCOPIC MEASUREMENTS
Filter Fabrication. The filters are fabricated on a 4 inchdiameter soda-lime glass wafer using contact photolithography.The sequence of steps involved in fabrication is depicted in Figure3. Briefly, a 600 nm layer of Si3N4 is deposited onto the substrateby plasma enhanced chemical vapor deposition (PECVD) froma mixture of N2, SiH4, and NH3 flowing at rates of 1960, 80,and 55 cm3/min, respectively, all at a pressure of 900 mTorrand temperature of 300 °C. The wafer is then baked at 125 °Cfor 2 min as a preparatory step to remove any moisture. Aphotoresist (AZ5214E) is spun coat on the wafer using anadhesion promoter (hexamethyldisilizane). The adhesive isspun at 4000 rpm for 30 s and the photoresist is spun at 5000rpm for 45 s. The wafer is then baked at 110 °C for 50 s. Thethickness of the photoresist layer obtained is estimated to be1.25 µm. The wafer surface is then exposed to ultravioletradiation at 7.5 mW/cm2 for 10 s through a chrome mask withthe four grating patterns printed on its surface.
To reveal the grating pattern, the wafer is then immersed in adeveloping agent (AZ400 in a 1:4 dilution with water) for 9 s. Thewafer is then hard baked at 125 °C and then etched by reactiveion etching (RIE) using Freon-14 at 35 mTorr using 90 W.Approximately 490 Å are estimated to be etched in a minute, and
a grating depth of 300 nm is targeted to be achieved. The waferis finally cleaned using oxygen plasma treatment, and this finaldescum step ensures that the grating layer obtained is smooth.
Analytical Measurements. Microscopy Measurements. Atomicforce microscopy (AFM) measurements were performed with theprobe in ac mode at a frequency of 0.1 Hz with the voltage set at2 V. Data were acquired over an area of 5 µm × 10 µm on 512pixels over 256 scan lines at a 5 µm/s scan rate with noproportional gain and integral gain of 10. The scanning electronmicroscopy (SEM) images are acquired using a field-emissionenvironmental scanning electron microscope. The structuralprofiles were obtained from the AFM data by averaging over the256 scan lines.
Spectroscopic Measurements. The filter responses to a broad-band beam from a silicon carbide element source were recordedusing an optical setup, as shown in Figure 4. An off-axis parabolicmirror is used to collimate the radiation, and a wire-grid polarizerwas used to control incident polarization. Two parallel circularapertures that restrict the beam to around 10 mm have been
Figure 3. Sequence of steps involved in fabrication of surface-relieved film on soda lime wafer.
Figure 4. Optical setup for spectroscopic measurements of GMRFfor (A) normal incidence and (B) angular incidence.
5701Analytical Chemistry, Vol. 82, No. 13, July 1, 2010

employed for filtering divergent rays. A beam splitter wasemployed for measurements of the normal incidence case asshown in Figure 4A. The beam splitter and all other optics areassumed to be of 100% efficiency. The filter wheel was mountedon a stage with precise control on translation and rotation. It isnot possible to achieve a perfectly collimated beam from theextended globar source employed here. Hence, a Zemax modelwas developed for the optical setup and the half angle divergenceis estimated to be ∼0.65° due to the multiple apertures andfocusing elements. The data set was acquired at 4 cm-1 resolutionand each measurement was averaged 16 times. The reflectionspectra were evaluated by comparing the filter responses withthat of a silver coated substrate. Bruker Vertex 70 spectrometeris used to acquire spectra at an undersampling ratio of 2 andNorton-Beer medium apodization.
RESULTS AND DISCUSSIONSimulations. Using the parameters for the filter set above in
the developed theoretical framework, we simulated reflectancespectra for broadband IR illumination for each of the selectedstructures, as shown in Figure 5A. The four structures of Λ )2.2, 2.3, 2.4, and 2.5 µm possess a maximum reflection efficiencyof ∼1 at 2987, 2869, 2760, and 2659 cm-1, respectively, anddistinct bandshapes in the characteristic reflection peak withfull width at half-maximum (FWHM) of 50, 42, 36, and 33 cm-1,respectively. Along with these resonance peaks, there exists amuch weaker reflection peak due to a higher order guidedmode at 5456, 5250, 5063, and 4892 cm-1, respectively.
While the higher order modes cannot be avoided, we note thatthe reflections are substantially weaker and the peak positionsare shifted toward the near-IR. While one strategy may be tooptimize filter structures such that these peaks are minimized,the ∼2500 cm-1 shift from the major reflectance peak impliesthat bandpass or long-pass filters may be used to eliminate theireffects. For example, a long-pass filter commonly used forundersampling in FT-IR spectroscopy (transmittance of ∼0.95%for νj < 3950 cm-1) can be used to eliminate the effects of thesame. The bandwidths for the structures can potentially be
changed (especially, reduced) by considering different valuesfor thicknesses of grating and waveguide layers. Our intentionhere, however, was to achieve the fabrication of the entire filterset on a single wafer for purposes of comparison with theory.Hence, we choose the same thickness values for grating andwaveguide layers.
Finally, the out-of-bandpass or sideband reflections in thesefilters reach up to 17%. The ratio of the peak reflectivity to themaximum sideband reflectivity can be termed the contrast ratiofor the filter. The contrast ratio can be improved, for example, byusing additional layers.23 The approach here was to comparetheory and fabrication and such methods have not been consid-ered here to keep the fabrication and optical setup simple. Tounderstand the behavior of GMRFs further, we examine onespecific case. At peak reflection, a lateral standing wave is createdinside the filter,31 due to the coupling of the two counter-propagating diffracted waves (+1 and -1 orders) which are phasematched to the leaky waveguide mode. The strength of the localelectric field in the surface-relieved film can depict the strengthof the lateral standing wave setup and the extent to which coupledwaves propagate, resulting in the multiple interferences of theenergy coupled to the waveguide from every grating period. Thehigher the electric field enhancement inside the surface-relievedfilm, the narrower is the far-field resonance.32 In Figure 5B, thisstanding wave is visualized by the electric field amplitudedistribution at a resonant frequency (2659 cm-1) for a filter (Λ) 2.5 µm), which is significantly smaller at an off-resonancefrequency (3400 cm-1). Because of the strong modulation forthe GMRFs considered here, the maximum electric fieldenhancement inside the structure is smaller in comparison withenhancements reported in other structures.32
Prior to a comparison with measurements, it is instructive toconsider experimental factors that can possibly influence therecorded data and to understand their potential effects using the
(31) Wei, C.; Liu, S.; Deng, D.; Shen, J.; Shao, J.; Fan, Z. Opt. Lett. 2006, 31,1223–1225.
(32) Sun, T.; Ma, J.; Wang, J.; Jin, Y.; He, H.; Shao, J.; Fan, Z. J. Opt. A: PureAppl. Opt. 2008, 10, 125003.
Figure 5. (A) Reflection spectra (zero-order diffraction efficiency) of the designed filters. The parameters chosen are Λ ) 2.2, 2.3, 2.4, and 2.5µm, f ) 0.5, dgr ) dwg ) 0.3 µm, nSi3N4 ) 2.0, ns ) 1.48, nc ) 1.0. (B) E-field distribution in the vicinity of structure with Λ ) 2.5 µm at a resonantwavenumber, νj ) 2659 cm-1 (top) and off-resonance wavenumber, νj ) 3400 cm-1. The surface relief of the film to be fabricated is depictedusing white lines.
5702 Analytical Chemistry, Vol. 82, No. 13, July 1, 2010

developed theoretical framework. First, we recognize that spectralreflectance of filters can be significantly altered by differences inthe values of refractive indices used in simulation and those thatare realized during fabrication.30 Such differences may arise fromspectral dispersion, from film structure at the nanomicroscale, aswell as due to confinement effects.33 Second, light in experimentalconditions is unlikely to be highly collimated. Hence, the effectof small variations in angles on incidence must be studied. Theseare two of the largest effects and we examine them next.
The refractive index of silicon nitride in the visible regiondecreases gradually with increasing wavelength. It has a signifi-cant dispersion, however, in mid-IR spectral region with intenseabsorption peaks in the 1400-600 cm-1 spectral range.34 Figure6A shows the effect on reflectance spectra for one of the structureswhen dispersion characteristics are considered. When dispersionof the underlying substrate, soda lime,35 is considered, the peakis slightly shifted toward higher wavenumber (from 2869 to 2875cm-1). When dispersion of Si3N4 is considered, the peak shiftstoward a lower wavenumber (from 2869 to 2853 cm-1) and isof lower efficiency (0.96 in comparison to 1.0). The combinedeffect of the absorption of the Si3N4 layer and surface scatteringis a lower peak efficiency (0.95 in comparison to 1.0) and aslight broadening of the reflectance peak (150 cm-1 in com-parison to 138 cm-1). The effects due to anomalous dispersionare also apparent in the region below 1600 cm-1. Figure 6Bdepicts the E-field amplitude distributions considering a constantreal refractive index while Figure 6C depicts the E-field distribu-tion when the dispersion characteristics are incorporated into themodel. In both cases, a standing wave is observed, indicating thepresence of resonances. The local E-field, as shown in Figure 6D,is only slightly lower for the latter case indicating a decrease inthe slightly broader reflectance peak.36 In summary, we note that
the refractive index values can influence the position, peakreflectivity, and band shape of the filter. Hence, it is critical tocontrol this parameter during fabrication and operation.
The peaks obtained are also strongly coupled to the angle ofincidence of the light to be filtered due to the strong modulationin the filter structures. For example, Figure 7 shows the effect ofvarying incidence angle, θ, on the two reflectance peaks comparedto those obtained using normal incidence. Even a 1° variation inθ results in splitting of the peak at 2858 cm-1 into two peaks atcentered at 2880 and 2822 cm-1. The two peaks are slightlydifferent, and one of the peaks is broader and shorter. A 5°variation could result in splitting and shifting of peaks by asmuch as of 140 cm-1. Hence, the optical setup needs to be asprecise as possible in measurements and consistently auto-mated when utilizing the filters. At the same time, we note thatthe peak splitting and shifts can be a facile means to achievemodulation in spectral position. As opposed to amplitudemodulation, which may be achieved by a chopper, for example,
(33) Yoon, D. H.; Yoon, S. G.; Kim, Y. T. Thin Solid Films 2007, 515, 5004–5007.
(34) Gunde, M. K.; Macek, M. Phys. Status Solidi 2001, 183, 439–449.(35) Rubin, M. Solar Energy Mater. 1985, 12, 275–288.(36) Norton, S. M.; Erdogan, T.; Morris, G. M. J. Opt. Soc. Am. A. 1997, 14,
629–639.
Figure 6. (A) Effect on resonances of dispersion characteristics of Si3N4 and soda lime, for structure of Λ ) 2.3 µm, dgr ) 0.3 µm, and dwg )0.3 µm, when a TE-polarized wave is normally incident. (B) E-field amplitude distribution at resonance wavenumber (νj ) 2869 cm-1) withoutconsidering the dispersion properties of both Si3N4 and soda lime. (C) E-field amplitude distribution at resonance wavenumber (νj ) 2858 cm-1)considering the dispersion properties of Si3N4
34 and soda lime.35 The surface relief of the film to be fabricated is depicted using white lines. (D)Comparison of E-field amplitude distributions shown in parts B and C at the interface of grating and waveguide layers.
Figure 7. Spectral variability with changes in incidence angle θ forstructure of Λ ) 2.3 µm, dgr ) 0.3 µm, and dwg ) 0.3 µm, when aTE-polarized wave is incident with azimuthal angle � ) 0°. Onlyregions around the two resonances observed in Figure 5 are plotted,and significant alterations are observed within both regions. Otherspectral regions are insignificantly impacted and hence not shownhere.
5703Analytical Chemistry, Vol. 82, No. 13, July 1, 2010

this type of spectral modulation is not possible in interferom-etry. Hence, the filters present an additional modulationmechanism that remains to be utilized in a smart manner. Atrivial application is, of course, in filter alignment such thattilting the filter would bring the peaks closer, eventuallyresulting in a single reflection peak.
Measurements. Filters were fabricated as described inExperimental Methods: GMRF Fabrication, Microscopy, andSpectroscopic Measurements. We subsequently characterized theobtained structures using SEM and AFM. While SEM provides aglobal view of the consistency of fabricated microstructures, AFMprovides a quantitative measure of the achieved thickness. Fromthese measurements, we can iteratively refine experimentalconditions such that filters with consistently similar structuresare obtained. We refined our experimental protocol using severalruns and validated that the results are consistent in implementa-tion of the protocol for fabrication. Once routinely consistent filterswere obtained, we characterized the measured geometricalparameters with a goal of using them as inputs to the theoreticalframework to predict filter response. Results from both modalitiesof such consistent filters are shown in Figure 8. With over 256scan lines averaged, the values for dgr and Λ are estimated. Thestandard deviation in the values obtained for dgr is observed tobe less than 5 nm while that for Λ is observed to be less than15 nm.
Structural Parameters. The response of the filter is alsovery sensitive to the actual geometrical configuration ob-tained.30 The fabricated filters show a good homogeneity ofthe grating layers as characterized by the structural profilesobtained using AFM measurements. Figure 9A shows theaverage structural profile of the grating layer in the four filterstructures offset from each other. The fill fractions can be app-roximated to be 0.5 from these profiles. The filter responsesare relatively insensitive to slight variations in fill fractions andhence an approximate value will suffice. The rectangular profileof the grating grooves cannot be verified from these results,but for convenience we assume straight edges for the groovesin calculations. The pitch values derived are close to thetargeted values within a ∼1% variability. Although the targeted
dgr is 0.3 µm, the actual depths obtained were somewhatlower (∼0.25 µm). This can be attributed to the etch ratebeing smaller than that estimated due to a higher SiH4/NH3
flow ratio used in our fabrication process to achieve a Si3N4
film of higher refractive index.37 The thickness of thewaveguide layer is obtained using the reflectance measure-ments at TM-polarized normal incidence.
As depicted in Figure 9B, the theoretical predictions andexperimental measurements match very well for all the filterstructures when a value of 0.4 µm is chosen for dwg. The peaksare relatively broader in the measured data, which is likelydue to small angular distribution in the incident beam. Therelatively higher base reflectance in the experimental datacould be attributed to the background radiation in the opticalsetup and the scattering at the Si3N4-soda lime interfaceand a finitely thick actual soda lime substrate while theRCWA simulation assumes a semi-infinite medium.38
Validation: Comparing Predicted and Measured Spectra.The reflectance spectra of the fabricated filters are measured forTE incidence and are compared with the theoretical predictions.The acquired spectra show distinct peaks in the spectral regionof interest as shown in Figure 10. The four structures providemaximal reflection efficiencies of 0.79, 0.74, 0.73, and 0.69,respectively, with side bands of peak reflection efficiency of0.2-0.25. The bandwidths are approximately the same as thedesign values.
The H2O and CO2 present in air that permeates the opticalsetup results in small differences from predicted values around3800 and 2350 cm-1. The higher baseline for the reflectanceexists in TE polarization, as seen for the TM measurements,and can be attributed to the effects due to nonspecific reflectionat the interface, substrate properties, and background responsedue to optics in the experimental setup. The splitting of thepeaks can be modeled better when the responses are calculatedby averaging over the variation in angles of incidence (less thanor equal to the divergence 0.65° predicted by Zemax models),as illustrated in Figure 11. The match between experimentalresults and results from simulation is improved but not entirelypredicted by the theoretical model we have proposed here. Thelack of a perfect match likely implies that a number of otherfactors, including the variation in azimuthal angle and imperfec-tions in structure and optical properties, have to be accuratelyaccounted for a better prediction.
Because of the unavailability of precise refractive index values,the losses due to scattering (at the Si3N4 and soda lime interface)and absorption (of bulk material) cannot accurately be ac-counted for in the simulations. The imperfections in thestructure and the deviations from straight edges in groovesand edges have also been excluded from the theoretical model.This, along with the slight variability in the incident beam, couldbe the cause for deviations from ideal predictions. The basereflectance can be eliminated by multiply reflecting off thefilters. The experimental measurements at other angles ofincidence have also been verified against theoretical predic-tions, and the results have been presented in the SupportingInformation. The unavailability of a collimated IR source is a
(37) Zhang, X.; Ding, K.; Yang, A.; Shao, D. Adv. Mater. Opt. Electron. 1996,6, 147–150.
(38) Magnusson, R.; Shin, D.; Liu, Z. S. Opt. Lett. 1998, 23, 612–614.
Figure 8. (A) Scanning electron microscopy (SEM) image of one ofthe fabricated GMRFs, and (B) atomic force microscopy (AFM)images of a 1D GMRF, demonstrating the consistency in depth andthe periodicity in surface relief.
5704 Analytical Chemistry, Vol. 82, No. 13, July 1, 2010

significant hurdle in rigorously and exactly validating the filterresponses. Similarly, the optical setup can be further optimizedto yield better efficiencies and lower side-bands. An accuratevalidation can however only be done by a proper characterizationof the incident beam and inclusion of all optical effects in themodel.39 Nevertheless, the two major conclusions of the observa-tions and modeling are that, first, fabricated filters possess distinctreflection characteristics with reasonably high efficiencies. Second,reflectance spectra can be understood theoretically. Combined,the two results form a significant first step toward creatingappropriate GMRFs for mid-IR measurements. Work is under-way40 in optimizing parameters to obtain a desired spectralresponse from the filters and fabricating the same for use inspectroscopic applications.
CONCLUSIONSHere, GMR reflectance filter structures have been demon-
strated for the mid-IR spectral region. We proposed a design basedon a surface-relief film of silicon nitride and fabricated structureswith distinct characteristics on the same wafer using a lithographyapproach. While agreement between theory and experiment wasgenerally good, the fabricated filters exhibited slightly lowerreflectance and broader bandshapes of the reflectance peak thanpredicted due to experimental constraints. The simple design andfabrication demonstrated here will allow for mass production whilethe validation of theory is a first step in creating customized filtersof desired reflectance characteristics. Careful design and control
(39) Rumpf, R. C.; Johnson, E. G. Opt. Express 2007, 15, 3452–3464.(40) Kodali, A. K.; Schulmerich, M.; Cunningham, B. T.; Bhargava, R. In
preparation.
Figure 9. (A) Structure of the grating layer obtained for the four structures using AFM, (depicted offset from each other here). The AFM resultsare averaged over 256 scan lines. The structure of the grating layer is used to evaluate Λ and dgr, the standard deviation of dgr is e0.005 µm,and the standard deviation in evaluating Λ is e0.015 µm. (B) With the reflectance efficiencies of the four filters with TM-polarized normalincidence, an appropriate dwg is found with which results predicted by RCWA match those obtained from experiments. (C) Structural parametersfor the four filters fabricated.
Figure 10. Comparison of experimentally measured and theoreti-cally calculated reflectance spectra of fabricated GMR filters for aTE-polarized incident wave. The structural parameters are obtainedfrom AFM measurements and reflectance measurements from TM-polarized incidence. These values are listed in Figure 9C.
Figure 11. Comparison of experimental results with theoreticalspectra calculated by considering the incident beam to have raysvarying between θ ) 0 and θmax. The θmax values used for structures1, 2, 3, and 4 are 0.35, 0.35, 0.35, and 0.6°, respectively. Theintegration has been performed using the trapezoidal method.
5705Analytical Chemistry, Vol. 82, No. 13, July 1, 2010

of fabricated structures, within the framework of the developedtheoretical treatment here, will allow for the production of filtersuseful for spectroscopic measurements in applications rangingfrom environmental monitoring of single chemical species tochemical imaging for use in pathology or quality control. Weanticipate that the development of routine fabrication of tailoredGMRFs and their use will provide problem-driven, targetedspectral data acquisition using inexpensive instrumentation, hence,presenting an attractive alternative to the general-purpose datarecording paradigm prevalent today.
ACKNOWLEDGMENTThis work was supported in part by a seed grant from Siteman
Center of Cancer Nanotechnology Excellence (SCCNE) at Wash-ington University in collaboration with the University of Illinois
at Urbana-Champaign and by the Grainger Foundation. Theproject described was supported by Award Number R01EB009745from the National Institute of Biomedical Imaging and Bioengi-neering. The content is solely the responsibility of the authorsand does not necessarily represent the official views of theNational Institute of Biomedical Imaging and Bioengineering orthe National Institutes of Health.
SUPPORTING INFORMATION AVAILABLEAdditional information as noted in text. This material is
available free of charge via the Internet at http://pubs.acs.org.
Received for review March 18, 2010. Accepted May 23,2010.
AC1007128
5706 Analytical Chemistry, Vol. 82, No. 13, July 1, 2010