Designing a Bubbling Fluidized Bed (BFB) Boiler for Research ...
Upload
independentCategory
view
1download
0
Chemical Engineering Science 66 (2011) 3648–3655
Contents lists available at ScienceDirect
Chemical Engineering Science
0009-25
doi:10.1
n Corr
E-m
theinde
journal homepage: www.elsevier.com/locate/ces
Bed height and material density effects on fluidized bed hydrodynamics
David Escudero n, Theodore J. Heindel
Department of Mechanical Engineering, Iowa State University, Ames, IA 50011, USA
a r t i c l e i n f o
Article history:
Received 3 February 2011
Received in revised form
21 April 2011
Accepted 27 April 2011Available online 5 May 2011
Keywords:
Bed height
Fluidization
Hydrodynamics
Minimum fluidization velocity
Voidage
X-ray computed tomography
09/$ - see front matter & 2011 Elsevier Ltd. A
016/j.ces.2011.04.036
esponding author. Tel.: þ1 515 451 6194; fax
ail addresses: [email protected] (D. Escud
[email protected] (T.J. Heindel).
a b s t r a c t
Characterizing the hydrodynamics of a fluidized bed is of vital importance to understanding the
behavior of this multiphase flow system. Minimum fluidization velocity and gas holdup are two of
these key characteristics. Experimental studies addressing the effects of bed height and material
density on the minimum fluidization velocity and gas holdup were carried out in this study using a
10.2 cm diameter cylindrical fluidized bed. Three different Geldart type-B particles were tested: glass
beads, ground walnut shell, and ground corncob, with material densities of 2600, 1300, and 1000 kg/m3,
respectively. The particle size range was selected to be the same for all three materials and corresponded
to 500–600 mm. In this study, five different bed height-to-diameter ratios were investigated: H/D¼0.5, 1,
1.5, 2, and 3. Minimum fluidization velocity was determined for each H/D ratio using pressure drop
measurements. Local time-average gas holdup was determined using non-invasive X-ray computed
tomography imaging. Results show that minimum fluidization velocity is not affected by the change in
bed height. However, as the material density increased, the minimum fluidization velocity increased.
Finally, local time-average gas holdup values revealed that bed hydrodynamics were similar for all bed
heights, but differed when the material density was changed.
& 2011 Elsevier Ltd. All rights reserved.
1. Introduction
Fluidized bed hydrodynamic behavior is very complex andmust be understood to improve fluidized bed operations. One ofthe most important parameters to characterizing fluidized bedconditions is the minimum fluidization velocity, Umf (RamosCaicedo et al., 2002), which is proportional to the drag forceneeded to attain solid suspension in the gas phase. The minimumfluidization velocity also constitutes a reference for evaluatingfluidization intensity when the bed is operated at higher gasvelocities (Zhong et al., 2008). In general, Umf is a function ofparticle properties/geometry, fluid properties, and bed geometry.
Sau et al. (2007) determined the minimum fluidization velo-city for a gas–solid system in a tapered fluidized bed and studiedthe effects of bed geometry, specifically the tapered angle, on theminimum fluidization velocity. Results showed that as thetapered angle increased, Umf increased, which implied a depen-dence of the minimum fluidization velocity to the geometry of thefluidized bed. Moreover, Hilal et al. (2001) concluded that boththe bed diameter and the type and geometry of the gas distributoraffected Umf.
ll rights reserved.
: þ1 515 294 3261.
ero),
The influence of bed height on minimum fluidization velocityhas been studied using different types of fluidized beds. Zhonget al. (2006) concluded that the static bed height for a 2D spoutedbed influenced the minimum spouting fluidization velocity;increasing the bed height increased the spouting velocity.Sau et al. (2007) used a conical tapered fluidized bed to find theminimum fluidization velocity and the pressure drop across thebed. They concluded that Umf was independent of bed height fortheir conical tapered fluidized bed.
Ramos Caicedo et al. (2002) studied the minimum fluidizationvelocity for gas–solid 2D fluidized beds operated over a range ofconditions. They concluded that as the static bed height increased,Umf increased. Moreover, Sanchez-Delgado et al. (2011) also studiedthe effects of bed height on the minimum fluidization velocity for a2D fluidized bed, and concluded that there were negligible differencesin Umf as bed height changed, which did not corroborate the resultsobtained by Ramos Caicedo et al. (2002). Gunn and Hilal (1997)studied cylindrical fluidized beds and concluded that for all thematerial and experimental conditions used in their study, there wasno significant change in the minimum fluidization velocity when thebed height was increased. Cranfield and Geldart (1974) studied thefluidization characteristics of large particles and showed that for 3Dbeds, the minimum fluidization velocity remained constant no matterthe bed height.
Gas holdup (eg) is another important parameter that characterizesfluidization quality, homogenous mixing, and process efficiency in afluidization system, and is defined as the volumetric fraction of gas

Fig. 1. Fluidized bed reactor (not to scale). The static bed height is identified by H.
D. Escudero, T.J. Heindel / Chemical Engineering Science 66 (2011) 3648–3655 3649
present within the bed. Using an optical probe, Zhu et al. (2008)determined the solid volumetric fraction (1�eg) in a gas–solid systemfor bubbling and turbulent fluidization regimes. The turbulent regimeshowed that solid concentrations were not uniform in the axial orradial direction. In the bubbling regime, the nonuniformity increasedas the superficial gas velocity increased. Zhu et al. (2008) also studiedthe effects of static bed height on the solid concentration. Resultsshowed that increasing the static bed height produced an increase inthe solid concentrations mainly in the bed central region, while thewall region had no significant changes.
Du et al. (2003) measured the solid concentration for a turbulentfluidized bed. Results showed that at high gas velocities, especially inthe turbulent regime, the cross-sectional solids holdup exhibited aradially symmetric distribution, while this was not the case for thebubbling regime. At low gas velocities in the bubbling regime,dispersed bubbles produced a lower solids concentration in thecenter of the bed. The asymmetric distribution of solids concentrationwas attributed to the spiral motion of bubbles in the bed.
X-ray computed tomography (CT) imaging was used by Grasslerand Wirth (2000) to determine the solids concentration in a 0.19 mdiameter circulating fluidized bed with 50–70 mm glass beads as thebed material. For an up-flow system, they showed that the radialsolid concentration exhibited a parabolic shape with a maximumconcentration close to the wall of the reactor and a minimumconcentration in the center of the bed. In a down-flow system, thesolid concentration distribution was much more complex anddepended upon the gas–solid distributor operating conditions.Franka and Heindel (2009) also used X-ray CT imaging to determinelocal time-average gas holdup in a 10.2 cm fluidized bed. Usingdifferent materials (glass beads, ground corncob, and ground walnutshell), superficial gas velocities (Ug), and side air injection flow rates(Qside), they identified the local variations in the bed hydrodynamics.They found that with side air injection, the side air flow rose nearthe wall but then expanded into the bed as height and Qside
increased. As Ug increased, the effects caused by the side airinjection were less pronounced, and the overall gas holdup in thesystem increased. Fluidization among the different materials hadsimilar behaviors with some notable differences. Side air injectionwas less influential in the less dense material and gas holdup wasthe lowest for the denser material. Finally, they demonstrated theusefulness of X-ray computed tomography in visualizing the inter-nal features of fluidized beds.
In the current study, two of the particle types are natural(biomass) components. Fluidizing biomass particles is challengingdue to their irregular size, shape, and density. Understanding theinfluence of these particular characteristics on the fluidized bedhydrodynamics is also important. Zhong et al. (2008) studied theeffects of particle size, density, and shape on the minimumfluidization velocity using wood chips, mung beans, millet, cornstalks, and cotton stalks. In their study, they used a rectangularfluidized bed with a cross section of 0.4 m�0.4 m and air as thefluidizing gas. They determined that for long, thin biomass types,the minimum fluidization velocity increased with increasinglength-to-diameter (L/dpt) ratio. Their experiments showed thatbiomass did not fluidize when L/dpt420, indicating that thebiomass size and shape affect fluidization.
In this paper, the effects of bed height and material density onthe minimum fluidization velocity and local time-average gasholdup in a 3D cylindrical fluidized bed are investigated.
2. Experimental setup
The reactor used in these experiments is a 3D cold flowfluidized bed. The cylindrical fluidized bed was fabricated with10.2 cm internal diameter (ID) acrylic tubes with a 0.64 cm wall
thickness. As shown in Fig. 1, the reactor consists of three mainchambers: the top chamber or freeboard region, the bed chamber,and the plenum. Fluidization occurs in the bed chamber, which is30.5 cm tall and 10.2 cm ID. Square flanges (16.5 cm�16.5 cm)connect each section. An aeration plate is located immediatelybelow the bed chamber; it is fabricated from a 1.27 cm thickacrylic plate with 62, 1 mm diameter holes spaced approximately1.27 cm apart in a circular grid for a total open area of 0.62%. A 45mesh screen with 0.04 cm openings is attached to the plate usingsilicone adhesive to avoid material blocking the aeration holes.
Compressed air from the laboratory’s building air supply isused as the fluidizing gas for this research. The fluidized bed airflow is regulated with a manual stainless steel pressure regulatorand attached filter. The regulated air flows through two differentmass flow meters: a 0–1000 Lpm stainless steel Aalborg GFM771flow meter, which is used for high gas flow applications, and a0–200 Lpm Aalborg GFM571 flow meter, used in lower gas flowapplications. This allows for better measurement resolution. Theflow through the respective mass flow meter is directed by ballvalves. The mass flow meters for this study have a maximumerror of 2% of full scale.
Pressure is measured with a Dwyer 0–34.5 kPa (0–5 psig),4–20 mA output pressure transducer located in the bottom ofthe plenum. The signals obtained from the pressure transducerand mass flow meters are connected to a computer controlleddata acquisition system. Pressure readings have an estimatederror of 1–4%, with the largest error corresponding to the smallestpressure readings.
Computer controlled data acquisition software is used torecord real-time pressure and flow rate measurements over auser-specified period, and then the average pressure and flow rateare calculated and recorded. Average measurements are neces-sary due to the highly variable pressure signal caused by thebubbling bed. In this study, data collection occurs at a rate of1000 Hz for a time interval of 5 s; average pressure, and averageflow rate are subsequently written to a data file.

Table 1Summary of bed characteristics.
Glass beads
Static bed height (cm) 5.1 10.2 15.3 20.4 30.6
H/D 0.5 1 1.5 2 3
Diameter (lm) 500–600 500–600 500–600 500–600 500–600
Average bed mass (g) 590 1180 1775 2440 3640
Bulk density (kg/m3) 1410730 1410730 1420730 1465730 1455730
Particle density (kg/m3) 2600 2600 2600 2600 2600
Ground walnut shell
Static bed height (cm) 5.1 10.2 15.3 20.4 30.6
H/D 0.5 1 1.5 2 3
Diameter (lm) 500–600 500–600 500–600 500–600 500–600
Average bed mass (g) 235 465 645 900 1365
Bulk density (kg/m3) 565720 560720 515720 540720 545720
Particle density (kg/m3) 1200–1400 1200–1400 1200–1400 1200–1400 1200–1400
Ground corncob
Static bed height (cm) 5.1 10.2 15.3 20.4 30.6
H/D 0.5 1 1.5 2 3
Diameter (lm) 500–600 500–600 500–600 500–600 500–600
Average bed mass (g) 155 340 505 690 1030
Bulk density (kg/m3) 370720 410720 400720 415720 410720
Particle density (kg/m3) 800–1200 800–1200 800–1200 800–1200 800–1200
Fig. 2. Sample minimum fluidization plot for glass beads with H/D¼1.
D. Escudero, T.J. Heindel / Chemical Engineering Science 66 (2011) 3648–36553650
Three different materials are used for this study (glass beads,ground walnut shell, and ground corncob) and fluidized over arange of flow rates. All particles are in the 500–600 mm size rangeand are classified as Geldart type-B particles (Geldart, 1973).
The bed bulk density is determined knowing the material massand the static bed volume. Bed material is slowly added until thedesired static bed height, which corresponds to nominal values ofH/D¼0.5, 1, 1.5, 2, or 3. Before the final bed height is measured,the bed is fluidized and then allowed to collapse to avoid anypacking effects due to the filling process. The material mass isthen measured and the given bed bulk density is calculated.Table 1 summarizes the characteristics of the various beds used inthis study. Note that the bulk density error represents onestandard deviation from five independent measurements.
To avoid electrostatic effects that may build up during fluidi-zation, the fluidization air is passed through a humidifier beforeentering the fluidized bed inlet. Several trials in the laboratoryhave shown that using this simple solution minimizes electro-static effects; others have also successfully used this technique(Baron et al., 1987; Zhang et al., 2010).
The minimum fluidization velocity is defined as the minimumsuperficial gas velocity where particle fluidization is achieved.Minimum fluidization velocity is determined using the followingpressure measurement procedure. First, the reactor is filled withthe desired material to a specified height. Air at Ug¼40.8 cm/s ispassed through the bed for about an hour to allow the material toabsorb any moisture from the humidified air; this process isrepeated each time the material is replaced. After this condition-ing period, the pressure and flow rate are acquired using the dataacquisition system. Data are collected at 1000 Hz over a 5 sinterval, averaged, and then output to a data file. Next, the airflow rate is decreased by 1 cm/s by closing the pressure regulator.After waiting 60 s, a period such that the bed achieves a quasisteady-state, the pressure and flow rate are again averaged over a5 s interval. This process is repeated until the flow rate reachesUg¼0 cm/s; at this point the test is completed. For statisticalpurposes, each test for the specified material and bed height isrepeated 5 times.
After all the bed material data are collected, the same proce-dure is repeated in an empty reactor. This is done to quantify thepressure drop through the aeration plate and plenum. The emptyreactor pressure data are then subtracted from the fluidized bed
data at the respective superficial gas velocity. Since the flow ratesbetween the empty reactor and fluidized bed tests do not matchexactly, a linear interpolation method is employed to calculatethe empty bed pressures corresponding to the fluidized bed flowrates. Finally, the bed pressure drop is plotted as a function ofsuperficial gas velocity and the minimum fluidization velocity isdefined as the point in which the pressure drop across the bedremains constant. Fig. 2 shows a sample plot obtained for glassbeads where the static bed height corresponds to H/D¼1.
X-ray computed tomography (CT) scans are completed for allthree materials at different H/D ratios (0.5, 1, 1.5, 2) and differentsuperficial gas velocities Ug¼1.25, 1.5, 1.75, 2, 3 Umf. CT imagingallows for quantitative analysis of the local time-average gasholdup, and identifies the effects that different bed heights andmaterial densities have on the local hydrodynamic behavior in afluidized bed.
The X-ray facility used in this study has been describedelsewhere by Heindel et al. (2008), and only the procedure usedin this study is described here. First, the X-ray source that islocated opposite the CT detector is warmed up at the same timethe thermoelectric cooler on the CCD camera is simultaneously

Fig. 3. Bed pressure drop as a function of gas velocity for glass beads.
Fig. 4. Bed pressure force/bed weight as a function of superficial gas velocity for
glass beads.
D. Escudero, T.J. Heindel / Chemical Engineering Science 66 (2011) 3648–3655 3651
cooled to 0 1C to reduce noise and allow for long CT scans. Aftercompleting the warm-up process, the X-ray voltage and current,as well as the camera exposure time and binning options areadjusted based on the bed material in the imaging region. For thisstudy, the power settings are constant for each material, regard-less of flow and bed height conditions. Glass bead data areacquired at a voltage of 150 keV and a current of 3.5 mA, groundcorncob and ground walnut shell images are acquired at 130 keVand 3.2 mA. For this research, the exposure time is set to 1 s andthe camera binning is set to 4�4 for each of the 360 X-rayprojections that comprise a single X-ray CT scan.
Next, the fluidized bed is placed in the imaging region and thescintillation crystals in the detector are excited with X-rays forapproximately 20 min. The fluidized bed is positioned in the samehorizontal location for all bed heights. However, as the H/D ratioincreased, it is necessary to move the bed down relative to theX-ray system so that all the upper bed materials can be imaged.CT scan settings are adjusted; including the number of verticalslices (horizontal cross-sections), slice interval, and slice startlocation. Once the settings are adjusted, the system is ready tostart a CT scan.
The gas holdup (void fraction or volumetric gas fraction)describes the amount of voidage in the bed. Quantifying the localtime-average gas holdup, eg, requires the CT value of the emptyreactor (Ig), the CT value of the reactor filled with a fixed bed ofthe bulk material (Ib), and the CT value of the reactor underspecified fluidization conditions (If). To ensure the same responsefor each condition from the detector system, each CT is taken withthe same X-ray source power settings for the respectiveconditions.
The local time-average gas holdup is then determined from thetwo reference CT images and the flow CT image as described byFranka and Heindel (2009):
eg ¼If�IbþðIg�If Þeg,b
ðIg�IbÞð1Þ
where the bulk void fraction, eg,b, is defined as:
eg,b ¼ 1�rb
rp
ð2Þ
with rb and rp the bulk and particle density, respectively. Thebulk density is determined experimentally and the particledensities are provided by the particle manufacturers. The result-ing 3D image provides the local time-average gas holdupanywhere within the reactor, with a voxel (3D pixel) size of0.6 mm�0.6 mm�0.6 mm. The values obtained using Eq. (1)have an estimated error of 4–10%.
3. Results and discussion
3.1. Minimum fluidization velocity
Minimum fluidization velocity was determined for all threematerials and 0.5rH/Dr3 Fig. 3 shows the bed pressure drop asa function of superficial gas velocity for the glass bead bed at thedifferent H/D ratios. Although five tests were completed for eachcondition, only a single representative test is plotted at the givencondition in Fig. 3 as well as all subsequent figures. Bed pressuredrop increased with increasing H/D ratio because more pressureforce is needed to fluidize more bed mass in the constantdiameter bed. The knee in each plot identifies the minimumfluidization velocity, which is similar for each H/D ratio. Similarplots using ground walnut shell and ground corncob revealidentical trends, except the pressure drop is lower at constantH/D ratios because the materials are lighter than glass beads,
reducing the required pressure force to fluidize the respectivebeds (Escudero, 2010).
A force balance between the gravity and the pressure forcewas completed for each material to emphasize the minimumfluidization velocity. Fig. 4 reveals the glass bead bed data, wherethe knee of the graph occurs approximately where the bedpressure force equals the bed weight and corresponds to Umf.The knee (Umf) is approximately independent of bed height forglass beads; similar results are obtained for ground walnut shelland ground corncob (Escudero, 2010). Gunn and Hilal (1997) andCranfield and Geldart (1974) showed similar results for 3Dcylindrical beds. It is interesting to note that the 2D bed usedby Ramos Caicedo et al. (2002) revealed a bed height effect onUmf. The values of the bed pressure force over the bed weight thatsurrounds the knee of the graph are not perfectly 1 due to non-spherical particles effects and wall frictional forces. At highersuperficial gas velocities, the ratio between bed pressure drop andbed weight shows a slight decrease, which is attributed to thefrictional forces on the walls of the fluidized bed.
Plotting the bed pressure force per bed weight as a function ofUg for all three materials reveals the effect of material density onUmf; this is shown in Fig. 5 for H/D¼1. Similar results areobserved for other H/D values. Fig. 5 reveals that Umf increasesas material density increases. For the same material height,

Fig. 5. Effect of material density on the fluidization force balance for H/D¼1.
Fig. 6. Minimum fluidization velocity as a function of height-to-diameter ratio
(H/D).
H/D = 0.5
Z s
lice
h =
2D
(20
.4 c
m)
Z s
lice
h =
1.5
D (
15.3
cm
)Z
slic
eh
= 1
D (
10.2
cm
)Z
slic
eh
= 0
.5D
(5.
1 cm
)Z
-slic
eh
= 0
.25D
(2.
5 cm
)Y
-slic
e
H/D = 1 H/D = 1.5 H/D = 2
εg
D. Escudero, T.J. Heindel / Chemical Engineering Science 66 (2011) 3648–36553652
increasing the material density increases the bed pressure drop,causing Umf to increase. Similar results were revealed by RamosCaicedo et al. (2002) for 2D beds and Franka et al. (2008) for twodifferent 3D beds.
The effect of bed height and material density on Umf issummarized in Fig. 6. The error bars represent 1 standard devia-tion from the five-test average. This figure clearly shows that Umf
is approximately constant for the three materials considered hereover the range 0.5rH/Dr3. This figure also shows that Umf
increases with increasing material density.
0.6 0.7 0.8 0.9 1.00.4 0.5Fig. 7. Gas holdup y- and z-slices for Ug¼1.25Umf at different H/D ratios for a glass
bead fluidized beds.
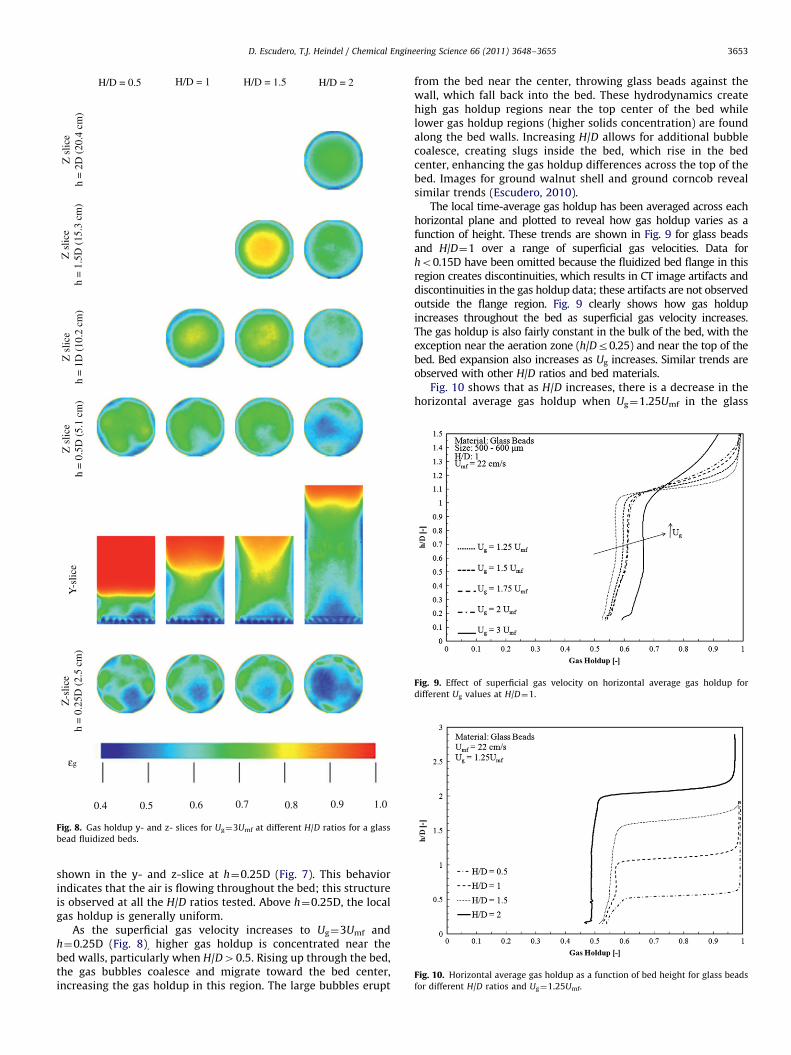
3.2. Time-average gas holdupThe 3D time-average gas holdup obtained from Eq. (1) isobtained at any voxel within the fluidized bed. These values canbe qualitatively displayed through 2D gas holdup maps slicedvertically through the bed centerline or horizontally at specifiedbed heights. Images of y- and z-slice gas holdup at specificsuperficial gas velocities for glass beads at different H/D ratiosare presented in Figs. 7 and 8 for Ug¼1.25, Umf, and 3Umf,respectively. The y-slice images are taken in the center of thebed, while the z-slice images are taken at five different axialheights (h¼0.25D, 0.5D, 1D, 1.5D, and 2D) when appropriate.
Jetting from individual aeration holes is observed in the y-sliceimages in both Figs. 7 and 8. It is observed that increasing Ug
increases the number of active aeration holes. Additionally,increasing Ug decreases the jet length because mixing in thefluidized bed increases and the individual jets lose their identity.
Gas holdup increases as superficial gas velocity increases; thisis primarily attributed to a higher volume of air passing throughthe bed. For Ug¼1.25Umf, a high local gas concentration is locatednear the bottom-center of the bed as well as near the bed wall as
H/D = 0.5
Z s
lice
h =
2D
(20
.4 c
m)
Z s
lice
h =
1.5
D (
15.3
cm
)Z
slic
eh
= 1
D (
10.2
cm
)Z
slic
eh
= 0
.5D
(5.
1 cm
)Z
-slic
eh
= 0
.25D
(2.
5 cm
)Y
-slic
eH/D = 1 H/D = 1.5 H/D = 2
0.6 0.7 0.8 0.9 1.00.4 0.5
εg
Fig. 8. Gas holdup y- and z- slices for Ug¼3Umf at different H/D ratios for a glass
bead fluidized beds.
Fig. 9. Effect of superficial gas velocity on horizontal average gas holdup for
different Ug values at H/D¼1.
Fig. 10. Horizontal average gas holdup as a function of bed height for glass beads
for different H/D ratios and Ug¼1.25Umf.
D. Escudero, T.J. Heindel / Chemical Engineering Science 66 (2011) 3648–3655 3653
shown in the y- and z-slice at h¼0.25D (Fig. 7). This behaviorindicates that the air is flowing throughout the bed; this structureis observed at all the H/D ratios tested. Above h¼0.25D, the localgas holdup is generally uniform.
As the superficial gas velocity increases to Ug¼3Umf andh¼0.25D (Fig. 8), higher gas holdup is concentrated near thebed walls, particularly when H/D40.5. Rising up through the bed,the gas bubbles coalesce and migrate toward the bed center,increasing the gas holdup in this region. The large bubbles erupt
from the bed near the center, throwing glass beads against thewall, which fall back into the bed. These hydrodynamics createhigh gas holdup regions near the top center of the bed whilelower gas holdup regions (higher solids concentration) are foundalong the bed walls. Increasing H/D allows for additional bubblecoalesce, creating slugs inside the bed, which rise in the bedcenter, enhancing the gas holdup differences across the top of thebed. Images for ground walnut shell and ground corncob revealsimilar trends (Escudero, 2010).
The local time-average gas holdup has been averaged across eachhorizontal plane and plotted to reveal how gas holdup varies as afunction of height. These trends are shown in Fig. 9 for glass beadsand H/D¼1 over a range of superficial gas velocities. Data forho0.15D have been omitted because the fluidized bed flange in thisregion creates discontinuities, which results in CT image artifacts anddiscontinuities in the gas holdup data; these artifacts are not observedoutside the flange region. Fig. 9 clearly shows how gas holdupincreases throughout the bed as superficial gas velocity increases.The gas holdup is also fairly constant in the bulk of the bed, with theexception near the aeration zone (h/Dr0.25) and near the top of thebed. Bed expansion also increases as Ug increases. Similar trends areobserved with other H/D ratios and bed materials.
Fig. 10 shows that as H/D increases, there is a decrease in thehorizontal average gas holdup when Ug¼1.25Umf in the glass

Fig. 11. Horizontal average gas holdup as a function of bed height for glass beads
for different H/D ratios and Ug¼3Umf.Fig. 12. Horizontal average gas holdup as a function of bed height for all materials
at H/D¼1 and Ug¼1.5Umf.
D. Escudero, T.J. Heindel / Chemical Engineering Science 66 (2011) 3648–36553654
bead bed. In the bed bulk, the gas holdup in the H/D¼0.5 bedincreases with increasing height because there is little materialsuppressing bed expansion. However, as H/D increases, bedexpansion is suppressed, producing a uniform gas holdup in thebed bulk while decreasing gas holdup as H/D increases. Thelighter ground walnut shell and ground corncob beds do notsuppress bed expansion and gas holdup is uniform in the bed bulkover a range of H/D ratios when Ug¼1.25Umf.
Increasing Ug to 3Umf enhances mixing throughout the bed,and as shown in Fig. 11, this creates competing effects as H/Dincreases. When H/D¼0.5 and 1, the bed bulk is fairly uniform.Visually, the bed is very violent and large bubbles erupt at the topof the bed over a variety of regions. This allows the bed to freelyexpand but the demarcation between the bed bulk and freeboardregion occurs over a small h/D range (0.4–0.7). Increasing H/D to1.5 provides more bed height for individual bubbles to coalesce.The bed is still extremely violent, but large bubbles concentratenear the bed central axis as they erupt into the freeboard region.The large bubbles create, on a time-average sense, a low gasholdup region at the top of the bed that penetrates deep into thebed; this is very apparent in Fig. 8 where the y-slice for H/D¼1.5displays this trend. Deep in the bed, the horizontally averaged gasholdup is similar to that when H/D¼0.5 or 1, but rising throughthe bed, the bulk gas holdup is higher than that at H/D¼1. Thetransition from the bed bulk to the freeboard region also extendsover a wide h/D range (h/D�1). Increasing H/D further to2 produces a different effect. Visually, large bubbles still eruptat the surface along the bed centerline, but small bubbles areobserved (visually near the bed walls) deep in the bed. It ishypothesized that the violent motion of the small bubbles createslocalized packing effects deep in the bed. This is observed in Fig. 8for H/D¼2 where a ‘‘mound’’ of low gas holdup is observed in they-slice and rises to h/D�0.75. The localized packing decreases thehorizontally averaged gas holdup for H/D¼2 when compared toother H/D values. These trends are less apparent when the lighterground walnut shell or ground corncob materials are used inthe bed.
Fig. 12 shows the horizontal average and time-average gasholdup as a function of axial height for the three materials used inthis study and H/D¼1. As the material density decreases theaverage gas holdup increases, which corresponds to the trend inbulk gas holdup. The horizontal average gas holdup increasesslightly and is then constant in the bed bulk for glass beads forthis particular bed height (H/D¼1). The constant values with bed
height correspond to a well-mixed bed. The lower densitymaterials (ground walnut shell and ground corncob) are easierto mix in the bed, producing a constant gas holdup throughoutthe bulk of the bed.
Fig. 12 clearly shows the increase in gas holdup as the top ofthe bed is approached. The ground walnut shell expands slightlymore than glass beads and ground corncob, but this excessexpansion is hypothesized to be primarily due to a slight packingeffect for this system that was introduced during the fillingprocess. Note that although this packing effect was not visuallyobserved during the filling process, the CT imaging captures theenhanced expansion that results from the packing effect.
4. Conclusions
Minimum fluidization velocity was determined for threedifferent materials (glass beads, ground walnut shell, and groundcorncob) over a range of bed heights. For the 3D bubblingfluidized bed used in this study, the minimum fluidizationvelocity was independent of the bed height. The three materialsused in this study had different densities, and as densityincreased, the minimum fluidization velocity increased. Hence,ground corncob had the lowest minimum fluidization velocitywhile glass beads had the highest.
Local time-average gas holdup values obtained with X-ray CTimaging revealed that the bed hydrodynamics were similar for allstatic bed heights tested in this study at low superficial gasvelocities. At the highest superficial gas velocity tested in thisstudy (Ug¼3Umf), static bed height differences were observed andattributed to localized mixing and packing effects. Increasing Ug
enhanced mixing in the bed, producing a more homogenous bulkbed while the static bed height was held constant. Decreasing thebed density increased the gas holdup in the bed.
Acknowledgments
Support for D.E. through the Fulbright Commission is acknowl-edged. The X-ray facility used in this research was funded by theNational Science Foundation under award number CTS-0216367and Iowa State University.
D. Escudero, T.J. Heindel / Chemical Engineering Science 66 (2011) 3648–3655 3655
References
Baron, T., Briens, C.L., Bergougnou, M.A., Hazlett, J.D., 1987. Electrostatic effects onentrainment from a fluidized bed. Powder Technology 53 (1), 55–67.
Cranfield, R.R., Geldart, D., 1974. Large particle fluidisation. Chemical EngineeringScience 29 (4), 935–947.
Du, B., Warsito, W., Fan, L.-S., 2003. Bed nonhomogeneity in turbulent gas–solidfluidization. AIChE Journal 49 (5), 1109–1126.
Escudero, D., 2010. Bed Height and Material Density Effects on Fluidized BedsHydrodynamics. Department of Mechanical Engineering. Ames, IA, Iowa StateUniversity. MSc. Thesis, pp. 109.
Franka, N.P., Drake, J.B., Heindel, T.J., 2008. Minimum fluidization velocity and gasholdup in fluidized beds with side port air injection. In: Proceedings of theASME Fluids Engineering Division Summer Meeting. Jacksonville, Fl, USA,ASME, pp. 11.
Franka, N.P., Heindel, T.J., 2009. Local time-averaged gas holdup in a fluidized bedwith side air injection using X-ray computed tomography. Powder Technology193 (1), 69–78.
Geldart, D., 1973. Types of gas fluidization. Powder Technology 7 (5), 285–292.Grassler, T., Wirth, K.E., 2000. X-ray computer tomography—potential and limita-
tion for the measurement of local solids distribution in circulating fluidizedbeds. Chemical Engineering Journal 77 (1), 65–72.
Gunn, D.J., Hilal, N., 1997. The expansion of gas-fluidised beds in bubblingfluidisation. Chemical Engineering Science 52 (16), 2811–2822.
Heindel, T.J., Gray, J.N., Jensen, T.C., 2008. An X-ray system for visualizing fluidflows. Flow Measurement and Instrumentation 19 (2), 67–78.
Hilal, N., Ghannam, M.T., Anabtawi, M.Z., 2001. Effect of bed diameter, distributorand inserts on minimum fluidization velocity. Chemical Engineering andTechnology 24 (2), 161–165.
Ramos Caicedo, G., Garcıa Ruiz, M., Prieto Marques, J.J., Guardiola Soler, J., 2002.Minimum fluidization velocities for gas–solid 2D beds. Chemical Engineeringand Processing 41 (9), 761–764.
Sanchez-Delgado, S., Almendros-Ibanez, J.A., Garcıa-Hernando, N., Santana, D.,2011. On the minimum fluidization velocity in 2D fluidized beds. PowderTechnology 207 (1–3), 145–153.
Sau, D.C., Mohanty, S., Biswal, K.C., 2007. Minimum fluidization velocities andmaximum bed pressure drops for gas–solid tapered fluidized beds. ChemicalEngineering Journal 132 (1–3), 151–157.
Zhang, Y., Jin, B., Zhong, W., Ren, B., Xiao, R., 2010. DEM simulation of particlemixing in flat-bottom spout-fluid bed. Chemical Engineering Research andDesign 88 (5–6), 757–771.
Zhong, W., Chen, X., Zhang, M., 2006. Hydrodynamic characteristics of spout-fluidbed: pressure drop and minimum spouting/spout-fluidizing velocity. ChemicalEngineering Journal 118 (1–2), 37–46.
Zhong, W., Jin, B., Zhang, Y., Wang, X., Xiao, R., 2008. Fluidization of biomassparticles in a gas–solid fluidized bed. Energy and Fuels 22 (6), 4170–4176.
Zhu, H., Zhu, J., Li, G., Li, F., 2008. Detailed measurements of flow structure inside adense gas–solids fluidized bed. Powder Technology 180 (3), 339–349.
Copyright © 2022 FDOKUMEN