Mathematical Modeling of the Fluidized Bed Drying of Cubic Materials
16
795 Mathematical modeling of fluidized bed drying of rough rice (Oryza sativa L.) grain M. Khanali 1* , Sh. Rafiee 1 , A. Jafari 1 , S.H. Hashemabadi 2 and A. Banisharif 3 1 Department of Agricultural Machinery Engineering, Faculty of Agricultural Engineering and Technology, University of Tehran, Karaj, Iran, 2 Computer Aided Process Engineering Lab., Department of Chemical Engineering, Iran University of Science and Technology, Narmak, Tehran, Iran, 3 College of engineering, School of Chemical Engineering, University of Tehran, Tehran, Iran M. Khanali, Sh. Rafiee, A. Jafari, S.H. Hashemabadi and A. Banisharif (2012) Mathematical modeling of fluidized bed drying of rough rice (Oryza sativa L.) grain. Journal of Agricultural Technology 8(3): 795-810. Fluidized bed drying experiments were conducted for rough rice for drying air temperatures of 50, 60 and 70 °C, superficial fluidization velocities of 2.3, 2.5 and 2.8 m/s and solids holdups of 0.66 and 1.32 kg. Various popular empirical and semi empirical drying models were used to fit the drying data. Comparison of the coefficient of determination, reduced chi-square, root mean square error and plot of residual showed that the Midilli et al. model was the best model in describing fluidized bed drying characteristics of rough rice. Drying parameters of the Midilli et al. model were correlated with drying air temperature, superficial fluidization velocity and initial stagnant bed height. Also the effect of various operating variables on the fluidized bed drying characteristics of rough rice was studied. It was found that the drying air temperature has a dominant effect on drying kinetics. Increasing the air temperature increases the drying rate. The drying rate increased marginally with increase in the velocity of the drying air, while decreased marginally with increase in the solids holdup. Key words: Fluidized bed, drying, modeling, rough rice Introduction Rough rice (Oryza sativa L.) is one of the principal cereals used by the world’s inhabitants. Rice is the second largest produced cereal in the world. The world’s rice production increased from 316 million tons in 1970 to 678 million tons in 2009 (FAOSTAT, 2010). Moisture content of freshly harvested rough rice is very high in the range of 20-35% (d.b.). Moisture favors mold growth, leading to fermentation, which * Corresponding author: Majid Khanali; e-mail: [email protected] Journal of Agricultural Technology 2012 Vol. 8(3): 795-810 Available online http://www.ijat-aatsea.com ISSN 1686-9141
-
Upload
independent -
Category
Documents
-
view
1 -
download
0
Transcript of Mathematical Modeling of the Fluidized Bed Drying of Cubic Materials
Journal of Agricultural Technology 2012, Vol. 8(3): 795-810
795
Mathematical modeling of fluidized bed drying of rough rice (Oryza sativa L.) grain M. Khanali1*, Sh. Rafiee1, A. Jafari1, S.H. Hashemabadi2 and A. Banisharif3
1Department of Agricultural Machinery Engineering, Faculty of Agricultural Engineering and Technology, University of Tehran, Karaj, Iran, 2Computer Aided Process Engineering Lab., Department of Chemical Engineering, Iran University of Science and Technology, Narmak, Tehran, Iran, 3College of engineering, School of Chemical Engineering, University of Tehran, Tehran, Iran M. Khanali, Sh. Rafiee, A. Jafari, S.H. Hashemabadi and A. Banisharif (2012) Mathematical modeling of fluidized bed drying of rough rice (Oryza sativa L.) grain. Journal of Agricultural Technology 8(3): 795-810. Fluidized bed drying experiments were conducted for rough rice for drying air temperatures of 50, 60 and 70 °C, superficial fluidization velocities of 2.3, 2.5 and 2.8 m/s and solids holdups of 0.66 and 1.32 kg. Various popular empirical and semi empirical drying models were used to fit the drying data. Comparison of the coefficient of determination, reduced chi-square, root mean square error and plot of residual showed that the Midilli et al. model was the best model in describing fluidized bed drying characteristics of rough rice. Drying parameters of the Midilli et al. model were correlated with drying air temperature, superficial fluidization velocity and initial stagnant bed height. Also the effect of various operating variables on the fluidized bed drying characteristics of rough rice was studied. It was found that the drying air temperature has a dominant effect on drying kinetics. Increasing the air temperature increases the drying rate. The drying rate increased marginally with increase in the velocity of the drying air, while decreased marginally with increase in the solids holdup. Key words: Fluidized bed, drying, modeling, rough rice Introduction
Rough rice (Oryza sativa L.) is one of the principal cereals used by the world’s inhabitants. Rice is the second largest produced cereal in the world. The world’s rice production increased from 316 million tons in 1970 to 678 million tons in 2009 (FAOSTAT, 2010).
Moisture content of freshly harvested rough rice is very high in the range of 20-35% (d.b.). Moisture favors mold growth, leading to fermentation, which
* Corresponding author: Majid Khanali; e-mail: [email protected]
Journal of Agricultural Technology 2012 Vol. 8(3): 795-810 Available online http://www.ijat-aatsea.com
ISSN 1686-9141

796
results in yellow and damaged kernels. To prevent paddy deterioration, high moisture content of paddy should be reduced to 14% (d.b.) by hot air drying (Brooker et al. 1992). Fluidized beds find increasing application for the drying of agricultural materials, while they have found widespread applications for the drying of particulate or granular solids in the chemical, fertilizer, ceramic, pharmaceutical, polymer, and waste management industries. Increasing application of fluidized bed drying for agricultural materials is due to the important advantages of fluidized bed drying such as good solids mixing, high rates of heat and mass transfer, easy material transport inside dryer, ease of control and low maintenance cost.
Sutherland and Ghaly (1990) were probably the first research group who investigated feasibility of using fluidization technique for paddy drying. Tumambing and Driscoll (1991) found that drying rate was affected by drying air temperature and bed thickness. They also developed a mathematical model for continuous fluidized bed paddy dryer. Research works and development of fluidized bed paddy drying technique in Thailand were carried out, starting with an experimental batch dryer and culminating with a commercial continuous flow dryer (Soponronnarit and Prachayawarakorn, 1994; Soponronnarit et al., 1995; Soponronnarit et al., 1996; Soponronnarit et al., 2001). As mentioned, the fluidized bed drying technique has been proposed and applied as an appropriate method for the drying of rough rice. However no much information on the fluidized bed drying kinetic of rough rice is available in the literature.
Based on moisture content of the products, drying kinetics from the text books refers constant rate period followed by falling rate period with the demarcation based on the critical moisture content. Drying of cereal grains, including rough rice, mostly occurs in the falling rate period and the moisture transfer during drying is controlled by internal moisture diffusion (Wang and Brennan, 1992). On the other hand, these materials have a very short duration constant rate period and a longer curvy linear falling rate period (Strumillo and Kudra, 1986; Srinivasakannan et al. 1994).
In order to simulate fluidized bed drying, some researchers have used single and multi phase models. In a single-phase model, the fluidized bed is regarded essentially as a continuum. Heat and mass balances are applied over the fluidized bed. It is assumed that particles in the bed are perfectly mixed (Martinez-Vera et al. 1995). A multi-phase model of fluidized bed drying treats the fluidized bed to be composed of a bubble phase (dilute phase) and a suspension phase (dense phase). In some researches, suspension phase itself was assumed to be composed of the particles and intermediate gas phase (Burgschweiger et al. 1999; Zahed et al. 1995). However, these modeling types are complex and not suitable for practical aims. Most researchers have
Journal of Agricultural Technology 2012, Vol. 8(3): 795-810
797
performed empirical or semi empirical models for simulation of drying. The primary advantage of empirical or semi empirical models in drying simulations, is their easiness to apply. Knowledge of batch drying kinetics is essential for obtaining drying curves as well as for optimizing the operation parameters and improving the drying systems. Also in some Analytical modeling of continuous drying systems, knowing the batch drying kinetics is necessary.
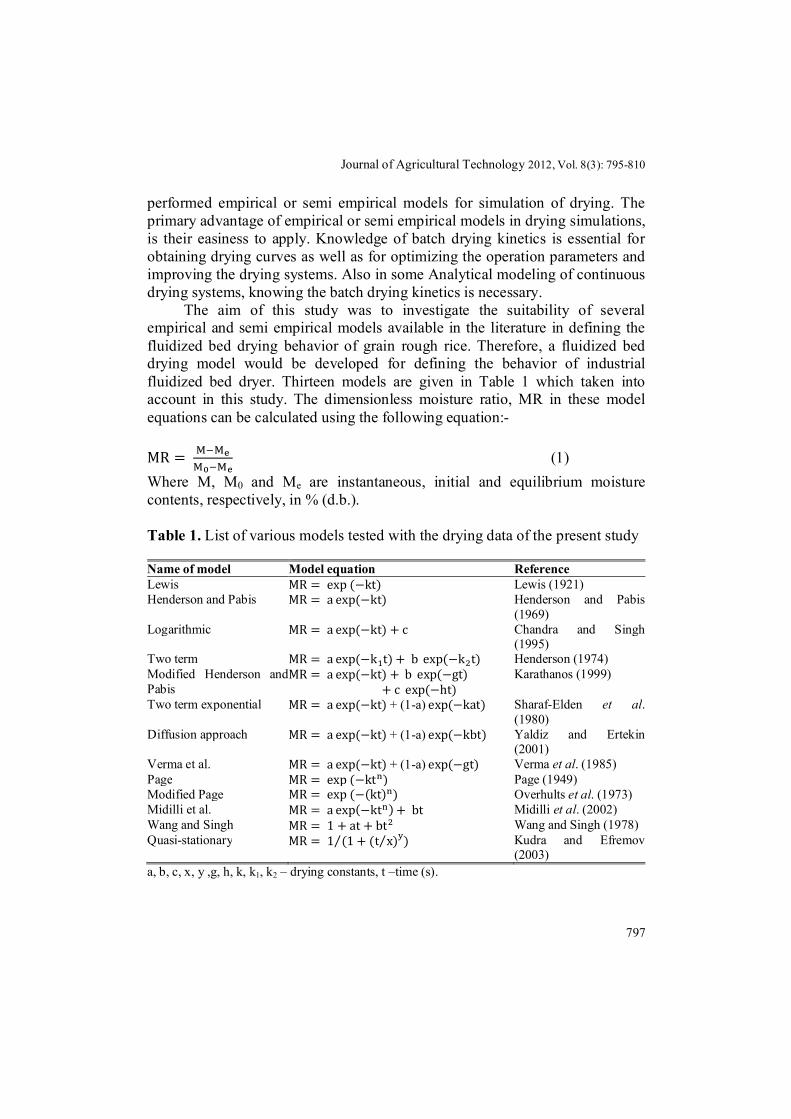
The aim of this study was to investigate the suitability of several empirical and semi empirical models available in the literature in defining the fluidized bed drying behavior of grain rough rice. Therefore, a fluidized bed drying model would be developed for defining the behavior of industrial fluidized bed dryer. Thirteen models are given in Table 1 which taken into account in this study. The dimensionless moisture ratio, MR in these model equations can be calculated using the following equation:-
MR = (1) Where M, M0 and Me are instantaneous, initial and equilibrium moisture contents, respectively, in % (d.b.). Table 1. List of various models tested with the drying data of the present study Name of model Model equation Reference Lewis MR = exp (−kt) Lewis (1921) Henderson and Pabis MR = a exp(−kt) Henderson and Pabis
(1969) Logarithmic MR = a exp(−kt) + c Chandra and Singh
(1995) Two term MR = a exp(−k t) + b exp(−k t) Henderson (1974) Modified Henderson and Pabis
MR = a exp(−kt) + b exp(−gt)+ c exp(−ht)
Karathanos (1999)
Two term exponential MR = a exp(−kt) + (1-a) exp(−kat) Sharaf-Elden et al. (1980)
Diffusion approach MR = a exp(−kt) + (1-a) exp(−kbt) Yaldiz and Ertekin (2001)
Verma et al. MR = a exp(−kt) + (1-a) exp(−gt) Verma et al. (1985) Page MR = exp (−kt ) Page (1949) Modified Page MR = exp (−(kt) ) Overhults et al. (1973) Midilli et al. MR = a exp(−kt ) + bt Midilli et al. (2002) Wang and Singh MR = 1 + at + bt Wang and Singh (1978) Quasi-stationary MR = 1 (1 + (t x)⁄⁄ ) Kudra and Efremov
(2003) a, b, c, x, y ,g, h, k, k1, k2 – drying constants, t –time (s).
798
Non-linear regression techniques were used to obtain the different constants in each selected model, using Curve Fitting Toolbox of Matlab R2009a software package based on the Levenberg-Marquardt algorithm. This algorithm combines the steepest-descent and a Taylor series based approach to obtain a fast, reliable technique for non-linear optimization. Knowing that the steepest descent approach works best far away from the minimum, and the Taylor series approach works best close to the minimum, Levenberg-Marquardt algorithm allows for a smooth transition between these two as the iteration proceeds. The coefficient of determination (R2), reduced chi-square (χ2), root mean square error (RMSE) and randomness of residual plots were used in order to evaluate the goodness of fitting of each model to experimental data. The higher values of R2, the lower values of χ2 and RMSE and the less patterned residual plots were chosen for goodness of fit, according to the criterion followed by Chapra and Canale (1989) and Chen and Jayas (1998). These parameters are defined as follows:
χ2 = ∑ ( , , )
(2)
RMSE = ∑ (MR , − MR , ) ⁄
(3) Where MRexp,i is the experimental moisture ratio, MRpre,i the predicted moisture ratio, N the number of observations and p is the number of parameters in the regression model. The difference between measured and predicted moisture content values is defined as the residuals. Materials and methods
Dried long grain rough rice of the Neda variety was provided by the Rice Research Institute, Mazandaran province, Iran. The rice was re-moistened, homogenized and kept in a cold storage at 3-5 °C for four days prior to an experiment in order to ensure the uniform water concentration throughout the kernel. The moisture content of rough rice was determined by drying 50 g of rough rice sample at temperature of 105 °C for 24 h in a hot air oven (ASAE, 1984). The initial moisture content of the re-moistened rough rice was 25% (d.b.).
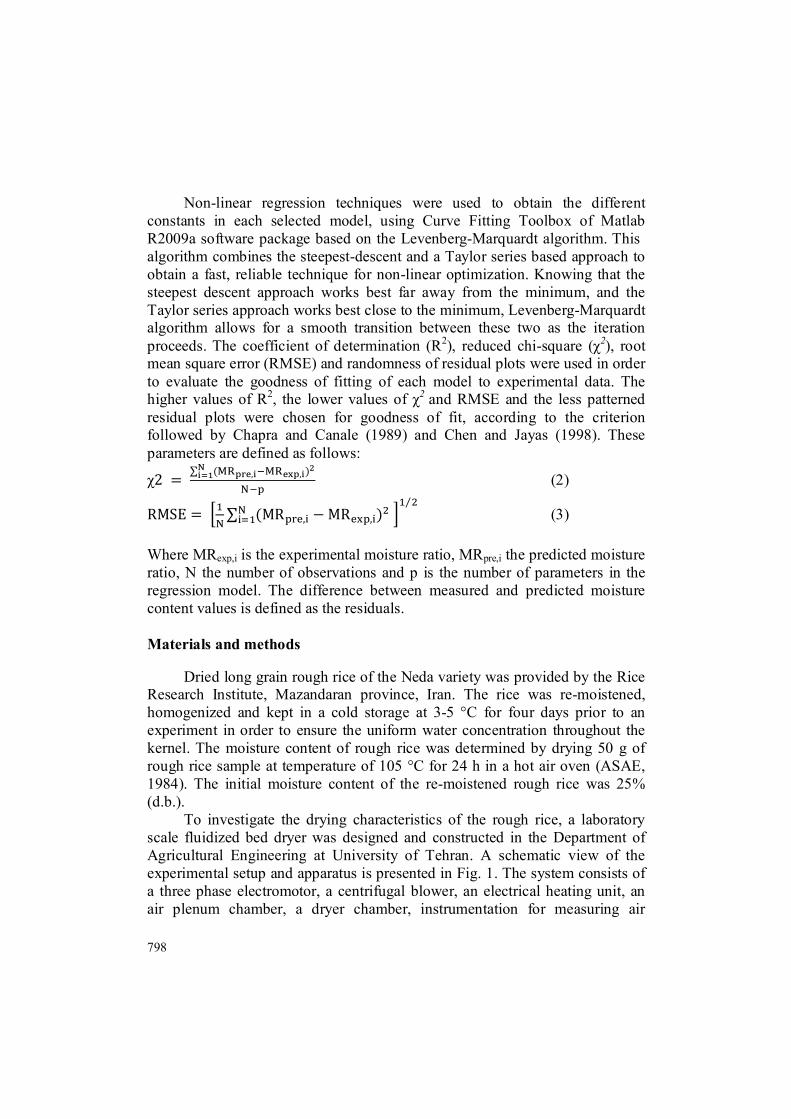
To investigate the drying characteristics of the rough rice, a laboratory scale fluidized bed dryer was designed and constructed in the Department of Agricultural Engineering at University of Tehran. A schematic view of the experimental setup and apparatus is presented in Fig. 1. The system consists of a three phase electromotor, a centrifugal blower, an electrical heating unit, an air plenum chamber, a dryer chamber, instrumentation for measuring air
Journal of Agricultural Technology 2012, Vol. 8(3): 795-810
799
temperature, relative humidity and volumetric flow rate and a data acquisition system. The drying chamber was a stainless steel cylinder with 0.25 m inner diameter and 0.7 m height. A perforated steel air distributor plate with 2 mm thickness and 2 mm diameter holes on a 5 mm triangular pitch was used.
Fig. 1. Schematic diagram of experimental setup (1. Blower; 2. Pitot tube; 3. Differential pressure transmitter; 4. Electrical heater; 5. Air plenum chamber; 6. Distributor plate; 7. Dryer chamber; 8. U-tube manometer; 9-10. Relative humidity sensors; 11. Temperature control sensor; 12-13. Pressure recording taps; 14-15-16. Bed temperature distribution sensors.
After the dryer was brought to steady state conditions at the desired air inlet temperature and flow rata, a known quantity of rough rice with known initial moisture content was introduced into the column. The fluidization air velocity was decided based on the minimum fluidization velocity of the rough rice. The experiments were carried out at superficial fluidization velocities of 1.35, 1.47 and 1.65 times the minimum fluidization velocity of 1.7 m/s. An acceptable fluidization state in terms of uniform and stable fluidization was observed visibly. This was substantiated with low fluctuation in the bed pressure drop, which is an indication for homogenous fluidization without formation slugs. The moisture content of the sample during drying was determined by weighing the sample together with the drying chamber for about 5 s every 2 min using an INFINITY ESK-204HTS electronic balance. The accuracy of the weighing was ±0.1 g. For checking the reproducibility of the experimental data, three replications for each drying condition were conducted and average drying curves were obtained.
The equilibrium moisture content of rough rice as a function of temperature and relative humidity of the drying air was determined by Eq. (4) (Atthajariyakul and Leephakpreeda, 2006).
M = ( ). × ( . . )
.⁄ (4)
800
Where T is the drying air temperature in °C and RH is the relative humidity of drying air as a decimal. The physical attributes of rough rice, the equilibrium moisture content as well as the experimental conditions can be found in Table 2. Table 2. Some physical attributes of the rough rice and experimental conditions covered in the present study Name of grain Rough rice Shape of grain Spherical Size, dp× 103 – (m) 3.45 Bulk density – (kg/m3) 541.27 Porosity – (%, m3/m3) 51.45 Equilibrium moisture contents corresponding to drying air temperatures of 50, 60 and 70 °C – (% , kg/kg, d.b.)
3.3, 3.1, 2.9
Minimum fluidization velocity – (m/s) 1.7 Drying air temperature – ( °C) 50, 60, 70 Superficial air velocity – (m/s) 2.3, 2.5, 2.8 Solids holdup – (kg) 0.66, 1.32 Initial stagnant bed height – (m) 0.025, 0.05 Results and discussion
Non-linear regression analyses have been carried out on the thirteen drying models relating the moisture ratio with the drying time for drying air temperatures of 50, 60 and 70 °C, superficial fluidization velocities of 2.3, 2.5 and 2.8 m/s and solids holdups of 0.66 and 1.32 kg. The solids holdups of 0.66 and 1.32 kg correspond to the initial stagnant bed heights of 0.025 m and 0.05 m, respectively. Based on the statistical analysis on models presented in Table 1, the results of statistical computing on the seven best models are summed up in Tables 3-8. The acceptability of the drying model has been based on a value for R2 which should be close to one, and low values for χ2 and RMSE.
Journal of Agricultural Technology 2012, Vol. 8(3): 795-810
801
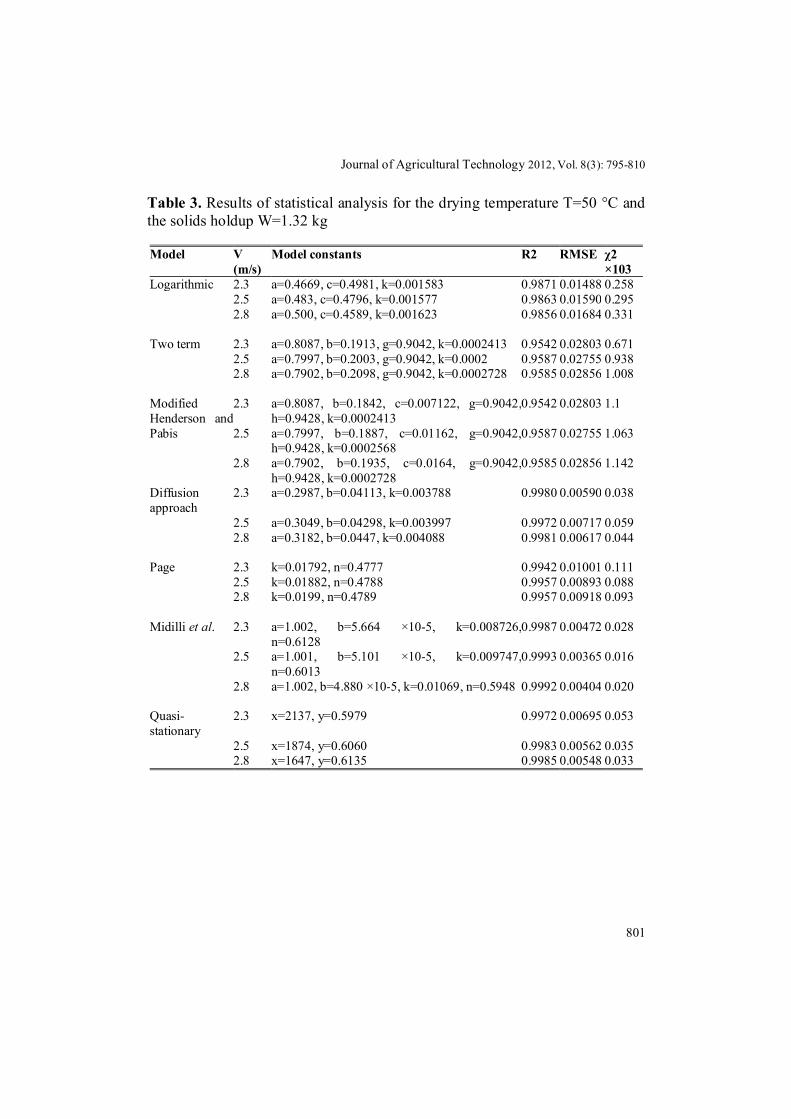
Table 3. Results of statistical analysis for the drying temperature T=50 °C and the solids holdup W=1.32 kg
χ2 ×10³
RMSE R2 Model constants V (m/s)
Model
0.258 0.01488 0.9871 a=0.4669, c=0.4981, k=0.001583 2.3 Logarithmic 0.295 0.01590 0.9863 a=0.483, c=0.4796, k=0.001577 2.5 0.331 0.01684 0.9856 a=0.500, c=0.4589, k=0.001623 2.8
0.671 0.02803 0.9542 a=0.8087, b=0.1913, g=0.9042, k=0.0002413 2.3 Two term 0.938 0.02755 0.9587 a=0.7997, b=0.2003, g=0.9042, k=0.0002 2.5 1.008 0.02856 0.9585 a=0.7902, b=0.2098, g=0.9042, k=0.0002728 2.8
1.1 0.02803 0.9542 a=0.8087, b=0.1842, c=0.007122, g=0.9042,
h=0.9428, k=0.0002413 2.3 Modified
Henderson and Pabis
1.063 0.02755 0.9587 a=0.7997, b=0.1887, c=0.01162, g=0.9042, h=0.9428, k=0.0002568
2.5
1.142 0.02856 0.9585 a=0.7902, b=0.1935, c=0.0164, g=0.9042, h=0.9428, k=0.0002728
2.8
0.038 0.00590 0.9980 a=0.2987, b=0.04113, k=0.003788 2.3 Diffusion approach
0.059 0.00717 0.9972 a=0.3049, b=0.04298, k=0.003997 2.5 0.044 0.00617 0.9981 a=0.3182, b=0.0447, k=0.004088 2.8
0.111 0.01001 0.9942 k=0.01792, n=0.4777 2.3 Page 0.088 0.00893 0.9957 k=0.01882, n=0.4788 2.5 0.093 0.00918 0.9957 k=0.0199, n=0.4789 2.8
0.028 0.00472 0.9987 a=1.002, b=5.664 ×10⁻⁵, k=0.008726,
n=0.6128 2.3 Midilli et al.
0.016 0.00365 0.9993 a=1.001, b=5.101 ×10⁻⁵, k=0.009747, n=0.6013
2.5
0.020 0.00404 0.9992 a=1.002, b=4.880 ×10⁻⁵, k=0.01069, n=0.5948 2.8
0.053 0.00695 0.9972 x=2137, y=0.5979 2.3 Quasi-stationary
0.035 0.00562 0.9983 x=1874, y=0.6060 2.5 0.033 0.00548 0.9985 x=1647, y=0.6135 2.8
802
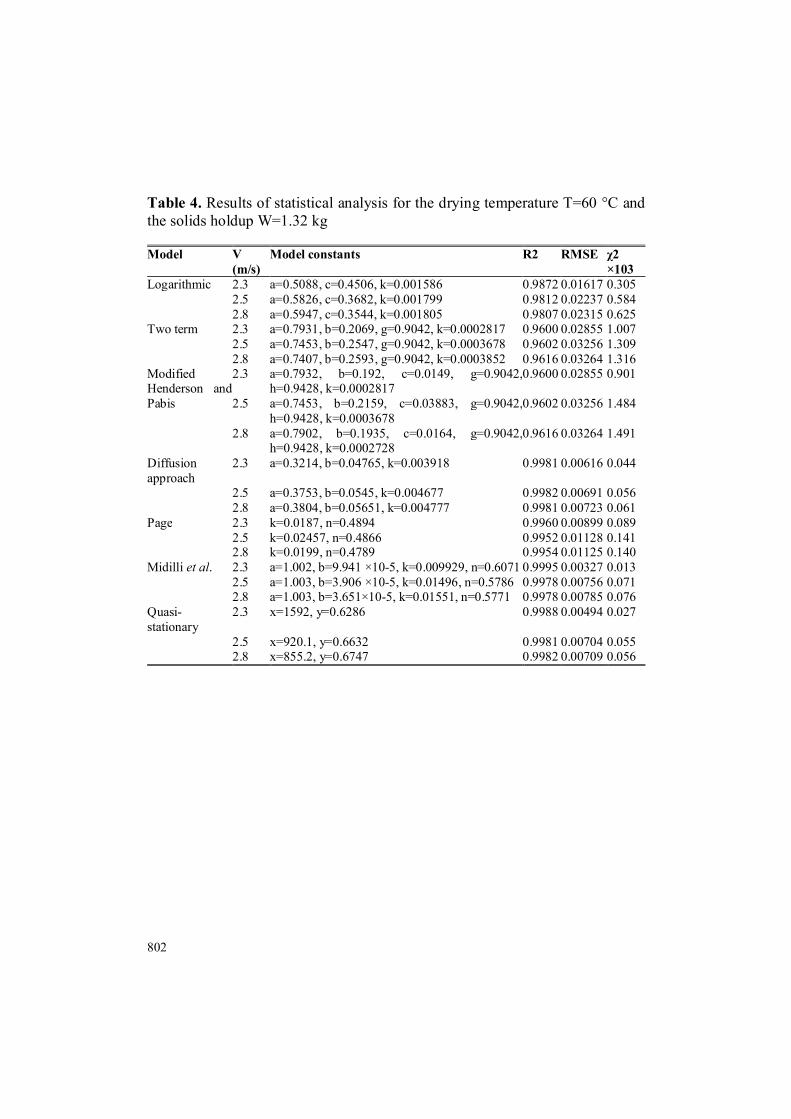
Table 4. Results of statistical analysis for the drying temperature T=60 °C and the solids holdup W=1.32 kg
χ2 ×10³
RMSE R2 Model constants V (m/s)
Model
0.305 0.01617 0.9872 a=0.5088, c=0.4506, k=0.001586 2.3 Logarithmic 0.584 0.02237 0.9812 a=0.5826, c=0.3682, k=0.001799 2.5 0.625 0.02315 0.9807 a=0.5947, c=0.3544, k=0.001805 2.8 1.007 0.02855 0.9600 a=0.7931, b=0.2069, g=0.9042, k=0.0002817 2.3 Two term 1.309 0.03256 0.9602 a=0.7453, b=0.2547, g=0.9042, k=0.0003678 2.5 1.316 0.03264 0.9616 a=0.7407, b=0.2593, g=0.9042, k=0.0003852 2.8 0.901 0.02855 0.9600 a=0.7932, b=0.192, c=0.0149, g=0.9042,
h=0.9428, k=0.0002817 2.3 Modified
Henderson and Pabis 1.484 0.03256 0.9602 a=0.7453, b=0.2159, c=0.03883, g=0.9042,
h=0.9428, k=0.0003678 2.5
1.491 0.03264 0.9616 a=0.7902, b=0.1935, c=0.0164, g=0.9042, h=0.9428, k=0.0002728
2.8
0.044 0.00616 0.9981 a=0.3214, b=0.04765, k=0.003918 2.3 Diffusion approach
0.056 0.00691 0.9982 a=0.3753, b=0.0545, k=0.004677 2.5 0.061 0.00723 0.9981 a=0.3804, b=0.05651, k=0.004777 2.8 0.089 0.00899 0.9960 k=0.0187, n=0.4894 2.3 Page 0.141 0.01128 0.9952 k=0.02457, n=0.4866 2.5 0.140 0.01125 0.9954 k=0.0199, n=0.4789 2.8 0.013 0.00327 0.9995 a=1.002, b=9.941 ×10⁻⁵, k=0.009929, n=0.6071 2.3 Midilli et al. 0.071 0.00756 0.9978 a=1.003, b=3.906 ×10⁻⁵, k=0.01496, n=0.5786 2.5 0.076 0.00785 0.9978 a=1.003, b=3.651×10⁻⁵, k=0.01551, n=0.5771 2.8 0.027 0.00494 0.9988 x=1592, y=0.6286 2.3 Quasi-
stationary 0.055 0.00704 0.9981 x=920.1, y=0.6632 2.5 0.056 0.00709 0.9982 x=855.2, y=0.6747 2.8
Journal of Agricultural Technology 2012, Vol. 8(3): 795-810
803
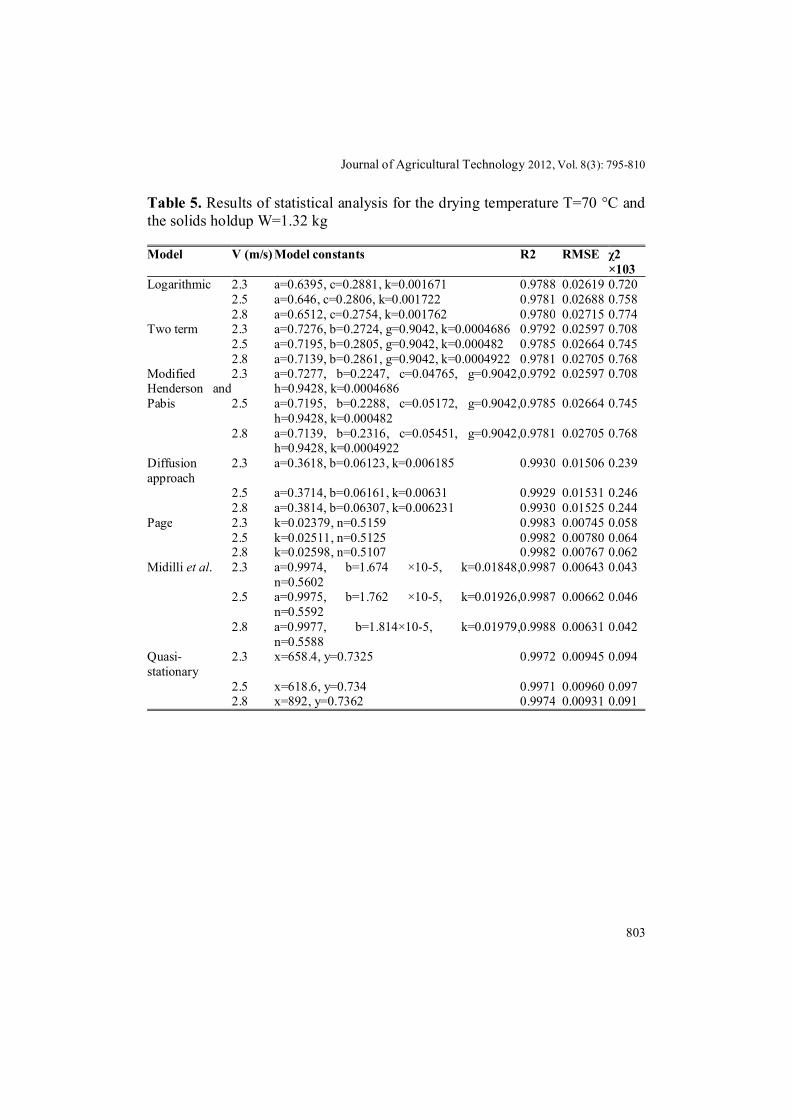
Table 5. Results of statistical analysis for the drying temperature T=70 °C and the solids holdup W=1.32 kg
χ2 ×10³
RMSE R2 Model constants V (m/s) Model
0.720 0.02619 0.9788 a=0.6395, c=0.2881, k=0.001671 2.3 Logarithmic 0.758 0.02688 0.9781 a=0.646, c=0.2806, k=0.001722 2.5 0.774 0.02715 0.9780 a=0.6512, c=0.2754, k=0.001762 2.8 0.708 0.02597 0.9792 a=0.7276, b=0.2724, g=0.9042, k=0.0004686 2.3 Two term 0.745 0.02664 0.9785 a=0.7195, b=0.2805, g=0.9042, k=0.000482 2.5 0.768 0.02705 0.9781 a=0.7139, b=0.2861, g=0.9042, k=0.0004922 2.8 0.708 0.02597 0.9792 a=0.7277, b=0.2247, c=0.04765, g=0.9042,
h=0.9428, k=0.0004686 2.3 Modified
Henderson and Pabis 0.745 0.02664 0.9785 a=0.7195, b=0.2288, c=0.05172, g=0.9042,
h=0.9428, k=0.000482 2.5
0.768 0.02705 0.9781 a=0.7139, b=0.2316, c=0.05451, g=0.9042, h=0.9428, k=0.0004922
2.8
0.239 0.01506 0.9930 a=0.3618, b=0.06123, k=0.006185 2.3 Diffusion approach
0.246 0.01531 0.9929 a=0.3714, b=0.06161, k=0.00631 2.5 0.244 0.01525 0.9930 a=0.3814, b=0.06307, k=0.006231 2.8 0.058 0.00745 0.9983 k=0.02379, n=0.5159 2.3 Page 0.064 0.00780 0.9982 k=0.02511, n=0.5125 2.5 0.062 0.00767 0.9982 k=0.02598, n=0.5107 2.8 0.043 0.00643 0.9987 a=0.9974, b=1.674 ×10⁻⁵, k=0.01848,
n=0.5602 2.3 Midilli et al.
0.046 0.00662 0.9987 a=0.9975, b=1.762 ×10⁻⁵, k=0.01926, n=0.5592
2.5
0.042 0.00631 0.9988 a=0.9977, b=1.814×10⁻⁵, k=0.01979, n=0.5588
2.8
0.094 0.00945 0.9972 x=658.4, y=0.7325 2.3 Quasi-stationary
0.097 0.00960 0.9971 x=618.6, y=0.734 2.5 0.091 0.00931 0.9974 x=892, y=0.7362 2.8
804
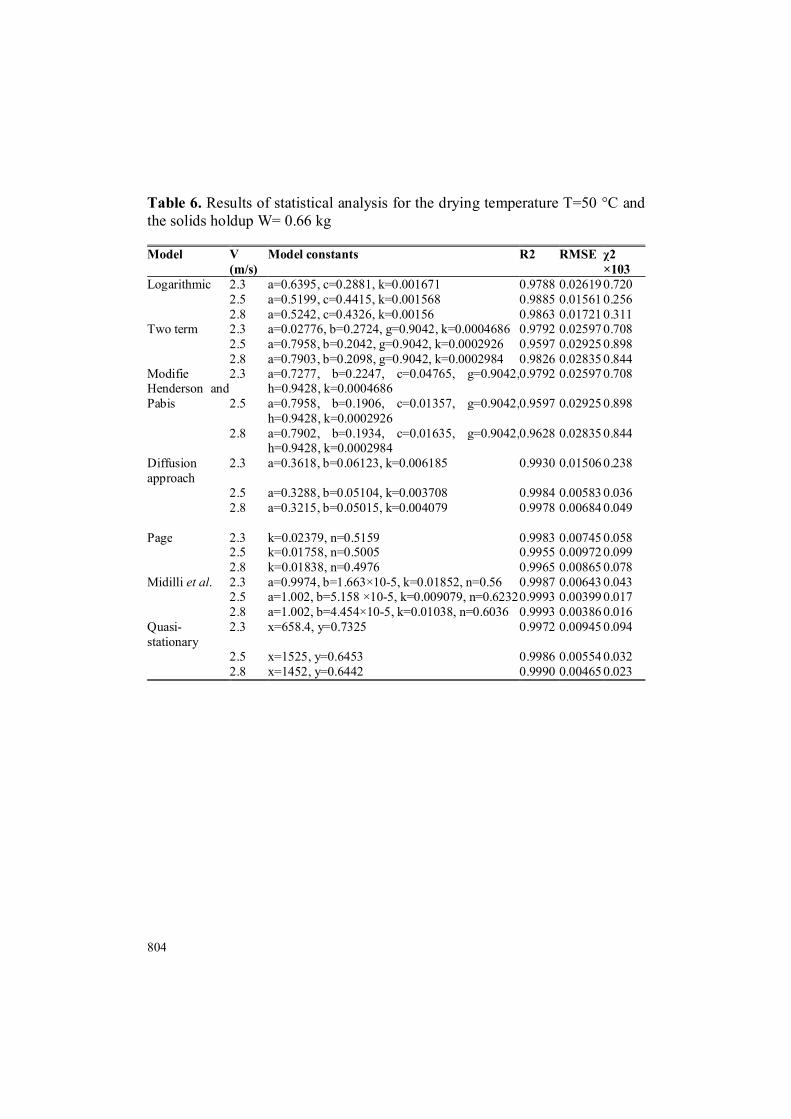
Table 6. Results of statistical analysis for the drying temperature T=50 °C and the solids holdup W= 0.66 kg
χ2 ×10³
RMSE R2 Model constants V (m/s)
Model
0.720 0.02619 0.9788 a=0.6395, c=0.2881, k=0.001671 2.3 Logarithmic 0.256 0.01561 0.9885 a=0.5199, c=0.4415, k=0.001568 2.5 0.311 0.01721 0.9863 a=0.5242, c=0.4326, k=0.00156 2.8 0.708 0.02597 0.9792 a=0.02776, b=0.2724, g=0.9042, k=0.0004686 2.3 Two term 0.898 0.02925 0.9597 a=0.7958, b=0.2042, g=0.9042, k=0.0002926 2.5 0.844 0.02835 0.9826 a=0.7903, b=0.2098, g=0.9042, k=0.0002984 2.8 0.708 0.02597 0.9792 a=0.7277, b=0.2247, c=0.04765, g=0.9042,
h=0.9428, k=0.0004686 2.3 Modifie
Henderson and Pabis 0.898 0.02925 0.9597 a=0.7958, b=0.1906, c=0.01357, g=0.9042,
h=0.9428, k=0.0002926 2.5
0.844 0.02835 0.9628 a=0.7902, b=0.1934, c=0.01635, g=0.9042, h=0.9428, k=0.0002984
2.8
0.238 0.01506 0.9930 a=0.3618, b=0.06123, k=0.006185 2.3 Diffusion approach
0.036 0.00583 0.9984 a=0.3288, b=0.05104, k=0.003708 2.5 0.049 0.00684 0.9978 a=0.3215, b=0.05015, k=0.004079 2.8
0.058 0.00745 0.9983 k=0.02379, n=0.5159 2.3 Page 0.099 0.00972 0.9955 k=0.01758, n=0.5005 2.5 0.078 0.00865 0.9965 k=0.01838, n=0.4976 2.8 0.043 0.00643 0.9987 a=0.9974, b=1.663×10⁻⁵, k=0.01852, n=0.56 2.3 Midilli et al. 0.017 0.00399 0.9993 a=1.002, b=5.158 ×10⁻⁵, k=0.009079, n=0.6232 2.5 0.016 0.00386 0.9993 a=1.002, b=4.454×10⁻⁵, k=0.01038, n=0.6036 2.8 0.094 0.00945 0.9972 x=658.4, y=0.7325 2.3 Quasi-
stationary 0.032 0.00554 0.9986 x=1525, y=0.6453 2.5 0.023 0.00465 0.9990 x=1452, y=0.6442 2.8
Journal of Agricultural Technology 2012, Vol. 8(3): 795-810
805
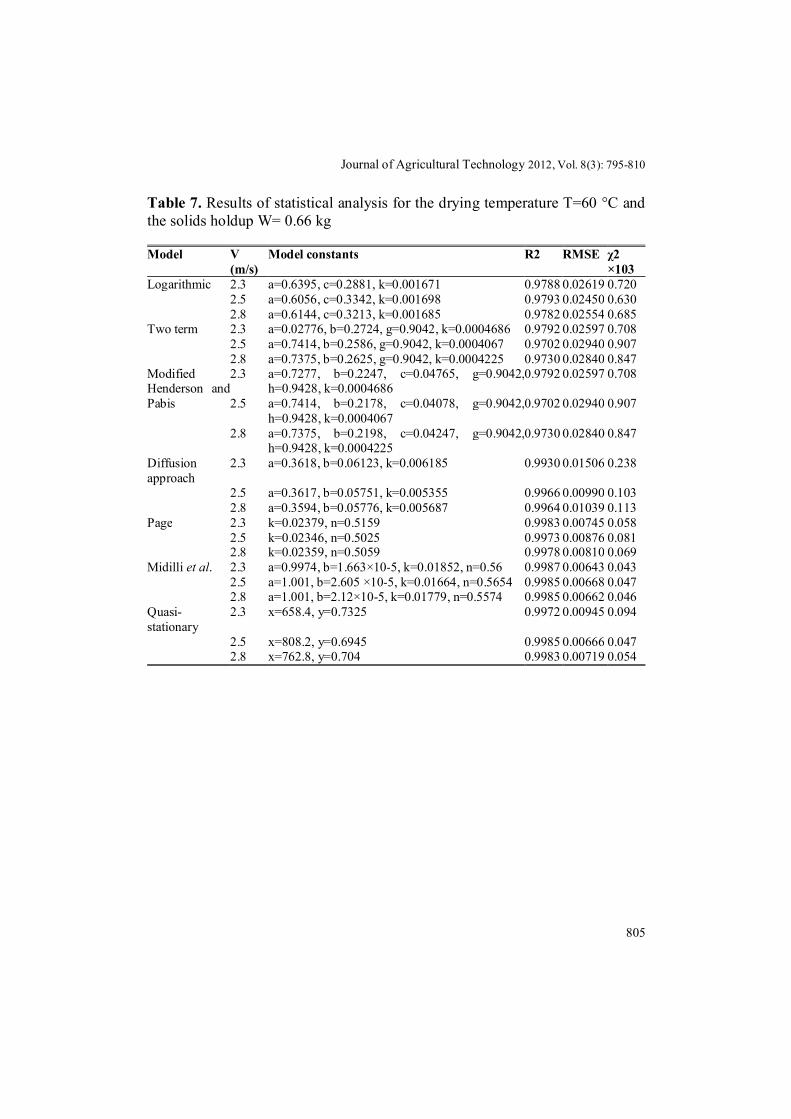
Table 7. Results of statistical analysis for the drying temperature T=60 °C and the solids holdup W= 0.66 kg
χ2 ×10³
RMSE R2 Model constants V (m/s)
Model
0.720 0.02619 0.9788 a=0.6395, c=0.2881, k=0.001671 2.3 Logarithmic 0.630 0.02450 0.9793 a=0.6056, c=0.3342, k=0.001698 2.5 0.685 0.02554 0.9782 a=0.6144, c=0.3213, k=0.001685 2.8 0.708 0.02597 0.9792 a=0.02776, b=0.2724, g=0.9042, k=0.0004686 2.3 Two term 0.907 0.02940 0.9702 a=0.7414, b=0.2586, g=0.9042, k=0.0004067 2.5 0.847 0.02840 0.9730 a=0.7375, b=0.2625, g=0.9042, k=0.0004225 2.8 0.708 0.02597 0.9792 a=0.7277, b=0.2247, c=0.04765, g=0.9042,
h=0.9428, k=0.0004686 2.3 Modified
Henderson and Pabis 0.907 0.02940 0.9702 a=0.7414, b=0.2178, c=0.04078, g=0.9042,
h=0.9428, k=0.0004067 2.5
0.847 0.02840 0.9730 a=0.7375, b=0.2198, c=0.04247, g=0.9042, h=0.9428, k=0.0004225
2.8
0.238 0.01506 0.9930 a=0.3618, b=0.06123, k=0.006185 2.3 Diffusion approach
0.103 0.00990 0.9966 a=0.3617, b=0.05751, k=0.005355 2.5 0.113 0.01039 0.9964 a=0.3594, b=0.05776, k=0.005687 2.8 0.058 0.00745 0.9983 k=0.02379, n=0.5159 2.3 Page 0.081 0.00876 0.9973 k=0.02346, n=0.5025 2.5 0.069 0.00810 0.9978 k=0.02359, n=0.5059 2.8 0.043 0.00643 0.9987 a=0.9974, b=1.663×10⁻⁵, k=0.01852, n=0.56 2.3 Midilli et al. 0.047 0.00668 0.9985 a=1.001, b=2.605 ×10⁻⁵, k=0.01664, n=0.5654 2.5 0.046 0.00662 0.9985 a=1.001, b=2.12×10⁻⁵, k=0.01779, n=0.5574 2.8 0.094 0.00945 0.9972 x=658.4, y=0.7325 2.3 Quasi-
stationary 0.047 0.00666 0.9985 x=808.2, y=0.6945 2.5 0.054 0.00719 0.9983 x=762.8, y=0.704 2.8
806
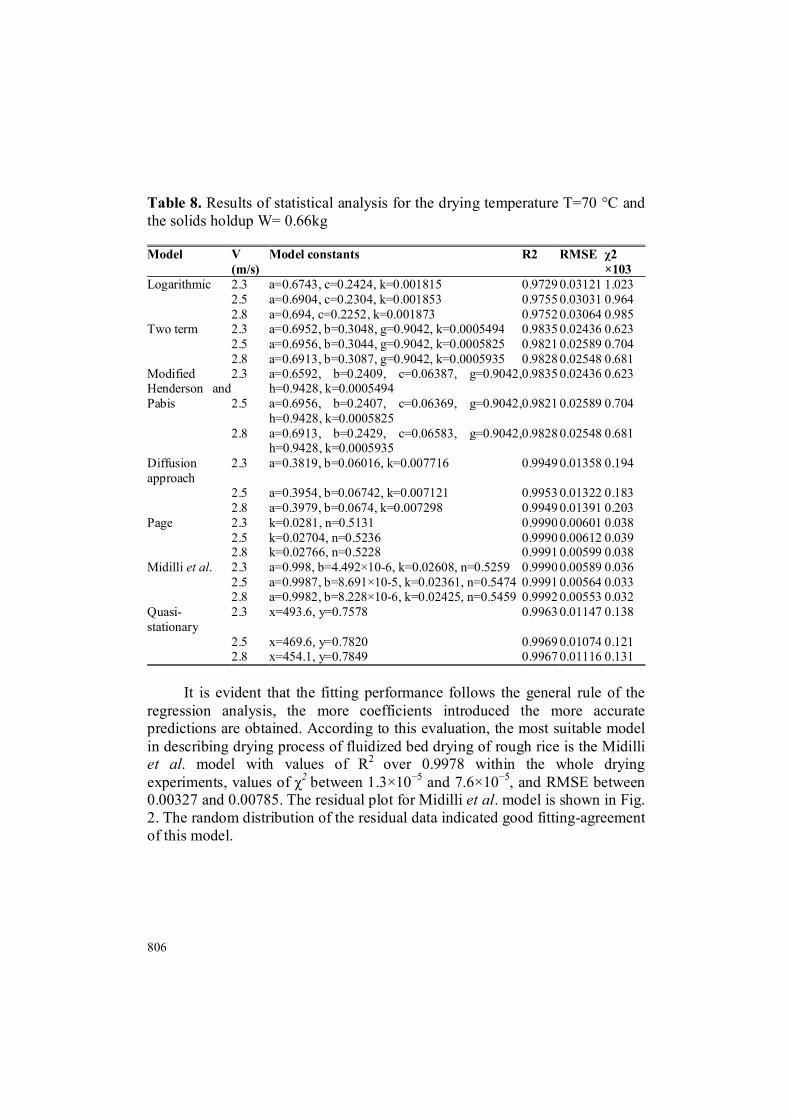
Table 8. Results of statistical analysis for the drying temperature T=70 °C and the solids holdup W= 0.66kg
χ2 ×10³
RMSE R2 Model constants V (m/s)
Model
1.023 0.03121 0.9729 a=0.6743, c=0.2424, k=0.001815 2.3 Logarithmic 0.964 0.03031 0.9755 a=0.6904, c=0.2304, k=0.001853 2.5 0.985 0.03064 0.9752 a=0.694, c=0.2252, k=0.001873 2.8 0.623 0.02436 0.9835 a=0.6952, b=0.3048, g=0.9042, k=0.0005494 2.3 Two term 0.704 0.02589 0.9821 a=0.6956, b=0.3044, g=0.9042, k=0.0005825 2.5 0.681 0.02548 0.9828 a=0.6913, b=0.3087, g=0.9042, k=0.0005935 2.8 0.623 0.02436 0.9835 a=0.6592, b=0.2409, c=0.06387, g=0.9042,
h=0.9428, k=0.0005494 2.3 Modified
Henderson and Pabis 0.704 0.02589 0.9821 a=0.6956, b=0.2407, c=0.06369, g=0.9042,
h=0.9428, k=0.0005825 2.5
0.681 0.02548 0.9828 a=0.6913, b=0.2429, c=0.06583, g=0.9042, h=0.9428, k=0.0005935
2.8
0.194 0.01358 0.9949 a=0.3819, b=0.06016, k=0.007716 2.3 Diffusion approach
0.183 0.01322 0.9953 a=0.3954, b=0.06742, k=0.007121 2.5 0.203 0.01391 0.9949 a=0.3979, b=0.0674, k=0.007298 2.8 0.038 0.00601 0.9990 k=0.0281, n=0.5131 2.3 Page 0.039 0.00612 0.9990 k=0.02704, n=0.5236 2.5 0.038 0.00599 0.9991 k=0.02766, n=0.5228 2.8 0.036 0.00589 0.9990 a=0.998, b=4.492×10⁻⁶, k=0.02608, n=0.5259 2.3 Midilli et al. 0.033 0.00564 0.9991 a=0.9987, b=8.691×10⁻⁵, k=0.02361, n=0.5474 2.5 0.032 0.00553 0.9992 a=0.9982, b=8.228×10⁻⁶, k=0.02425, n=0.5459 2.8 0.138 0.01147 0.9963 x=493.6, y=0.7578 2.3 Quasi-
stationary 0.121 0.01074 0.9969 x=469.6, y=0.7820 2.5 0.131 0.01116 0.9967 x=454.1, y=0.7849 2.8
It is evident that the fitting performance follows the general rule of the
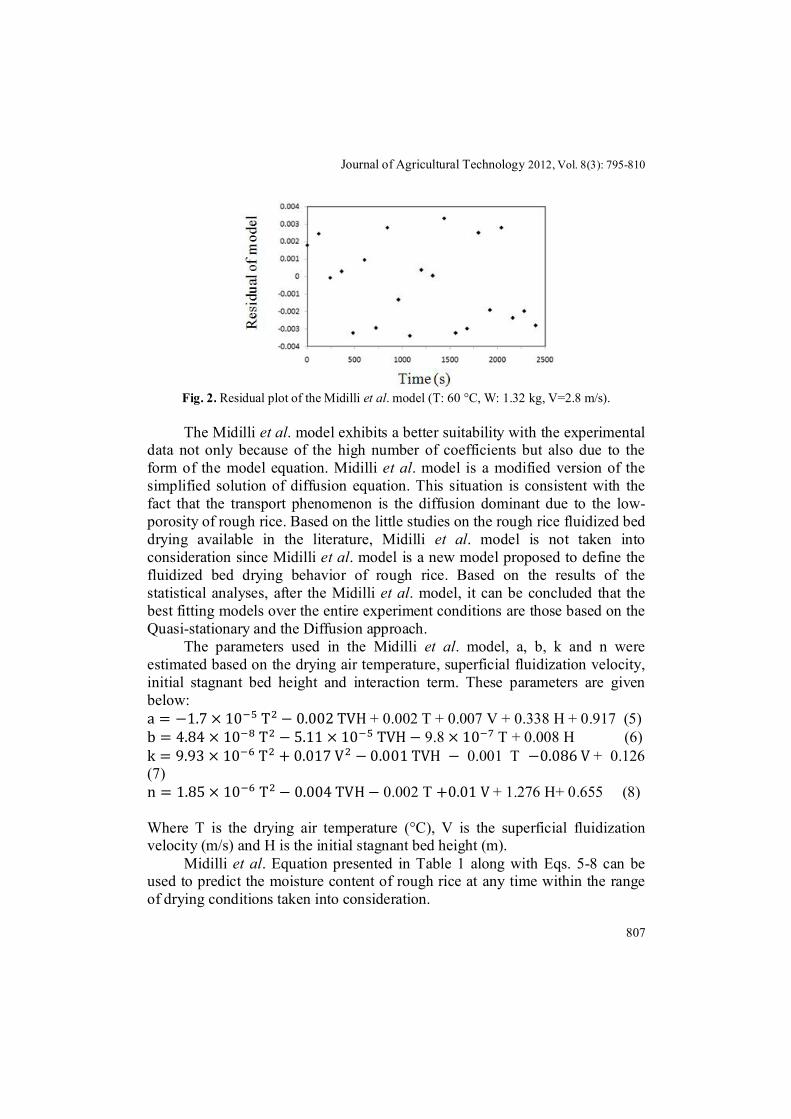
regression analysis, the more coefficients introduced the more accurate predictions are obtained. According to this evaluation, the most suitable model in describing drying process of fluidized bed drying of rough rice is the Midilli et al. model with values of R2 over 0.9978 within the whole drying experiments, values of χ2 between 1.3×10⁻⁵ and 7.6×10⁻⁵, and RMSE between 0.00327 and 0.00785. The residual plot for Midilli et al. model is shown in Fig. 2. The random distribution of the residual data indicated good fitting-agreement of this model.
Journal of Agricultural Technology 2012, Vol. 8(3): 795-810
807
Fig. 2. Residual plot of the Midilli et al. model (T: 60 °C, W: 1.32 kg, V=2.8 m/s).
The Midilli et al. model exhibits a better suitability with the experimental
data not only because of the high number of coefficients but also due to the form of the model equation. Midilli et al. model is a modified version of the simplified solution of diffusion equation. This situation is consistent with the fact that the transport phenomenon is the diffusion dominant due to the low-porosity of rough rice. Based on the little studies on the rough rice fluidized bed drying available in the literature, Midilli et al. model is not taken into consideration since Midilli et al. model is a new model proposed to define the fluidized bed drying behavior of rough rice. Based on the results of the statistical analyses, after the Midilli et al. model, it can be concluded that the best fitting models over the entire experiment conditions are those based on the Quasi-stationary and the Diffusion approach.
The parameters used in the Midilli et al. model, a, b, k and n were estimated based on the drying air temperature, superficial fluidization velocity, initial stagnant bed height and interaction term. These parameters are given below: a = −1.7 × 10 T − 0.002 TVH + 0.002 T + 0.007 V + 0.338 H + 0.917 (5) b = 4.84 × 10 T − 5.11 × 10 TVH − 9.8 × 10 T + 0.008 H (6) k = 9.93 × 10 T + 0.017 V − 0.001 TVH − 0.001 T −0.086 V + 0.126 (7) n = 1.85 × 10 T − 0.004 TVH − 0.002 T +0.01 V + 1.276 H+ 0.655 (8) Where T is the drying air temperature (°C), V is the superficial fluidization velocity (m/s) and H is the initial stagnant bed height (m).
Midilli et al. Equation presented in Table 1 along with Eqs. 5-8 can be used to predict the moisture content of rough rice at any time within the range of drying conditions taken into consideration.
808
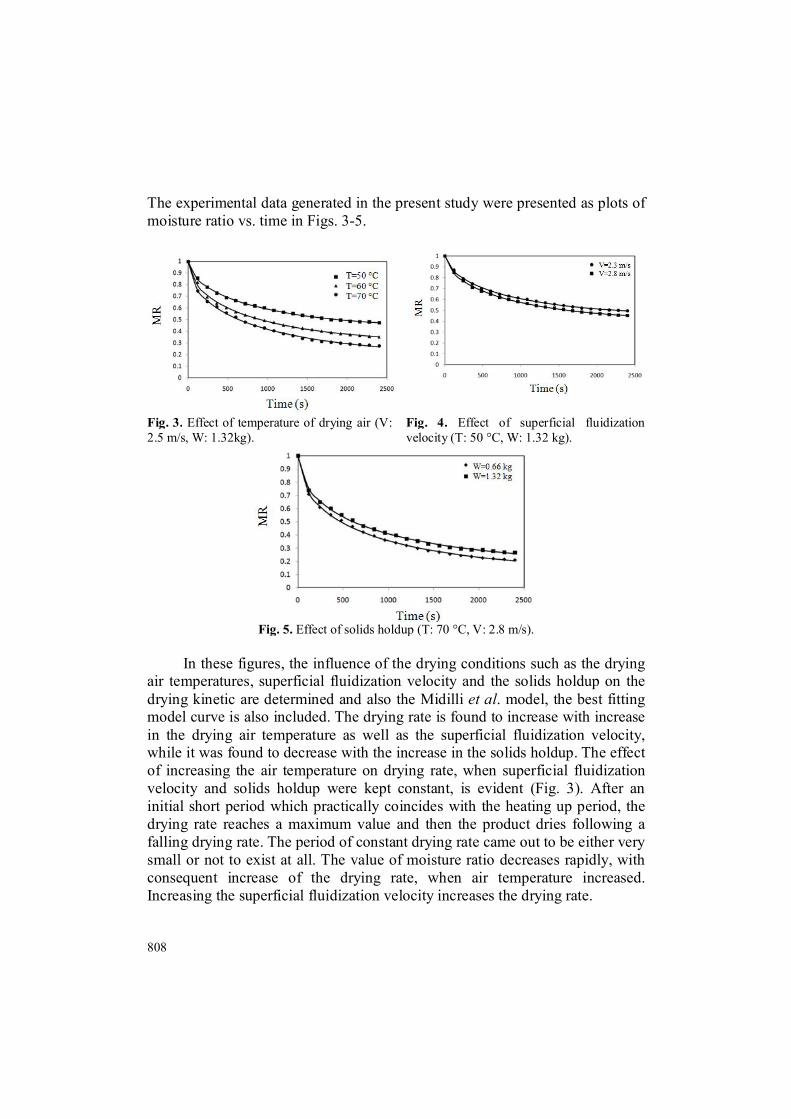
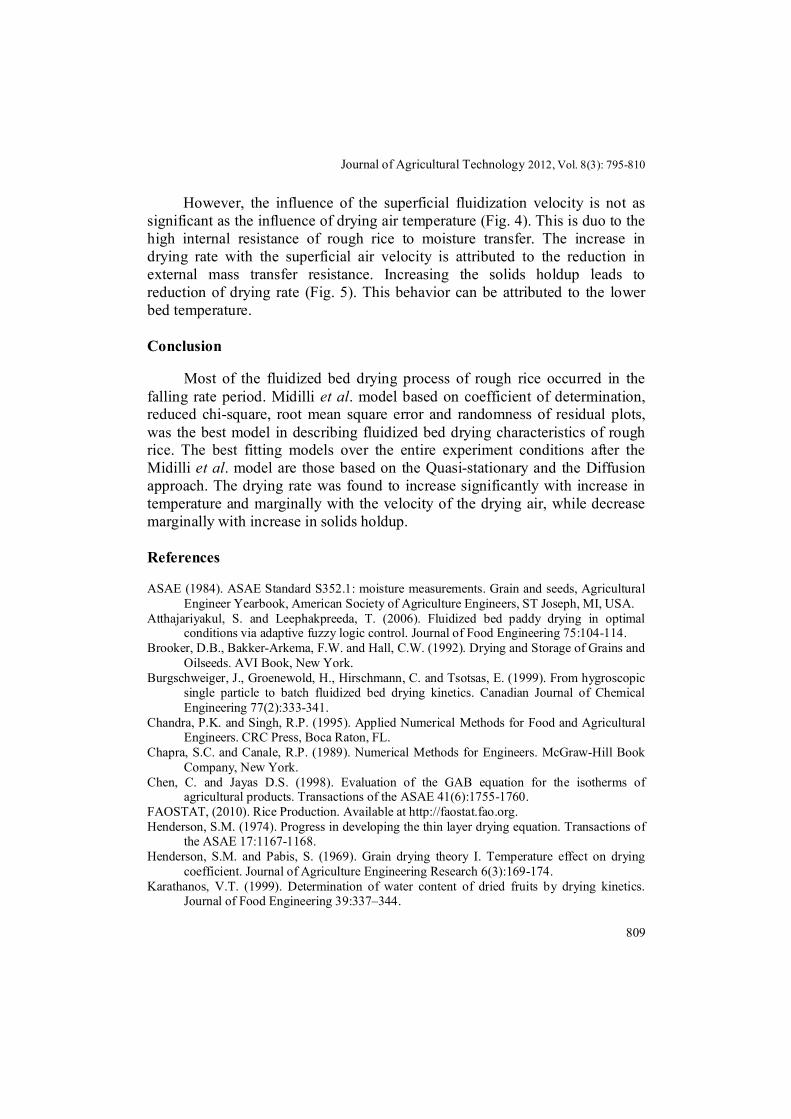
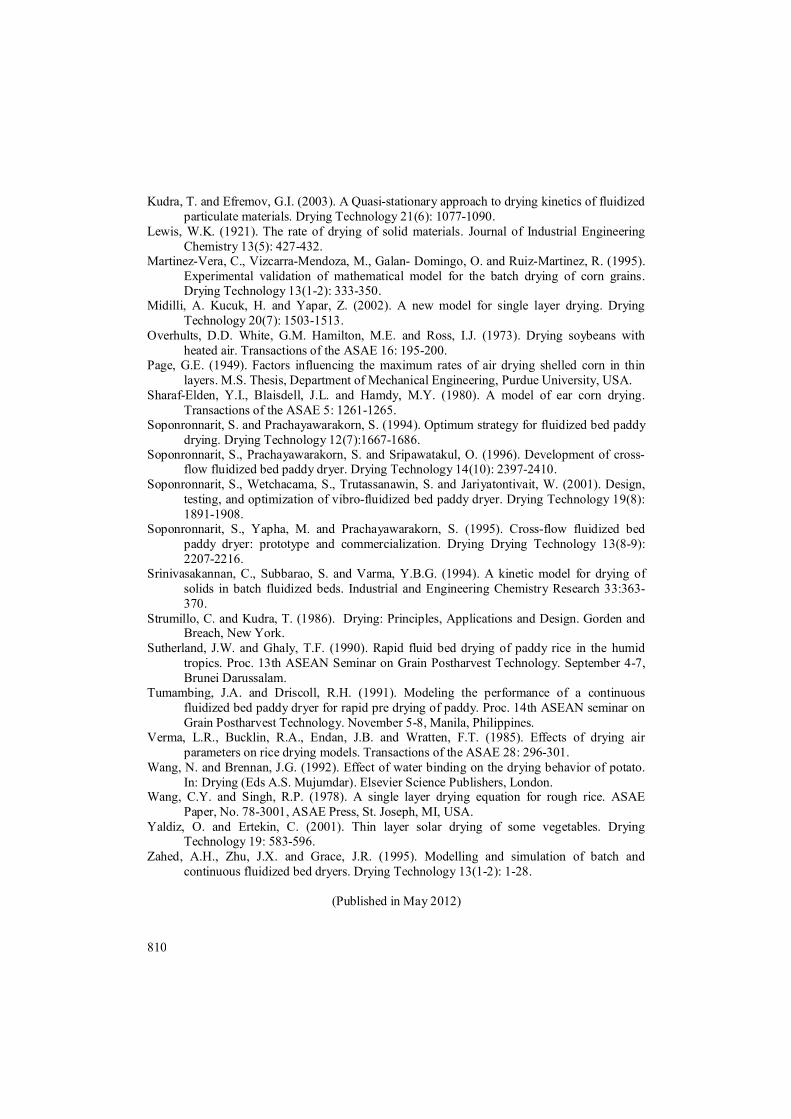
The experimental data generated in the present study were presented as plots of moisture ratio vs. time in Figs. 3-5.
Fig. 3. Effect of temperature of drying air (V: 2.5 m/s, W: 1.32kg).
Fig. 4. Effect of superficial fluidization velocity (T: 50 °C, W: 1.32 kg).
Fig. 5. Effect of solids holdup (T: 70 °C, V: 2.8 m/s).
In these figures, the influence of the drying conditions such as the drying
air temperatures, superficial fluidization velocity and the solids holdup on the drying kinetic are determined and also the Midilli et al. model, the best fitting model curve is also included. The drying rate is found to increase with increase in the drying air temperature as well as the superficial fluidization velocity, while it was found to decrease with the increase in the solids holdup. The effect of increasing the air temperature on drying rate, when superficial fluidization velocity and solids holdup were kept constant, is evident (Fig. 3). After an initial short period which practically coincides with the heating up period, the drying rate reaches a maximum value and then the product dries following a falling drying rate. The period of constant drying rate came out to be either very small or not to exist at all. The value of moisture ratio decreases rapidly, with consequent increase of the drying rate, when air temperature increased. Increasing the superficial fluidization velocity increases the drying rate.
Journal of Agricultural Technology 2012, Vol. 8(3): 795-810
809
However, the influence of the superficial fluidization velocity is not as significant as the influence of drying air temperature (Fig. 4). This is duo to the high internal resistance of rough rice to moisture transfer. The increase in drying rate with the superficial air velocity is attributed to the reduction in external mass transfer resistance. Increasing the solids holdup leads to reduction of drying rate (Fig. 5). This behavior can be attributed to the lower bed temperature. Conclusion
Most of the fluidized bed drying process of rough rice occurred in the falling rate period. Midilli et al. model based on coefficient of determination, reduced chi-square, root mean square error and randomness of residual plots, was the best model in describing fluidized bed drying characteristics of rough rice. The best fitting models over the entire experiment conditions after the Midilli et al. model are those based on the Quasi-stationary and the Diffusion approach. The drying rate was found to increase significantly with increase in temperature and marginally with the velocity of the drying air, while decrease marginally with increase in solids holdup. References ASAE (1984). ASAE Standard S352.1: moisture measurements. Grain and seeds, Agricultural
Engineer Yearbook, American Society of Agriculture Engineers, ST Joseph, MI, USA. Atthajariyakul, S. and Leephakpreeda, T. (2006). Fluidized bed paddy drying in optimal
conditions via adaptive fuzzy logic control. Journal of Food Engineering 75:104-114. Brooker, D.B., Bakker-Arkema, F.W. and Hall, C.W. (1992). Drying and Storage of Grains and
Oilseeds. AVI Book, New York. Burgschweiger, J., Groenewold, H., Hirschmann, C. and Tsotsas, E. (1999). From hygroscopic
single particle to batch fluidized bed drying kinetics. Canadian Journal of Chemical Engineering 77(2):333-341.
Chandra, P.K. and Singh, R.P. (1995). Applied Numerical Methods for Food and Agricultural Engineers. CRC Press, Boca Raton, FL.
Chapra, S.C. and Canale, R.P. (1989). Numerical Methods for Engineers. McGraw-Hill Book Company, New York.
Chen, C. and Jayas D.S. (1998). Evaluation of the GAB equation for the isotherms of agricultural products. Transactions of the ASAE 41(6):1755-1760.
FAOSTAT, (2010). Rice Production. Available at http://faostat.fao.org. Henderson, S.M. (1974). Progress in developing the thin layer drying equation. Transactions of
the ASAE 17:1167-1168. Henderson, S.M. and Pabis, S. (1969). Grain drying theory I. Temperature effect on drying
coefficient. Journal of Agriculture Engineering Research 6(3):169-174. Karathanos, V.T. (1999). Determination of water content of dried fruits by drying kinetics.
Journal of Food Engineering 39:337–344.
810
Kudra, T. and Efremov, G.I. (2003). A Quasi-stationary approach to drying kinetics of fluidized particulate materials. Drying Technology 21(6): 1077-1090.
Lewis, W.K. (1921). The rate of drying of solid materials. Journal of Industrial Engineering Chemistry 13(5): 427-432.
Martinez-Vera, C., Vizcarra-Mendoza, M., Galan- Domingo, O. and Ruiz-Martinez, R. (1995). Experimental validation of mathematical model for the batch drying of corn grains. Drying Technology 13(1-2): 333-350.
Midilli, A. Kucuk, H. and Yapar, Z. (2002). A new model for single layer drying. Drying Technology 20(7): 1503-1513.
Overhults, D.D. White, G.M. Hamilton, M.E. and Ross, I.J. (1973). Drying soybeans with heated air. Transactions of the ASAE 16: 195-200.
Page, G.E. (1949). Factors influencing the maximum rates of air drying shelled corn in thin layers. M.S. Thesis, Department of Mechanical Engineering, Purdue University, USA.
Sharaf-Elden, Y.I., Blaisdell, J.L. and Hamdy, M.Y. (1980). A model of ear corn drying. Transactions of the ASAE 5: 1261-1265.
Soponronnarit, S. and Prachayawarakorn, S. (1994). Optimum strategy for fluidized bed paddy drying. Drying Technology 12(7):1667-1686.
Soponronnarit, S., Prachayawarakorn, S. and Sripawatakul, O. (1996). Development of cross-flow fluidized bed paddy dryer. Drying Technology 14(10): 2397-2410.
Soponronnarit, S., Wetchacama, S., Trutassanawin, S. and Jariyatontivait, W. (2001). Design, testing, and optimization of vibro-fluidized bed paddy dryer. Drying Technology 19(8): 1891-1908.
Soponronnarit, S., Yapha, M. and Prachayawarakorn, S. (1995). Cross-flow fluidized bed paddy dryer: prototype and commercialization. Drying Drying Technology 13(8-9): 2207-2216.
Srinivasakannan, C., Subbarao, S. and Varma, Y.B.G. (1994). A kinetic model for drying of solids in batch fluidized beds. Industrial and Engineering Chemistry Research 33:363-370.
Strumillo, C. and Kudra, T. (1986). Drying: Principles, Applications and Design. Gorden and Breach, New York.
Sutherland, J.W. and Ghaly, T.F. (1990). Rapid fluid bed drying of paddy rice in the humid tropics. Proc. 13th ASEAN Seminar on Grain Postharvest Technology. September 4-7, Brunei Darussalam.
Tumambing, J.A. and Driscoll, R.H. (1991). Modeling the performance of a continuous fluidized bed paddy dryer for rapid pre drying of paddy. Proc. 14th ASEAN seminar on Grain Postharvest Technology. November 5-8, Manila, Philippines.
Verma, L.R., Bucklin, R.A., Endan, J.B. and Wratten, F.T. (1985). Effects of drying air parameters on rice drying models. Transactions of the ASAE 28: 296-301.
Wang, N. and Brennan, J.G. (1992). Effect of water binding on the drying behavior of potato. In: Drying (Eds A.S. Mujumdar). Elsevier Science Publishers, London.
Wang, C.Y. and Singh, R.P. (1978). A single layer drying equation for rough rice. ASAE Paper, No. 78-3001, ASAE Press, St. Joseph, MI, USA.
Yaldiz, O. and Ertekin, C. (2001). Thin layer solar drying of some vegetables. Drying Technology 19: 583-596.
Zahed, A.H., Zhu, J.X. and Grace, J.R. (1995). Modelling and simulation of batch and continuous fluidized bed dryers. Drying Technology 13(1-2): 1-28.
(Published in May 2012)