E101-3161A - Bubbling Fluidized-Bed Boilers - Windsor Energy
FINAL TECHNICAL REPORT September 1, 2006, through August 31, 2007
Project Title: FLUIDIZED BED DRYING OF HIGH MOISTURE ILLINOIS
COALS USING POWER PLANT WASTE HEAT: PHASE I ICCI Project Number: 06-1/2.1A-1 Principal Investigator: Dr. Edward K. Levy, Energy Research Center, Lehigh University Other Investigators: Dr. Nenad Sarunac and Mr. Wei-Cheng Wang, Energy Research
Center, Lehigh University Project Manager: Joseph C. Hirschi, ICCI
ABSTRACT Previous research carried out by the authors on high-moisture, low-rank-coals from the western U.S. show that using power plant waste heat to partially dry coals prior to firing them in boilers can result in improvements in power plant heat rate, reductions in stack emissions and reductions in maintenance costs. The present project, which extended the research on coal drying to high moisture Illinois coals, consisted of laboratory drying tests performed to measure rates of drying as a function of coal dryer process conditions and computer analyses carried out to predict coal product moisture and heat flux requirements as functions of drying temperature. The laboratory drying experiments were carried out with coals from the Buckheart, Crown 2 and Viper mines. With drying temperatures from 110 to 140°F, the measured moisture content of the Crown 2 coal was reduced to 20 percent of the initial moisture within 15 to 20 minutes, the Viper coal required from 18 to 33 minutes for an 80 percent moisture reduction, and the Buckheart coal required 20 to 28 minutes. Batch bed drying tests provided coal-specific data on drying characteristics needed to simulate the drying behavior of these coals in continuously operating coal dryers. Computer simulations were performed to determine the effects of drying temperature on coal product moisture and required rates of in-bed heat transfer for a commercial scale dryer of fixed size and fixed coal and air feed rates. Predicted results show the coal product moisture decreases sharply with higher drying temperatures while the required in-bed heat transfer increases to accommodate larger rates of moisture removal. A series of simulations was also performed in which drying characteristics of the three Illinois coals and a North Dakota lignite were compared. Predicted results all show that the three Illinois coals would dry more easily than the lignite, which, for the Illinois coals, would translate into smaller or fewer fluidized beds and less fluidizing air to achieve a target coal product moisture content.
EXECUTIVE SUMMARY Some mines in Illinois produce coal with unusually high inherent moisture levels. For example, typical as-shipped moisture of Illinois #6 coal from the Crown 2 and 3 mines is in the 16 to 17 percent range. When used as a fuel in coal-fired power plants, fuel moisture levels this high adversely affect power plant heat rate and emissions of pollutants and can also cause fuel handling and maintenance problems. The authors have been carrying out research on fluidized bed thermal drying of low rank Western U.S. coals where the energy for drying is obtained from power plant waste heat. The research results show that partial drying of the coal can improve heat rate, reduce stack emissions, and reduce maintenance problems in the fuel delivery system. Cost studies by Great River Energy of a site specific lignite drying system show that use of power plant waste heat for drying is quite cost effective. The present project, which is the first phase of a multi-phase effort, extended the coal drying database from low rank Western fuels to high-moisture Illinois coals. The questions which were answered are:
• How are the drying rates of high moisture Illinois coals affected by coal dryer
process conditions? • Does drying rate vary from one high moisture Illinois coal to another? • How much waste heat would be needed per ton of Illinois coal?
To answer these questions, laboratory drying tests were performed to measure rates of drying as a function of coal dryer process conditions and computer analyses were carried out to predict heat flux requirements and coal product moisture as functions of drying temperature. Fluidization and drying characteristics of coals from the Buckheart, Crown 2 and Viper mines were determined in drying tests carried out in a batch operated fluidized bed. All three coals had a wide size distribution, with a top size of ¼ inch. The coal from the Crown 2 mine, an Illinois #6 coal, had been sampled both before and after the centrifugal dryer in the mine’s coal prep plant. The “before” coal, with 0.54 to 0.60 lb H2O/lb dry coal was too cohesive to be fluidized, and tests showed the coal needed to be reduced in moisture to less than 0.24 lb H2O/lb dry coal for fluidization to occur. The “after” Crown 2 coal had a moisture content of 0.18 to 0.20 lb H2O/lb dry coal and was easily fluidized. The coal from the Buckheart mine, a reject from an old coal cleaning operation and also an Illinois #6 coal, had 0.24 to 0.26 lb H2O/lb dry coal and was easily fluidized. The Illinois #5 coal, obtained from the Viper mine, had approximately 0.21 lb H2O/lb dry coal and this, too, was easily fluidized. Batch bed drying experiments were carried out for all three coals at in-bed heater and inlet air temperatures ranging from 110 to 140°F. The data show that, as expected, the drying rate increased with an increase in drying temperature. The moisture content of the Crown 2 coal was reduced to 20 percent of the initial moisture within 15 to 20 minutes,
the Viper coal required from 18 to 33 minutes for an 80 percent moisture reduction, and the Buckheart coal required 20 to 28 minutes, all depending on the temperature. Batch bed drying tests provided coal-specific data on drying characteristics needed to simulate the drying behavior of these coals in continuously operating coal dryers. Computer simulations were performed to determine the effects of drying temperature on product moisture and required rates of in-bed heat transfer for a dryer of fixed size and fixed coal and air feed rates. The results show the strong effects of using higher drying temperatures on coal product moisture and rate of in-bed heat transfer. The predicted coal product moisture decreases sharply with higher drying temperatures while the required in-bed heat transfer increases to accommodate larger rates of moisture removal. A series of simulations was also performed in which the drying characteristics of the three Illinois coals and a North Dakota lignite were compared. The predicted results all show that the three Illinois coals would dry more easily than the lignite, which, for the Illinois coals, would translate into smaller or fewer fluidized beds and less fluidizing air to achieve a target coal product moisture content.
1
OBJECTIVES The present study is the initial phase of a multi-phase effort to determine the technical feasibility and potential economic benefits of drying high moisture Illinois coals using power plant waste heat. The objectives of the present study were to:
• Determine how the drying rates of high moisture Illinois coals are affected by
coal dryer process conditions. • Determine how drying rate varies from one high-moisture Illinois coal to
another. • Determine how much waste heat would be needed per ton of Illinois coal.
INTRODUCTION AND BACKGROUND
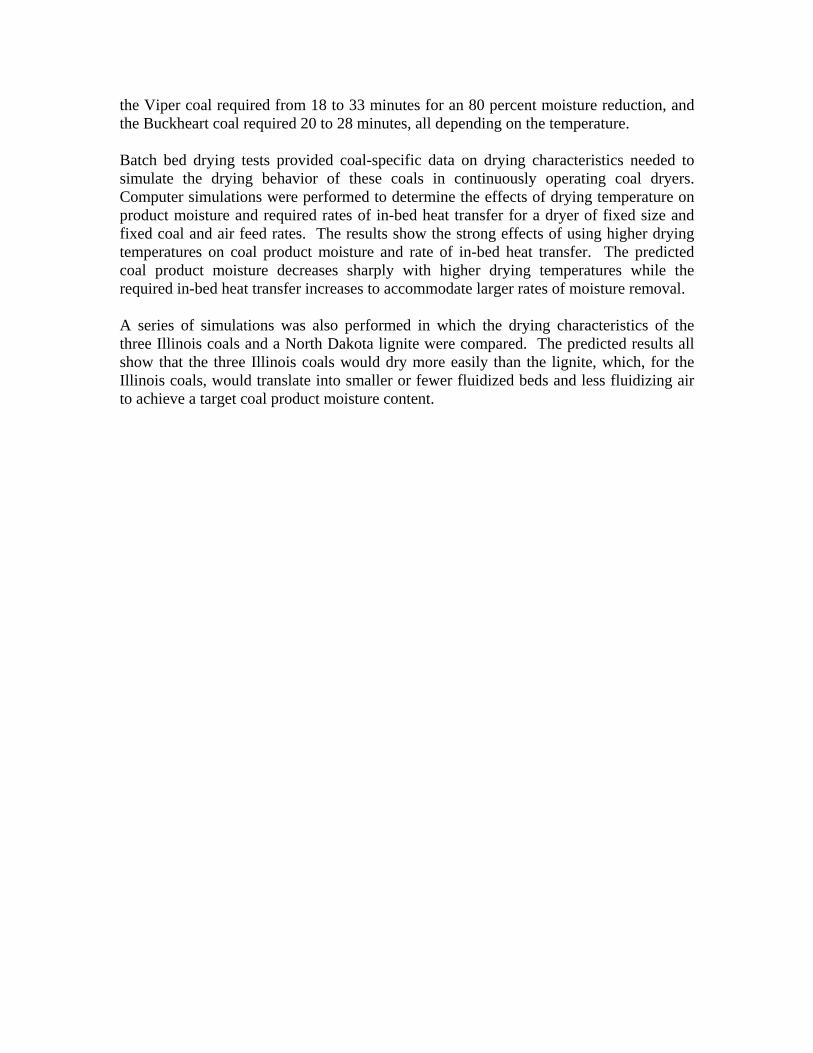
Some mines in Illinois produce coal with relatively high moisture levels for bituminous coals. For example, the typical as-shipped moisture content of Illinois #6 coal from the Crown 2 and 3 mines is in the 16 to 17 percent range. When used as a fuel in coal-fired power plants, fuel moisture levels this high adversely affect power plant heat rate and emissions of pollutants and can also cause fuel handling and maintenance problems. The authors have been carrying out research on fluidized bed thermal drying of low rank Western coals where the energy for drying is obtained from power plant waste heat (Levy, E., N. Sarunac, and H. Bilirgen. 2006). Figure 1 shows one possible drying scheme involving fluidized bed dryers, where waste heat from the steam condenser and boiler is used to preheat the fluidization air and provide additional heat for drying using in-bed heat exchangers. Coal is fed to the dryers and is then transported with reduced moisture to the pulverizers before being conveyed to the burners by transport air. Figure 1: Process Diagram for Drying System Using Hot Circulating Water from Steam Condenser and Heat from the Boiler as Sources of Waste Heat.
2
Moisture Content Versus Time
0
0.1
0.2
0.3
0.4
0.5
0.6
0.7
0 20 40 60 80 100 120 140
Time (min)
Moi
stur
e C
onte
nt (k
g w
t/kg
dry
coal
)
L34
L35
L36
L37
L38
L39
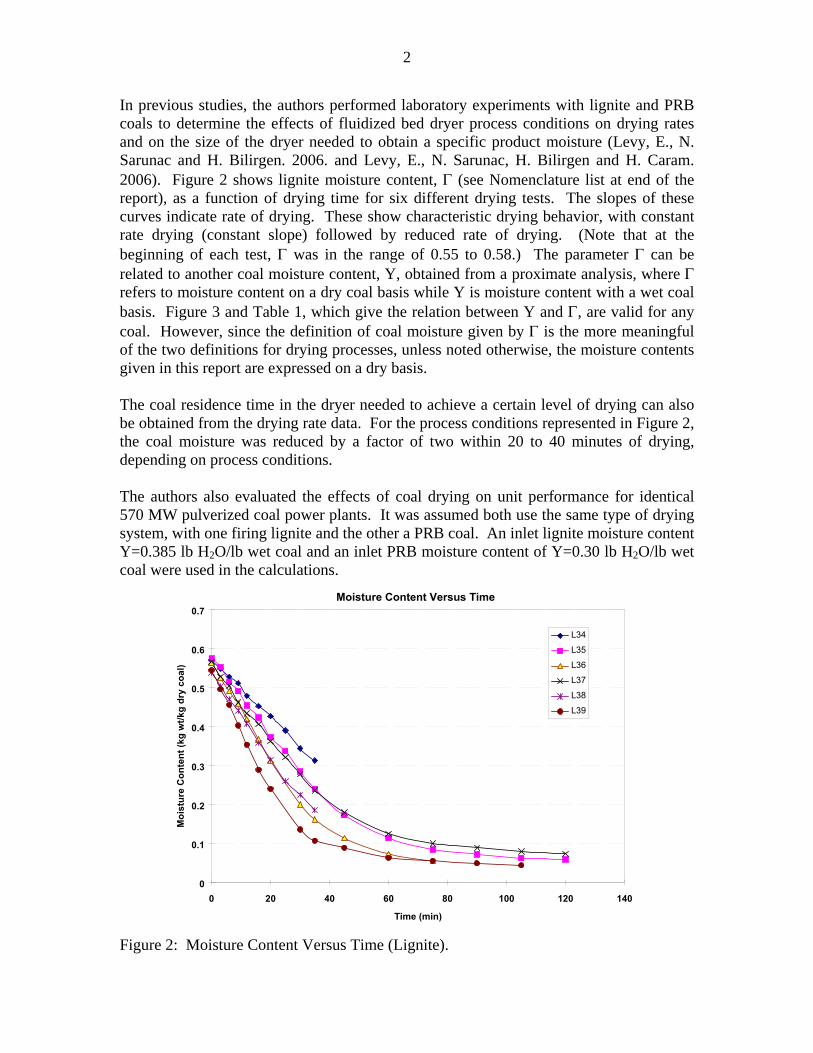
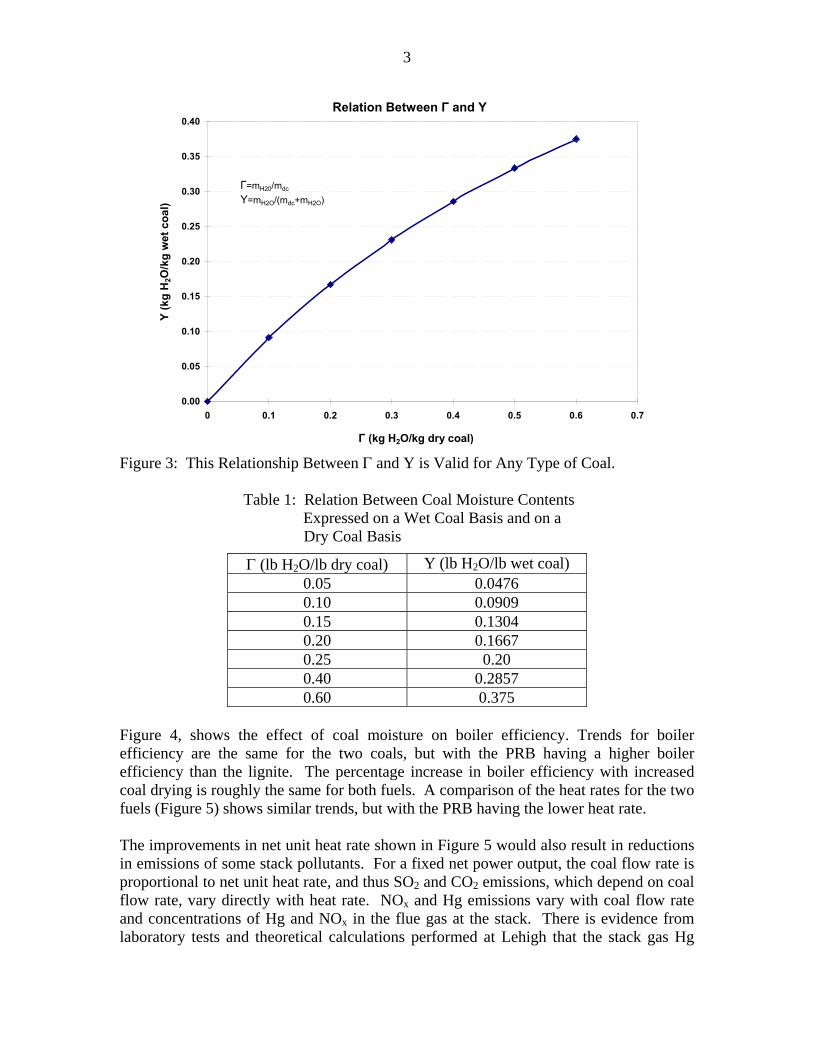
In previous studies, the authors performed laboratory experiments with lignite and PRB coals to determine the effects of fluidized bed dryer process conditions on drying rates and on the size of the dryer needed to obtain a specific product moisture (Levy, E., N. Sarunac and H. Bilirgen. 2006. and Levy, E., N. Sarunac, H. Bilirgen and H. Caram. 2006). Figure 2 shows lignite moisture content, Γ (see Nomenclature list at end of the report), as a function of drying time for six different drying tests. The slopes of these curves indicate rate of drying. These show characteristic drying behavior, with constant rate drying (constant slope) followed by reduced rate of drying. (Note that at the beginning of each test, Γ was in the range of 0.55 to 0.58.) The parameter Γ can be related to another coal moisture content, Y, obtained from a proximate analysis, where Γ refers to moisture content on a dry coal basis while Y is moisture content with a wet coal basis. Figure 3 and Table 1, which give the relation between Y and Γ, are valid for any coal. However, since the definition of coal moisture given by Γ is the more meaningful of the two definitions for drying processes, unless noted otherwise, the moisture contents given in this report are expressed on a dry basis. The coal residence time in the dryer needed to achieve a certain level of drying can also be obtained from the drying rate data. For the process conditions represented in Figure 2, the coal moisture was reduced by a factor of two within 20 to 40 minutes of drying, depending on process conditions. The authors also evaluated the effects of coal drying on unit performance for identical 570 MW pulverized coal power plants. It was assumed both use the same type of drying system, with one firing lignite and the other a PRB coal. An inlet lignite moisture content Y=0.385 lb H2O/lb wet coal and an inlet PRB moisture content of Y=0.30 lb H2O/lb wet coal were used in the calculations.
Figure 2: Moisture Content Versus Time (Lignite).
3
Figure 3: This Relationship Between Γ and Y is Valid for Any Type of Coal.
Table 1: Relation Between Coal Moisture Contents Expressed on a Wet Coal Basis and on a Dry Coal Basis
Γ (lb H2O/lb dry coal) Y (lb H2O/lb wet coal) 0.05 0.0476 0.10 0.0909 0.15 0.1304 0.20 0.1667 0.25 0.20 0.40 0.2857 0.60 0.375
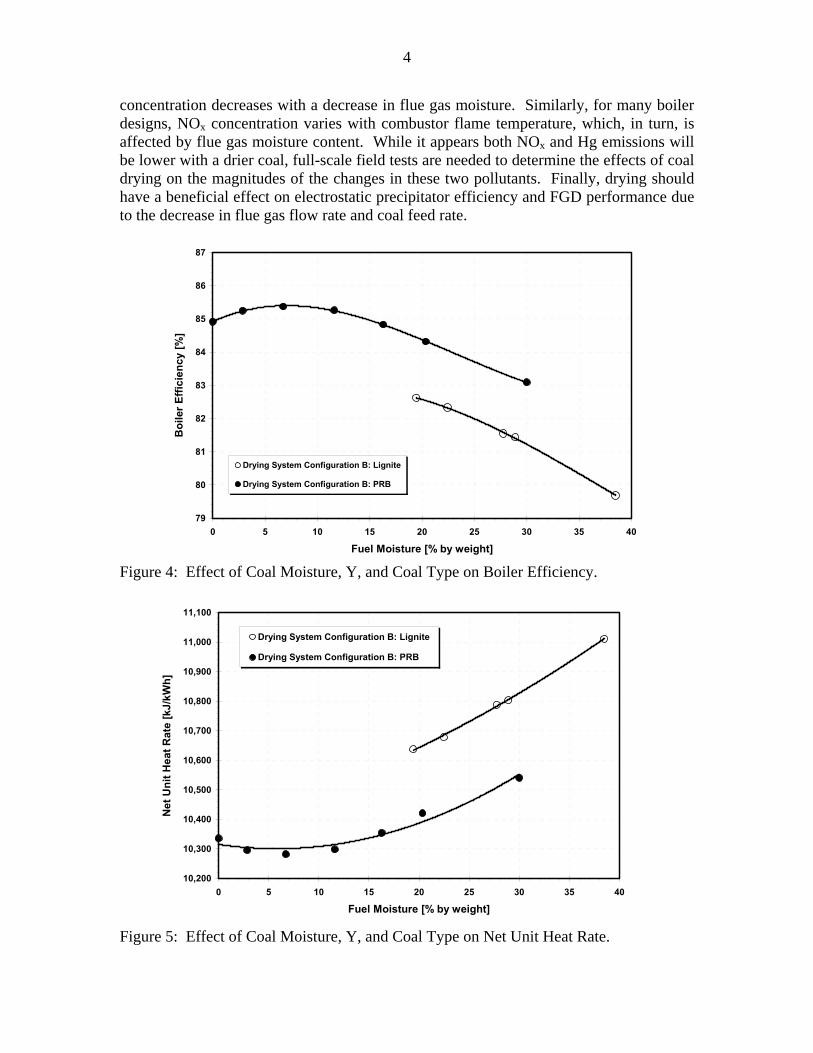
Figure 4, shows the effect of coal moisture on boiler efficiency. Trends for boiler efficiency are the same for the two coals, but with the PRB having a higher boiler efficiency than the lignite. The percentage increase in boiler efficiency with increased coal drying is roughly the same for both fuels. A comparison of the heat rates for the two fuels (Figure 5) shows similar trends, but with the PRB having the lower heat rate. The improvements in net unit heat rate shown in Figure 5 would also result in reductions in emissions of some stack pollutants. For a fixed net power output, the coal flow rate is proportional to net unit heat rate, and thus SO2 and CO2 emissions, which depend on coal flow rate, vary directly with heat rate. NOx and Hg emissions vary with coal flow rate and concentrations of Hg and NOx in the flue gas at the stack. There is evidence from laboratory tests and theoretical calculations performed at Lehigh that the stack gas Hg
Relation Between Γ and Y
0.00
0.05
0.10
0.15
0.20
0.25
0.30
0.35
0.40
0 0.1 0.2 0.3 0.4 0.5 0.6 0.7
Γ (kg H2O/kg dry coal)
Y (k
g H
2O/k
g w
et c
oal)
Γ=mH20/mdc
Y=mH2O/(mdc+mH2O)
4
79
80
81
82
83
84
85
86
87
0 5 10 15 20 25 30 35 40
Fuel Moisture [% by weight]
Boi
ler E
ffici
ency
[%]
Drying System Configuration B: Lignite
Drying System Configuration B: PRB
10,200
10,300
10,400
10,500
10,600
10,700
10,800
10,900
11,000
11,100
0 5 10 15 20 25 30 35 40
Fuel Moisture [% by weight]
Net
Uni
t Hea
t Rat
e [k
J/kW
h]
Drying System Configuration B: Lignite
Drying System Configuration B: PRB
concentration decreases with a decrease in flue gas moisture. Similarly, for many boiler designs, NOx concentration varies with combustor flame temperature, which, in turn, is affected by flue gas moisture content. While it appears both NOx and Hg emissions will be lower with a drier coal, full-scale field tests are needed to determine the effects of coal drying on the magnitudes of the changes in these two pollutants. Finally, drying should have a beneficial effect on electrostatic precipitator efficiency and FGD performance due to the decrease in flue gas flow rate and coal feed rate.
Figure 4: Effect of Coal Moisture, Y, and Coal Type on Boiler Efficiency.
Figure 5: Effect of Coal Moisture, Y, and Coal Type on Net Unit Heat Rate.
5
Rubber Connector/Reducer
Plexiglas Tube
Metal Bed
Distributor
Air Heater
Rotameter
Compressed Air
Metal Ducting
Filter Bag
Plenum
The authors are part of a team led by Great River Energy to develop a full-scale lignite drying system at a 600 MW unit at Coal Creek Station in Underwood, North Dakota (NETL-DOE. 2007). Construction is underway and when it is complete, the drying system will use power plant waste heat to dry all of the coal fed to the pulverizers from an initial moisture of Y = 0.385 to roughly 0.295. Cost studies carried out by Great River Energy show a payback period of less than one year. The present study is the initial phase of a multi-phase effort to determine the technical feasibility and potential economic benefits of drying high moisture Illinois coals using power plant waste heat. This first phase focuses on determining drying characteristics of Illinois coals and using drying data to estimate the thermal energy needed for full-scale commercial dryers.
EXPERIMENTAL PROCEDURE
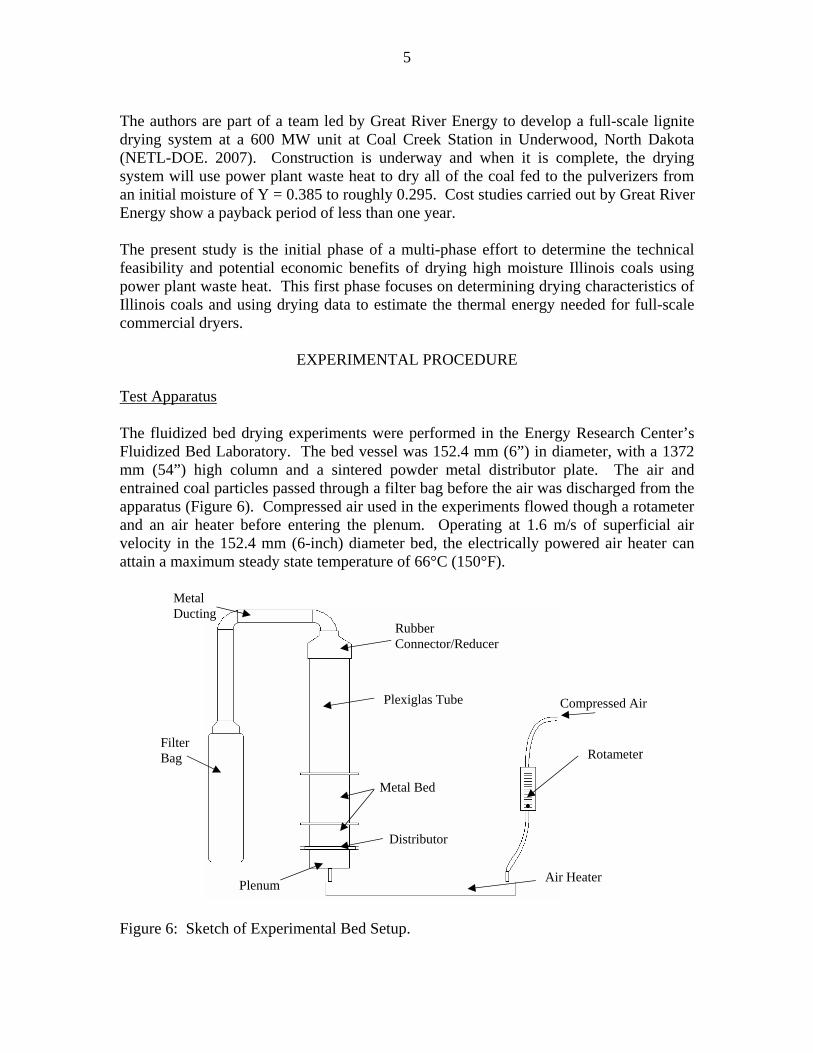
Test Apparatus The fluidized bed drying experiments were performed in the Energy Research Center’s Fluidized Bed Laboratory. The bed vessel was 152.4 mm (6”) in diameter, with a 1372 mm (54”) high column and a sintered powder metal distributor plate. The air and entrained coal particles passed through a filter bag before the air was discharged from the apparatus (Figure 6). Compressed air used in the experiments flowed though a rotameter and an air heater before entering the plenum. Operating at 1.6 m/s of superficial air velocity in the 152.4 mm (6-inch) diameter bed, the electrically powered air heater can attain a maximum steady state temperature of 66°C (150°F). Figure 6: Sketch of Experimental Bed Setup.

6
Thermocouples inserted through the bed wall were used to measure vertical distribution of bed temperature. A horizontal bundle of eighteen electric heating elements was used to provide in-bed heating. The heaters were located in the region from 51 mm (2”) to 304.8 mm (12”) above the distributor and were instrumented with thermocouples to indicate heater surface temperature. At a given heater surface temperature, total heat flux to the bed could be reduced from the maximum by disconnecting selected heaters from the power supply. Test Procedure Batch bed drying tests were performed to determine the effects of fluidized bed process conditions on rate of drying. Small samples of the coal were removed from the bed at selected intervals during the drying tests and coal moisture was measured. This was determined by drying samples of the coal in crucibles in an oven at 110°C for 5 to 6 hours, and weighing the samples before and after drying. The complete test procedure used in these experiments is described in Table 2.
Table 2: Procedure for Drying Tests
1. With no coal in bed, turn on compressor, set air flow to desired value, turn on air preheater and allow system to reach steady-state at desired temperature. Measure inlet relative humidity and dry bulb temperature of air.
2. Once air is at steady-state, turn off air preheater and air flow, load coal into bed, turn on all heaters and air flow to appropriate values, start stopwatch, and record pressure of inlet air from pressure gauge above rotameter.
3. Begin recording temperatures after 5 minutes, collect small samples of coal from bed, measure wet and dry bulb temperatures at exit of bed, record values for temperature readings at each assigned thermocouple, adjust voltage regulators for the heaters so that surface temperatures remain steady at appropriate values, and repeat this procedure for each time interval on data sheet.
4. At end of test, shut off heaters but keep air flow on to cool the heaters, detach filter bag, load coal samples into crucibles, place crucibles into oven, set to 100°C, and leave for 5-6 hours or overnight, remove remaining coal from the bed and weigh it.
5. Analyze results.
During the first minute or two of each test, fines were elutriated from the bed. The drying rates presented in this report are based on the dry coal which remained in the bed after elutriation had occurred and after coal samples had been removed for analysis.

7
Buckheart size distribution
0.00
0.10
0.20
0.30
0.40
0.001<
dp<0.0
139
0.013
9<dp
<0.016
5
0.016
5<dp
<0.019
7
0.019
7<dp
<0.027
8
0.027
8<dp
<0.046
9
0.046
9<dp
<0.055
5
0.055
5<dp
<0.0787
0.078
7<dp
<0.111
0.111
<dp<0.2
5
particle size (in)
wei
ght f
ract
ion
Mean particle size : 0.0563 inches0.25 inches Top size
Crown mine size distribution
0.00
0.10
0.20
0.30
0.40
0.001
<dp<0.0
139
0.013
9<dp
<0.016
5
0.016
5<dp
<0.019
7
0.019
7<dp
<0.027
8
0.027
8<dp
<0.046
9
0.046
9<dp
<0.055
5
0.055
5<dp
<0.0787
0.078
7<dp
<0.111
0.111
<dp<0.2
5
particle size (in)
wei
ght f
ract
ion
Mean particle size : 0.0648 inches0.25 inches Top size
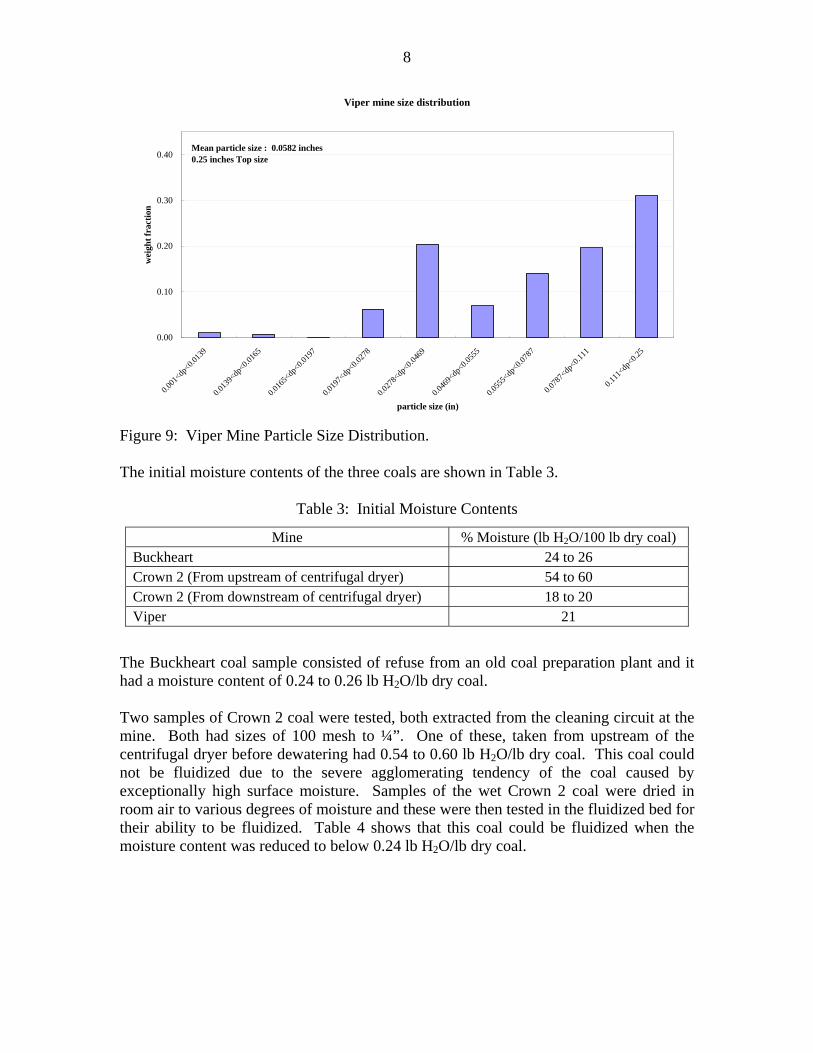
RESULTS AND DISCUSSION Task 1: Laboratory Drying Experiments Size Distributions and Moisture Contents of Coals Tested. The experiments were carried out with Illinois #6 coals from the Buckheart and Crown mines of the Freeman United Coal Mining Company and an Illinois #5 coal from the Viper mine of the International Coal Group. The drying tests were performed with coal samples having wide size distributions, but with a top size of 0.25 inches in all cases. Typical particle size distributions for the three coals are shown in Figures 7 to 9.
Figure 7: Buckheart Particle Size Distribution.
Figure 8: Crown Mine Particle Size Distribution.
8
Viper mine size distribution
0.00
0.10
0.20
0.30
0.40
0.001
<dp<0.0
139
0.013
9<dp
<0.016
5
0.016
5<dp
<0.019
7
0.019
7<dp
<0.027
8
0.027
8<dp
<0.046
9
0.046
9<dp
<0.055
5
0.055
5<dp
<0.078
7
0.078
7<dp
<0.111
0.111
<dp<0.2
5
particle size (in)
wei
ght f
ract
ion
Mean particle size : 0.0582 inches0.25 inches Top size
Figure 9: Viper Mine Particle Size Distribution. The initial moisture contents of the three coals are shown in Table 3.
Table 3: Initial Moisture Contents
Mine % Moisture (lb H2O/100 lb dry coal) Buckheart 24 to 26 Crown 2 (From upstream of centrifugal dryer) 54 to 60 Crown 2 (From downstream of centrifugal dryer) 18 to 20 Viper 21
The Buckheart coal sample consisted of refuse from an old coal preparation plant and it had a moisture content of 0.24 to 0.26 lb H2O/lb dry coal. Two samples of Crown 2 coal were tested, both extracted from the cleaning circuit at the mine. Both had sizes of 100 mesh to ¼”. One of these, taken from upstream of the centrifugal dryer before dewatering had 0.54 to 0.60 lb H2O/lb dry coal. This coal could not be fluidized due to the severe agglomerating tendency of the coal caused by exceptionally high surface moisture. Samples of the wet Crown 2 coal were dried in room air to various degrees of moisture and these were then tested in the fluidized bed for their ability to be fluidized. Table 4 shows that this coal could be fluidized when the moisture content was reduced to below 0.24 lb H2O/lb dry coal.
9
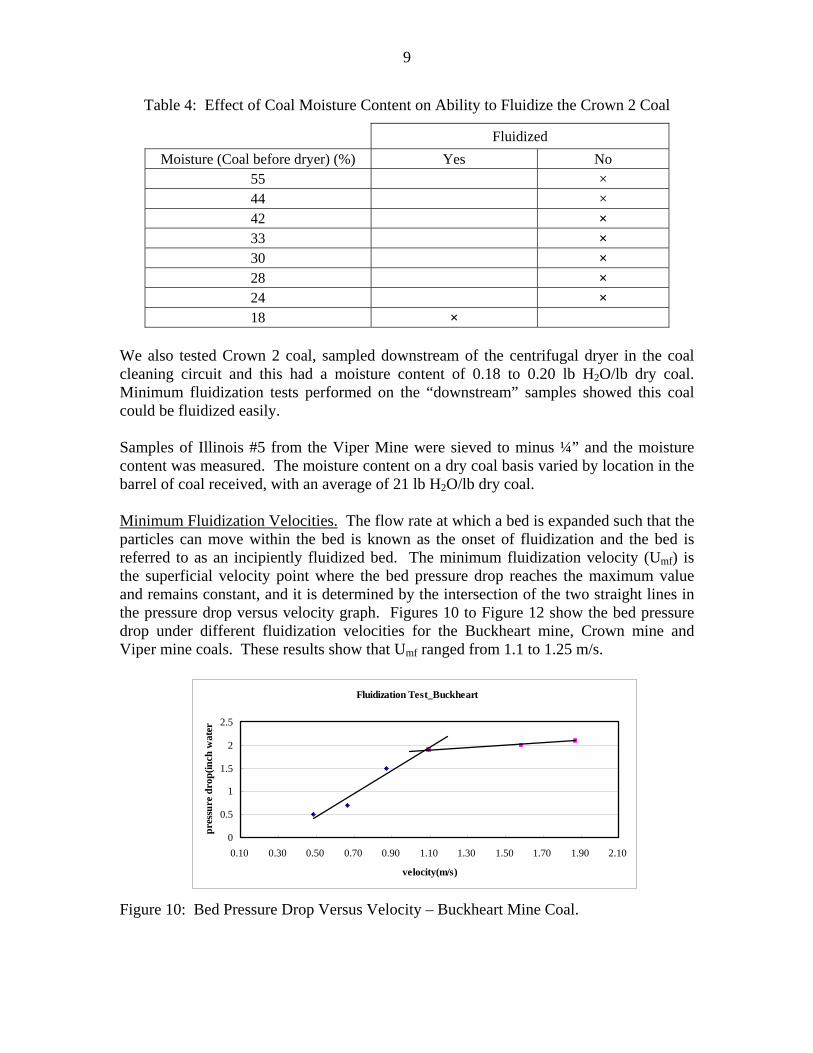
Table 4: Effect of Coal Moisture Content on Ability to Fluidize the Crown 2 Coal
Fluidized Moisture (Coal before dryer) (%) Yes No
55 × 44 × 42 × 33 × 30 × 28 × 24 × 18 ×
We also tested Crown 2 coal, sampled downstream of the centrifugal dryer in the coal cleaning circuit and this had a moisture content of 0.18 to 0.20 lb H2O/lb dry coal. Minimum fluidization tests performed on the “downstream” samples showed this coal could be fluidized easily. Samples of Illinois #5 from the Viper Mine were sieved to minus ¼” and the moisture content was measured. The moisture content on a dry coal basis varied by location in the barrel of coal received, with an average of 21 lb H2O/lb dry coal. Minimum Fluidization Velocities. The flow rate at which a bed is expanded such that the particles can move within the bed is known as the onset of fluidization and the bed is referred to as an incipiently fluidized bed. The minimum fluidization velocity (Umf) is the superficial velocity point where the bed pressure drop reaches the maximum value and remains constant, and it is determined by the intersection of the two straight lines in the pressure drop versus velocity graph. Figures 10 to Figure 12 show the bed pressure drop under different fluidization velocities for the Buckheart mine, Crown mine and Viper mine coals. These results show that Umf ranged from 1.1 to 1.25 m/s.
Fluidization Test_Buckheart
0
0.5
1
1.5
2
2.5
0.10 0.30 0.50 0.70 0.90 1.10 1.30 1.50 1.70 1.90 2.10
velocity(m/s)
pres
sure
dro
p(in
ch w
ater
Figure 10: Bed Pressure Drop Versus Velocity – Buckheart Mine Coal.
10
Fluidization Test _ Crown mine
012345678
0.00 0.20 0.40 0.60 0.80 1.00 1.20 1.40 1.60 1.80 2.00
Velocity(m/s)
Pres
sure
dro
p (in
ch w
ater
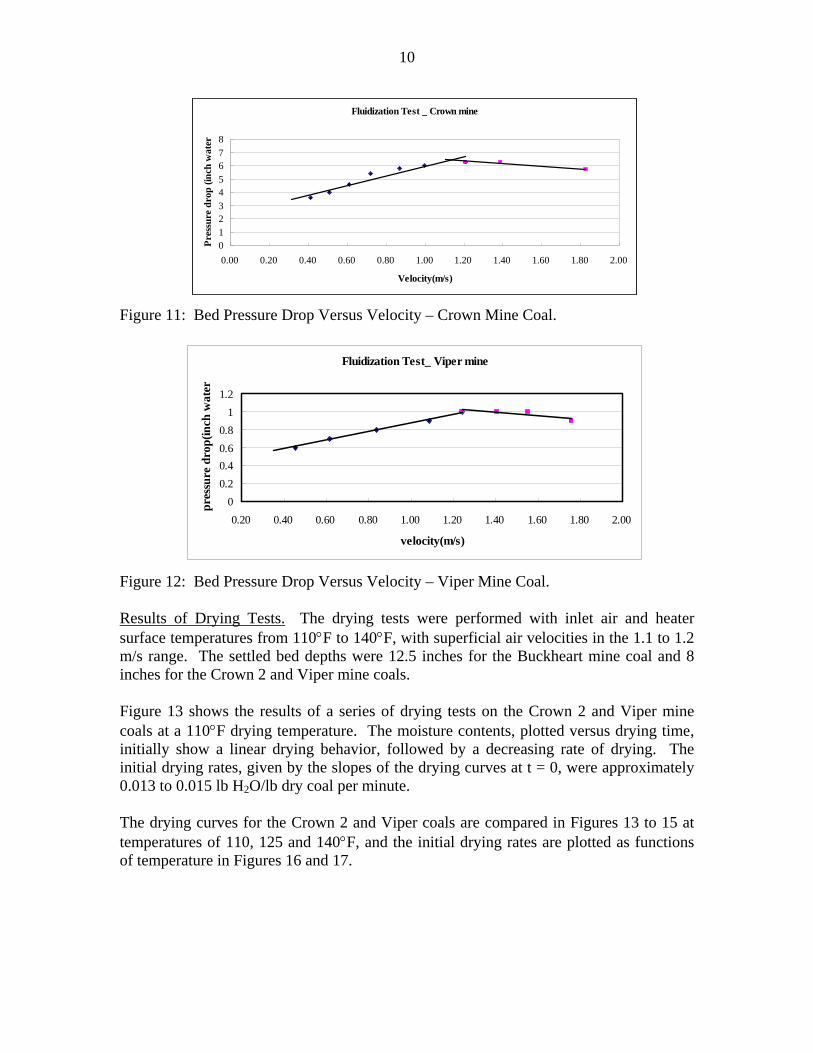
Figure 11: Bed Pressure Drop Versus Velocity – Crown Mine Coal.
Fluidization Test_ Viper mine
00.20.40.60.8
11.2
0.20 0.40 0.60 0.80 1.00 1.20 1.40 1.60 1.80 2.00
velocity(m/s)
pres
sure
dro
p(in
ch w
ater
Figure 12: Bed Pressure Drop Versus Velocity – Viper Mine Coal. Results of Drying Tests. The drying tests were performed with inlet air and heater surface temperatures from 110°F to 140°F, with superficial air velocities in the 1.1 to 1.2 m/s range. The settled bed depths were 12.5 inches for the Buckheart mine coal and 8 inches for the Crown 2 and Viper mine coals. Figure 13 shows the results of a series of drying tests on the Crown 2 and Viper mine coals at a 110°F drying temperature. The moisture contents, plotted versus drying time, initially show a linear drying behavior, followed by a decreasing rate of drying. The initial drying rates, given by the slopes of the drying curves at t = 0, were approximately 0.013 to 0.015 lb H2O/lb dry coal per minute. The drying curves for the Crown 2 and Viper coals are compared in Figures 13 to 15 at temperatures of 110, 125 and 140°F, and the initial drying rates are plotted as functions of temperature in Figures 16 and 17.

11
Coal Moisture Versus Time(dry basis)_ Crown mine and Viper mine_110F
0
0.05
0.1
0.15
0.2
0.25
0.3
0 5 10 15 20 25 30 35 40 45
Time (min)
Moi
stur
e C
onte
nt (k
g w
ater
/ kg
dry
mas
s)Viper mine
Crown mine
Test A1,A4, V1, V4Ta,in, Tsuf =110F
Figure 13: Drying Curves for Coals from Crown 2 and Viper Mines. T = 110°F.
Coal Moisture Versus Time(dry basis)_ Crown mine and Viper mine_125F
0
0.05
0.1
0.15
0.2
0.25
0.3
0 5 10 15 20 25 30 35 40 45
Time (min)
Moi
stur
e C
onte
nt (k
g w
ater
/ kg
dry
mas
s)
Viper mine
Crown mine
Test A2,V2,V5Ta,in, Tsuf =125F
Figure 14: Drying Curves for Coals from Crown 2 and Viper Mines. T = 125°F.
12
Coal Moisture Versus Time(dry basis)_ Crown mine and Viper mine_140F
0
0.05
0.1
0.15
0.2
0.25
0.3
0 5 10 15 20 25 30 35 40 45
Time (min)
Moi
stur
e C
onte
nt (k
g w
ater
/ kg
dry
mas
s)Viper mineCrown minepoly._ Crown minepoly. _ Viper mine
Test A3,A5, V3,V6Ta,in , Tsuf =140F
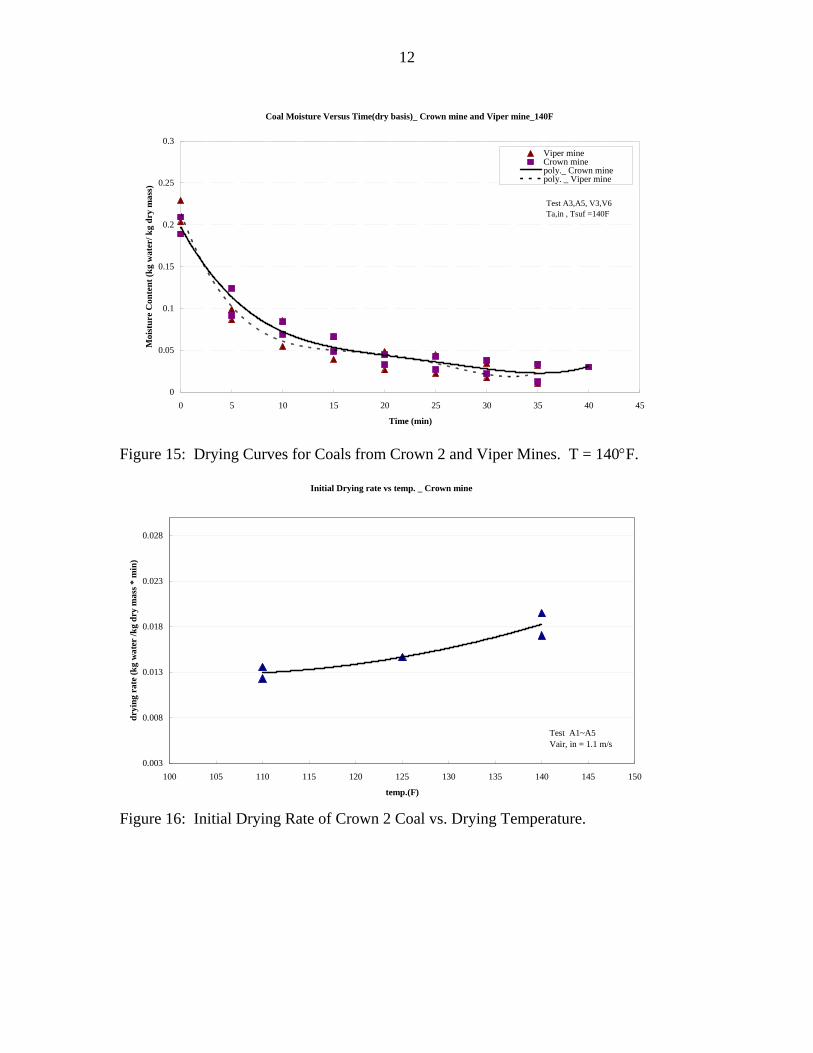
Figure 15: Drying Curves for Coals from Crown 2 and Viper Mines. T = 140°F.
Figure 16: Initial Drying Rate of Crown 2 Coal vs. Drying Temperature.
Initial Drying rate vs temp. _ Crown mine
0.003
0.008
0.013
0.018
0.023
0.028
100 105 110 115 120 125 130 135 140 145 150
temp.(F)
dryi
ng r
ate
(kg
wat
er /k
g dr
y m
ass *
min
)
Test A1~A5Vair, in = 1.1 m/s
13
Time required for 80% moisture reduction_ Crown and Viper mines
5
10
15
20
25
30
35
40
100 105 110 115 120 125 130 135 140 145 150
Temp(F)
time
requ
irem
ent(m
in)
Viper mineCrown minepoly. _ Viper minepoly. _ Crown mine
Test A1~A5, V1~V6ho=8"weight; 2.5kg
V=1.2m/s
V=1.1m/s
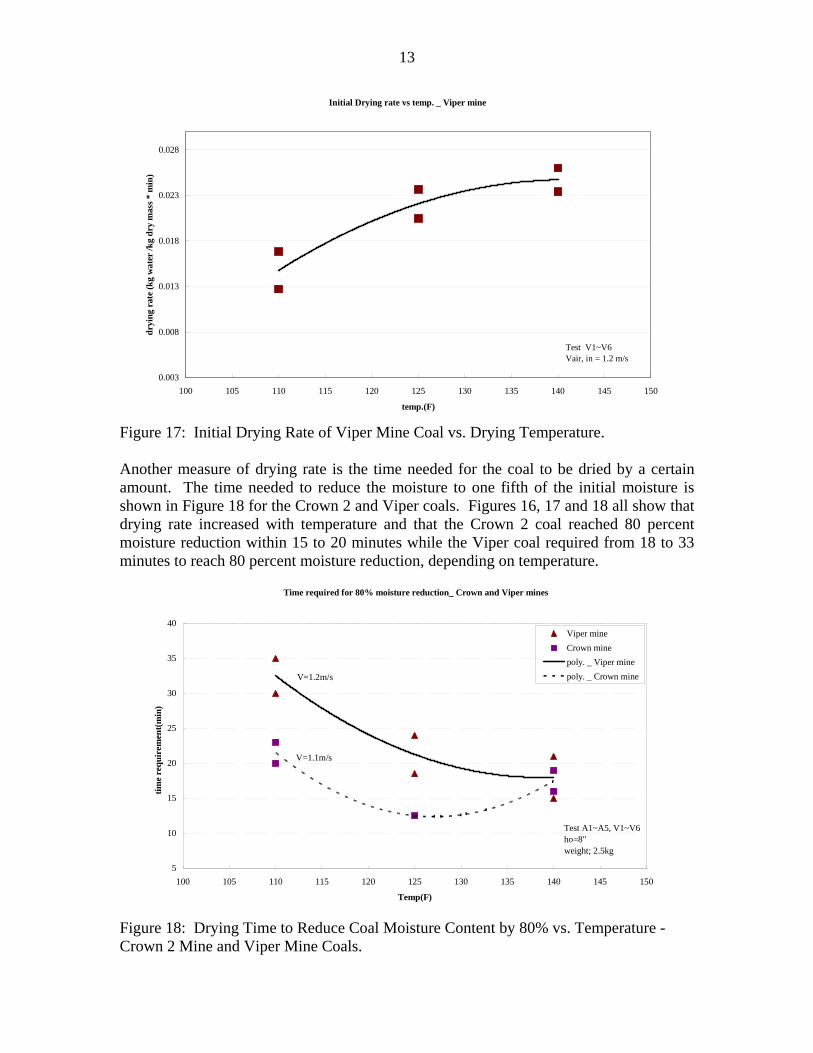
Figure 17: Initial Drying Rate of Viper Mine Coal vs. Drying Temperature. Another measure of drying rate is the time needed for the coal to be dried by a certain amount. The time needed to reduce the moisture to one fifth of the initial moisture is shown in Figure 18 for the Crown 2 and Viper coals. Figures 16, 17 and 18 all show that drying rate increased with temperature and that the Crown 2 coal reached 80 percent moisture reduction within 15 to 20 minutes while the Viper coal required from 18 to 33 minutes to reach 80 percent moisture reduction, depending on temperature. Figure 18: Drying Time to Reduce Coal Moisture Content by 80% vs. Temperature - Crown 2 Mine and Viper Mine Coals.
Initial Drying rate vs temp. _ Viper mine
0.003
0.008
0.013
0.018
0.023
0.028
100 105 110 115 120 125 130 135 140 145 150
temp.(F)
dryi
ng r
ate
(kg
wat
er /k
g dr
y m
ass *
min
)
Test V1~V6Vair, in = 1.2 m/s
14
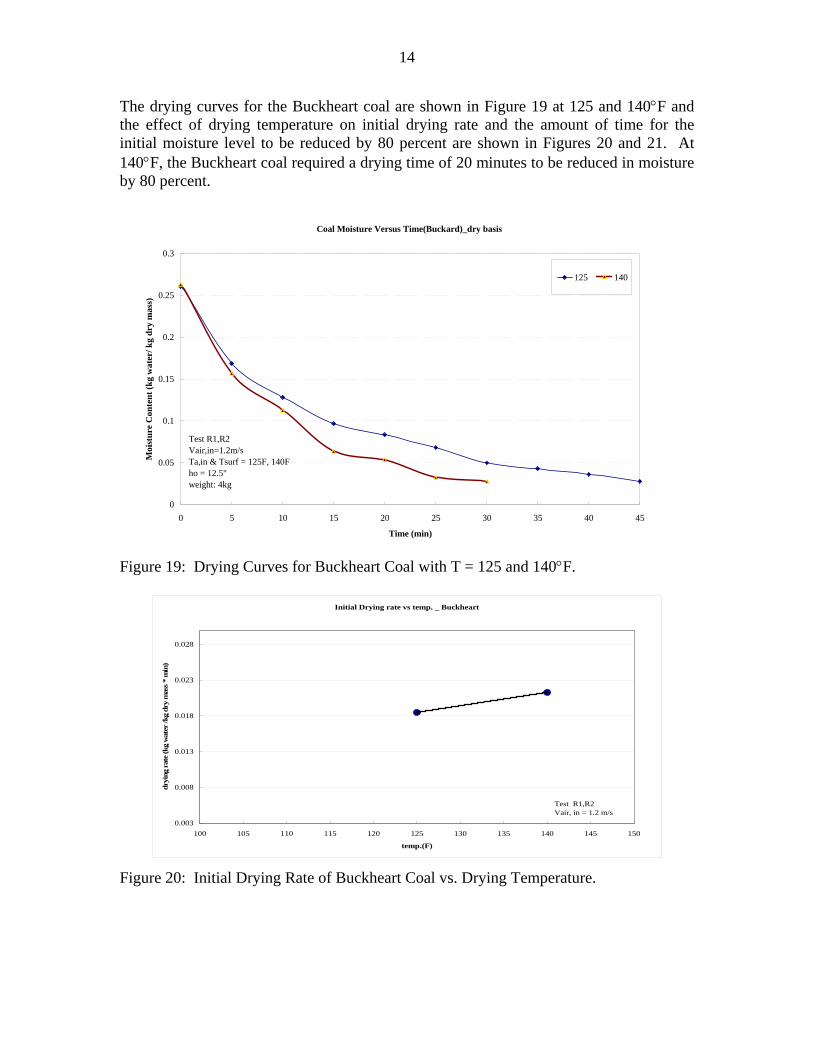
The drying curves for the Buckheart coal are shown in Figure 19 at 125 and 140°F and the effect of drying temperature on initial drying rate and the amount of time for the initial moisture level to be reduced by 80 percent are shown in Figures 20 and 21. At 140°F, the Buckheart coal required a drying time of 20 minutes to be reduced in moisture by 80 percent.
Coal Moisture Versus Time(Buckard)_dry basis
0
0.05
0.1
0.15
0.2
0.25
0.3
0 5 10 15 20 25 30 35 40 45
Time (min)
Moi
stur
e C
onte
nt (k
g w
ater
/ kg
dry
mas
s)
125 140
Test R1,R2Vair,in=1.2m/sTa,in & Tsurf = 125F, 140Fho = 12.5"weight: 4kg
Figure 19: Drying Curves for Buckheart Coal with T = 125 and 140°F.
Initial Drying rate vs temp. _ Buckheart
0.003
0.008
0.013
0.018
0.023
0.028
100 105 110 115 120 125 130 135 140 145 150
temp.(F)
dryi
ng r
ate
(kg
wat
er /k
g dr
y m
ass *
min
)
Test R1,R2Vair, in = 1.2 m/s
Figure 20: Initial Drying Rate of Buckheart Coal vs. Drying Temperature.
15
Time required for 80% moisture reduction_ Buckheart
5
10
15
20
25
30
35
40
100 105 110 115 120 125 130 135 140 145 150
Temp(F)
time
requ
irem
ent(
min
)Buckheart
poly. _ Buckheart
Test R1,R2ho=12"weight; 4kgV=1.2 m/s
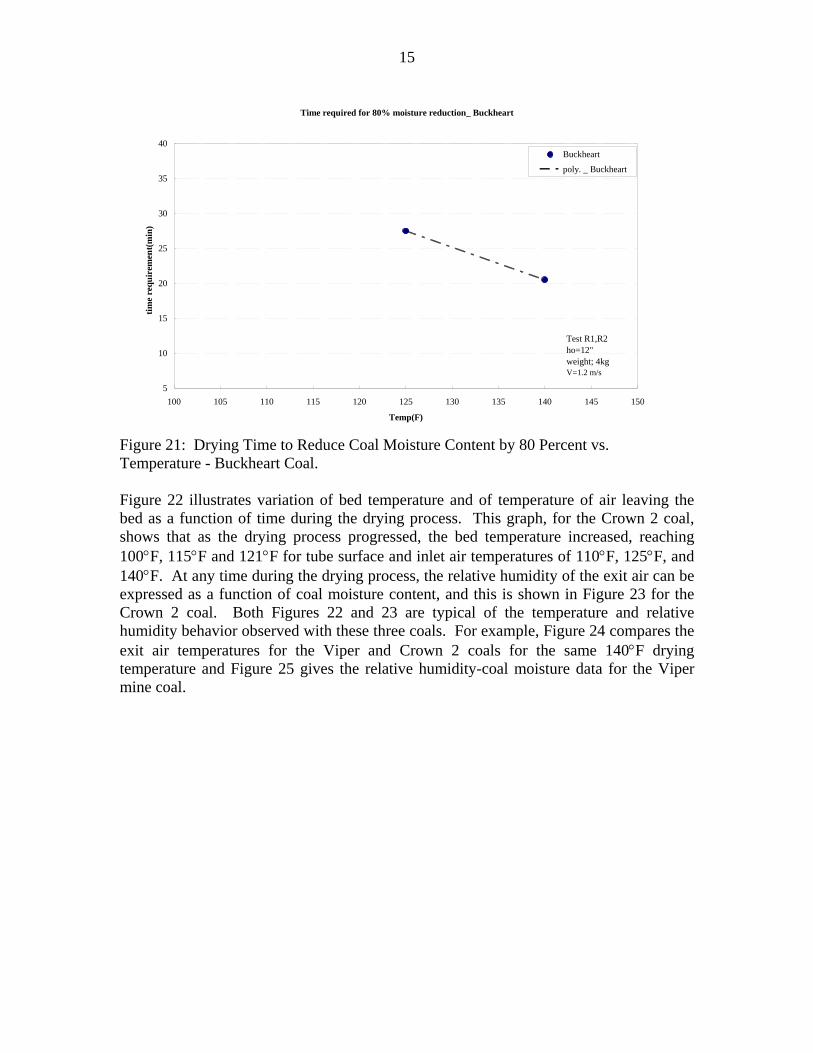
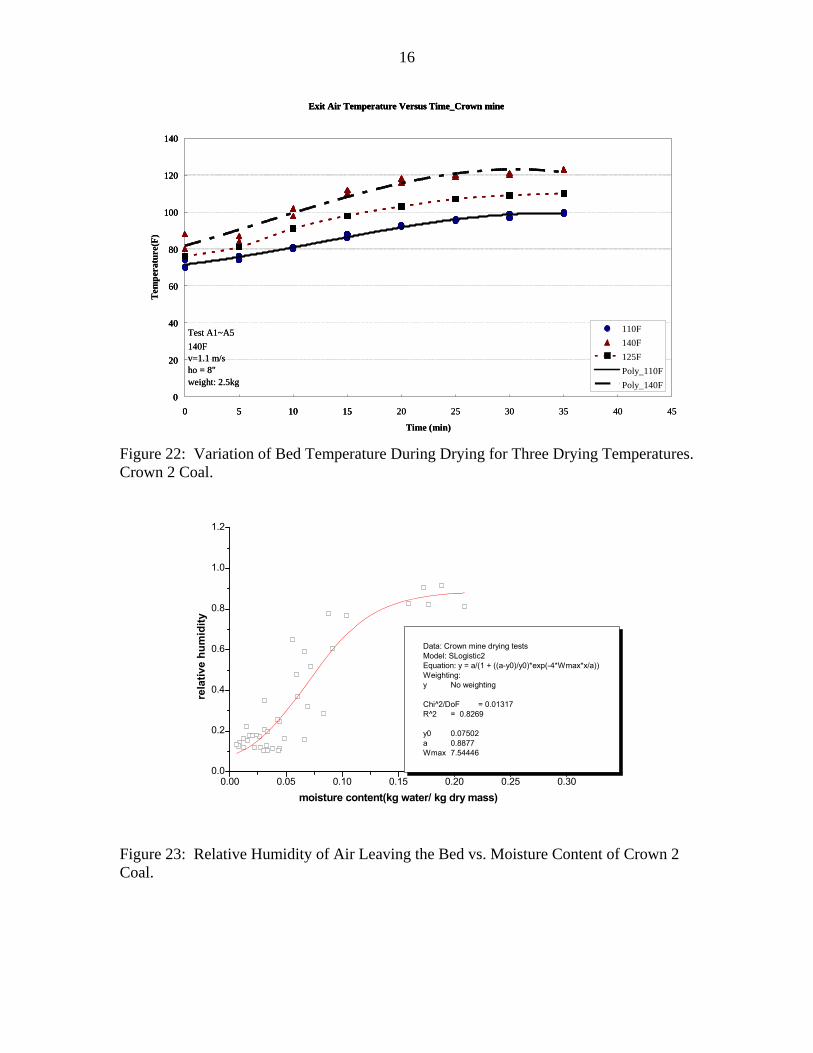
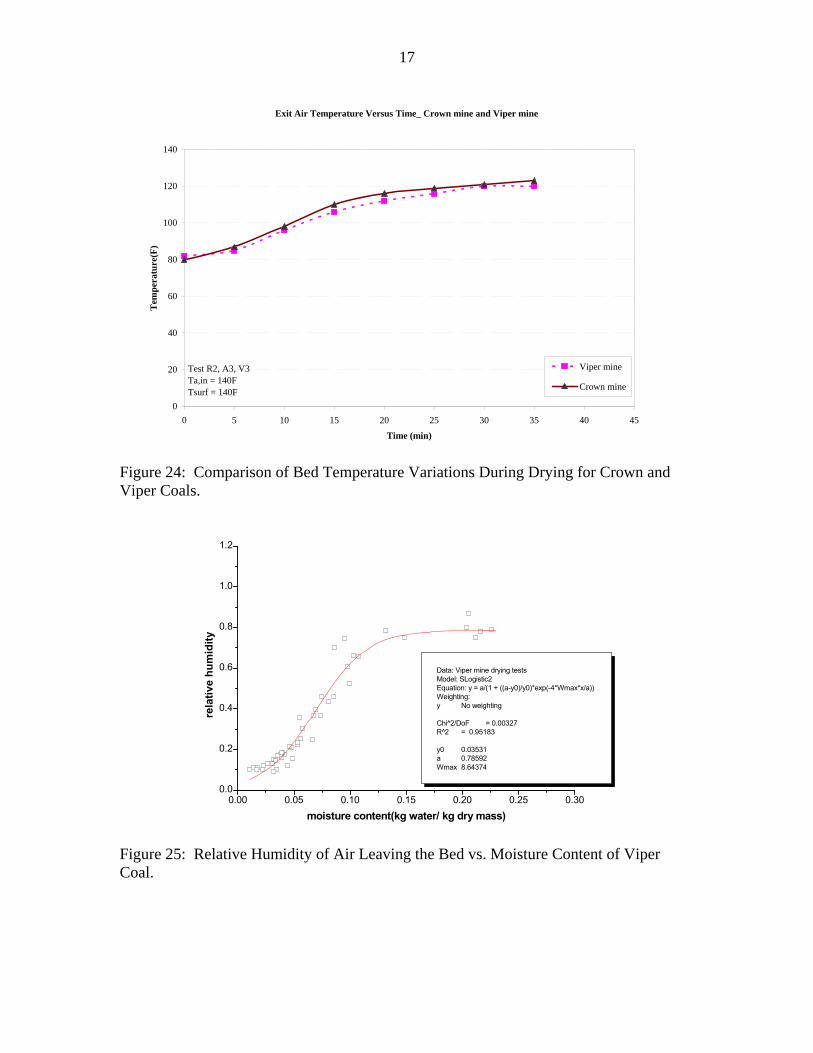
Figure 21: Drying Time to Reduce Coal Moisture Content by 80 Percent vs. Temperature - Buckheart Coal. Figure 22 illustrates variation of bed temperature and of temperature of air leaving the bed as a function of time during the drying process. This graph, for the Crown 2 coal, shows that as the drying process progressed, the bed temperature increased, reaching 100°F, 115°F and 121°F for tube surface and inlet air temperatures of 110°F, 125°F, and 140°F. At any time during the drying process, the relative humidity of the exit air can be expressed as a function of coal moisture content, and this is shown in Figure 23 for the Crown 2 coal. Both Figures 22 and 23 are typical of the temperature and relative humidity behavior observed with these three coals. For example, Figure 24 compares the exit air temperatures for the Viper and Crown 2 coals for the same 140°F drying temperature and Figure 25 gives the relative humidity-coal moisture data for the Viper mine coal.
16
Figure 22: Variation of Bed Temperature During Drying for Three Drying Temperatures. Crown 2 Coal.
0.00 0.05 0.10 0.15 0.20 0.25 0.300.0
0.2
0.4
0.6
0.8
1.0
1.2
Data: Crown mine drying testsModel: SLogistic2 Equation: y = a/(1 + ((a-y0)/y0)*exp(-4*Wmax*x/a)) Weighting:y No weighting Chi^2/DoF = 0.01317R^2 = 0.8269 y0 0.07502a 0.8877Wmax 7.54446
moisture content(kg water/ kg dry mass)
rela
tive
hum
idity
Figure 23: Relative Humidity of Air Leaving the Bed vs. Moisture Content of Crown 2 Coal.
Exit Air Temperature Versus Time_Crown mine
0
20
40
60
80
100
120
140
0 5 10 15 20 25 30 35 40 45
Time (min)
Tem
pera
ture
(F)
110F140F125FPoly_110FPoly_140F
Test A1~A5140Fv=1.1 m/sho = 8"weight: 2.5kg
Exit Air Temperature Versus Time_Crown mine
0
20
40
60
80
100
120
140
0 5 10 15
Exit Air Temperature Versus Time_Crown mine
0
20
40
60
80
100
120
140
0 5 10 15 20 25 30 35 40 45
Time (min)
Tem
pera
ture
(F)
110F140F125FPoly_110FPoly_140F
Test A1~A5140Fv=1.1 m/sho = 8"weight: 2.5kg
17
Figure 24: Comparison of Bed Temperature Variations During Drying for Crown and Viper Coals.
0.00 0.05 0.10 0.15 0.20 0.25 0.300.0
0.2
0.4
0.6
0.8
1.0
1.2
Data: Viper mine drying testsModel: SLogistic2 Equation: y = a/(1 + ((a-y0)/y0)*exp(-4*Wmax*x/a)) Weighting:y No weighting Chi 2/DoF = 0.00327R^2 = 0.95183 y0 0.03531a 0.78592Wmax 8.64374
moisture content(kg water/ kg dry mass)
rela
tive
hum
idity
Figure 25: Relative Humidity of Air Leaving the Bed vs. Moisture Content of Viper Coal.
Exit Air Temperature Versus Time_ Crown mine and Viper mine
0
20
40
60
80
100
120
140
0 5 10 15 20 25 30 35 40 45
Time (min)
Tem
pera
ture
(F)
Viper mine
Crown mine
Test R2, A3, V3Ta,in = 140FTsurf = 140F
18
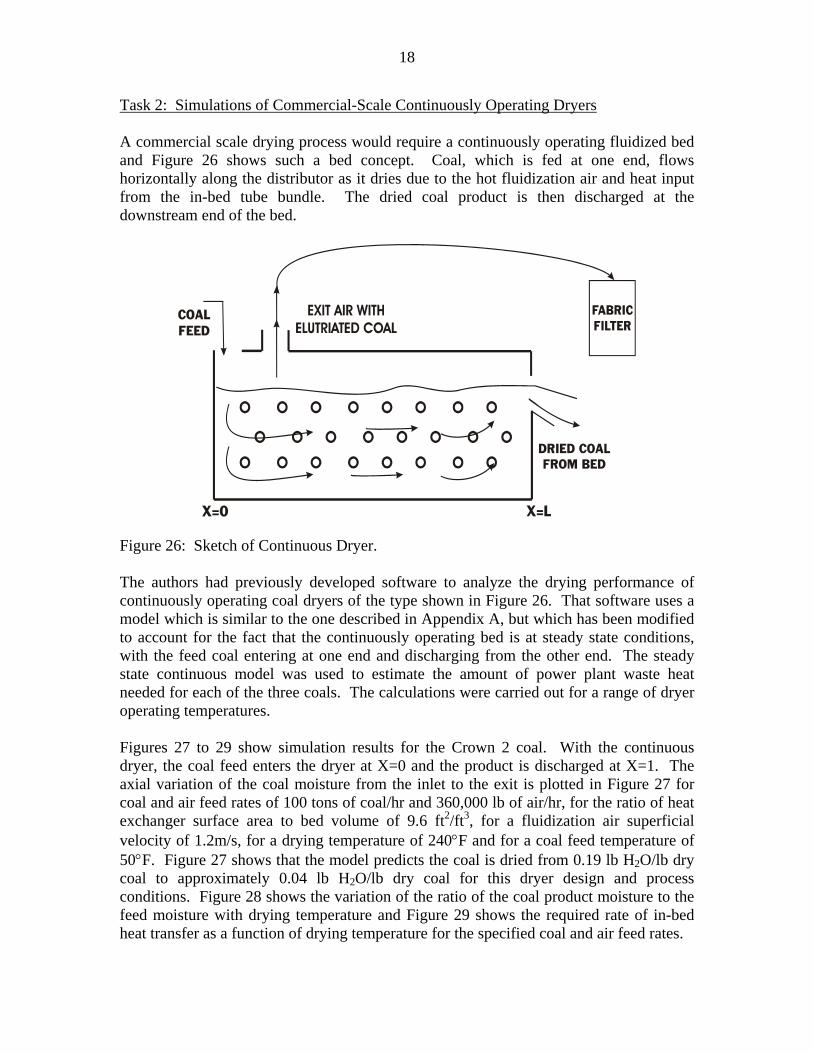
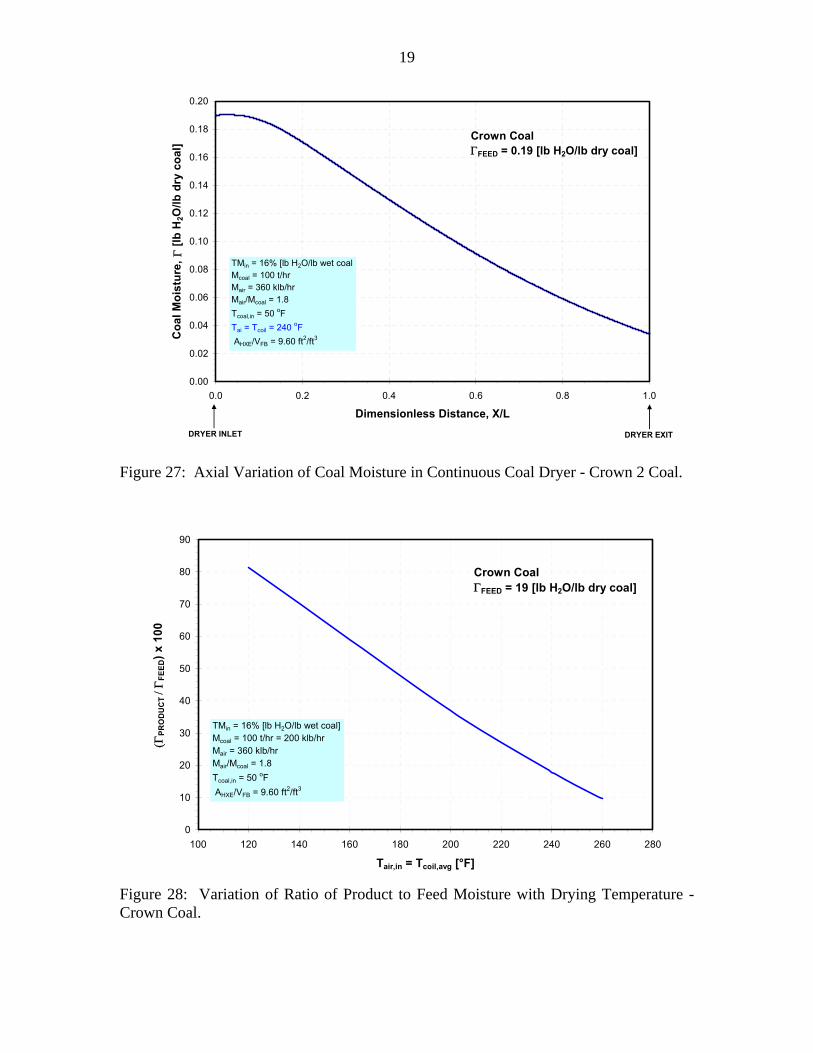
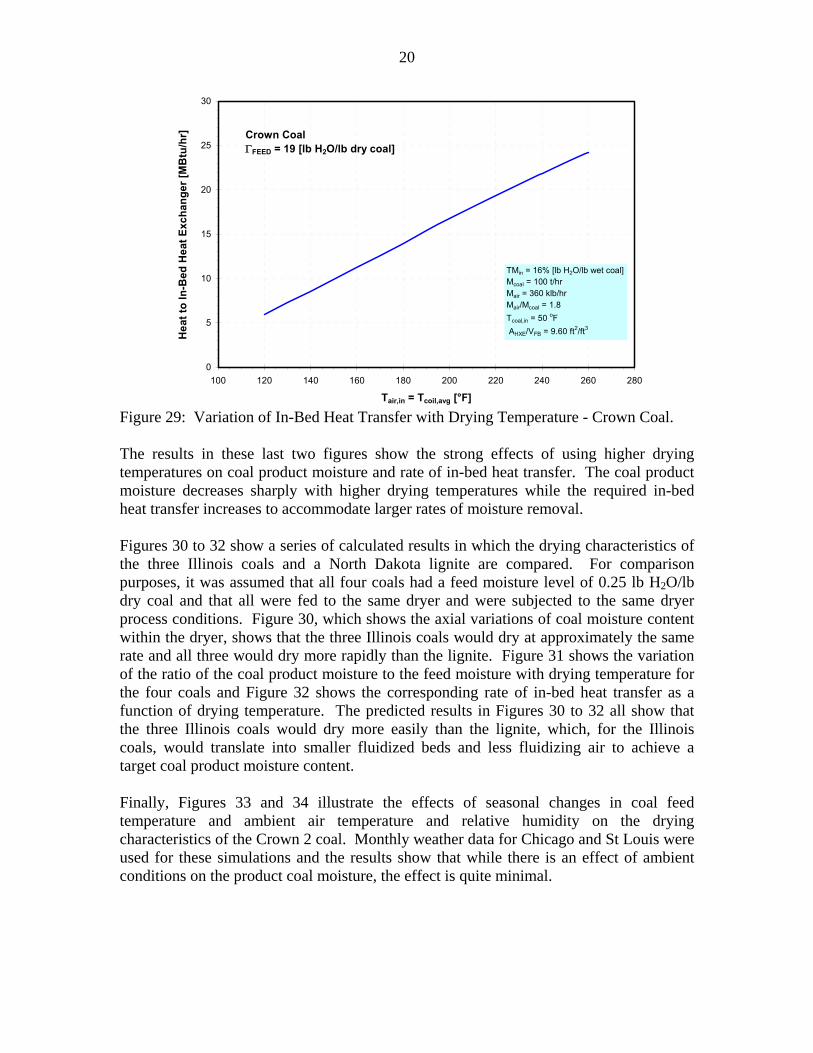
Task 2: Simulations of Commercial-Scale Continuously Operating Dryers A commercial scale drying process would require a continuously operating fluidized bed and Figure 26 shows such a bed concept. Coal, which is fed at one end, flows horizontally along the distributor as it dries due to the hot fluidization air and heat input from the in-bed tube bundle. The dried coal product is then discharged at the downstream end of the bed. Figure 26: Sketch of Continuous Dryer. The authors had previously developed software to analyze the drying performance of continuously operating coal dryers of the type shown in Figure 26. That software uses a model which is similar to the one described in Appendix A, but which has been modified to account for the fact that the continuously operating bed is at steady state conditions, with the feed coal entering at one end and discharging from the other end. The steady state continuous model was used to estimate the amount of power plant waste heat needed for each of the three coals. The calculations were carried out for a range of dryer operating temperatures. Figures 27 to 29 show simulation results for the Crown 2 coal. With the continuous dryer, the coal feed enters the dryer at X=0 and the product is discharged at X=1. The axial variation of the coal moisture from the inlet to the exit is plotted in Figure 27 for coal and air feed rates of 100 tons of coal/hr and 360,000 lb of air/hr, for the ratio of heat exchanger surface area to bed volume of 9.6 ft2/ft3, for a fluidization air superficial velocity of 1.2m/s, for a drying temperature of 240°F and for a coal feed temperature of 50°F. Figure 27 shows that the model predicts the coal is dried from 0.19 lb H2O/lb dry coal to approximately 0.04 lb H2O/lb dry coal for this dryer design and process conditions. Figure 28 shows the variation of the ratio of the coal product moisture to the feed moisture with drying temperature and Figure 29 shows the required rate of in-bed heat transfer as a function of drying temperature for the specified coal and air feed rates.
19
Crown CoalΓFEED = 19 [lb H2O/lb dry coal]
0
10
20
30
40
50
60
70
80
90
100 120 140 160 180 200 220 240 260 280
Tair,in = Tcoil,avg [°F]
(ΓPR
OD
UC
T / Γ
FEED
) x 1
00
TMin = 16% [lb H2O/lb wet coal]Mcoal = 100 t/hr = 200 klb/hrMair = 360 klb/hrMair/Mcoal = 1.8Tcoal,in = 50 oF AHXE/VFB = 9.60 ft2/ft3
Crown CoalΓFEED = 0.19 [lb H2O/lb dry coal]
0.00
0.02
0.04
0.06
0.08
0.10
0.12
0.14
0.16
0.18
0.20
0.0 0.2 0.4 0.6 0.8 1.0
Dimensionless Distance, X/L
Coa
l Moi
stur
e, Γ
[lb
H2O
/lb d
ry c
oal]
TMin = 16% [lb H2O/lb wet coalMcoal = 100 t/hrMair = 360 klb/hrMair/Mcoal = 1.8Tcoal,in = 50 oFTai = Tcoil = 240 oF AHXE/VFB = 9.60 ft2/ft3
DRYER INLET DRYER EXIT
Figure 27: Axial Variation of Coal Moisture in Continuous Coal Dryer - Crown 2 Coal. Figure 28: Variation of Ratio of Product to Feed Moisture with Drying Temperature - Crown Coal.
20
Crown CoalΓFEED = 19 [lb H2O/lb dry coal]
0
5
10
15
20
25
30
100 120 140 160 180 200 220 240 260 280
Tair,in = Tcoil,avg [°F]
Hea
t to
In-B
ed H
eat E
xcha
nger
[MB
tu/h
r]
TMin = 16% [lb H2O/lb wet coal]Mcoal = 100 t/hrMair = 360 klb/hrMair/Mcoal = 1.8Tcoal,in = 50 oF AHXE/VFB = 9.60 ft2/ft3
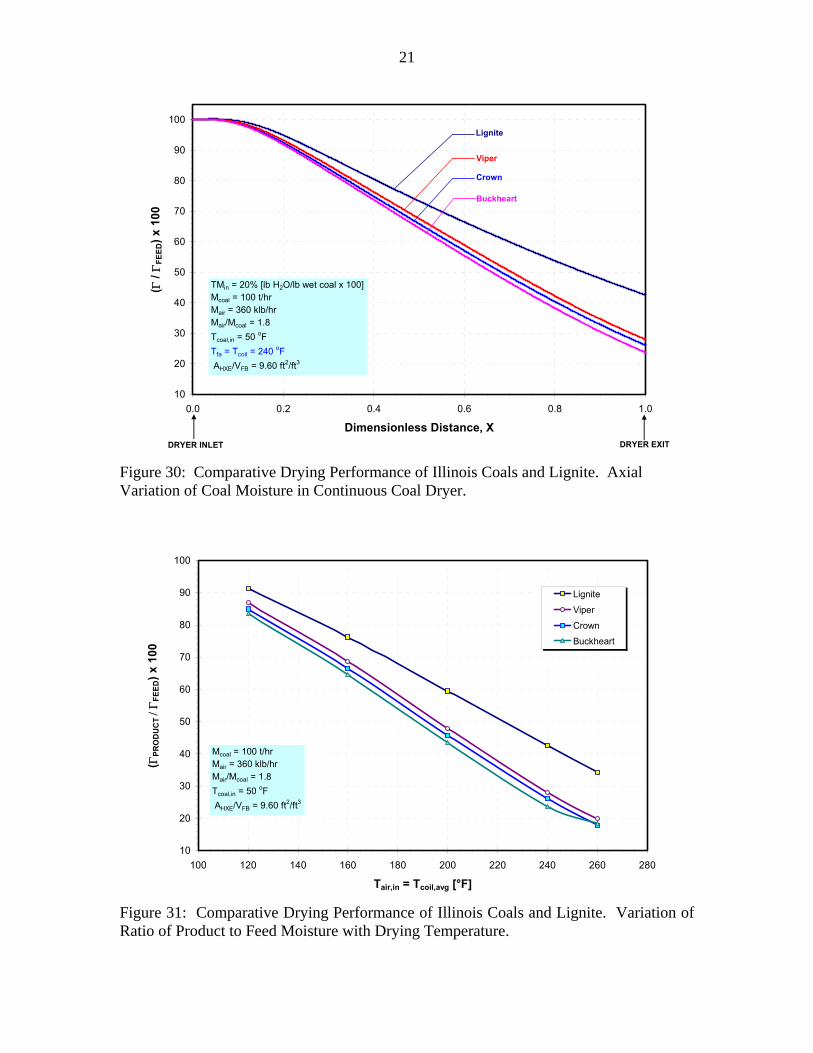
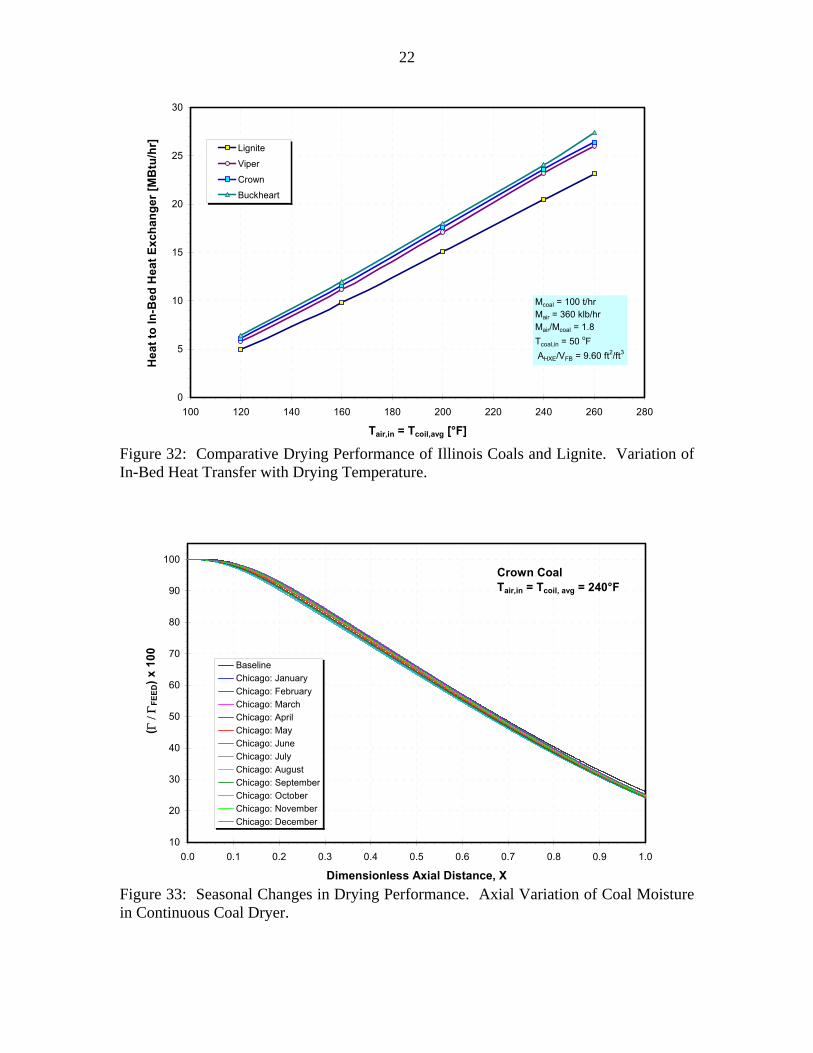
Figure 29: Variation of In-Bed Heat Transfer with Drying Temperature - Crown Coal. The results in these last two figures show the strong effects of using higher drying temperatures on coal product moisture and rate of in-bed heat transfer. The coal product moisture decreases sharply with higher drying temperatures while the required in-bed heat transfer increases to accommodate larger rates of moisture removal. Figures 30 to 32 show a series of calculated results in which the drying characteristics of the three Illinois coals and a North Dakota lignite are compared. For comparison purposes, it was assumed that all four coals had a feed moisture level of 0.25 lb H2O/lb dry coal and that all were fed to the same dryer and were subjected to the same dryer process conditions. Figure 30, which shows the axial variations of coal moisture content within the dryer, shows that the three Illinois coals would dry at approximately the same rate and all three would dry more rapidly than the lignite. Figure 31 shows the variation of the ratio of the coal product moisture to the feed moisture with drying temperature for the four coals and Figure 32 shows the corresponding rate of in-bed heat transfer as a function of drying temperature. The predicted results in Figures 30 to 32 all show that the three Illinois coals would dry more easily than the lignite, which, for the Illinois coals, would translate into smaller fluidized beds and less fluidizing air to achieve a target coal product moisture content. Finally, Figures 33 and 34 illustrate the effects of seasonal changes in coal feed temperature and ambient air temperature and relative humidity on the drying characteristics of the Crown 2 coal. Monthly weather data for Chicago and St Louis were used for these simulations and the results show that while there is an effect of ambient conditions on the product coal moisture, the effect is quite minimal.
21
10
20
30
40
50
60
70
80
90
100
100 120 140 160 180 200 220 240 260 280
Tair,in = Tcoil,avg [°F]
( ΓPR
OD
UC
T / Γ
FEED
) x 1
00
Lignite
Viper
Crown
Buckheart
Mcoal = 100 t/hr Mair = 360 klb/hrMair/Mcoal = 1.8Tcoal,in = 50 oF AHXE/VFB = 9.60 ft2/ft3
10
20
30
40
50
60
70
80
90
100
0.0 0.2 0.4 0.6 0.8 1.0
Dimensionless Distance, X
( Γ /
ΓFE
ED) x
100
TMin = 20% [lb H2O/lb wet coal x 100]Mcoal = 100 t/hrMair = 360 klb/hrMair/Mcoal = 1.8Tcoal,in = 50 oFTfa = Tcoil = 240 oF AHXE/VFB = 9.60 ft2/ft3
Lignite
Viper
Crown
Buckheart
DRYER INLET DRYER EXIT
Figure 30: Comparative Drying Performance of Illinois Coals and Lignite. Axial Variation of Coal Moisture in Continuous Coal Dryer. Figure 31: Comparative Drying Performance of Illinois Coals and Lignite. Variation of Ratio of Product to Feed Moisture with Drying Temperature.
22
0
5
10
15
20
25
30
100 120 140 160 180 200 220 240 260 280
Tair,in = Tcoil,avg [°F]
Hea
t to
In-B
ed H
eat E
xcha
nger
[MB
tu/h
r] Lignite
Viper
Crown
Buckheart
Mcoal = 100 t/hrMair = 360 klb/hrMair/Mcoal = 1.8Tcoal,in = 50 oF AHXE/VFB = 9.60 ft2/ft3
Crown CoalTair,in = Tcoil, avg = 240°F
10
20
30
40
50
60
70
80
90
100
0.0 0.1 0.2 0.3 0.4 0.5 0.6 0.7 0.8 0.9 1.0
Dimensionless Axial Distance, X
( Γ /
ΓFE
ED) x
100
BaselineChicago: JanuaryChicago: FebruaryChicago: MarchChicago: AprilChicago: MayChicago: JuneChicago: JulyChicago: AugustChicago: SeptemberChicago: OctoberChicago: NovemberChicago: December
Figure 32: Comparative Drying Performance of Illinois Coals and Lignite. Variation of In-Bed Heat Transfer with Drying Temperature. Figure 33: Seasonal Changes in Drying Performance. Axial Variation of Coal Moisture in Continuous Coal Dryer.

23
Crown CoalTair,in = Tcoil, avg = 240°F
23.0
23.5
24.0
24.5
25.0
25.5
26.0
26.5
BaselineJanuary
FebruaryMarch April May
June JulyAugust
SeptemberOctober
November
December
Month
( ΓPR
OD
UC
T / Γ
FEED
) x 1
00Chicago O'Hare AirportCahokia/St. Louis Downtown Airport
Figure 34: Seasonal Changes in Drying Performance. Variation in Product Moisture in Continuous Coal Dryer.
CONCLUSIONS AND RECOMMENDATIONS The fluidization and drying characteristics of three Illinois coals were determined using a batch operated fluidized bed. All three coals had a wide size distribution, with a top size of ¼ inch. The coal from the Crown 2 mine, an Illinois # 6 coal, was sampled both before and after the centrifugal dryer in the mine’s coal prep plant. The “before” coal, with 0.54 to 0.60 lb H2O/lb dry coal was too cohesive to be fluidized, and tests showed the coal needed to be reduced in moisture to less than 0.24 lb H2O/lb dry coal for fluidization to occur. The “after” Crown 2 coal had a moisture of 0.18 to 0.20 lb H2O/lb dry coal and was easily fluidized. The coal from the Buckheart mine, also an Illinois #6, had 0.24 to 0.26 lb H2O/lb dry coal and was easily fluidized. This coal was recovered by processing the reject from an old coal cleaning operation. The Illinois #5 coal, obtained from the Viper mine, had approximately 0.21 lb H2O/lb dry coal and this, too, was easily fluidized. The batch bed drying experiments were carried out for all three coals at in-bed heater and inlet air temperatures ranging from 110 to 140°F. The data show that, as expected, the drying rate increased with an increase in drying temperature. The moisture content of the Crown 2 coal was reduced to 20 percent of the initial moisture within 15 to 20 minutes, the Viper coal required from 18 to 33 minutes for an 80 percent moisture reduction, and the Buckheart coal required 20 to 28 minutes, all depending on the temperature.
24
The batch bed drying tests provided the coal-specific data on drying characteristics needed to simulate the drying behavior of these coals in continuously operating coal dryers. Computer simulations were performed to determine the effects of drying temperature on the product moisture and required rates of in-bed heat transfer for a dryer of fixed size and coal and air feed rates. The results show the strong effects of using higher drying temperatures on coal product moisture and rate of in-bed heat transfer. The predicted coal product moisture decreases sharply with higher drying temperatures while the required in-bed heat transfer increases to accommodate larger rates of moisture removal. A series of simulations was also performed in which the drying characteristics of the three Illinois coals and a North Dakota lignite were compared. The predicted results all show that the three Illinois coals would dry more easily than the lignite, which, for the Illinois coals, would translate into smaller or fewer fluidized beds and less fluidizing air to achieve a target coal product moisture content. There are two major recommendations to come out of this study.
• Perform drying tests with high moisture Illinois coal in a pilot scale continuous-flow coal dryer to verify the highly favourable drying rates described in this report.
• Perform a design and feasibility study of a full scale coal drying system for a pulverized coal power generation unit firing high moisture Illinois coal. This study will develop a site-specific system layout and design, size components, estimate capital and operating costs and determine the benefits of using power plant waste heat for coal drying at that power plant.
REFERENCES
1. Levy, E., N. Sarunac, and H. Bilirgen. 2006. “Operational and Environmental
Benefits of Pre-Drying Low Rank Coals Using Power Plant Waste Heat.” Paper presented at the Western Fuels Conference, October 2006, Denver, Colorado.
2. Levy, E., N. Sarunac, H. Bilirgen, and H. Caram. 2006. Use of Coal Drying to
Reduce Water Consumed in Pulverized Coal Power Plants. Final Report. DOE Report DE-FC26-03NT41729.
3. NETL/DOE News Release. June 6, 2007. “Unique DOE-Funded Coal Dryers
Meet Goal of Increased Efficiency, Reduced Emissions. North Dakota Power Station to Expand Use of “Very Successful” Coal Drying Technology.”
NOMENCLATURE
Cpa Specific Heat of Air
CC Specific Heat of Coal
25
CL Specific Heat of Water
dp Particle Size
ho Settled Bed Depth
L Length of Continuous Flow Dryer
airm& Mass Flow Rate of Air
Mwet coal Mass of Wet Coal
MDC Mass of Dry Coal
P Total Pressure
PSAT Vapor Pressure of Water Vapor
TUBESQ& Rate of Heat Transfer from In-Bed Heat Exchanger
LOSSQ& Heat Loss Through Walls of Bed
t Time
T Temperature
Ta, in Air Inlet Temperature
Tb Bed Temperature
TTUBE=TSURF Surface Temperature of In-Bed Heating Element
V=Vair,in=Uo Superficial Air Velocity
VBed Bed Volume
X Axial Distance from Inlet of Dryer
Y Coal Moisture Content on a Wet Basis
⎟⎟⎠
⎞⎜⎜⎝
⎛+⎟⎟
⎠
⎞⎜⎜⎝
⎛+ coaldry kg OH kg
OH kgor coaldry lb OH lb
OH lb as expressed2
22
2
Γ Coal Moisture Content on a Dry Basis , coaldry mass
OH mass 2⎟⎟⎠
⎞⎜⎜⎝
⎛
⎟⎟⎠
⎞⎜⎜⎝
⎛⎟⎟⎠
⎞⎜⎜⎝
⎛coaldry kgOH kgor
coaldry lbOH lb as expressed 22
ΓFEED Moisture Content of Feed Coal
ΓPRODUCT Moisture Content of Product Coal
Γ& Drying Rate = dtdΓ
ω Specific Humidity of Air
, coaldry mass OH mass
OH mass2
2⎟⎟⎠
⎞⎜⎜⎝
⎛+

26
φ Relative Humidity of Air
Subscripts
1 Entering Batch Bed
2 Leaving Batch Bed
dc Dry Coal
27
DISCLAIMER STATEMENT This report was prepared by Edward Levy and Lehigh University with support, in part, by grants made possible by the Illinois Department of Commerce and Economic Opportunity through the Office of Coal Development and the Illinois Clean Coal Institute. Neither Edward Levy and Lehigh University nor any of its subcontractors, nor the Illinois Department of Commerce and Economic Opportunity, Office of Coal Development, the Illinois Clean Coal Institute, nor any person acting on behalf of either:
(A) Makes any warranty of representation, express or implied, with respect to the accuracy, completeness, or usefulness of the information contained in this report, or that the use of any information, apparatus, method, or process disclosed in this report may not infringe privately-owned rights; or
(B) Assumes any liabilities with respect to the use of, or for damages resulting
from the use of, any information, apparatus, method or process disclosed in this report.
Reference herein to any specific commercial product, process, or service by trade name, trademark, manufacturer, or otherwise, does not necessarily constitute or imply its endorsement, recommendation, or favoring; nor do the views and opinions of authors expressed herein necessarily state or reflect those of the Illinois Department of Commerce and Economic Development, Office of Coal Development, or the Illinois Clean Coal Institute. Notice to Journalists and Publishers: If you borrow information from any part of this report, you must include a statement about the state of Illinois’ support of the project.
A-1
APPENDIX A
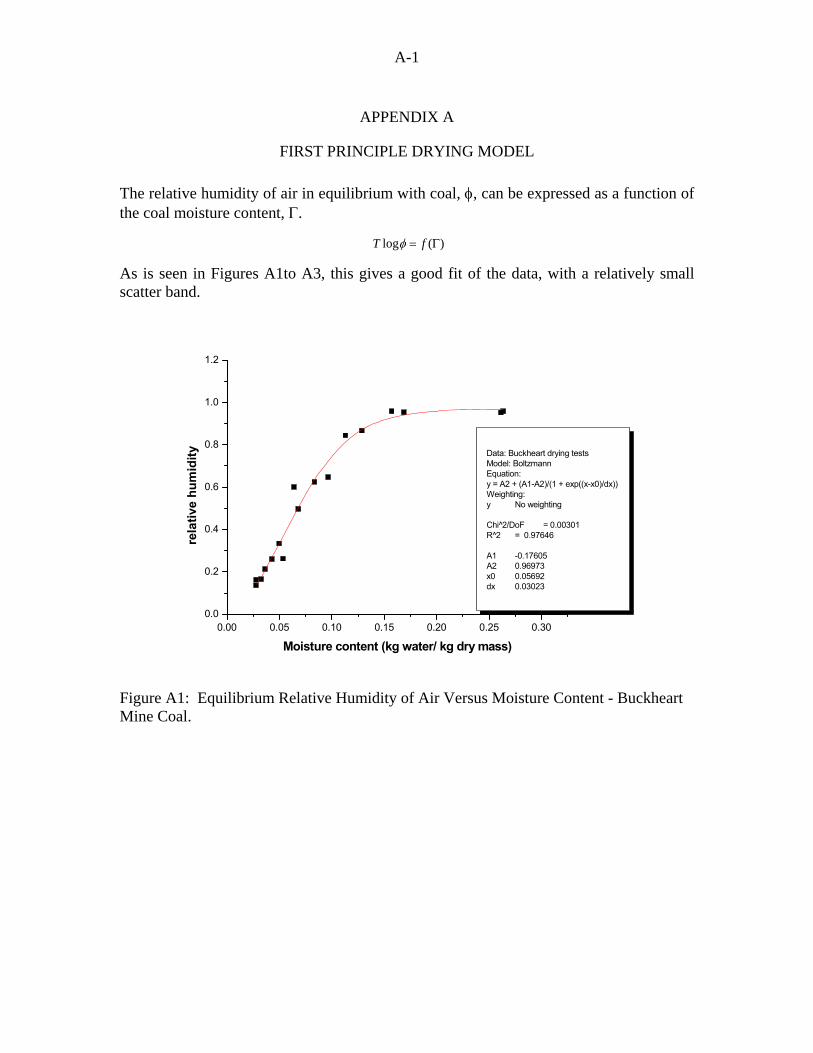
FIRST PRINCIPLE DRYING MODEL The relative humidity of air in equilibrium with coal, φ, can be expressed as a function of the coal moisture content, Γ.
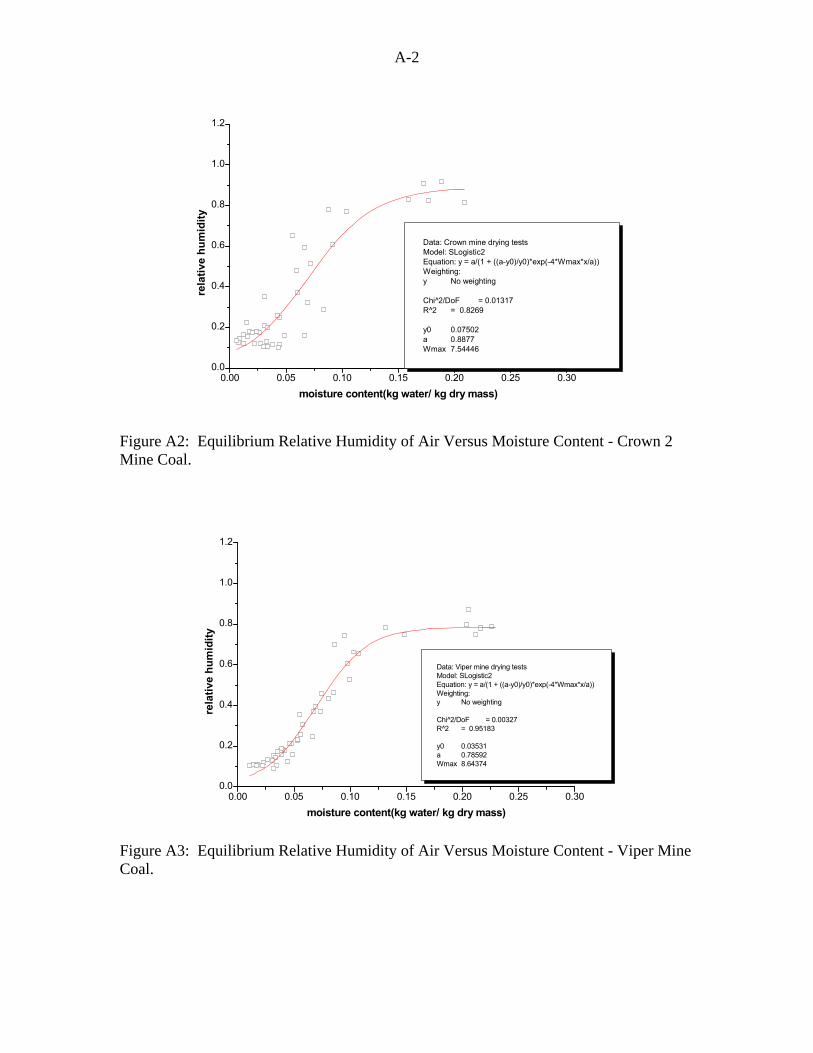
As is seen in Figures A1to A3, this gives a good fit of the data, with a relatively small scatter band.
0.00 0.05 0.10 0.15 0.20 0.25 0.300.0
0.2
0.4
0.6
0.8
1.0
1.2
Data: Buckheart drying testsModel: Boltzmann Equation: y = A2 + (A1-A2)/(1 + exp((x-x0)/dx)) Weighting:y No weighting Chi^2/DoF = 0.00301R^2 = 0.97646 A1 -0.17605A2 0.96973x0 0.05692dx 0.03023
rela
tive
hum
idity
Moisture content (kg water/ kg dry mass)
Figure A1: Equilibrium Relative Humidity of Air Versus Moisture Content - Buckheart Mine Coal.
)(log Γ= fT φ
A-2
0.00 0.05 0.10 0.15 0.20 0.25 0.300.0
0.2
0.4
0.6
0.8
1.0
1.2
Data: Crown mine drying testsModel: SLogistic2 Equation: y = a/(1 + ((a-y0)/y0)*exp(-4*Wmax*x/a)) Weighting:y No weighting Chi^2/DoF = 0.01317R^2 = 0.8269 y0 0.07502a 0.8877Wmax 7.54446
moisture content(kg water/ kg dry mass)
rela
tive
hum
idity
Figure A2: Equilibrium Relative Humidity of Air Versus Moisture Content - Crown 2 Mine Coal.
0.00 0.05 0.10 0.15 0.20 0.25 0.300.0
0.2
0.4
0.6
0.8
1.0
1.2
Data: Viper mine drying testsModel: SLogistic2 Equation: y = a/(1 + ((a-y0)/y0)*exp(-4*Wmax*x/a)) Weighting:y No weighting Chi 2/DoF = 0.00327R^2 = 0.95183 y0 0.03531a 0.78592Wmax 8.64374
moisture content(kg water/ kg dry mass)
rela
tive
hum
idity
Figure A3: Equilibrium Relative Humidity of Air Versus Moisture Content - Viper Mine Coal.

A-3
Air
Air
2
1
The equilibrium moisture content-relative humidity relationships were used, along with the equations of conservation of mass and energy, to develop a first principle model of the batch bed drying process. The model assumes at any instant of time, the particles and air in the bed are at the same temperature and the gas and particle properties do not vary with vertical distance in the bed. Thus, for the batch bed drying process illustrated in Figure A4, conservation of mass and energy can be written:
( )iDCa
mm
dtd ωω −−=
Γ2
& Eq. 1
( ) ( )
( )[ ]112212
122
hghgTTCm
mmu
dtdTCCmQQ
paa
DCa
LLCDCLOSSTUBES
ωω
ωω
−+−+
⎥⎥⎦
⎤
⎢⎢⎣
⎡−⎟⎟
⎠
⎞⎜⎜⎝
⎛−+Γ+=−
&
&&&
Eq. 2
Specific humidity, ω, can be related to relative humidity φ and air temperature T, by
( )( )TPP
TP
satsat
622.0
φφω
−= Eq. 3
while the relative humidity is an empirical function of coal moisture Γ (Figures A1 to A3). In addition, the tube bundle heat transfer rate is
( )BEDTUBETUBE TTUAQ −=& Eq. 4
and the parameters Psat and hg are functions of air temperature.
Figure A4: Sketch of Dryer Model.
Equations 1 to 4 form a system of ordinary differential equations for coal moisture Γ and bed temperature T2 as functions of time t. This was treated as an initial value problem and solved by a Runge Kutta numerical integration scheme.
A-4
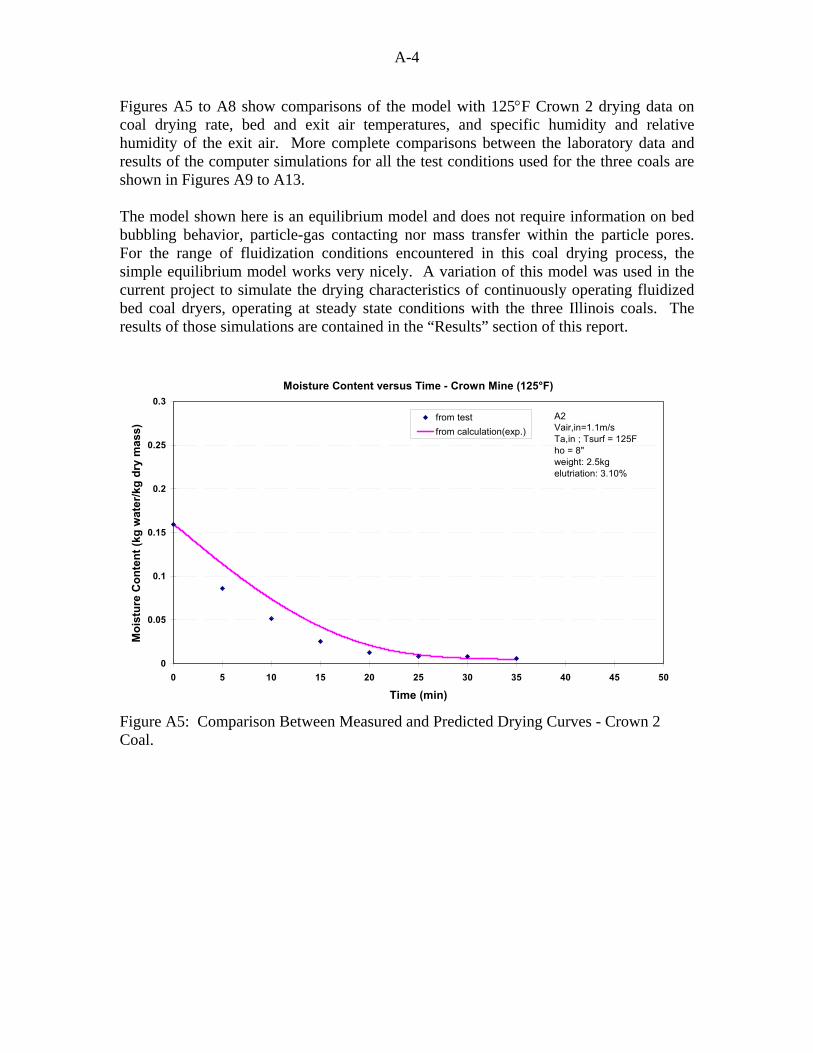
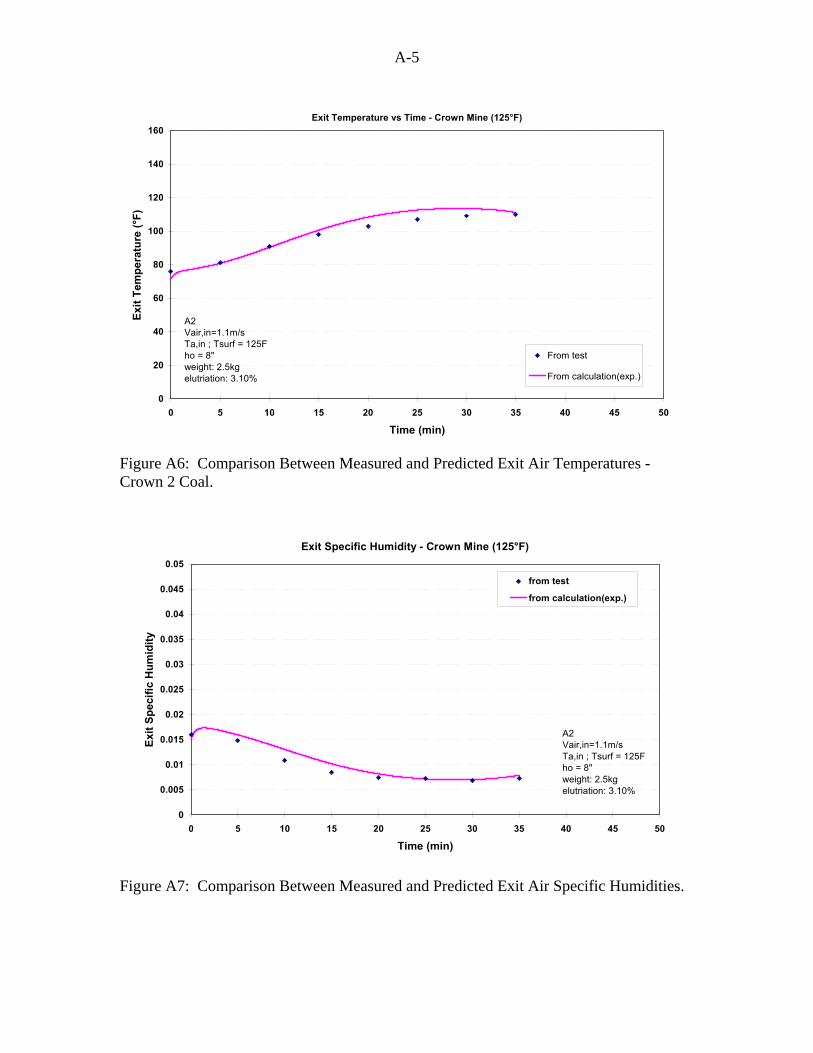
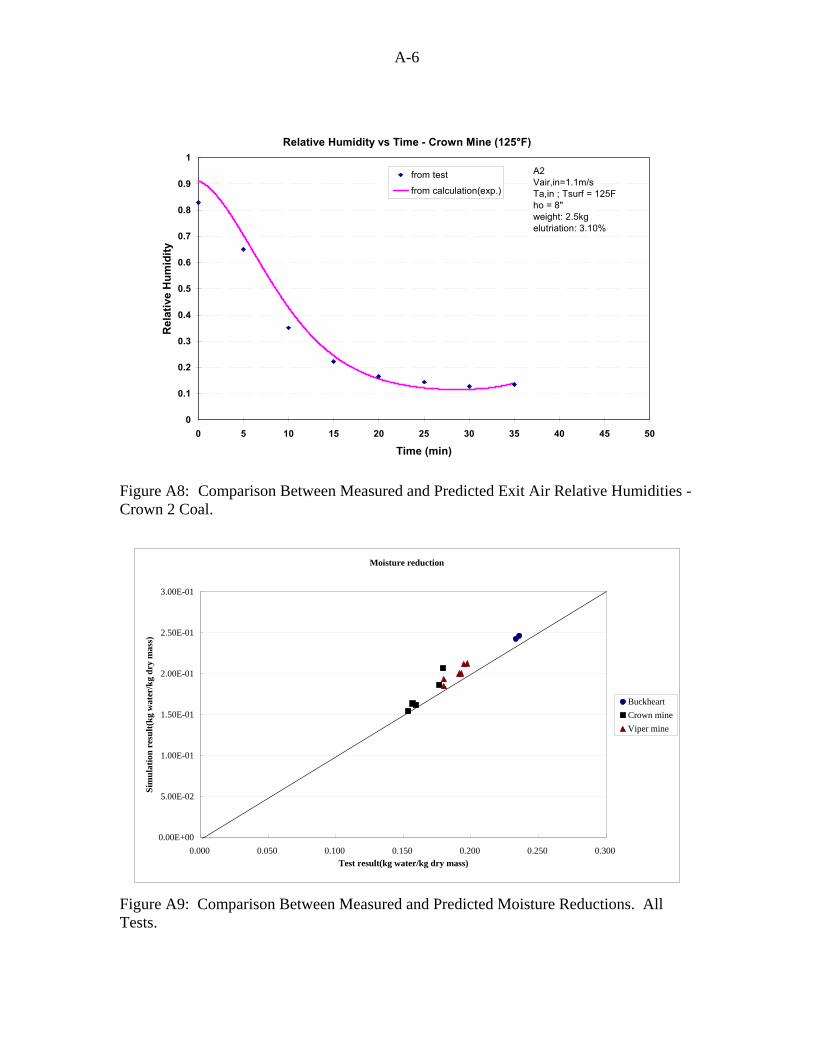
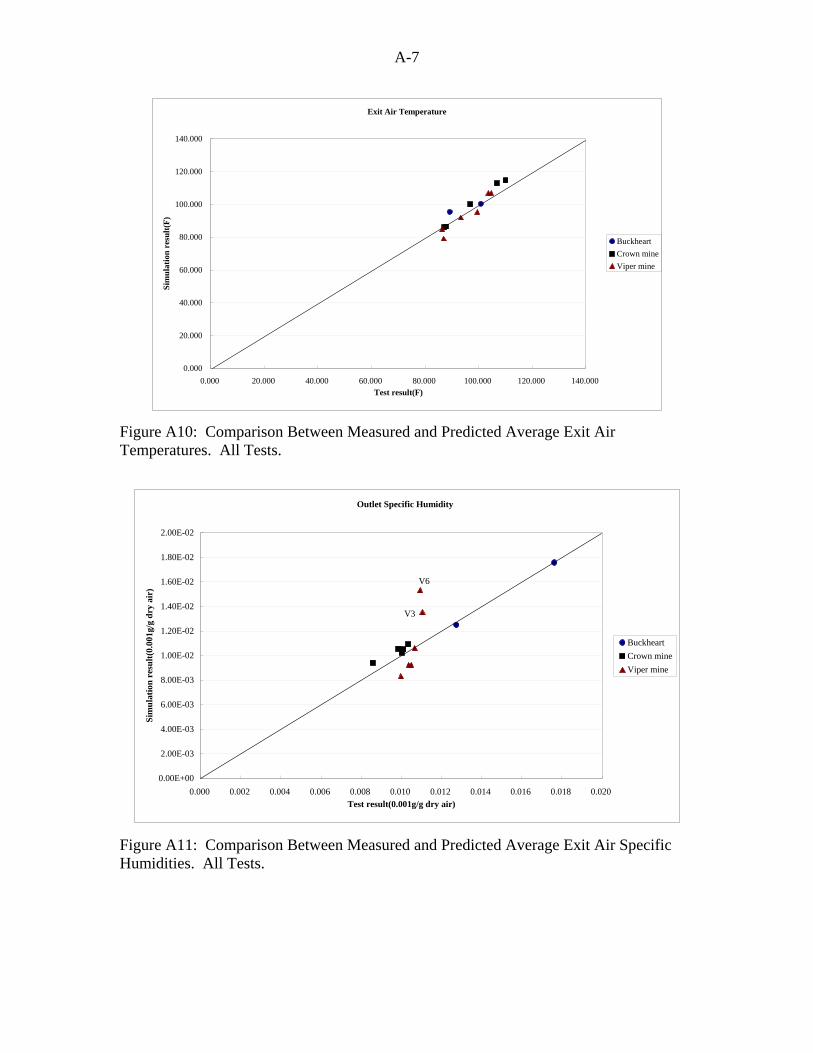
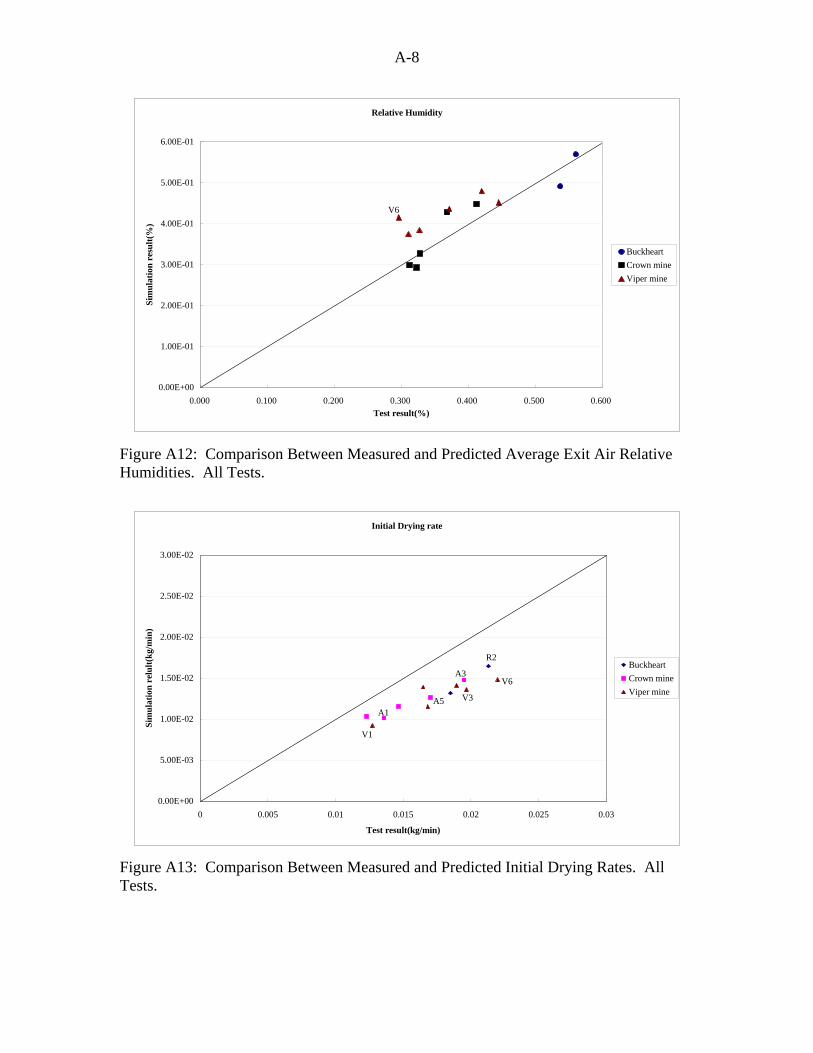
Figures A5 to A8 show comparisons of the model with 125°F Crown 2 drying data on coal drying rate, bed and exit air temperatures, and specific humidity and relative humidity of the exit air. More complete comparisons between the laboratory data and results of the computer simulations for all the test conditions used for the three coals are shown in Figures A9 to A13.
The model shown here is an equilibrium model and does not require information on bed bubbling behavior, particle-gas contacting nor mass transfer within the particle pores. For the range of fluidization conditions encountered in this coal drying process, the simple equilibrium model works very nicely. A variation of this model was used in the current project to simulate the drying characteristics of continuously operating fluidized bed coal dryers, operating at steady state conditions with the three Illinois coals. The results of those simulations are contained in the “Results” section of this report.
Moisture Content versus Time - Crown Mine (125°F)
0
0.05
0.1
0.15
0.2
0.25
0.3
0 5 10 15 20 25 30 35 40 45 50
Time (min)
Moi
stur
e C
onte
nt (k
g w
ater
/kg
dry
mas
s)
from testfrom calculation(exp.)
A2Vair,in=1.1m/sTa,in ; Tsurf = 125Fho = 8"weight: 2.5kgelutriation: 3.10%
Figure A5: Comparison Between Measured and Predicted Drying Curves - Crown 2 Coal.
A-5
Exit Temperature vs Time - Crown Mine (125°F)
0
20
40
60
80
100
120
140
160
0 5 10 15 20 25 30 35 40 45 50
Time (min)
Exit
Tem
pera
ture
(°F)
From test
From calculation(exp.)
A2Vair,in=1.1m/sTa,in ; Tsurf = 125Fho = 8"weight: 2.5kgelutriation: 3.10%
Figure A6: Comparison Between Measured and Predicted Exit Air Temperatures - Crown 2 Coal.
Exit Specific Humidity - Crown Mine (125°F)
0
0.005
0.01
0.015
0.02
0.025
0.03
0.035
0.04
0.045
0.05
0 5 10 15 20 25 30 35 40 45 50
Time (min)
Exit
Spec
ific
Hum
idity
from test
from calculation(exp.)
A2Vair,in=1.1m/sTa,in ; Tsurf = 125Fho = 8"weight: 2.5kgelutriation: 3.10%
Figure A7: Comparison Between Measured and Predicted Exit Air Specific Humidities.
A-6
Relative Humidity vs Time - Crown Mine (125°F)
0
0.1
0.2
0.3
0.4
0.5
0.6
0.7
0.8
0.9
1
0 5 10 15 20 25 30 35 40 45 50
Time (min)
Rel
ativ
e H
umid
ityfrom test
from calculation(exp.)
A2Vair,in=1.1m/sTa,in ; Tsurf = 125Fho = 8"weight: 2.5kgelutriation: 3.10%
Figure A8: Comparison Between Measured and Predicted Exit Air Relative Humidities -Crown 2 Coal.
Moisture reduction
0.00E+00
5.00E-02
1.00E-01
1.50E-01
2.00E-01
2.50E-01
3.00E-01
0.000 0.050 0.100 0.150 0.200 0.250 0.300Test result(kg water/kg dry mass)
Sim
ulat
ion
resu
lt(kg
wat
er/k
g dr
y m
ass)
BuckheartCrown mineViper mine
Figure A9: Comparison Between Measured and Predicted Moisture Reductions. All Tests.
A-7
Exit Air Temperature
0.000
20.000
40.000
60.000
80.000
100.000
120.000
140.000
0.000 20.000 40.000 60.000 80.000 100.000 120.000 140.000Test result(F)
Sim
ulat
ion
resu
lt(F)
BuckheartCrown mineViper mine
Figure A10: Comparison Between Measured and Predicted Average Exit Air Temperatures. All Tests.
Outlet Specific Humidity
0.00E+00
2.00E-03
4.00E-03
6.00E-03
8.00E-03
1.00E-02
1.20E-02
1.40E-02
1.60E-02
1.80E-02
2.00E-02
0.000 0.002 0.004 0.006 0.008 0.010 0.012 0.014 0.016 0.018 0.020Test result(0.001g/g dry air)
Sim
ulat
ion
resu
lt(0.
001g
/g d
ry a
ir)
BuckheartCrown mineViper mine
V6
V3
Figure A11: Comparison Between Measured and Predicted Average Exit Air Specific Humidities. All Tests.
A-8
Relative Humidity
0.00E+00
1.00E-01
2.00E-01
3.00E-01
4.00E-01
5.00E-01
6.00E-01
0.000 0.100 0.200 0.300 0.400 0.500 0.600Test result(%)
Sim
ulat
ion
resu
lt(%
)
BuckheartCrown mineViper mine
V6
Figure A12: Comparison Between Measured and Predicted Average Exit Air Relative Humidities. All Tests.
Initial Drying rate
0.00E+00
5.00E-03
1.00E-02
1.50E-02
2.00E-02
2.50E-02
3.00E-02
0 0.005 0.01 0.015 0.02 0.025 0.03
Test result(kg/min)
Sim
ulat
ion
relu
lt(kg
/min
)
BuckheartCrown mineViper mine
A3
A5 V3
V6
V1
A1
R2
Figure A13: Comparison Between Measured and Predicted Initial Drying Rates. All Tests.
PUBLICATIONS AND PRESENTATIONS REPORT September 1, 2006, through August 31, 2007
Project Title: FLUIDIZED BED DRYING OF HIGH MOISTURE ILLINOIS
COALS USING POWER PLANT WASTE HEAT: PHASE I ICCI Project Number: 06-01/2.1A-1 Principal Investigator: Dr. Edward K. Levy, Energy Research Center, Lehigh University Other Investigators: Dr. Nenad Sarunac and Mr. Wei-Cheng Wang, Energy Research
Center, Lehigh University Project Manager: Joseph C. Hirschi, ICCI
PUBLICATIONS AND PRESENTATIONS No presentations were given nor were any publications submitted.
EQUIPMENT INVENTORY REPORT September 1, 2006, through August 31, 2007
Project Title: FLUIDIZED BED DRYING OF HIGH MOISTURE ILLINOIS
COALS USING POWER PLANT WASTE HEAT: PHASE I ICCI Project Number: 06-01/2.1A-1 Principal Investigator: Dr. Edward K. Levy, Energy Research Center, Lehigh University Other Investigators: Dr. Nenad Sarunac and Mr. Wei-Cheng Wang, Energy Research
Center, Lehigh University Project Manager: Joseph C. Hirschi, ICCI
LIST OF EQUIPMENT PURCHASED No equipment was purchased.
Copyright © 2022 FDOKUMEN