Studies of inorganics added to low-rank coals for catalytic gasification
24
Studies of inorganics added to low-rank coals for catalytic gasification G. Domazetis a, * , J. Liesegang b,c , B.D. James a,b a Chemistry Department, La Trobe University, Victoria, 3086, Australia b Centre for Materials and Surface Science, La Trobe University, Victoria, 3086, Australia c Physics Department, La Trobe University, Victoria, 3086, Australia Received 25 February 2003; received in revised form 30 September 2003; accepted 30 March 2004 Abstract Inorganic complexes were added to low-rank coals by step-wise pH adjustment of a mixture of inorganic solution and brown coal while avoiding the formation of precipitates. The nature and amounts of the added inorganic depend on the pH of the coal/solution mixture and concentration of inorganic salts. The amount of hydroxide added for high loading of iron to coal is consistent with added multinuclear complexes. Computer generated models of brown coal with multi-iron species account for observed OH/Fe ratios. X-ray photoelectron spectroscopy (XPS) data for these samples are consistent with multi-iron species in coal. Computer molecular modelling of two brown coal models with added inorganics shows monodentate carboxyl coordination to metals is sterically favoured. Mononuclear Fe(III) with bidentate carboxyl coordination form distorted structures and are energetically unfavoured. Modelling indicates significant reductions in partial charges on metal centres, consistent with a redistribution of electron density on complexation. Low temperature pyrolysis of brown coals with added inorganics provides increased yields of gases, no detectable tar and lower char, compared with acid washed coals. Gasification of these coals using a nitrogen/oxygen mix at 150–200 8C yields CO, while steam gasification at 250–450 8C yields CO 2 , CO and CH 4 . Iron oxide/carbonate complexes are postulated during the pyrolysis and gasification. D 2004 Elsevier B.V. All rights reserved. Keywords: X-ray photoelectron spectroscopy; Brown coal; Gasification 0378-3820/$ - see front matter D 2004 Elsevier B.V. All rights reserved. doi:10.1016/j.fuproc.2004.03.009 * Corresponding author. Fax: +61-3-9479-1399. E-mail address: [email protected] (G. Domazetis). Fuel Processing Technology 86 (2005) 463– 486 www.elsevier.com/locate/fuproc
-
Upload
independent -
Category
Documents
-
view
3 -
download
0
Transcript of Studies of inorganics added to low-rank coals for catalytic gasification
Fuel Processing Technology 86 (2005) 463–486
www.elsevier.com/locate/fuproc
Studies of inorganics added to low-rank coals for
catalytic gasification
G. Domazetisa,*, J. Liesegangb,c, B.D. Jamesa,b
aChemistry Department, La Trobe University, Victoria, 3086, AustraliabCentre for Materials and Surface Science, La Trobe University, Victoria, 3086, Australia
cPhysics Department, La Trobe University, Victoria, 3086, Australia
Received 25 February 2003; received in revised form 30 September 2003; accepted 30 March 2004
Abstract
Inorganic complexes were added to low-rank coals by step-wise pH adjustment of a mixture of
inorganic solution and brown coal while avoiding the formation of precipitates. The nature and
amounts of the added inorganic depend on the pH of the coal/solution mixture and concentration
of inorganic salts. The amount of hydroxide added for high loading of iron to coal is consistent
with added multinuclear complexes. Computer generated models of brown coal with multi-iron
species account for observed OH/Fe ratios. X-ray photoelectron spectroscopy (XPS) data for these
samples are consistent with multi-iron species in coal. Computer molecular modelling of two
brown coal models with added inorganics shows monodentate carboxyl coordination to metals is
sterically favoured. Mononuclear Fe(III) with bidentate carboxyl coordination form distorted
structures and are energetically unfavoured. Modelling indicates significant reductions in partial
charges on metal centres, consistent with a redistribution of electron density on complexation. Low
temperature pyrolysis of brown coals with added inorganics provides increased yields of gases, no
detectable tar and lower char, compared with acid washed coals. Gasification of these coals using
a nitrogen/oxygen mix at 150–200 8C yields CO, while steam gasification at 250–450 8C yields
CO2, CO and CH4. Iron oxide/carbonate complexes are postulated during the pyrolysis and
gasification.
D 2004 Elsevier B.V. All rights reserved.
Keywords: X-ray photoelectron spectroscopy; Brown coal; Gasification
* Corresponding author. Fax: +61-3-9479-1399.
0378-3820/$ -
doi:10.1016/j.
E-mail add
see front matter D 2004 Elsevier B.V. All rights reserved.
fuproc.2004.03.009
ress: [email protected] (G. Domazetis).

G. Domazetis et al. / Fuel Processing Technology 86 (2005) 463–486464
1. Introduction
Research on catalysts for low temperature gasification of low-rank coals is currently
carried out in our laboratory by: (i) the systematic study of the nature of inorganic
complexes added to low-rank coals, (ii) differentiation between the effect of the inorganic
complex on pyrolysis from gasification at low temperature, (iii) characterisation of
inorganic species during devolatilisation and gasification and (iv) selection of effective
catalysts for further study using a laboratory gasification apparatus.
Past research on catalysts for low-rank coal gasification has centred on relating
effectiveness of catalysts added to the coal with the method(s) of addition and
characterisation of the inorganic species in coal. The concept that inorganic salts may
be dion-exchangedT into low-rank coals has gained wide interest owing to the presence of
carboxylic and phenolic functional groups in such coals. Examples of inorganic ions added
to low-rank coals have been Na, K, Mg, Ca and Ba by Otake and Walker Jr. [1], Ca and Ni
by Ohtsuka and Asami [2], and Ni by Shirai et al. [3,4]. Minerals and inorganics present in
coals may exert a catalytic influence on gasification, and this is particularly so for low-
rank coals with significant amounts of dion-exchangedT inorganics. The catalytic activity
of the inorganic species added to low-rank coals has been reported to be dependent on
temperature and type of complex added to the coal. The transformations of the inorganic
complex during heating, devolatilisation and gasification by either steam or carbon dioxide
have been studied. Little information exists, however, on the catalytically active species at
the various transformations of low-rank coals during pyrolysis and gasification.
Gasification has been described by Kapteijn and Moulijn [5] as seven consecutive steps,
including transport of gases to and from the coal, adsorption and desorption steps to the
active sites and chemical reaction. A mechanism for Fe-catalysed gasification has also
been proposed by Huttinger et al. [6] and possible modes of action for Fe/Na by Suzuki et
al. [7], kinetics for Fe gasification by McCarthy [8] and active species proposed for dionexchangedT Fe by Ohtsuka and Asami [9]. Arrhenius plots for reaction of carbon dioxide
with pure carbon were compared with those for carbon doped with iron and nickel by
Marsh and Adair [10].
The catalysts of greatest interest are those of iron, calcium and nickel. Our overall
objective is to develop catalysts active in the temperature range 200–800 8C for
gasification of low-rank coals, by using gases containing oxygen and steam to maximise
the production of carbon monoxide and hydrogen. In this paper we report results on the
solution chemistry during addition of inorganics to brown coals, computer modelling of
brown coal and iron species, and the low temperature pyrolysis and gasification of acid
washed coals and coals with added inorganics to obtain a relative distribution of products
for each.
2. Experimental
Brown coal with low levels of silica and clay was selected for these studies, obtained
from the La Trobe Valley in Victoria, Australia (Yallourn and Loy Yang Open Cut Mines)
and Germany (Rheinbraun GBT). All chemicals used were AR grade.
G. Domazetis et al. / Fuel Processing Technology 86 (2005) 463–486 465
2.1. Addition of inorganics to low-rank coals
2.1.1. Acid washed coal
Brown coal was crushed using a mortar and pestle and passed through a Mesh 10 sieve
(1.68 mm opening). Coal was acid washed by mixing 100 g of raw coal with 500 ml of a
10:1 solution of de-ionised water and conc. HCl, heating with stirring at 90–100 8C for 4
h. The coal was filtered, 500 ml of de-ionised water added and the mixture heated with
stirring for another 4 h. The coal was washed with de-ionised water and filtered through a
Buchner funnel until the filtrate had a constant pH. The acid washed coal was stored in
plastic airtight jars. The ash content of dry acid washed coals at 1000 8C was ~0.1% of the
dry weight of the coals.
2.1.2. Adding inorganics to coal
A 0.02 M NaOH solution was slowly added to a solution of the selected salt and the
addition stopped before the solution became cloudy. The resultant solution was mixed with
coal and the pH readjusted over a period of time to its initial value. The coal was filtered
off and the pH of the solution increased and then re-mixed with the coal. These steps were
repeated, avoiding any cloudy formation in the solution until most of the inorganic had
been added to the coal. A number of steps were needed for appreciable amounts of
additives such as iron and nickel to be added to the coal. The amount of added inorganic
estimated during each step was determined by measuring the inorganic remaining in
solution using atomic absorption, after each step. When the solution/filtrate contained b1%
of the original inorganic, the addition was terminated.
The concentration of the particular inorganic salt solution was set to a value that reflects
the amount added to the coal. Thus, greater concentrations were used when a greater
amount of inorganic was added. The method described below for the addition of Fe(II) is
typical.
A solution of 27.8 g of FeSO4d 7H2O in 500 ml water was adjusted to pH~4 using a
solution of NaOH. (Some yellow colour may appear due to air oxidation of Fe(II) to Fe(III).)
The solution was filtered to remove the slightly cloudy precipitate. One hundred grams of
moist, acid washed German brown coal was added with stirring. The pH of the coal/iron
solution mixture was measured as 2.6 using a combined glass electrode. A 0.02 M NaOH
solution was slowly added to the stirred mixture until the pH had returned to V4. The coalwas filtered off and the solution carefully treated with NaOH without turning cloudy. The
coal was re-mixed with the solution and stirred while the pH was continuously re-adjusted.
This was repeated until N99% of the iron had been added to the coal (final pH~5). The coal/
water mixture was filtered, and the coal washed with copious amounts of water, until iron
was no longer detected in the filtrate. The wet coal was stored in a plastic airtight jar.
2.1.3. Mixtures of inorganics added to coal
The preparation of a coal with nickel, iron and calcium additives was typical of this
procedure: to a solution of 0.2 M Ni(NO3)2d 6H2O, 0.1 M Fe(NO3)3d 9H2O and 0.1 M
CaCl2 (pH 1.1), a 0.02 M NaOH solution was added with stirring until the mixture was
near pH 4. The mixture was filtered if it became cloudy. The clear solution was added to
100 g of German acid washed coal with stirring. The coal/salts mixture was adjusted from
G. Domazetis et al. / Fuel Processing Technology 86 (2005) 463–486466
near pH 2 using NaOH solution by filtering off the coal and adjusting the solution pH, as
previously described. These steps were repeated and the addition completed when the pH
remained unchanged at ~pH 5. The coal was separated by filtration, and continuously
washed with distilled water until nickel could not be detected in the wash. The wet coal
was stored in an airtight plastic jar.
2.2. X-ray photoelectron spectroscopy (XPS)
XPS experiments were performed using a Kratos Axis Ultra spectrometer with
monochromatised Al Ka radiation (1486.6 eV) operating at 150 W. Both survey and high-
resolution region spectra were recorded. The spectrometer energy scale was calibrated
using the Au 4f7/2 photoelectron peak at electron binding energy EB=83.98 eV. Spectra
were charge corrected with reference to C–C species at EB=285.0 eV. Such surface charge
neutralisation was used to effect a slight improvement in peak resolution. The analysis area
was 700�300 Am2.
Spectra were quantified using Kratos XPS elementary sensitivity factor data after
background subtraction and the fitting of Gaussian (70%)/Lorentzian (30%) component
peaks. The full width at half-maximum (FWHM) of the peaks was maintained constant or
within a chosen range for all components in a particular spectrum. Atomic concentrations
were recalculated by assuming that coal contained 5% by weight of hydrogen, and
uncertainties for all fitted spectra were estimated to be F10% of the measured value.
2.3. Characterisation of the coal
Coals containing additives were characterised by their moisture, total ash content, ash
elemental analysis and identification of ash crystalline phases. Acid washed coal with
~0.1% ash was used for all work involving additives.
Moisture was usually determined by heating a known weight of the coal sample in a
drying oven to constant weight. Moisture in coals with added iron and calcium was
determined by (i) air-drying the coal to constant weight over 5 days and then heating the
coal at 60 8C to constant weight (~4 h), and (ii) by heating a known weight of treated coal
in a pre-weighed flask purged with nitrogen to a constant weight—the temperature was
usually maintained at 100–110 8C; but experiments were also performed at higher
temperatures and the moisture collected with a condenser, the water being quantified by
measuring the amount boiling at 100 8C from the condensate.
Ashing was carried out at low temperatures for samples of coal with iron and/or
calcium. Initially, the sample was heated to 150–180 8C until N80% of the weight had been
lost. The char was then heated at 300 8C to provide, in the case of iron, an orange coloured
magnetic ash. Coals with nickel and cobalt additives were heated to 300 8C to remove
most of the coal, and then the residue heated to a constant weight at 600–700 8C.
2.4. X-ray fluorescence analysis (XRF)
Ash samples were analysed using XRF as reported by Metz and Domazetis [11].
Samples were prepared by ashing the coal sample at 1000 8C in a muffle furnace. The ash
G. Domazetis et al. / Fuel Processing Technology 86 (2005) 463–486 467
was pulverised to b65 Am using an automated mortar and pestle, and accurate weights of
the ash (1.0000 g) thoroughly mixed with 4.0000 g of fusion flux (Norrish 12:22 lithium
tetraborate/lithium metaborate). The mixture was placed in a platinum/5% gold crucible
and melted into a liquid at 1050 8C. After 10 min, the melt was poured into a preheated 32
mm mould at 950 8C, where it cooled to a glass disc, which was then placed into the XRF
holder for analysis. A Siemens SRS303as XRF spectrometer with Rh end window was
used, the X-ray tube operating at 40 mA/75 kV. Calibration in both cases was carried out
using standard reference materials (SRM)-SDC-1 (mica schist), DNC-1 (diabase), STM-1
(syenite) and QLO-1 (quartz latite).
2.5. X-ray diffraction (XRD)
X-ray diffraction data for ashes were obtained on finely ground ashes using a Siemens
Kristalloflex D5000 Diffractometer.
2.6. Low temperature pyrolysis and gasification
2.6.1. Pyrolysis
This was carried out using a glass cold-finger distillation apparatus having a
thermometer within the coal bed, and the system purged with nitrogen. The condensed
liquids and tars were collected in a closed flask. The coals were heated to ~350 8C until
gases or tars were no longer released. Char remaining in the heated flask was cooled under
nitrogen, collected and weighed. The entire apparatus was weighed before and after the
pyrolysis experiment to determine gas mass loss by difference. The char remaining in the
container was collected for XPS studies. Water content was determined by distilling the
tar/liquid at 100 8C and weighing the condensed water.
2.6.2. Air gasification
Initial studies were carried out using either an open heating furnace or a tubular furnace,
in which weighed samples of either raw coals or coals with catalysts were placed in a
crucible and allowed to heat to programmed temperatures of 110, 130–170 and 300 8C.The samples were then weighed to determine the mass loss.
Studies were carried out to differentiate between gases due to pyrolysis and those due
to oxygen gasification. Brown coals containing Fe/Ca and Fe/Ni/Ca catalysts were
heated under nitrogen in round bottom flasks each equipped with a thermometer, and in
which the water vapour from the gas stream was removed using a molecular sieve.
These experiments were performed at specific temperatures over the temperature range
150–350 8C. The evolving gas was sampled in a standard gas cell for analysis using a
Perkin Elmer 1600-X FTIR instrument. The gas entering the apparatus was then
switched from nitrogen to air, or an oxygen/nitrogen mixture, and the resultant gas
evolving from the coal again dried, collected and analysed in a similar manner. The
gases under nitrogen were due to pyrolysis, while those produced with an air stream, or
an oxygen/nitrogen stream, result from gasification. The IR spectra of evolved gases
contained peaks due to CO, CO2 and CH4. The FTIR cell was calibrated with standard
mixtures of CO and CO2.
G. Domazetis et al. / Fuel Processing Technology 86 (2005) 463–486468
2.6.3. Steam gasification
Coals were heated under steam using a quartz vessel heated by a furnace over the
temperature range 250–500 8C. The volatiles and excess steam were condensed out, while
gases were collected in an infrared gas cell in which CO, CO2 and CH4 were monitored.
Temperatures were measured using a Type J thermocouple with a Digi-Sense temperature
readout.
2.7. Molecular modelling
Molecular structures for various iron compounds in this work are based on reports in
the literature and where available, on published crystal structures. Molecular structures
were optimised using the Fujitsu CAChe Ab Initio V 5.04 Windows software package,
initially with molecular mechanics using augmented MM2 and MM3 parameters, followed
by MOPAC2002 geometry optimisation using either AM1 or PM5 Hamiltonian. Electron
density for models with transition metals was calculated on structures optimised with
MM3, using Extended Hqckel (EH) with CAChe.
Large models of lignite were initially optimised using CAChe molecular mechanics,
followed by an initial MOZYME optimisation, and then submitted to the Australian
Partnership in Advanced Computing High Performance Computing facility (APAC-HPC)
for optimisation using MOPAC2002.
3. Results and discussion
3.1. Addition of inorganic salts to brown coals
Inorganics have been added to acid washed brown coals by adjusting the pH of the
mixture of coal and inorganic solution. Care was taken to ensure inorganic precipitates did
not form, and occasionally the treated coal was washed with a solution of dilute acetic
acid, as an additional precaution to ensure that precipitated hydroxide would not
contaminate the sample. During the latter stages of samples with high loading of
inorganics, the drop in pH of the mixture was slow and these required 4 weeks to prepare.
Table 1 lists a number of samples treated with inorganic salts at specific pH values, with
the amount of inorganic added expressed as the oxide. Table 2 provides the results of
elemental analysis for inorganics in coals used in these studies. Samples with high
loadings of inorganics also contained some sodium, retained by the coal from NaOH used
in the pH adjustment.
The first step was to adjust the pH of inorganic solution without forming hydroxide
precipitate. The acid washed coal was then added to the solution with stirring and
monitoring the change in pH. The extent of the drop in pH of the mixture differed for
each of the inorganic salts; e.g., for Fe and Ni solutions, the pH of a brown coal/water
mixture changed from pH~3 to pHb2, whereas for Zn and Al solutions the pH fell
from ~4 to ~3. The change in pH also depended on the concentration of solution. This
type of acid/base chemistry behaviour for brown coal is well documented, as for
example by Ohtsuka and Asami [2], who reported the release of CO2 from a mixture
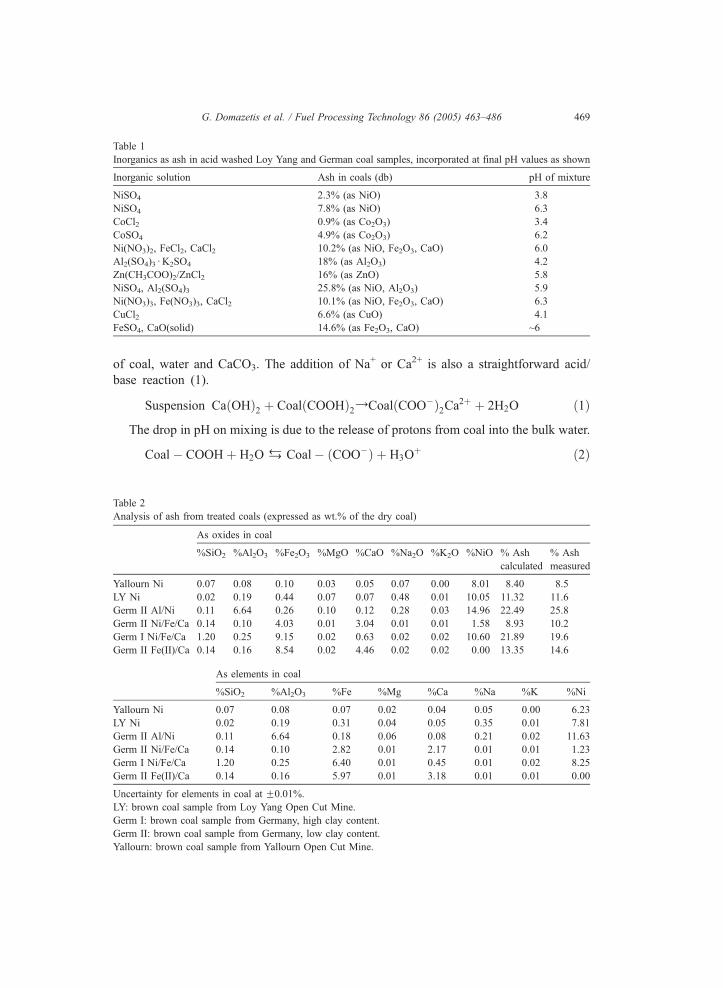
Table 1
Inorganics as ash in acid washed Loy Yang and German coal samples, incorporated at final pH values as shown
Inorganic solution Ash in coals (db) pH of mixture
NiSO4 2.3% (as NiO) 3.8
NiSO4 7.8% (as NiO) 6.3
CoCl2 0.9% (as Co2O3) 3.4
CoSO4 4.9% (as Co2O3) 6.2
Ni(NO3)2, FeCl2, CaCl2 10.2% (as NiO, Fe2O3, CaO) 6.0
Al2(SO4)3d K2SO4 18% (as Al2O3) 4.2
Zn(CH3COO)2/ZnCl2 16% (as ZnO) 5.8
NiSO4, Al2(SO4)3 25.8% (as NiO, Al2O3) 5.9
Ni(NO3)3, Fe(NO3)3, CaCl2 10.1% (as NiO, Fe2O3, CaO) 6.3
CuCl2 6.6% (as CuO) 4.1
FeSO4, CaO(solid) 14.6% (as Fe2O3, CaO) ~6
G. Domazetis et al. / Fuel Processing Technology 86 (2005) 463–486 469
of coal, water and CaCO3. The addition of Na+ or Ca2+ is also a straightforward acid/
base reaction (1).
Suspension CaðOHÞ2 þ CoalðCOOHÞ2YCoalðCOO�Þ2Ca2þ þ 2H2O ð1Þ
The drop in pH on mixing is due to the release of protons from coal into the bulk water.
Coal� COOHþ H2O f Coal� ðCOO�Þ þ H3Oþ ð2Þ
Table 2
Analysis of ash from treated coals (expressed as wt.% of the dry coal)
As oxides in coal
%SiO2 %Al2O3 %Fe2O3 %MgO %CaO %Na2O %K2O %NiO % Ash
calculated
% Ash
measured
Yallourn Ni 0.07 0.08 0.10 0.03 0.05 0.07 0.00 8.01 8.40 8.5
LY Ni 0.02 0.19 0.44 0.07 0.07 0.48 0.01 10.05 11.32 11.6
Germ II Al/Ni 0.11 6.64 0.26 0.10 0.12 0.28 0.03 14.96 22.49 25.8
Germ II Ni/Fe/Ca 0.14 0.10 4.03 0.01 3.04 0.01 0.01 1.58 8.93 10.2
Germ I Ni/Fe/Ca 1.20 0.25 9.15 0.02 0.63 0.02 0.02 10.60 21.89 19.6
Germ II Fe(II)/Ca 0.14 0.16 8.54 0.02 4.46 0.02 0.02 0.00 13.35 14.6
As elements in coal
%SiO2 %Al2O3 %Fe %Mg %Ca %Na %K %Ni
Yallourn Ni 0.07 0.08 0.07 0.02 0.04 0.05 0.00 6.23
LY Ni 0.02 0.19 0.31 0.04 0.05 0.35 0.01 7.81
Germ II Al/Ni 0.11 6.64 0.18 0.06 0.08 0.21 0.02 11.63
Germ II Ni/Fe/Ca 0.14 0.10 2.82 0.01 2.17 0.01 0.01 1.23
Germ I Ni/Fe/Ca 1.20 0.25 6.40 0.01 0.45 0.01 0.02 8.25
Germ II Fe(II)/Ca 0.14 0.16 5.97 0.01 3.18 0.01 0.01 0.00
Uncertainty for elements in coal at F0.01%.
LY: brown coal sample from Loy Yang Open Cut Mine.
Germ I: brown coal sample from Germany, high clay content.
Germ II: brown coal sample from Germany, low clay content.
Yallourn: brown coal sample from Yallourn Open Cut Mine.
G. Domazetis et al. / Fuel Processing Technology 86 (2005) 463–486470
For solutions of iron and nickel salts, the amount of metal species added to coal after
mixing, without pH adjustment, is b1% of the dry weight of coal. The coal does not have a
great affinity for the iron and nickel solution species under these conditions; but when the
pH of the mixture is slowly adjusted (care taken to avoid forming hydroxide precipitates),
the amount of inorganic added increases significantly. A step-wise method was used,
filtering out the coal after mixing, adjusting the pH of the resulting clear solution, then
adding the coal and adjusting the pH of the mixture to that of the solution prior to mixing
with the coal, and so on, until almost all of the inorganic was added to the coal. During
these steps, the pH of the inorganic solution always fell when the coal was added, due to
release of protons from the coal functional groups as the inorganic species were
incorporated within the coal molecular structure. Importantly, the change in pH of the coal/
water mixture also influences the inorganic hydrolysis chemistry and thus the relative
distribution of the various inorganic complex species in solution. The chemistry in this
discussion can be illustrated using iron complexes. The aqueous chemistry of iron(III) is
summarised by the general hydrolysis reaction (3):
xFe3þ þ yH2OfFexðOHÞð3x�yÞþy þ yHþ ð3Þ
A number of aquated Fe(III) species are formed over the range pH 2–6 as reported by
Hong-Xiao and Stumm [14] and Cornell and Schwertmann [15], and include:
Type AZFe3þ; Fe2ðOHÞ4þ2 ; Fe3ðOHÞ5þ4 ; Type BZFe4ðOHÞ6þ6 ;
Type C� FexðOHÞð3x�yÞþy ; Type DZFexOzðOHÞð3x�2z�yÞþ
y
The nature of the Fe species depends on the pH and the total concentration of iron salt.
Increasing the concentration of iron solution increases the amount of Fe added to coal. For
example, a 2% addition of Fe to coal required ~400 ml of a 0.1 M solution of Fe(NO3)3,
whereas a 10% addition of Fe required ~500 ml of 0.4 M solution of Fe(NO3)3. On mixing
the salt, the pH of such an iron(III) solution is between 1 and 2 due to reaction (4), e.g.
Fe(NO3)3 (hydration molecules not shown):
2FeðNO3Þ3 þ 2H2OfFe3þ þ FeðOHÞ2þ þ H3Oþ þ 6NO�
3 ð4Þ
Adjusting the pH in reaction (4) with OH� shifts the equilibrium to the right. As the
concentration of Fe(III) drops and the pH increases, the distribution of species changes to
include significant amounts of the multi-iron species referred to above. Additionally, as
coal and the iron solution are mixed, the acid from the coal shifts the iron hydrolysis
reaction to the left (reaction (5)). This shift in the equilibrium is countered by the addition
of [OH]� that reacts with released H3O+, shifting the equilibrium to the right. Thus, the
amount of iron added to the coal increases and also the relative abundance of polymeric
species in solution increases. We may illustrate this by using as an example a type C
complex, in reaction (5):
Coal ðCOOHÞþ½Fe3ðOHÞ8d 6H2O�þ þ H2Of½CoalðCOOÞ�ðFe3ðOHÞ8d 6H2OÞþ�þH3Oþ
ð5Þ
If the relationship between the amount of Fe taken up by the coal and the amount of
OH� added were a straightforward stoichiometric ratio such as 1:2 or 1:3, then it could

G. Domazetis et al. / Fuel Processing Technology 86 (2005) 463–486 471
well be that Fe(OH)2+ or Fe(OH)2+ were the relevant iron(III) species in reaction (5). A
correlation between the number moles of OH� added to maintain a constant pH and
amount of iron in the coal may be made. For a species such as Fe(OH)2+, the mole ratio
[OH�]:[Fe] would be 2:1 to form the iron species, and an additional [OH�] (for the same
amount of iron in coal, reaction (6)) to adjust the pH to that prior to mixing the coal and
solution, thus providing a [OH�]/[Fe] ratio of 3:1.
FeðOHÞþ2 þ Coal� COOHþ OH�Y½CoalCOO�½FeðOHÞ2� þ H2O ð6Þ
In our work, the amount of [OH�] used for known amounts of iron added to coal was
consistent with the formation of a mixture of polymeric iron species. Although we may use
parameters B and B* of Hong-Xiao and Stumm [14] as a measure of the polymerisation of
iron species, an accurate and detailed analysis using this method needs to include the
partitioning of iron species between the aqueous phase and the solid phase of coal, and
such a treatment is outside the scope of this paper. The Hong-Xiao and Stumm method
provides a series of B* values for solution species, and results using this method show the
bulk of the iron species are Types B, C and D during the addition of most of the iron to the
coal. A simpler method may be based on a B value at the final point in the addition, to give
an overall [OH�]/[FeIII] ratio as a basic indicator of polymeric species. This overall B
value for Fe wt.%N5% in coal is between 1.5 and 1.7, indicative of Type D iron species
(Hong-Xiao and Stumm B value for Type D is 1.0–2.3).
XPS data for surface species of coal samples with 5–10 wt.% of Fe (db) added,
discussed in Section 3.5.1, provide O/Fe ratios in the range 1.7 to 1.9, consistent with
polymeric iron species. Although the XPS technique measures near-surface region species
only, it is nonetheless consistent with the solution data.
Additionally, we have used a computer model of coal to relate the amount of iron species
added to the coal and the positive charges on each particular iron complex considered, with
the number of carboxyl groups available in brown coal, to determine the number of positive
charges that can be accommodated by the coal for 5%, 10% and 15% additions of iron. We
illustrate this by usingModel A (below) constructed to aMWt~10000, in which iron at 10%
dry weight is equivalent to 19Fe3+ and 19Fe(OH)2+, but contains 18 carboxyl groups, and
thus cannot provide sufficient negative charges for all except perhaps 18Fe(OH)2+ species.
For cases with N10% loading of FeIII, brown coal cannot accommodate even singly charged
species such as Fe(OH)2+. Our molecular models using multi-iron polymeric species can
model the high loading of iron complexes added to coal.
3.2. Structural models for lignite and inorganic complexes in lignite
3.2.1. Modelling and iron species addition
Models of brown coal for computer molecular modelling studies developed by
Domazetis [16] have been: (1) Model A—based on the reported elemental analysis,
functional groups distribution, C/H ratio, aliphatic/aromatic ratio and major fragments
observed by pyrolysis; and (2) Model B—based on reports by Faulon et al. [12] consisting
either of a lignin helix modified to reflect the changes reported for lignification (Model
B1) or a version representative of brown coal (Model B2) as proposed by Hatcher [13].
G. Domazetis et al. / Fuel Processing Technology 86 (2005) 463–486472
Model A was built to a molecular weight of ~10,000 and larger models made by
combining 2 and 4 units of the model into clusters held together by H-bonding and
electrostatic interactions. Larger molecular models of Model B were constructed by
combining 2 and 4 single molecules into a macromolecule and stabilised by H-bonding.
Partial charges for smaller molecules have been calculated with CAChe with the PM5
Hamiltonian or MOPAC2002 with the PM5 Hamiltonian at the APAC-HPC facility. Partial
charges for large molecules have been obtained with MOZYME, and for models with iron
complexes, from single point energy calculations (1SCF) with MOPAC2002 at the APAC-
HPC facility, and electron density calculations using EH with CAChe.
We have carried out numerous modelling studies of various iron hydroxy complexes
added to our models of brown coal. For particular multi-iron species, these studies provide
calculated O/Fe ratios, and equate the available carboxyl groups with the number of
positive charges on the iron complex at a given wt.% of iron in the coal. The following
examples illustrate this (brown coal is heterogeneous and analyses differ significantly for
samples obtained at different locations and various open cut mines. The data given are
typical):
Coal model formula C259H241NO76S: MWt=4615.7;
Number of COOH groups=5; analysis C 67.4%, H 5.26%, O 26.3%, N 0.3%, S 0.7%.
C/O ratio 3.4:1
Typical analysis of brown coals (daf)
Loy Yang: C 67.8%, H 4.9%, O 26.4%, N 0.32%, S 0.6% (C/O ratio 3.4:1)
German: C 68.5%, H 4.8%, O 24.8%, N 0.8%, S 1.1% (C/O ratio 3.7:1)
Iron species: one [Fe3(OH)8]+, one carboxyl group for one molecule of iron complex.
Formula C259H247Fe3NO84S: analysis: C 63.25%, H 5.08%, O 27.33%;
C/O ratio 3.1:1 (oxygen from coal=76, oxygen from iron complex=8)
Wt.% Fe=3.4, ratio O/Fe=2.7:1.
Iron species: two [Fe3(OH)7]2+, two carboxyl groups per iron complex.
Formula C259H251Fe6NO90S: analysis: C 59.58%, H 4.92%, O 28.19%;
C/O ratio 2.9:1 (oxygen from coal=76, oxygen from iron complex=14)
Wt.% Fe=6.42, ratio of O/Fe=2.3:1.
Thus, a coal model with five negative carboxyl groups may complex with one
[Fe3(OH)8]+ and two [Fe3O7]
2+ to contain 9.8 wt.% Fe and a ratio O/Fe of 2.4:1. The
overall C/O ratio for the model is 2.6:1 (reduced from that of the coal model without iron
complex) by the 22 oxygen atoms from iron complexes.
If five negatively charged carboxyl groups formed complexes with five [Fe3(OH)8]+
species, the iron content in coal would be ~13 wt.%, with a ratio O/Fe of 2.7:1, and so on.
Our modelling and solution data are consistent with a OH/Fe ratio indicative of multi-
iron species added to coal. The nature of such species is important, but their exact structure
cannot be contemplated because the chemistry always involves a variety of iron-oxy-
hydroxy complexes.
G. Domazetis et al. / Fuel Processing Technology 86 (2005) 463–486 473
3.2.2. Molecular models of brown coal and inorganic structures
Modelling enables us to consider: (i) the amount of inorganic species that may be held
within the coal model, (ii) steric constraints that may or may not occur when particular
coordination of carboxyl to the inorganic species is proposed, and (iii) the relative changes
of electron distribution that may occur, as illustrated by the partial charges and bond
polarities, when the inorganic complex is added to the coal molecule.
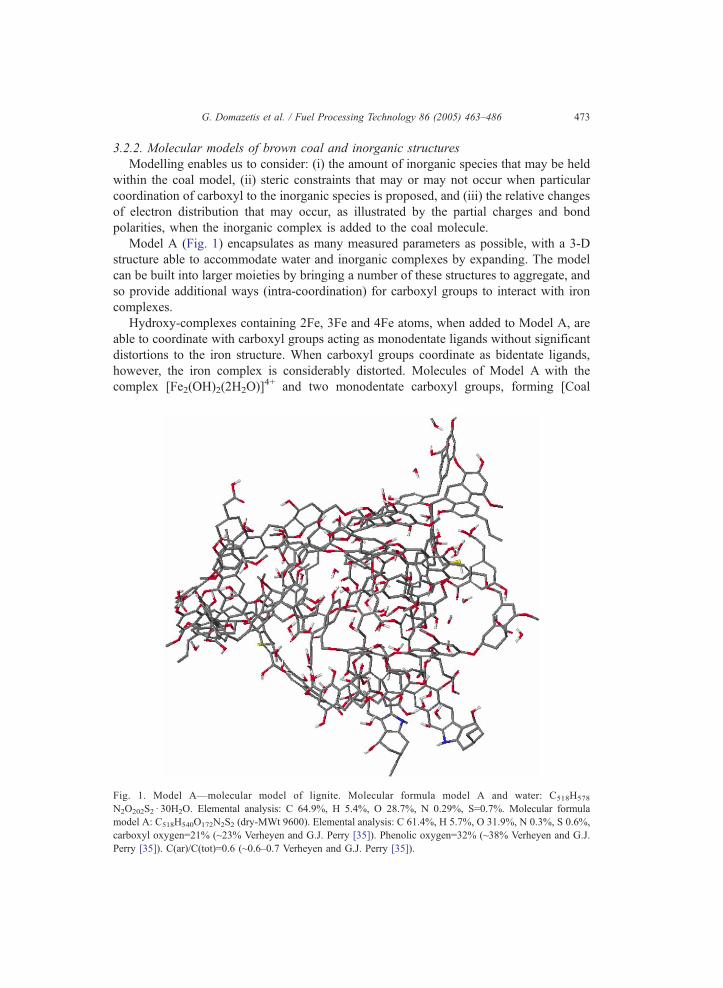
Model A (Fig. 1) encapsulates as many measured parameters as possible, with a 3-D
structure able to accommodate water and inorganic complexes by expanding. The model
can be built into larger moieties by bringing a number of these structures to aggregate, and
so provide additional ways (intra-coordination) for carboxyl groups to interact with iron
complexes.
Hydroxy-complexes containing 2Fe, 3Fe and 4Fe atoms, when added to Model A, are
able to coordinate with carboxyl groups acting as monodentate ligands without significant
distortions to the iron structure. When carboxyl groups coordinate as bidentate ligands,
however, the iron complex is considerably distorted. Molecules of Model A with the
complex [Fe2(OH)2(2H2O)]4+ and two monodentate carboxyl groups, forming [Coal
Fig. 1. Model A—molecular model of lignite. Molecular formula model A and water: C518H578
N2O202S2d 30H2O. Elemental analysis: C 64.9%, H 5.4%, O 28.7%, N 0.29%, S=0.7%. Molecular formula
model A: C518H540O172N2S2 (dry-MWt 9600). Elemental analysis: C 61.4%, H 5.7%, O 31.9%, N 0.3%, S 0.6%,
carboxyl oxygen=21% (~23% Verheyen and G.J. Perry [35]). Phenolic oxygen=32% (~38% Verheyen and G.J.
Perry [35]). C(ar)/C(tot)=0.6 (~0.6–0.7 Verheyen and G.J. Perry [35]).
G. Domazetis et al. / Fuel Processing Technology 86 (2005) 463–486474
(COO�)2] [Fe2(OH)2(2H2O)]2+ are readily constructed, the remaining positive charges
provided by ionized carboxyl groups at some distance from the Fe(III) complex.
Additional coordination by phenol groups can replace coordinated water molecules.
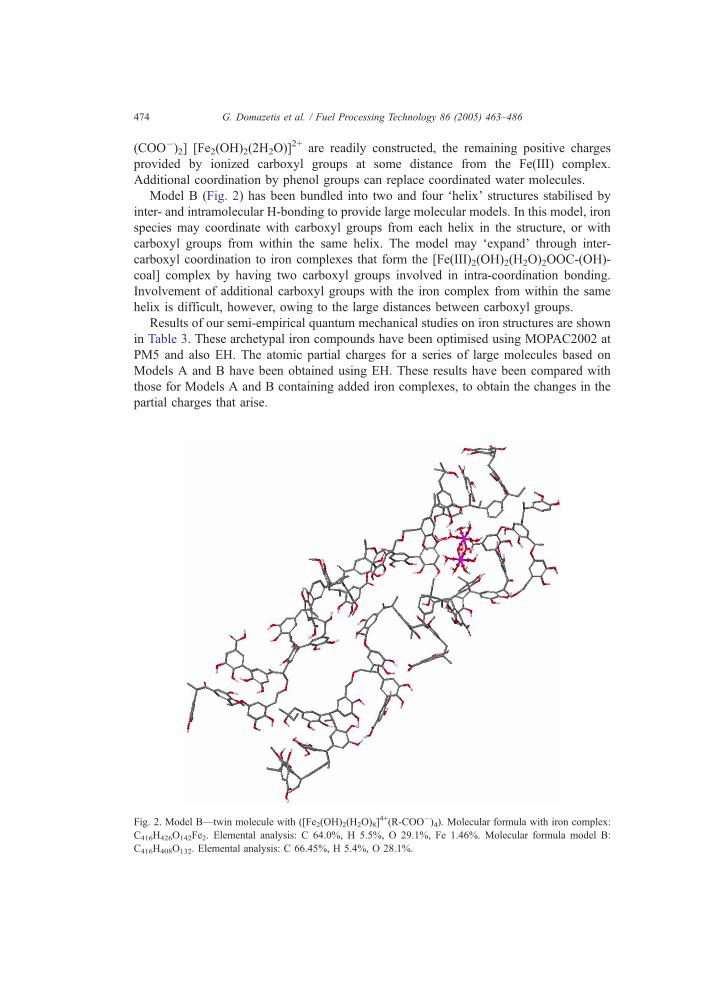
Model B (Fig. 2) has been bundled into two and four dhelixT structures stabilised by
inter- and intramolecular H-bonding to provide large molecular models. In this model, iron
species may coordinate with carboxyl groups from each helix in the structure, or with
carboxyl groups from within the same helix. The model may dexpandT through inter-
carboxyl coordination to iron complexes that form the [Fe(III)2(OH)2(H2O)2OOC-(OH)-
coal] complex by having two carboxyl groups involved in intra-coordination bonding.
Involvement of additional carboxyl groups with the iron complex from within the same
helix is difficult, however, owing to the large distances between carboxyl groups.
Results of our semi-empirical quantum mechanical studies on iron structures are shown
in Table 3. These archetypal iron compounds have been optimised using MOPAC2002 at
PM5 and also EH. The atomic partial charges for a series of large molecules based on
Models A and B have been obtained using EH. These results have been compared with
those for Models A and B containing added iron complexes, to obtain the changes in the
partial charges that arise.
Fig. 2. Model B—twin molecule with ([Fe2(OH)2(H2O)8]4+(R-COO�)4). Molecular formula with iron complex:
C416H426O142Fe2. Elemental analysis: C 64.0%, H 5.5%, O 29.1%, Fe 1.46%. Molecular formula model B:
C416H408O132. Elemental analysis: C 66.45%, H 5.4%, O 28.1%.
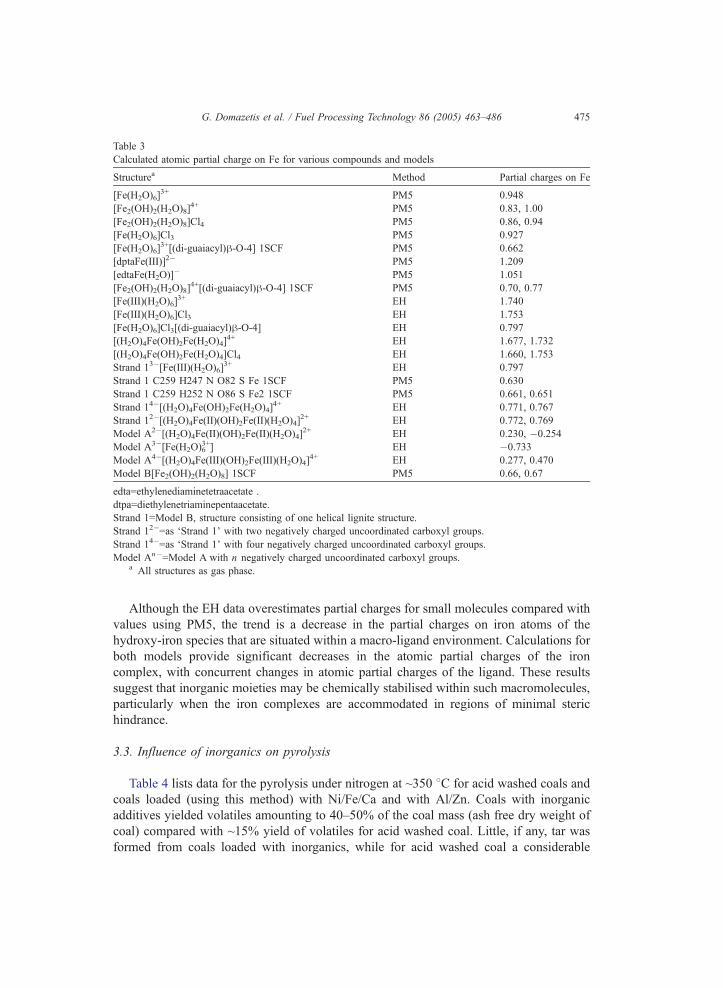
Table 3
Calculated atomic partial charge on Fe for various compounds and models
Structurea Method Partial charges on Fe
[Fe(H2O)6]3+ PM5 0.948
[Fe2(OH)2(H2O)8]4+ PM5 0.83, 1.00
[Fe2(OH)2(H2O)8]Cl4 PM5 0.86, 0.94
[Fe(H2O)6]Cl3 PM5 0.927
[Fe(H2O)6]3+[(di-guaiacyl)h-O-4] 1SCF PM5 0.662
[dptaFe(III)]2� PM5 1.209
[edtaFe(H2O)]� PM5 1.051
[Fe2(OH)2(H2O)8]4+[(di-guaiacyl)h-O-4] 1SCF PM5 0.70, 0.77
[Fe(III)(H2O)6]3+ EH 1.740
[Fe(III)(H2O)6]Cl3 EH 1.753
[Fe(H2O)6]Cl3[(di-guaiacyl)h-O-4] EH 0.797
[(H2O)4Fe(OH)2Fe(H2O)4]4+ EH 1.677, 1.732
[(H2O)4Fe(OH)2Fe(H2O)4]Cl4 EH 1.660, 1.753
Strand 13�[Fe(III)(H2O)6]3+ EH 0.797
Strand 1 C259 H247 N O82 S Fe 1SCF PM5 0.630
Strand 1 C259 H252 N O86 S Fe2 1SCF PM5 0.661, 0.651
Strand 14�[(H2O)4Fe(OH)2Fe(H2O)4]4+ EH 0.771, 0.767
Strand 12�[(H2O)4Fe(II)(OH)2Fe(II)(H2O)4]2+ EH 0.772, 0.769
Model A2�[(H2O)4Fe(II)(OH)2Fe(II)(H2O)4]2+ EH 0.230, �0.254
Model A3�[Fe(H2O)63+] EH �0.733
Model A4�[(H2O)4Fe(III)(OH)2Fe(III)(H2O)4]4+ EH 0.277, 0.470
Model B[Fe2(OH)2(H2O)8] 1SCF PM5 0.66, 0.67
edta=ethylenediaminetetraacetate .
dtpa=diethylenetriaminepentaacetate.
Strand 1=Model B, structure consisting of one helical lignite structure.
Strand 12�=as dStrand 1T with two negatively charged uncoordinated carboxyl groups.
Strand 14�=as dStrand 1T with four negatively charged uncoordinated carboxyl groups.
Model An�=Model A with n negatively charged uncoordinated carboxyl groups.a All structures as gas phase.
G. Domazetis et al. / Fuel Processing Technology 86 (2005) 463–486 475
Although the EH data overestimates partial charges for small molecules compared with
values using PM5, the trend is a decrease in the partial charges on iron atoms of the
hydroxy-iron species that are situated within a macro-ligand environment. Calculations for
both models provide significant decreases in the atomic partial charges of the iron
complex, with concurrent changes in atomic partial charges of the ligand. These results
suggest that inorganic moieties may be chemically stabilised within such macromolecules,
particularly when the iron complexes are accommodated in regions of minimal steric
hindrance.
3.3. Influence of inorganics on pyrolysis
Table 4 lists data for the pyrolysis under nitrogen at ~350 8C for acid washed coals and
coals loaded (using this method) with Ni/Fe/Ca and with Al/Zn. Coals with inorganic
additives yielded volatiles amounting to 40–50% of the coal mass (ash free dry weight of
coal) compared with ~15% yield of volatiles for acid washed coal. Little, if any, tar was
formed from coals loaded with inorganics, while for acid washed coal a considerable
Table 4
Distribution of char and volatiles from pyrolysis (weight as dry ash free basis)
Coal sample Coal (g) Char (g) % Mass Volatiles (g) % Mass % Ash
G acid washed 2.79 2.33 83.7 0.41 14.7 0.1
G Ni/FeIII/Ca 4.06 1.95 48.1 2.0 49.2 9.3
G Ni/FeIII/Ca 3.18 2.04 63.9 1.13 35.5 9.3
GAl/Zn added 3.02 1.91 56.1 1.02 40.3 16.0
Weight at F0.01 g.
G=German brown coals.
All samples heated under nitrogen to 350F20 8C.
G. Domazetis et al. / Fuel Processing Technology 86 (2005) 463–486476
amount of volatile materials condensed as tar. The yield of volatiles was similar for coals
with Fe/Ni/Ca and Al/Zn additives.
The amount of the coal mass lost during pyrolysis, at comparable or lower
temperatures, is greater than previously reported. For example, Otake and Walker Jr. [1]
reported weight losses of ~20% (ash free dry weight) at 400 8C for lignite with a number
of inorganics, and Schafer [18] reported losses of CO2 and H2O of ~30% (ash free dry
weight) at ~400 8C. The char yield from pyrolysis of our samples is 48–56% at 350 8C for
coals with inorganics and 84% for acid washed coals (Table 4). These results may be
compared to those of Murakami et al. [17], of char yield of ~50% for acid washed coal and
~40% for Ca loaded coal (an ash free dry basis) at 900 8C.The FTIR spectra of evolved gases have been used to monitor and identify gases
from the pyrolysis of coal with added inorganics over the temperature range 200–350
8C. The gases are CO2, CO and CH4, and are similar to the results of Shirai et al. [4]
who reported the release of CO2 at ~180 8C and CO at ~230 8C for Loy Yang coal
loaded with nickel.
3.4. Influence of inorganics on oxygen and steam gasification at low temperatures
Coal containing a mixture of Fe(II), Fe(III) and Ca(II) was heated in air at various
temperatures to measure oxidation. Table 5 provides the weight loss after heating at 110,
130–170 and ~300 8C. At 130–170 8C, sample 1 lost 86.7% and sample 2 lost 100% of the
Table 5
Weight losses for two samples of coal with Fe catalysts heated in air
Weight (g) Weight loss % Weight loss % (dafb)
Sample 1 (db, ash=10.5% db) 4.50
Heated at 110F5 8C 1.78 60.5 67.6
Heated at 130–170 8C 1.01 77.6 86.7
Heated at 300–350 8C 0.47 89.5 100
Sample 2 (db, ash=13.3%) 4.03
Heated at 110F5 8C 1.31 67.6 78.0
Heated at 130–170 8C 0.54 86.7 100
Heated at 300–350 8C 0.54 86.7 100
dafb=dry ash free basis.
Weight at F0.01 g.
G. Domazetis et al. / Fuel Processing Technology 86 (2005) 463–486 477
coal weight (ash free dry basis). Triplicate results for sample 2 show that 100% of the coal
oxidised at 150 8C. The ash from these coals was attracted by a magnet and light red in
colour, unlike the non-magnetic ash from coals ashed at 900 8C. From XRD data, the
predominant iron oxide is hematite, with maghemite-C detected. The XRD of ashes from
coals with nickel additives contained a number of nickel species including Ni metal.
The FTIR spectra of dry gases obtained from coal samples containing Fe/Ca gasified
with air at 150–250 8C identify CO2, CO and a small amount of methane. A number of
experiments were performed in an attempt to distinguish gases that result from the
pyrolysis of these coal samples from the gases produced from air gasification, by
switching the gas stream from pure N2 to a N2/O2 mixture. The relative concentration for
such gases was measured using the IR spectra by calibrating with a standard mixture
(14.6% CO2 and 7.3% CO). The product gas was a mixture of CO2/CO in the
concentration ratio over the range 2:1 to 6:1. When the oxygen gas was stopped, to
provide only nitrogen the spectra of the gas samples contained only CO2. When oxygen
was re-introduced to the nitrogen stream, the CO peak re-appeared. The concentration of
CO2 during N2/O2 gasification was the same as that under N2, showing that no measurable
CO2 resulted from oxygen gasification. The CO that results from oxygen gasification at
the low temperature must be due to chemistry involving the inorganic complexes, oxygen
and the coal.
Gasification of coal samples containing Fe/Ni/Ca with steam at 300–500 8C produced
CO, CO2 and significant amounts of methane in the gas stream. Further research on
gasification of coals with these additives is currently underway.
3.5. XPS studies
XPS data for acid washed coals and for those coals with additives are shown in Table
6(a). The results for the acid washed coals, with the respective assignments of binding
energies for C1s and O1s are consistent with values reported by Perry and Grint [19]. Data
for Cl2p, S2p and N1s (minor constituents in the samples) are not given but were found
also to be consistent with values in reference [19].
Table 6(a)
XPS binding energies (eV) from survey scans
Sample C1s O1s Fe2p1/2 Ni2p3/2 Ca2p3/2
Germ awc 283.0 531.0
Germ awc 4.8% Fe 283.0 529.0 709.0
Germ awc 7.8% Fe 283.0 529.0 709.0
Germ awc Fe/Ca/Ni 283.0 529.0 709.0 853.0 345.0
Germ awc-char Fe/Ni/Ca 282.0 529.0 709.0 852.0 345.0
Germ awc-ash Fe/Ni/Ca 709.0 853.0 346.0
LY awc 284.0 532.0
LY awc Ni 284.0 531.0 855.0
LY awc Ni/Ca 284.0 531.0 854.0 346.0
awc=acid washed coal (all samples with inorganics are prepared from awc).
Germ=German brown coal.
LY=Loy Yang brown coal.
G. Domazetis et al. / Fuel Processing Technology 86 (2005) 463–486478
XPS has been used to characterise the inorganic species present in the coal samples.
The results are preliminary and should be viewed only as data for inorganic species
detected in the surface region of brown coal samples. The XPS values of surface
concentrations of added inorganics (including Fe) however, may vary greatly from bulk
concentrations obtained from chemical analysis of the samples. We are continuing our
studies using a number of techniques to address the nature and concentration of inorganics
within coal particles, and also the differences that may be observed amongst coal particles.
XPS data are used here to obtain iron to oxygen ratios, as these are indicators of poly-iron
species, as discussed previously.
From the XPS data, a distinction has been made between the oxygen from the coal
substrate and that which is due to added inorganics. The dominant XPS features for acid
washed brown coal are due to carbon (various C1s near 284.5 eV) and oxygen (various
O1s peaks near 532 eV). Nitrogen N1s has been reported near 397 eV and organic sulphur
S2p around 162 eV. Region scans provide details of oxygen and carbon assignable to C–C/
C–H, C–O and CMO groups. O1s peaks are assignable to coal bound oxygen and to
oxygen from added inorganic species. Sulphur, nitrogen and chloride are minor
components and are not required in this discussion.
3.5.1. Coals with added iron
Fe2p3/2 and O 1s binding energies (eV) in some coals, chars and ash are summarised in
Table 6(b). The coals containing iron show the Fe2p1/2, 3/2 doublets at 725 and 711 eV,
consistent with XPS data for reported Fe3+ by Glisenti et al. [20] and Scheithauer et al.
[21]. The XPS of iron containing ashes obtained after gasification of these coal shows Fe
2p1/2, 3/2 doublet binding energies at 724.1 and 711.0 eV.
All the coals that contain Fe show the additional feature of an O1s peak around 530.5
eV. Inorganic oxygen is assigned to O 1s at 532–534 eV due to OH and at 531–533 eV due
to O2� by McCaferty and Wightman [22].
Survey spectra of O1s in acid washed coal and in acid washed coal with iron added are
shown in Fig. 3. The spectrum of coal with iron contains three peaks compared to two for
the acid washed coal. Table 6(b) lists the O1s peaks for a number of coal samples with
added iron species. The O1s peaks for acid washed coal and acid washed coal with iron
species overlap in the region 533.84–532.01 eV, while the 530.3 eV peak is due to the iron
Table 6(b)
XPS binding energies (eV) for Fe2p and O1s peaks in coals, char and ash
Sample Fe 2p3/2 O1s
LY acid washed coal 533.84 532.01
LY coal Fe 711.84 533.8 532.14 530.66
LY char Fe 711.70 ~537 531.95 530.59
G Fe 7.8% 711.62 533.50 531.95 530.49
G Fe/Ca 711.68 533.45 531.85 530.41
G Ni/Fe/Ca char 711.31 533.90 531.72 530.39
G Fe/Ca ash (gasification) 711.03 532.3 530.00
G=German brown coal.
LY=Loy Yang brown coal.
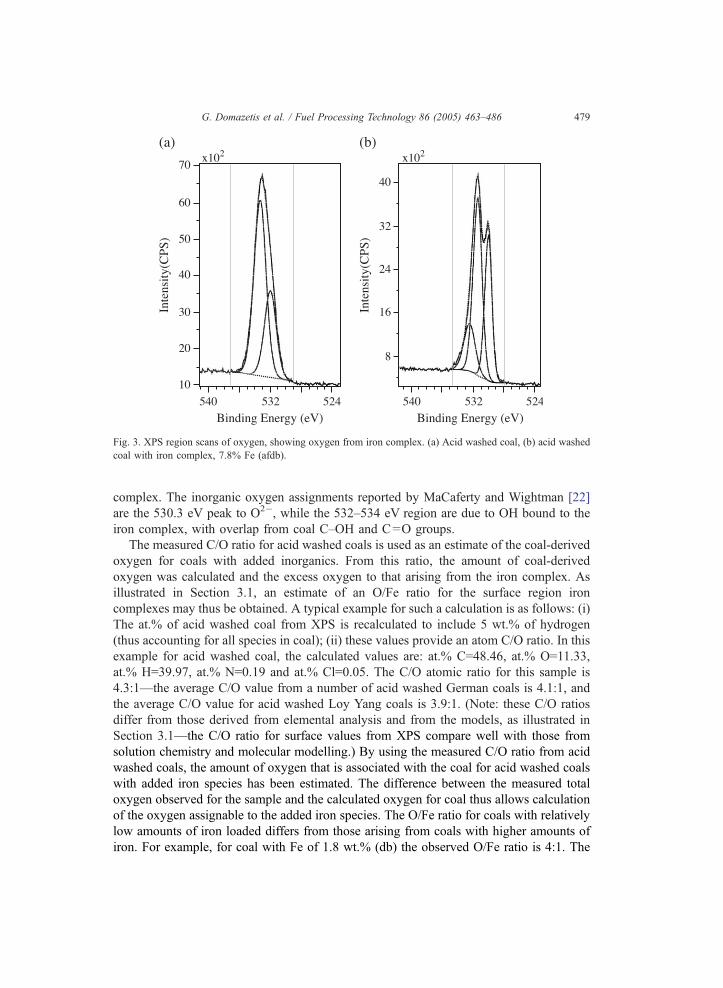
Fig. 3. XPS region scans of oxygen, showing oxygen from iron complex. (a) Acid washed coal, (b) acid washed
coal with iron complex, 7.8% Fe (afdb).
G. Domazetis et al. / Fuel Processing Technology 86 (2005) 463–486 479
complex. The inorganic oxygen assignments reported by MaCaferty and Wightman [22]
are the 530.3 eV peak to O2�, while the 532–534 eV region are due to OH bound to the
iron complex, with overlap from coal C–OH and CMO groups.
The measured C/O ratio for acid washed coals is used as an estimate of the coal-derived
oxygen for coals with added inorganics. From this ratio, the amount of coal-derived
oxygen was calculated and the excess oxygen to that arising from the iron complex. As
illustrated in Section 3.1, an estimate of an O/Fe ratio for the surface region iron
complexes may thus be obtained. A typical example for such a calculation is as follows: (i)
The at.% of acid washed coal from XPS is recalculated to include 5 wt.% of hydrogen
(thus accounting for all species in coal); (ii) these values provide an atom C/O ratio. In this
example for acid washed coal, the calculated values are: at.% C=48.46, at.% O=11.33,
at.% H=39.97, at.% N=0.19 and at.% Cl=0.05. The C/O atomic ratio for this sample is
4.3:1—the average C/O value from a number of acid washed German coals is 4.1:1, and
the average C/O value for acid washed Loy Yang coals is 3.9:1. (Note: these C/O ratios
differ from those derived from elemental analysis and from the models, as illustrated in
Section 3.1—the C/O ratio for surface values from XPS compare well with those from
solution chemistry and molecular modelling.) By using the measured C/O ratio from acid
washed coals, the amount of oxygen that is associated with the coal for acid washed coals
with added iron species has been estimated. The difference between the measured total
oxygen observed for the sample and the calculated oxygen for coal thus allows calculation
of the oxygen assignable to the added iron species. The O/Fe ratio for coals with relatively
low amounts of iron loaded differs from those arising from coals with higher amounts of
iron. For example, for coal with Fe of 1.8 wt.% (db) the observed O/Fe ratio is 4:1. The
G. Domazetis et al. / Fuel Processing Technology 86 (2005) 463–486480
ratios for coals with high amounts of Fe added are: Fe in coal 4.8 wt.% (db), O/Fe=1.8:1,
Fe in coal 7.5 wt.% (db), O/Fe=1.9:1.
If we consider coal models discussed previously, in which a mononuclear iron complex
is attached to a monodentate COO ligand, the calculated and observed O/Fe ratios for low
amounts of iron in coal indicate the species [Fe(OH)2d 3(H2O)]+, for which the O/Fe ratio
is 4:1. However, we have not modelled, and cannot exclude other species such as the iron-
hydroxy (or A-oxo) complexes discussed by Junk et al. [23] in which coal-related carboxyl
oxygen atoms replace two water molecules coordinated to the iron complex.
3.5.2. Char with added iron complexes
The XPS data for char from acid washed coal and char containing Fe/Ca additives
provide the following outcome: Char from acid washed coal contains 90.4 at.% C and 8.5
at.% O (hydrogen not included) consistent with an increase in carbon and a loss of oxygen.
The char from coals with iron additives contains 77.8 at.% C and 16.4 at.% O. The large
amount of oxygen relative to carbon in these latter chars is due to the presence of inorganic
oxides. The XPS data from the surface region of chars show the iron additives are present
mainly as oxygen-containing compounds and not reduced inorganic species, with EB for
Fe2p3/2 at 711.7 eV and for O 1s at 531.9 and 530.0 eV. Samples in which a great deal of
the coal/char has been gasified show the O 1s at 532 eV to be the predominant peak.
Literature values for a-Fe2O3 show EB for Fe 2p3/2 at 710.9–711.2 eV, with the O 1s at
529.5–530.0 eV. In studies of the reaction of methanol and other alcohols over Fe2O3 by
Glisenti et al. [20], an increase in the O/Fe ratio has been attributed to oxygen addition to
iron oxide, and a decrease to the reduction of iron to lower oxidation states. Clearly, our
results are consistent with Fe(III) oxides in chars.
An attempt is underway to elucidate additional iron species that may indicate the nature
of possible intermediate complexes involved in the pyrolysis and/or gasification chemistry.
Whilst oxygen in char samples may be distributed between iron oxide and iron carbonate,
the C1s for carbonate is often obscured by the C1s peaks due to char. XPS of samples in
which most of the coal had been gasified provided oxygen and carbon peaks that are
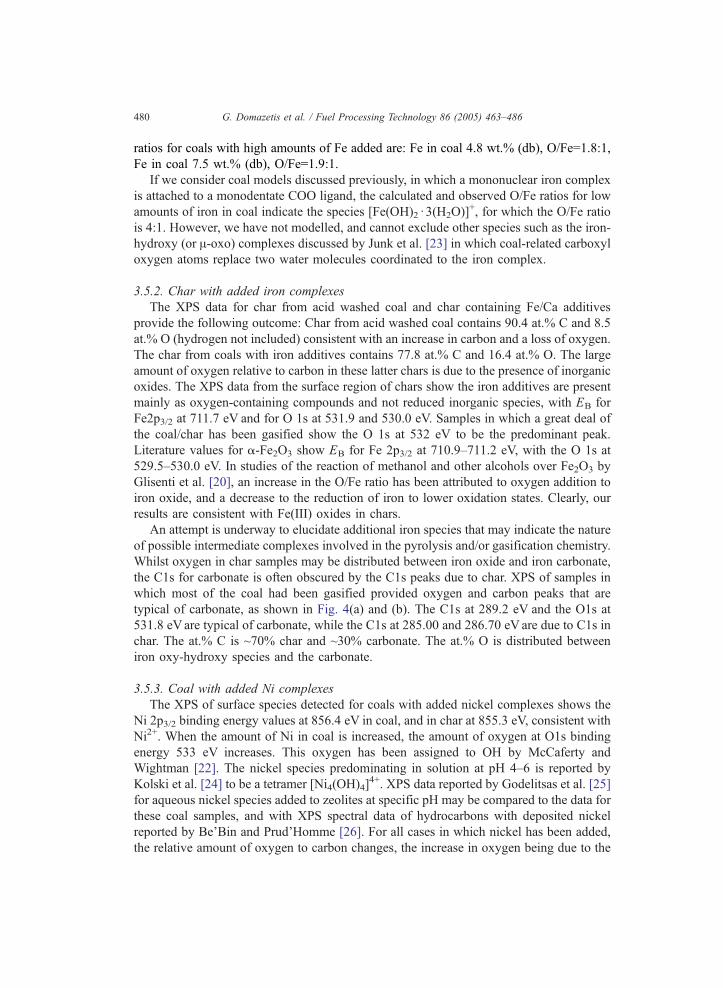
typical of carbonate, as shown in Fig. 4(a) and (b). The C1s at 289.2 eV and the O1s at
531.8 eVare typical of carbonate, while the C1s at 285.00 and 286.70 eVare due to C1s in
char. The at.% C is ~70% char and ~30% carbonate. The at.% O is distributed between
iron oxy-hydroxy species and the carbonate.
3.5.3. Coal with added Ni complexes
The XPS of surface species detected for coals with added nickel complexes shows the
Ni 2p3/2 binding energy values at 856.4 eV in coal, and in char at 855.3 eV, consistent with
Ni2+. When the amount of Ni in coal is increased, the amount of oxygen at O1s binding
energy 533 eV increases. This oxygen has been assigned to OH by McCaferty and
Wightman [22]. The nickel species predominating in solution at pH 4–6 is reported by
Kolski et al. [24] to be a tetramer [Ni4(OH)4]4+. XPS data reported by Godelitsas et al. [25]
for aqueous nickel species added to zeolites at specific pH may be compared to the data for
these coal samples, and with XPS spectral data of hydrocarbons with deposited nickel
reported by Be’Bin and Prud’Homme [26]. For all cases in which nickel has been added,
the relative amount of oxygen to carbon changes, the increase in oxygen being due to the
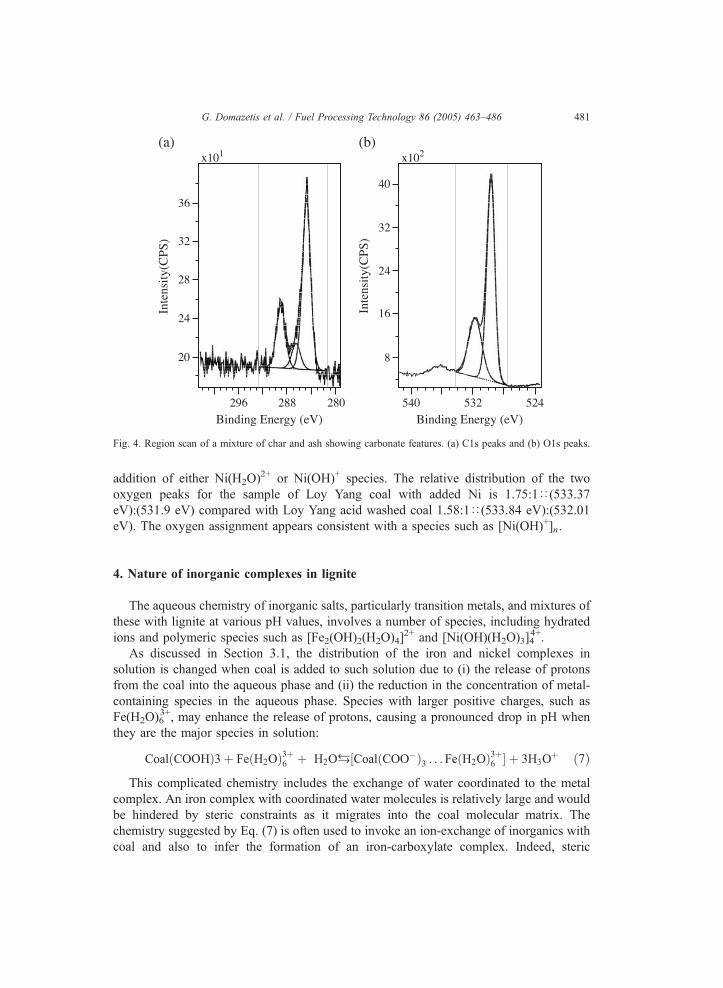
Fig. 4. Region scan of a mixture of char and ash showing carbonate features. (a) C1s peaks and (b) O1s peaks.
G. Domazetis et al. / Fuel Processing Technology 86 (2005) 463–486 481
addition of either Ni(H2O)2+ or Ni(OH)+ species. The relative distribution of the two
oxygen peaks for the sample of Loy Yang coal with added Ni is 1.75:1D(533.37
eV):(531.9 eV) compared with Loy Yang acid washed coal 1.58:1D(533.84 eV):(532.01
eV). The oxygen assignment appears consistent with a species such as [Ni(OH)+]n.
4. Nature of inorganic complexes in lignite
The aqueous chemistry of inorganic salts, particularly transition metals, and mixtures of
these with lignite at various pH values, involves a number of species, including hydrated
ions and polymeric species such as [Fe2(OH)2(H2O)4]2+ and [Ni(OH)(H2O)3]4
4+.
As discussed in Section 3.1, the distribution of the iron and nickel complexes in
solution is changed when coal is added to such solution due to (i) the release of protons
from the coal into the aqueous phase and (ii) the reduction in the concentration of metal-
containing species in the aqueous phase. Species with larger positive charges, such as
Fe(H2O)63+, may enhance the release of protons, causing a pronounced drop in pH when
they are the major species in solution:
CoalðCOOHÞ3þ FeðH2OÞ3þ6 þ H2Of½CoalðCOO�Þ3 . . . FeðH2OÞ3þ6 � þ 3H3Oþ ð7Þ
This complicated chemistry includes the exchange of water coordinated to the metal
complex. An iron complex with coordinated water molecules is relatively large and would
be hindered by steric constraints as it migrates into the coal molecular matrix. The
chemistry suggested by Eq. (7) is often used to invoke an ion-exchange of inorganics with
coal and also to infer the formation of an iron-carboxylate complex. Indeed, steric
G. Domazetis et al. / Fuel Processing Technology 86 (2005) 463–486482
hindrance would apply equally to poly-iron complexes. Intuitively it would be expected
that negatively charged carboxyl groups would increase the attraction with the positively
charged iron complexes and the coal matrix, but the dexchangeT of an iron complex with
protons from coal needs to occur. The driving force for such chemistry is difficult to
deduce from a simple ion-exchange concept. A physicochemical model of metal-humate
interactions discussed by Bryan et al. [27] indicates that the chemical contribution to the
enthalpy of the interaction may be small and endothermic. Alternatively, the driving force
may be the increase in entropy brought about by the release of water molecules into the
aqueous phase. Relaxation of the double-layer may play a key role in the mechanism of
metal binding by such macromolecules. Various binding sites in humic acids for metal ions
have been discussed by Davies et al. [28], who suggest the presence of different binding
sites related to the hydrophilic character of these molecules.
The data in this report show, however, that the high iron loading is possible because
multi-iron species are added to the coal, with the overall positive charges of the iron
species being equalled by the negative carboxyl charges in coal. Such species also provide
a basis for rationalising the amount of OH� used during the addition of iron to the coal.
The XPS data for coal with a high loading of iron show surface concentrations are also
consistent with the presence of multi-iron polymeric species within specific regions of the
coal particles.
Additional factors may influence the take-up of inorganics by the coal, such as different
functional groups participating in the chemistry, and/or additional polymerisation of iron
complexes within the coal macromolecule after uptake from solution, resulting from
changes to the pH of the coal/water mixture. Our results are sufficient to show that
complex inorganic species are present in the coal macromolecule. Polymeric species of
iron have been discussed by Cornell and Schwertmann [15], and for nickel by Clare and
Kepert [29]. Ozakia et al. [30] and Bocquet et al. [31] report trivalent iron accounts for 6%
of the known total carboxylate concentration in brown coal, while studies based on the
Mfssbauer spectra of Fe2+ and Fe3+ iron complexes have led to the suggestion that
octahedral iron complexes may be present in brown coal with some bonding between
carboxylate [i.e. R–C–O–Fe] and perhaps proximity to other Fe complexes via H-bonded
water molecules. A wide variety of structures of iron complexes with oxo- and carboxyl
ligands has been reported; e.g., Junk et al. [23] of [(H2O)5Fe(A-O)Fe(OH2)5]4+ stabilised
by crown ethers and by Manago et al. [32] of mixed-valence A-phenolate bis(A-carboxylate) diiron (II,III) complexes in which bridging carboxy and oxo ligands are
found.
Species used in our modelling studies are [Fe(H2O)6]3+ and [Fe(H2O)4(OH)2
Fe(H2O)4]4+. These species have been added to the coal models as positive ions (with
negative carboxyl groups for a neutral model), and as iron complexes able to form
coordinated bonds to carboxyl and phenol groups. In some cases, carboxyl groups may
form coordinate bonds, or may be negatively charged groups in close proximity to the iron
complex, while other negative carboxyl groups may be at some distance, but overall
electroneutrality is maintained. Some of these species provide a model of hydrated iron
species, similar to those present in the water phase, placed within the coal matrix.
Our results show partial charges of the iron species are reduced when they are placed
within ligands containing oxygen functional groups such as phenol and carboxyl groups. It
G. Domazetis et al. / Fuel Processing Technology 86 (2005) 463–486 483
may be that macroligands containing oxygen and aromatic groups exert a stabilising effect
on such complexes. The presence of H-bonding between the macroligand and the iron
species adds to the stability of these species. The greatest reduction in partial charge on
iron atoms occurs when the iron species are placed in dpocketsT surrounded by oxygen and
aromatic groups within these ligands. These are areas within the macroligand that can
spatially accommodate the iron complex and maximise the ionic and H-bond interactions.
The overall effect is that the ionic charge of the ligand appears to be dspreadT over themacroligand, suggesting that the ionic and electrostatic interactions between the positively
charged species cause a reciprocal ionicity over a large portion of the macroligand,
involving many oxygen, aromatic and other functional groups.
Shirai et al. [4] have used IR and EXAFS spectra for a sample with a 0.77 wt.% loading
of Ni, to postulate an octahedral nickel complex having bidentate carboxylate groups.
They describe the structure as nickel surrounded by six oxygen atoms, with two oxygen
atoms derived from a bidentate carboxylate group, and the other derived from carbonyl
groups, H2O and OH ions. Modelling such a structure using Model Awith one Ni2+ in the
structure described, gives rise to a distorted Ni complex, with the carboxylate bidentate
angle about 698, and the (carbonyl)O-Ni-O(carboxyl) angle of 1058. Model B provided
similar results.
The structure postulated by Shirai et al. for a 6.4 wt.% loading of Ni contained a
monodentate carboxyl group, with the remaining oxygen groups derived from H2O, OH
and carbonyl groups within coal. We have modelled this structure and other nickel-
containing structures, including monodentate carboxyl groups coordinating to polymeric
Ni complexes within Models A and B. We have modelled an octahedral Ni with [OH�]
and [H2O] ligands forming a non-distorted six-coordinate complex stabilised by oxygen
functional groups from coal, with monodentate carboxylate groups coordinated to nickel,
while other ionized carboxyl groups provide electroneutrality. Octahedral iron complexes
with bidentate carboxyl forming coordination bonds also are highly distorted.
5. Catalytic effects of added inorganics
Experimental data show that inorganics added to brown coal exert a pronounced
influence on low-temperature pyrolysis and on oxygen/steam gasification. The effect on
pyrolysis is to increase the amount of tar/gases and decrease the amount of char formed
compared with that of acid washed coal. Pyrolysis in an atmosphere of nitrogen produces
tar, and gases and water, similar to that reported by Schafer [18]. The volatiles from coals
with Fe/Ni additives are ~40% of the weight of the coal mass. XPS indicates that the iron
species in chars are iron oxides and carbonate (see Section 3.5).
Under an atmosphere of N2/O2, coals with Fe/Ca additives undergo gasification at 150–
200 8C. The FTIR spectra of the gases generated under nitrogen show mainly CO2 (due to
pyrolysis) at low temperature (CO is not detected in the spectra), whereas under N2/O2,
CO2 and CO are observed at relative concentrations as high as 2:1. These results may be
compared to those reported by Shirai et al. [4] for brown coal doped with nickel at ~230 8Cwhich show predominantly CO2, with the proportion of CO forming at ~230 8C being
b0.1 of CO2.
G. Domazetis et al. / Fuel Processing Technology 86 (2005) 463–486484
Steam gasification with Fe and Ni catalysts produces a mixture of CO2, CO, methane
(and probably hydrogen) with methane concentrations increasing at higher steam
concentrations in the temperature range 300–500 8C. This is similar to results reported
by Takarada et al. [33] at 500 8C for Ni-loaded brown coal.
Iron species exist as oxygenated species in char during low-temperature pyrolysis and
oxygen gasification. It has as yet been impossible to detect reduced iron species such as
the FeC postulated by McCarthy [8] for steam gasification. The XPS of chars with added
nickel that have been pyrolysed at low temperature shows Ni2+ in an oxygen environment.
When such chars are completely ashed at higher temperatures, reduced nickel is detected,
consistent with aggregated nickel reported by Shirai et al. [3].
The role of metal complexes in the pyrolysis of brown coals has been examined via a
mechanism developed by Domazetis [34] that predicts a weight loss of 58% of the coal
mass. This may be compared to the measured weight losses of 36–50%, shown in Table 4.
The features of this mechanism for pyrolysis, interpreted using Model A with multi-iron
hydroxy complexes (composition C91H87Fe5NO14; MWt 1697.9; C 64.37%, H 5.16%, Fe
16.4%, N 0.82%, O 13.19%) are: (i) FeIII-oxy molecules with loss of coordinated water
through carboxyl coordination are in close proximity to various coal oxygen functional
groups; (ii) carboxyl groups participate in the formation of iron carbonate complexes,
followed by decomposition into CO2 and iron-oxy intermediates; (iii) cleavage of oxygen
bonds in the coal model to provide CO and a char-like fragment. The iron complex
participates in the breakdown of five oxygen functional groups, with the formation of CO2,
CO, a char and a hydrocarbon fragment. This mechanism is speculative at this stage and
requires further refinement. Its main purpose is to show how multi-iron complexes may
participate in metal assisted pyrolysis and gasification.
Low temperature oxygen gasification should be favoured by oxidised iron complexes
that lead to the production of CO. When gasified with steam, pyrolysis events involving
oxygen functional groups form CO2, while inorganic oxide intermediates are involved in
the formation of CO and H2. Work on the mechanism of inorganic assisted gasification is
currently aimed at identifying such intermediate inorganic species.
6. Conclusions
The results presented in this paper are consistent with the following:
! Addition of simple monomeric iron and nickel hydrated complexes to coordinating
carboxylate groups in coal is unlikely to account for significant amounts of these
complexes added to brown coal. Polymeric iron and nickel complexes are the
predominant species added to coal at the pH of the coal/inorganic solution mixtures.
! Initially the inorganic complexes may be accommodated within dpocketsT of the coal
structure that contain ionised carboxylate groups and other oxygen functional groups in
the proximity of the inorganic complex. Modelling indicates these complexes
experience a reduction in atomic partial charges. Steric considerations indicate that
water molecules coordinated to the metal atom may be replaced by monodentate
carboxylate groups. Phenoxy groups may also coordinate to the inorganic complexes.

G. Domazetis et al. / Fuel Processing Technology 86 (2005) 463–486 485
Modelling of bidentate carboxyl groups from coal coordinating to the metal leads to a
distorted structure.
! Low temperature pyrolysis of brown coal with added iron, nickel and calcium produces
relatively low amounts of char. XPS data of char indicate oxides and carbonates of
iron. Low-temperature gasification of coals with added Fe/Ca using N2/O2 mixture
produces significant quantities of CO at 150–250 8C. Gasification of these coals with
steam at 300–400 8C produces CO2, CO and CH4.
Acknowledgements
We gratefully acknowledge: Mr. Jorg Metz, Department of Earth Sciences for XRF and
XRD analysis; Dr. N. Brack, Centre for Materials and Surface Sciences, for XPS spectra;
Monthida Raoarun for atomic absorption analysis; The Australian Partnership for
Advanced Computing National Facility under the Merit Allocation Scheme for computer
molecular modelling; The Victorian Partnership for Advanced Computing for allocation of
computer time; Loy Yang and Yallourn Open Cut Mines for samples of Victorian brown
coal; Rheinbraun GBT for samples of German brown coal.
References
[1] Y. Otake, P.L. Walker Jr., Fuel 72 (1993) 139.
[2] Y. Ohtsuka, K. Asami, Energy Fuels 10 (1996) 431.
[3] M. Shirai, M. Arai, K. Murakami, Energy Fuels 14 (2000) 1038.
[4] M. Shirai, M. Arai, K. Murakami, Energy Fuels 13 (1999) 465.
[5] F. Kapteijn, J.A. Moulijn, in: J.L. Figueiredo, J.A. Moulijn (Eds.), Carbon and Coal Gasification, NATO
ASI Series E, vol. 105, 1986, p. 291.
[6] K.J. Huttinger, J. Alder, G. Hermann, in: J.L. Figueiredo, J.A. Moulijn (Eds.), Carbon and Coal Gasification,
NATO ASI Series E, vol. 105, 1986, p. 213.
[7] T. Suzuki, K. Inoue, Y. Watanabe, Fuel 68 (1989) 626.
[8] D.J. McCarthy, Carbon 28 (1990) 661.
[9] Y. Ohtsuka, K. Asami, Ind. Eng. Chem. Res. 30 (1991) 192.
[10] H. Marsh, R.R. Adair, Carbon 13 (1975) 327.
[11] J.G.H. Metz, G. Domazetis, ACHEMA 2000, 2000 DECHEMA e.V. Frankfurt AM Main.
[12] J.-L. Faulon, G.A. Carlson, P.G. Hatcher, Org. Geochem. 21 (1994) 1169.
[13] P.G. Hatcher, Org. Geochem. 16 (1989) 959.
[14] T. Hong-Xiao, W. Stumm, Water Res. 21 (1987) 115.
[15] R.M. Cornell, U. Schwertmann, The Iron Oxides, VCH, Weinheim, 1996.
[16] G. Domazetis, Studies on Molecular Models of Brown Coal, Clean Coal Technology Pty Report RN4
(2001).
[17] K. Murakami, H. Shirato, J. Ozaki, Y. Nishiyama, Fuel Process. Technol. 46 (1996) 183.
[18] H.N.S. Schafer, Fuel 58 (1979) 667.
[19] D.L. Perry, A. Grint, Fuel 62 (1983) 1024.
[20] A. Glisenti, G. Favero, G. Granozzi, J. Chem. Soc., Faraday Trans. 94 (1998) 173.
[21] M. Scheithauer, E. Bosch, U.A. Schubert, H. Knfzinger, T.-K. Cheung, F.C. Jentoft, B.C. Gates, B. Tesche,J. Catalysis 177 (1998) 137.
[22] E. McCaferty, J.P. Wightman, Surf. Interface Anal. 26 (1998) 549.
[23] P.C. Junk, B.J. McCool, B. Moubaraki, K.S. Murray, L. Spiccia, J.D. Cashion, J.W. Steed, J. Chem. Soc.,
Dalton Trans. 2002 (2002) 1024.
G. Domazetis et al. / Fuel Processing Technology 86 (2005) 463–486486
[24] G.B. Kolski, N.K. Kildahl, D.W. Margerum, Inorg. Chem. 8 (1969) 1211.
[25] A. Godelitsas, D. Charistos, A. Tsipis, C. Tsipis, A. Filippidis, C. Triantafyllidis, G. Manos, D. Siapkas,
Chem. Eur. J. 7 (2001) 3705.
[26] P. Be’Bin, R.E. Prud’Homme, J. Polym. Sci., Part B, Polym. Phys. 40 (2002) 82.
[27] N.D. Bryan, D.M. Jones, M. Appleton, F.R. Livens, M.N. Jones, P. Warwick, S. King, A. Hall, Phys. Chem.
Chem. Phys. 2 (2000) 1291.
[28] G. Davies, A. Fataftah, A. Cherkasskiy, E.A. Ghabbour, A. Radwan, S.A. Jansen, S. Kolla, M.D. Paciolla,
L.T. Sein Jr., W. Buermann, M. Balasurbramanian, J. Budnick, B. Xing, J. Chem. Soc. Dalton Trans. (1997)
4047.
[29] W. Clare, D.L. Kepert, Aust. J. Chem. 28 (1975) 1489.
[30] J. Ozakia, Y. Nishiyama, J.D. Cashion, L.J. Brown, Fuel 78 (1999) 489.
[31] S. Bocquet, J.D. Cashion, P.S. Cook, Phys. Chem. Miner. 25 (1998) 328.
[32] T. Manago, S. Hayami, H. Oshio, S. Osaki, H. Hasuyama, R.H. Herber, Y. Maeda, J. Chem. Soc., Dalton
Trans. (1999) 1001.
[33] T. Takarada, J. Sasaki, Y. Ohtsuka, Y. Tamai, A. Tomita, Ind. Eng. Chem. Res. 26 (1987) 627.
[34] G. Domazetis, Structure and Chemistry of Catalytic Gasification of Brown Coals, Clean Coal Technology
Pty Report SR03, 2000.
[35] T.V. Verheyen, G.J. Perry, in: R.A. Durie (Ed.), The Science of Victorian Brown Coal, Butterworth
Heinemann, Oxford, 1991, p. 280.