An experimental and computational study of multiphase flow behavior in a circulating fluidized bed
33
An experimental and computational study of multiphase flow behavior in a circulating fluidized bed V. Mathiesen, T. Solberg, B.H. Hjertager* Telemark Technological R&D Centre (Tel-Tek) and Telemark College (HiT-TF), Kjølnes Ring, N-3914 Porsgrunn, Norway Received 19 January 1998; received in revised form 12 April 1999 Abstract This paper presents an experimental and computational study of the flow behavior in a cold flow laboratory scale circulating fluidized bed reactor. Laser Doppler Anemometry and Phase Doppler Anemometry techniques are used to measure mean and fluctuating velocity, diameter and solid concentration, simultaneously. An axial segregation by size and its variation with the superficial gas velocity are demonstrated. Also, a significant radial segregation is measured in the riser. A multi-fluid Computational Fluid Dynamics model has been developed and verified against the experimental results. The flow model is based on an Eulerian description of the phases where the kinetic theory for granular flow forms the basis for the turbulence modeling in the solid phases. The model is generalized for one gas phase and N number of solid phases to enable a realistic description of the particle size distributions in gas/solid flow systems. Each solid phase is characterized by a diameter, form factor, density and restitution coecient. The computational results agree well with the measurements. # 2000 Elsevier Science Ltd. All rights reserved. Keywords: LDA/PDA; CFD; Multiphase flow; Circulating fluidized bed; Kinetic theory of granular flow 1. Introduction The subject of gas/solid flow has for several decades been studied quite extensively, mainly because of its important applications in nuclear, chemical and petroleum industries. Recently, experimental observations of the flow behavior have increased the depth of understanding of International Journal of Multiphase Flow 26 (2000) 387–419 0301-9322/00/$ - see front matter # 2000 Elsevier Science Ltd. All rights reserved. PII: S0301-9322(99)00027-0 www.elsevier.com/locate/ijmulflow * Corresponding author. Aalborg University Esbjerg, DK-6700, Esbjerg, Denmark.
Transcript of An experimental and computational study of multiphase flow behavior in a circulating fluidized bed
An experimental and computational study of multiphase¯ow behavior in a circulating ¯uidized bed
V. Mathiesen, T. Solberg, B.H. Hjertager*
Telemark Technological R&D Centre (Tel-Tek) and Telemark College (HiT-TF), Kjùlnes Ring, N-3914 Porsgrunn,Norway
Received 19 January 1998; received in revised form 12 April 1999
Abstract
This paper presents an experimental and computational study of the ¯ow behavior in a cold ¯owlaboratory scale circulating ¯uidized bed reactor. Laser Doppler Anemometry and Phase DopplerAnemometry techniques are used to measure mean and ¯uctuating velocity, diameter and solidconcentration, simultaneously. An axial segregation by size and its variation with the super®cial gasvelocity are demonstrated. Also, a signi®cant radial segregation is measured in the riser. A multi-¯uidComputational Fluid Dynamics model has been developed and veri®ed against the experimental results.The ¯ow model is based on an Eulerian description of the phases where the kinetic theory for granular¯ow forms the basis for the turbulence modeling in the solid phases. The model is generalized for onegas phase and N number of solid phases to enable a realistic description of the particle size distributionsin gas/solid ¯ow systems. Each solid phase is characterized by a diameter, form factor, density andrestitution coe�cient. The computational results agree well with the measurements. # 2000 ElsevierScience Ltd. All rights reserved.
Keywords: LDA/PDA; CFD; Multiphase ¯ow; Circulating ¯uidized bed; Kinetic theory of granular ¯ow
1. Introduction
The subject of gas/solid ¯ow has for several decades been studied quite extensively, mainlybecause of its important applications in nuclear, chemical and petroleum industries. Recently,experimental observations of the ¯ow behavior have increased the depth of understanding of
International Journal of Multiphase Flow 26 (2000) 387±419
0301-9322/00/$ - see front matter # 2000 Elsevier Science Ltd. All rights reserved.PII: S0301-9322(99)00027-0
www.elsevier.com/locate/ijmulflow
* Corresponding author. Aalborg University Esbjerg, DK-6700, Esbjerg, Denmark.

the underlying mechanisms, which in turn has provided the basis for improved ®eldinformation of the basic conservation equations and constitutive laws for gas/solid ¯owsystems. Although circulating ¯uidized beds are successfully and widely used in commercialindustrial operations, much remains to be done due to the complexity of the gas/solid ¯ow. Inorder to gain fundamental knowledge about the complex multiphase ¯ow behavior, research isstill needed.To get detailed knowledge about complex gas/solid ¯ow systems, experimental work are
obviously important. In this work, Laser Doppler Anemometry (LDA) and Phase DopplerAnemometry (PDA) are used to measure mean and ¯uctuating velocity, diameter and solidconcentration, simultaneously. The di�erent ¯ow behavior of particles of di�erent sizes arestudied as well.Computational ¯uid dynamics in multiphase ¯ow has become a well accepted and useful tool
in modeling of gas/solid ¯ow systems during the recent years, and much progress has beenmade toward developing computer codes for describing ¯uidized beds. Most of the developedmodels are based on a two-phase description, one gas and one solid phase, where all theparticles are assumed to be identical, characterized by a diameter, form factor, density and acoe�cient of restitution. Most of the models use an Eulerian description of the phases wherethe constitutive equations of the solid phases are based on the kinetic theory for granular ¯owwith basis of the work of Jenkins and Savage (1983), Lun et al. (1984), Ding and Gidaspow(1990), and Gidaspow (1994). Enwald et al. (1996) and Hjertager (1997) gives a general reviewof di�erent Eulerian two-phase ¯ow models applied to ¯uidization.In gas/solid systems, particle segregation due to di�erent size and/or density will play a
signi®cant role on the ¯ow behavior. To describe such phenomena, an extension to multipleparticle phases is essential. Jenkins and Mancini (1987) extended the kinetic theory for granular¯ow to binary mixtures. The basic assumption was equal turbulent kinetic energy with a smallcorrection for the individual phase temperatures. Mathiesen et al. (1996) developed a modelbased on this work and performed a simulation with one gas and three solid phases. Themodel predicted segregation e�ects fairly well, and good agreement with experimental data wasobtained.Gidaspow et al. (1996) and Manger (1996) extended the kinetic theory to binary mixtures of
solid with unequal granular temperatures between the phases. Based on their research, ageneralized multiphase gas/solid model is given here and the consistency of the model isdiscussed brie¯y.The developed model is used to simulate a cold ¯ow laboratory scale circulating ¯uidized
bed. One gas and two solid phases are used in the simulations. Experimental andcomputational results are compared and discussed.
2. Experimental measurements technique
During the recent years, LDA has become one of the most commonly used experimentaltechniques in dilute gas/solid ¯ow systems. The main reasons are that LDA is a non-invasiveoptical technique which does not disturb the ¯ow, and has a high spatial resolution with a fast
V. Mathiesen et al. / International Journal of Multiphase Flow 26 (2000) 387±419388

dynamic response and range. LDA together with PDA is able to measure mean and ¯uctuatingvelocity, size and concentration of the dispersed phase, simultaneously.
2.1. Particle velocity measurement
When two coherent Gaussian laser beams are intersecting, the intersection will cause apattern of plane interference fringes. The fringe spacing df can be shown to be proportional tothe wavelength l and inversely proportional to half of the angle W between the two incidentbeams:
df � l2sin�W=2� �1�
When a particle is passing through the intersection area, it will scatter light and the intensitywill change according to the interference fringes. The intensity variation of the scattered lightor the frequency can be obtained by a photo detector. The velocity of the passing particle willbe proportional to the Doppler frequency fD and the fringe spacing:
vi � fDdf � fDl2sin�W=2� �2�
where vi is the absolute velocity of the particle in the direction which is perpendicular to thebisector of the two incident laser beams. To detect the direction of the ¯ow, a frequency shiftfor one of the beams is introduced. The Doppler frequency is the frequency obtained by thephoto detector minus the frequency shift.The mean velocity, V may be obtained by:
V � 1
Ni
XNi
i�1vi �3�
where Ni is the number of sampled particles. The ¯uctuating velocity or the Root Mean Square(RMS) velocity, VRMS may be expressed as:
VRMS ��������������������������������������������
1
�Ni ÿ 1�XNi
i�1�vi ÿ V�2
vuut �4�
2.2. Particle size measurement
Durst and Zare (1975) found that there exists a linear relation between the diameter of aspherical particle and the Doppler signals detected at two di�erent points in space. Almost 10years later, Sa�mann et al. (1984) extended the technique and presented experimental resultson bubble size measurements.The theory is based upon that when two adjacent photo detectors are used to collect
scattered laser light, they will show a phase di�erence which is linearly proportional to the
V. Mathiesen et al. / International Journal of Multiphase Flow 26 (2000) 387±419 389
diameter of a smooth and spherical particle as it passes through the measuring volume(Bachalo and Houser, 1984). The diameter is a function of the phase shift f, the focal lengthof the transmitting lens fl, the fringe spacing df , an optical constant K and spacing of thedetectors DL:
Di � fldff3608DL
K �5�
The phase di�erence between two symmetrically placed detectors will be periodic with theparticle diameter. Large particles will, therefore, produce a phase di�erence which is notunique. This ambiguity is removed by adding a third photo detector.
2.3. Particle concentration measurement
The best suitable technique for small particles, sizes less than the measuring volume, is theTime Ratio Technique, Sekoguchi et al. (1982). The technique uses the time ratio of thedispersed phase to the total sampling time to ®nd the average volume fraction of solids. Whena particle is in the measuring volume, the local volume fraction ei of the dispersed phase maybe expressed as:
ei � pD3i
6Vfocus
�6�
where Di is the diameter of the ith particle and Vfocus is the volume of the measuring volume.Within the sampling time period Tsample, the average volume fraction of the solid is:
es �
XNi
i�1tiei
Tsample
�7�
The basic assumption of the technique is that there is only one particle in the measuringvolume at the same time and, hence, the technique is only suitable for very dilute systems.
3. Multiphase gas/solid model
A multiphase Computational Fluid Dynamics (CFD) model for turbulent gas/solid ¯ow isdeveloped and presented. The model uses an Eulerian description of the phases, and theconservation equations for the solid phases are based on kinetic theory for granular ¯ow withbasis on the work of Jenkins and Savage (1983), Lun et al. (1984), Ding and Gidaspow (1990),Gidaspow (1994) and further extended to binary mixtures by Manger (1996). Transport of thedistribution functions are described by the Boltzmann equation. The model is modi®ed,generalized and made consistent for one gas phase and N number of solid phases to enabledescription of realistic particle size distributions. Each solid phase is characterized by diameter,form factor, density and restitution coe�cient. The constitutive equations come from the
V. Mathiesen et al. / International Journal of Multiphase Flow 26 (2000) 387±419390

interactions of the ¯uctuating and the mean motion of the particles. The interactions give riseto e�ective shear viscosities, which relates the random motion to the mean motion of theparticles. A turbulent kinetic energy equation or granular temperature is derived for each solidphase in order to predict the random ¯uctuations for each solid phase. The granulartemperature is de®ned as one-third times the ¯uctuating velocity squared.To enable modeling of porous plates and obstructions, area and volume porosities are
included in the governing equations. The porosities may have values between zero and one,where zero is a totally blocked area/volume and unity is open. This makes it more easy todescribe complex geometries such as circulating ¯uidized beds.
3.1. Transport equations
The CFD model is three-dimensional in Cartesian coordinates, and the governingconservation equations are presented in tensor notation.
3.1.1. Continuity equationsThe gas continuity equation is given by:
@
@t
ÿbvegrg
�� @
@xi
ÿbiegrgUi,g
� � 0 �8�
where e, r and Ui are volume fraction, density and the ith direction velocity component,respectively. bv is volume porosity and bi is the area porosity in ith direction.The continuity equation for each solid phase is written as:
@
@t
ÿbvesrs
�� @
@xi
ÿbiesrsUi,s
� � 0 �9�
No mass transfer is allowed between the phases.
3.1.2. Momentum equationsThe gas phase momentum equation in j-direction may be expressed as:
@
@t
ÿbvegrgUj,g
�� @
@xi
ÿbiegrgUi,gUj,g
� �ÿ ÿbveg
� @P@xj� @
@xi
ÿbitij,g
�� bvegrggj � bv
XMm�1, m6�g
Fgm
ÿUj,m ÿUj,g
� �10�
P and gj are ¯uid pressure and j-direction component of gravity, respectively. Fgm is dragcoe�cient between the phases g and m.The stress tensor tij,g is given by:
tij,g � meff,g
��@Uj
@xi� @Ui
@xj
�ÿ 2
3dij@Uk
@xk
�g
�11�
where dij is the Kroenecker delta.
V. Mathiesen et al. / International Journal of Multiphase Flow 26 (2000) 387±419 391

The gas phase turbulence is modeled by the Sub Grid Scale (SGS) model proposed byDeardor� (1971), and thus the e�ective viscosity meff,g may be estimated as:
meff,g � egÿmlam,g � mturb,g
� � egmlam,g � egrg�ctD�2�����������������Sij,g:Sij,g
pD � �DxDyDz�1=3 and Sij,g � 1
2
�@Uj
@xi� @Ui
@xj
�g
�12�
The constant turbulence parameter ct is estimated to be 0.079 by using ReNormalizationGroup (RNG) theory (Yakhot and Orszag, 1986).The momentum equations for the solid phases in the j-direction may be written as:
@
@t
ÿbvesrsUj,s
�� @
@xi
ÿbiesrsUi,sUj,s
� �ÿ ÿbves
� @P@xj� @
@xi
ÿbiPij,s
�� bvesrsgj � bv
XMm�1, m6�s
Fsm
ÿUj,m ÿUj,s
� �13�
where the total stress tensor pij,s for each solid phase is:
Pij,s � ÿPsdij � xsdij@Uk,s
@xk� ms
��@Uj
@xi� @Ui
@xj
�ÿ 2
3dij@Uk
@xk
�s
�14�
The solid phase pressure Ps, bulk viscosity xs and shear viscosity ms are derived from thekinetic theory for granular ¯ow. The solid phase pressure Ps consists of a collisional and akinetic part:
Ps �XNn�1
PC,sn � esrsys �15�
where PC,sn is the pressure caused by collisions between the solid phases s and n, and has theexpression:
PC,sn � p3�1� esn�d 3
sngsnnsnn
(m0ysynÿ�ms=mn�ys � �mn=ms�yn
�)( �m0=ms�2ysynÿys � �mn=ms�2yn
��ys � yn�
)3=2
esn � 1
2�es � en�, dsn � 1
2�ds � dn� and m0 � ms �mn �16�
e, d, n and m are coe�cient of restitution, diameter of the particle, number of particles andmass of a particle, respectively. The coe�cient of restitution is unity for fully elastic, and zerofor inelastic collisions. By using the assumption of spherical particles, number of particles andmass of a particle are, respectively:
V. Mathiesen et al. / International Journal of Multiphase Flow 26 (2000) 387±419392

ns � 6es
pd 3s
and ms � pd 3srs
6�17�
gsn is the radial distribution function, which is nearly one when the ¯ow is dilute and becomesin®nite when the ¯ow is so dense that motion is impossible. Based on the single solid phasemodel given implicitly by Bagnold (1954), a new binary radial distribution function is proposedhere:
g0 �(1ÿ
�1ÿ eg
es,max
�1=3)ÿ1
gsn � N
2
g0ÿ1ÿ eg
��es � en� �18�
where es,max is maximum total volume fraction of solid.The solid phases bulk viscosity may be written as:
xs �XNn�1
PC,sn
dsn
3
ÿys � �mn=ms�yn
� �������������������������������������������������2
pysyn
ÿys � �mn=ms�2yn
�s�19�
The solid phases shear viscosity consists of a collisional term:
mcol,s �XNn�1
PC,sndsn
5
ÿys � �mn=ms�yn
� �������������������������������������������������2
pysyn
ÿys � �mn=ms�2yn
�s�20�
and a kinetic term:
mkin,s �2mdil,s
1
N
XNn�1�1� esn�gsn
(1� 4
5
XNn�1
gsnen�1� esn�)2
�21�
where
mdil,s �15
8d 3s
esls
�����������������2msys,av
p
rand ls � 1
6���2p ds
es
�22�
To ensure that the dilute viscosity is ®nite as the volume fraction of solid approaches zero, themean free path ls is limited by a characteristic dimension. The average granular temperatureys,av is obtained from:
ys,av � 2msys8<:XNn�1
�nn
ns
��dsn
ds
�2���������������������������������������m0=ms�2ynÿ
ys � �mn=ms�2�yn
sS3=2
9=;2
S � �m0=ms�2ysynÿys � �mn �ms�2yn
��ys � yn�
�23�
V. Mathiesen et al. / International Journal of Multiphase Flow 26 (2000) 387±419 393

For egR0:8, the gas/solid drag coe�cients are based on Ergun equation (Ergun, 1952):
Fsg � 150es
ÿ1ÿ eg
�mlam,g
eg
ÿcsds
�2 � 1:75esrgj~ug ÿ ~usj
csds
�24�
where cs is the form factor which is unity for spheres and between zero and one for all otherparticles. For eg > 0:8, the drag coe�cients are based on the work by Wen and Yu (1966), andRowe (1961):
Fsg � 3
4Cd
esegrgj~ug ÿ ~usjcsds
eÿ2:65g
Cd � f24
Res
ÿ1� 0:15Re0:687
�for ResR1000
0:44 for Res > 1000
�25�
Res �dsrgegj~ug ÿ ~usj
mlam,g
The particle/particle drag coe�cients may be expressed as (Manger, 1996):
Fsn � PC,sn
8<: 3
dsn
���������������������������������2ÿm2
sys �m2nyn
�pm2
0ysyn
s� 1
j~un ÿ ~usj
"rjlnas
an
j
� ysyn
ys � yn
jryn
y2nÿ rys
y2sj � 3rj ln�mnyn�
ln�msys� j#9=;
�26�
3.1.3. Turbulent kinetic energy equationsA transport equation for turbulent kinetic energy or granular temperature equation is
de®ned for each solid phase, i.e.:
3
2
�@
@t
ÿbvesrsys
�� @
@xi
ÿbiesrsUi,sys
��
� bv
�Pij,s:
@Uj,s
@xi
�� @
@xi
�biks
@ys
@xi
�ÿ bvgs ÿ 3bvFsgys �27�
Here, the terms on the right side of the equation represent production due to shear, di�usivetransport, dissipation due to inelastic collisions and dissipation due to ¯uid friction. Aproduction term due to ¯uctuations in drag has been assumed as negligible. This is areasonable assumption for the relatively large and heavy glass particles considered in this work.
V. Mathiesen et al. / International Journal of Multiphase Flow 26 (2000) 387±419394

Hence, the particle response time is assumed to be much longer than the characteristic timescale for the turbulent ¯uid motion.The conductivity of granular temperature ks, and the dissipation due to inelastic collisions gs
are determined from the kinetic theory for granular ¯ow. The conductivity is given by a diluteand a dense part as:
ks � 2kdil,s
1
N
XNn�1�1� esn�gsn
(1� 6
5
XNn�1
gsnen�1� esn�)2
�2esrsds
�����ys
p
r XNn�1
engsn�1� esn�
kdil,s � 225
32esls
�����������������2msys,av
p
r �28�
The collisional dissipation is given by:
gs �XNn�1
3
4PC,sn
�1ÿ esn�dsn
244 �����������������������������������������������������������2ysyn
pÿ�ms=m0�2ys � �mn=m0�2yn
�s
ÿ dsn
�ms=m0�ys � �mn=m0�yn
�ms=m0�2ys � �mn=m0�2yn
!@Uk,s
@xk
35 �29�
3.2. Consistency of the multiphase model
A multiphase gas/solid ¯ow model based on kinetic theory for granular ¯ow has beenpresented. In order to handle realistic particle distributions, the multiphase model has beenextended from a single solid phase to multiple solid phases. Before the multiphase gas/solid¯ow model is applied, the generalization from a single solid phase to multiple solid phases isdemonstrated to be consistent.There are two requirements for model consistency that must be ful®lled. The ®rst
requirement is that the multiphase gas/solid ¯ow model with multiple solid phases must reduceto the corresponding model with a single solid phase, if the number of solid phases are chosenequal to one. The second requirement is that a solid phase consisting of particles with identicaldiameter, density and coe�cient of restitution can be represented either as a single solid phaseof volume fraction es or as N distinct solid phases, whose respective volume fractions will sumto es:
3.2.1. Single solid phaseFor a single solid phase, the momentum equation and the constitutive equations presented
by Eqs. (13)±(26) will be reduced to following equations:
V. Mathiesen et al. / International Journal of Multiphase Flow 26 (2000) 387±419 395

@
@t
ÿbvesrsUj,s
�� @
@xi
ÿbiesrsUi,sUj,s
�� ÿÿbves
� @P@xj� @
@xi
ÿbiPij,s
�� bvesrsgj � Fsg
ÿUj,g ÿUj,s
� �30�
The total stress tensor for the single solid phase model is identically to Eq. (14), but the solidphase pressure will be simpli®ed to:
Ps � esrs
ÿ1� 2�1� es�esg0
�ys �31�
The single solid phase bulk viscosity can be written as:
xs �4
3e2srsdsg0�1� es�
�����ys
p
r�32�
The solid phase shear viscosity may be rewritten as:
ms � 2mdil,s
�1� es�g0
�1� 4
5�1� es�g0es
�2
�45e2srsdsg0�1� es�
�����ys
p
r�33�
where
mdil,s �5
16rsesls
���������2pys
pand ls � 1
6���2p ds
es
�34�
The transport equation for the turbulent kinetic energy of a single solid phase is equivalent toEq. (27). The transport coe�cient is reduced to:
kn � 2kdil,s
�1� es�g0
�1� 6
5�1� es�g0es
�2
�2e2srsdsg0�1� es������ys
p
r�35�
where
kdil,s � 75
64rsesls
���������2pys
pand ls � 1
6���2p ds
es
�36�
The collisional energy dissipation is simpli®ed to:
gs � 3ÿ1ÿ e2s
�e2srsg0ys
4
ds
�����ys
p
rÿ @Uk,s
@xk
!�37�
The model presented by Eqs. (30)±(37) is the same as the single solid phase model proposed byGidaspow (1994). This model is also the starting point for the present multiphase gas/solid¯ow model with multiple solid phases.
3.2.2. Two identical solid phasesIf a gas/solid system is modeled by N solid phases with particles of identical diameter, form
V. Mathiesen et al. / International Journal of Multiphase Flow 26 (2000) 387±419396

factor, density and coe�cients of restitution, the mathematical model for a single solid phasedescribed by Eqs. (30)±(37) should be retained. For simplicity, the number of identical solidphases N is chosen to be 2, and, therefore:
es � e1 � e2 �38�By adding the momentum equations for the solid phases 1 and 2, a common momentumbalance for the solid phases may be obtained:
@
@t
ÿbvesrsUj,s
�� @
@xi
ÿbiesrsUi,sUj,s
� � ÿÿbves
� @P@xj
� @
@xi
"bi
�P1 � P2�dij � �x1 � x2�dij
@Uk,s
@xk� �m1 � m2�
�@Uj
@xi� @Ui
@xiÿ 2
3dij@Uk
@xk
�s
!#
� bvesrsgj �ÿF1g � F2g
�ÿUj,g ÿUj,s
��39�
The momentum Eqs. (30) and (39) are identical, if the following equalities are satis®ed:
Ps � P1 � P2
xs � x1 � x2
ms � m1 � m2
Fsg � F1g � F2g �40�Likewise, the transport equations for the turbulent kinetic energy or granular temperature inthe two formulations can be shown to be identical, if the following equalities are satis®ed:
ks � k1 � k2
gs � g1 � g2 �41�The equalities in Eqs. (40) and (41) can be shown to be ful®lled, if the collisional pressuressatisfy the following relation:
PC,s � PC,1 � PC,2 �42�The collisional pressure for a single solid phase is given by:
PC,s � 2�1� es�e2srsg0ys �43�For two identical solid phases, the sum of the collisional pressures are:
PC,1 � PC,2 � 2�1� es�e21rsg11ys � 2�1� es�2e1e2rsg12ys � 2�1� es�2e22rsg22ys �44�Comparing Eqs. (43) and (44) leads to:
V. Mathiesen et al. / International Journal of Multiphase Flow 26 (2000) 387±419 397

e2s g0 � e21g11 � 2e1e2g12 � e22g22 �45�
For the multiphase gas/solid models with either a single solid phase or multiple identical solidphases to be the same, the almost trivial ®nding is reached that the radial distribution functionmust be the same, i.e.,
g0 � g11 � g12 � g22 �46�Deriving binary radial distribution functions, which behave properly, is clearly notstraightforward. In the literature, Lebowitz (1964), Jenkins and Mancini (1987), Zamankhan(1995) and Boemer (1996) have proposed di�erent models for the binary radial distributionfunction. However, none of these models reduce to the monodispersed radial distributionfunction for multiple solid phases with identical particles, become in®nite for maximum solidpacking and are an expression for a probability of collision between two solid phases.The binary radial distribution function proposed in Eq. (18) satisfy all three requirements,
provided that the initial volume fractions for solid phases 1 and 2 are:
e1 � e2 � 1
2es �47�
It should be noted that the fraction of the phases only have to be initially identical. If they are,the volume fractions of the two solid phases will be equal at each point in time and space,since Eqs. (40) and (41) are satis®ed. This shows that a solid phase consisting of particles withidentical diameter, density and coe�cient of restitution can be represented either as a singlesolid phase of volume fraction es or as N distinct solid phases, whose respective volumefraction is es=N: Otherwise, when considering N solid phases which are not identical, theconcentrations of the solid phases do not have to be equal.
4. Solution procedure
The governing equations are solved by a ®nite volume method (Patankar, 1980). Thecalculation domain is divided into a ®nite number of control volumes. At main grid pointsplaced in the center of the control volume, volume fraction, density and turbulent kineticenergy are stored. A staggered grid arrangement is used and the velocity components arestored at the control volume surfaces. The conservation equations are integrated in space andtime. This integration is performed using upwind di�erencing in space and implicit in time. Theset of algebraic equation are solved by the TriDiagonal-Matrix Algorithm, except for thevolume fraction where a point iteration method is used. Due to the strong coupling betweenthe phases through the drag forces, the two-phase Partial Elimination Algorithm (PEA)(Spalding, 1985) is generalized to multiple phases, and is used to de-couple the drag. TheInterPhase-Slip Algorithm (IPSA) is used to take care of the coupling between continuity andthe velocity equations, from Spalding (1983).
V. Mathiesen et al. / International Journal of Multiphase Flow 26 (2000) 387±419398

5. Experimental setup
An experimental study of a cold ¯ow laboratory scale circulating ¯uidized bed using LDAand PDA are conducted. In the riser of the circulating ¯uidized bed, diameter, velocity andvolume fraction measurements are performed, simultaneously. The dispersed phase is sphericalglass particles which are classi®ed as group B particles (Geldart, 1973). A LDA/PDA systemdelivered by DANTEC is used in the experimental study. The experiments are conducted withone dilute particle concentration and with three di�erent super®cial gas velocities.
5.1. Circulating ¯uidized bed
The riser has a internal diameter of 0.032 m, is 1.0 m high and made of clear plexiglass. Theprimary gas inlet is located at the bottom of the riser. To provide a uniform gas velocity at theinlet, an air distributor is installed. The distributor is a ®lter-plate with a thickness andporosity of 0.004 m and 0.36, respectively.At the top of the riser, the suspended particles enter a glass cyclone where the solid are
separated from the gas and recycled via a return loop. Supply of secondary air, positioned 0.05 m
Fig. 1. A schematic sketch of the laboratory scale CFB.
V. Mathiesen et al. / International Journal of Multiphase Flow 26 (2000) 387±419 399

above the air distributor feeds the solid back to the riser. Fig. 1 shows a schematic sketch ofthe circulating ¯uidized bed system.
The air has ambient temperature and pressure. To minimize the in¯uence of electrostatice�ects, a humidi®er is installed upstream the main air inlet.
The measurements are conducted with three di�erent super®cial gas velocities, 0.8, 1.0 and1.2 m/s, respectively. To prevent the particles to build up in the recirculation loop, thesecondary air inlet velocity is held constant at 0.3 m/s. The secondary air inlet has a diameterof 0.008 m.
From a Gaussian particle size distribution with a Sauter mean diameter of 157 mm, twodistinct particle groups are sieved out. The sieved particles have diameters between 100 and 130m, and between 175 and 205 m for the smallest and largest particles, respectively. The meanparticle diameter of the two groups are approximately 120 and 185 mm. The two distinctparticle groups are mixed together and the initial volume concentration of each group isidentical. The initial bed height is 0.04 m. Thus, the overall volume concentration of solid inthe riser is 2.5%. The particle density is 2400 kg/m3.
5.2. Laser and phase Doppler anemometry
The laser source is a 2 W Spectra-Physics Stabilite 2016 Argon-Ion laser operating at awavelength of 514.5 nm. The LDA/PDA system is applied in an o�-axis back scatter modus.The transmitting and receiving lenses have focal length of 310 and 600 mm, respectively. Table1 gives a summary of the most essential LDA/PDA parameters.
The measurements are performed at three heights 0.2, 0.4 and 0.7 m above the main gasinlet, respectively. At each height the measurements are done at 25 di�erent radial positions,from wall to wall. An IBM compatible computer is used on-line for data acquisition andprocessing. Mean particle velocity and ¯uctuating velocity pro®les are obtained for eachparticle group. Volume fraction pro®les of solid and mean diameter pro®les are measured aswell. Mean diameters along the center axis are also measured and presented. The local meandiameters and velocities are the mean values of 3000 accepted samples in each measuring point.
Table 1
LDA/PDA parameters
Fringe spacing 4.2 mmBeam separation 38 mmFocal length, transmitting lens 310 mmFocal length, receiving lens 600 mm
Width of measuring volume 0.15 mmLength of measuring volume 2.45 mmE�ective scattering angle 1248Velocity range ÿ1.26 to 3.28 m/s
Particle/gas refraction index 1.51/1.00
V. Mathiesen et al. / International Journal of Multiphase Flow 26 (2000) 387±419400

6. Numerical parameters, initial and boundary conditions
The whole circulating ¯uidized bed loop as shown in Fig. 1, is modeled and simulated in atwo-dimensional Cartesian coordinate system. The calculation domain is divided into 29 � 102control volumes in radial and axial direction, respectively. The grid is uniform in the axialdirection, but in the radial direction a non-uniform grid is used in order to have smallercontrol volumes close to the walls, where the volume fraction and velocity gradients increase.Although a grid dependence study is clearly desirable, the long computational times involvedmake such a study infeasible. Based on previous experiences (e.g., Samuelsberg and Hjertager,1996a, 1996b), the grid resolution appears, nevertheless, to be adequate. The circulating¯uidized bed model with internal obstructions and grid nodes is shown in Fig. 2.Two solid phases are used to describe the particles. The two solid phases have identical ¯ow
parameters, but di�erent particle diameters. Table 2 gives a summary of the ¯ow parameters.The reactor is initially ®lled with a 0.04 m high bed, where the total volume fraction of solid
is approximately 0.63. The two solid phases are perfectly mixed in the bed and are assumed tohave an identical initial volume fraction.
Fig. 2. Calculation domain with internal obstructions and grid nodes.
V. Mathiesen et al. / International Journal of Multiphase Flow 26 (2000) 387±419 401

One-dimensional plug ¯ow is assumed at the primary as well as at the secondary gas inlet.At the outlet, which is located at the top of the cyclone, a continuity condition for the gasphase is used. No particles are allowed to leave the circulating ¯uidized bed system. At thewalls, the no-slip wall condition is used for the gas. Even though a humidi®er was installed toprevent electrostatic e�ects, signi®cant static electricity was observed during the experiments,and particles were sticking to the wall. Due to this a no-slip condition is also used for the solidphases. A zero gradient condition is used for the turbulent kinetic energy.All the simulations are run for 12 s of real time. The time averaged results are obtained from
the last two seconds of the simulations.
7. Experimental and computational results
In the experimental as well as in the computational study, particular emphasis is given to the¯ow condition with a super®cial gas velocity of 1.0 m/s. Flow conditions with lower and highersuper®cial gas velocity, 0.8 and 1.2 m/s, respectively, are used to investigate the sensitivity andgeneral trends of the ¯ow behavior.
7.1. Particle diameter pro®les
The particle size distribution is important in chemical reactors, and axial as well as radialsegregation by size will have large in¯uence on the reaction kinetics and catalyst activity. It iswell accepted knowledge that risers can generally be divided into three distinct zones. Abovethe inlet, there will be a section looked upon as a dense turbulent bubbling bed with nearlyconstant concentration of solid. In this region, the averaged particle size will be large. Abovethe dense zone comes a freeboard zone with a smaller averaged particle size and a signi®cantdecreasing of solid concentration. At the top of the riser an exit zone will exist. Depending onthe outlet geometry, the concentration of solid will decrease/increase and the particle diameter
Table 2Numerical ¯ow parameters
Gas phase Solid phase I Solid phase II
Mean diameter (mm) ± 120 185Density (kg/m3) 1.20 2400 2400Form factor ± 1.00 1.00
Laminar viscosity (kg/ms)] 1.8Eÿ5 ± ±Restitution coe�cient, solid ± 0.99 0.99
Courant number 1.00Maximum total volume fraction of solid 0.63
V. Mathiesen et al. / International Journal of Multiphase Flow 26 (2000) 387±419402

will normally be small. When the super®cial gas velocity increases, the solid concentrationdistribution as well as the diameter distribution will be more uniform in the axial direction.Fig. 3 shows the measured and computed axial number averaged diameter pro®le along the
center axis of the riser. The super®cial gas velocity is 1.0 m/s. The averaged diameter issigni®cantly decreasing with the height above the inlet. The measurements show that from 0.2to 0.7 m above the primary gas inlet, the averaged diameter decreases from 135 to 120 mm.Due to a dense zone, it was not possible to conduct measurements lower than 0.2 m above theinlet. However, the experimentally obtained mean diameter seems to increase exponentially inthe dense zone. The simulation shows exactly the same trend and the maximum deviationbetween measurements and simulation is just about 2 mm.The experimental and computational results show the importance of using more than one
solid phase in modeling of a gas/solid ¯ow system with a non-uniform particle sizedistribution. With one solid phase, the deviation between the real and actual diameter wouldhave been 30±40 mm in most of the riser. By using two solid phases the maximum deviation isreduced to about 2 mm.With di�erent super®cial gas velocities, the form and slope of the axial diameter pro®le will
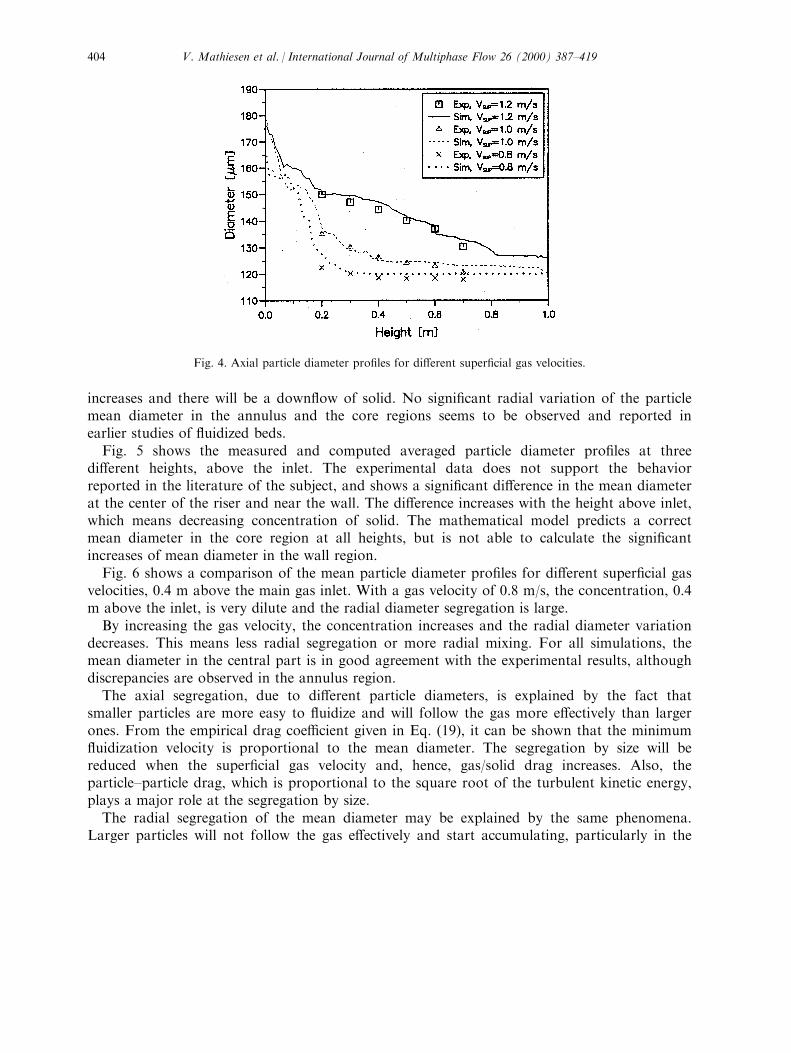
be changed. This is shown in Fig. 4. When the gas velocity decreases, the particles are moredi�cult to ¯uidize and only the smallest particles will reach the freeboard zone and circulate inthe loop. In the dense section, a very large mean diameter is observed. By increasing the gasvelocity a more uniform axial diameter distribution appears. The mathematical model predictsthe axial segregation very well for all ¯ow conditions and only insigni®cant deviations from theexperimental data are observed.Core-annulus ¯ow will normally occur in the riser of a circulating ¯uidized bed and is
frequently observed and reported in the literature. Core-annulus ¯ow is characterized by anearly constant particle up¯ow and relatively small concentration of solid in the central part ofthe riser, called the core region. Near the wall, in the annulus, the concentration of solid
Fig. 3. Axial particle diameter pro®le, VSUP � 1:0 m/s.
V. Mathiesen et al. / International Journal of Multiphase Flow 26 (2000) 387±419 403
increases and there will be a down¯ow of solid. No signi®cant radial variation of the particlemean diameter in the annulus and the core regions seems to be observed and reported inearlier studies of ¯uidized beds.Fig. 5 shows the measured and computed averaged particle diameter pro®les at three
di�erent heights, above the inlet. The experimental data does not support the behaviorreported in the literature of the subject, and shows a signi®cant di�erence in the mean diameterat the center of the riser and near the wall. The di�erence increases with the height above inlet,which means decreasing concentration of solid. The mathematical model predicts a correctmean diameter in the core region at all heights, but is not able to calculate the signi®cantincreases of mean diameter in the wall region.Fig. 6 shows a comparison of the mean particle diameter pro®les for di�erent super®cial gas
velocities, 0.4 m above the main gas inlet. With a gas velocity of 0.8 m/s, the concentration, 0.4m above the inlet, is very dilute and the radial diameter segregation is large.By increasing the gas velocity, the concentration increases and the radial diameter variation
decreases. This means less radial segregation or more radial mixing. For all simulations, themean diameter in the central part is in good agreement with the experimental results, althoughdiscrepancies are observed in the annulus region.The axial segregation, due to di�erent particle diameters, is explained by the fact that
smaller particles are more easy to ¯uidize and will follow the gas more e�ectively than largerones. From the empirical drag coe�cient given in Eq. (19), it can be shown that the minimum¯uidization velocity is proportional to the mean diameter. The segregation by size will bereduced when the super®cial gas velocity and, hence, gas/solid drag increases. Also, theparticle±particle drag, which is proportional to the square root of the turbulent kinetic energy,plays a major role at the segregation by size.The radial segregation of the mean diameter may be explained by the same phenomena.
Larger particles will not follow the gas e�ectively and start accumulating, particularly in the
Fig. 4. Axial particle diameter pro®les for di�erent super®cial gas velocities.
V. Mathiesen et al. / International Journal of Multiphase Flow 26 (2000) 387±419404

Fig. 5. Mean particle diameter pro®les at di�erent heights, VSUP � 1:0 m/s.
V. Mathiesen et al. / International Journal of Multiphase Flow 26 (2000) 387±419 405

Fig. 6. Mean particle diameter pro®les for di�erent super®cial gas velocities, h � 0:4 m.
V. Mathiesen et al. / International Journal of Multiphase Flow 26 (2000) 387±419406

Fig. 7. Volume fraction pro®les of solid at di�erent heights, VSUP � 1:0 m/s.
V. Mathiesen et al. / International Journal of Multiphase Flow 26 (2000) 387±419 407

Fig. 8. Computed volume fraction pro®les, VSUP � 1:0 m/s.
V. Mathiesen et al. / International Journal of Multiphase Flow 26 (2000) 387±419408

Fig. 9. Particle velocity pro®les at di�erent heights, VSUP � 1:0 m/s.
V. Mathiesen et al. / International Journal of Multiphase Flow 26 (2000) 387±419 409

wall region where the gas velocity is very low. Another important factor in a circulating¯uidized bed will be that the smallest particle will probably circulate in the whole system, up inthe core region and recirculate back through the standpipe. Larger particles will also start¯owing up in the core, and then loose the momentum and start falling down near the wall.Thus, a larger mean diameter is observed in the annulus than in the core region.In CFD modeling of bubbly two-phase ¯ow, Lahey (1995) and others have shown that a
transverse force has signi®cant in¯uence on the radial phase distribution. The transverse forceis proportional to the axial velocity gradient in radial direction of the continuous phase andthe relative velocity between the dispersed and continuous phase. It may be reasonable thatthis force should have an in¯uence also in a gas/solid ¯ow system. To test this, the transverseforce was included into the mathematical model. However, the simulations show that thetransverse force in a gas/solid ¯ow system has only small e�ects on the ¯ow pattern.A Magnus-type force which is produced by spin and rotation of particles may have e�ects
on the radial segregation. This force is more complex to implement in the model and is notincluded, but the e�ects should be studied in the future.
7.2. Volume fraction pro®les
The LDA/PDA system delivered by DANTEC is only able to estimate the concentration ofsolid by the Time Ratio Technique. The technique has the limitations that there should be onlyone particle in the measuring volume at the same time and that this particle is less than themeasuring volume. Since the width of the measuring volume is 150 mm and the system cannotbe characterized as very dilute, there may be signi®cant errors in the volume fractionsmeasurements. However, the volume fraction measurements should give a good indication ofthe order of magnitude and general trends.Fig. 7 shows the measured and computed radial volume fraction pro®les of solid at three
di�erent heights for a super®cial gas velocity of 1.0 m/s. The general agreement between theexperimental and numerical results is fairly good. The simulated and measured pro®les havethe same form. At all heights the solid concentration distribution are as expected, dilute in thecore region and more dense in the wall region in the simulation as well as in the measurements.The solid concentration is most dense at height 0.2 m. The heights 0.4 and 0.7 m seem to be inthe freeboard zone, and the solid concentration is more dilute. At these two heights there arelarger di�erences between the concentration of solid in the annulus and in the core regions.The computed volume fraction pro®les of each solid phase are shown in Fig. 8. For both
phases, the concentration of solid increases from the center of the riser and toward the wall.Similar to the mean diameter, the radial concentration gradient seems to increase with heightabove the inlet. The smallest particles (solid phase I) separate more distinctly between theannulus and the core regions than the larger ones (solid phase II). The largest particles havenot the same increase of the volume fraction in the wall region, as the smaller solid.
7.3. Particle velocity pro®les
Measured and computed particle velocity pro®les for each particle group are presented in
V. Mathiesen et al. / International Journal of Multiphase Flow 26 (2000) 387±419410

Fig. 9. The particle velocity pro®les are obtained with a super®cial gas velocity of 1.0 m/s, and0.2, 0.4 and 0.7 m above the main gas inlet.As illustrated in the ®gure, the particles move upward in the central part of the riser and
downward near the walls, a behavior which is typical for core-annulus ¯ow. The behavior isclearly observed in the experiments as well as in the simulations. At all heights, the negativevelocities in the wall regions are almost correctly predicted. The computed core velocities are ingood agreement with the experimental results, although a too low velocity is obtained at height0.2 m above the primary gas inlet.The measured velocity pro®les show a relative velocity between particles of di�erent sizes in
the core region. In the wall region, no signi®cant velocity deviation is observed in theexperiments. The relative velocities are expected and caused by di�erent gas-particle drag, fordi�erent particle sizes. The particle±particle drag, which is a strong function of the particlecollisions will also play a major role at the magnitude of the relative velocity. The particle±particle drag decreases normally in a dilute gas/solid system where the particle±particlecollisions are of less importance. The relative velocity decreases slightly with the height abovethe gas inlet, due to a lower mean velocity in the upper part of the riser.The simulation shows a behavior similar to the measurements even though the relative
velocity is a little too high at all heights, probably due to a too small estimated particle±particle drag. A too large computed relative particle velocity may be one of the reasons for theincorrectly obtained mean diameters in the annulus region. A too low particle velocity of thelargest particle will give a too low circulation of larger particles in the riser and, hence, anincorrect radial diameter distribution.Figs. 10 and 11 show the velocity pro®les at height 0.4 m obtained with super®cial gas
velocity of 0.8 and 1.2 m/s, respectively. The same trends are observed, typical core-annulus¯ow and a relative velocity between the particles of di�erent sizes in the central part of theriser. The relative velocity increases slightly with the super®cial gas velocity. The simulations
Fig. 10. Particle velocity pro®les, h � 0:4 m and VSUP � 0:8 m/s.
V. Mathiesen et al. / International Journal of Multiphase Flow 26 (2000) 387±419 411

are in a fairly good agreement with the measurements, and a typical core-annulus ¯ow with arelative velocity between the solid phases are obtained for all ¯ow conditions.
7.4. Fluctuating particle velocity
A comparison of the experimental and numerical results is done in Fig. 12. The particleRMS velocity pro®les are obtained at heights 0.2, 0.4 and 0.7 m and with a super®cial gasvelocity of 1.0 m/s.The computed particle RMS velocities are derived from the de®nition of granular
temperature:
VRMS ��������3ys
p�48�
The RMS velocities from experiments are found by Eq. (4). The RMS velocity pro®les aremeasured for each particle group, and calculated for each solid phase.For a very dilute gas/solid ¯ow system that is considered in these experiments, the
¯uctuating velocity or the turbulence is mainly produced by shear. The RMS velocity in such asystem increases from the center of the riser toward the wall. The turbulence decreases slightlywith the height of the riser. At height 0.2 m, where the concentration of solid is more dense,particle±particle collisions have signi®cantly in¯uence the magnitude of the turbulence. Hence,the turbulence does not increase as much in the shear layer at this height, as at 0.4 and 0.7 m,where the concentration of solid is more dilute.The general trends in the simulation are in a relatively good agreement with the experimental
results. However, the simulations are a little too low at the heights 0.2 and 0.4 m. The relativeparticle RMS velocity decreases correctly with the height of the riser, and a small increase ofthe turbulence in the shear layer is obtained in the simulation. The model calculate correctlythe highest turbulence for the smallest particles (solid phase I).
Fig. 11. Particle velocity pro®les, h � 0:4 m and VSUP � 1:2 m/s.
V. Mathiesen et al. / International Journal of Multiphase Flow 26 (2000) 387±419412

Fig. 12. Particle RMS velocity pro®les at di�erent heights, VSUP � 1:0 m/s.
V. Mathiesen et al. / International Journal of Multiphase Flow 26 (2000) 387±419 413

A gas/solid ¯ow system, like a circulating ¯uidized bed, will never reach a normal steadystate condition. The system will exhibit a ¯uctuating behavior. In modeling such systems, thekinetic theory for granular ¯ow takes care of the small scale ¯uctuations which are present.The large scale ¯uctuations are also simulated. Figs. 13 and 14 show the calculated large scalevelocity ¯uctuations for each solid phase at the center line, 0.2 and 0.7 m above the gas inlet,respectively. The ¯uctuations are plotted for the ®rst 10 s of real time and with a super®cialgas velocity of 1.0 m/s. The large scale velocity ¯uctuations have the same frequency, and therelative velocity between the solid phases is nearly constant. A wide range of particle velocitiesis observed, including positive and negative velocities. In the experiments, the large scale¯uctuations were easy to observe visually.The large scale ¯uctuating ¯ow behavior of a circulating ¯uidized bed will obviously also
Fig. 13. Large scale velocity ¯uctuations, h � 0:2 m, VSUP � 1:0 m/s.
Fig. 14. Large scale velocity ¯uctuations, h � 0:7 m, VSUP � 1:0 m/s.
V. Mathiesen et al. / International Journal of Multiphase Flow 26 (2000) 387±419414

lead to a ¯uctuating mean diameter. The computed ¯uctuating diameter at the centerline, 0.4m above the gas inlet is shown in Fig. 15. The frequency of the diameter ¯uctuations have thesame order of magnitude as the velocity ¯uctuations. The number averaged diameter ¯uctuatesbetween 120 and 145 mm.The large scale velocity ¯uctuations as well as the small scale ¯uctuations are included in the
measurements of the particle RMS velocity pro®les. Hence, the computed RMS velocity fromthe granular temperature cannot be compared directly with the measured RMS velocity. Thecomputed large scale ¯uctuations give rise to an extra RMS velocity which is added to theRMS velocity from the granular temperatures. The total RMS velocity is compared against theexperimental data in Fig. 16. Although the large scale ¯uctuations seem to be signi®cant, theyhave only minor e�ects on the total particle RMS velocity of each phase. The large scalevelocity ¯uctuations are highest and have most in¯uence on the total RMS velocity in theshear layers.
8. Concluding remarks
An extensive experimental study of the ¯ow behavior of group B particles in a cold ¯owlaboratory scale circulating ¯uidized bed using LDA and PDA is performed. Mean and RMSparticle velocities are obtained for two di�erent particle sizes. In addition, solid volumefraction and mean diameter are measured. The experimental results are analyzed and may besummarized as follow:
. A typical core-annulus ¯ow behavior is observed in the riser.
. A relative particle velocity between small and larger particles is measured. The relativevelocity is largest in the center of the riser and decreases toward the walls.
. The turbulent velocity is almost constant in the center of the riser and increases in the shearlayer.
Fig. 15. Diameter ¯uctuations, h � 0:4 m, VSUP � 1:0 m/s.
V. Mathiesen et al. / International Journal of Multiphase Flow 26 (2000) 387±419 415

Fig. 16. RMS velocity pro®les added large scale ¯uctuations, VSUP � 1:0 m/s.
V. Mathiesen et al. / International Journal of Multiphase Flow 26 (2000) 387±419416

. A relative particle RMS velocity is observed in the lower part of the riser. Smaller particles¯uctuate more than larger ones. In the upper part of the riser, the turbulent velocity seemsto be nearly independent of the particle size.
. The solid concentration is dilute in the core region and denser in the annulus zone.
. An axial segregation by size is shown. The axial segregation decreases when the super®cialgas velocity increases.
. A signi®cant radial segregation of the mean diameter is shown, a behavior which seems notto be observed or reported in earlier studies of ¯uidized beds.
A three-dimensional Computational Fluid Dynamics (CFD) model has been developed basedon earlier works at Telemark Technological R and D Centre (Tel-Tek). The model is based onan Eulerian description of the phases where the kinetic theory for granular ¯ow forms the basisfor the turbulence modeling in the solid phases. The model is generalized for one gas phaseand N number of solid phase to enable a realistic description of particle size distributions anda non-uniform diameter distribution in gas/solid systems. Each solid phase is characterized bya diameter, form factor, density and restitution coe�cient. The granular temperature andmomentum equations are solved for each phase.The circulating ¯uidized bed loop is simulated using a 2D Cartesian coordinate system. Two
solid phases are used to describe two distinct particle groups. The simulations are in a fairlygood agreement with the measurements. The core-annulus ¯ow is correctly computed and thesolid concentration seems to be relatively well predicted. However, the relative velocity betweenthe solid phases is somewhat overpredicted. This may be due to the underestimated turbulentkinetic energy in the lower part of the riser, since the particle±particle drag is proportional tothe square root of the granular temperature. In the upper part of the riser, the computedturbulence has a correct form and magnitude, although the turbulence in the shear layer issomewhat too low.For di�erent super®cial gas velocities, the mathematical model is capable of estimating the
axial segregation by size very well. But the model is not able to predict the signi®cant radialvariation of the mean diameter. The underestimation of the turbulence in the lower part maybe a reason for the discrepancy between measured and simulated mean diameter in the wallregion. The radial segregation may also be a result of external forces which are not included inthe mathematical model.The large scale ¯uctuations which occur in a gas/solid ¯ow system are calculated and added
to the small scale ¯uctuations obtained by the granular temperature. Although the large scale¯uctuations seemed signi®cant, they increased the total particle RMS velocity very little. Themodel correctly calculate the higher level of turbulence, for the largest particles.
Acknowledgements
The authors would like to express their thanks to Norsk Hydro, Statoil and The ResearchCouncil of Norway (NFR) for their ®nancial support of this work.
V. Mathiesen et al. / International Journal of Multiphase Flow 26 (2000) 387±419 417

References
Bachalo, W.D., Houser, M.J., 1984. Phase Doppler spray analyzer for simultaneous measurements of drop size and
velocity distributions. Opt. Engineering 25 (5), 583±590.Bagnold, R.A., 1954. Experiments on a gravity-free dispersion of large solid spheres in a Newtonian ¯uid under
shear. Proc. Roe. Soc A255, 49±63.
Boemer, A., 1996. Consistency of the granular multiphase model, private communication.Deardor�, J.W., 1971. On the magnitude of the subgrid scale eddy coe�cient. J. Comp. Phys 7, 120±133.
Ding, J., Gidaspow, D., 1990. Bubbling ¯uidization model using kinetic theory of granular ¯ow. AIChE J 36 (4),523±538.
Durst, F., Zare, M., 1975. Laser-Doppler measurements in two-phase ¯ows. In: Proceedings of the LDA-
Symposium, Copenhagen, pp. 403±429.Enwald, H., Peirano, E., Almstedt, A.-E., 1996. Eulerian two-phase ¯ow theory applied to ¯uidization. Int. J.
Multiphase Flow 22 Supplement, 21±66.
Ergun, S., 1952. Fluid ¯ow through packed columns. Chem. Eng. Prog 48, 89±94.Geldart, D., 1973. Types of gas ¯uidization. Powder Technology 7, 285±295.
Gidaspow, D., 1994. Multiphase Flow and Fluidization. Academic Press, Boston.Gidaspow, D., Huilin, L., Manger, E., 1996. Kinetic theory of multiphase ¯ow and ¯uidization: validation and
extension to binary mixtures. In: Nineteenth Int. Cong. of Theoretical and Appl. Mech., August, Kyoto, Japan,
pp. 25±31.Hjertager, B.H., 1997. Computational ¯uid dynamics (CFD) analysis of multiphase chemical reactors. Delft
University of Technology, 25±29 August. Also 1998, Trends in Chem. Eng. 4, 45±92.
Jenkins, J.T., Mancini, F., 1987. Balance laws and constitutive relations for plane ¯ows of a dense binary mixture ofsmooth, nearly elastic circular disks. J. Appl. Mech 54, 27±34.
Jenkins, J.T., Savage, S.B., 1983. A theory for the rapid ¯ow of identical, smooth, nearly elastic, spherical particles.
J. Fluid Mech 30, 187±202.Lahey, R.T., 1995. CFD modelling of phase distribution and separation phenomena: Part 17B. Multiphase Flow
and Heat Transfer, Computational Modelling. Swiss Federal Institute of Technology, March 20±24, Zurich,Switzerland.
Lebowitz, J.L., 1964. Exact solution of generalized Percus±Yevick equation for a mixture of hard spheres. The
Physical Review 133 (4A), 895±899.Lun, C.K.K., Savage, S.B., Je�rey, D.J., Chepurniy, N., 1984. Kinetic theories for granular ¯ow: inelastic particles
in couette ¯ow and slightly inelastic particles in a general ¯ow®eld. J. Fluid Mech 140, 223±256.
Manger, E., 1996. Modelling and simulation of gas/solid ¯ow in curvilinear coordinates. Ph.D. thesis, TelemarkInstitute of Technology, Norway.
Mathiesen, V., Solberg, T., Manger, E., Hjertager, 1996. Modelling and predictions of multiphase ¯ow in a pilots-
cale circulating ¯uidized bed. Proc. 5th Int. Conf. on Circulating Fluidized Beds, May 28±31, Beijing, China.Patankar, S.V., 1980. Numerical Heat Transfer and Fluid Flow. Hemisphere, Washington DC.
Rowe, P.N., 1961. Drag forces in a hydraulic model of a ¯uidized bed, Part II. Trans. Inst. Chem 39, 175±180.Sa�mann, M., Buchhave, P., Tanger, H., 1984. Simultaneous measurements of size concentration and velocity of
spherical particles by a laser doppler method. In: Adrian, R.J., Durano, D.F.G., Durst, F., Mishina, H.,
Whitelaw, J.H. (Eds.), Laser Anemometry in Fluid MechanicsÐPart II. Ladoan Instituoto Superior Tecnico,Lisboa, Portugal.
Samuelsberg, A., Hjertager, B.H., 1996a. An experimental and numerical study of ¯ow patterns in a circulating ¯ui-
dized bed reactor. Int. J. Multiphase Flow 22 (3), 575±591.Samuelsberg, A., Hjertager, B.H., 1996b. Computational modelling of gas particle ¯ow in a riser. AIChE J 42 (6),
1536±1546.
Sekoguchi, K., Takeishi, M., Kano, H., Hironaga, K., Nishiura, T., 1982. In: First Int. Symp. on Appl. of LaserAnemometry to Fluid Mech. Paper 16.1, Lisboa, Portugal.
Spalding, D.B., 1983. Developments in the IPSA procedure for numerical computation of multiphase-¯ow phenom-ena with interphase slip, unequal temperatures, etc. In: Numerical Properties and Methodologies in HeatTransfer. Hemisphere, Washington DC, pp. 421±476.
V. Mathiesen et al. / International Journal of Multiphase Flow 26 (2000) 387±419418

Spalding, D.B., 1985. Computer simulation of two-phase ¯ows with special reference to nuclear reactor systems. In:Lewis, R.W., Morgan, K., Johnson, J.A., Smith, W.R. (Eds.), Computational Techniques in Heat Transfer.
Pineridge, Swansea, p. 44.Wen, C.Y., Yu, Y.H., 1966. Mechanics of ¯uidization. Chem. Eng. Prog. Symp. Series 62, 100±111.Yakhot, Y., Orszag, S.A., 1986. Renormalization group analysis of turbulence. Part 1: basic theory. J. Scienti®c
Computing 1 (1), 3±51.Zamankhan, P., 1995. Kinetic theory of multicomponent dense mixtures of slightly inelastic spherical particles.
Phys. Rev. E 52 (5), 4877±4891.
V. Mathiesen et al. / International Journal of Multiphase Flow 26 (2000) 387±419 419