ASPEN plus modelling of air–steam gasification of biomass ...

Applied Energy 88 (2011) 5208–5220
Contents lists available at SciVerse ScienceDirect
Applied Energy
journal homepage: www.elsevier .com/ locate/apenergy
Performance evaluation for dual circulating fluidized-bed steam gasifierof biomass using quasi-equilibrium three-stage gasification model
Son Ich Ngo a, Thanh D.B. Nguyen a,e, Young-Il Lim a,⇑, Byung-Ho Song b, Uen-Do Lee c,Young-Tai Choi c, Jae-Hun Song d
a Lab. FACS, RCCT, Department of Chemical Engineering, Hankyong National University, Gyonggi-do, Anseong-si, Jungangno 167, 456-749, Republic of Koreab Department of Chemical Engineering, Kunsan National University, Gunsan, Jeonbuk 573-701, Republic of Koreac High Temperature Processing R&D Department, Korea Institute of Industrial Technology (KITECH), Cheonan 331-825, Republic of Koread R&D Center, SeenTec Co., Ltd., #608 Office Plazza, 7-2 Yongho-dong, Changwon, Gyeongnam 641-969, Republic of Koreae School of Chemical Engineering, Hanoi University of Science and Technology, No. 1 Dai Co Viet, Hanoi, Viet Nam
a r t i c l e i n f o
Article history:Received 21 April 2011Received in revised form 8 July 2011Accepted 27 July 2011Available online 20 August 2011
Keywords:Steam gasificationWoodchipsDual circulating fluidized-bed (DFB)Solid circulation ratioQuasi-equilibrium three-stage gasification(qETG) modelParametric study
0306-2619/$ - see front matter � 2011 Elsevier Ltd. Adoi:10.1016/j.apenergy.2011.07.046
⇑ Corresponding author. Tel.: +82 31 670 5207; faxE-mail address: [email protected] (Y.-I. Lim).
a b s t r a c t
The effects of gasification temperature (TG) and steam to fuel ratio (c) on product gas composition andyield were experimentally investigated for steam gasification of pine woodchips in a bench-scale circu-lating fluidized-bed (CFB) gasifier with external heat supplier. To evaluate process performance in a dualcirculating fluidized-bed (DFB) with heat carrier (silica sand), a quasi-equilibrium three-stage gasification(qETG) model was developed and validated with experimental data of biomass steam gasification. Themodel was divided into three stages including biomass pyrolysis, char–gas reactions, and gas-phase reac-tions. Carbonic and methane formation ratios were considered at the pyrolysis stage under the assump-tion of spontaneous decomposition. At the second and third stages, char–gas and gas-phase equilibriumreactions were corrected by two empirical equations concerning the steam participation ratio and thenon-equilibrium factor, respectively. Using the qETG model, parametric study on TG and c was performedto predict final gas composition, carbon conversion, char residue, gas yield, lower heating value, addi-tional fuel ratio, solid circulation ratio, heat recovery and H2 to CO molar ratio. Focusing on the solid cir-culation ratio and H2/CO molar ratio, several effective operating conditions were suggested from thecontour of performance criteria.
� 2011 Elsevier Ltd. All rights reserved.
1. Introduction
As we know, there are nine general sources of energy on theEarth: Solar, biomass, wind, wave, hydro, tidal, geothermal, nuclear,and fossil. Except for the last three, the remaining six are generallycalled renewable sources of energy, as they are not depleted withtime [1]. Biomass sources in the plant form store solar energy aschemical energy during their growth by photosynthesis. This stor-age of chemical energy can be released and converted to many otheruseful forms of energy such as heat, electricity, light, and automotivepower through some upgrading and conversion systems [2].
In recent years, much attention has been paid to the thermo-chemical conversion from biomass since: (1) the use of biomassfor energy has the potential to control the net emission of CO2 tothe atmosphere [2] and (2) it can reduce the dependence of fossilsources. Among the thermochemical conversion processes such asgasification, pyrolysis and combustion, gasification has been
ll rights reserved.
: +82 31 670 5445.
considered to be the most cost effective process since it converts bio-mass into clean combustible gaseous products [3].
Steam gasification has become an area of growing interest, sinceit produces a gaseous fuel with relatively higher hydrogen content,which could be used in fuel cells as a new recognizable technologyfor the future to produce power in a much cleaner manner. It alsohas other advantages in comparison with air or air–steam gasifica-tion such as, (1) producing a gas with higher heating value, (2) reduc-ing the dilution effect of nitrogen from air, and (3) eliminating theneed for an expensive oxygen plant when both air and oxygen areused as gasification reagents [4]. However, steam gasification is amore complex process, because the heat necessary to the processis not directly supplied by the partial combustion of the feedstockduring the gasification process [4].
Among several types of gasifiers such as fixed bed, down- and up-draft, and fluidized-bed, the fluidized-bed has been known as apromising alternative , thereby maximizing the gas product yielddue to the uniform temperature distribution and high mass and heattransfer rates [5]. The dual circulating fluidized-bed (DFB) systemhas many advantages that are capable of scaling up and
Nomenclatures
A empirical parameters (–)B empirical parameters (–)cp molar heat capacity (kJ/kmol/K)Cp heat capacity (kJ/kg/K)DG0
TGGibbs free energy change of reaction at 25 �C (kJ/kmol)
DG0f standard Gibbs energy of formation at 25 �C (kJ/kmol)
h molar enthalpy (kJ/kmol)Hbiomass sensible heat of biomass fed to gasifier (kJ/h)Hsens
char sensible heat of unreacted char leaving gasifier (kJ/h)Hdemand heat demand (kJ/h)Hg,in heat entering into gasifier (kJ/h)Hg,out heat leaving gasifier (kJ/h)Hloss heat loss through surrounding environment (kJ/h)Hcomb
product combustion heat of syngas (kJ/h)Hsens
product sensible heat of syngas leaving gasifier (kJ/h)Hsteam heat of steam fed to gasifier (kJ/h)DH0
f standard enthalpy of formation at 25 �C (kJ/kmol)K equilibrium constant (–)K� corrected equilibrium constant (–)Lwater latent heat of water (kJ/kg/h)LHVbiomass lower heating value of biomass (kJ/kg)LHVproduct lower heating value of producer gas (MJ/Nm3)LHVchar lower heating value of char (kJ/kg)Madd amount of additional fuel to combustor (kg/h)Mbiomass biomass feed rate (kg/h)MC amount of carbon in biomass (kg/h)MC,in amount of fixed carbon in biomass (kg/h)Mchar amount of the unreacted char (kg/h)MC,convert amount of carbon converted to producer gas (kg/h)MC,unreact amount of unreacted char (kg/h)Msand amount of recirculated sand (kg/h)n number of moles (kmol/h)
p empirical polynomial parameter (–)Vproduct volumetric flow rate of product gas (Nm3/h, dry basis)radd additional fuel ratio (kg/kg)rcir solid circulation ratio (kg/kg)R gas constant (kJ/kmol/K)Rt retention time (min)Tambient ambient temperature (K or �C)Tfeed temperature of biomass fed to gasifier (K or �C)TG gasification temperature (K or �C)Tpyrol pyrolysis temperature (K or �C)Triser riser temperature (K or �C)Tin
steam inlet temperature of steam (K or �C)Vyield gas yield (Nm3/kg biomass)x mass fraction (–)y mole fraction (–)z empirical variable (1/K)
Greek lettersc steam to fuel ratio (kg/kg)e reaction coordinate (kmol)j non-equilibrium factor (–)ge heat recovery (–)/ ratio of molar fractions(–)/C carbon conversion (–)/CR char residue (–)m stoichiometric number (–)a species involved reactionsv total stoichiometric number (–)
Subscriptsi species indexj reaction index
S.I. Ngo et al. / Applied Energy 88 (2011) 5208–5220 5209
development. However, it is also known as a complex system in con-struction and installation [6].
Numerous studies for biomass gasification by means of modelingand simulation include (1) thermodynamic equilibrium models [7–10], (2) kinetic rate models [1,11–13], and (3) neural network mod-els [14,15]. In the kinetic rate models, initial conditions and kineticparameters are not well known because of a variety of feedstock[11]. The neural network models as a kind of black-box models haveachieved high prediction accuracy. However, it is hard to obtainphysical meaning from these models, and the scale-up and adaptionabilities of the neural network models are restricted. The kineticmodels predict the progress of product composition with respectto the residence time in a gasifier, whereas the equilibrium modelsprovide the maximum yield of a desired product which is achievablefrom a gasification system [16]. Although kinetic rate models areconsidered as a rigorous approach, equilibrium models are valuablebecause they can predict thermodynamic limits which are used todesign, evaluate and improve the process [17]. The equilibriummodels have been used for preliminary study on the influence ofthe most important process parameters.
Several equilibrium models have been proposed for coal gasifica-tion [3,18], but these models cannot directly be applied to biomassdue to significant differences in chemical and physical properties be-tween coal and biomass. In biomass gasification, the pyrolysis step isone of the most important steps for gasification, since it strongly af-fects the final gas product composition [19–22]. The knowledge ofdevolatilization in the pyrolysis step is crucial for a precise predic-tion. Therefore, the more detailed the pyrolysis is taken into account,the better the prediction will be.
In this study, we investigate the biomass gasification with thesteam agent in a bench-scale circulating fluidized-bed (CFB) gasifierand develop a quasi-equilibrium three-stage gasification (qETG)model for the prediction of process performance in dual circulatingfluidized-bed (DFB). The qETG model is divided into three mainstages: (1) pyrolysis of volatiles in biomass, (2) solid–gas reactionsbetween biomass char and gasifying reagents (carbon dioxide orsteam) in the fluidized bed, and (3) gas-phase reactions among thegaseous species in the free board of the gasifier. At each stage, empir-ical models are established based on the experimental data to calcu-late the gaseous components. Especially, the deviation fromequilibrium reaction is taken into account in the third stage by anon-equilibrium factor. The model is first validated by the experi-ment data conducted in the bench-scale CFB gasifier with pinewoodchips, and the data taken from the literature [17,23]. Thenthe contour of performance criteria (i.e., the solid circulation ratio,the H2/CO molar ratio, the additional fuel ratio, and the heat recov-ery) is obtained from the parametric study of TG and c using the qETGmodel. Focusing on the solid circulation ratio and H2/CO molar ratiofor Fisher–Tropsch (FT) synthesis, several effective operating condi-tions were proposed for a 100 MW DFB biomass gasifier.
2. Experiment
Experiments were performed in a bench-scale CFB gasifier(0.15 m I.D. � 3.0 m height) operating at atmospheric pressure.The schematic diagram of the experimental set-up is shown inFig. 1. The gasification system consists of a CFB gasifier with

Fig. 1. Schematic diagram of experimental set-up for bench-scale CFB gasifier.
Table 1Proximate and ultimate analyses of pine woodchips used in this study.
Proximate analysis (wt.%, wet basis) Ultimate analysis (wt.%, dry basis)
H2O 6.4 C 50.8Volatile 75.9 H 5.4Fixed carbon 17.4 O 43.6Ash 0.3 N Not detected
S 6.2�10�3
Cl Not detected
Total 100.0 99.8
5210 S.I. Ngo et al. / Applied Energy 88 (2011) 5208–5220
electrical heaters, a screw feeder for continuous supply of the feed-stock, two cyclones, and an impinger box for collecting fly ash, a tartrap, and a gas analyzer. Pine woodchips of sizes under 10 mmwere used as a feedstock. The proximate and ultimate analysesof the woodchips are listed in Table 1. It is addressed that the bio-mass material contained large volatiles (76%) and low ash content(0.3%) in comparison with common coal materials [24,25], and alittle sulfur was detected from the ultimate analysis.
The screw feeder with a feed rate of about 5 kg/h continuouslysupplied the feedstock. The gasifier temperature was controlled byelectrical heaters, which could be heated up to 1300 �C. Steam wasused as a fluidized and gasifying agent. Superheated steam at400 �C was introduced to the gasifier to remove condensable compo-nents. The on-line gas analyzer (Model: AO2020, ND-IR analyzer,ABB Co. Ltd., Germany) monitored the composition of syngas. Gaschromatography (Model: 7890A, Agilent Technologies, USA) wasemployed for the quantitative analysis of sulfur compounds, wherehighly sensitive Flame Photometric Detector (FPD) was generating aflame with hydrogen and oxygen. The flow rates of hydrogen andoxygen were 100, and 60 ml/min, respectively. The inlet and detec-tor temperatures were 250 �C. The PLOT capillary column
(GC-gaspro, Agilent, I.D. = 0.32 mm, L = 5 m) was used since it is suit-able for light molecular weight hydrocarbon compounds or sulfurcompounds. For the identification of the sample gas, the area andretention time (Rt) was calibrated by standard gases of COS(49.6 ppm) and H2S (177.6 ppm) with N2 balanced. Helium was usedas a carrier gas, and the oven temperature was maintained at 50 �C.The COS was detected after 7.0 min and the H2S was detected after8.1 min.
Temperature was measured at the six locations of which the thirdone from the bottom (T3 in Fig. 1) was considered as the gasificationtemperature (TG). Steam was injected from the bottom of the gasifierand the steam to fuel ratio (c) was adjusted by the steam flow rate.The two operating conditions ranged 700 6 TG 6 900 �C and0.3 6 c 6 1.0 kg/kg.
At TG = 800 �C and c = 0.3 (kg/kg), Fig. 2a shows temperatureprofiles of the six measuring points with respect to the runningtime of biomass feeding. The temperatures slightly dropped downjust after feeding. The temperatures and the product gas composi-tion were stabilized after 5 min (see Fig. 2). The gasification tem-perature (TG) measured at T3 was controlled by manipulating theelectrical heater. The syngas composition measured after 30 minof the running time was used for the final one.
3. Quasi-equilibrium three-stage gasification (qETG) model andprocess performance evaluation
A quasi-equilibrium three-stage gasification (qETG) modelinvolving four empirical equations is developed to investigate theinfluence of two operating conditions, gasification temperature(TG) and steam to fuel ratio (c), on process performance of a100 MW (20 tons/h) DFB gasifier. The parameters of the fourempirical equations are estimated from experimental data pub-lished in the literature [18,23,26,27]. The empirical equations are

Tem
pera
ture
(o C
)
0
600
700
800
900
1000
T1T2T3T4T5T6
Time (min)0 5 10 15 20 25 30
Gas
com
posi
tion
(vo
l%, d
ry b
asis
)
0
10
20
30
40
50H 2
CO2
CH4
CO
(a)
(b)
Fig. 2. Experimental data in the bench-scale CFB performed at TG = 800 �C andc = 0.3 kg/kg: (a) temperature profile, and (b) syngas composition.
S.I. Ngo et al. / Applied Energy 88 (2011) 5208–5220 5211
used to calculate the gaseous components at each stage. Table 2shows main reactions and products in the three-stage gasification.Three char–gas reactions and a water–gas shift reaction are takeninto account in this model.
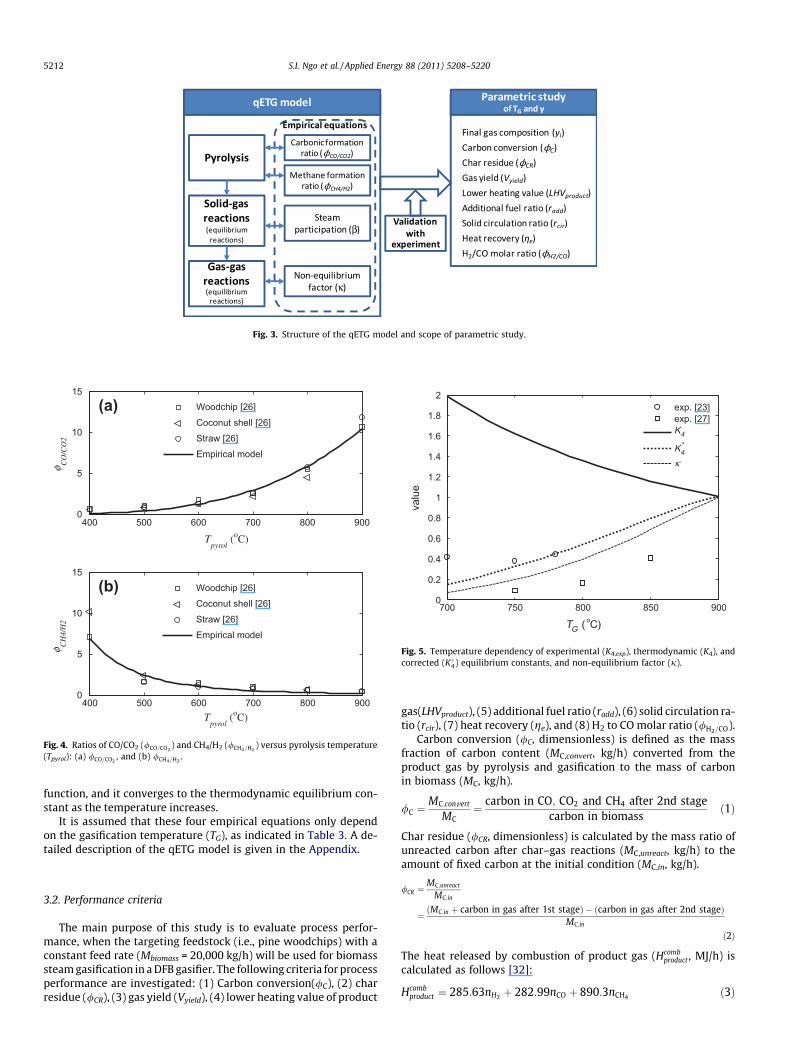
The qETG model is validated with experimental data obtainedfrom the bench-scale CFB as well as the other data from thesources. Parametric study on TG and c is performed to predict finalgas composition (yi), carbon conversion (/C), char residue (/CR),lower heating value (LHVproduct), heat recovery (e), gas yield (Vyield),additional fuel ratio (radd), and solid circulation ratio (rcir). Fig. 3summarizes the structure of qETG model and the scope of para-metric study.
3.1. Quasi-equilibrium three-stage gasification (qETG) model
The three stages of gasification are divided into biomass pyroly-sis, char–gas reactions, and gas-phase reactions. At the pyrolysisstage under the assumption that volatiles and tar in biomass are
Table 2Reactions and products assumed in the qETG model.
Stage Reactions Products
Pyrolysis First step: thermaldecomposition
CO, CO2, CH4, H2 and H2O
Second step: tar cracking CO, CO2, H2, heavier hydrocaC3H6), and inert tar.
Solid–gasreactions
C(s) + CO2(g) M 2CO(g) (Char unreacted) CO, CO2, H
C(s) + H2O(g) M CO(g) + H2(g)C(s) + 2H2O(g) M CO2(g) + 2H2(g)
Water–gas shiftreaction
CO(g) + H2O(g) M CO2(g) + H2(g) CO, CO2, H2, H2O
completely and spontaneously converted into five gaseous compo-nents (CO, CO2, CH4, H2, and H2O), the carbonic formation ratio(/CO=CO2
) and the methane formation ratio (/CH4=H2) determine gas
composition after pyrolysis by the elemental balance (see AppendixA.1).
The two empirical equations in the first stage (/CO=CO2and
/CH4=H2) were derived on the basis of experimental data [26] con-
ducted at a wide range of temperatures (400–900 �C), using threekinds of biomass (woodchip, coconut shell and straw). Fig. 4 illus-trates the dependency of the two ratios on pyrolysis temperature(Tpyrol). As shown in Fig. 2b, the temperatures are distributed insidethe gasifier. Since pyrolysis and decomposition of biomass dependon its pore size distribution, heating rate [28] and residence time, itis not easy to determine an appropriate Tpyrol in the range of700 6 TG 6 900 �C. Thus, Tpyrol was assumed to be the same as TG
in our study.Char–gas and gas-phase reactions are supposed to reach an
equilibrium state. At the second stage, the steam participation ratio(b) is used to determine the amount of steam involved in the char–gas reactions with respect to TG [3,18]. At the third stage, a non-equilibrium factor (j) is employed to account for the deviationfrom thermodynamic equilibrium of the water–gas shift reaction[23,27,29]. Due to b and j, the qETG model compensates for a devi-ation from equilibrium reaction according to the gasification tem-perature (see Appendices A.2 and A.3).
The steam reforming reaction (CH4 + H2O � CO + 3H2) is as-sumed not to take place in the third stage (see Table 2). This reac-tion is not favorable at temperatures over 800 �C, since the Gibbsfree energy of formation has a positive value [30]. Moreover, Du-pont et al. concluded from a modeling approach that the steamreforming of CH4 was kinetically limited [22] in those tempera-tures. Therefore, only one reaction for water–gas shift is consideredin this stage.
Fig. 5 shows the temperature dependency of the thermodynamicequilibrium constant (K4, see Appendix A.4), and the experimentalequilibrium constant (K4,exp = (yCO2
� yH2Þ=ðyCO � yH2O)) for the
water–gas shift reaction. The molar fraction ratios (K4,exp) betweenreactants and products obtained from experimental value of Weiet al. [27] and Herguido et al. [23] are far from the thermodynamicequilibrium constants (K4). The former [27] was measured in adown-draft gasifier and the latter [23] was in a fluidized bed whichis closer to K4 than the former. To compensate this discrepancy, thenon-equilibrium factor (j) has been used elsewhere [29,31]. Apply-ing the non-equilibrium factor (j) to K4, the modified equilibriumconstant (K�4 ¼ j� K4) follows the trends of experimental data.The non-equilibrium factor (j) may depend on feedstock, operatingconditions, and the type of gasifiers. In this study, j was determinedso that our experimental syngas compositions measured for CO, CO2,and H2 were predicted as best as possible by the qETG model. In Ta-ble 3, the fifth-order polynomial of j is suggested as the best fitting
Components assumed inqETG
Refs.
CO, CO2, CH4, H2 and H2O [19,20,45,48]
rbon (e. g., C2H6, C2H4, and
2, (H2O-residue) Char unreacted, CO, H2,H2O-residue
[3,18]
CO, CO2, H2, H2O [23,27,30,38,47]
β
κ
Fig. 3. Structure of the qETG model and scope of parametric study.
400 500 600 700 800 9000
5
10
15
(a)
φ CO
/CO
2
Woodchip [26]Coconut shell [26]Straw [26]Empirical model
400 500 600 700 800 9000
5
10
15
(b)
Tpyrol
(oC)
φ CH
4/H
2
Woodchip [26]Coconut shell [26]Straw [26]Empirical model
Tpyrol
(oC)
Fig. 4. Ratios of CO/CO2 (/CO=CO2) and CH4/H2 (/CH4=H2
) versus pyrolysis temperature(Tpyrol): (a) /CO=CO2
, and (b) /CH4=H2.
700 750 800 850 9000
0.2
0.4
0.6
0.8
1
1.2
1.4
1.6
1.8
2
TG ( oC)
valu
eexp. [23]exp. [27]K4
K4*
κ
Fig. 5. Temperature dependency of experimental (K4,exp), thermodynamic (K4), andcorrected (K�4) equilibrium constants, and non-equilibrium factor (j).
5212 S.I. Ngo et al. / Applied Energy 88 (2011) 5208–5220
function, and it converges to the thermodynamic equilibrium con-stant as the temperature increases.
It is assumed that these four empirical equations only dependon the gasification temperature (TG), as indicated in Table 3. A de-tailed description of the qETG model is given in the Appendix.
3.2. Performance criteria
The main purpose of this study is to evaluate process perfor-mance, when the targeting feedstock (i.e., pine woodchips) with aconstant feed rate (Mbiomass = 20,000 kg/h) will be used for biomasssteam gasification in a DFB gasifier. The following criteria for processperformance are investigated: (1) Carbon conversion(/C), (2) charresidue (/CR), (3) gas yield (Vyield), (4) lower heating value of product
gas(LHVproduct), (5) additional fuel ratio (radd), (6) solid circulation ra-tio (rcir), (7) heat recovery (ge), and (8) H2 to CO molar ratio (/H2=CO).
Carbon conversion (/C, dimensionless) is defined as the massfraction of carbon content (MC,convert, kg/h) converted from theproduct gas by pyrolysis and gasification to the mass of carbonin biomass (MC, kg/h).
/C ¼MC;convert
MC¼ carbon in CO; CO2 and CH4 after 2nd stage
carbon in biomassð1Þ
Char residue (/CR, dimensionless) is calculated by the mass ratio ofunreacted carbon after char–gas reactions (MC,unreact, kg/h) to theamount of fixed carbon at the initial condition (MC,in, kg/h).
/CR ¼MC;unreact
MC;in
¼ ðMC;in þ carbon in gas after 1st stageÞ � ðcarbon in gas after 2nd stageÞMC;in
ð2Þ
The heat released by combustion of product gas (Hcombproduct , MJ/h) is
calculated as follows [32]:
Hcombproduct ¼ 285:63nH2 þ 282:99nCO þ 890:3nCH4 ð3Þ
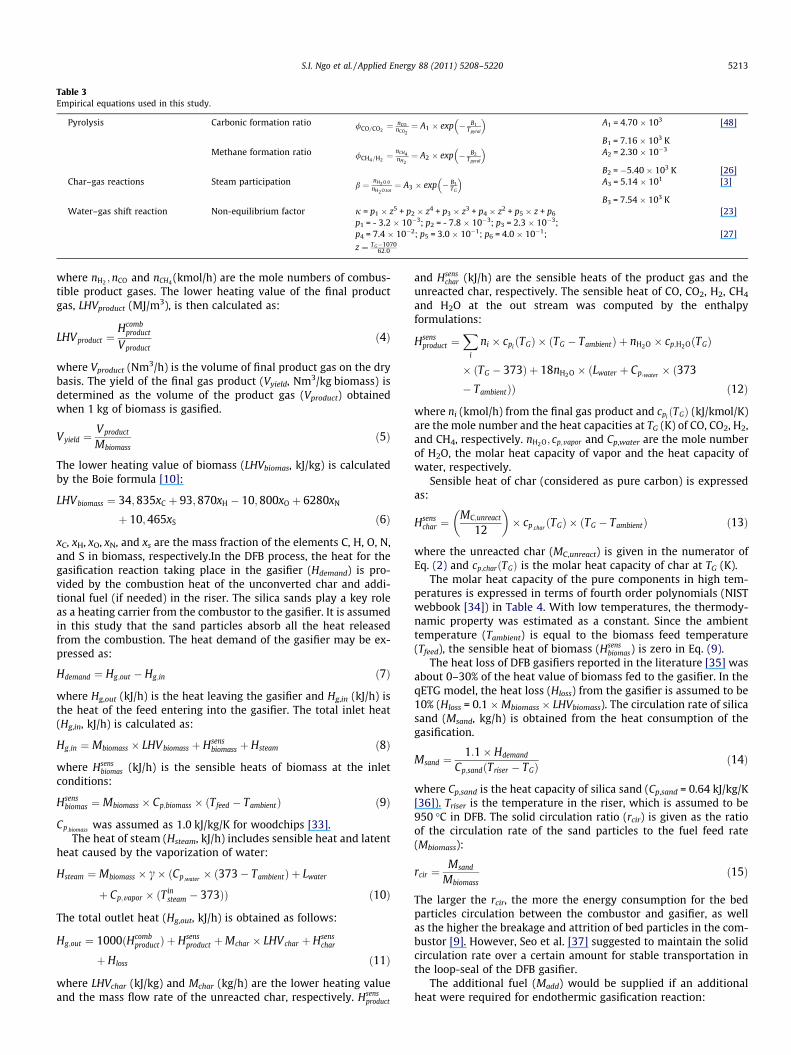
Table 3Empirical equations used in this study.
Pyrolysis Carbonic formation ratio /CO=CO2¼ nCO
nCO2¼ A1 � exp � B1
Tpyrol
� �A1 = 4.70 � 103 [48]
B1 = 7.16 � 103 KMethane formation ratio /CH4=H2
¼ nCH4nH2¼ A2 � exp � B2
Tpyrol
� �A2 = 2.30 � 10�3
B2 = �5.40 � 103 K [26]Char–gas reactions Steam participation b ¼ nH2 O;0
nH2 O;tot¼ A3 � exp � B3
TG
� �A3 = 5.14 � 101 [3]
B3 = 7.54 � 103 KWater–gas shift reaction Non-equilibrium factor j = p1 � z5 + p2 � z4 + p3 � z3 + p4 � z2 + p5 � z + p6 [23]
p1 = - 3.2 � 10�3; p2 = - 7.8 � 10�3; p3 = 2.3 � 10�3;p4 = 7.4 � 10�2; p5 = 3.0 � 10�1; p6 = 4.0 � 10�1; [27]
z ¼ TG�107062:0
S.I. Ngo et al. / Applied Energy 88 (2011) 5208–5220 5213
where nH2 ;nCO and nCH4 (kmol/h) are the mole numbers of combus-tible product gases. The lower heating value of the final productgas, LHVproduct (MJ/m3), is then calculated as:
LHVproduct ¼Hcomb
product
Vproductð4Þ
where Vproduct (Nm3/h) is the volume of final product gas on the drybasis. The yield of the final gas product (Vyield, Nm3/kg biomass) isdetermined as the volume of the product gas (Vproduct) obtainedwhen 1 kg of biomass is gasified.
Vyield ¼Vproduct
Mbiomassð5Þ
The lower heating value of biomass (LHVbiomas, kJ/kg) is calculatedby the Boie formula [10]:
LHVbiomass ¼ 34;835xC þ 93;870xH � 10;800xO þ 6280xN
þ 10;465xS ð6Þ
xC, xH, xO, xN, and xs are the mass fraction of the elements C, H, O, N,and S in biomass, respectively.In the DFB process, the heat for thegasification reaction taking place in the gasifier (Hdemand) is pro-vided by the combustion heat of the unconverted char and addi-tional fuel (if needed) in the riser. The silica sands play a key roleas a heating carrier from the combustor to the gasifier. It is assumedin this study that the sand particles absorb all the heat releasedfrom the combustion. The heat demand of the gasifier may be ex-pressed as:
Hdemand ¼ Hg;out � Hg;in ð7Þ
where Hg,out (kJ/h) is the heat leaving the gasifier and Hg,in (kJ/h) isthe heat of the feed entering into the gasifier. The total inlet heat(Hg,in, kJ/h) is calculated as:
Hg;in ¼ Mbiomass � LHVbiomass þ Hsensbiomass þ Hsteam ð8Þ
where Hsensbiomas (kJ/h) is the sensible heats of biomass at the inlet
conditions:
Hsensbiomas ¼ Mbiomass � Cp;biomass � ðTfeed � TambientÞ ð9Þ
Cp;biomasswas assumed as 1.0 kJ/kg/K for woodchips [33].
The heat of steam (Hsteam, kJ/h) includes sensible heat and latentheat caused by the vaporization of water:
Hsteam ¼ Mbiomass � c� ðCp;water� ð373� TambientÞ þ Lwater
þ Cp;vapor � ðTinsteam � 373ÞÞ ð10Þ
The total outlet heat (Hg,out, kJ/h) is obtained as follows:
Hg;out ¼ 1000ðHcombproductÞ þ Hsens
product þMchar � LHVchar þ Hsenschar
þ Hloss ð11Þ
where LHVchar (kJ/kg) and Mchar (kg/h) are the lower heating valueand the mass flow rate of the unreacted char, respectively. Hsens
product
and Hsenschar (kJ/h) are the sensible heats of the product gas and the
unreacted char, respectively. The sensible heat of CO, CO2, H2, CH4
and H2O at the out stream was computed by the enthalpyformulations:
Hsensproduct ¼
Xi
ni � cpiðTGÞ � ðTG � TambientÞ þ nH2O � cp;H2OðTGÞ
� ðTG � 373Þ þ 18nH2O � ðLwater þ Cp;water � ð373
� TambientÞÞ ð12Þ
where ni (kmol/h) from the final gas product and cpiðTGÞ (kJ/kmol/K)
are the mole number and the heat capacities at TG (K) of CO, CO2, H2,and CH4, respectively. nH2O; cp;vapor and Cp,water are the mole numberof H2O, the molar heat capacity of vapor and the heat capacity ofwater, respectively.
Sensible heat of char (considered as pure carbon) is expressedas:
Hsenschar ¼
MC;unreact
12
� �� cp;char
ðTGÞ � ðTG � TambientÞ ð13Þ
where the unreacted char (MC,unreact) is given in the numerator ofEq. (2) and cp;charðTGÞ is the molar heat capacity of char at TG (K).
The molar heat capacity of the pure components in high tem-peratures is expressed in terms of fourth order polynomials (NISTwebbook [34]) in Table 4. With low temperatures, the thermody-namic property was estimated as a constant. Since the ambienttemperature (Tambient) is equal to the biomass feed temperature(Tfeed), the sensible heat of biomass (Hsens
biomas) is zero in Eq. (9).The heat loss of DFB gasifiers reported in the literature [35] was
about 0–30% of the heat value of biomass fed to the gasifier. In theqETG model, the heat loss (Hloss) from the gasifier is assumed to be10% (Hloss = 0.1 �Mbiomass � LHVbiomass). The circulation rate of silicasand (Msand, kg/h) is obtained from the heat consumption of thegasification.
Msand ¼1:1� Hdemand
Cp;sandðTriser � TGÞð14Þ
where Cp,sand is the heat capacity of silica sand (Cp,sand = 0.64 kJ/kg/K[36]). Triser is the temperature in the riser, which is assumed to be950 �C in DFB. The solid circulation ratio (rcir) is given as the ratioof the circulation rate of the sand particles to the fuel feed rate(Mbiomass):
rcir ¼Msand
Mbiomassð15Þ
The larger the rcir, the more the energy consumption for the bedparticles circulation between the combustor and gasifier, as wellas the higher the breakage and attrition of bed particles in the com-bustor [9]. However, Seo et al. [37] suggested to maintain the solidcirculation rate over a certain amount for stable transportation inthe loop-seal of the DFB gasifier.
The additional fuel (Madd) would be supplied if an additionalheat were required for endothermic gasification reaction:

Table 4Operating conditions and thermodynamic properties for pure components used in heat balance.
Operating conditions Constants
Tambient 298 K (25 �C) Lwater 2260 (kJ/kg/h)
Tinsteam
673 K (400 �C) Cp;water4.1813 (kJ/kg/K)
Tfeed 298 K (25 �C) Cp;vapor2.080 (kJ/kg/K)
TG 973–1173 K (700–900 �C)
Fourth order polynomial equations of molar heat capacity (kJ/kmol/K)cp,CO 29:7� 6:50� 10�3 � TG þ 1:83� 10�5 � T2
G � 9:39� 10�9 � T3G þ 1:08� 10�12 � T4
G
cp;CO2 29:3� 2:24� 10�2 � TG þ 2:65� 10�4 � T2G � 4:15� 10�7 � T3
G þ 2:01� 10�10 � T4G
cp;H2 27:0þ 1:19� 10�2 � TG � 2:41� 10�5 � T2G þ 2:15� 10�8 � T3
G � 6:15� 10�12 � T4G
cp;CH4 36:2� 5:11� 10�2 � TG þ 2:21� 10�4 � T2G � 1:82� 10�7 � T3
G þ 4:90� 10�11 � T4G
cp;H2O 33:8� 5:95� 10�3 � TG þ 2:24� 10�5 � T2G � 9:96� 10�9 � T3
G þ 1:10� 10�12 � T4G
cp,char 27:0þ 4:58� 10�4 � TG � 4:53�103
TG� 2:18�106
T2Gþ 8:00�108
T3G� 7:21�1010
T4G
700 750 800 850 9005
10
15
20
25
30
35
40
45
50
final
gas
com
posi
tion
(%vo
l)
CO-Model valueH2 -Model valueCO2-Model valueCH4-Model value
CO-Exp.valueH2 -Exp.valueCO2-Exp.valueCH4-Exp.value
TG ( oC)
Fig. 6. Effect of gasification temperature (TG) on final gas composition obtainedfrom qETG model in comparison with experiment data at c = 0.3 (kg/kg).
5214 S.I. Ngo et al. / Applied Energy 88 (2011) 5208–5220
Madd ¼Hdemand � 1:12� Hsens
char �Mchar � LHVchar
LHVbiomassð16Þ
where the heat loss due to the transportation of sand particles fromthe riser to the gasifier is supposed to be 12% of Hdemand. The addi-tional fuel ratio (radd, dimensionless) is defined as the mass ratio ofthe additional fuel (Madd) to the feed rate (Mbiomass):
radd ¼Madd
Mbiomassð17Þ
The heat recovery (ge, dimensionless) is expressed as the ratio of theheat of the product gas (LHVproduct) to that of the total biomass fed tothe system:
ge ¼Vyield � LHVproduct
ð1þ raddÞ � LHVbiomassð18Þ
Note that the units of LHVproduct and LHVbiomas are different and Vyield
multiplied in Eq. (18) makes ge dimensionless.
4. Results and discussion
In this section, the proposed model (qETG model) is validatedwith the experimental data measured in the bench-scale CFB gas-ifier as well as the data taken from the published works [17,23].The effects of the gasification temperature (TG) and the steam tofuel ratio (c) on the DFB gasifier performances are examined bymeans of their parametric study. Effective operating conditionsare proposed for the production of syngas suitable for Fisher–Trop-sch (FT) synthesis.
4.1. Model verification
In Fig. 6, three experiment sets operated at c = 0.3 kg/kg andTG = 700, 800, and 900 �C are compared to the qETG model results.The H2 and CO2 concentrations increase with the rise in tempera-ture, while the concentrations of CH4 and CO show an oppositetrend. Since the water–gas shift reaction (CO + H2O M CO2 + H2)proceeds forward at the temperatures above 700 �C in the presenceof steam [4,38], the increase in H2 and the decrease in CO are ex-pected from the reaction when TG increases. However, for a highertemperature range, the water–gas shift reaction has been thoughtto be less important and the Boudouard reaction (C + CO2 M 2CO)and the primary and secondary water gas reactions (C + H2O M -CO + H2, and C + 2H2O M CO2 + 2H2) have a more prevailing role[4]. The CO2 formed by the secondary water gas reaction could beconsumed by the Boudouard reaction, which could explain a slightincrease observed in CO2 concentration when the gasification tem-perature rises. The concentration of CH4 produced mainly in thepyrolysis stage decreases with TG (see Fig. 4). The model results of
the final gas composition show a similar tendency to the experimen-tal data, as seen in Fig. 6.
Table 5 gives the comparison of H2/CO molar ratio (/H2=CO), gasyield (Vyield), and lower heating value (LHVproduct) between the exper-iment and the qETG model at c = 0.3 kg/kg. /H2=CO increases with theincrease of temperature, as expected in Fig. 6. The error of /H2=CO be-tween the experiment and the model increases with temperaturebut is limited to 10%. It is experimentally observed that Vyield in-creases with an increase of TG from 700 �C to 800 �C, since the endo-thermic reactions of tar cracking and char gasification (char–CO2
and char–steam) proceed forward when TG increases [27]. HoweverVyield at TG = 900 �C is slightly less than that obtained at TG = 800 �C. Itmight be attributed to the tar formation at elevated temperatures[39]. Furthermore, the gasification with pure steam has been knownto produce a large content of tar (30–80 g/m3), compared to the gas-ification with steam–O2 mixture and air agents (4–30 and 2–20 g/m3, respectively) [40]. In the qETG model where tar formation isnot considered, the syngas yield increases with temperature. The er-ror of Vyield is relatively big at 700 �C where the gasification reactionsare far from equilibrium [23,27,29]. The lower heating value(LHVproduct, MJ/Nm3) decreases a little with the increase of tempera-ture because the volume of product gas (Vproduct, Nm3/h) increases
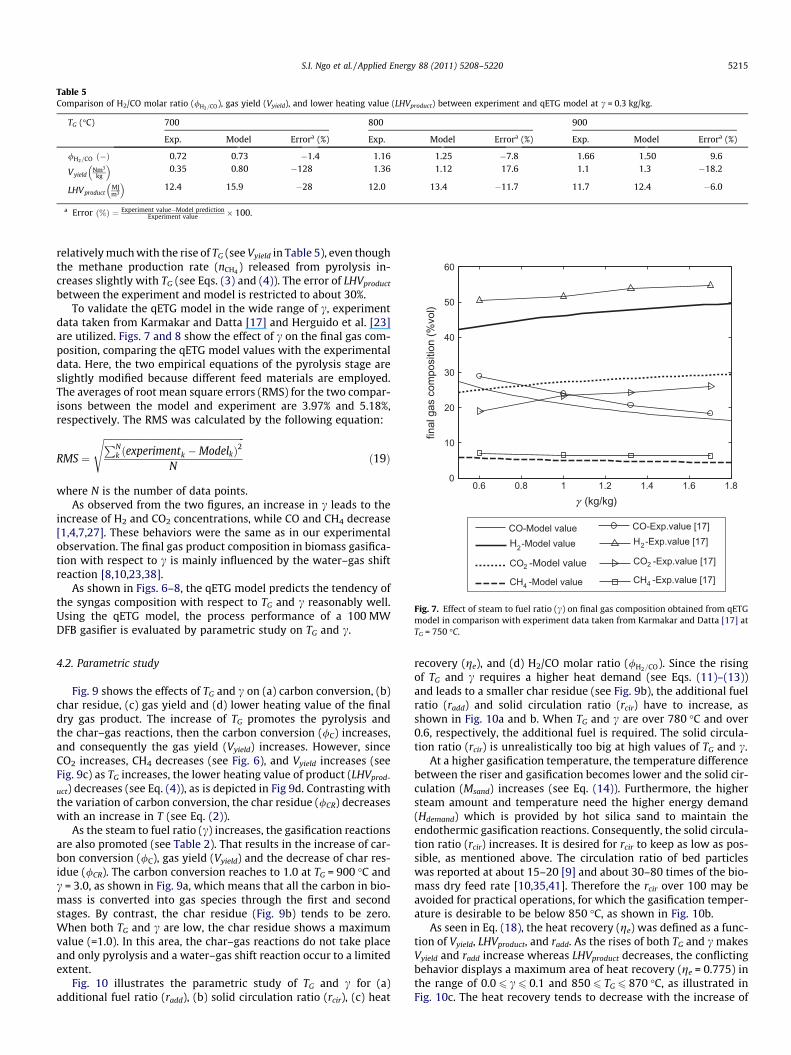
Table 5Comparison of H2/CO molar ratio (/H2=CO), gas yield (Vyield), and lower heating value (LHVproduct) between experiment and qETG model at c = 0.3 kg/kg.
TG (�C) 700 800 900
Exp. Model Errora (%) Exp. Model Errora (%) Exp. Model Errora (%)
/H2=CO ð�Þ 0.72 0.73 �1.4 1.16 1.25 �7.8 1.66 1.50 9.6
VyieldNm3
kg
� �0.35 0.80 �128 1.36 1.12 17.6 1.1 1.3 �18.2
LHVproductMJm3
� �12.4 15.9 �28 12.0 13.4 �11.7 11.7 12.4 �6.0
a Error ð%Þ ¼ Experiment value�Model predictionExperiment value � 100.
0.6 0.8 1 1.2 1.4 1.6 1.80
10
20
30
40
50
60
final
gas
com
posi
tion
(%vo
l)
CO-Model valueH2-Model value
CO2 -Model value
CH4 -Model value
CO-Exp.value [17]H2-Exp.value [17]
CO2 -Exp.value [17]
CH4 -Exp.value [17]
γ (kg/kg)
Fig. 7. Effect of steam to fuel ratio (c) on final gas composition obtained from qETGmodel in comparison with experiment data taken from Karmakar and Datta [17] atTG = 750 �C.
S.I. Ngo et al. / Applied Energy 88 (2011) 5208–5220 5215
relatively much with the rise of TG (see Vyield in Table 5), even thoughthe methane production rate (nCH4 ) released from pyrolysis in-creases slightly with TG (see Eqs. (3) and (4)). The error of LHVproduct
between the experiment and model is restricted to about 30%.To validate the qETG model in the wide range of c, experiment
data taken from Karmakar and Datta [17] and Herguido et al. [23]are utilized. Figs. 7 and 8 show the effect of c on the final gas com-position, comparing the qETG model values with the experimentaldata. Here, the two empirical equations of the pyrolysis stage areslightly modified because different feed materials are employed.The averages of root mean square errors (RMS) for the two compar-isons between the model and experiment are 3.97% and 5.18%,respectively. The RMS was calculated by the following equation:
RMS ¼
ffiffiffiffiffiffiffiffiffiffiffiffiffiffiffiffiffiffiffiffiffiffiffiffiffiffiffiffiffiffiffiffiffiffiffiffiffiffiffiffiffiffiffiffiffiffiffiffiffiffiffiffiffiffiffiffiffiffiffiffiffiPNk ðexperimentk �ModelkÞ2
N
sð19Þ
where N is the number of data points.As observed from the two figures, an increase in c leads to the
increase of H2 and CO2 concentrations, while CO and CH4 decrease[1,4,7,27]. These behaviors were the same as in our experimentalobservation. The final gas product composition in biomass gasifica-tion with respect to c is mainly influenced by the water–gas shiftreaction [8,10,23,38].
As shown in Figs. 6–8, the qETG model predicts the tendency ofthe syngas composition with respect to TG and c reasonably well.Using the qETG model, the process performance of a 100 MWDFB gasifier is evaluated by parametric study on TG and c.
4.2. Parametric study
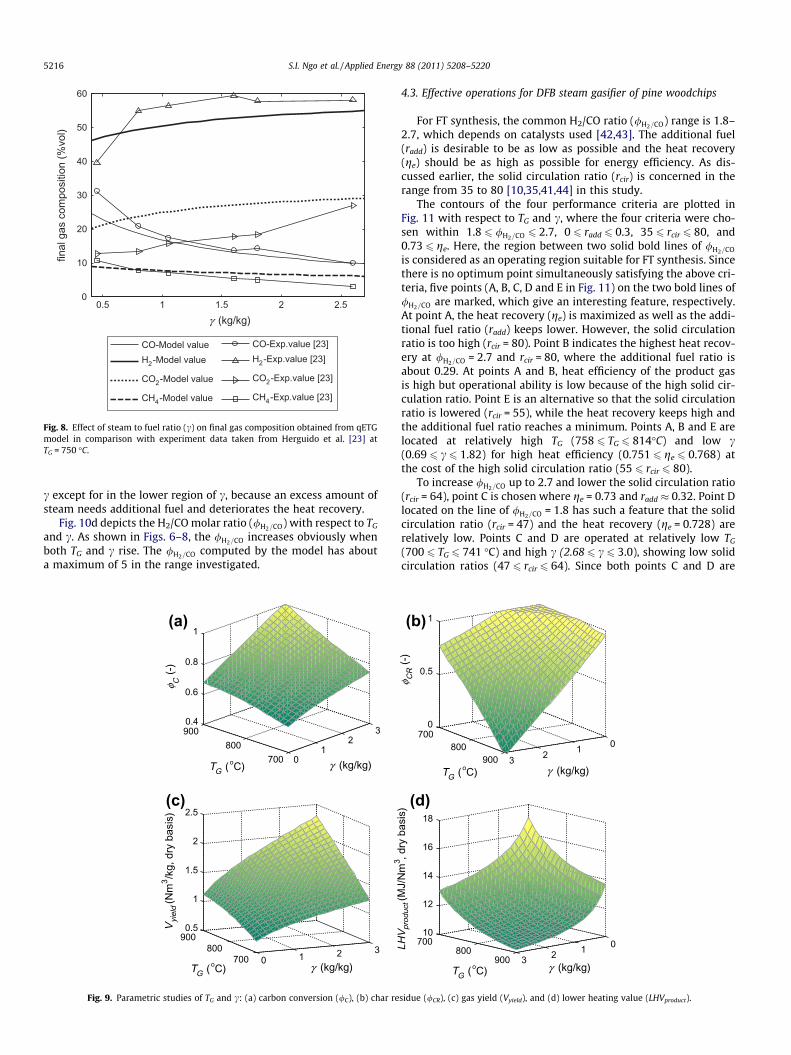
Fig. 9 shows the effects of TG and c on (a) carbon conversion, (b)char residue, (c) gas yield and (d) lower heating value of the finaldry gas product. The increase of TG promotes the pyrolysis andthe char–gas reactions, then the carbon conversion (/C) increases,and consequently the gas yield (Vyield) increases. However, sinceCO2 increases, CH4 decreases (see Fig. 6), and Vyield increases (seeFig. 9c) as TG increases, the lower heating value of product (LHVprod-
uct) decreases (see Eq. (4)), as is depicted in Fig 9d. Contrasting withthe variation of carbon conversion, the char residue (/CR) decreaseswith an increase in T (see Eq. (2)).
As the steam to fuel ratio (c) increases, the gasification reactionsare also promoted (see Table 2). That results in the increase of car-bon conversion (/C), gas yield (Vyield) and the decrease of char res-idue (/CR). The carbon conversion reaches to 1.0 at TG = 900 �C andc = 3.0, as shown in Fig. 9a, which means that all the carbon in bio-mass is converted into gas species through the first and secondstages. By contrast, the char residue (Fig. 9b) tends to be zero.When both TG and c are low, the char residue shows a maximumvalue (=1.0). In this area, the char–gas reactions do not take placeand only pyrolysis and a water–gas shift reaction occur to a limitedextent.
Fig. 10 illustrates the parametric study of TG and c for (a)additional fuel ratio (radd), (b) solid circulation ratio (rcir), (c) heat
recovery (ge), and (d) H2/CO molar ratio (/H2=CO). Since the risingof TG and c requires a higher heat demand (see Eqs. (11)–(13))and leads to a smaller char residue (see Fig. 9b), the additional fuelratio (radd) and solid circulation ratio (rcir) have to increase, asshown in Fig. 10a and b. When TG and c are over 780 �C and over0.6, respectively, the additional fuel is required. The solid circula-tion ratio (rcir) is unrealistically too big at high values of TG and c.
At a higher gasification temperature, the temperature differencebetween the riser and gasification becomes lower and the solid cir-culation (Msand) increases (see Eq. (14)). Furthermore, the highersteam amount and temperature need the higher energy demand(Hdemand) which is provided by hot silica sand to maintain theendothermic gasification reactions. Consequently, the solid circula-tion ratio (rcir) increases. It is desired for rcir to keep as low as pos-sible, as mentioned above. The circulation ratio of bed particleswas reported at about 15–20 [9] and about 30–80 times of the bio-mass dry feed rate [10,35,41]. Therefore the rcir over 100 may beavoided for practical operations, for which the gasification temper-ature is desirable to be below 850 �C, as shown in Fig. 10b.
As seen in Eq. (18), the heat recovery (ge) was defined as a func-tion of Vyield, LHVproduct, and radd. As the rises of both TG and c makesVyield and radd increase whereas LHVproduct decreases, the conflictingbehavior displays a maximum area of heat recovery (ge = 0.775) inthe range of 0.0 6 c 6 0.1 and 850 6 TG 6 870 �C, as illustrated inFig. 10c. The heat recovery tends to decrease with the increase of
0.5 1 1.5 2 2.50
10
20
30
40
50
60
γ (kg/kg)
final
gas
com
posi
tion
(%vo
l)
CO-Model valueH2-Model value
CO2-Model value
CH4-Model value
CO-Exp.value [23]H2-Exp.value [23]
CO2-Exp.value [23]
CH4-Exp.value [23]
Fig. 8. Effect of steam to fuel ratio (c) on final gas composition obtained from qETGmodel in comparison with experiment data taken from Herguido et al. [23] atTG = 750 �C.
5216 S.I. Ngo et al. / Applied Energy 88 (2011) 5208–5220
c except for in the lower region of c, because an excess amount ofsteam needs additional fuel and deteriorates the heat recovery.
Fig. 10d depicts the H2/CO molar ratio (/H2=CO) with respect to TG
and c. As shown in Figs. 6–8, the /H2=CO increases obviously whenboth TG and c rise. The /H2=CO computed by the model has abouta maximum of 5 in the range investigated.
01
23
700800
9000.4
0.6
0.8
1
γ (kg/kg)
(a)
TG (oC)
φ C (-
)
0 1 2 3700
8009000.5
1
1.5
2
2.5(c)
Vyi
eld (
Nm
3 /kg,
dry
bas
is)
γ (kg/kg)TG (oC)
Fig. 9. Parametric studies of TG and c: (a) carbon conversion (/C), (b) char re
4.3. Effective operations for DFB steam gasifier of pine woodchips
For FT synthesis, the common H2/CO ratio (/H2=CO) range is 1.8–2.7, which depends on catalysts used [42,43]. The additional fuel(radd) is desirable to be as low as possible and the heat recovery(ge) should be as high as possible for energy efficiency. As dis-cussed earlier, the solid circulation ratio (rcir) is concerned in therange from 35 to 80 [10,35,41,44] in this study.
The contours of the four performance criteria are plotted inFig. 11 with respect to TG and c, where the four criteria were cho-sen within 1.8 6 /H2=CO 6 2.7, 0 6 radd 6 0.3, 35 6 rcir 6 80, and0.73 6 ge. Here, the region between two solid bold lines of /H2=CO
is considered as an operating region suitable for FT synthesis. Sincethere is no optimum point simultaneously satisfying the above cri-teria, five points (A, B, C, D and E in Fig. 11) on the two bold lines of/H2=CO are marked, which give an interesting feature, respectively.At point A, the heat recovery (ge) is maximized as well as the addi-tional fuel ratio (radd) keeps lower. However, the solid circulationratio is too high (rcir = 80). Point B indicates the highest heat recov-ery at /H2=CO = 2.7 and rcir = 80, where the additional fuel ratio isabout 0.29. At points A and B, heat efficiency of the product gasis high but operational ability is low because of the high solid cir-culation ratio. Point E is an alternative so that the solid circulationratio is lowered (rcir = 55), while the heat recovery keeps high andthe additional fuel ratio reaches a minimum. Points A, B and E arelocated at relatively high TG (758 6 TG 6 814�C) and low c(0.69 6 c 6 1.82) for high heat efficiency (0.751 6 ge 6 0.768) atthe cost of the high solid circulation ratio (55 6 rcir 6 80).
To increase /H2=CO up to 2.7 and lower the solid circulation ratio(rcir = 64), point C is chosen where ge = 0.73 and radd � 0.32. Point Dlocated on the line of /H2=CO = 1.8 has such a feature that the solidcirculation ratio (rcir = 47) and the heat recovery (ge = 0.728) arerelatively low. Points C and D are operated at relatively low TG
(700 6 TG 6 741 �C) and high c (2.68 6 c 6 3.0), showing low solidcirculation ratios (47 6 rcir 6 64). Since both points C and D are
0123
700800
900
0
0.5
1(b)
φ CR
(-)
0123
700800
900
10
12
14
16
18
(d)
LHV p
rodu
ct (M
J/N
m3 , d
ry b
asis
)
γ (kg/kg)TG (oC)
γ (kg/kg)TG (oC)
sidue (/CR), (c) gas yield (Vyield), and (d) lower heating value (LHVproduct).

01
23
700800
9000
0.2
0.4
0.6
0.8(a)
TG ( oC)
r add
(kg/
kg)
01
23
700800
9000
200
400(b)
r cir (k
g/kg
)0 1 2 3 700
800900
0.65
0.7
0.75
0.8(c)
γ (kg/kg)
η e(-)
01
23
700
800
9000
2
4
6(d)
φ H2/
CO
(-)
TG ( oC) TG ( oC)
TG ( oC)
γ (kg/kg)
γ (kg/kg)γ (kg/kg)
Fig. 10. Parametric studies of TG and c: (a) additional fuel ratio (radd), (b) solid circulation to fuel ratio (rcir), (c) heat recovery (ge), and (d) H2/CO molar ratio (/H2=CO).
Fig. 11. Contours of process performance criteria for a 100 MW DFB gasifier calculated by the qETG model with respect to TG and c.
S.I. Ngo et al. / Applied Energy 88 (2011) 5208–5220 5217
situated at the border of the operating conditions, the two pointsare dependent on the operating boundary of TG and c.
Process performance for the 100 MW DFB gasifier is evaluatedat the five interesting points in Table 6. Since each point has a par-ticular value for the eight performance criteria, one can choose an
operating condition suitable for a purpose of the producer gas.However, it is worth noting that the process performance evalua-tion is valid only if the parameters of the empirical equations usedin the qETG model are well estimated for a given feedstock andgasifier.

Table 6Performance evaluation for steam gasification of pine woodchips in a 100 MW DFB gasifier at five interesting points of Fig. 11.
Points TG (�C) c (kg/kg) /C /CR Vyield (Nm3/kg) LHVproduct (MJ/Nm3) radd rcir ge /H2=CO
A 814 0.69 0.73 0.78 1.29 12.68 0.173 80 0.768 1.8B 791 1.82 0.80 0.59 1.50 11.88 0.308 80 0.751 2.7C 741 3.0 0.81 0.56 1.47 12.14 0.349 64 0.730 2.7D 700 2.68 0.74 0.75 1.10 13.39 0.219 47 0.728 1.8E 758 1.12 0.73 0.80 1.22 13.02 0.159 55 0.763 1.8
5218 S.I. Ngo et al. / Applied Energy 88 (2011) 5208–5220
5. Conclusions
In the experimental work, the pine woodchips of particle sizesof under 10 mm were used in a CFB (circulating fluidized-bed)steam gasifier as a feedstock. The result showed the final gas com-positions about 26–42% of H2, 25–37% of CO, 16–19% of CO2 and 8–11% of CH4, when the steam to fuel ratio (c) was 0.3 kg/kg and thegasification temperature (TG) was from 700 �C to 900 �C.
The quasi-equilibrium three-stage gasification (qETG) modelwas proposed to investigate the effects of TG and c on DFB (dual cir-culating fluidized-bed) process performances such as (1) Carbonconversion (/C), (2) char residue (/CR), (3) gas yield (Vyield), (4) low-er heating value (LHVproduct), (5) additional fuel ratio (radd), (6) solidcirculation ratio (rcir), (7) heat recovery (ge), and (8) H2 to CO molarratio (/H2=CO). The qETG model includes three stages: biomasspyrolysis, char–gas reaction, and gas phase reaction, where empir-ical equations are involved to take into account the deviation fromtheoretical equilibrium reactions. Final gas compositions predictedby the model had a reasonable agreement with our experimentaldata and previous studies from the literature. The prediction accu-racy of the qETG model would be enhanced, if tar formation andcracking in the pyrolysis stage are considered.
By parametric study, the eight process performances were eval-uated for a 100 MW DFB gasifier with respect to TG and c. As bothTG and c increase, the carbon conversion, the product gas yield,additional fuel ratio, solid circulation ratio, and H2 to CO molar ra-tio increase, while the lower heating value of product gas de-creases. The heat recovery shows a maximum point because of aconflicting behavior among the product gas yield, the additionalfuel ratio, and the lower heating value of product gas.
Considering the syngas production suitable for FT synthesis, thecontour of the four performance criteria (/H2=CO, radd, ge, and rcir)was plotted as a function of TG and c. Since there was no generaloptimum point simultaneously satisfying the criteria, five operat-ing conditions showing an interesting feature were suggested. Inthe region of high TG (758 6 TG 6 814 �C) and low c(0.69 6 c 6 1.82), high heat efficiency is found but the solid circu-lation ratio is too high. The low heat efficiency and low solid circu-lation ratio are observed in low TG (700 6 TG 6 741 �C) and high c(2.68 6 c 6 3). The contour of performance criteria provides aguideline for the selection of effective operating conditions.
Acknowledgement
This work is supported by Bilateral International CollaborativeR&D program under the Ministry of Knowledge Economy, Korea.
Appendix A
A.1. Pyrolysis
The non-oxidative decomposition of biomass called pyrolysismay be divided into two main steps: (1) primary and (2) secondarypyrolysis. In the first step, biomass thermally decomposes intogases, tar, and char. The gases released from the primary pyrolysis
consist of CO, CO2, CH4, H2, and H2O. In the secondary pyrolysis (tarcracking step), the thermal cracking of tar takes place. Tar crackingin the gas phase has significant impact on the accurate predictionof pyrolysis gas composition. The products of tar cracking are com-posed of CO, CO2, H2, hydrocarbons (e.g., C2H6, C2H4, and C3H6), andinert tar [19,20,45].
Prasad and Kuester [7] proposed an empirical model obtainedfrom a linear regression to predict the composition of pyrolysisgas, in which the gas components were expressed as a functionof pyrolysis temperature and steam to fuel ratio. A simplified ap-proach was reported by Sharma, and Gao and Li [46,47], hereinthe product gas of pyrolysis was assumed to be only CO, CH4,and H2O. The atomic balances determined the composition of thesecomponents. Sadaka et al. [48] calculated the pyrolysis gas compo-sition using the elemental balance under the assumption that theproduct consists of CO, CO2, CH4, H2, and H2O. The approach pro-posed by Sadaka et al. [48] is used in this study to predict the com-position of the gaseous product released from biomass pyrolysis. Inthis approach, volatiles and tar in biomass are considered to becompletely converted to the five gaseous components mentionedabove without any inert tar remaining. The elemental balancesare written as:
nc ¼ nCO þ nCO2 þ nCH4 ðA:1ÞnH ¼ 4nCH4 þ 2nH2 þ 2nH2O ðA:2ÞnO ¼ nCO þ 2nCO2 þ nH2O ðA:3Þ
where n is the number of moles. The nitrogen content in biomass (ifany) is assumed to form inert nitrogen gas. Thus the elemental bal-ance for nitrogen is
nN ¼ 2nN2 ðA:4Þ
In order to close the elemental balance equations, two terms de-fined as follows are required [48]: The fraction of CO formation,
/CO=CO2¼ nCO
nCO2
ðA:5Þ
and the fraction of CH4 formation,
/CH4=H2¼ nCH4
nH2
ðA:6Þ
The two fractions are determined by pyrolysis experiments for abiomass used. The experimental data show that with an increasein temperature /CO=CO2
increases, while /CH4=H2decreases. It is sup-
posed that the reaction between a certain part of char and CO2 byBoudouard reaction (C + CO2 ? 2CO) leads to the increase of/H2=CO when the pyrolysis temperature increases [26]. Increase inthe H2 concentration by the dehydrogenation of saturated hydro-carbons such as C2H6 and C3H8 might be the explanation for the de-crease in /CH4=H2
.
A.2. Char–gas reaction
The second stage of the qETG model is the char–gas reactions,which are composed of a series of complex and competing reac-tions between biomass char and gasification reagents. However,

S.I. Ngo et al. / Applied Energy 88 (2011) 5208–5220 5219
the Boudouard reaction, primary char–steam reaction and second-ary char–steam reaction are assumed to take place and to reach anequilibrium state in this study:
CðsÞ þ CO2ðgÞ $ 2COðgÞ ðIÞCðsÞ þH2OðgÞ $ COðgÞ þH2ðgÞ ðIIÞCðsÞ þ 2H2OðgÞ $ CO2ðgÞ þ 2H2ðgÞ ðIIIÞ
Since the steam amount involved in the char–gas equilibrium reac-tion increases with the increase of gasification temperature, it isneeded to determine the ratio of the steam amount involved inreactions (II) and (III) to the total water amount in this stage[3,18]. The steam participation ratio (b) is estimated from thechar–gasification experimental data taken from Yoshida et al.[18]. In Table 3, b is expressed as a function of gasificationtemperature.
A.3. Gas-phase reaction
It was reported that the water–gas shift reaction dominates inbiomass gasification at the temperature higher than 670 �C[23,27,38]:
COðgÞ þH2OðgÞ $ CO2ðgÞ þH2ðgÞ ðIVÞ
The methanation reaction C(s) + 2H2(g) ? CH4(g) in the secondstage and the steam reforming reaction CH4(g) + H2O(g) ? CO(g) +3H2(g) in the third stage of the qETG model are not supposed to takeplace.
A.4. Calculation procedures
Because the hydrogen and oxygen content in char decreasessharply as temperature increases [26,49], the char remaining afterbiomass pyrolysis is assumed to be pure carbon. The moles of car-bon in volatiles are determined by the difference between fixedcarbon content in the proximate analysis and carbon content inthe ultimate analysis. The moles of H, O, and N are then calculatedfrom the ultimate analysis. The composition of each species inpyrolysis gas is obtained by solving element-based balances. Thesecompositions are used as the initial conditions of the equilibriummodel in the second stage for char gasification. At the secondand third stages of the qETG model, instead of using element-basedbalances, the compositions of gaseous components are calculatedby using species-based balances. The equilibrium constant for eachreaction is calculated from the Gibbs free energy change of thereaction [50]. At the third stage, the equilibrium constant (K4) ofthe water–gas shift reaction (reaction (IV)) is corrected by thenon-equilibrium factor (j).
In the first stage, six linear equations are established to calcu-late the compositions of pyrolysis gas:
nC
nH
nO
nN
00
2666666664
3777777775¼
1 1 1 0 0 00 0 4 2 2 01 2 0 0 1 00 0 0 0 0 21 �/CO=CO2
0 0 0 00 0 1 �/CH4=H2
0 0
2666666664
3777777775�
nCO
nCO2
nCH4
nH2
nH2O
nN2
2666666664
3777777775
ðA:7Þ
In the second stage, the molar fraction of the gas species is calcu-lated. For a stoichiometric multi-reaction system, a set of i speciesai involved in j independent reactions can be written as:X
j
mi;jaj ¼ 0 ðA:8Þ
where vi,j is the stoichiometric number of species ai involved in thejth reaction. It is positive if ai is the product and negative if ai is the
reactant. Each reaction proceeds forward or backward to a certaindegree ejej, called the reaction coordinate, in order to reach an equi-librium from the initial stage [50]. At the equilibrium state, themole fraction of species ai is expressed as [50]:
yi ¼ni;0 þ
Pjmi;jej
n0 þP
jmjejðA:9Þ
where ni,0 and n0 are the moles of species ai and the total moles ofall species in the system at the initial state, respectively. vj is the to-tal stoichiometric number of the jth reaction which is defined as:
vj ¼X
i
mi;j ðA:10Þ
By applying Eq. (A.10) to the reactions of the second stage (reactionsI, II, III), the mole fraction of the gas species is expressed as:
yCO ¼nCO;0 þ 2e1 þ e2
n0 þ e1 þ e2 þ e3ðA:11Þ
yCO2¼
nCO2;0 � e1 þ e3
n0 þ e1 þ e2 þ e3ðA:12Þ
yH2¼ nH2 ;0 þ e2 þ 2e3
n0 þ e1 þ e2 þ e3ðA:13Þ
yH2O ¼nH2O;0 � e2 � 2e3
n0 þ e1 þ e2 þ e3ðA:14Þ
yCH4¼ nCH4 ;0
n0 þ e1 þ e2 þ e3ðA:15Þ
yN2¼ nN2 ;0
n0 þ e1 þ e2 þ e3ðA:16Þ
The equilibrium constant of each reaction is required to determinethe reaction coordinates:
K1 ¼ y�1CO2� y2
CO ðA:17ÞK2 ¼ y�1
H2O � yCO � yH2ðA:18Þ
K3 ¼ y�2H2O � yCO2
� y2H2
ðA:19Þ
From the Gibbs free energy equation, we have:
Kj ¼ exp �DG0
TG ;j
RTG
!ðA:20Þ
where D0TG
is calculated from standard Gibbs energy of formation:Xi
DG0TG ;f ;i¼ DG0
TG¼ ðDH0
TG� TGDS0
TGÞ ðA:21Þ
The molar enthalpy hi of a component i in the gas phase is definedby the enthalpy of formation D0
fiand the molar heat capacity Cpi
according to the following equation [50].
DH0TG¼X
i
mi � hi ðA:22Þ
hi ¼ DH0f ;i þ
Z TG
298:15cpiðTGÞdTG ðA:23Þ
In the third stage, the thermodynamic equilibrium constant ofwater–gas shift reaction is first calculated by the same way as thesecond stage, then the non-equilibrium factor (j) is applied:
K�4 ¼ j� K4 ðA:24Þ
where K�4 is the corrected equilibrium constant.
References
[1] Zainal ZA, Ali R, Lean CH, Seetharamu KN. Prediction of performance of adowndraft gasifier using equilibrium modeling for different biomass materials.Energy Convers Manage 2001;42:1499–515.
[2] Asadullah M, Miyazawa T, Ito S, Kunimori K, Yamada M, Tomishige K.Gasification of different biomasses in a dual-bed gasifier system combined

5220 S.I. Ngo et al. / Applied Energy 88 (2011) 5208–5220
with novel catalysts with high energy efficiency. Appl Catal A2004;267:95–102.
[3] Nguyen TDB, Lim YI, Song BH, Kim SM, Joo YJ, Ahn DH. Two-stage equilibriummodel applicable to the wide range of operating conditions in entrained-flowcoal gasifiers. Fuel 2010;89:3901–10.
[4] Franco C, Pinto F, Gulyurtlu I, Cabrita I. The study of reactions influencing thebiomass steam gasification process. Fuel 2003;82:835–42.
[5] Rapagnà S, Jand N, Kiennemann A, Foscolo PU. Steam-gasification of biomass ina fluidised-bed of olivine particles. Biomass Bioenergy 2000;19:187–97.
[6] Puig-Arnavat M, Bruno JC, Coronas A. Review and analysis of biomassgasification models. Renew Sustain Energy Rev 2010;14:2841–51.
[7] Prasad BVRK, Kuester JL. Process analysis of a dual fluidized bed biomassgasification system. Ind Eng Chem Res 1988;27:304–10.
[8] Schuster G, Löffler G, Weigl K, Hofbauer H. Biomass steam gasification – anextensive parametric modeling study. Bioresour Technol 2001;77:71–9.
[9] Shen L, Gao Y, Xiao J. Simulation of hydrogen production from biomassgasification in interconnected fluidized beds. Biomass Bioenergy2008;32:120–7.
[10] Proll T, Hofbauer H. H2 rich syngas by selective CO2 removal from biomassgasification in a dual fluidized bed system—process modelling approach. FuelProcess Technol 2008;89:1207–17.
[11] Corella J, Sanz A. Modeling circulating fluidized bed biomass gasifiers. Apseudo-rigorous model for stationary state. Fuel Process Technol2005;86:1021–53.
[12] Fiaschi D, Michelini M. A two-phase one-dimensional biomass gasificationkinetics model. Biomass Bioenergy 2001;21:121–32.
[13] Petersen I, Werther J. Experimental investigation and modeling of gasificationof sewage sludge in the circulating fluidized bed. Chem Eng Process2005;44:717–36.
[14] Guo B, Li D, Cheng C, Lü Z-a, Shen Y. Simulation of biomass gasification with ahybrid neural network model. Bioresour Technol 2001;76:77–83.
[15] Brown D, Fuchino T, Maréchal F. Solid fuel decomposition modelling for thedesign of biomass gasification systems. In: Marquardt W, Pantelides C,editors. Elsevier; 2006. p. 1661–6.
[16] Li X. Biomass gasification in a circulating fluidized bed. Biomass Bioenergy2004;26:171–93.
[17] Karmakar MK, Datta AB. Generation of hydrogen rich gas through fluidized bedgasification of biomass. Bioresour Technol 2011;102:1907–13.
[18] Yoshida H, Kiyono F, Tajima H, Yamasaki A, Ogasawara K, Masuyama T. Two-stage equilibrium model for a coal gasifier to predict the accurate carbonconversion in hydrogen production. Fuel 2008;87:2186–93.
[19] Radmanesh R, Chaouki J, Guy C. Biomass gasification in a bubbling fluidizedbed reactor: experiments and modeling. AICHE J 2006;52:4258–72.
[20] Wurzenberger JC, Wallner S, Raupenstrauch H, Khinast JG. Thermal conversionof biomass: comprehensive reactor and particle modeling. AICHE J2002;48:2398–411.
[21] Zhang L, Xu C, Champagne P. Overview of recent advances in thermo-chemicalconversion of biomass. Energy Convers Manage 2010;51:969–82.
[22] Dupont C, Boissonnet G, Seiler JM, Gauthier P, Schweich D. Study about thekinetic processes of biomass steam gasification. Fuel 2007;86:32–40.
[23] Herguido J, Corella J, Gonzalez-Saiz J. Steam gasification of lignocellulosicresidues in a fluidized bed at a small pilot scale. Effect of the type of feedstock.Ind Eng Chem Res 1992;31:1274–82.
[24] Kim YJ, Lee JM, Kim SD. Modeling of coal gasification in an internallycirculating fluidized bed reactor with draught tube. Fuel 2000;79:69–77.
[25] Prins M, Ptasinski K, Janssen F. From coal to biomass gasification: comparisonof thermodynamic efficiency. Energy 2007;32:1248–59.
[26] Fagbemi L, Khezami L, Capart R. Pyrolysis products from different biomasses:application to the thermal cracking of tar. Appl Energy 2001;69:293–306.
[27] Wei L, Xu S, Zhang L, Liu C, Zhu H, Liu S. Steam gasification of biomass forhydrogen-rich gas in a free-fall reactor. Int J Hydrogen Energy 2007;32:24–31.
[28] Senneca O. Kinetics of pyrolysis, combustion and gasification of three biomassfuels. Fuel Process Technol 2007;88:87–97.
[29] Jarungthammachote S, Dutta A. Thermodynamic equilibrium model andsecond law analysis of a downdraft waste gasifier. Energy 2007;32:1660–9.
[30] Altafini C. Prediction of the working parameters of a wood waste gasifierthrough an equilibrium model. Energy Convers Manage 2003;44:2763–77.
[31] Loha C, Chatterjee PK, Chattopadhyay H. Performance of fluidized bed steamgasification of biomass – modeling and experiment. Energy Convers Manage2011;52:1583–8.
[32] Buragohain B, Mahanta P, Moholkar VS. Thermodynamic optimization ofbiomass gasification for decentralized power generation and Fischer–ropschsynthesis. Energy 2010;35:2557–79.
[33] Hedlund H, Johansson P. Heat capacity of birch determined by calorimetry:implications for the state of water in plants. Thermochim Acta2000;349:79–88.
[34] Chemistry WebBook [Internet]. National Institute of Standards andTechnology (NIST) [cited 03.04.11]. <http://webbok.nist.gov/chemistry/>.
[35] Murakami T, Xu G, Suda T, Matsuzawa Y, Tani H, Fujimori T. Some processfundamentals of biomass gasification in dual fluidized bed. Fuel2007;86:244–55.
[36] Ho K, Pehlke RD. Simultaneous determination of thermal conductivity andspecific heat for refractory materials. J Am Ceram Soc 1990;73:2316–22.
[37] Seo MW, Nguyen TDB, Lim YI, Kim SD, Park S, Song BH, et al. Solid circulationand loop-seal characteristics of a dual circulating fluidized bed: experimentsand CFD simulation. Chem Eng J 2011;168:803–11.
[38] Walawender WP, Hoveland DA, Fan LT. Steam gasification of pure cellulose. 1.Uniform temperature profile. Ind Eng Chem Process Des Dev 1985;24:813–7.
[39] Kinoshita CM, Wang Y, Zhou J. Tar formation under different biomassgasification conditions. J Anal Appl Pyrolysis 1994;29:169–81.
[40] Gil J, Corella J, Aznar MP, Caballero MA. Biomass gasification in atmosphericand bubbling fluidized bed: effect of the type of gasifying agent on the productdistribution. Biomass Bioenergy 1999;17:389–403.
[41] Pfeifer C, Puchner B, Hofbauer H. Comparison of dual fluidized bed steamgasification of biomass with and without selective transport of CO2. Chem EngSci 2009;64:5073–83.
[42] Buftron H, Davis MLO. Advances in Fischer–Tropsch, synthesis, catalysts, andcatalysis. Boca Raton: CRC Press; 2010.
[43] Demirbas A. Biorefineries for biomass upgrading facilities. Springer-Verlag;2010.
[44] Göransson K, Söderlind U, Zhang W. Experimental test on a novel dualfluidised bed biomass gasifier for synthetic fuel production. Fuel2011;90:1340–9.
[45] Rath J, Staudinger G. Cracking reactions of tar from pyrolysis of spruce wood.Fuel 2001;80:1379–89.
[46] Gao N, Li A. Modeling and simulation of combined pyrolysis and reductionzone for a downdraft biomass gasifier. Energy Convers Manage2008;49:3483–90.
[47] Sharma AK. Equilibrium modeling of global reduction reactions for adowndraft (biomass) gasifier. Energy Convers Manage 2008;49:832–42.
[48] Sadaka SS, Ghaly AE, Sabbah MA. Two phase biomass air-steam gasificationmodel for fluidized bed reactors: Part I-model development. BiomassBioenergy 2002;22:439–62.
[49] Shafizadeh F. Introduction to pyrolysis of biomass. J Anal Appl Pyrolysis1982;3:283–305.
[50] Smith JM, VanNess HC, Abbott MM. Introduction to chemical engineeringthermodynamics. 7th ed. New York: Mc Graw-Hill; 2005.
Copyright © 2022 FDOKUMEN