Bead Geometry Optimization of Submerged Arc Weld: Exploration of Weighted Principal Component...
6
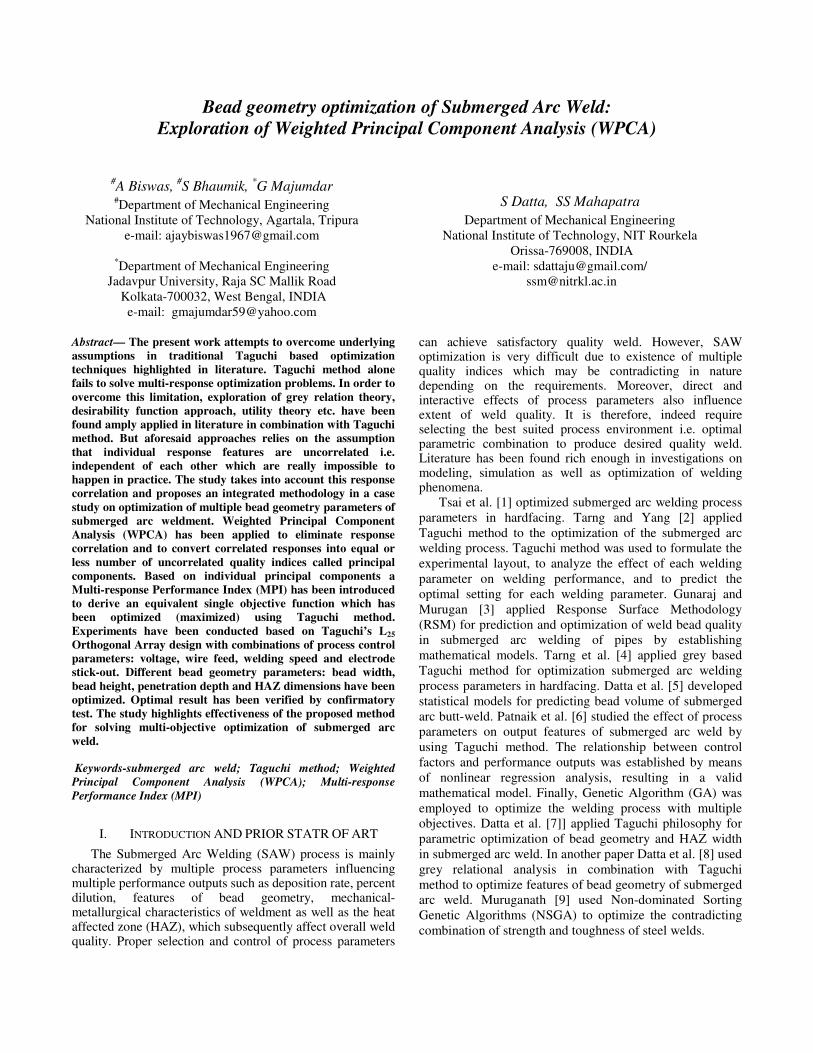
Bead geometry optimization of Submerged Arc Weld: Exploration of Weighted Principal Component Analysis (WPCA) # A Biswas, # S Bhaumik, * G Majumdar # Department of Mechanical Engineering National Institute of Technology, Agartala, Tripura e-mail: [email protected] * Department of Mechanical Engineering Jadavpur University, Raja SC Mallik Road Kolkata-700032, West Bengal, INDIA e-mail: [email protected] S Datta, SS Mahapatra Department of Mechanical Engineering National Institute of Technology, NIT Rourkela Orissa-769008, INDIA e-mail: [email protected]/ [email protected] Abstract— The present work attempts to overcome underlying assumptions in traditional Taguchi based optimization techniques highlighted in literature. Taguchi method alone fails to solve multi-response optimization problems. In order to overcome this limitation, exploration of grey relation theory, desirability function approach, utility theory etc. have been found amply applied in literature in combination with Taguchi method. But aforesaid approaches relies on the assumption that individual response features are uncorrelated i.e. independent of each other which are really impossible to happen in practice. The study takes into account this response correlation and proposes an integrated methodology in a case study on optimization of multiple bead geometry parameters of submerged arc weldment. Weighted Principal Component Analysis (WPCA) has been applied to eliminate response correlation and to convert correlated responses into equal or less number of uncorrelated quality indices called principal components. Based on individual principal components a Multi-response Performance Index (MPI) has been introduced to derive an equivalent single objective function which has been optimized (maximized) using Taguchi method. Experiments have been conducted based on Taguchi’s L 25 Orthogonal Array design with combinations of process control parameters: voltage, wire feed, welding speed and electrode stick-out. Different bead geometry parameters: bead width, bead height, penetration depth and HAZ dimensions have been optimized. Optimal result has been verified by confirmatory test. The study highlights effectiveness of the proposed method for solving multi-objective optimization of submerged arc weld. Keywords-submerged arc weld; Taguchi method; Weighted Principal Component Analysis (WPCA); Multi-response Performance Index (MPI) I. INTRODUCTION AND PRIOR STATR OF ART The Submerged Arc Welding (SAW) process is mainly characterized by multiple process parameters influencing multiple performance outputs such as deposition rate, percent dilution, features of bead geometry, mechanical- metallurgical characteristics of weldment as well as the heat affected zone (HAZ), which subsequently affect overall weld quality. Proper selection and control of process parameters can achieve satisfactory quality weld. However, SAW optimization is very difficult due to existence of multiple quality indices which may be contradicting in nature depending on the requirements. Moreover, direct and interactive effects of process parameters also influence extent of weld quality. It is therefore, indeed require selecting the best suited process environment i.e. optimal parametric combination to produce desired quality weld. Literature has been found rich enough in investigations on modeling, simulation as well as optimization of welding phenomena. Tsai et al. [1] optimized submerged arc welding process parameters in hardfacing. Tarng and Yang [2] applied Taguchi method to the optimization of the submerged arc welding process. Taguchi method was used to formulate the experimental layout, to analyze the effect of each welding parameter on welding performance, and to predict the optimal setting for each welding parameter. Gunaraj and Murugan [3] applied Response Surface Methodology (RSM) for prediction and optimization of weld bead quality in submerged arc welding of pipes by establishing mathematical models. Tarng et al. [4] applied grey based Taguchi method for optimization submerged arc welding process parameters in hardfacing. Datta et al. [5] developed statistical models for predicting bead volume of submerged arc butt-weld. Patnaik et al. [6] studied the effect of process parameters on output features of submerged arc weld by using Taguchi method. The relationship between control factors and performance outputs was established by means of nonlinear regression analysis, resulting in a valid mathematical model. Finally, Genetic Algorithm (GA) was employed to optimize the welding process with multiple objectives. Datta et al. [7]] applied Taguchi philosophy for parametric optimization of bead geometry and HAZ width in submerged arc weld. In another paper Datta et al. [8] used grey relational analysis in combination with Taguchi method to optimize features of bead geometry of submerged arc weld. Muruganath [9] used Non-dominated Sorting Genetic Algorithms (NSGA) to optimize the contradicting combination of strength and toughness of steel welds.
-
Upload
independent -
Category
Documents
-
view
0 -
download
0
Transcript of Bead Geometry Optimization of Submerged Arc Weld: Exploration of Weighted Principal Component...
Bead geometry optimization of Submerged Arc Weld:
Exploration of Weighted Principal Component Analysis (WPCA)
#A Biswas,
#S Bhaumik,
*G Majumdar
#Department of Mechanical Engineering
National Institute of Technology, Agartala, Tripura
e-mail: [email protected]
*Department of Mechanical Engineering
Jadavpur University, Raja SC Mallik Road
Kolkata-700032, West Bengal, INDIA
e-mail: [email protected]
S Datta, SS Mahapatra
Department of Mechanical Engineering
National Institute of Technology, NIT Rourkela
Orissa-769008, INDIA
e-mail: [email protected]/
Abstract— The present work attempts to overcome underlying
assumptions in traditional Taguchi based optimization
techniques highlighted in literature. Taguchi method alone
fails to solve multi-response optimization problems. In order to
overcome this limitation, exploration of grey relation theory,
desirability function approach, utility theory etc. have been
found amply applied in literature in combination with Taguchi
method. But aforesaid approaches relies on the assumption
that individual response features are uncorrelated i.e.
independent of each other which are really impossible to
happen in practice. The study takes into account this response
correlation and proposes an integrated methodology in a case
study on optimization of multiple bead geometry parameters of
submerged arc weldment. Weighted Principal Component
Analysis (WPCA) has been applied to eliminate response
correlation and to convert correlated responses into equal or
less number of uncorrelated quality indices called principal
components. Based on individual principal components a
Multi-response Performance Index (MPI) has been introduced
to derive an equivalent single objective function which has
been optimized (maximized) using Taguchi method.
Experiments have been conducted based on Taguchi’s L25
Orthogonal Array design with combinations of process control
parameters: voltage, wire feed, welding speed and electrode
stick-out. Different bead geometry parameters: bead width,
bead height, penetration depth and HAZ dimensions have been
optimized. Optimal result has been verified by confirmatory
test. The study highlights effectiveness of the proposed method
for solving multi-objective optimization of submerged arc
weld.
Keywords-submerged arc weld; Taguchi method; Weighted
Principal Component Analysis (WPCA); Multi-response
Performance Index (MPI)
I. INTRODUCTION AND PRIOR STATR OF ART
The Submerged Arc Welding (SAW) process is mainly characterized by multiple process parameters influencing multiple performance outputs such as deposition rate, percent dilution, features of bead geometry, mechanical-metallurgical characteristics of weldment as well as the heat affected zone (HAZ), which subsequently affect overall weld quality. Proper selection and control of process parameters
can achieve satisfactory quality weld. However, SAW optimization is very difficult due to existence of multiple quality indices which may be contradicting in nature depending on the requirements. Moreover, direct and interactive effects of process parameters also influence extent of weld quality. It is therefore, indeed require selecting the best suited process environment i.e. optimal parametric combination to produce desired quality weld. Literature has been found rich enough in investigations on modeling, simulation as well as optimization of welding phenomena. Tsai et al. [1] optimized submerged arc welding process
parameters in hardfacing. Tarng and Yang [2] applied
Taguchi method to the optimization of the submerged arc
welding process. Taguchi method was used to formulate the
experimental layout, to analyze the effect of each welding
parameter on welding performance, and to predict the
optimal setting for each welding parameter. Gunaraj and
Murugan [3] applied Response Surface Methodology
(RSM) for prediction and optimization of weld bead quality
in submerged arc welding of pipes by establishing
mathematical models. Tarng et al. [4] applied grey based
Taguchi method for optimization submerged arc welding
process parameters in hardfacing. Datta et al. [5] developed
statistical models for predicting bead volume of submerged
arc butt-weld. Patnaik et al. [6] studied the effect of process
parameters on output features of submerged arc weld by
using Taguchi method. The relationship between control
factors and performance outputs was established by means
of nonlinear regression analysis, resulting in a valid
mathematical model. Finally, Genetic Algorithm (GA) was
employed to optimize the welding process with multiple
objectives. Datta et al. [7]] applied Taguchi philosophy for
parametric optimization of bead geometry and HAZ width
in submerged arc weld. In another paper Datta et al. [8] used
grey relational analysis in combination with Taguchi
method to optimize features of bead geometry of submerged
arc weld. Muruganath [9] used Non-dominated Sorting
Genetic Algorithms (NSGA) to optimize the contradicting
combination of strength and toughness of steel welds.
BPCL
Text Box
2nd International Conference on Mechanical, Industrial and Manufacturing Technologies (MIMT 2011) 26th - 28th February 2011, Singapore
BPCL
Text Box
Literature depicts two diverse directions on the
research of weld optimization. In one trend attempt has been
made to model the welding process behavior. In this case,
mathematical models are developed to represent process
responses as a function of input parameters. If the problem
deals with only one objective function; it can easily be
optimized by an optimization algorithm. But when more
than one response comes under consideration and the
system is subjected to a number of constraints it is very
difficult to tackle the problem. Evolutionary algorithms like
Simulated Annealing, Genetic Algorithm, Neural Network
(NN) and Particle Swarm (PSO) optimization can provide
an approximate solution in the experimental domain. If
these algorithms follow continuous search ideology then the
optimal solution may be infeasible to achieve in practice.
The reason behind that, the setup usually has the provision
of controlling parameters at some discrete levels. This
problem can be avoided if these algorithms are modified to
follow continuous search to discrete search in the parametric
domain. This may add complexity to the problem and
requires in depth knowledge of computer programming.
The second trend in solving optimization problem
highlights application feasibility of Taguchi’s philosophy of
robust design. Taguchi method is very popular as it requires
a well balanced experimental design (limited number of
experiments) which saves time as well as cost. Not only
this, Taguchi approach finds optimal at discrete levels of the
process parameters. But this method fails to solve multi-
objective optimization problems. In order to overcome this,
previous researchers applied desirability function approach
[10], grey relation theory [8], utility theory [11, 12], VIKOR
method [13] in combination with Taguchi method. The
purpose is to aggregate multiple responses (objective
functions) into an equivalent quality index (single objective
function) which can easily be optimized using Taguchi
method. But aforesaid approaches are based on the
assumption that response features i.e. quality indices are
uncorrelated i.e. independent which seems to be totally
infeasible in practical case. To overcome this shortcoming,
in the present work, Principal Component Analysis (PCA)
has been explored to eliminate correlation that exists
between the responses and to evaluate independent i.e.
uncorrelated quality indices which are denoted as Principal
Components. These individual principal components have
been aggregated further to compute a multi-response
performance index (MPI). MPI has been optimized
(maximized) finally by Taguchi method. Optimal result was
verified through confirmatory test. This indicates
application feasibility of the aforesaid methodology
proposed for multi-response optimization and off-line
control of correlated multi-quality weld bead characteristics
in submerged arc welding.
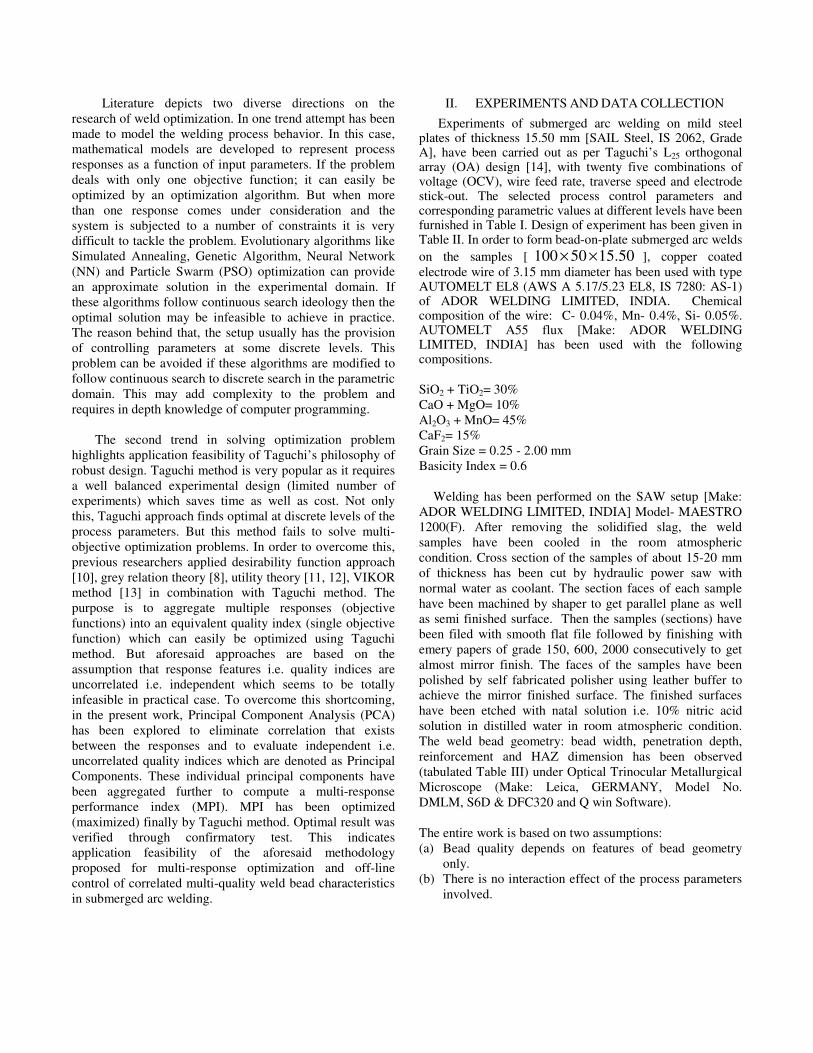
II. EXPERIMENTS AND DATA COLLECTION
Experiments of submerged arc welding on mild steel plates of thickness 15.50 mm [SAIL Steel, IS 2062, Grade A], have been carried out as per Taguchi’s L25 orthogonal array (OA) design [14], with twenty five combinations of voltage (OCV), wire feed rate, traverse speed and electrode stick-out. The selected process control parameters and corresponding parametric values at different levels have been furnished in Table I. Design of experiment has been given in Table II. In order to form bead-on-plate submerged arc welds
on the samples [ 50.1550100 ×× ], copper coated
electrode wire of 3.15 mm diameter has been used with type AUTOMELT EL8 (AWS A 5.17/5.23 EL8, IS 7280: AS-1) of ADOR WELDING LIMITED, INDIA. Chemical composition of the wire: C- 0.04%, Mn- 0.4%, Si- 0.05%. AUTOMELT A55 flux [Make: ADOR WELDING LIMITED, INDIA] has been used with the following compositions.
SiO2 + TiO2= 30%
CaO + MgO= 10%
Al2O3 + MnO= 45%
CaF2= 15%
Grain Size = 0.25 - 2.00 mm
Basicity Index = 0.6
Welding has been performed on the SAW setup [Make:
ADOR WELDING LIMITED, INDIA] Model- MAESTRO
1200(F). After removing the solidified slag, the weld
samples have been cooled in the room atmospheric
condition. Cross section of the samples of about 15-20 mm
of thickness has been cut by hydraulic power saw with
normal water as coolant. The section faces of each sample
have been machined by shaper to get parallel plane as well
as semi finished surface. Then the samples (sections) have
been filed with smooth flat file followed by finishing with
emery papers of grade 150, 600, 2000 consecutively to get
almost mirror finish. The faces of the samples have been
polished by self fabricated polisher using leather buffer to
achieve the mirror finished surface. The finished surfaces
have been etched with natal solution i.e. 10% nitric acid
solution in distilled water in room atmospheric condition.
The weld bead geometry: bead width, penetration depth,
reinforcement and HAZ dimension has been observed
(tabulated Table III) under Optical Trinocular Metallurgical
Microscope (Make: Leica, GERMANY, Model No.
DMLM, S6D & DFC320 and Q win Software).
The entire work is based on two assumptions:
(a) Bead quality depends on features of bead geometry
only.
(b) There is no interaction effect of the process parameters
involved.

III. PROPOSED METHODOLOGY
Traditional Taguchi approach fails solve a multi-response
optimization problem. It is felt necessary to combine these
multiple objectives (criteria or response attributes) into an
equivalent single objective function which is going to be
treated as the representative overall quality index for multi-
quality characteristics. In this context application of
Principal Component Analysis (PCA) deserves mention
[15]. The method is helpful to eliminate response
correlation, if it exists. This approach converts correlated
responses into an equal or less number of uncorrelated
quality indices which are called individual principal
components. The principal component which has the
maximum accountability proportion (AP) is generally
treated as overall performance index. But when more than
one principal component has considerable value of
accountability proportion which cannot be ignored; the
problem of computing composite principal component
arises. Literature indicates that different researchers
suggested different approaches to calculate this composite
principal component [15, 16, 17]. But those approaches are
not reliable always and at the same time there is no physical
interpretation of the said composite principal component. It
is just a mathematical tool to facilitate the solution of
optimization problems.
In consideration of the above Weighted Principal
Component Analysis (WPCA) was suggested by Liao [18].
The study provided scientific means for computation of
composite principal component. Values of individual
principal components multiplied by their priority weight
were added to calculate the composite principal component
defined as Multi-response Performance Index (MPI). MPI
was optimized (maximized) using Taguchi method.
IV. ANALYSIS RESULTS AND DISCUSSIONS
Experimental data (Table III) has been normalized first.
The objective is to minimize bead width, reinforcement,
depth of HAZ and to maximize depth of penetration. For
this purpose (Lower-the-Better) LB criteria has been
selected for bead width, reinforcement as well as depth of
HAZ. Penetration depth follows Higher-the-Better (HB)
criteria. Data has been normalized using the equations
shown below.
(a) (Lower-the-Better) criteria:
* min ( )( )
( )
ii
i
X kX k
X k= (4)
Here, 1,2,........, ;
1, 2,.........,
i m
k n
=
=
(b) HB (Higher-the-Better)
* ( )( )
max ( )
ii
i
X kX k
X k= (5)
Here, 1, 2,........, ;
1, 2,.........,
i m
k n
=
=
Assuming, the number of experimental runs in Taguchi’s
OA design is m , and the number of quality characteristics
is n . *( )iX k is the normalized data of the k th element in
the i th sequence.
0 ( )b
X k is the desired value of the k th quality
characteristic. After data normalization, the value of *( )iX k will be between 0 and 1. The series
*, 1, 2,3,........, .iX i m= can be viewed as the comparative
sequence used in the present case.
After data normalization a check has to be made whether
responses are correlated or not. Table IV represents
Pearson’s correlation coefficient between the responses. In
all cases non-zero value of correlation coefficient indicates
that all response features are correlated to each other. In
order to eliminate response correlation Principal Component
Analysis has been applied. Table V represents results of
PCA (Eigen value, Eigen vector, accountability proportion
AP and cumulative accountability proportion CAP).
Next, correlated responses have been converted into
uncorrelated quality indices called principal components
( 1ψ , 2ψ , 3ψ and 4ψ ). These individual principal
components have been furnished in Table VI.
Accountability proportion of individual principal
components has been treated as individual priority weights
[18]. Finally, multi-response performance index (MPI) has
been computed using the following equation (Table VI).
43
21
067.0082.0
342.0509.0
ψψ
ψψ
×+×+
×+×=MPI (5)
MPI has been treated as single objective function for
optimization in order to maximize it. The factorial
combination that maximized MPI can be treated as optimal
parametric combination/ most favorable process
environment ensuring high surface quality. This has been
performed using Taguchi method. Figure 1 represents S/N
ratio plot of MPI; S/N ratio has been calculated using
Higher-the-Better (HB) criteria. Optimal setting has been
evaluated from this plot. Predicted optimal combination
becomes: V1 F1 S5 N4. Optimal result has been verified
through confirmatory test. According to Taguchi’ prediction
[19] predicted value of S/N ratio for MPI becomes 0.320465
(higher than all entries in Table 9) whereas in confirmatory
experiment it is obtained a value of 0.4892. So quality has
improved using the optimal setting.
TABLE I. PROCESS PARAMETERS
Parameters Units
Level values
Level
1
Level
2
Level
3
Level
4
Level
5
Voltage
(OCV)
V
V 32.5 35 37 39 41
Wire feed
F
Knob
setting 2 3 4 5 6
Traverse
speed
S
m/min 0.30 0.45 0.60 0.75 0.90
Stick-out
N mm 25 27 29 31 33
TABLE II. DESIGN OF EXPERIMENT
Sl.
No.
Design of experiment: Levels of factors (Factorial
combinations)
V F S N
1 1 1 1 1
2 1 2 2 2
3 1 3 3 3
4 1 4 4 4
5 1 5 5 5
6 2 1 2 3
7 2 2 3 4
8 2 3 4 5
9 2 4 5 1
10 2 5 1 2
11 3 1 3 5
12 3 2 4 1
13 3 3 5 2
14 3 4 1 3
15 3 5 2 4
16 4 1 4 2
17 4 2 5 3
18 4 3 1 4
19 4 4 2 5
20 4 5 3 1
21 5 1 5 4
22 5 2 1 5
23 5 3 2 1
24 5 4 3 2
25 5 5 4 3
TABLE III. EXPERIMENTAL DATA
Sample
No.
Penetration
(mm)
Reinforcement
(mm)
Bead width
(mm)
Width of HAZ
(mm)
01 1.61 2.14 15.41 1.17
02 3.27 2.19 15.25 1.39
03 4.93 3.38 12.68 1.13
04 5.30 3.69 9.80 0.75
05 5.17 3.71 9.73 0.60
06 1.39 1.81 13.99 1.47
07 2.27 2.16 12.65 1.08
08 4.17 2.43 13.20 1.00
09 4.99 3.16 12.19 0.71
10 8.76 5.77 18.13 3.11
11 1.51 1.59 11.15 0.97
12 2.47 2.07 13.35 0.97
13 4.78 2.64 10.01 0.61
14 7.34 5.58 17.00 2.01
15 8.21 4.85 11.59 1.03
16 1.70 1.45 10.01 1.06
17 2.76 1.63 11.97 0.74
18 6.82 3.92 20.53 1.53
19 6.99 4.35 16.06 1.20
20 8.62 3.94 13.89 1.23
21 1.45 1.53 8.57 1.83
22 3.35 2.74 21.37 2.59
23 6.30 3.09 18.14 1.15
24 8.81 2.54 15.77 0.71
25 7.26 4.57 13.16 0.70
TABLE IV. CORRELATION CHECK (#SIGNIFICANT CORRELATION)
Sl.
No.
Correlation
between
responses
Pearson’s
correlation
coefficient
Comment P-value
1
Penetration
and
reinforcement
-0.647 Both are correlated 0.000#
2
Penetration
and
bead width
-0.204 Both are correlated 0.316
3
Penetration
and
HAZ width
+0.145 Both are correlated 0.481
4
Reinforcement
and
bead width
+0.501 Both are correlated 0.009#
5
Reinforcement
and
HAZ width
+0.143 Both are correlated 0.484
6
Bead width
and
HAZ width
+0.585 Both are correlated 0.002#
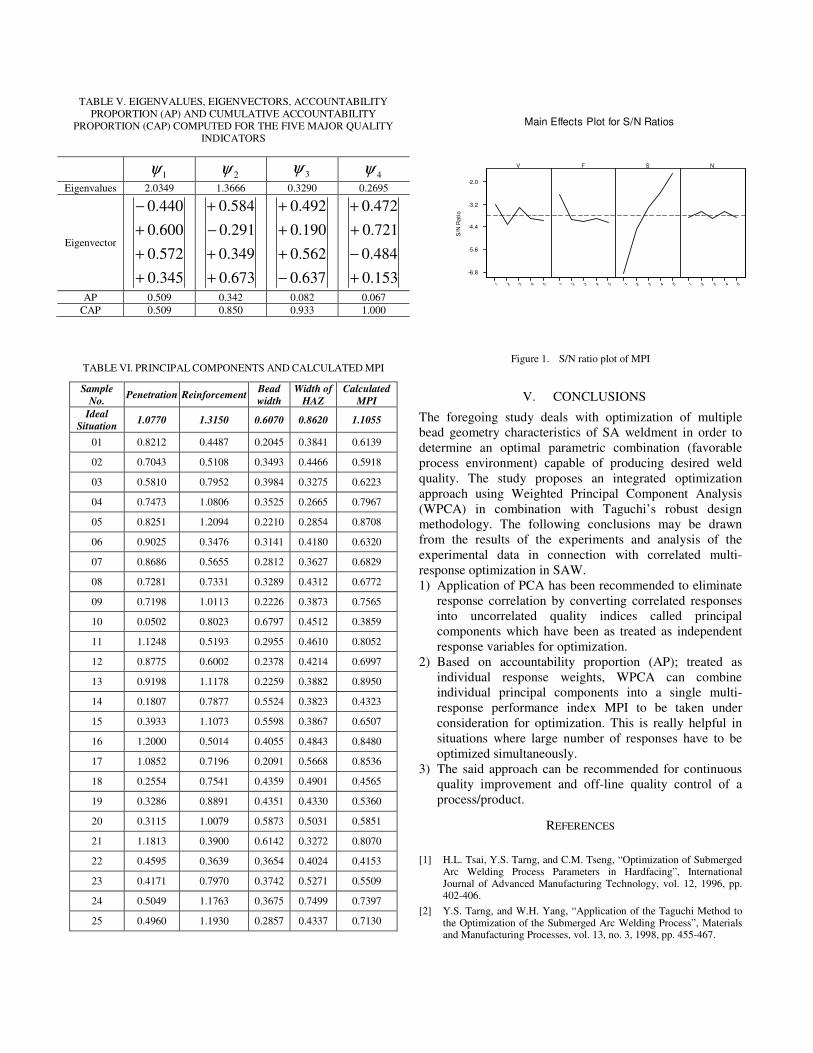
TABLE V. EIGENVALUES, EIGENVECTORS, ACCOUNTABILITY
PROPORTION (AP) AND CUMULATIVE ACCOUNTABILITY
PROPORTION (CAP) COMPUTED FOR THE FIVE MAJOR QUALITY
INDICATORS
1ψ 2ψ 3ψ
4ψ
Eigenvalues 2.0349 1.3666 0.3290 0.2695
Eigenvector
345.0
572.0
600.0
440.0
+
+
+
−
673.0
349.0
291.0
584.0
+
+
−
+
637.0
562.0
190.0
492.0
−
+
+
+
153.0
484.0
721.0
472.0
+
−
+
+
AP 0.509 0.342 0.082 0.067
CAP 0.509 0.850 0.933 1.000
TABLE VI. PRINCIPAL COMPONENTS AND CALCULATED MPI
Sample
No. Penetration Reinforcement
Bead
width
Width of
HAZ
Calculated
MPI
Ideal
Situation 1.0770 1.3150 0.6070 0.8620 1.1055
01 0.8212 0.4487 0.2045 0.3841 0.6139
02 0.7043 0.5108 0.3493 0.4466 0.5918
03 0.5810 0.7952 0.3984 0.3275 0.6223
04 0.7473 1.0806 0.3525 0.2665 0.7967
05 0.8251 1.2094 0.2210 0.2854 0.8708
06 0.9025 0.3476 0.3141 0.4180 0.6320
07 0.8686 0.5655 0.2812 0.3627 0.6829
08 0.7281 0.7331 0.3289 0.4312 0.6772
09 0.7198 1.0113 0.2226 0.3873 0.7565
10 0.0502 0.8023 0.6797 0.4512 0.3859
11 1.1248 0.5193 0.2955 0.4610 0.8052
12 0.8775 0.6002 0.2378 0.4214 0.6997
13 0.9198 1.1178 0.2259 0.3882 0.8950
14 0.1807 0.7877 0.5524 0.3823 0.4323
15 0.3933 1.1073 0.5598 0.3867 0.6507
16 1.2000 0.5014 0.4055 0.4843 0.8480
17 1.0852 0.7196 0.2091 0.5668 0.8536
18 0.2554 0.7541 0.4359 0.4901 0.4565
19 0.3286 0.8891 0.4351 0.4330 0.5360
20 0.3115 1.0079 0.5873 0.5031 0.5851
21 1.1813 0.3900 0.6142 0.3272 0.8070
22 0.4595 0.3639 0.3654 0.4024 0.4153
23 0.4171 0.7970 0.3742 0.5271 0.5509
24 0.5049 1.1763 0.3675 0.7499 0.7397
25 0.4960 1.1930 0.2857 0.4337 0.7130
NSFV
54321543215432154321
-2.0
-3.2
-4.4
-5.6
-6.8
S/N
Ra
tio
Main Effects Plot for S/N Ratios
Figure 1. S/N ratio plot of MPI
V. CONCLUSIONS
The foregoing study deals with optimization of multiple
bead geometry characteristics of SA weldment in order to
determine an optimal parametric combination (favorable
process environment) capable of producing desired weld
quality. The study proposes an integrated optimization
approach using Weighted Principal Component Analysis
(WPCA) in combination with Taguchi’s robust design
methodology. The following conclusions may be drawn
from the results of the experiments and analysis of the
experimental data in connection with correlated multi-
response optimization in SAW.
1) Application of PCA has been recommended to eliminate
response correlation by converting correlated responses
into uncorrelated quality indices called principal
components which have been as treated as independent
response variables for optimization.
2) Based on accountability proportion (AP); treated as
individual response weights, WPCA can combine
individual principal components into a single multi-
response performance index MPI to be taken under
consideration for optimization. This is really helpful in
situations where large number of responses have to be
optimized simultaneously.
3) The said approach can be recommended for continuous
quality improvement and off-line quality control of a
process/product.
REFERENCES
[1] H.L. Tsai, Y.S. Tarng, and C.M. Tseng, “Optimization of Submerged Arc Welding Process Parameters in Hardfacing”, International Journal of Advanced Manufacturing Technology, vol. 12, 1996, pp. 402-406.
[2] Y.S. Tarng, and W.H. Yang, “Application of the Taguchi Method to the Optimization of the Submerged Arc Welding Process”, Materials and Manufacturing Processes, vol. 13, no. 3, 1998, pp. 455-467.

[3] V. Gunaraj, and N. Murugan, “Application of Response Surface Methodology for Predicting Weld Bead Quality in Submerged Arc Welding of Pipes”, Journal of Materials Processing Technology, vol. 88, 1999, pp. 266–275.
[4] Y.S. Tarng, S.C. Juang, and C.H. Chang, “The Use of Grey-Based Taguchi Methods to Determine Submerged Arc Welding Process Parameters in Hard Facing”, Journal of Materials Processing Technology, vol. 128, 2002, pp. 1–6.
[5] S. Datta, M. Sundar, A. Bandyopadhyay, P. K. Pal, G. Nandi, and S.C. Roy, “Statistical Modeling for Predicting Bead Volume of Submerged Arc Butt Welds”, Australasian Welding Journal, vol. 51, no. 2, 2006, pp. 39-47.
[6] A. Patnaik, S. Biswas, and S.S. Mahapatra, “An Evolutionary Approach to Parameter Optimization of Submerged Arc Welding in the Hardfacing Process”, International Journal of Manufacturing Research, vol. 2, no. 4, 2007, pp. 462-483.
[7] S. Datta, A. Bandyopadhyay, and P.K. Pal, “Application of Taguchi Philosophy for Parametric Optimization of Bead Geometry and HAZ Width in Submerged Arc Welding Using Mixture of Fresh Flux and Fused Slag”, International Journal of Advanced Manufacturing Technology, vol. 36, 2008, pp. 689-698.
[8] S. Datta, A. Bandyopadhyay, and P.K. Pal, “Grey Based Taguchi Method for Optimization of Bead Geometry in Submerged Arc Bead-On-Plate Welding”, International Journal of Advanced Manufacturing Technology, vol. 39, 2008, pp. 1136-1143.
[9] M. Murugananth, “Metaheuristic Multiobjective Optimization in Steel Welds”, Materials and Manufacturing Processes, vol. 24, 2009, pp. 230–239.
[10] S. Datta, A. Bandyopadhyay, and P. K. Pal, “Desirability Function Approach for Solving Multi-Objective Optimization Problem in Submerged Arc Welding”, International Journal of Manufacturing Science and Production, vol. 7, no. 2, 2006, pp. 127-135.
[11] P. Kumar, P.B. Barua, and J.L. Gaindhar, “Quality Optimization (Multi-Characteristics) Through Taguchi’s Technique and Utility Concept, Quality and Reliability Engineering International, vol. 16, 2000, pp. 475-485.
[12] R.S. Walia, H.S. Shan, and P. KUMAR, “Multi-Response Optimization of CFAAFM Process Through Taguchi Method and Utility Concept”, Materials and Manufacturing Processes, vol. 21, 2006, 907-914.
[13] S. Datta, S. S. Mahapatra, S. Banerjee, A. Bandyopadhyay, “Comparative study on application of utility concept and VIKOR method for vendor selection”, AIMS International Conference on Value-based Management, organized by Indus Business Academy–India, International Forum of Management Scholars, AIMS International, held during August 11-13, 2010 at Dev Sanskriti Vishwavidyalaya, Haridwar, India.
[14] G.S. Peace, “Taguchi Methods- A Hands-On Approach”, 1993, Addison-Wesley Publishing Company. Massachusetts.
[15] F.C. Wu, “Optimization of Correlated Multiple Quality Characteristics Using Desirability Function”, Quality Engineering, vol. 17, no. 1, 2005, pp. 119-126.
[16] M.S. Huang, and T.Y. Lin, “Simulation of a Regression-Model and PCA based Searching Method Developed for Setting the Robust Injection Molding Parameters of Multi-Quality Characteristics”, International Journal of Heat and Mass Transfer, 2008, DOI: 10.1016/j.ijheatmasstransfer.2008.05.016.
[17] S. Datta, G. Nandi, A. Bandyopadhyay, and P.K. Pal, “Application of PCA based Hybrid Taguchi Method for Multi-Criteria Optimization of Submerged Arc Weld: A case study”, International Journal of Advanced Manufacturing Technology, vol. 45, no. 3-4, November 2009, pp. 276-286.
[18] H.C. Liao, “Multi-Response Optimization using Weighted Principal Component”, International Journal of Advanced Manufacturing Technology, vol. 27, 2006, pp. 720-725.
[19] J. Antony, and F. Antony, “Teaching the Taguchi Method to Industrial Engineers”, Work Study, vol. 50, no. 4, 2001, pp. 141-149.
.