PREDICTION AND OPTIMIZATION OF WELD BEAD GEOMETRY IN GAS METAL ARC WELDING PROCESS USING D‐OPTIMAL...
12
PREDICTION AND OPTIMIZATION OF WELD BEAD GEOMETRY IN GAS METAL ARC WELDING PROCESS USING D‐OPTIMAL METHODOLOGY VIVEKANAND 1 , BHUVNESH BHARDWAJ 2 , KULBHUSHAN BHAGAT 3 , MOHIT CHOUBISA 4 1 Student, Department of Mechanical Engineering, Suresh Gyan Vihar University, Jaipur, Email: [email protected] 2 Associate professor, Department of Mechanical Engineering, Suresh Gyan Vihar University, Jaipur, Email: [email protected] 3 Assistant professor, Department of Mechanical Engineering, Suresh Gyan Vihar University, Jaipur, Email: [email protected] 4 Student, Department of Mechanical Engineering, Suresh Gyan Vihar University, Jaipur, Email: [email protected] ABSTRACT Metal inert gas welding (MIG) is also known as gas metal arc welding (GMAW). GMAW (Gas Metal Arc Welding) is a Welding process used a variety of materials Ferrous and Non‐Ferrous. In the Gas Shielded Arc welding both the arc and molten metal are shielded from the atmosphere by a stream of gas. In this experiment, welding was performed on mild steel and the welding parameters like nozzle to plate distance (NPD), Open circuit voltage (OCV), Welding speed, Wire feed rate were controlled to achieve maximum bead width. For this, we used response surface methodology (RSM) with central composite design (CCRD) on the design software Design Expert. After ANOVA analysis, we found that bead width increases with the increase in NPD, OCV & Wire feed rate while it decreases with increase in welding speed. Maximum bead width is 5.3mm at NPD of 18mm, OCV of 21V, Welding speed of 30cm/min, Wire feed rate of 9m/min. 1. INTRODUCTION Modern industrial products which have contributed to the prosperity of mankind, owe their development and efficient performance to welding, which is now the universally accepted method of permanently joining metal metals and producing monolithic structures efficiently and economically. Steels by far are the most widely used and welded materials, primarily, due to the fact that they can be manufactured relatively cheaply in large quantities to very precise specifications and have an extensive range of mechanical properties. Weld surfacing is increasingly employed to enhance the life & to reduce the cost of engineering components. Gas metal arc welding (GMAW) cladding is extensively employed in its automatic mode to obtain the good quality stainless steel cladding. Cladding is popularly employed to increase corrosion resistance, resistance to high temperature etc. at the surface of a component in order to enhance its life and to reduce its cost by depositing a suitable filler material. 1.1 Metal Inert Gas (MIG) Process In Gas Metal Arc Welding (MIG), also known as Metal Inert Gas (MIG) welding, an electric arc is established between the workpiece and a consumable bare wire electrode. The arc continuously melts the wire as it is fed to the weld puddle. The weld metal is shielded from the atmosphere by a flow of an inert gas, or gas mixture. The Figure 1 shows this process and a portion the welding torch. Figure 1: MIG welding setup The MIG welding process operates on D.C. (direct current) usually with the wire electrode positive. This is known as ‘reverse’ polarity. ‘Straight’ polarity is seldom used because of poor transfer of molten metal from the wire electrode to the work piece. Welding currents of 50 A to 600 amperes are commonly used at welding voltages of 15V to 32 V. A stable, self correcting arc is obtained by using the constant potential (voltage) power system and a constant wire feed speed. A constant voltage, DC power source is most commonly used with MIG, but constant current systems, as well as AC, can be used. There are four primary methods of metal transfer in MIG, called globular, short‐circuiting, spray, and pulsed‐spray, each of which has distinct properties and corresponding advantages and limitations. 1.2 MIG Variables After having selected the wire and gas for the weld, operation condition must be chosen. The four important parameters are the nozzle to plate distance, wire feed rate, welding voltage and welding speed. These parameters will affect the weld characteristic to a great extent. Because these factors can be varied over a large range, they can be considered the primary adjustment in any welding operation. 1.3 Welding Voltage (V) It should be re‐emphasized that the voltage setting directly controls the arc length. In addition, a certain range is required to maintain arc stability at any given welding current level. 1.4 Nozzle to plate distance (NDP) Nozzle to plate distance (NPD) is also important in controlling the bead shape and quality. If NPD is too short, the gas nozzle is damaged due to excessive heating but if NPD too long, the shielding gas efficiency is affected along with the chances of extinguishing of arc VIVEKANAND et al. DATE OF PUBLICATION: OCT 09, 2014 ISSN: 2348-4098 VOLUME 2 ISSUE 7 SEP-OCT 2014 INTERNATIONAL JOURNAL OF SCIENCE, ENGINEERING AND TECHNOLOGY- www.ijset.in 1497
Transcript of PREDICTION AND OPTIMIZATION OF WELD BEAD GEOMETRY IN GAS METAL ARC WELDING PROCESS USING D‐OPTIMAL...
PREDICTIONANDOPTIMIZATIONOFWELDBEADGEOMETRYINGASMETALARCWELDINGPROCESSUSINGD‐OPTIMALMETHODOLOGY
VIVEKANAND1,BHUVNESHBHARDWAJ2,KULBHUSHANBHAGAT3,MOHITCHOUBISA4
1Student,DepartmentofMechanicalEngineering,SureshGyanViharUniversity,Jaipur,Email:[email protected]
2Associateprofessor,DepartmentofMechanicalEngineering,SureshGyanViharUniversity,Jaipur,Email:[email protected]
3Assistantprofessor,DepartmentofMechanicalEngineering,SureshGyanViharUniversity,Jaipur,Email:[email protected]
4Student,DepartmentofMechanicalEngineering,SureshGyanViharUniversity,Jaipur,Email:[email protected]
ABSTRACT
Metalinertgaswelding(MIG)isalsoknownasgasmetalarcwelding(GMAW).GMAW(GasMetalArcWelding)isaWeldingprocessusedavarietyofmaterialsFerrousandNon‐Ferrous.IntheGasShieldedArcweldingboththearcandmoltenmetalareshieldedfromtheatmospherebyastreamofgas.Inthisexperiment,weldingwasperformedonmildsteelandtheweldingparameterslikenozzletoplatedistance(NPD),Opencircuitvoltage(OCV),Weldingspeed,Wirefeedratewerecontrolledtoachievemaximumbeadwidth.Forthis,weusedresponsesurfacemethodology(RSM)withcentralcompositedesign(CCRD)onthedesignsoftwareDesignExpert.AfterANOVAanalysis,we foundthatbeadwidth increaseswiththe increase inNPD,OCV&Wirefeedratewhileitdecreaseswithincreaseinweldingspeed.Maximumbeadwidthis5.3mmatNPDof18mm,OCVof21V,Weldingspeedof30cm/min,Wirefeedrateof9m/min.1. INTRODUCTION
Modern industrial products which have contributed tothe prosperity ofmankind, owe their development andefficient performance to welding, which is now theuniversally accepted method of permanently joiningmetal metals and producing monolithic structuresefficiently and economically. Steels by far are themostwidelyusedandweldedmaterials,primarily,duetothefactthattheycanbemanufacturedrelativelycheaplyinlarge quantities to very precise specifications and haveanextensiverangeofmechanicalproperties.
Weldsurfacing is increasinglyemployedtoenhancethelife&toreducethecostofengineeringcomponents.Gasmetal arc welding (GMAW) cladding is extensivelyemployed in its automatic mode to obtain the goodquality stainless steel cladding. Cladding is popularlyemployedtoincreasecorrosionresistance,resistancetohigh temperature etc. at the surface of a component inorder to enhance its life and to reduce its cost bydepositingasuitablefillermaterial.
1.1MetalInertGas(MIG)Process
In Gas Metal Arc Welding (MIG), also known as MetalInert Gas (MIG) welding, an electric arc is establishedbetween the workpiece and a consumable bare wireelectrode.Thearccontinuouslymeltsthewireasitisfedtotheweldpuddle.Theweldmetalisshieldedfromtheatmospherebyaflowofaninertgas,orgasmixture.TheFigure 1 shows this process and a portion theweldingtorch.
Figure1:MIGweldingsetup
The MIG welding process operates on D.C. (directcurrent)usuallywiththewireelectrodepositive.Thisisknownas ‘reverse’polarity. ‘Straight’polarity isseldomusedbecauseofpoortransferofmoltenmetal fromthewireelectrodetotheworkpiece.Weldingcurrentsof50A to 600 amperes are commonly used at weldingvoltages of 15V to 32 V. A stable, self correcting arc isobtainedbyusingtheconstantpotential(voltage)powersystem and a constant wire feed speed. A constantvoltage,DC power source ismost commonly usedwithMIG,butconstantcurrentsystems,aswellasAC,canbeused.Therearefourprimarymethodsofmetaltransferin MIG, called globular, short‐circuiting, spray, andpulsed‐spray, eachofwhichhasdistinctpropertiesandcorrespondingadvantagesandlimitations.
1.2MIGVariables
After having selected the wire and gas for the weld,operationconditionmustbechosen.Thefourimportantparameters are the nozzle to plate distance, wire feedrate, welding voltage and welding speed. Theseparameterswillaffect theweldcharacteristic toagreatextent.Because these factorscanbevariedovera largerange,theycanbeconsideredtheprimaryadjustmentinanyweldingoperation.
1.3WeldingVoltage(V)
It should be re‐emphasized that the voltage settingdirectly controls the arc length. In addition, a certainrange is required tomaintain arc stability at any givenweldingcurrentlevel.
1.4Nozzletoplatedistance(NDP)
Nozzle to plate distance (NPD) is also important incontrolling the bead shape and quality. If NPD is tooshort,thegasnozzleisdamagedduetoexcessiveheatingbut if NPD too long, the shielding gas efficiency isaffected alongwith the chances of extinguishing of arc
VIVEKANAND et al. DATE OF PUBLICATION: OCT 09, 2014
ISSN: 2348-4098 VOLUME 2 ISSUE 7 SEP-OCT 2014
INTERNATIONAL JOURNAL OF SCIENCE, ENGINEERING AND TECHNOLOGY- www.ijset.in 1497

increases. Normally nozzle to plate distance should beapprox 1 to 1.5 the inner diameter of the nozzle beingused.
1.5Weldingspeed(S)
Theweldingspeedisthelinearratethatthearcmovingalongtheworkpiece.Parameterisusuallyexpressedasinches ormeters perminute. Three general statementscanbemaderegardingthearctravelspeed:
As thematerial thickness increases, the travelspeedmustbelowered. Foragivenmaterialthicknessandjointdesign,asthe
welding current is increased, so is the travel speed.Theconverseisalsotrue.
Higher welding speeds are attainable by using theforehandweldingtechnique.
1.6Wirefeedrate
Wirefeedrateisthespeedatwhichthewireelectrodeisfeed throughweldinggun. It isgenerally setbymanualdepends upon the quality and the types on platemetalstructure.Itisseenthatatthesameweldingspeed,wirefeed speed increase bead becomeswider and the beadcross section area will be increase. When wire feedspeed increase then penetration changes fromincomplete penetration to excessive melting. Anotherfactisthatwhenmaximizingtheobjectivefunctionvaluethewirefeedspeedwillbeoptimizeatweldingspeedof0.5m/min,1.min.and0m/1.5m/min
2. RESEARCHGAPANDOBJECTIVE1. The properties of the cladding is the significantly
influenced by dilution obtained. Hence, control ofdilution is important in cladding where a lowdilution is highly desirable. When dilution is quitelow, the final deposit compositionwill be closer tothatof fillermaterial andhence corrosion resistantpropertiesofcladdingwillbegreatlyimproved.
2. Researchershaveattempted tooptimizedilution instainlesssteelcladdingusingGMAWprocess.Whiledoing so, it was found that the optimum dilutionconditionsareachievedatlowerwirefeedrateandlower welding speed, which affects the depositionrateoftheprocess,thusdecreasingtheproductivityof this process if it is to be used for surfacingoperations.
3. Highdepositionrate in thisprocess isdesirable forcladdingoperationsbutithasbeenestablishedthatdeposition rate is achieved with a combination ofparameters.
Based upon the problem formulated as discussedabove,thefollowingobjectiveswereformulated:
1. To develop the empirical model between GMAWParameters(Wirefeedrate,opencircuitvoltage,weldingspeed and NPD) and responses (weld bead geometryparameters anddilution)during surfacing ofmild steelplatewith304stainlesssteelelectrode.
2. To find out the optimumwelding conditions for lowdilutionusingD‐optimaldesign.
3. METHODOLOGY
To achieve the following objectives D‐optimalmethodologyhasbeenselected.TheD‐optimalmethodisrelatively a new technique, related to response surfacemethodology, used for carrying out the design ofexperiments, theanalysisofvariance,andtheempiricalmodeling. The D‐optimal criterion was developed toselectdesignpointsinawaythatminimizesthevarianceassociated with the estimates of specified modelcoefficients. Inasensethismethodismoreusefulthancentral composite design (a conventional responsesurface method) method that it demands smallernumberofexperiments tobeconductedandalso it cantackle categorical factors included in the design ofexperiments. Basic steps for achieving the desireobjectivesare:
DataCollection: AccordingtodesignmatrixbasedonD‐optimaldesignmatrix,Theexperimentswillbeconducted on mild steel plate using 304 stainlesssteelelectrodes.
Empirical Modelling: Development of empiricalmodel (relationshipbetweenGMAWresponsesandtheGMAWparameters)usingregressionanalysis.
Test foradequacyofdevelopmodel:Checkingofmodel significance, model terms significance usingANOVAanalysis.ThisempiricalmodelwillhelpfulinoptimalselectionofGMAWparameters.
OptimizationofGMAWParameters:Analysisandselection of optimal GMAW parameters for a lowdilutionrate.
4. EXPERIMENTATION
4.1Introduction
This chapter discusses the detailed experimentationincluding the base material, consumables and theequipmentusedforthepresentwork.
4.2Materialsandequipments
4.2.1Basematerial
Mildsteelplatesof10mmthicknessandhavingsizeof300x100x10 mm. which were cut from the flats usingpowerhacksaw.
4.2.2Fillerwire
Theausteniticstainlesssteelsolidwireof the typeAISI304ofdiameter1.2mmwasused in thepresentwork.ThephysicalandthechemicalpropertiesoftheAISItype304areasfollows:
Table:4.1ChemicalcompositionofsolidfillerwireAISI304
VIVEKANAND et al. DATE OF PUBLICATION: OCT 09, 2014
ISSN: 2348-4098 VOLUME 2 ISSUE 7 SEP-OCT 2014
INTERNATIONAL JOURNAL OF SCIENCE, ENGINEERING AND TECHNOLOGY- www.ijset.in 1498
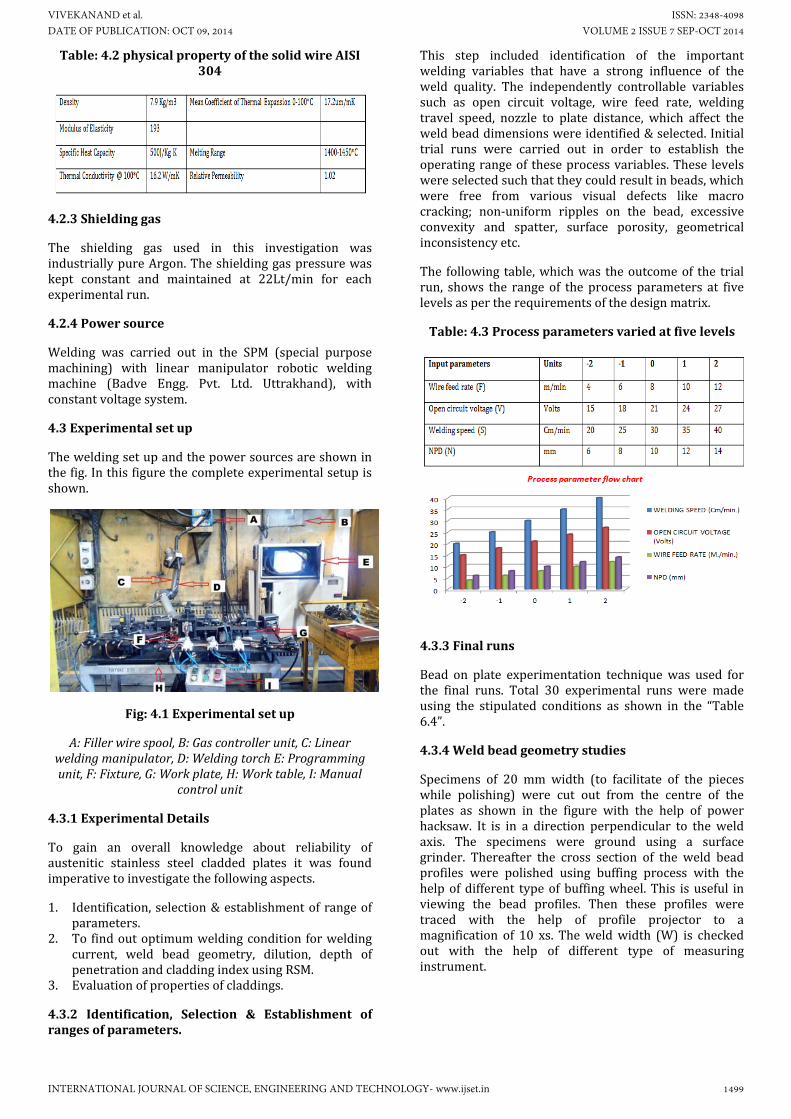
Table:4.2physicalpropertyofthesolidwireAISI304
4.2.3Shieldinggas
The shielding gas used in this investigation wasindustriallypureArgon.Theshieldinggaspressurewaskept constant and maintained at 22Lt/min for eachexperimentalrun.
4.2.4Powersource
Welding was carried out in the SPM (special purposemachining) with linear manipulator robotic weldingmachine (Badve Engg. Pvt. Ltd. Uttrakhand), withconstantvoltagesystem.
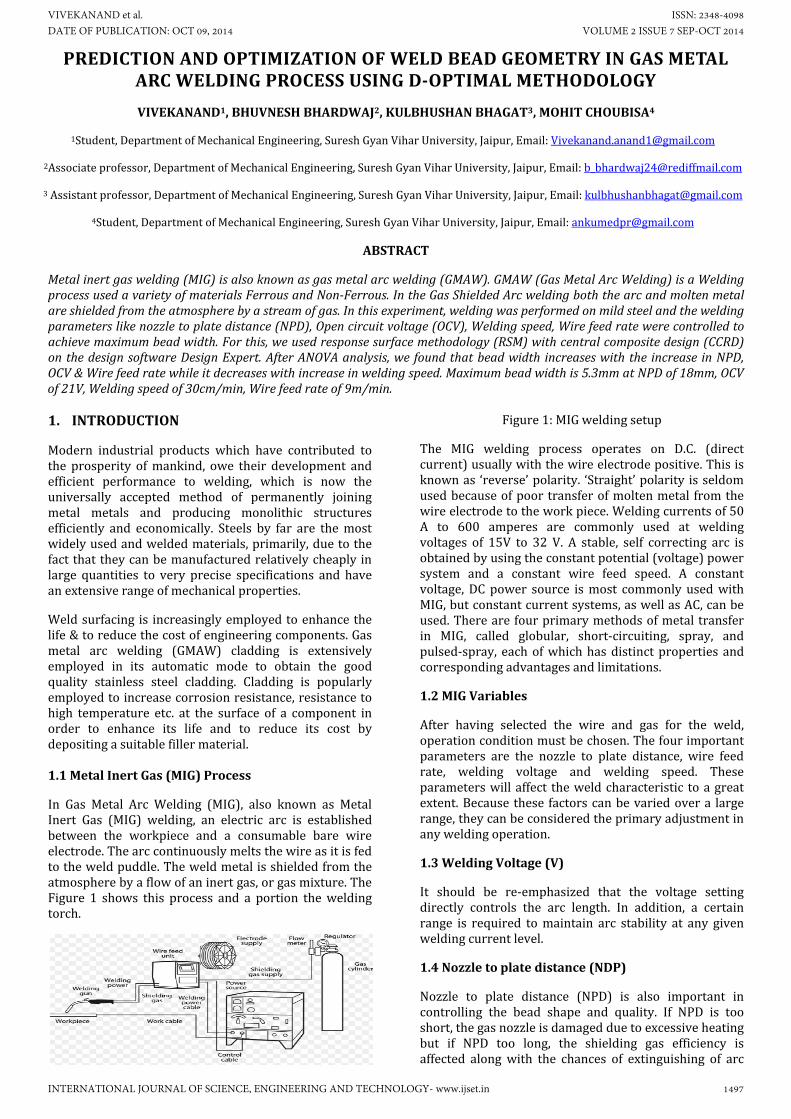
4.3Experimentalsetup
Theweldingsetupandthepowersourcesareshowninthefig.Inthisfigurethecompleteexperimentalsetupisshown.
Fig:4.1Experimentalsetup
A:Fillerwirespool,B:Gascontrollerunit,C:Linearweldingmanipulator,D:WeldingtorchE:Programmingunit,F:Fixture,G:Workplate,H:Worktable,I:Manual
controlunit
4.3.1ExperimentalDetails
To gain an overall knowledge about reliability ofaustenitic stainless steel cladded plates it was foundimperativetoinvestigatethefollowingaspects.
1. Identification,selection&establishmentofrangeofparameters.
2. Tofindoutoptimumweldingconditionforweldingcurrent, weld bead geometry, dilution, depth ofpenetrationandcladdingindexusingRSM.
3. Evaluationofpropertiesofcladdings.
4.3.2 Identification, Selection & Establishment ofrangesofparameters.
This step included identification of the importantwelding variables that have a strong influence of theweld quality. The independently controllable variablessuch as open circuit voltage, wire feed rate, weldingtravel speed, nozzle to plate distance, which affect theweldbeaddimensionswereidentified&selected.Initialtrial runs were carried out in order to establish theoperatingrangeof theseprocessvariables.These levelswereselectedsuchthattheycouldresultinbeads,whichwere free from various visual defects like macrocracking; non‐uniform ripples on the bead, excessiveconvexity and spatter, surface porosity, geometricalinconsistencyetc.
The following table,whichwas theoutcomeof the trialrun, shows the range of the process parameters at fivelevelsaspertherequirementsofthedesignmatrix.
Table:4.3Processparametersvariedatfivelevels
4.3.3Finalruns
Bead on plate experimentation techniquewas used forthe final runs. Total 30 experimental runs were madeusing the stipulated conditions as shown in the “Table6.4”.
4.3.4Weldbeadgeometrystudies
Specimens of 20 mm width (to facilitate of the pieceswhile polishing) were cut out from the centre of theplates as shown in the figure with the help of powerhacksaw. It is in a direction perpendicular to the weldaxis. The specimens were ground using a surfacegrinder. Thereafter the cross section of the weld beadprofiles were polished using buffing process with thehelpofdifferent typeofbuffingwheel.This isuseful inviewing the bead profiles. Then these profiles weretraced with the help of profile projector to amagnification of 10 xs. Theweldwidth (W) is checkedout with the help of different type of measuringinstrument.
VIVEKANAND et al. DATE OF PUBLICATION: OCT 09, 2014
ISSN: 2348-4098 VOLUME 2 ISSUE 7 SEP-OCT 2014
INTERNATIONAL JOURNAL OF SCIENCE, ENGINEERING AND TECHNOLOGY- www.ijset.in 1499

Table:4.4Experimentalruns
STD RUN NPD OCVWELDINGSPEED
WIRE FEEDRATE
BEADWIDTH
3 1 6 27 20 6 4.43
25 2 10 21 30 9 4.23
20 3 10 33 30 9 4.5
11 4 6 27 20 12 4.45
16 5 14 27 40 12 4.86
28 6 10 21 30 9 4.39
14 7 14 15 40 12 4.58
15 8 6 27 40 12 4.21
9 9 6 15 20 12 3.83
29 10 10 21 30 9 4.39
19 11 10 9 30 9 3.24
12 12 14 27 20 12 4.98
8 13 14 27 40 6 4.61
17 14 2 21 30 9 3.77
6 15 14 15 40 6 3.37
24 16 10 21 30 15 4.74
23 17 10 21 30 3 3.95
5 18 6 15 40 6 2.96
22 19 10 21 50 9 3.75
13 20 6 15 40 12 3.31
7 21 6 27 40 6 4.12
4 22 14 27 20 6 4.61
10 23 14 15 20 12 4.78
30 24 10 21 30 9 4.24
27 25 10 21 30 9 4.22
21 26 10 21 10 9 4.65
1 27 6 15 20 6 3.66
26 28 10 21 30 9 4.35
18 29 18 21 30 9 5.3
2 30 14 15 20 6 4.55
Andthereinforcementheights(R)weremeasuredbythehelpofdigitalverniercaliper(L.C.of0.01mm)andDepthgauge.Themeasuredvaluesoftheresponseswereusedtocalculateandevaluatethemodels.Theresponsesofalltheexperimentsarerecordedintable.
Themathematicalmodelsdevelopedfortheseresponsesare mentioned in the next chapter on Design ofExperiments. In the figure we can see that first one isshowing the beat of the welding created by theexperiments in total number of the thirty beats.Approximately30mmdistance is coverupbetween thetwobeatsafterexperimentalrunisoveritisfurthercutouteachbeatwiththehelpofthepartingwheelwiththehelpofgrindingm/c.andafterthatitisfurthersendfortheprocessofbuffing,themainpurposeofbuffingistobe achieve the mirror like surface it is helpful in thecategorized the mild steel and the stainless steel andeasy for the measuring the responses like depth ofpenetration, area of penetration and the area of thedilution with the help of some of the instruments it isgivenbelow;
Digitalverniercaliper Depthgauge Tracepaper
5. DESIGNOFEXPERIMENTS
5.1Introduction
The use of robotic& automaticwelding system for thefabrication industries has helped in improvingproductivity, quality & tackled such problems asshortage of skilledwelders & stringent health & safetyrequirement.Tomakeeffectiveuseofsuchsystem, it isessentialtoselecttheweldingprocedures¶metersthatwouldensureanadequateweldbeadquality.Ahighqualityweld can be obtained once the variousweldingvariables are in proper balance. To find the desiredbalance,thecombinedeffectofdifferentvariablesontheweld bead dimensions must be determined & the bestcombinationofthehighlevelofthevariablesbeselectedthat ensures the high quality weld. Therefore, it isnecessarytopredictthecombinedeffectoftheseprocessvariableson the resultingweldbeadgeometry&shaperelationinonewayortheother,asthesedimensionsinaddition to the type of micro structure of the welddeterminestresscarryingcapacityoftheweldjoint.
Mathematicalmodeling that canbeapplied in a varietyoffieldforinvestigationswasadoptedtoaccomplishtheaimofpredicting the effect ofwelding variableson theweld bead geometry dimensions because through thismethod the research becomesmore economical, fast &versatile. The statistical technique of central compositerot able design has been employed to conduct theexperiments on the basis on which such mathematicalmodelsorequationscouldbedeveloped.Thedevelopedmathematicalmodels or equations inwhich the data isrepresented can be programmed and fed to thecomputer to develop the expert welding systems. Thedesign of experiments, the procedures for developingmathematicalmodelsforweldbeadgeometrypredictionand the procedures for testing the significance ofcoefficientandadequaciesofsuchmathematicalmodelsarecoveredinthischapter.Aftertestingtheadequaciesofthemodelsanddroppingtheinsignificantcoefficients,the final mathematical models were used to showgraphically the relationship between the weldingvariables and the weld bead dimensions. Finally, theoptimized welding parameters were obtained using
VIVEKANAND et al. DATE OF PUBLICATION: OCT 09, 2014
ISSN: 2348-4098 VOLUME 2 ISSUE 7 SEP-OCT 2014
INTERNATIONAL JOURNAL OF SCIENCE, ENGINEERING AND TECHNOLOGY- www.ijset.in 1500

RSM, which were used to achieve good quality weldcladdings.
5.2Designofexperiment
Experimentaldesignisanimportanttool.Inwhichitaddthe experiments design and it is, helpful in thecomplexities of technical investigation. This is anorganizedapproachtothecollectionofinformation.Thedesign experiment is the procedure of selecting thenumber of trials and conditions for running them,essentialandsufficientforsolvingtheproblemthathasbeensetwiththerequiredprecision.
Among the various research techniques the generalquantitativeapproachistakeninused.Thisisbasedonamore sound logic. Than others were selected fordesigning the experiments. One of the importantstaticallytechniquethathavebeenrecommendedforthedesignof experiments in the engineering investigationsis a method known as factorial technique of designingthe experiments. This technique is the one that isselectedforexperimentsinthepresentwork.
The concepts related to this technique are explainedbelow:
5.3Terminology
5.3.1Factor
One of the independent variables that can be set to adesired value is called a factor. Factors are under thedirect control of the experimenter during theexperimental run. There are quantitative factors thathave numerical values and qualitative factors likeelectrodepolarityorthetypeofspeedandshieldinggas.
5.3.2Level
It is the numerical value or qualitative future of eachfactor.Thelevelofafactorisitsvalueorsettingduringtheexperimentalrun.
5.3.3Treatment
The specific combination of the level, one from eachfactor,whichtested,istermedascombination.
5.3.4Response
Itisthenumericalresultofanobservationmadewithaparticular treatment combination. In our experimentalworkresponseistakenasthebeadwidth.
5.4Centralcompositerotatabledesign
Cochran and Cox have developed the new designs,specificallyforfittingthesecondorderresponsesurfacescalled central composite rotatable designs which areconstructed by adding further treatment combinationsto thoseobtained froma2k factorial.The totalnumberof treatments combinations is reduced significantly byemploying these designs. Central composite rotatabledesignsforanynumberkorX‐variablescanbebuiltupfromthefollowingthreecomponents:
1. Thepointsthatconstitutethe2kfactorial.
2. The extra 2k point to from a central compositedesignwithα.Thevalueofαmustbe2k/4inordertomakethedesignrotatable.Thesearecalledthestarpoint.With5X‐variables,thesizeoftheexperimentis reduced by using a half replicate in the 2k‐1factorial.With the half replicateα becomes 2 (k‐1)/4,theadditionalfactorcombinationsintroducedbytheextra 2k points are formed by keeping one of thefactorat–αlevelwhilekeepingtheremainingofthefactorat0levelandagainkeepingthatfactorat+αlevelwhilekeepingtherestofthefactoratthesame0leveltillallthefactorshavebeendesigned–αand+α.
3. By rotatable design, we mean that the standarderrorof theestimatedresponseatanypointonthefittedsurfaceisthesameforallpointsthatareatthesame distance from the centre of the region. Asmentionedthevalueofαmustbeselectedproperlytomakethedesignrotatable.
4. All factorsareattheir0 levelonthesepoints.Oncethe operating ranges of the factor are established,theupperandthelowerlimitsarecodedas+2and‐2levelrespectively.Therangesfrom+2and‐2levelare divided into four equal parts forming theintermediatelevelof‐1,0,+1with0levelbeingthecentrepoint.Thisasdonetofacilitatetheformationof the design matrix which shows the differentcombinations of the factors according towhich theexperimentalrunaretobecarriedoutrandomlytoavoidedsystematicerrors.
5.5Factorandtheirlevel
Thevariousfactorandtheirlevelsaregiveninthetable:5.1
5.6Developmentofdesignmatrix
Design matrix was developed for four variable factors,which were taken into account for bead geometryprediction. The various input variables and theresponses taken for these experimental studies are asfollow:
5.6.1Inputvariables
Nozzletoplatedistance[NPD]N Weldingspeed[S] Opencircuitvoltage[V] Wirefeedrate[F]
5.6.2Inputconstants
Baseplatethickness=[300x100x10]mm Torchangle=90* Shieldinggas=99.9%pureArgon Shieldinggasflowrate=22Lt/min. Weldingposition=flat Weldingmode=Automatically
VIVEKANAND et al. DATE OF PUBLICATION: OCT 09, 2014
ISSN: 2348-4098 VOLUME 2 ISSUE 7 SEP-OCT 2014
INTERNATIONAL JOURNAL OF SCIENCE, ENGINEERING AND TECHNOLOGY- www.ijset.in 1501

5.6.3Responseparameters
Beadwidth(W)
5.6.4Forfour[4]factor[F=4]
The total number of factor is taken as F=4. So totalnumber of run is created by the 2F stations is sixteen.Next eight runs is created by 2F is 17 to 24. From runnumber 25 to 30 is create by the center point. And sobecausethereare30numberofrunistoberequiredforthe trial of design [CCRD] the corresponding levelsfactorsofaccordanceistobetakenas[‐2,‐1,0,+1,+2.].OneestimatedvalueofA0fortheaverageinfluenceofallthe parameter is providedby design for four [4] factori.e. A1, A2, A3, A4 are the estimated formain effects, A11,A22,A33, A44 are the four effects forquadratic effect andA12,A13,…….A34aretheeffectsfortwofactorinteraction.X0whichhasforcalculationofA0isavirtualvariable.
5.6.5Expeditionsofthemathematicalmodels
Mathematical model gives an account of theacknowledgement to the rate of the standard one orlargeresponse isanessentialaid inthe investigationofthe results from an investigated design models. Thereare a lot of experts gives opinion that the quadraticrelations ismostly sufficient and so becausemaximumnumber of layer design in above literature review aretakenasquadraticequation.
And hence, these are second‐degree polynomialconsanguinity the reaction or the variables is to besimulated.
R=A0+∑ ∑ ∑
J=2,****************,k
Here,
R‐ Response variable e.g. bead height, bead width,dilutionetc.
Zi, Zj‐ Independent factoras likewire feed rate,nozzletoplatedistancegasflowrateetc.
A0,Ai,Aii,Aj,Aij–Regressioncoefficient.
K‐Factornumber
The equationmay be explained for the Four [4] factorvariablesasgivenbelow:
R = A0 + A1Z1 + A2Z2 + A3Z3 + A4Z4 + A11Z12 +********************+A34Z3Z4
Amodelmaybeexpressedinthenotationofthematrixas:
R=AZ+€
Where
R=Response.
€=Error.
6. RESULTSANDDISCUSSION
Introduction:
From the last chapter, we discussed about theexperiment performed, observations taken and designmatrix.With thehelpofdesignsoftware,designexpert,we got the designmatrix for our response beadwidth.Design matrix provides us the ANOVA table whichindicates the significance of themodel In ANOVA tablesometermsaresignificantandsomearenon‐significant.TermswhichhasP‐value(probability>F)lessthan0.05are significant terms for the response and termswhichhasP‐value>0.1arenonsignificanttermswhicharenotsuited for themodel. In themodel, lackof fit shouldbenon‐significant.Our experimental studywasperformedat the 95%confidence level. The regression analysis ofvarianceisshownbelow‐
ANOVAfortheresponseofbeadwidth(manual)
Table‐ANOVAforbeadwidth
Response‐‐Beadwidth
ANOVAforResponseSurfaceQuadraticmodel
Analysisofvariancetable[Partialsumofsquares‐ TypeIII]
Squares Mean F p‐value
Source Squares df Square Value Prob>F
Model 8.514178 14 0.608156 34.27409 <0.0001 significant
A‐NPD 2.961038 1 2.961038 166.8765 <0.0001
B‐OCV 2.502604 1 2.502604 141.0403 <0.0001
C‐weldings. 1.071038 1 1.071038 60.36092 <0.0001
D‐wirefeedrate 0.759704 1 0.759704 42.81498 <0.0001
AB 0.174306 1 0.174306 9.823453 0.006823
AC 0.004556 1 0.004556 0.256779 0.619709
AD 0.127806 1 0.127806 7.202832 0.017002
BC 0.232806 1 0.232806 13.12036 0.002509
BD 0.094556 1 0.094556 5.328947 0.035637
CD 0.077006 1 0.077006 4.339874 0.054753
A^2 0.076503 1 0.076503 4.311494 0.055458
B^2 0.352953 1 0.352953 19.89151 0.000458
C^2 0.026253 1 0.026253 1.479534 0.242642
D^2 0.000774 1 0.000774 0.043627 0.83736
Residual 0.266158 15 0.017744
Lack ofFit 0.232625 10 0.023263 3.468564 0.091129
notsignificant
PureError 0.033533 5 0.006707
VIVEKANAND et al. DATE OF PUBLICATION: OCT 09, 2014
ISSN: 2348-4098 VOLUME 2 ISSUE 7 SEP-OCT 2014
INTERNATIONAL JOURNAL OF SCIENCE, ENGINEERING AND TECHNOLOGY- www.ijset.in 1502

CorTotal 8.780337 29
Std.Dev. 0.133206 R‐Squared 0.969687
Mean 4.234333 AdjR‐Squared 0.941395
C.V.% 3.14586Pred R‐Squared 0.841896
PRESS 1.388208 AdeqPrecision 25.07759
From the ANOVA table shown below, we found thatinteractionofnozzletoplatedistanceandweldingspeed(AC), quadratic term of factor welding speed (C2),quadratic term of wire feed rate (D2) were non‐significant. Lack of fit was found non‐significant whichwas good for our model. Then, we applied backwardeliminationtoeliminatenon‐significantterm.
Finalequationintermsofcodedfactor
Beadwidth=+4.30+0.35*A+0.32*B‐0.21*C+0.18*D‐0.10 * AB + 0.017 *AC +0.089 *AD +0.112 * BC ‐0.077*BD + 0.069 *CD + 0.053 *A2 ‐0.11 * B2 ‐0.031 *C2+5.313E‐003*D2
Finalequationintermsofactualfactors:
Beadwidth=+2.07219+0.033437*NPD+0.20778*OCV‐0.069813 *welding speed–5.48611E‐003 *wire feedrate – 4.34896E‐003* NPD * OCV+ 4.21875E‐004*NPD*welding speed+7.44792E‐003*NPD *wire feedrate+2.01042E‐003*OCV*weldingspeed‐4.27083E‐003 * OCV * wire feed rate +2.31250E‐003 * weldingspeed*wirefeedrate+3.30078E‐003*NPD2‐3.15104E‐003* OCV2‐3.09375E‐004 *welding speed2 + 5.90278E‐004*wirefeedrate2
Theequationintermsofcodedfactorsexhibitsthattheequation is quadratic which is used to predict theresponse that is bead width in our case where higherleveloffactoriscodedas+1Andlowerleveloffactoriscoded as ‐1.the coded equation is useful for identifyingthe relative impact of each factor by comparing thefactorcoefficient.
ANOVA for the response of bead width withbackwardelimination
Table‐ANOVAresponsesurfacequadraticmodel
Response‐‐Beadwidth
BackwardEliminationRegressionwithAlphatoExit=0.100
ForcedTerms‐Intersept
Removed F‐valuep‐value
R‐Squared MSE
Prob>F
D^2 0.043627 0.837 0.969687 0.017744
AC 0.273103 0.608 0.969599 0.016683
C^2 1.761473 0.202 0.96908 0.01597
ANOVAforResponseSurfaceReducedQuadraticmodel
Analysisofvariancetable[Partialsumofsquares‐TypeIII]
Sumof Mean F p‐value
Source Squares df Square Value Prob>F
Model 8.480717 11 0.770974 46.31724 <0.0001 significant
A‐NPD 2.961038 1 2.961038 177.888 <0.0001
B‐OCV 2.502604 1 2.502604 150.3471 <0.0001
C‐weldingspeed 1.071038 1 1.071038 64.34391 <0.0001
D‐wirefeedrate 0.759704 1 0.759704 45.64017 <0.0001
AB 0.174306 1 0.174306 10.47166 0.004585
AD 0.127806 1 0.127806 7.678119 0.012596
BC 0.232806 1 0.232806 13.98612 0.0015
BD 0.094556 1 0.094556 5.680584 0.028377
CD 0.077006 1 0.077006 4.626246 0.045319
A^2 0.089252 1 0.089252 5.361899 0.032583
B^2 0.345646 1 0.345646 20.76511 0.000244
Residual 0.299619 18 0.016646
Lack ofFit 0.266086 13 0.020468 3.051911 0.112629
notsignificant
PureError 0.033533 5 0.006707
CorTotal 8.780337 29
Std.Dev. 0.129017
R‐Squared 0.965876
Std.Dev. 0.129017
Mean 4.234333Adj R‐Squared 0.945023 Mean 4.234333
C.V.% 3.046938
Pred R‐Squared 0.873548
C.V.% 3.046938
PRESS 1.110287
AdeqPrecision 28.50553
PRESS 1.110287
VIVEKANAND et al. DATE OF PUBLICATION: OCT 09, 2014
ISSN: 2348-4098 VOLUME 2 ISSUE 7 SEP-OCT 2014
INTERNATIONAL JOURNAL OF SCIENCE, ENGINEERING AND TECHNOLOGY- www.ijset.in 1503

After eliminationwe found that From theANOVA tableshown that interaction of nozzle to plate distance andwelding speed (AC), quadratic term of factor weldingspeed (C2), quadratic term of wire feed rate (D2) wereremoved from the table with the help of backwardelimination regression method. The value of pre‐ R‐SquaredandAdjR‐Squaredisgreaterthan0.8andtheirdifference is less than 0.2which is good for fitting themodal.AdeqPrecisionratioshouldbegreaterthan4andour value is 28.506 that are good. The value of pre‐ R‐SquaredandAdjR‐Squaredisgreaterthan0.8andtheirdifference is less than 0.2which is good for fitting themodal.AdeqPrecisionratioshouldbegreaterthan4andour value is28.506 that are good. It is helpful to knowabout the standard division of the work and themeanvalue as well as in the press of the work. It can besuitabletoknowabouttheadequationprecisionofthework.Asthelackoffitvalueis0.1126inourcasewhichshowsitisnotsignificantandnon‐significantlackoffitisgood for our model. As the lack of fit F‐ value is 3.05which isnotsignificantandnon‐significant lackof fit isagaingood.
Finalequationintermsofcodedfactors:
Beadwidth=4.28+0.35*A+0.32*B–0.21*C+0.18*D–0.10*AB+0.09*AD+0.12*BC–0.077*BD+0.09*CD+0.056*A2–0.11*B2.
Finalequationintermsofactualfactors:
Beadwidth=2.20988+0.042090*NPD+0.20404*OCV‐0.084156*weldingspeed+5.13889E–003*wirefeedrate – 4.34896E ‐003 *NPD *OCV+7.44792E– 003 *NPD*wirefeedrate+2.010428–003*OCV*weldingspeed – 4.27083E – 003 * OCV * wire feed rate +2.31250E – 003 * welding speed * wire feed rate +3.50098E–003*NPD2–3.06207E–003*OCV2.
Theequationintermsofcodedfactorsexhibitsthattheequation is quadratic which is used to predict theresponse that is bead width in our case where higherleveloffactoriscodedas+1Andlowerleveloffactoriscoded as ‐1.the coded equation is useful for identifyingthe relative impact of each factor by comparing thefactorcoefficient.
ANOVAanalysisforbeadwidth:
There are different types of plots are shown whichrepresents the comparability study of our inputparametersandtheresponseof theexperimentalwork.By thehelpof thiswe caneasily study the solutionsofthisexperimentalwork.
Figure:Normalplotofresidualsforbeadwidth
Normal probability plot describes us whether theresidual follows the normal distribution or not. In ourcase,plotindicatesstraightlineexceptsomepointslaysoutsidearoundstraightlinethusitshowsthaterrorsaredistributednormally.
Figure:plotofresidualv/spredicted
Thegraphwhichisshownaboveindicatesthatvalueofbead width is scattered that is point are distributedrandomly around the zero level which is essentialqualification for a good model. Thus, it fulfills therequirementsandfitsthemodel.
Figure:Predictedv/sActualplotforbeadwidth
Itistheplotthatindicateshowwellthepredictedvaluesmatch with the actual one. The data points should bedistributed evenly around the 45° line. And the figureshowsthatitiscorrectinourcase.
Figure:Box‐CoxPlotforpowertransformforbeadwidth
Itprovidestheguidelinesforpowertransformationandthe value of λ is good in our casewhich gives us 95%confidencelevelwhichisbestsuitedforourmodal.
VIVEKANAND et al. DATE OF PUBLICATION: OCT 09, 2014
ISSN: 2348-4098 VOLUME 2 ISSUE 7 SEP-OCT 2014
INTERNATIONAL JOURNAL OF SCIENCE, ENGINEERING AND TECHNOLOGY- www.ijset.in 1504

Effectofweldingparameterson the responseBeadWidth:
We employed response surface methodology to studythe effect of welding parameters – NPD (nozzle platedistance),OCV(opencircuitvoltage),weldingspeed,wirefeed rate in MIG welding on mild steel plate for theresponseofBeadWidth.
EffectofNPDonbeadwidthFrom the graph shown below, we found that the beadwidth increases linearly with respect to the nozzle toplate distance as the NPD increase, arc length increasewhichresultsinwiderbead.
Figure:onefactorplotofbeadwidthv/sNPD
EffectofOCVonbeadwidth:
Fromthegraph,it isalsoseenthatbeadwidthincreasewith the increase in open circuit voltage. In our case,rangesofconstantfactorsare‐
NPD=10mm
weldingspeed=30mm/min
andwirefeedrate=9m/min
Wecanseeinthegraph,beadwidthincreaseswithopencircuit voltage (OCV) at the bottom level of point3.85mm to the top level of the point 4.5mm. Graph isshownbelow‐
Figure:beadwidthplotrelativetoOCV&NPD
EffectofWirefeedrateonbeadwidth:
Fromthegraphshownbelow,wefoundthatbeadwidthincreasewithwirefeedrateandthevalueofbeadwidth
ranges fromminimumvalueof2.96 tomaximumvalueof5.3forthewirefeedrateofrange6‐12m/min.
Figure:plotofbeadwidthv/swirefeedrate
Effectofweldingspeedonbeadwidth:
From the graph, it is found that when we increaseweldingspeed,beadwidthdecrease.Inourcase,fortheweldingspeedrangeof20‐40cm/min,beadwidthcomesouttobe2.96to5.3mm.
Figure:plotofbeadwidthv/sweldingspeed
Interactioneffectofinputparameters:
1. InteractioneffectofNPD&OCVonbeadwidth:
FromthegraphA&B,wefoundthatwhenopencircuitvoltage(OCV)andnozzleplatedistance increases,beadwith increases with respect to both of them. For this,constantdesignvaluesare–weldingspeed=30cm/min,wirefeedrate=9m/min.
Figure:plotofInteractioneffectofNPD&OCV
2. InteractioneffectofNPD&wirefeedrate:Fromtheplot,wefoundthatwhenNPD(nozzletoplatedistance) increaseandwire feedrate increases.Bothof
VIVEKANAND et al. DATE OF PUBLICATION: OCT 09, 2014
ISSN: 2348-4098 VOLUME 2 ISSUE 7 SEP-OCT 2014
INTERNATIONAL JOURNAL OF SCIENCE, ENGINEERING AND TECHNOLOGY- www.ijset.in 1505

the factors contribute to increase beadwidth. For this,the constant design values are – OCV=31V, weldingspeed=30cm/min.
Figure:InteractionplotofNPD&wirefeedrate
3. InteractioneffectofwirefeedrateandNPD:From the graphwe found thatwhenOCV (open circuitvoltage)increasesandweldingspeedratealsoincreases.Bothof thesefactorscontributeto increasebeadwidth.For this, constant design values are‐ NPD=10mm, wirefeedrate=9m/min.
Figure:InteractionplotofOCV&weldingspeed
4. InteractioneffectofOCV&weldingspeed:As shown in the plot belowwe found that as the opencircuit voltage (OCV) increase and welding speedincrease. Both the factors contribute to increase beadwidth.Forthis,constantdesignvaluesofNPD=10mm&welding speed =30cm/min. The D‐ 6.00 represent theblack linewhileD+ 12.00 represent the red line in thegraphwhich increase frombottom level to top level ofbeadwidth.
Figure:plotofinteractioneffectofOCVandwirefeed
rate5. Interactioneffectofweldingspeedandwirefeed
rateAs shown in the plot below, we found that as weldingspeed increase andwire feed rate increase.Bothof thefactors contribute to decrease bead width. For thisconstantdesignvaluesofOCV=21V,NPD=10mm.
Figure:plotofinteractioneffectofweldingspeed&wire
feedrateEffecton3Dsurface1. 3D surface view of wire feed rate & welding
speedfactorsonbeadwidth:Fromthe3D‐Surfaceshownbelow,wefoundthatasthewire feed rate increases, beadwidth increases sharply.But beadwidth decreaseswith welding speed. For therange of wire feed rate =6‐12m/min, maximum beadwidth found to be 4.6mm. And for the welding speedrange = 20‐40cm/min, we had constant values‐ NPD=10mm,OCV=21V.
Figure:3Dsurfaceofbeadwidthv/swirefeedrate&
weldingspeed2. 3D surface view of wire feed rate and OCV
factorsonbeadwidth:
Asshowninthefigurebelow,wefoundthatasthewirefeed rate increases, bead width increases. Similarly,when OCV increases beadwidth increases sharply. Forthis, wire feed range of 6‐12m/min and OCV range of15‐27V,wehadconstantdesignvalues‐
NPD=10mm,weldingspeed=30cm/min.
Figure:3Dsurfaceofbeadwidthv/swirefeedrate&
OCV3. 3D surface view of NPD& OCV factors on beadwidth:
VIVEKANAND et al. DATE OF PUBLICATION: OCT 09, 2014
ISSN: 2348-4098 VOLUME 2 ISSUE 7 SEP-OCT 2014
INTERNATIONAL JOURNAL OF SCIENCE, ENGINEERING AND TECHNOLOGY- www.ijset.in 1506

Asshown in the3Dsurfacebelow,we foundthatastheOCV increase, bead width increases sharply. Similarlywith NPD, bead width also increases for the constantdesignvaluesofweldingspeed=30m/minandwirefeedrate=9cm/min.
CUBE:1. CuberepresentationofOCVasB,weldingspeed
asC,wirefeedrateasDrelativetotheresponsebeadwidth:
From the cube shown below, we found that when thevalue of OCV increases from 15to 27V, bead widthincreases from 3.99 to 4.54. But there is different caseforC&D.For welding speed(C) increases from 20‐40cm/min,beadwidthdecreases3.99to3.18.Forwirefeedrate(D)increasesfrom6‐12m/min,beadwidthincreases4.54to4.61.HeretheconstantdesignvalueisofNPD=10mm.
Figure:cubeofOCV,weldingspeed,wirefeedrate
2. CuberepresentationofNPDasA,OCVasB,wirefeedrateasDrelativetoresponsebeadwidth:
As shown in the cube below,we found thatwhenNPDincreasesfrom6‐14mm,beadwidthincreasesfrom3.27to 4.01mm. Similarly, for OCV increases from 15‐27V,bead width increases from 3.27 to 4.28mm and beadwithalsoincreasesfrom4.01to4.70mmwhenwirefeedrate vary from 6‐12m/min. Constant design value isweldingspeed(C)=30cm/min.
Figure:cubeofNPD,OCV,wirefeedrate
Optimizationofresponse:Fromthisexperimentalstudy,wefoundthatbeadwidthhasdifferentvaluesatdifferentvaluesof factors. Ithasmaximum and minimum values at differentcombinations of design parameters with differentdesirability. To optimize the design parameters and togetmaximumbeadwidth,were‐experimentedtheworktoachievetheerrorsintheactualresult.For this, we performed the experiment for 4 differentcombinationorrunwhichareasfollows‐
Table:runtableselectedforoptimization
RUN NPD OCV W.S W.F.R B.W DESIRA.
1 14 21.83 20.02 12 5.09474 0.912
2 14 19.69 20 12 5.08423 0.908
3 13.95 20.72 20 12 5.08664 0.909
4 14 21.48 20.21 12 5.09239 0.911
When, we performed the experiment again foroptimization,wefounddifferentsolutionforeachoftherun with some errors which was shown below by thetable‐
Table:finalobservationtableafteroptimization
RUN NPD OCV W.S W.F.R B.W1 B.W.2 %ERRORS
1 14 21.83 20.02 12 5.09474 4.84 5
2 14 19.69 20 12 5.08423 4.83002 5
3 13.95 20.72 20 12 5.08664 4.83231 5
4 14 21.48 20.21 12 5.09239 4.83777 5
From the above table, we found that out of the 4 runperformed for optimization, we found each of the runwith5%errorbut the first rungaveusmaximumbeadwidthwithsameamountoferrori.e.5%.Whichrevealedthat we performed this experimental study on95%confidencelevel.Theoptimumorbestresultis–Beadwidth=4.840003mmInputvariables‐ NPD=14mm OCV=21.83V Weldingspeed=20.02cm/min
Wirefeedrate=12m/min
7. CONCLUSIONS
In this experimental study, we used stainless steelAISI304 as wire electrode for coating mild steel plateusing MIG (metal inert gas welding) welding processwith the input parameters – nozzle to plate distance,opencircuitvoltage,weldingspeedandwirefeedratetocalculate and statistical study the bead width as ourresponse. We used response surface methodology andcentralcompositedesignindesignexpertsoftware.Andwith the help of this experimental work, we founddifferenteffectsonthebeadwidth.Thefollowingeffectsarefoundinthisexperimentalstudy‐
VIVEKANAND et al. DATE OF PUBLICATION: OCT 09, 2014
ISSN: 2348-4098 VOLUME 2 ISSUE 7 SEP-OCT 2014
INTERNATIONAL JOURNAL OF SCIENCE, ENGINEERING AND TECHNOLOGY- www.ijset.in 1507

1. A three level four factor central composite rotabledesign was used to study the effect of weldingparametersonbeadwidthforcoatingstainlesssteelcoating on mild steel using response surfacemethodologyapproach.
2. We found that bead width increases with theincreaseinNPD(nozzletoplatedistance).
3. Similarly,beadwidthincreaseswiththeriseinOCV(opencircuitvoltage).
4. Beadwidth also increasewith the increase inwirefeedrate.
5. Butthebeadwidthdecreasewiththeriseinweldingspeed.
6. Minimumbeadwidth is 2.96mmwhich is found atthefollowingconditions‐NPD=6mm,OCV=15V,Weldingspeed=40cm/min,Wirefeedrate=6m/min.
7. Maximum bead width is 5.3mm which is found atfollowingconditions‐NPD = 18mm, OCV = 21V, Welding speed=30cm/min,Wirefeedrate=9m/min.
8. ThebestresultafteroptimizationBeadwidth=4.840003mmInputvariables‐
NPD=14mm OCV=21.83V Weldingspeed=20.02cm/min Wirefeedrate=12m/min9. The error found in our experiment was 5% so we
can say that we have worked on 95% confidencelevel.
8. FUTURESCOPE
1. Asitishelpfulforthecorrosionresistancesoitcan
beusedforcoatingthemateriallikeinconel.2. Thus, we can also implement MIG welding on
different combination of base metals and wireelectrodes.
3. Wecanalsochangethediameterofwireelectrodetoobtainbestbeadwidth.
4. We can also check the effect of these weldingparametersforthedilution,penetration,height,etc.
REFERENCES
1. Avery,R.E.andParsons,D.1995,“Weldingstainlessand 9% Nickel steel cryogenic vessels”, WeldingJournal,1,45‐49.
2. Correia,D.S.,Gonccalves,C.V.Ferraresi,V.A.2005,“Comparison between GA and RSM in GMAWwelding optimization”, Journal of materialsprocessingtechnology160,70‐76.
3. Ei‐Hebeary, M.R. Rittinger, J. 1998, “Factorsaffectingtoughnessofausteniticclad layers”, Int.conference on welding technology, University ofRoorkee,India,2,87‐92.
4. Gautam,D.K.andBreazu,M.1998,“SomeaspectsofMIG stainless steel cladding”, Int. conference onwelding technology,UniversityofRoorkee, India,1,145‐151.
5. Gunaraj,V.andMurugan,N.2005,“Effectofprocessparameters on angular distoration of gasmetalarc welded structured steel plates”, WeldingJournal,AWS,1,165‐171.
6. Gunarj, V. andMurugan,N. 2005. “Predictionandcontrol of weld bead geometry and shaperelationshipsinsubmergedarcweldingofpipes”,Journal of materials processing Technology, 168,478‐487.
7. Haragopal, G., Reddy, P.V.R. , Reddy,G. C.M. andSubrahmanyam,J.V.,2011,“ParametricdesignforMIG welding of Al‐65032 alloy using TaguchiTechnique”, Journal of Scientific and IndustrialResearch,70,844‐858.
8. Ibrahim, I. A., 2013, “The Effect of GasMetal ArcWelding (GMAW) processes on differentweldingparameters”, International Symposium on RoboticsandIntelligentSensors,7,342‐347.
9. Kumar, P.,2013, “ParametricOptimization of GasMetal Arc Welding of Austenitic Stainless Steel(AISI 304) & Low Carbon Steel using Taguchi’stechnique”, International Journal of EngineeringResearchandManagementresearch,3(4),18‐22.
10. Luksa,K.2005,“Influenceofweldimperfectiononshort circuit GMAW arc stability”, Journal ofMaterialsProcessingTechnology,160,184‐191.
11. Murugan, N. and Parmar, R.S. May 1997, “Effect ofwelding condition on microstructure andpropertiesofType316Lstainlesssteelsubmergedarc cladding”,welding research supplement, AWS,1,210‐220.
12. Murugan,N.andParmar,R.S.1997,“Stainlesssteelcladding deposited by Automatic Gas Metal ArcWelding”,WeldingJournal,AWS,1,391‐403.
13. Shahi, A.S. & Pandey, S. 2003, “ Hot cracking inausteniticstainlesssteels‐AReview”, internationalwelding,2,325‐331.
VIVEKANAND et al. DATE OF PUBLICATION: OCT 09, 2014
ISSN: 2348-4098 VOLUME 2 ISSUE 7 SEP-OCT 2014
INTERNATIONAL JOURNAL OF SCIENCE, ENGINEERING AND TECHNOLOGY- www.ijset.in 1508