Weld strength mismatch effects - multipass weld evaluation
110
British Steel plc Swinden Technology Centre Moorgate Rotherham S60 3AR United Kingdom Brite-Euram Project No.: BE95-1426 Contract No.: BRPR-CT95-0024 Task No.: 1 Sub-Task No.: 1.3 Date: 24/3/99 Contributing Organisations: British Steel Document No.: SINTAP/BS/24 STRUCTURAL INTEGRITY ASSESSMENT PROCEDURES FOR EUROPEAN INDUSTRY SINTAP SUB-TASK 1.3: WELD STRENGTH MISMATCH EFFECTS - MULTIPASS WELD EVALUATION Reported By: British Steel plc Author: P.L. Harrison
-
Upload
khangminh22 -
Category
Documents
-
view
1 -
download
0
Transcript of Weld strength mismatch effects - multipass weld evaluation

British Steel plcSwinden Technology CentreMoorgateRotherham S60 3ARUnited Kingdom
Brite-Euram Project No.: BE95-1426Contract No.: BRPR-CT95-0024Task No.: 1Sub-Task No.: 1.3Date: 24/3/99Contributing Organisations: British SteelDocument No.: SINTAP/BS/24
STRUCTURAL INTEGRITY ASSESSMENT PROCEDURES
FOR EUROPEAN INDUSTRY
SINTAP
SUB-TASK 1.3:
WELD STRENGTH MISMATCH EFFECTS -
MULTIPASS WELD EVALUATION
Reported By: British Steel plc
Author: P.L. Harrison

BRITE-EURAM SINTAP S454 BRPR-CT95-0024Contribution to BE95-1426 Task 1 Sub-Task 1.3 24/3/99 CONFIDENTIAL
INITIAL CIRCULATION
The contents of this report are the exclusive property of British Steel plc and are confidential. The contents must not be disclosed to any other party without British Steel’s previous written consentwhich (if given) is in any event conditional upon that party indemnifying British Steel against all costs, expenses and damages claims which might arise pursuant to such disclosure.
Care has been taken to ensure that the contents of this report are accurate, but British Steel and its subsidiary companies do not accept responsibility for errors or for information which is bound to bemisleading. Suggestions for or descriptions of the end use or application of products or methods of working are for information only and British Steel and subsidiaries accept no liability in respectthereof. Before using products supplied or manufactured by British Steel or its subsidiary companies the customer should satisfy himself of their suitability. If further assistance is required, BritishSteel within the operational limits of its research facilities may often be able to help.
COPYRIGHT AND DESIGN RIGHT - © - BRITISH STEEL, 1999
EXTERNAL CIRCULATION
GKSS
Dr M. KoçakDr U. Zerbst
NE
Dr R. AinsworthDr Y.J. Kim
RUG
Prof. R. Denys
AEA
Dr G. Wardle
TWI
Dr C.S. WiesnerDr H.G. Pisarshi
VTT
Prof. K. Wallin
IDS
Mr J-Y. Barthelemy
SHELL
Dr R. Koers
University of Cantabria
Prof. F. Gutierrez-SolanaDr J. Ruiz-Ocejo
IWM
Dr L. Hodulak
IMS
Dr I. Milne
BS TECHNOLOGY CENTRES
Swinden Technology Centre
Mr A.C. BannisterMr P.H. BatesonDr P.L. HarrisonMr S.E. Webster

BRITE-EURAM SINTAP S454 BRPR-CT95-0024Contribution to BE95-1426 Task 1 Sub-Task 1.3 24/3/99 CONFIDENTIAL
1
SUMMARY
WELD STRENGTH MISMATCH EFFECTS - MULTIPASS WELD EVALUATION
British Steel plc
An experimental programme has been undertaken as part of SINTAP Task 1 to quantify the mechanical and fracturetoughness properties of multipass welded joints with weld strength mismatch. The programme used a conventional25 mm thick Q & T steel which was heat treated to different strength levels and then welded under identical weldingconditions to give nominally identical weld and HAZ structures in the different strength plates. Two types of weldingwere used to provide HAZs with different tensile properties adjacent to the weld. Testing was conducted at two crackdepths in the parent materials, weld centreline and HAZ(FL) locations to provide Charpy, CTOD, and δ5 data. Centrecracked tensile tests were also conducted in the same locations to assess the load - displacement, CMOD, δ5 andlocal straining characteristics of the specimens.
Throughout the work, a consistent effect of notch depth on fracture toughness transition was observed for parent,weld metal and HAZ notch locations. CTOD transition temperatures (at 0.1 mm) were about 20 to 40°C lower forshallow notched specimens (a/w 0.15) compared to deep notched specimens (a/w 0.5). Beneficial effects ofovermatching (M = 2.15) on HAZ(FL) CTOD and Charpy toughness values were observed for welds with a highstrength HAZ. In both cases this was observed to be associated with crack deviation away from the high strength HAZwhich occurred in the toughness transition region. The relationship between the direct measurement of CTOD usinga δ5 gauge and CTOD to BS 7448 appeared to differ with crack depth and weld strength mismatch level indicating thatmismatch corrected CTOD procedures are required for assessing weld fracture toughness in shallow notchedspecimens.
Centre cracked tensile testing demonstrated that whilst the load bearing characteristics of overmatched weldsusually equalled those of an equivalent unwelded plate, the load bearing characteristics of undermatched weldsexamined failed to match the parent plate. The CCT data also showed that higher values of CMOD or δ5 and localstrain in the notch region developed for a given test displacement in the undermatched welds compared toovermatched. These effects were present not only at the weld centreline, but also in the HAZ at the fusion lineindicating that weld strength overmatching provides some strain limitation in the HAZ(FL) regions.
Cover Pages: 2Text/Table Pages: 20Figure Pages: 33Appendix Pages: 60
Signed by: P.L. HarrisonOther authors: -Approved by: S.E. Webster
ManagerWelding & EngineeringMetallurgy Department
BRITE-EURAM SINTAP S454 BRPR-CT95-0024Contribution to BE95-1426 Task 1 Sub-Task 1.3 24/3/99 CONFIDENTIAL
2
CONTENTS Page
1. INTRODUCTION 3
2. TEST PROGRAMME 3
3. MATERIALS AND HEAT TREATMENTS 4
4. WELDING 4
5. TENSILE PROPERTIES 4
5.1 Parent Plates 45.2 Weld Metals 55.3 Heat Affected Zones 55.4 Average Mismatch Levels 6
6. CHARPY PROPERTIES 6
6.1 Parent Plates 66.2 Weld Metals 66.3 Heat Affected Zones (Flux Cored Arc Welds) 76.4 Heat Affected Zones (Submerged Arc Welds) 7
7. CTOD AND δ5 IN SENB SPECIMENS 7
7.1 Parent Plates 77.2 Flux Core Weld Metals 97.3 Heat Affected Zones (Flux Cored Arc Welding) 107.4 Heat Affected Zones (Submerged Arc Welding) 11
8. CENTRE CRACKED TENSILE TESTS 12
8.1 Parent Plates 128.2 Weld Metal 138.3 Heat Affected Zones (Flux Cored Arc Welds) 148.4 Heat Affected Zones (Submerged Arc Welds) 14
9. CONCLUSIONS 15
REFERENCES 16
TABLES 18
FIGURES F1
APPENDIX 1CHARPY TRANSITION DATA FOR PARENT PLATES A1/1APPENDIX 2CHARPY TRANSITION DATA FOR FCAW WELD METALS A2/1APPENDIX 3CHARPY TRANSITION DATA FOR FCAW HAZS A3/1APPENDIX 4CHARPY TRANSITION DATA FOR SAW HAZS A4/1APPENDIX 5CTOD TRANSITION DATA FOR PARENT PLATES A5/1APPENDIX 6CTOD TRANSITION DATA FOR FCAW WELD METALS A6/1APPENDIX 7CTOD TRANSITION DATA FOR FCAW HAZS A7/1APPENDIX 8CTOD TRANSITION DATA FOR SAW HAZS A8/1APPENDIX 9CENTRE CRACKED TENSILE TEST DATA FOR PARENT PLATES A9/1APPENDIX 10 CENTRE CRACKED TENSILE TEST DATA FOR TESTS NOTCHED AT FCAW WELD A10/1
METAL CENTRELINEAPPENDIX 11 CENTRE CRACKED TENSILE TEST DATA FOR TESTS NOTCHED AT FCAW HAZ A11/1APPENDIX 12 CENTRE CRACKED TENSILE TEST DATA FOR TESTS NOTCHED AT SAW HAZ A12/1APPENDIX 13 MICRO-TENSILE TESTING OF MULTIPASS WELDS A13/1
BRITE-EURAM SINTAP S454 BRPR-CT95-0024Contribution to BE95-1426 Task 1 Sub-Task 1.3 24/3/99 CONFIDENTIAL
3
WELD STRENGTH MISMATCH EFFECTS - MULTIPASS WELD EVALUATION
British Steel plc
1. INTRODUCTION
SINTAP Sub Task 1.3 was set up to investigate the effects of weld strength mismatch in multipass welded joints. Theprogramme was designed to keep weld metal and HAZ microstructures constant whilst varying the parent materialproperties. This was achieved by heat treating plates of the same composition to different strength levels and thenwelding them under identical welding procedures. Since it was uncertain whether or not HAZ properties aresignificant in the question of weld strength mismatching the programme examined the effects of weld metal strengthmismatch with HAZs at two strength levels. Welding was multipass using the Flux Cored Arc Welding (FCAW)process for low heat input welds and the Submerged Arc Welding (SAW) process for high heat input welding. Thenotch locations investigated were parent plate, HAZ at the fusion line and the weld metal centreline.
2. TEST PROGRAMME
The programme included conventional small scale tests (Charpy and tensile), fracture toughness tests (CTOD, δ5)and centre cracked tensile (CCT) tests. The experimental procedure involved generation of load-displacement andCMOD-displacement curves in the CCT specimens and CTOD transition curves for the single edge notch bend(SENB) specimens. A range of different crack depths and orientations were investigated in the CTOD specimens asillustrated in Fig. 1. The test matrix for the programme is summarised in Table 1 and a diagram showing theapproximate mismatch levels aimed for is given in Fig. 2.
Test Series 1 to 3 in Table 2 show the work undertaken on the parent materials which involved tensile testing (fullstress strain curves), Charpy impact testing (full transition curves), CTOD and δ5 testing (transition curves on surfacenotched and through thickness notched SENB specimens), and mini-wide plate testing (crack driving force curves onsurface notched (SN) and through thickness notched (TTN) CCT specimens). The parent materials were in threestrength conditions with approximate yield strengths of 675, 475 and 300 N/mm².
Test Series 4 to 6 in Table 1 summarises the work undertaken on the HAZ and weld metal of multipass FCAW weldswith notches in the HAZ at the fusion line (FL) and weld metal (at centreline). Tensile properties of the weld metalswere measured with waisted tensile specimens in the transverse orientation, giving full stress - strain data. HAZtensile properties were measured by GKSS using micro-tensile specimens taken from the HAZ. Charpy tests wereconducted at the fusion line and weld metal centreline. CTOD and CCT testing was also conducted at the FL andweld metal centreline locations using surface notched specimens with a/w of 0.15 and 0.5. Additional throughthickness specimens were included for the overmatching and undermatching conditions. Notch locations were HAZat FL and weld metal centreline.
Test Series 7 to 9 in Table 2 summarise the work undertaken on the HAZ of multipass SAW welds with notches in theHAZ (at FL). Tensile properties of the weld metal and HAZ were measured in the same way as in Series 4 to 6.Charpy, CTOD and CCT tests were conducted at the fusion line. The fracture mechanics tests were surface notchedgeometry with a/w of 0.15 and 0.5. Notch locations were HAZ at FL.

BRITE-EURAM SINTAP S454 BRPR-CT95-0024Contribution to BE95-1426 Task 1 Sub-Task 1.3 24/3/99 CONFIDENTIAL
4
3. MATERIALS AND HEAT TREATMENTS
Details of the steel selected for the programme are given in Table 2. The steel was a 25 mm thick quenched andtempered grade made by the basic oxygen steelmaking process (BOS) and was continuously cast. Heat treatmentconsisted of reheating to 930C for 50 min prior to water quenching and tempering at 580°C for 1 h.
Further heat treatments were conducted to produce nominal yield strengths of ~650, ~500 and ~350 N/mm² followinga PWHT after welding. To achieve these strength levels in the welded panels, steel coupons were given the followingtreatments.
For the high strength condition, steel was welded in the as-received condition and then post weld heat treated at560°C for 1 h. For the medium strength level, a high temperature tempering treatment at 675°C for 1 h wasconducted prior to welding, whilst for the low strength level, a normalising heat treatment at 900°C for 1 h was usedprior to welding. After welding all panels were given a PWHT using the conditions given above.
4. WELDING
Approximately 15 m of FCAW welds and 6 m of SAW welds were manufactured for the test programme. Details of theweld preps. and welding parameters used are given in Figs. 3 and 4. For both processes a single sided weld prep.with backing bar was used. One side of the weld prep. was perpendicular to the plate surface to allow HAZ notchingof fracture toughness specimens. The other side had a bevel angle of 10 (FCAW procedure) and 15° (SAWprocedure). Root gaps of 16 and 14 mm were used for the FCAW and SAW procedures respectively to try to ensurethe weld widths were similar to those for which FE models already exist.
The FCAW welding consumables used were Fluxofil 35 / Argoshield 20 which is a 1.4Mn, 0.5Mo consumable. For theSAW procedure, Oerlikon SD3 1Ni¼Mo wire with OP121TT flux was used. Both consumables were selected to giveweld metals of nominally ~500 N/mm² yield strength after PWHT.
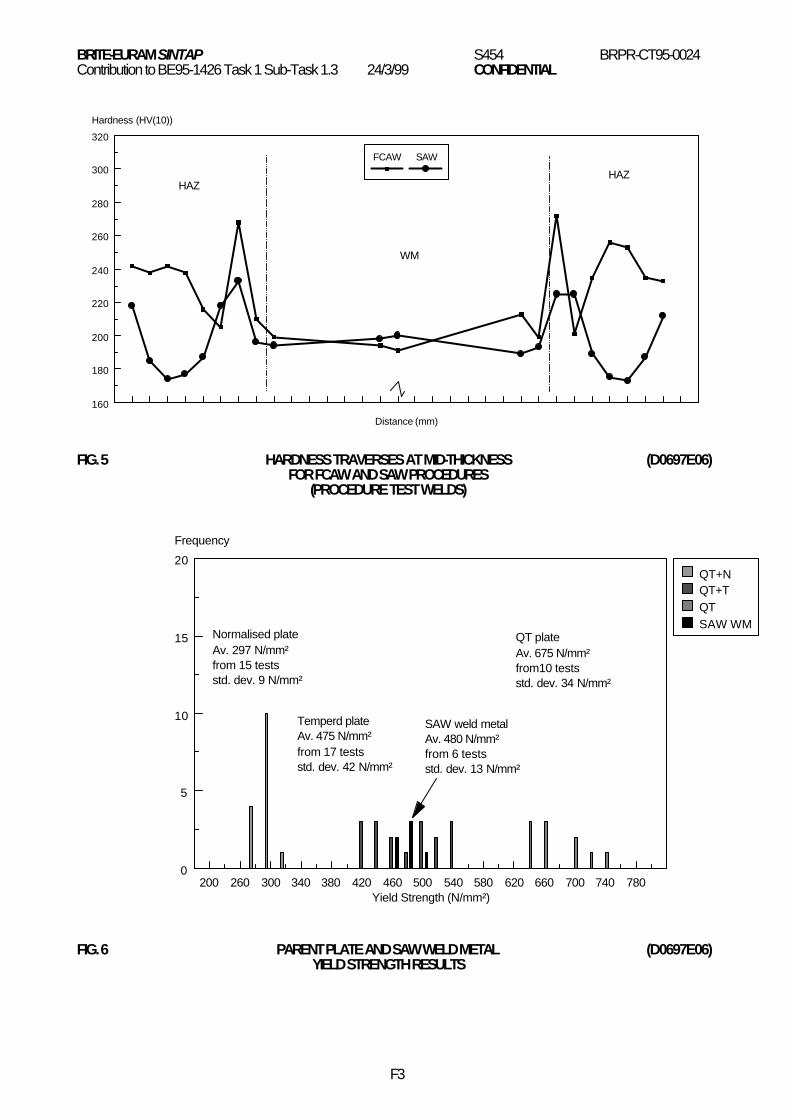
Hardness traverses were conducted at 1 mm subsurface from the cap and root and at mid-thickness on most welds.Details of the welds produced and their weld metal hardness values are given in Table 3. Figure 5 shows acomparison of hardness traverses on the procedure test welds at mid-thickness. For both procedures, the weldmetal hardness was similar indicating similar weld metal yield strength. For the HAZ, the FCAW procedure, with itsfaster cooling rate has produced a higher hardness close to the fusion line. Both procedures produce a HAZ softzone which is significantly softer and wider for the high heat input SAW procedure.
5. TENSILE PROPERTIES
5.1 Parent Plates
The tensile properties of the parent materials were measured using 8 mm diameter tensile specimens located atmid-thickness. Since a large number of heat treatments were undertaken in the programme, multiple tests wereconducted to produce information on the spread of tensile properties in the heat treated plates.
The mean yield and ultimate tensile strength (UTS) values with standard deviations are given in Table 4. For thenormalised + PWHT condition an average yield strength of ~300 N/mm² (SD 9 N/mm²) and UTS of 510 N/mm² (SD 3N/mm²) was obtained. For the tempered + PWHT condition an average yield strength of ~475 N/mm² (SD 42 N/mm²)and UTS of 610 N/mm² (SD 21 N/mm²) was observed and for the Q&T + PWHT an average yield strength of ~675N/mm² (SD 34 N/mm²) and UTS of 753 N/mm² (SD 23 N/mm²) was observed.
Figure 6 shows the distribution of yield strength values obtained from the three strength conditions. The highestspread in tensile properties was for the tempered + PWHT condition and the least for the normalised + PWHTconditions. These results are in agreement with the data generated in the heat treatment trials which showed yieldstrength in the 675°C reheat regime to be very sensitive to reheating temperature, but quite insensitive in the 900°Cregime(1).
The measured yield strength values of ~300, 475 and 675 N/mm² for the three strength conditions were within about50 N/mm² of the original aim values and allow examination of a slightly wider range of mismatching levels thanoriginally planned.
5.2 Weld Metals

BRITE-EURAM SINTAP S454 BRPR-CT95-0024Contribution to BE95-1426 Task 1 Sub-Task 1.3 24/3/99 CONFIDENTIAL
5
Tensile properties of the weld metals were evaluated from longitudinal all weld metal tensile specimens (on theprocedure test weld) and from transverse diametrical tensile specimens (on selected welds).
The weld metal yield strength results are given in Table 5 and Figs. 6 and 7. For the SAW procedure, similar strengthvalues were recorded for the procedure test weld and the test programme welds, indicating that there was littleinfluence of orientation or test specimen type on measured weld strength values. Average values of yield and UTSwere 480 and 591 N/mm2 respectively (Table 5) and these values were close to the aimed values for the project.
For the FCAW procedure, the procedure test weld gave yield and UTS values of 545 and 619 N/mm2 which althoughslightly higher than the SAW values were within ~10% of the aim values for the project. Unfortunately, the results forthe project test welds were significantly higher than the procedure test weld, with average yield and UTS values of 639and 709 N/mm2 respectively. The reasons for these differences were not established. However, investigationsconfirmed that the procedure test and project test weld metals were of the same chemical composition and welded tothe same procedure.
5.3 Heat Affected Zones
An estimate of HAZ yield strength was established from a strength versus hardness correlation and directmeasurements of tensile properties using micro-tensiles were performed at GKSS. The strength versus hardnessrelationship was developed using simulated HAZ strength and hardness data measured earlier in the project.Preliminary results suggested that the mean GCHAZ strengths at the fusion line were ~510 N/mm² and 730 N/mm²for the SAW and FCAW procedures respectively. Detailed HAZ tensile results from micro-tensile specimens(Appendix 13) showed a range of HAZ strength levels indicating some expected weld to weld and location to locationvariation in strength levels. The peak GCHAZ strength levels measured in the SAW welds were 560 and 580 N/mm2.
Taking average hardness data from the hardness traverses for the FL to FL + 2.5 mm regions, the estimated HAZstrengths were ~430 N/mm² and 530 N/mm² for the SAW and FCAW procedures respectively. The maximum andminimum yield strength values measured in the SAW HAZ by micro-tensiles were 580 and 320 N/mm2 respectivelyindicating a wide range of tensile properties in the SAW HAZ.
5.4 Average Mismatch Levels
The average strength mismatch levels achieved in the weld panels are summarised in Fig. 8. For the SAW weldsaverage mismatch levels of 0.71, 1.01 and 1.62 were produced, which were similar to the original aim values of 0.77,1.0 and 1.43. Unfortunately the aim of having the GCHAZ yield strength less than the weld metal may not have beenachieved. However, the average HAZ strength in the FL to FL + 2.5 mm region is lower than the weld metal strengthand even lower strength levels are present in the outer parts of the SAW HAZ as shown in Fig. 5.
For the FCAW welds, due to the higher than expected weld metal strength, the mismatch levels were 0.95, 1.35 and2.15. These were significantly higher than the aim values and resulted in a test matrix of approximately matching (M =0.95), overmatching (M = 1.35) and higher overmatching (M = 2.15) weld strength compared to the planned matrix ofundermatching, matching and overmatching. The aim of having GCHAZ strength greater than the weld metal wasachieved.
6. CHARPY PROPERTIES
6.1 Parent Plates
The Charpy impact toughness of the parent materials, some selected FCAW weld metals and their HAZs andselected SAW HAZs were measured over a range of temperatures to produce transition curves. In almost all cases,testing was done with triplicate specimens at 5 or 6 temperatures and a mean energy transition curve establishedfrom which the mean 27 J transition temperatures were defined. All Charpy tests were transverse to the rolling andwelding directions and were taken 2 mm subsurface. For the weld metal and HAZ tests, the root side of the weld wasnotched.
The parent material Charpy curves for Q&T + PWHT, 675°C tempered + PWHT, and normalised + PWHT conditions,are shown compared in Fig. 9. The lowest 27 J temperature was obtained in the Q&T condition (-65°C) followed bythe 675°C tempered condition (-50°C). The highest transition temperature was observed in the normalised condition(-15°C). Scatter in the triplicate tests was generally quite modest (usually <25 J) with the maximum difference inabsorbed energy values being observed in the mid-transition region of the tempered steel (~50 J). The transition

BRITE-EURAM SINTAP S454 BRPR-CT95-0024Contribution to BE95-1426 Task 1 Sub-Task 1.3 24/3/99 CONFIDENTIAL
6
curves for the Q&T and tempered conditions crossed over at ~50 J; the higher strength condition having the shallowertransition curve below about 60 J.
6.2 Weld Metals
The Charpy transition curves for the three FCAW weld metals investigated (one in each mismatch condition) arecompared in Fig. 10. The scatter in these tests was also low and generally similar or lower than that observed in theparent steels. For the undermatched condition (nominally M = 0.95) the 27 J temperature was -55°C, whereas for theother two conditions (nominally M = 1.35 and 2.15) the 27 J temperatures were -40 and -38°C respectively.
Examination of the Charpy notch locations to identify the weld metal microstructures sampled in each test series interms of as-deposited and retransformed microstructures indicated little difference in the microstructures sampled.However, hardness data indicated that the weld metal with the slightly lower transition temperature also has thelowest hardness of the three welds and this is a likely explanation for its slightly lower 27 J temperature.Consequently the weld metal Charpy results suggest that there is probably no influence of weld strength mismatchon weld metal Charpy toughness in the welds under investigation and the small variation of ~15°C in transition isprobably due to the slight intrinsic weld metal toughness variability expected in multipass welds.
6.3 Heat Affected Zones (Flux Cored Arc Welds)
The Charpy transition curves for the three FCAW HAZs investigated (one in each mismatch condition) are comparedin Figs. 11 and 12 using mean and upper/lower bound curves to the data. The scatter in these tests was high whichis typical for HAZ tests at the fusion line of multipass welds. For example, the range of absorbed energies for thetriplicate tests at a fixed temperature was often >75 J and in some instances was as high as 150 J. Consequently,definition of the transition temperature in these tests was subject to greater uncertainty than the previous results forparent plates and weld metals. As in previous figures, the transition curves in Fig. 11 were drawn through the meanenergy values at each test temperature. For one of the data sets, the mean absorbed energy at -20°C was lower thanat -40°C and for this data set the mean line curve has been drawn through the mean of the -20 and -40°C results at -30°C to avoid a region of negative slope in the transition curve.
The 27 J transition temperatures obtained from the mean transition curves were ~-75°C (M = 2.15, ~-35°C (M = 1.35)and ~-40°C (M = 0.95). These results, which are illustrated in Fig. 11, suggest a complex effect of mismatching onHAZ Charpy toughness in multipass FCAW welds. At room temperature and +40°C, overmatching seems to bebeneficial to Charpy toughness, whereas at -20°C, the mean Charpy energies for the three conditions are verysimilar. At -40 to -60°C a beneficial effect of high levels of overmatching (M = 2.15) on HAZ (FL) Charpy toughnesswas apparent.
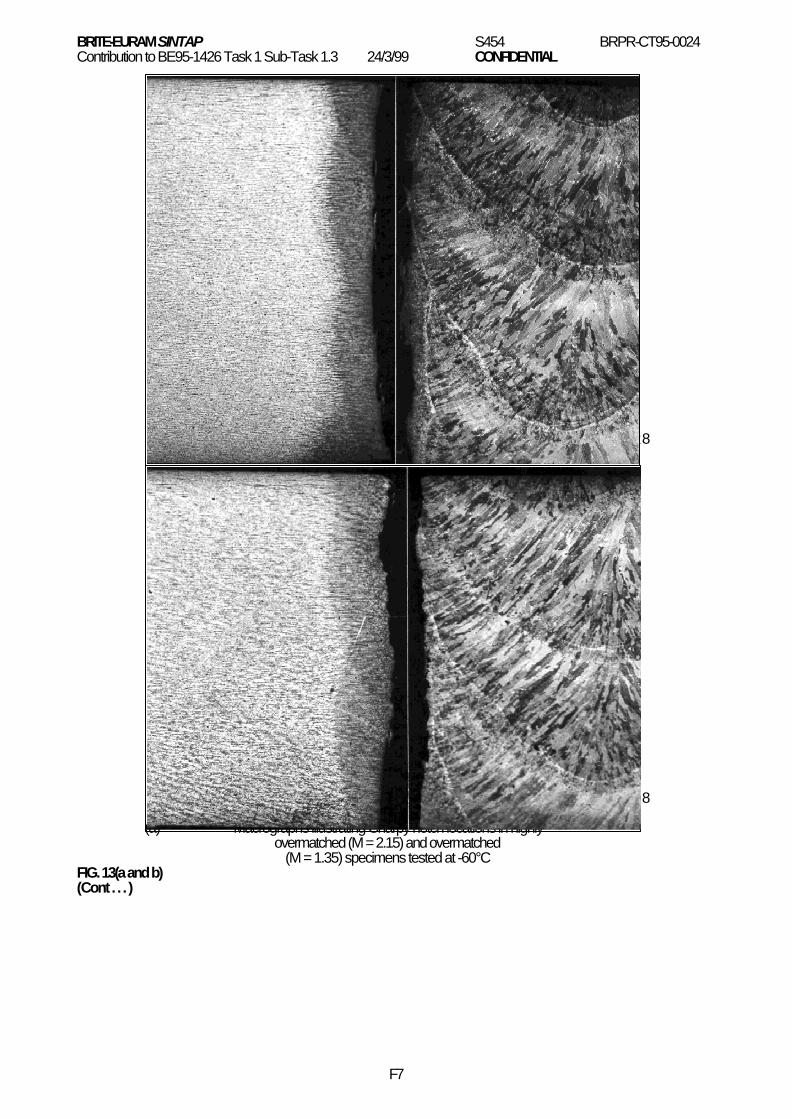
Macrographs illustrating the notch locations and fracture paths in specimens tested at -60°C in the highlyovermatched and slightly overmatched conditions are given in Fig. 13. These photos show that whilst the notchlocations in the HAZ at the fusion line were similar (Fig. 13(a)), the fracture paths differed (Fig. 13 (b)) with the highlyovermatched specimen deviating from the fusion line into lower strength plate. This fracture deviation may explain theobserved beneficial effect of high overmatching on HAZ Charpy toughness.
6.4 Heat Affected Zones (Submerged Arc Welds)
The Charpy transition curves for the three SAW HAZs investigated are compared in Figs. 14 and 15. As observed inthe FCAW HAZ tests, there was also considerable scatter in energy results from the SAW HAZ triplicate tests (up to~150 J). Mean energy transition curves were plotted through average energy values at each temperature exceptwhere this would result in a negative slope in the transition curve.
The 27 J transition temperatures obtained were +30°C (M = 1.62), +37°C (M = 1.01) and +20°C (M = 0.71). Given thedegree of scatter observed in the tests it seems unlikely that the small differences in 27 J temperature are significantand in fact Fig. 14 shows that the three mean curves are very close at the 50 J level. Consequently, there appears tobe little influence of mismatch on HAZ Charpy toughness of the SAW welds (M = 0.71 to 1.62) for the lower part of theCharpy transition curves. However, for the upper part of the transition curve at +80 and +100°C, the data indicates thatovermatching is slightly beneficial to HAZ toughness.

BRITE-EURAM SINTAP S454 BRPR-CT95-0024Contribution to BE95-1426 Task 1 Sub-Task 1.3 24/3/99 CONFIDENTIAL
7
7. CTOD AND δδ 5 IN SENB SPECIMENS
7.1 Parent Plates
Fracture toughness levels in the parent plates were measured using 25 x 25 mm bend specimens with nominalcrack sizes of a/w 0.5 and 0.15. The majority of tests were done with surface notched specimens (Y-Z orientation),but additional tests were done with through thickness notched specimens (Y-X orientation). Testing was conductedover a range of temperatures to define the CTOD transition behaviour and additional replicate tests were conducted at~18°C below the Charpy 28 J temperature to allow further analyses using the master curve method, if required, at alater date. Double clip gauges were used on all specimens to enable load - CMOD traces to be generated and a δ5
gauge was used to obtain a direct measurement of CTOD in tests conducted in the temperature range +50 to -50°C.Unfortunately, problems were encountered with the initial δ5 testing on the parent plates and consequently δ5 data forthese tests has not been presented. However, subsequent δ5 testing conducted on the weld metal and HAZspecimens with different δ5 gauges and data logging arrangements proved more successful and these results arediscussed in the relevant sections.
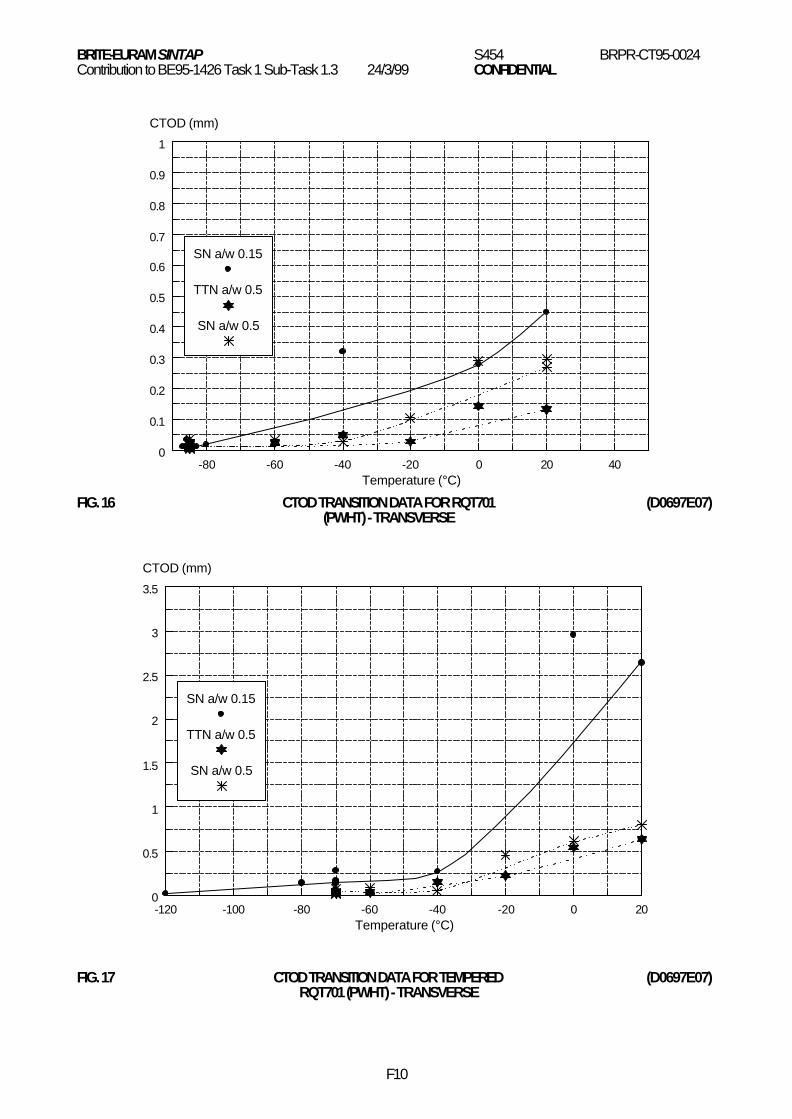
CTOD values calculated to BS 7448:Part 1(3) are presented as CTOD transition curves in Appendix 5, Figs. A5.1 toA5.9. Comparison of the effects of notch geometry and orientation are given in Figs. 16 to 18 for plates in the Q & T,tempered and normalised conditions respectively. For the Q & T condition (followed by PWHT at 560°C for 1 h) threedistinct transition curves were produced for the three notch geometry's investigated (Fig. 16). The 0.1 mm CTODtransition temperatures taken from lower bound curves were -50°C (SN a/w 0.15), -20°C (SN a/w 0.5) and +10°C(TTN a/w 0.5). The lower transition for the short cracked specimens was probably due to lower crack tip constraintwhereas the higher transition temperature in the TTN specimens may be a result of different microstructuralsampling effects. For example, the TTN geometry would have sampled all regions through the plate thickness andconsequently any local microstructural inhomogeneity such as centre segregation from the continuous casting of thesteel could have been sampled and may have influenced the CTOD values.
For the tempered condition (tempered at 675°C for 1 h followed by PWHT at 560°C for 1 h) the lowest transitiontemperature was again observed for the shallow notched specimens with a 0.1 mm CTOD temperature of -80°C (Fig.17). In this heat treatment condition there was less difference in the transition curves for the deep notchedspecimens which may have been a consequence of effective tempering of the segregate regions resulting in a morehomogeneous microstructure. The 0.1 mm CTOD temperature for the deep notched specimens was about -30°C to -40°C.
For the normalised condition (normalised at 900°C for 1 h followed by PWHT at 560°C for 1 h), with the exception ofone lower result at +20°C, the shallow notched geometry again gave the lowest transition temperature and the deepnotched specimens gave similar transition curves, (Fig. 18). The 0.1 mm CTOD temperatures were about -40°C forshallow and about 0°C for the deep notched specimens.
A comparison of parent plate fracture toughness levels in terms of CTOD at different test temperatures has beenmade in Figs. 19 to 21 for TTN a/w 0.5, SN a/w 0.5 and SN a/w 0.15 geometry's respectively. In order to show thereplicate test results obtained at the lower test temperatures, CTOD was plotted on a logarithmic scale. For all threenotch types, the tempered condition tends to show the highest levels CTOD at each temperature, whereas the scatterin CTOD of the other two heat treatment conditions tends to overlap. For surface notched specimens, the lowestCTOD values at any given temperature tended to be for the normalised steel, although this was not universal (e.g. SNa/w 0.5 at +20°C). The toughness ranking obtained from the CTOD tests was in broad agreement with the Charpytests (Fig. 9) for the part of the Charpy curves above ~70 J. In this regime, the lowest transition temperature was forthe tempered condition with the highest for the normalised condition. However, the ranking at the lower Charpyenergy levels, which identified the Q & T condition as having the lowest transition temperature, was not the same asin the CTOD tests. This may have been a consequence of using a subsurface Charpy specimen in the toughnessevaluation rather than one from mid-thickness.
7.2 Flux Cored Weld Metals
Fracture toughness levels in the FCAW weld metals were measured in a similar manner to the parent plates. Due toslight distortion during welding, the machined specimens were generally made to a common size of 23 x 23 mmcompared to 25 x 25 for the parent plate specimens. Specimens with surface notched geometry's (a/w 0.5 and 0.15)were tested at all three mismatched conditions (M ~0.95, 1.35, and 2.15) whilst the specimens with through thicknessgeometry (a/w 0.5) were tested for the undermatching and highly overmatching conditions only. All specimens were

BRITE-EURAM SINTAP S454 BRPR-CT95-0024Contribution to BE95-1426 Task 1 Sub-Task 1.3 24/3/99 CONFIDENTIAL
8
notched at the weld centreline as shown in Fig. 22. For the surface notched tests, specimens were notched from theroot side.
CTOD transition curves are presented in Figs. A6.1 to A6.8 of Appendix 6 and Fig. 23. The data for deep notchedspecimens exhibited less scatter than the shallow notched data. A similar effect of notch depth and orientation wasseen in the weld metal tests to that observed in the parent plates with the lowest transition temperature and highestCTOD values being seen in the short surface notched specimens due to lower crack tip constraint.
Taking a CTOD transition temperature corresponding to 0.1 mm CTOD, the relative CTOD transition temperatureswere ~-60°C for the short surface notched specimens, -15°C for the deep SN specimens and ~0°C for TTN a/w 0.5.The reason for the highest transition temperature in the TTN specimens may be the wider range of weld metalmicrostructures sampled by the fatigue precrack allowing fracture to initiate from the least tough region in the weldmetal, although this has not been established in the present study.
The effect of weld strength mismatch on weld metal CTOD is shown in Figs. 24 to 26 for the TTN, deep SN andshallow SN specimens respectively. Unexpected results were obtained for the TTN and deep SN specimens at lowtemperature, because these tests indicated lower levels of toughness in the overmatched welds for most testtemperatures. Since it is generally considered that for deep notched specimens (a/w 0.5) there is little effect ofmismatch on CTOD to BS 7448, these differences may be due to some variation in the intrinsic fracture toughness ofthe weld deposits. This argument was proposed in an earlier progress report to explain the slightly higher Charpytoughness observed in undermatched weld metal(4). Unlike the Charpy test weld panels, the differences in averageweld metal hardness of the TTN CTOD weld panels was not large, although the cap regions of the overmatched weldwere slightly harder. Other possible reasons for the slightly lower levels of toughness in the overmatched TTNspecimens could be the slightly thicker specimen size (23 x 23 mm compared to 22 x 22 mm and the presence ofweld porosity which was present in one of the weld runs of the multipass weld in the overmatched condition.
For specimens with a/w = 0.15, where strength mismatch is expected to have an effect(5), higher values of CTOD weremeasured in the highly overmatched (M = 2.15) weld metal but this effect was not seen for the lower level of strengthovermatching (M = 1.35).
The relationship between δ5 and BS 7448 CTOD obtained from the weld metal tests is shown in Figs. 27 and 28 forthe deep and shallow notched specimens respectively. For the deep notched specimens, δ5 values were similar toBS 7448 CTOD for low values of CTOD but tended to diverge from a 1:1 line at higher crack openings. The δ5 valueswere usually greater than BS 7448 CTOD for larger crack openings, but one possibly anomalous result was observedwhere a δ5 value smaller than the corresponding BS 7448 value was observed. For shallow notched specimens, theoverall correlation between δ5 and BS 7448 CTOD was closer to the 1:1 line. This may be a reflection of theoverestimation of CTOD by the BS 7448 method for short cracked specimens. The δ5 results for the short crackedspecimens also showed an effect of weld metal strength mismatch, with smaller values of δ5 being observed in thehighly overmatched weld metal for a given value of BS 7448 CTOD.
7.3 Heat Affected Zones (Flux Cored Arc Welding)
CTOD tests on the HAZ of the FCAW welds were conducted using the same matrix of mismatch conditions and crackgeometry's as for the FCAW weld metals and CTOD was calculated to BS 7448:Part 2(2). Through thickness testspecimens were notched in the HAZ on the straight side of the weld preparation with the intention of sampling highproportions of grain coarsened HAZ close to the fusion boundary (e.g. typically >15%). The surface notchedspecimens (a/w = 0.5 and 0.15) were notched into the straight HAZ from the weld root side. No attempt was made toaim for specific regions of grain coarsened HAZ with the surface notched specimens. After testing, post testsectioning was conducted on all HAZ test specimens to verify the HAZ notch locations and identify the microstructuressampled by the fatigue crack tips using the procedures given in BS 7448 Part 2(2). Macrographs illustrating the HAZnotch locations are presented in Fig. 29.
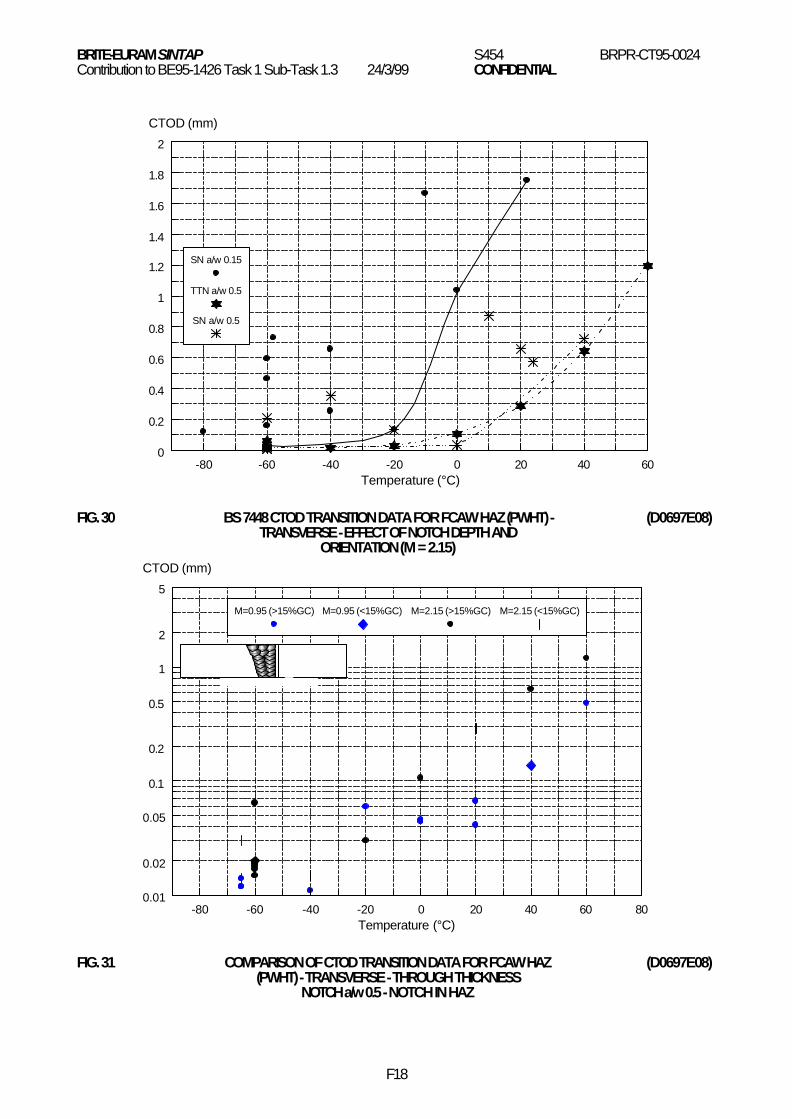
CTOD transition curves for the FCAW HAZ are presented in Figs. A7.1 to A7.8 of Appendix 7 and in Fig. 30. For thethrough thickness tests, smooth transition curves were obtained with little evidence of scatter and although the vastmajority of specimens sampled >15% GCHAZ, there did not appear to be much effect of the amount of GCHAZsampled on the test result. For the surface notched tests, some scatter in the test data was observed and themagnitude of the scatter increased for the shallow notched specimens. The microstructures in which fatigueprecracks were located is given in Figs. A7.3 to A7.8 in an attempt to explain some of the scatter. However, althoughcracks accurately located in the GCHAZ or at the fusion line were often on the lower bound lines, this was not always

BRITE-EURAM SINTAP S454 BRPR-CT95-0024Contribution to BE95-1426 Task 1 Sub-Task 1.3 24/3/99 CONFIDENTIAL
9
the case, indicating a wide range of toughness in the different microstructural regions in the multipass welds. Forexample, the toughness of GCHAZ regions increased with distance from the fusion line and was probably alsoinfluenced by the tempering effects of subsequent weld beads.
The effect of notch geometry on HAZ CTOD transition temperature is illustrated in Fig. 30 using test results fromovermatched welds (M ~2.15). The same type of effect was seen in the HAZ as in the parent plates and weld metals,with the lowest transition temperatures and highest CTOD values in the shallow cracked specimens Unlike the weldmetals, however, there did not appear to be much difference between through thickness and surface notchedspecimens when the lower bound data was considered.
The effect of weld strength mismatch on HAZ CTOD is shown in Figs. 31 to 33 for the through thickness, deep surfacenotched and shallow surface notched specimens respectively. For most of the through thickness tests and thesurface notched tests at the higher test temperatures, the overmatched welds exhibited higher HAZ CTOD values.These differences in CTOD values were reflected in clearly observable differences in HAZ fracture mode of the CTODspecimens as illustrated in Figs. 34 and 35. Figure 34 shows under and overmatched deep notched surface notchedspecimens tested at -40°C. The effect of overmatching was to prevent cleavage initiation in the GCHAZ, probably as aresult of reduced triaxial stress at the crack tip which resulted from having a lower strength parent material adjacent tothe HAZ region(6). In terms of fracture appearance, this resulted in fracture in the IC/SCHAZ linked back to the crack tipby a shear step. A similar effect was observed in the shallow surface notched specimens as illustrated in Fig. 35where the overmatched specimens often exhibited tearing away from the HAZ into the lower strength plate.
The observed effect of weld metal strength mismatch on HAZ CTOD is contrary to that recently reported by EWI/TWI(7)
where overmatching was shown to elevate HAZ transition temperature. This difference may be due to the differentways in which overmatching was achieved in the two programmes. In the present work overmatching was achievedby decreasing parent plate strength whereas in the TWI programme it was achieved by increasing weld metalstrength. These differences suggest that there is probably a need to consider the local strength mismatch betweenboth HAZ and weld metal and HAZ and parent plate as far as possible effects of mismatch constraint are concernedin the HAZ.
The relationships between δ5 and BS 7448 CTOD obtained from the FCAW HAZ tests are shown in Figs. 36 and 37for the deep and shallow notched specimens respectively. The results were similar to the weld metal results in so faras for the deep notched specimens, δ5 was similar to, or greater than, BS 7448 CTOD. Also, for the shallow notchedspecimens, the results were distributed around the 1:1 line in a similar way to the weld metal tests. An effect ofmismatch was observed for the shallow notched specimens (Fig. 37) such that all the undermatched condition δ5
values were greater than the corresponding BS 7448 value whilst most of the overmatched δ5 values (both M ~1.35and 2.15) were less than BS 7448 CTOD.
7.4 Heat Affected Zones (Submerged Arc Welding)
Fracture toughness levels in the HAZ of the SAW welds were measured in the same way as the HAZ of the FCAWwelds except that for these welds, no through thickness testing was undertaken. The results of the tests arepresented in Figs. A8.1 to A8.6 of Appendix 8 as CTOD transition curves. Once again, the microstructures in whichfatigue crack tips were located was identified and have been included in the figures. In general the lower bound to thetransition curve data was made up of GCHAZ results for tests close to the fusion boundary. In the case of thematched condition with a/w = 0.5 (Fig. A8.2) tests conducted at +60, +80 and +100°C had cracks located in the weldmetal and consequently the lower bound for the HAZ in this series of tests was not obtained.
The effect of weld strength mismatch on HAZ CTOD is illustrated in Figs. 38 and 39 for deep and shallow notchedspecimens respectively. Unfortunately due to variability in microstructural sampling, there were few temperatures atwhich clear comparisons of behaviour could be made. However, for the deep notched specimens wherecomparisons could be made there was a tendency for the overmatched specimens to have slightly higher CTODvalues (e.g. GCHAZ at +40 and +60°C). For the shallow notched specimens there were fewer opportunities to makemeaningful comparisons of results for specimens sampling the same microstructures. However, on average, theroom temperature tests sampling GCHAZ where higher in the overmatched condition compared to undermatching.
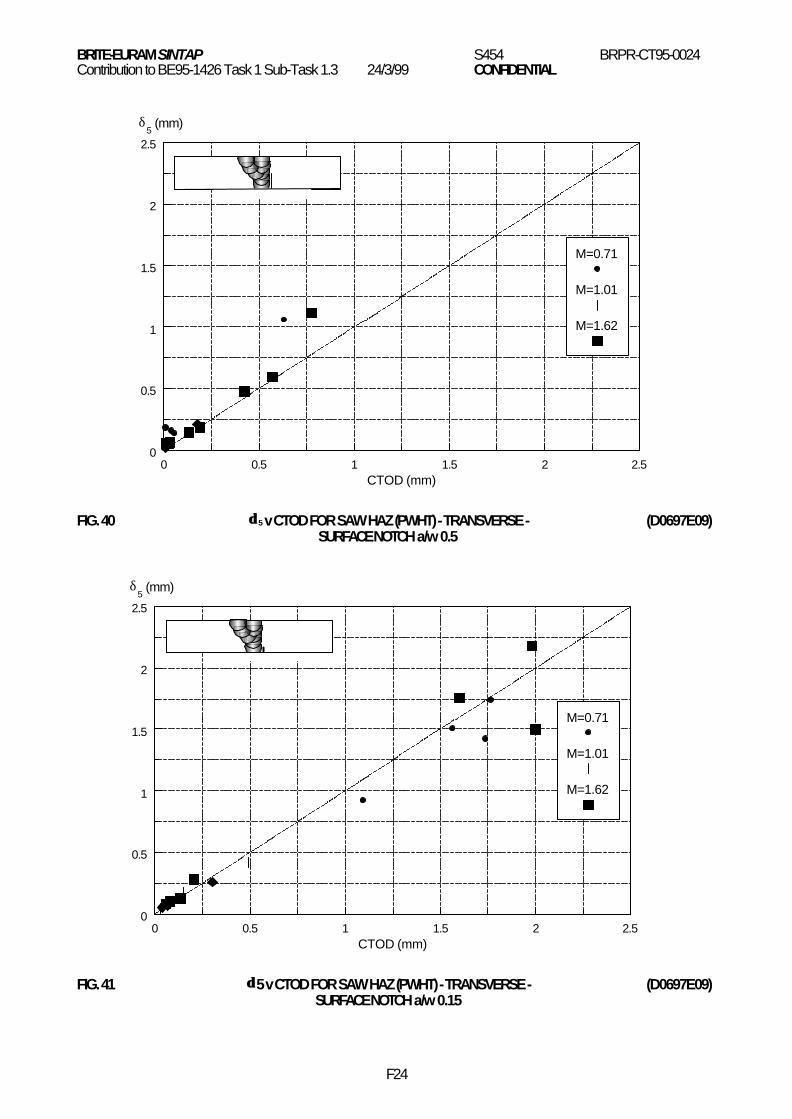
The δ5 test results for the SAW HAZ are summarised in Figs. 42 and 43. Similar trends were observed to those forthe FCAW HAZ except that in the shallow notched tests, Fig. 43, no obvious effect of mismatching was observed
BRITE-EURAM SINTAP S454 BRPR-CT95-0024Contribution to BE95-1426 Task 1 Sub-Task 1.3 24/3/99 CONFIDENTIAL
10
8. CENTRE CRACKED TENSILE TESTS
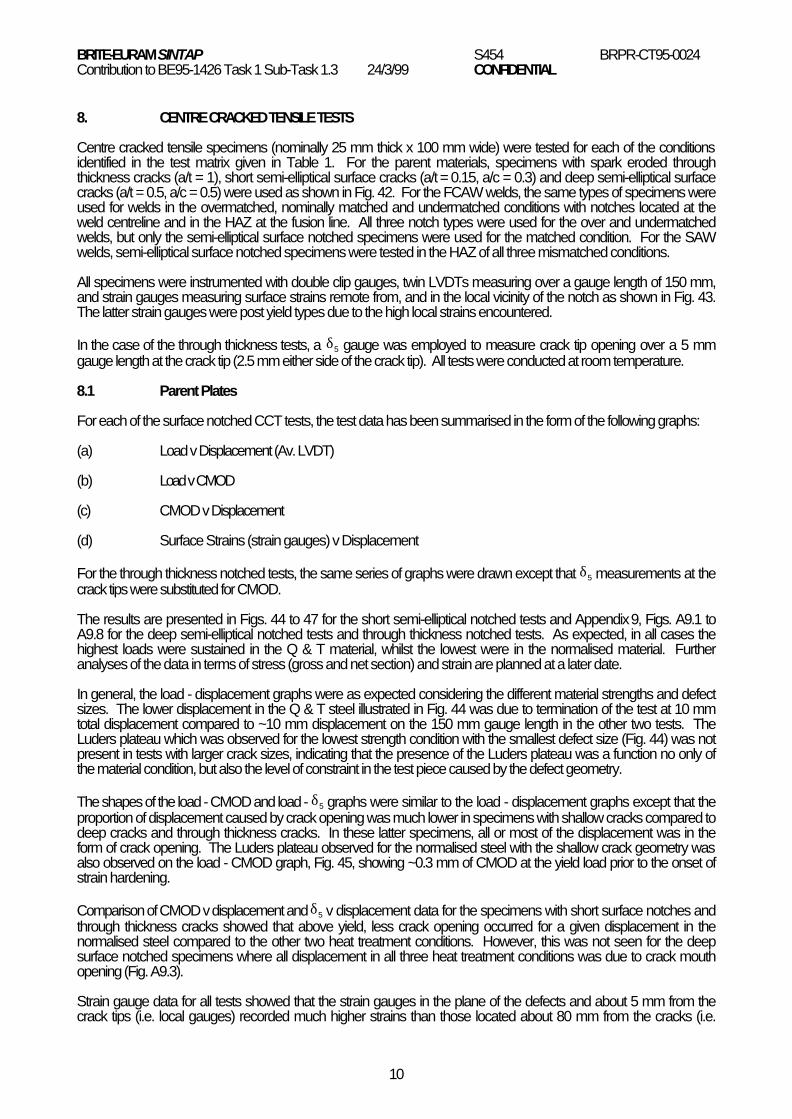
Centre cracked tensile specimens (nominally 25 mm thick x 100 mm wide) were tested for each of the conditionsidentified in the test matrix given in Table 1. For the parent materials, specimens with spark eroded throughthickness cracks (a/t = 1), short semi-elliptical surface cracks (a/t = 0.15, a/c = 0.3) and deep semi-elliptical surfacecracks (a/t = 0.5, a/c = 0.5) were used as shown in Fig. 42. For the FCAW welds, the same types of specimens wereused for welds in the overmatched, nominally matched and undermatched conditions with notches located at theweld centreline and in the HAZ at the fusion line. All three notch types were used for the over and undermatchedwelds, but only the semi-elliptical surface notched specimens were used for the matched condition. For the SAWwelds, semi-elliptical surface notched specimens were tested in the HAZ of all three mismatched conditions.
All specimens were instrumented with double clip gauges, twin LVDTs measuring over a gauge length of 150 mm,and strain gauges measuring surface strains remote from, and in the local vicinity of the notch as shown in Fig. 43.The latter strain gauges were post yield types due to the high local strains encountered.
In the case of the through thickness tests, a δ5 gauge was employed to measure crack tip opening over a 5 mmgauge length at the crack tip (2.5 mm either side of the crack tip). All tests were conducted at room temperature.
8.1 Parent Plates
For each of the surface notched CCT tests, the test data has been summarised in the form of the following graphs:
(a) Load v Displacement (Av. LVDT)
(b) Load v CMOD
(c) CMOD v Displacement
(d) Surface Strains (strain gauges) v Displacement
For the through thickness notched tests, the same series of graphs were drawn except that δ5 measurements at thecrack tips were substituted for CMOD.
The results are presented in Figs. 44 to 47 for the short semi-elliptical notched tests and Appendix 9, Figs. A9.1 toA9.8 for the deep semi-elliptical notched tests and through thickness notched tests. As expected, in all cases thehighest loads were sustained in the Q & T material, whilst the lowest were in the normalised material. Furtheranalyses of the data in terms of stress (gross and net section) and strain are planned at a later date.
In general, the load - displacement graphs were as expected considering the different material strengths and defectsizes. The lower displacement in the Q & T steel illustrated in Fig. 44 was due to termination of the test at 10 mmtotal displacement compared to ~10 mm displacement on the 150 mm gauge length in the other two tests. TheLuders plateau which was observed for the lowest strength condition with the smallest defect size (Fig. 44) was notpresent in tests with larger crack sizes, indicating that the presence of the Luders plateau was a function no only ofthe material condition, but also the level of constraint in the test piece caused by the defect geometry.
The shapes of the load - CMOD and load - δ5 graphs were similar to the load - displacement graphs except that theproportion of displacement caused by crack opening was much lower in specimens with shallow cracks compared todeep cracks and through thickness cracks. In these latter specimens, all or most of the displacement was in theform of crack opening. The Luders plateau observed for the normalised steel with the shallow crack geometry wasalso observed on the load - CMOD graph, Fig. 45, showing ~0.3 mm of CMOD at the yield load prior to the onset ofstrain hardening.
Comparison of CMOD v displacement and δ5 v displacement data for the specimens with short surface notches andthrough thickness cracks showed that above yield, less crack opening occurred for a given displacement in thenormalised steel compared to the other two heat treatment conditions. However, this was not seen for the deepsurface notched specimens where all displacement in all three heat treatment conditions was due to crack mouthopening (Fig. A9.3).
Strain gauge data for all tests showed that the strain gauges in the plane of the defects and about 5 mm from thecrack tips (i.e. local gauges) recorded much higher strains than those located about 80 mm from the cracks (i.e.

BRITE-EURAM SINTAP S454 BRPR-CT95-0024Contribution to BE95-1426 Task 1 Sub-Task 1.3 24/3/99 CONFIDENTIAL
11
remote gauges). In the case of the through thickness specimens, strains from the remote gauges remained elasticthroughout the tests indicating that gross section yielding (GSY) was not reached in these tests (Fig. A9.8). A similarsituation was observed for the deep surface notched tests, except for the normalised steel, where plastic strains wererecorded on the remote gauges for displacements greater than about 1.5 mm. This effect coincided with a reductionin the slope of the strain - displacement output of the local gauge, indicating that GSY was occurring and plasticitywas being transferred into the gross section due to strain hardening in the plane of the defect.
Two tests in the normalised steel (SN a/w 0.5 and TTN) terminated in brittle fracture whilst one test in the Q & Tcondition failed by ductile fracture after attainment of maximum load. All other tests were either terminated at ~10 mmdisplacement or were unloaded after maximum load.
8.2 Weld Metal
The results of the CCT tests conducted on specimens having notches at the centreline of FCAW weld metals arepresented in Figs. 48 to 51 and Appendix 10 Figs. A10.1 to A10.8. For all three notch types examined, the highestloads were sustained in the welds made in the Q & T plates (M = 0.95), whilst the lowest were in the welds made inthe normalised plates (M = 2.15).
For semi-elliptical notched geometry's, the load - displacement characteristics of the overmatched welds in thenormalised plates (M = 2.15) were similar to the parent material without a weld, except that the Luders plateaupreviously observed in the weld free material was not present. For the through thickness notched specimen, theloads sustained by the overmatched weld was slightly higher than the equivalent weld free material.
For all notch geometry's, the load carrying capacity of the undermatched welds made in the Q & T material (M = 0.95)were less than the equivalent weld free Q & T material. Since there was some variation in the plate thickness in theweld regions due to removal of weld caps and backing plate, the exact extent to which the undermatched welds failedto reach the same stress levels as the weld free specimens has yet to be calculated.
Comparison of CMOD v displacement and δ5 v displacement data for the mismatched welds showed that largervalves of CMOD (Fig. 50) and δ5 (Fig. A10.7) developed in the undermatched welds compared to the overmatchedwelds for a given level of displacement, particularly when the displacements were greater than ~0.5 to 1.0 mm.
In terms of local strains measured in the weld metals in the plane of the notch, there was also a clear and expectedinfluence of strength mismatching, with the highest local strains being measured in the undermatched welds and thelowest local strains in the overmatched welds.
Two of the weld metal tests reached 10 mm displacement prior to unloading. These were the short surface notchedspecimens in tempered and normalised materials. All other weld tests failed after attainment of maximum load.
8.3 Heat Affected Zones (Flux Cored Arc Welds)
The results of CCT tests on specimens notched into the HAZ of the FCAW welds are given in Figs. 52 to 55 andAppendix 11, Figs. A11.1 to A11.8. The characteristics of the FCAW HAZ tests were in many ways similar to the weldmetal tests, except that most of these tests ended in brittle fracture initiating from the grain coarsened HAZ. Post testsectioning of the specimens revealed that all three of the deep surface notched tests had notches located in the HAZwithin 0.6 mm of the fusion line. For the shallow notched tests, two crack tips were located in the fine grained HAZ ~1to 2 mm from the fusion line, and the third (Q & T material) had the crack tip in weld metal close to the fusion line.
In terms of load - displacement curves, none of the tests on the HAZ of the undermatched welds reached themaximum loads sustained in equivalent weld free plates, but the loads sustained by the overmatched welds were ingeneral similar to those of the weld free plates. (Note that the slightly lower loads in the shallow notched test (M =2.15) is probably due to reduced section thickness where the weld cap and backing were removed).
CMOD v displacement and δ5 v displacement data showed similar characteristics to the weld centreline tests in sofar as the highest CMOD (Fig. 54) or δ5 (Fig. A11.7) for a given displacement generally occurred in undermatchedwelds and the lowest crack opening in the most highly overmatched welds. The exceptions to this were the tests withthe deep semi - elliptical notches where the undermatched (M = 0.95) and nominally matched (M = 1.35) testsshowed similar behaviour with all the displacement being due to crack opening (Fig. A11.3). For this notch geometry,the highly overmatched condition (M = 2.15) resulted in reduced CMOD for a given displacement level, once grosssection yielding was reached.

BRITE-EURAM SINTAP S454 BRPR-CT95-0024Contribution to BE95-1426 Task 1 Sub-Task 1.3 24/3/99 CONFIDENTIAL
12
Strain gauge data for the FCAW HAZ notched tests (Figs. 55, A11.4 and A11.8) showed that the levels of local strain inthe plane of the notch were highest for the undermatched welds and lowest for the overmatched welds. The remotestrain gauges indicated that GSY was reached in the normalised (M = 2.15) and tempered (M = 1.35) plates withshallow surface notches and the normalised plate with the deep surface notch. Gross section yielding was notreached in any of the undermatched welds.
8.4 Heat Affected Zones (Submerged Arc Welds)
The results of the CCT tests conducted on specimens having notches in the HAZ of the SAW welds are presented inFigs. 56 to 59 and Appendix 12, Figs. A12.1 to A12.4. Of the six tests conducted, five had notches located within 0.4mm of the fusion line and all of these tests terminated in brittle fracture. The sixth test (shallow notched in thematched condition) had been accidentally notched at the weld metal centreline and was therefore not included in thesummary figures. However, this test was unloaded without fracture at a displacement of ~10 mm on the 150 mmgauge length. Due to the brittle nature of the SAW HAZ at room temperature, three tests failed at CMOD values <1.0mm (e.g. both shallow notched tests and the undermatched deep notched test).
In terms of load - displacement behaviour, the lowest levels of displacement were measured for the undermatchedtests (M ~0.65), where displacements of ~1 mm were measured on the 150 mm gauge length of the LVDT (i.e. ~0.7%strain) as shown in Figs. 56 and A12.1. The overmatched tests (M ~1.62) on the other hand reached displacementsof between 4.5 and 6 mm (i.e. ~3 to 4% strain). The matched condition test (M ~1.01) behaved in a similar way to theundermatched tests with a displacement of just more than 1 mm.
Comparison of the CMOD - displacement data showed that in the latter stages of the tests more crack openingoccurred for a given displacement in the undermatched condition. However, this effect was not observed for the initialloading of the deeper notched tests where all the displacement was due to crack opening.
Strain gauge data was not recorded for the local strain gauge in the overmatched short cracked specimen. However,the remote gauge indicated that GSY occurred at an early stage in this test. Corresponding data for theundermatched test indicated that surface strains remote from the notch remained elastic indicating that GSY was notreached in this test. The strain gauge data for the deep notched tests (Appendix 12 Fig. A12.4) was a little confusingin so far as the lowest levels of surface strain recorded on the local gauges were for the matched condition (M ~1.01).For both the over and undermatched tests, the initial rise in strain measured by the local gauges versusdisplacement was very high (about 4 times that observed in the FCAW HAZs). This may have been due to the lowerstrength of the SAW HAZ compared to the FCAW HAZ (local undermatching compared to local overmatching).Remote strain gauges showed that surface strains remained elastic for the undermatched and matched tests (M~0.71 and 1.01) whereas plasticity was transferred into the gross section for the overmatched test after ~1.3 mm ofdisplacement indicating gross section yielding in the overmatched test.
9. CONCLUSIONS
1. For parent plates, weld metal centreline and HAZ (FL) tests a clear and consistent effect of notch depthon fracture toughness transition temperature was observed with short cracks a/w 0.15 havingtransitions about 20 to 40°C lower than corresponding deep notches specimens. Through thicknessnotched orientations tended to have the highest transition temperatures.
2. Studies undertaken on SENB fracture toughness test specimens with notches in a high strength HAZ(FCAW procedure) tended to show higher values of CTOD to BS 7448 in overmatched compared toundermatched welds. The effect was most marked in the transition region where comparison of testspecimens revealed crack growth away from the HAZ towards the softer plate material in theovermatched specimens.
3. Similar studies on the lower strength HAZ (SAW procedure) were less conclusive due to experimentaldifficulties in obtaining over and undermatched specimens sampling identical microstructures.However, where valid comparisons could be made, the same type of effect was observed.
4. Studies conducted on SENB fracture toughness specimens with notches at the weld metal centreline(FCAW procedure) produced some contradictory results. For shallow cracks, higher values of CTODto BS 7448 were measured in the highly overmatched weld metal, but for deep through thicknesscracks, the results were contradictory, possibly as a result of weld to weld variations in fractureproperties.
BRITE-EURAM SINTAP S454 BRPR-CT95-0024Contribution to BE95-1426 Task 1 Sub-Task 1.3 24/3/99 CONFIDENTIAL
13
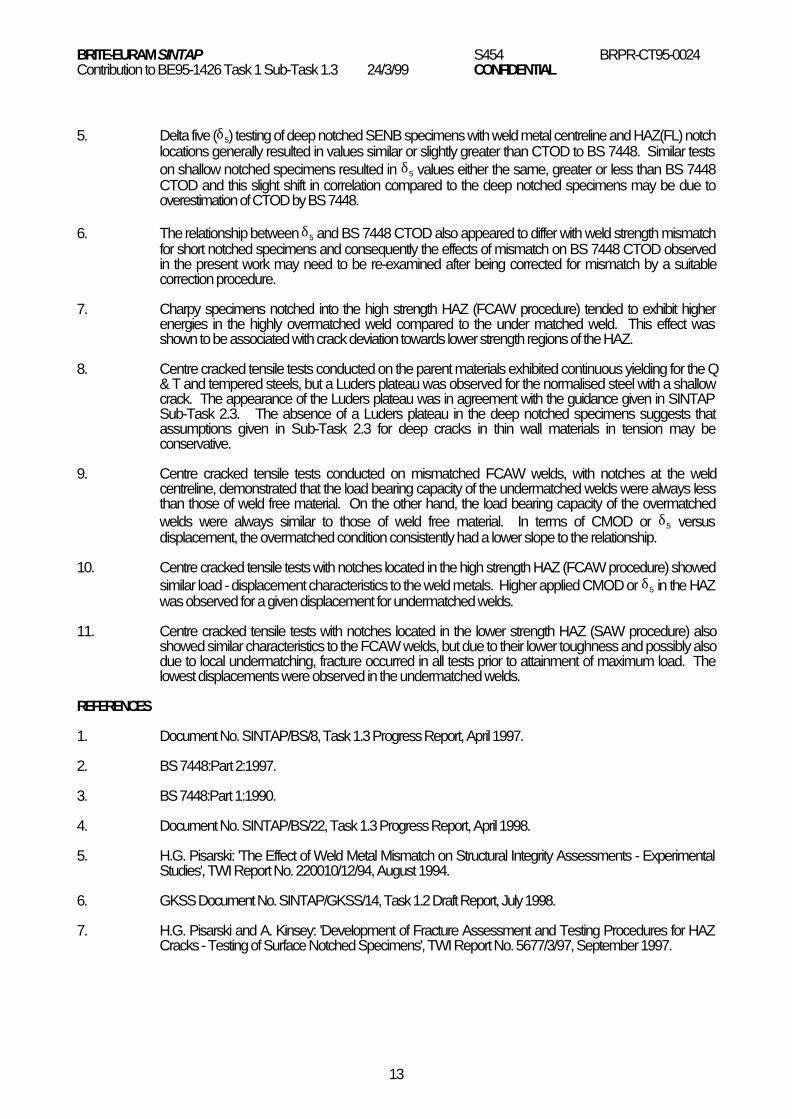
5. Delta five (δ5) testing of deep notched SENB specimens with weld metal centreline and HAZ(FL) notchlocations generally resulted in values similar or slightly greater than CTOD to BS 7448. Similar testson shallow notched specimens resulted in δ5 values either the same, greater or less than BS 7448CTOD and this slight shift in correlation compared to the deep notched specimens may be due tooverestimation of CTOD by BS 7448.
6. The relationship between δ5 and BS 7448 CTOD also appeared to differ with weld strength mismatchfor short notched specimens and consequently the effects of mismatch on BS 7448 CTOD observedin the present work may need to be re-examined after being corrected for mismatch by a suitablecorrection procedure.
7. Charpy specimens notched into the high strength HAZ (FCAW procedure) tended to exhibit higherenergies in the highly overmatched weld compared to the under matched weld. This effect wasshown to be associated with crack deviation towards lower strength regions of the HAZ.
8. Centre cracked tensile tests conducted on the parent materials exhibited continuous yielding for the Q& T and tempered steels, but a Luders plateau was observed for the normalised steel with a shallowcrack. The appearance of the Luders plateau was in agreement with the guidance given in SINTAPSub-Task 2.3. The absence of a Luders plateau in the deep notched specimens suggests thatassumptions given in Sub-Task 2.3 for deep cracks in thin wall materials in tension may beconservative.
9. Centre cracked tensile tests conducted on mismatched FCAW welds, with notches at the weldcentreline, demonstrated that the load bearing capacity of the undermatched welds were always lessthan those of weld free material. On the other hand, the load bearing capacity of the overmatchedwelds were always similar to those of weld free material. In terms of CMOD or δ5 versusdisplacement, the overmatched condition consistently had a lower slope to the relationship.
10. Centre cracked tensile tests with notches located in the high strength HAZ (FCAW procedure) showedsimilar load - displacement characteristics to the weld metals. Higher applied CMOD or δ5 in the HAZwas observed for a given displacement for undermatched welds.
11. Centre cracked tensile tests with notches located in the lower strength HAZ (SAW procedure) alsoshowed similar characteristics to the FCAW welds, but due to their lower toughness and possibly alsodue to local undermatching, fracture occurred in all tests prior to attainment of maximum load. Thelowest displacements were observed in the undermatched welds.
REFERENCES
1. Document No. SINTAP/BS/8, Task 1.3 Progress Report, April 1997.
2. BS 7448:Part 2:1997.
3. BS 7448:Part 1:1990.
4. Document No. SINTAP/BS/22, Task 1.3 Progress Report, April 1998.
5. H.G. Pisarski: 'The Effect of Weld Metal Mismatch on Structural Integrity Assessments - ExperimentalStudies', TWI Report No. 220010/12/94, August 1994.
6. GKSS Document No. SINTAP/GKSS/14, Task 1.2 Draft Report, July 1998.
7. H.G. Pisarski and A. Kinsey: 'Development of Fracture Assessment and Testing Procedures for HAZCracks - Testing of Surface Notched Specimens', TWI Report No. 5677/3/97, September 1997.

BR
ITE-E
UR
AM
SIN
TA
PS
454 BR
PR
-CT
95-0024
Contribution to B
E95-1426 T
ask 1 Sub-T
ask 1.3 24/3/99
CO
NFID
EN
TIAL
TABLE 1TESTING MATRIX FOR MULTIPASS JOINTS
Room TemperatureTensile Tests CTOD and Centre Cracked Tensile Tests
Test Weld CR Aim PP Aim W/M Aim HAZ Aim M/M HAZ Notched WM Notched PP NotchedSeries 800 - 500°C
(s)Yield(MPa)
Yield(MPa)
Yield(MPa)
Ratio(m)
WM PP HAZ a/w0.15
a/w0.5 TTN
a/w0.15
a/w0.5 TTN
a/w0.15
a/w0.5 TTN
1 NA 650 NA NA NA NA X NA - - - - - - XO XO XO2 NA 500 NA NA NA NA X NA - - - - - - XO XO XO3 NA 350 NA NA NA NA X NA - - - - - - XO XO XO4 10 s 650 500 >WM 0.77 - - XO XO XO XO X XO XO - - -5 10 s 500 500 >WM 1.00 - - O XO XO - X XO - - - -6 10 s 350 500 >WM 1.43 - - O XO XO XO X XO XO - - -7 125 s 350 500 <WM 0.77 - - XO XO XO - - - - - - -8 125 s 500 500 <WM 1.00 - - O XO XO - - - - - - -9 125 s 350 500 <WM 1.43 - - O XO XO - - - - - - -
(X) HAZ tensiles on simulated/heat treated HAZ (British Steel) (O) Micro-tensiles on multipass welds (GKSS)(X) Centre cracked tensiles to define crack tip driving force curves (British Steel)(X) CTOD tests to define transition behaviour (British Steels) (O) R - curves and selected δ5 measurements (GKSS)
TABLE 2STEEL COMPOSITION AND PROCESSING
C Si Mn P S Cr Mo Ni Al Cu Nb B Ti V CE0.13 0.41 1.42 0.015 0.002 0.023 0.003 0.022 0.042 0.012 0.034 0.0024 0.038 0.063 0.387
Steelmaking Process - BOSCasting - Continuously CastHeat TreatmentReheated - 930°C for 50 minQuenched and Tempered - 580°C for 1 h

BR
ITE-E
UR
AM
SIN
TA
PS
454 BR
PR
-CT
95-0024
Contribution to B
E95-1426 T
ask 1 Sub-T
ask 1.3 24/3/99
CO
NFID
EN
TIAL
TABLE 3SUMMARY OF TEST WELDS AND HARDNESS DATA
WeldingWeld Code Weld Metal
HardnessHAZ HV
(FL)Weld Code Weld Metal
HardnessHAZ HV
(FL)Weld Code Weld Metal
HardnessHAZ HV
(FL)Test Specimens Process HIGH YIELD PLATE MEDIUM YIELD PLATE LOW YIELD PLATE
WM CCT SN a/w 0.15, 0.5, TTN FCAW Y6A19C Y6A21C Y6A20CWM CTOD SN a/w = 0.15 FCAW Y6A19G Y6A21D 220 262 Y6A20D 231 264WM CTOD SN a/w = 0.5 FCAW Y6A19H Y6A18R 232 281 Y6A20E 221 248WM CTOD TTN FCAW Y6A18M 236 283 NA Y6A18P 237 284WM CHARPY FCAW Y6A18D 229 284 Y6A18G 246 271 Y6A18J 236 281HAZ CCT SN a/w 0.15, 0.5, TTN FCAW Y6A19F Y6A21F Y6A20FHAZ CTOD SN a/w = 0.15 FCAW Y6A18N 233 257 Y6A21G 231 262 Y6A20G 223 290HAZ CTOD SN a/w = 0.5 FCAW Y6A19D Y6A21H 223 287 Y6A20H 251 265HAZ CTOD TTN FCAW Y6A18L 229 279 NA Y6A18O 233 284HAZ CHARPY FCAW Y6A18C 244 272 Y6A18F 239 277 Y6A18I 231 280HAZ CCT SN a/w 0.15, 0.5 SAW Y6A19I Y6A21I Y6A20IHAZ CTOD SN a/w = 0.15 SAW Y6A19J 195 234 Y6A21J 187 224 Y6A20J 199 201HAZ CTOD SN a/w = 0.5 SAW Y6A19K 194 237 Y6A21K 184 225 Y6A20K 198 225HAZ CHARPY SAW Y6A18E 196 220 Y6A18H 190 235 Y6A18K 196 232

BR
ITE-E
UR
AM
SIN
TA
PS
454 BR
PR
-CT
95-0024
Contribution to B
E95-1426 T
ask 1 Sub-T
ask 1.3 24/3/99
CO
NFID
EN
TIAL
TABLE 4PARENT PLATE TENSILE PROPERTIES
Steel ConditionAverage Yield
Strength(N/mm2)
StandardDeviation
AverageTensile Strength
(N/mm2)StandardDeviation
Yield to TensileRatio
StrainHardeningExponent n
Q&T + PWHT 675 34 753 23 0.9 0.088675°C Temper + PWHT 475 42 610 21 0.78 0.117900°C Normalise + PWHT 297 9 510 3 0.58 0.239
TABLE 5WELD METAL TENSILE PROPERTIES
Weld TypeAverage Yield
Strength(N/mm2)
StandardDeviation
AverageTensile Strength
(N/mm2)StandardDeviation
Yield to TensileRatio
StrainHardeningExponent n
FCAW 545 *639 +
-15
619709
-13
0.880.90
-0.111
SAW 489 *475 +480 †
-1413
594590591
-1310
0.820.810.81
-0.147
* All WM tests on procedure weld+ Waisted transverse tensiles from test panels† Mean of all tests

BRITE-EURAM SINTAP S454 BRPR-CT95-0024Contribution to BE95-1426 Task 1 Sub-Task 1.3 24/3/99 CONFIDENTIAL
F1
FIG. 1 EXPERIMENTAL PROCEDURE (D0697E06)
FIG. 2 AIM MISMATCH LEVELS WITH HEAT TREATED PLATES (D0697E06)
CTOD/CMOD
STRESS/STRAIN
XX
X
XX
X
XX
X
XX
X
CTOD
TEMP.
Driving Force Curves
CCT TESTSSN a/B 0.15SN a/B 0.5TTN
CTOD TESTS SN a/w 0.15 and 0.5
CTOD TESTSTTN a/w 0.5
Transition Curves
0
200
400
600
800
1,000Yield Strength, N/mm²
0
200
400
600
800
1,000Yield Strength (N/mm²)
0
200
400
600
800
1,000Yield Strength (N/mm²)
0
200
400
600
800
1,000Yield Strength (N/mm²)
0
200
400
600
800
1,000Yield Strength (N/mm²)
WM HAZ PLATE
WM HAZ PLATE
UM : M = 0.77 HAZ > WM UM : M = 0.77 HAZ < WM
OM : M = 1.43 OM : M = 1.43
MM : M = 1 MM : M = 1
WM HAZ PLATE
WM HAZ PLATE
WM HAZ PLATE
WM HAZ PLATE
FCAW PROCEDURE SAW PROCEDURE
PLATE YS650 N/mm²
PLATE YS500 N/mm²
PLATE YS350 N/mm²
0
200
400
600
800
1,000Yield Strength, N/mm²

BRITE-EURAM SINTAP S454 BRPR-CT95-0024Contribution to BE95-1426 Task 1 Sub-Task 1.3 24/3/99 CONFIDENTIAL
F2
FIG. 3 MULTIPASS FLUX-CORED ARC WELDING PROCEDURE - 1 kJ/mm (D0697E06)
FIG. 4 MULTIPASS SUBMERGED ARC WELDING PROCEDURE - 5 kJ/mm (D0697E06)
1 2
34
56
78
910
1112
1314
16 mm
25 mm
80°
Welding Conditions
Current 250 AVoltage 30 VTravel speed 358 mm/minWire diameter 1.2 mmPreheat 100°CIntepass 150°CWire Fluxofil 35Gas Argoshield 20Arc energy 1.25 kJ/mm
14 mm
25 mm
75°
Welding Conditions
Current 700 AVoltage 30 VTravel speed 250 mm/minWire diameter 3.25 mmPreheat 200°CIntepass 250°CWire OESD3 1Ni¼MoFlux OP121TT
1
2
3
4
5 6
BRITE-EURAM SINTAP S454 BRPR-CT95-0024Contribution to BE95-1426 Task 1 Sub-Task 1.3 24/3/99 CONFIDENTIAL
F3
FIG. 5 HARDNESS TRAVERSES AT MID-THICKNESS (D0697E06)FOR FCAW AND SAW PROCEDURES
(PROCEDURE TEST WELDS)
FIG. 6 PARENT PLATE AND SAW WELD METAL (D0697E06)YIELD STRENGTH RESULTS
WM
HAZHAZ
160
180
200
220
240
260
280
300
320
Distance (mm)
Hardness (HV(10))
FCAW SAW
200 260 300 340 380 420 460 500 540 580 620 660 700 740 7800
5
10
15
20
Yield Strength (N/mm²)
Frequency
QT+NQT+TQTSAW WM
Normalised plateAv. 297 N/mm²from 15 testsstd. dev. 9 N/mm²
QT plateAv. 675 N/mm²from10 testsstd. dev. 34 N/mm²
Temperd plateAv. 475 N/mm²from 17 testsstd. dev. 42 N/mm²
SAW weld metalAv. 480 N/mm²from 6 testsstd. dev. 13 N/mm²

BRITE-EURAM SINTAP S454 BRPR-CT95-0024Contribution to BE95-1426 Task 1 Sub-Task 1.3 24/3/99 CONFIDENTIAL
F4
FIG. 7 PARENT PLATE AND FCAW WELD METAL (D0697E06)YIELD STRENGTH RESULTS
FIG. 8 ACHIEVED MISMATCH LEVELS WITH HEAT TREATED PLATES (D0697E06)
200 260 300 340 380 420 460 500 540 580 620 660 700 740 7800
5
10
15
20
Yield Strength (N/mm²)
Frequency
QT+NQT+TQTFCAW WM
Normalised plateAv. 297 N/mm²from 15 testsstd. dev. 9 N/mm²
QT plateAv. 675 N/mm²from10 testsstd. dev. 34 N/mm²
Temperd plateAv. 475 N/mm²from 17 testsstd. dev. 42 N/mm²
FCAW weld metal(test plates)Av. 639 N/mm²from 12 testsstd. dev. 15 N/mm²FCAW weld metal
(procedure plate)Av. 545 N/mm²
0
200
400
600
800
1,000Yield Strength (N/mm²)
0
200
400
600
800
1,000Yield Strength (N/mm²)
0
200
400
600
800
1,000Yield Strength (N/mm²)
0
200
400
600
800
1,000Yield Strength (N/mm²)
0
200
400
600
800
1,000Yield Strength (N/mm²)
0
200
400
600
800
1,000Yield Strength (N/mm²)
UM : M = 0.95 GCHAZ > WM UM : M = 0.71 HAZ < WM
OM : M = 2.15 OM : M = 1.62
MM : M =1.35 MM : M = 1.01
Low Heat Input FCAW High Heat Input SAW
PLATE YS~675 N/mm²
PLATE YS~475 N/mm²
PLATE YS~300 N/mm²
WM GCHAZ PLATE HAZ
WM GCHAZ PLATE HAZ
WM GCHAZ PLATE HAZ
WM GCHAZ PLATE HAZ
WM GCHAZ PLATE HAZ
WM GCHAZ PLATE HAZ

BRITE-EURAM SINTAP S454 BRPR-CT95-0024Contribution to BE95-1426 Task 1 Sub-Task 1.3 24/3/99 CONFIDENTIAL
F5
FIG. 9 CHARPY TRANSITION CURVES FOR PARENT (D0697E06)MATERIALS TRANSVERSE - SUBSURFACE
FIG. 10 CHARPY TRANSITION CURVES FOR FCAW WELD (D0697E06)METAL TRANSVERSE - SUBSURFACE (ROOT)
Normalised
Q & T
Tempered
-80 -60 -40 -20 0 20 40 600
50
100
150
200
250
Temperature (°C)
Energy (J)
Individual Mean
M ~ 2.15
M ~ 0.95
M ~ 1.35
-120 -100 -80 -60 -40 -20 0 200
50
100
150
200
250
Temperature (°C)
Energy (J)
Individual Mean

BRITE-EURAM SINTAP S454 BRPR-CT95-0024Contribution to BE95-1426 Task 1 Sub-Task 1.3 24/3/99 CONFIDENTIAL
F6
FIG. 11 CHARPY TRANSITION CURVES FOR FCAW HAZ (PWHT) (D0697E07)TRANSVERSE - SUBSURFACE (ROOT)
FIG. 12 CHARPY RESULTS FOR FCAW HAZ (PWHT) (D0697E07)TRANSVERSE - SUBSURFACE (ROOT)
M ~ 2.15
M ~ 0.95
M ~ 1.35
-100 -80 -60 -40 -20 0 20 400
50
100
150
200
250
Temperature (°C)
Energy (J)
Individual Mean
-80 -60 -40 -20 0 20 40 60 80 100 1200
50
100
150
200
250
Temperature (°C)
Energy (J)
M = 0.84Undematch
M = 1.35
M = 2.15Overmatching
BRITE-EURAM SINTAP S454 BRPR-CT95-0024Contribution to BE95-1426 Task 1 Sub-Task 1.3 24/3/99 CONFIDENTIAL
F7
Y6A18I (M = 2.15) 285 at -60°C x 8
Y6A18F (M = 1.35) 9 J at -60°C x 8
(a) Macrographs illustrating Charpy notch locations in highlyovermatched (M = 2.15) and overmatched
(M = 1.35) specimens tested at -60°CFIG. 13(a and b)(Cont . . . )

BRITE-EURAM SINTAP S454 BRPR-CT95-0024Contribution to BE95-1426 Task 1 Sub-Task 1.3 24/3/99 CONFIDENTIAL
F8
FL
Y6A18I (M = 2.15) 64 J at -60°C x 8
FL
Y6A18F (M = 1.35) 13 J at -60°C x 8
(b) Macrographs illustrating fracture paths in highlyovermatched (M = 2.15) and slightly overmatched
(M = 1.35) specimens tested at -60°C
FIG. 13(a and b) (Continued)

BRITE-EURAM SINTAP S454 BRPR-CT95-0024Contribution to BE95-1426 Task 1 Sub-Task 1.3 24/3/99 CONFIDENTIAL
F9
FIG. 14 CHARPY TRANSITION CURVES FOR SAW HAZ (PWHT) (D0697E07)TRANSVERSE - SUBSURFACE (ROOT)
FIG. 15 CHARPY RESULTS FOR SAW HAZ (PWHT) (D0697E07)TRANSVERSE - SUBSURFACE (ROOT)
M = 1.62
M = 0.71
M = 1.01
-20 0 20 40 60 80 100 1200
50
100
150
200
250
Temperature (°C)
Energy (J)
Individual Mean
-80 -60 -40 -20 0 20 40 60 80 100 1200
50
100
150
200
250
Temperature (°C)
Energy (J)
UndermatchM = 0.71
'Matched'M = 1.01
OvermatcedM = 1.62
BRITE-EURAM SINTAP S454 BRPR-CT95-0024Contribution to BE95-1426 Task 1 Sub-Task 1.3 24/3/99 CONFIDENTIAL
F10
FIG. 16 CTOD TRANSITION DATA FOR RQT701 (D0697E07)(PWHT) - TRANSVERSE
FIG. 17 CTOD TRANSITION DATA FOR TEMPERED (D0697E07)RQT701 (PWHT) - TRANSVERSE
-80 -60 -40 -20 0 20 400
0.1
0.2
0.3
0.4
0.5
0.6
0.7
0.8
0.9
1
Temperature (°C)
CTOD (mm)
SN a/w 0.15
TTN a/w 0.5
SN a/w 0.5
-120 -100 -80 -60 -40 -20 0 200
0.5
1
1.5
2
2.5
3
3.5
Temperature (°C)
CTOD (mm)
SN a/w 0.15
TTN a/w 0.5
SN a/w 0.5

BRITE-EURAM SINTAP S454 BRPR-CT95-0024Contribution to BE95-1426 Task 1 Sub-Task 1.3 24/3/99 CONFIDENTIAL
F11
FIG. 18 CTOD TRANSITION DATA FOR NORMALISED (D0697E07)RQT701 (PWHT) - TRANSVERSE
FIG. 19 COMPARISON OF CTOD TRANSITION DATA FOR PARENT (D0697E07)PLATES (PWHT) - TRANSVERSE - THROUGH
THICKNESS NOTCH a/w 0.5
-80 -60 -40 -20 0 20 40 600
0.5
1
1.5
2
2.5
3
3.5
Temperature (°C)
CTOD (mm)
SN a/w 0.15
TTN a/w 0.5
SN a/w 0.5
-100 -80 -60 -40 -20 0 20 40 60 80
0.5
1
1.5
2
2.5
3
3.5
Temperature (°C)
CTOD (mm)
Normalised
Tempered
Q&T

BRITE-EURAM SINTAP S454 BRPR-CT95-0024Contribution to BE95-1426 Task 1 Sub-Task 1.3 24/3/99 CONFIDENTIAL
F12
FIG. 20 COMPARISON OF CTOD TRANSITION DATA FOR PARENT (D0697E07)PLATES (PWHT) - TRANSVERSE - SURFACE NOTCH a/w 0.5
FIG. 21 COMPARISON OF CTOD TRANSITION DATA FOR PARENT (D0697E07)PLATES (PWHT) - TRANSVERSE - SURFACE NOTCH a/w 0.15
-100 -80 -60 -40 -20 0 20 40 60 800
0.1
0.2
0.3
0.4
0.5
0.6
0.7
0.8
0.9
1
Temperature (°C)
CTOD (mm)
Normalised
Tempered
Q&T
-100 -80 -60 -40 -20 0 20 40 60 800
0.1
0.2
0.3
0.4
0.5
0.6
0.7
0.8
0.9
1
Temperature (°C)
CTOD (mm)
Normalised
Tempered
Q&T

BRITE-EURAM SINTAP S454 BRPR-CT95-0024Contribution to BE95-1426 Task 1 Sub-Task 1.3 24/3/99 CONFIDENTIAL
F13
Y6A20E SN a/w 0.5 x 2 Y6A20D SN a/w 0.15 x 2
Y6A18M TTN a/w 0.5 x 2
FIG. 22 MACROGRAPHS ILLUSTRATING NOTCH LOCATIONSFOR FCAW WELD CENTRELINE TESTS

BRITE-EURAM SINTAP S454 BRPR-CT95-0024Contribution to BE95-1426 Task 1 Sub-Task 1.3 24/3/99 CONFIDENTIAL
F14
FIG. 23 BS 7448 CTOD TRANSITION DATA FOR FCAW WM (PWHT) - (D0697E08)TRANSVERSE - EFFECT OF NOTCH DEPTH AND
ORIENTATION (M = 2.15)
FIG. 24 COMPARISON OF CTOD TRANSITION DATA FOR FCAW WM (D0697E08)(PWHT) - TRANSVERSE - THROUGH THICKNESS NOTCH
a/w 0.5 - WELD CENTRELINE
-100 -80 -60 -40 -20 0 20 40 600
0.2
0.4
0.6
0.8
1
1.2
1.4
Temperature (°C)
CTOD (mm)
SN a/w 0.15
TTN a/w 0.5
SN a/w 0.5
-100 -80 -60 -40 -20 0 20 40 60 800.01
0.02
0.03
0.05
0.1
0.2
0.3
0.5
Temperature (°C)
CTOD (mm)
M = 0.95
M = 2.15

BRITE-EURAM SINTAP S454 BRPR-CT95-0024Contribution to BE95-1426 Task 1 Sub-Task 1.3 24/3/99 CONFIDENTIAL
F15
FIG. 25 COMPARISON OF CTOD TRANSITION DATA FOR FCAW WM (D0697E08)(PWHT) - TRANSVERSE - SURFACE NOTCH
a/w 0.5 - WELD CENTRELINE
FIG. 26 COMPARISON OF CTOD TRANSITION DATA FOR FCAW WM (D0697E08)(PWHT) - TRANSVERSE - SURFACE NOTCH
a/w 0.15 - WELD CENTRELINE
-100 -80 -60 -40 -20 0 20 40 600.01
0.02
0.03
0.05
0.1
0.2
0.3
0.5
Temperature (°C)
CTOD (mm)
M = 0.95
M = 1.35
M = 2.15
-100 -80 -60 -40 -20 0 20 40 600.1
0.2
0.3
0.5
1
Temperature (°C)
CTOD (mm)
M = 0.95
M = 1.35
M = 2.15

BRITE-EURAM SINTAP S454 BRPR-CT95-0024Contribution to BE95-1426 Task 1 Sub-Task 1.3 24/3/99 CONFIDENTIAL
F16
FIG. 27 δδ 5 v CTOD FOR FCAW WELD METAL (PWHT) - TRANSVERSE - (D0697E08)THROUGH THICKNESS AND SURFACE NOTCH a/w 0.5
FIG. 28 δδ 5 v CTOD FOR FCAW WELD METAL (PWHT) - TRANSVERSE - (D0697E08)SURFACE NOTCH a/w 0.15
0 0.2 0.4 0.6 0.8 10
0.2
0.4
0.6
0.8
1
CTOD (mm)
(mm)
M=0.95 (TTN)
M=2.15 (TTN)
M=0.95 (SN)
M=1.35 (SN)
M=2.15 (SN)
δ5
0 0.2 0.4 0.6 0.8 1 1.2 1.40
0.2
0.4
0.6
0.8
1
1.2
1.4
CTOD (mm)
(mm)
M=0.95
M=1.35
M=2.15
δ5

BRITE-EURAM SINTAP S454 BRPR-CT95-0024Contribution to BE95-1426 Task 1 Sub-Task 1.3 24/3/99 CONFIDENTIAL
F17
Y6A21H SN a/w 0.5 x 2 Y6A21G SN a/w 0.15 x 2
Y6A18L TTN a/w 0.5 x 2
FIG. 29 MACROGRAPHS ILLUSTRATING NOTCH LOCATIONSFOR FCAW HAZ NOTCHED TESTS
BRITE-EURAM SINTAP S454 BRPR-CT95-0024Contribution to BE95-1426 Task 1 Sub-Task 1.3 24/3/99 CONFIDENTIAL
F18
FIG. 30 BS 7448 CTOD TRANSITION DATA FOR FCAW HAZ (PWHT) - (D0697E08)TRANSVERSE - EFFECT OF NOTCH DEPTH AND
ORIENTATION (M = 2.15)
FIG. 31 COMPARISON OF CTOD TRANSITION DATA FOR FCAW HAZ (D0697E08)(PWHT) - TRANSVERSE - THROUGH THICKNESS
NOTCH a/w 0.5 - NOTCH IN HAZ
-80 -60 -40 -20 0 20 40 600
0.2
0.4
0.6
0.8
1
1.2
1.4
1.6
1.8
2
Temperature (°C)
CTOD (mm)
SN a/w 0.15
TTN a/w 0.5
SN a/w 0.5
-80 -60 -40 -20 0 20 40 60 800.01
0.02
0.05
0.1
0.2
0.5
1
2
5
Temperature (°C)
CTOD (mm)
M=0.95 (>15%GC) M=0.95 (<15%GC) M=2.15 (>15%GC) M=2.15 (<15%GC)

BRITE-EURAM SINTAP S454 BRPR-CT95-0024Contribution to BE95-1426 Task 1 Sub-Task 1.3 24/3/99 CONFIDENTIAL
F19
FIG. 32 COMPARISON OF CTOD TRANSITION DATA FOR FCAW (D0697E09)HAZ (PWHT) - TRANSVERSE - SURFACE NOTCH
a/w 0.5 - NOTCH IN HAZ
FIG. 33 COMPARISON OF CTOD TRANSITION DATA FOR FCAW (D0697E09)HAZ (PWHT) - TRANSVERSE - SURFACE NOTCH
a/w 0.15 - NOTCH IN HAZ
-80 -60 -40 -20 0 20 40 60 800.01
0.02
0.05
0.1
0.2
0.5
1
2
5
Temperature (°C)
CTOD (mm)
M=2.15 (GC)
M=2.15 (WM)
M=2.15 (GR)
M=2.15 (FL)
M=0.95 (GC)
M=0.95 (WM)
M=0.95 (GR)

BRITE-EURAM SINTAP S454 BRPR-CT95-0024Contribution to BE95-1426 Task 1 Sub-Task 1.3 24/3/99 CONFIDENTIAL
F20
Y7K82D (M ~0.95) x 5 Y6A20H4 (M ~2.15) x 5CTOD = 0.036 mm at -40°C CTOD = 0.352 mm at -40°C
FIG. 34 MACROGRAPHS ILLUSTRATING THE EFFECT OF WELD METALSTRENGTH MISMATCH ON FRACTURE OF FUSION LINENOTCHED CTOD SPECIMENS WITH DEEP NOTCHES(ARROWS SHOW FATIGUE CRACK TIP LOCATIONS)

BRITE-EURAM SINTAP S454 BRPR-CT95-0024Contribution to BE95-1426 Task 1 Sub-Task 1.3 24/3/99 CONFIDENTIAL
F21
Y6A18N11 (M ~0.95) x 5 Y6A20G1 (M ~2.15) x 5CTOD = 0.346 mm at RT CTOD = 1.751 mm at RT
FIG. 35 MACROGRAPHS ILLUSTRATING THE EFFECT OF WELD METALSTRENGTH MISMATCH ON FRACTURE OF FUSION LINE
NOTCHED CTOD SPECIMENS WITH SHALLOW NOTCHES(ARROWS SHOW FATIGUE CRACK TIP LOCATIONS)

BRITE-EURAM SINTAP S454 BRPR-CT95-0024Contribution to BE95-1426 Task 1 Sub-Task 1.3 24/3/99 CONFIDENTIAL
F22
FIG. 36 δδ 5 v CTOD FOR FCAW HAZ (PWHT) - TRANSVERSE - THROUGH (D0697E09)THICKNESS AND SURFACE NOTCH a/w 0.5
FIG. 37 δδ 5 v CTOD FOR FCAW HAZ (PWHT) - TRANSVERSE - (D0697E09)SURFACE NOTCH a/w 0.15
0 0.2 0.4 0.6 0.8 10
0.2
0.4
0.6
0.8
1
CTOD (mm)
(mm)
M=0.95 (TTN)
M=2.15 (TTN)
M=0.95 (SN)
M=1.35 (SN)
M=2.15 (SN)
δ5
0 0.2 0.4 0.6 0.8 1 1.20
0.2
0.4
0.6
0.8
1
1.2
CTOD (mm)
(mm)
M=0.95
M=1.35
M=2.15
δ5

BRITE-EURAM SINTAP S454 BRPR-CT95-0024Contribution to BE95-1426 Task 1 Sub-Task 1.3 24/3/99 CONFIDENTIAL
F23
FIG. 38 COMPARISON OF CTOD TRANSITION DATA FOR SAW HAZ (D0697E09)(PWHT) - TRANSVERSE - SURFACE NOTCH
a/w 0.5 - NOTCH IN HAZ
FIG. 39 COMPARISON OF CTOD TRANSITION DATA FOR SAW HAZ (D0697E09)(PWHT) - TRANSVERSE - SURFACE NOTCH
a/w 0.15 - NOTCH IN HAZ
-20 0 20 40 60 80 100 1200.01
0.02
0.05
0.1
0.2
0.5
1
2
5
Temperature (°C)
CTOD (mm)
M=1.62 (GC)
M=1.62 (WM)
M=1.62 (GR)
M=0.71 (GC)
M=0.71 (WM)
M=0.71 (GR)
-20 0 20 40 60 80 100 1200.01
0.02
0.05
0.1
0.2
0.5
1
2
5
Temperature (°C)
CTOD (mm)
M=1.62 (GC) M=1.62 (WM) M=1.62 (GR) M=0.71 (GC) M=0.71 (WM) M=0.71 (GR) M=0.71 (FL)
BRITE-EURAM SINTAP S454 BRPR-CT95-0024Contribution to BE95-1426 Task 1 Sub-Task 1.3 24/3/99 CONFIDENTIAL
F24
FIG. 40 δδ 5 v CTOD FOR SAW HAZ (PWHT) - TRANSVERSE - (D0697E09)SURFACE NOTCH a/w 0.5
FIG. 41 δδ 5 v CTOD FOR SAW HAZ (PWHT) - TRANSVERSE - (D0697E09)SURFACE NOTCH a/w 0.15
0 0.5 1 1.5 2 2.50
0.5
1
1.5
2
2.5
CTOD (mm)
(mm)
M=0.71
M=1.01
M=1.62
δ5
0 0.5 1 1.5 2 2.50
0.5
1
1.5
2
2.5
CTOD (mm)
(mm)
M=0.71
M=1.01
M=1.62
δ5

BRITE-EURAM SINTAP S454 BRPR-CT95-0024Contribution to BE95-1426 Task 1 Sub-Task 1.3 24/3/99 CONFIDENTIAL
F25
FIG. 42 CCT SPECIMEN GEOMETRY AND NOTCH DIMENSIONS (D0697E09)
FIG. 43 CCT SPECIMEN INSTRUMENTATION AND GAUGING DETAILS (D0697E09)
350 mm
100 or 185 mm 100 or 185 mm
100 mm Notch length25 or 50 mm
175 mm 175 mm
50 mm 50 mm25 mm
12.5 mm3.75 mm
80 mm
5 mm
δ
150 mm
Double knife edges mounted with single boltat specimen centreline
LVDT to measureover 150 mm gauge length(75 mm each side of notch)
'Local' straingauge (notchside)
'Remote' strain gauges(both sides of plate)
gauge
KEY
LVDT
Double knife edge
gauge
Strain gauge (post yield uniaxial type)
5
δ 5

BRITE-EURAM SINTAP S454 BRPR-CT95-0024Contribution to BE95-1426 Task 1 Sub-Task 1.3 24/3/99 CONFIDENTIAL
F26
FIG. 44 CCT TEST LOAD v DISPLACEMENT DATA FOR PARENT (D0697E10)MATERIALS - TRANSVERSE - SURFACE NOTCH a/t 0.15, a/c 0.3
FIG. 45 CCT TEST LOAD v CMOD DATA FOR PARENT MATERIALS - (D0697E10)TRANSVERSE - SURFACE NOTCH a/t 0.15, a/c 0.3
0 2 4 6 8 100
500
1,000
1,500
2,000
Displacement (mm)
Load (kN)
Q & T Normalised Tempered
100 mm
25 mm
2c
0 0.5 1 1.5 2 2.5 3 3.50
500
1,000
1,500
2,000
CMOD (mm)
Load (kN)
Q & T Normalised Tempered
100 mm
25 mm
2c

BRITE-EURAM SINTAP S454 BRPR-CT95-0024Contribution to BE95-1426 Task 1 Sub-Task 1.3 24/3/99 CONFIDENTIAL
F27
FIG. 46 CCT TEST CMOD v DISPLACEMENT DATA FOR PARENT (D0697E10)MATERIALS - TRANSVERSE - SURFACE NOTCH a/t 0.15, a/c 0.3
FIG. 47 CCT TEST STRAIN v DISPLACEMENT DATA FOR PARENT (D0697E10)MATERIALS - TRANSVERSE - SURFACE NOTCH a/t 0.15, a/c 0.3
0 2 4 6 8 100
0.5
1
1.5
2
2.5
3
3.5
Displacement (mm)
CMOD (mm)
Q & T Normalised Tempered
100 mm
25 mm
2c
Slip on LVDT2
0 1 2 3 4 50
5
10
15
20
Displacement (mm)
Strain (%)
Q & T
Normalised
Tempered
100 mm
25 mm
2c
QT(L)
QT (R)
T(L) N(L)
N(R) T(R)

BRITE-EURAM SINTAP S454 BRPR-CT95-0024Contribution to BE95-1426 Task 1 Sub-Task 1.3 24/3/99 CONFIDENTIAL
F28
FIG. 48 CCT TEST LOAD v DISPLACEMENT DATA FOR PARENT (D0697E10)MATERIALS AND FCAW WELDS - TRANSVERSE - SURFACE
NOTCH a/t 0.15, a/c 0.3 - NOTCH AT WELD CENTRELINE
FIG. 49 CCT TEST LOAD v CMOD DATA FOR PARENT MATERIALS (D0697E10)AND FCAW WELDS - TRANSVERSE - SURFACE NOTCH
a/t 0.15, a/c 0.3 - NOTCH AT WELD CENTRELINE
0 2 4 6 8 10 120
500
1,000
1,500
2,000
Displacement (mm)
Load (kN)
Q & T Parent
Normalised Parent
Q & T HAZM = 0.95
Normalised HAZM = 2.15
Tempered HAZM = 1.35
100 mm
25 mm
2c
M = 1.35
M = 2.15
M = 0.95
0 1 2 3 4 50
500
1,000
1,500
2,000
CMOD (mm)
Load (kN)
Q & TParent
NormalisedParent
Q & T HAZM = 0.95
Normalised HAZM = 2.15
Tempered HAZM = 1.35
100 mm
25 mm
2cM = 1.35
M = 2.15
M = 0.95

BRITE-EURAM SINTAP S454 BRPR-CT95-0024Contribution to BE95-1426 Task 1 Sub-Task 1.3 24/3/99 CONFIDENTIAL
F29
FIG. 50 CCT TEST CMOD v DISPLACEMENT DATA FOR PARENT (D0697E10)MATERIALS AND FCAW WELDS - TRANSVERSE - SURFACE
NOTCH a/t 0.15, a/c 0.3 - NOTCH AT WELD CENTRELINE
FIG. 51 CCT TEST STRAIN v DISPLACEMENT DATA FOR FCAW WELDS - (D0697E10)TRANSVERSE - SURFACE NOTCH a/t 0.15, a/c 0.3 - NOTCH
AT WELD METAL CENTRELINE
0 2 4 6 8 10 120
1
2
3
4
5
Displacement (mm)
CMOD (mm)
Q & TParent
NormalisedParent
Q & T HAZM = 0.95
Normalised HAZM = 2.15
Tempered HAZM = 1.35
100 mm
25 mm
2c
M = 1.35
M = 2.15
M = 0.95
0 1 2 3 4 50
2
4
6
8
10
Displacement (mm)
Strain (%)
Q & T HAZM = 0.95
Normalised HAZM = 2.15
Tempered HAZM = 1.35
100 mm
25 mm
2c
M = 1.35 (R)
M = 2.15 (L)
M = 0.95 (L)
M = 0.95 (R)
M = 2.15 (L)M = 1.35 (L)

BRITE-EURAM SINTAP S454 BRPR-CT95-0024Contribution to BE95-1426 Task 1 Sub-Task 1.3 24/3/99 CONFIDENTIAL
F30
FIG. 52 CCT TEST LOAD v DISPLACEMENT DATA FOR PARENT (D0697E10)MATERIALS AND FCAW WELDS - TRANSVERSE -SURFACE NOTCH a/t 0.15, a/c 0.3 - NOTCH IN HAZ
FIG. 53 CCT TEST LOAD V CMOD DATA FOR PARENT MATERIALS (D0697E10)AND FCAW WELDS - TRANSVERSE - SURFACE
NOTCH a/t 0.15, a/c 0.3 - NOTCH IN HAZ
0 2 4 6 8 10 120
500
1,000
1,500
2,000
Displacement (mm)
Load (kN)
Q & T Parent
Normalised Parent
Q & T HAZM = 0.95
Normalised HAZM = 2.15
Tempered HAZM = 1.35
100 mm
25 mm
2c
M = 1.35
M = 2.15
M = 0.95
0 1 2 3 4 50
500
1,000
1,500
2,000
CMOD (mm)
Load (kN)
Q & TParent
NormalisedParent
Q & T HAZM = 0.95
Normalised HAZM = 2.15
Tempered HAZM = 1.35
100 mm
25 mm
2cM = 1.35
M = 2.15
M = 0.95

BRITE-EURAM SINTAP S454 BRPR-CT95-0024Contribution to BE95-1426 Task 1 Sub-Task 1.3 24/3/99 CONFIDENTIAL
F31
FIG. 54 CCT TEST CMOD v DISPLACEMENT DATA FOR PARENT (D0697E11)MATERIALS AND FCAW WELDS - TRANSVERSE -SURFACE NOTCH a/t 0.15, a/c 0.3 - NOTCH IN HAZ
FIG. 55 CCT TEST STRAIN v DISPLACEMENT DATA FOR FCAW (D0697E11)WELDS - TRANSVERSE - SURFACE NOTCH
a/t 0.15, a/c 0.3 - NOTCH IN HAZ
0 2 4 6 8 10 120
1
2
3
4
5
Displacement (mm)
CMOD (mm)
Q & TParent
NormalisedParent
Q & T HAZM = 0.95
Normalised HAZM = 2.15
Tempered HAZM = 1.35
100 mm
25 mm
2c
M = 1.35
M = 2.15
M = 0.95
0 1 2 3 4 50
2
4
6
8
10
Displacement (mm)
Strain (%)
Q & T HAZM = 0.95
Normalised HAZM = 2.15
Tempered HAZM = 1.35
100 mm
25 mm
2c
M = 1.35 (R)
M = 2.15 (R)
M = 0.95 (L)
M = 0.95 (R)
M = 2.15 (L)
M = 1.35 (L)

BRITE-EURAM SINTAP S454 BRPR-CT95-0024Contribution to BE95-1426 Task 1 Sub-Task 1.3 24/3/99 CONFIDENTIAL
F32
FIG. 56 CCT TEST LOAD v DISPLACEMENT DATA FOR PARENT (D0697E11)MATERIALS AND SAW WELDS - TRANSVERSE -
SURFACE NOTCH a/t 0.15, a/c 0.3 - NOTCH IN HAZ
FIG. 57 CCT TEST LOAD v CMOD DATA FOR PARENT MATERIALS (D0697E11)AND SAW WELDS - TRANSVERSE - SURFACE
NOTCH a/t 0.15, a/c 0.3 - NOTCH IN HAZ
0 2 4 6 8 100
500
1,000
1,500
2,000
Displacement (mm)
Load (kN)
Q & T Parent
Normalised Parent
Q & T HAZM = 0.71
Normalised HAZM = 1.62
100 mm
25 mm
2c
M = 1.62
M = 0.71
0 0.5 1 1.5 2 2.5 3 3.50
500
1,000
1,500
2,000
CMOD (mm)
Load (kN)
Q & TParent
NormalisedParent
Q & T HAZM = 0.71
Normalised HAZM = 1.62
100 mm
25 mm
2c
M = 1.62
M = 0.71

BRITE-EURAM SINTAP S454 BRPR-CT95-0024Contribution to BE95-1426 Task 1 Sub-Task 1.3 24/3/99 CONFIDENTIAL
F33
FIG. 58 CCT TEST CMOD v DISPLACEMENT DATA FOR PARENT (D0697E11)MATERIALS AND SAW WELDS - TRANSVERSE - SURFACE
NOTCH a/t 0.15, a/c 0.3 - NOTCH IN HAZ
FIG. 59 CCT TEST STRAIN v DISPLACEMENT DATA FOR SAW (D0697E11)WELDS - TRANSVERSE - SURFACE NOTCH
a/t 0.15, a/c 0.3 - NOTCH IN HAZ
0 2 4 6 8 10 120
0.5
1
1.5
2
2.5
3
3.5
Displacement (mm)
CMOD (mm)
Q & T Parent
Normalised Parent
Q & TM = 0.71
Normalised HAZM = 1.62
100 mm
25 mm
2c
M = 1.62M = 0.71
0 1 2 3 4 50
2
4
6
8
10
Displacement (mm)
Strain (%)
Q & T HAZM = 0.71
Normalised HAZM = 1.62
100 mm
25 mm
2c
M = 1.62 (R)
M = 0.71 (L)
M = 0.71 (R)

BRITE-EURAM SINTAP S454 BRPR-CT95-0024Contribution to BE95-1426 Task 1 Sub-Task 1.3 24/3/99 CONFIDENTIAL
A1/1
APPENDIX 1
CHARPY TRANSITION DATA FOR PARENT PLATES

BRITE-EURAM SINTAP S454 BRPR-CT95-0024Contribution to BE95-1426 Task 1 Sub-Task 1.3 24/3/99 CONFIDENTIAL
A1/F1
FIG. A1.1 CHARPY TRANSITION CURVE FOR RQT701 (PWHT) - (D0697E13)TRANSVERSE - SUBSURFACE
FIG. A1.2 CHARPY TRANSITION CURVE FOR RQT701 TEMPERED (D0697E13)AT 675°C (PWHT) - TRANSVERSE - SUBSURFACE
-120 -100 -80 -60 -40 -20 0 200
50
100
150
200
250
Temperature (°C)
Energy (J)
Individual MeanQA Code Y6A19 BMean 27 J Temp., ~-65°C
-120 -100 -80 -60 -40 -20 0 200
50
100
150
200
250
Temperature (°C)
Energy (J)
Individual MeanQA Code Y6A21 BMean 27 J Temp., -50°C

BRITE-EURAM SINTAP S454 BRPR-CT95-0024Contribution to BE95-1426 Task 1 Sub-Task 1.3 24/3/99 CONFIDENTIAL
A1/F2
FIG. A1.3 CHARPY TRANSITION CURVE FOR RQT701 NORMALISED (D0697E13)AT 900°C (PWHT) - TRANSVERSE - SUBSURFACE
-80 -60 -40 -20 0 20 40 600
50
100
150
200
250
Temperature (°C)
Energy (J)
Individual MeanQA Code Y6A20Mean 27 J Temp., -15°C

BRITE-EURAM SINTAP S454 BRPR-CT95-0024Contribution to BE95-1426 Task 1 Sub-Task 1.3 24/3/99 CONFIDENTIAL
A2/1
APPENDIX 2
CHARPY TRANSITION DATA FOR FCAW WELD METALS

BRITE-EURAM SINTAP S454 BRPR-CT95-0024Contribution to BE95-1426 Task 1 Sub-Task 1.3 24/3/99 CONFIDENTIAL
A2/F1
FIG. A2.1 CHARPY TRANSITION CURVE FOR FCAW WELD METAL (D0697E15)(PWHT) - TRANSVERSE - SUBSURFACE (ROOT) -
UNDERMATCHED WELD (M ~0.95)
FIG. A2.2 CHARPY TRANSITION CURVE FOR FCAW WELD METAL (D0697E15)(PWHT) - TRANSVERSE - SUBSURFACE (ROOT) -
OVERMATCHED WELD (BUT M ~1.35)
-120 -100 -80 -60 -40 -20 0 200
50
100
150
200
250
Temperature (°C)
Energy (J)
Individual MeanQA Code Y6A18 DMean 27 J Temp., ~-55°C
-120 -100 -80 -60 -40 -20 0 200
50
100
150
200
250
Temperature (°C)
Energy (J)
Individual MeanQA Code Y6A18 GMean 27 J Temp., ~-40°C
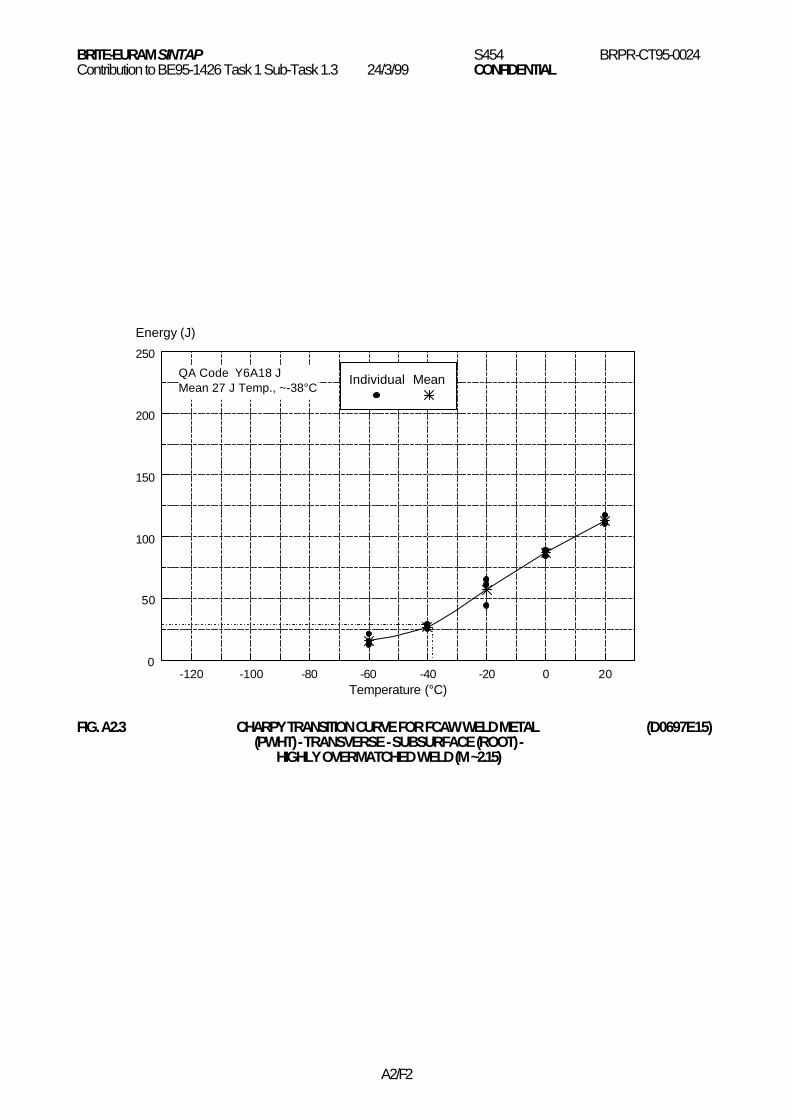
BRITE-EURAM SINTAP S454 BRPR-CT95-0024Contribution to BE95-1426 Task 1 Sub-Task 1.3 24/3/99 CONFIDENTIAL
A2/F2
FIG. A2.3 CHARPY TRANSITION CURVE FOR FCAW WELD METAL (D0697E15)(PWHT) - TRANSVERSE - SUBSURFACE (ROOT) -
HIGHLY OVERMATCHED WELD (M ~2.15)
-120 -100 -80 -60 -40 -20 0 200
50
100
150
200
250
Temperature (°C)
Energy (J)
Individual MeanQA Code Y6A18 JMean 27 J Temp., ~-38°C

BRITE-EURAM SINTAP S454 BRPR-CT95-0024Contribution to BE95-1426 Task 1 Sub-Task 1.3 24/3/99 CONFIDENTIAL
A3/1
APPENDIX 3
CHARPY TRANSITION DATA FOR FCAW HAZS

BRITE-EURAM SINTAP S454 BRPR-CT95-0024Contribution to BE95-1426 Task 1 Sub-Task 1.3 24/3/99 CONFIDENTIAL
A3/F1
FIG. A3.1 CHARPY TRANSITION CURVE FOR FCAW HAZ (PWHT) - (D0697E17)TRANSVERSE - SUBSURFACE (ROOT) -
HIGHLY OVERMATCHED (M ~2.15)
FIG. A3.2 CHARPY TRANSITION CURVE FOR FCAW HAZ (PWHT) - (D0697E17)TRANSVERSE - SUBSURFACE (ROOT) -OVERMATCHED WELD (BUT M ~1.35)
-120 -100 -80 -60 -40 -20 0 200
50
100
150
200
250
Temperature (°C)
Energy (J)
Individual MeanQA Code Y6A18 IMean 27 J Temp., ~-75°C
-120 -100 -80 -60 -40 -20 0 200
50
100
150
200
250
Temperature (°C)
Energy (J)
Individual MeanQA Code Y6A18 FMean 27 J Temp., ~-35°C

BRITE-EURAM SINTAP S454 BRPR-CT95-0024Contribution to BE95-1426 Task 1 Sub-Task 1.3 24/3/99 CONFIDENTIAL
A3/F2
FIG. A3.3 CHARPY TRANSITION CURVE FOR FCAW HAZ (PWHT) - (D0697E17)TRANSVERSE - SUBSURFACE (ROOT) -
UNDERMATCHED (M ~0.95)
-100 -80 -60 -40 -20 0 20 400
50
100
150
200
250
Temperature (°C)
Energy (J)
Individual MeanQA Code Y6A18 CMean 27 J Temp., ~-40°C

BRITE-EURAM SINTAP S454 BRPR-CT95-0024Contribution to BE95-1426 Task 1 Sub-Task 1.3 24/3/99 CONFIDENTIAL
A4/1
APPENDIX 4
CHARPY TRANSITION DATA FOR SAW HAZS

BRITE-EURAM SINTAP S454 BRPR-CT95-0024Contribution to BE95-1426 Task 1 Sub-Task 1.3 24/3/99 CONFIDENTIAL
A4/F1
FIG. A4.1 CHARPY TRANSITION CURVE FOR SAW HAZ (PWHT) - (D0697E19)TRANSVERSE - SUBSURFACE (ROOT) -
OVERMATCHED (M ~1.62)
FIG. A4.2 CHARPY TRANSITION CURVE FOR SAW HAZ (PWHT) - (D0697E19)TRANSVERSE - SUBSURFACE (ROOT) -
MATCHED (M ~1.01)
-20 0 20 40 60 80 100 1200
50
100
150
200
250
Temperature (°C)
Energy (J)
Individual AverageQA Code Y6A18 KMean 27 J Temp., ~+30°C
-20 0 20 40 60 80 100 1200
50
100
150
200
250
Temperature (°C)
Energy (J)
Individual AverageQA Code Y6A18 HMean 27 J Temp., ~+37°C

BRITE-EURAM SINTAP S454 BRPR-CT95-0024Contribution to BE95-1426 Task 1 Sub-Task 1.3 24/3/99 CONFIDENTIAL
A4/F2
FIG. A4.3 CHARPY TRANSITION CURVE FOR SAW HAZ (PWHT) - (D0697E19)TRANSVERSE - SUBSURFACE (ROOT) -
UNDERMATCHED (M ~0.71)
-20 0 20 40 60 80 100 1200
50
100
150
200
250
Temperature (°C)
Energy (J)
Individual MeanQA Code Y6A18 EMean 27 J Temp., ~+20°C
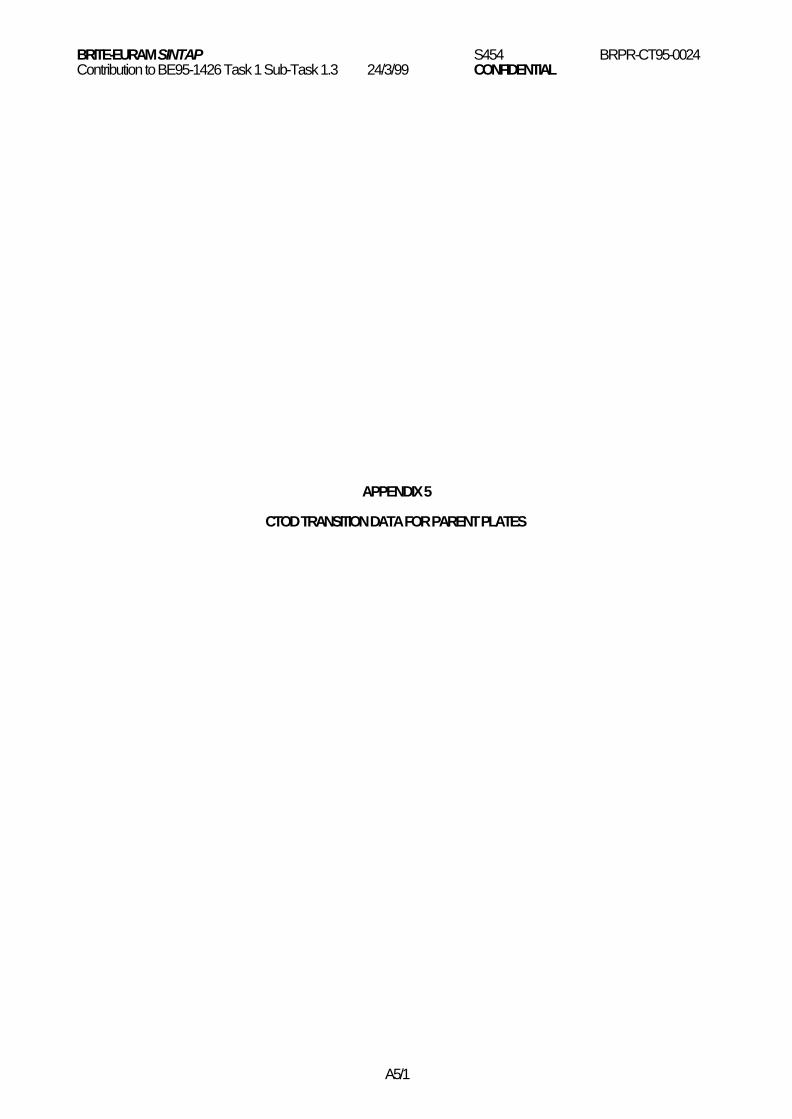
BRITE-EURAM SINTAP S454 BRPR-CT95-0024Contribution to BE95-1426 Task 1 Sub-Task 1.3 24/3/99 CONFIDENTIAL
A5/1
APPENDIX 5
CTOD TRANSITION DATA FOR PARENT PLATES

BRITE-EURAM SINTAP S454 BRPR-CT95-0024Contribution to BE95-1426 Task 1 Sub-Task 1.3 24/3/99 CONFIDENTIAL
A5/F1
FIG. A5.1 CTOD TRANSITION DATA FOR RQT701 (PWHT) - (D0697E21)TRANSVERSE - THROUGH THICKNESS NOTCH a/w 0.5
FIG. A5.2 CTOD TRANSITION DATA FOR TEMPERED RQT701 (PWHT) - (D0697E21)TRANSVERSE - THROUGH THICKNESS NOTCH a/w 0.5
-80 -60 -40 -20 0 20 400
0.2
0.4
0.6
0.8
1
Temperature (°C)
CTOD (mm)
QA Code Y6A19b13 to 24
-80 -60 -40 -20 0 20 40 600
0.2
0.4
0.6
0.8
1
Temperature (°C)
CTOD (mm)
QA Code Y6A21m to x
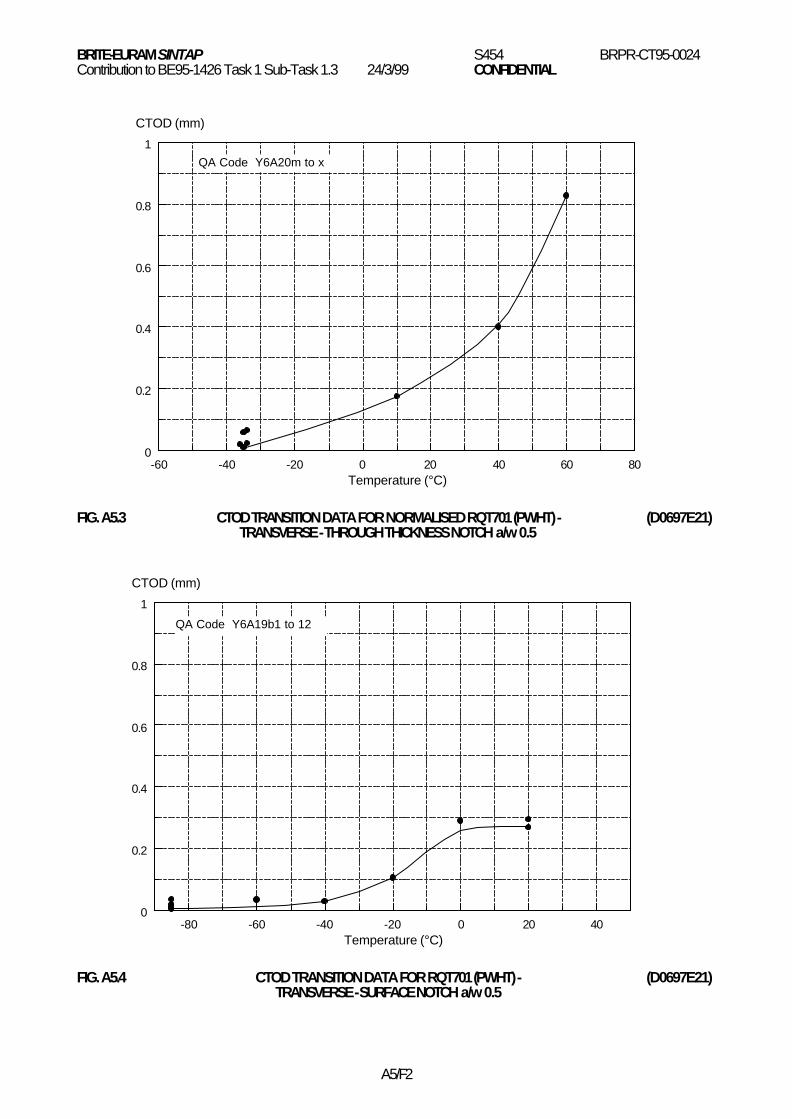
BRITE-EURAM SINTAP S454 BRPR-CT95-0024Contribution to BE95-1426 Task 1 Sub-Task 1.3 24/3/99 CONFIDENTIAL
A5/F2
FIG. A5.3 CTOD TRANSITION DATA FOR NORMALISED RQT701 (PWHT) - (D0697E21)TRANSVERSE - THROUGH THICKNESS NOTCH a/w 0.5
FIG. A5.4 CTOD TRANSITION DATA FOR RQT701 (PWHT) - (D0697E21)TRANSVERSE - SURFACE NOTCH a/w 0.5
-60 -40 -20 0 20 40 60 800
0.2
0.4
0.6
0.8
1
Temperature (°C)
CTOD (mm)
QA Code Y6A20m to x
-80 -60 -40 -20 0 20 400
0.2
0.4
0.6
0.8
1
Temperature (°C)
CTOD (mm)
QA Code Y6A19b1 to 12

BRITE-EURAM SINTAP S454 BRPR-CT95-0024Contribution to BE95-1426 Task 1 Sub-Task 1.3 24/3/99 CONFIDENTIAL
A5/F3
FIG. A5.5 CTOD TRANSITION DATA FOR TEMPERED RQT701 (PWHT) - (D0697E21)TRANSVERSE - SURFACE NOTCH a/w 0.5
FIG. A5.6 CTOD TRANSITION DATA FOR NORMALISED RQT701 (PWHT) - (D0697E21)TRANSVERSE - SURFACE NOTCH a/w 0.5
-80 -60 -40 -20 0 20 40 600
0.2
0.4
0.6
0.8
1
1.2
Temperature (°C)
CTOD (mm)
QA Code Y6A21a to l
-60 -40 -20 0 20 40 60 800
0.2
0.4
0.6
0.8
1
1.2
Temperature (°C)
CTOD (mm)
QA Code Y6A20a to l

BRITE-EURAM SINTAP S454 BRPR-CT95-0024Contribution to BE95-1426 Task 1 Sub-Task 1.3 24/3/99 CONFIDENTIAL
A5/F4
FIG. A5.7 CTOD TRANSITION DATA FOR RQT701 (PWHT) - (D0697E21)TRANSVERSE - SURFACE NOTCH a/w 0.15
FIG. A5.8 CTOD TRANSITION DATA FOR TEMPERED RQT701 (PWHT) - (D0697E21)TRANSVERSE - SURFACE NOTCH a/w 0.15
-80 -60 -40 -20 0 20 400
0.5
1
1.5
2
2.5
3
3.5
Temperature (°C)
CTOD (mm)
QA Code Y6A19b25 to 36
-120 -100 -80 -60 -40 -20 0 200
0.5
1
1.5
2
2.5
3
3.5
Temperature (°C)
CTOD (mm)
QA Code Y6A21y to aj

BRITE-EURAM SINTAP S454 BRPR-CT95-0024Contribution to BE95-1426 Task 1 Sub-Task 1.3 24/3/99 CONFIDENTIAL
A5/F5
FIG. A5.9 CTOD TRANSITION DATA FOR NORMALISED RQT701 (PWHT) - (D0697E21)TRANSVERSE - SURFACE NOTCH a/w 0.15
-60 -40 -20 0 20 40 60 800
0.5
1
1.5
2
2.5
3
3.5
Temperature (°C)
CTOD (mm)
QA Code Y6A20y to ag

BRITE-EURAM SINTAP S454 BRPR-CT95-0024Contribution to BE95-1426 Task 1 Sub-Task 1.3 24/3/99 CONFIDENTIAL
A6/1
APPENDIX 6
CTOD TRANSITION DATA FOR FCAW WELD METALS

BRITE-EURAM SINTAP S454 BRPR-CT95-0024Contribution to BE95-1426 Task 1 Sub-Task 1.3 24/3/99 CONFIDENTIAL
A6/F1
FIG. A6.1 CTOD TRANSITION DATA FOR FCAW WM (PWHT) - (D0697E23)TRANSVERSE - THROUGH THICKNESS NOTCH a/w 0.5 -
UNDERMATCHED CONDITION (M ~0.95)
FIG. A6.2 CTOD TRANSITION DATA FOR FCAW WM (PWHT) - (D0697E23)TRANSVERSE - THROUGH THICKNESS NOTCH a/w 0.5 -
HIGHLY OVERMATCHED CONDITION (M ~2.15)
-100 -80 -60 -40 -20 0 20 40 600
0.2
0.4
0.6
0.8
1
1.2
1.4
Temperature (°C)
CTOD (mm)
QA Code Y6A18M1 to 15
-100 -80 -60 -40 -20 0 20 40 600
0.2
0.4
0.6
0.8
1
1.2
1.4
Temperature (°C)
CTOD (mm)
QA Code Y6A18P1 to 15

BRITE-EURAM SINTAP S454 BRPR-CT95-0024Contribution to BE95-1426 Task 1 Sub-Task 1.3 24/3/99 CONFIDENTIAL
A6/F2
FIG. A6.3 CTOD TRANSITION DATA FOR FCAW WM (PWHT) - (D0697E23)TRANSVERSE - SURFACE NOTCH a/w 0.5 -
UNDERMATCHED CONDITION (M ~0.95)
FIG. A6.4 CTOD TRANSITION DATA FOR FCAW WM (PWHT) - (D0697E23)TRANSVERSE - SURFACE NOTCH a/w 0.5 -
OVERMATCHED CONDITION (M ~1.35)
-100 -80 -60 -40 -20 0 20 40 600
0.2
0.4
0.6
0.8
1
1.2
1.4
Temperature (°C)
CTOD (mm)
QA Code W7K85A to O
-100 -80 -60 -40 -20 0 20 40 600
0.2
0.4
0.6
0.8
1
1.2
1.4
Temperature (°C)
CTOD (mm)
QA Code Y6A18R1 to 15

BRITE-EURAM SINTAP S454 BRPR-CT95-0024Contribution to BE95-1426 Task 1 Sub-Task 1.3 24/3/99 CONFIDENTIAL
A6/F3
FIG. A6.5 CTOD TRANSITION DATA FOR FCAW WM (PWHT) - (D0697E23)TRANSVERSE - SURFACE NOTCH a/w 0.5 -
HIGHLY OVERMATCHED CONDITION (M ~2.15)
FIG. A6.6 CTOD TRANSITION DATA FOR FCAW WM (PWHT) - (D0697E23)TRANSVERSE - SURFACE NOTCH a/w 0.15 -
UNDERMATCHED CONDITION (M ~0.95)
-100 -80 -60 -40 -20 0 20 40 600
0.2
0.4
0.6
0.8
1
1.2
1.4
Temperature (°C)
CTOD (mm)
QA Code Y6A20E1 to 15
-100 -80 -60 -40 -20 0 20 40 600
0.2
0.4
0.6
0.8
1
1.2
1.4
Temperature (°C)
CTOD (mm)
QA Code W7K84A to O

BRITE-EURAM SINTAP S454 BRPR-CT95-0024Contribution to BE95-1426 Task 1 Sub-Task 1.3 24/3/99 CONFIDENTIAL
A6/F4
FIG. A6.7 CTOD TRANSITION DATA FOR FCAW WM (PWHT) - (D0697E23)TRANSVERSE - SURFACE NOTCH a/w 0.15 -
OVERMATCHED CONDITION (M ~1.35)
FIG. A6.8 CTOD TRANSITION DATA FOR FCAW WM (PWHT) - (D0697E23)TRANSVERSE - SURFACE NOTCH a/w 0.15 -
HIGHLY OVERMATCHED CONDITION (M ~2.15)
-100 -80 -60 -40 -20 0 20 40 600
0.2
0.4
0.6
0.8
1
1.2
1.4
Temperature (°C)
CTOD (mm)
QA Code Y6A21D1 to 15
-100 -80 -60 -40 -20 0 20 40 600
0.2
0.4
0.6
0.8
1
1.2
1.4
Temperature (°C)
CTOD (mm)
QA Code Y6A20D1 to 15
BRITE-EURAM SINTAP S454 BRPR-CT95-0024Contribution to BE95-1426 Task 1 Sub-Task 1.3 24/3/99 CONFIDENTIAL
A7/1
APPENDIX 7
CTOD TRANSITION DATA FOR FCAW HAZS

BRITE-EURAM SINTAP S454 BRPR-CT95-0024Contribution to BE95-1426 Task 1 Sub-Task 1.3 24/3/99 CONFIDENTIAL
A7/F1
FIG. A7.1 CTOD TRANSITION DATA FOR FCAW HAZ (PWHT) - (D0697E25)TRANSVERSE - THROUGH THICKNESS NOTCH a/w 0.5 -
UNDERMATCHED CONDITION (M ~0.95)
FIG. A7.2 CTOD TRANSITION DATA FOR FCAW HAZ (PWHT) - (D0697E25)TRANSVERSE - THROUGH THICKNESS NOTCH a/w 0.5 -
HIGHLY OVERMATCHED CONDITION (M ~2.15)
-80 -60 -40 -20 0 20 40 600
0.2
0.4
0.6
0.8
1
1.2
1.4
1.6
1.8
2
Temperature (°C)
CTOD (mm)
>15%GCHAZ
<15%GCHAZ
QA Code Y6A18L1 to 15
-80 -60 -40 -20 0 20 40 600
0.2
0.4
0.6
0.8
1
1.2
1.4
1.6
1.8
2
Temperature (°C)
CTOD (mm)
>15%GCHAZ
<15%GCHAZ
QA Code Y6A18O1 to 15

BRITE-EURAM SINTAP S454 BRPR-CT95-0024Contribution to BE95-1426 Task 1 Sub-Task 1.3 24/3/99 CONFIDENTIAL
A7/F2
FIG. A7.3 CTOD TRANSITION DATA FOR FCAW HAZ (PWHT) - (D0697E25)TRANSVERSE - SURFACE NOTCH a/w 0.5 -
UNDERMATCHED CONDITION (M ~0.95)
FIG. A7.4 CTOD TRANSITION DATA FOR FCAW HAZ (PWHT) - (D0697E25)TRANSVERSE - SURFACE NOTCH a/w 0.5 -
OVERMATCHED CONDITION (M ~1.35)
-80 -60 -40 -20 0 20 40 600
0.2
0.4
0.6
0.8
1
1.2
1.4
1.6
1.8
2
Temperature (°C)
CTOD (mm)
GCHAZ
WM
GRHAZ
QA Code W7K82A to O
-80 -60 -40 -20 0 20 40 600
0.2
0.4
0.6
0.8
1
1.2
1.4
1.6
1.8
2
Temperature (°C)
CTOD (mm)
GCHAZ
WM
GRHAZ
QA Code Y6A21H1 to 15

BRITE-EURAM SINTAP S454 BRPR-CT95-0024Contribution to BE95-1426 Task 1 Sub-Task 1.3 24/3/99 CONFIDENTIAL
A7/F3
FIG. A7.5 CTOD TRANSITION DATA FOR FCAW HAZ (PWHT) - (D0697E25)TRANSVERSE - SURFACE NOTCH a/w 0.5 -
HIGHLY OVERMATCHED CONDITION (M ~2.15)
FIG. A7.6 CTOD TRANSITION DATA FOR FCAW HAZ (PWHT) - (D0697E25)TRANSVERSE - SURFACE NOTCH a/w 0.15 -
UNDERMATCHED CONDITION (M ~0.95)
-80 -60 -40 -20 0 20 40 600
0.2
0.4
0.6
0.8
1
1.2
1.4
1.6
1.8
2
Temperature (°C)
CTOD (mm)
GCHAZ
WM
GRHAZ
FL
QA Code Y6A20H1 to 15
-80 -60 -40 -20 0 20 40 600
0.2
0.4
0.6
0.8
1
1.2
1.4
1.6
1.8
2
Temperature (°C)
CTOD (mm)
GCHAZ
WM
GRHAZ
QA Code Y6A18N1 to 15
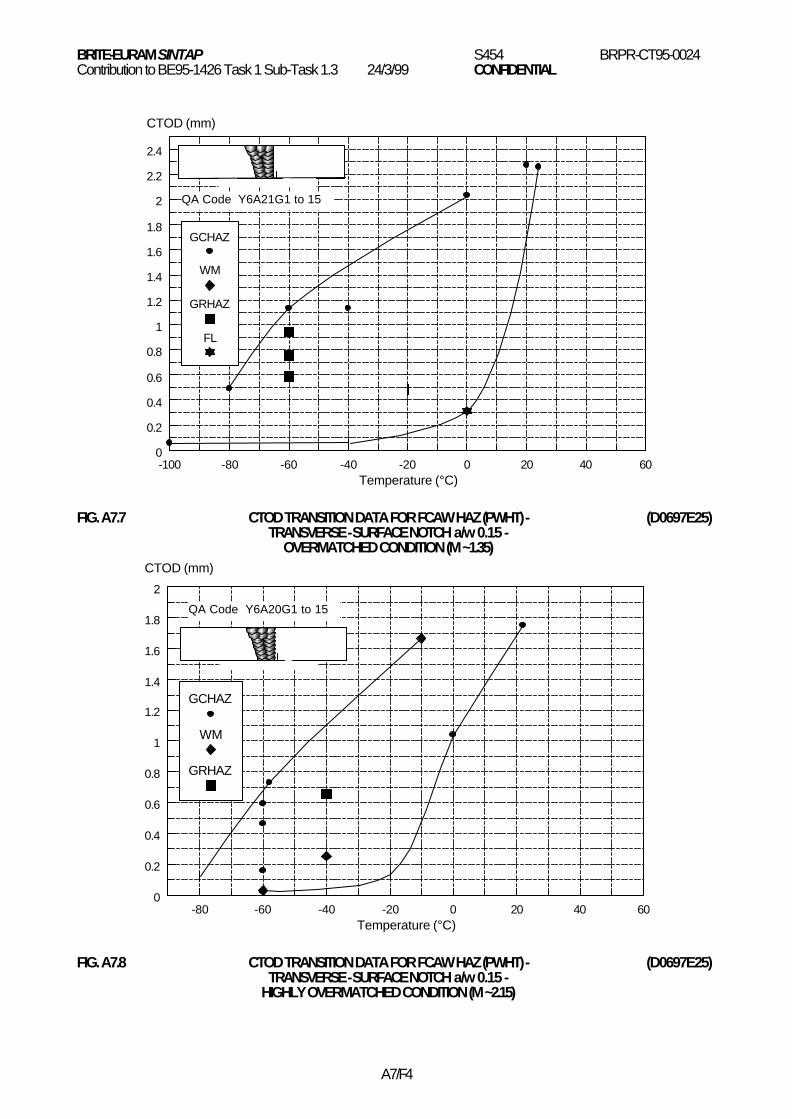
BRITE-EURAM SINTAP S454 BRPR-CT95-0024Contribution to BE95-1426 Task 1 Sub-Task 1.3 24/3/99 CONFIDENTIAL
A7/F4
FIG. A7.7 CTOD TRANSITION DATA FOR FCAW HAZ (PWHT) - (D0697E25)TRANSVERSE - SURFACE NOTCH a/w 0.15 -
OVERMATCHED CONDITION (M ~1.35)
FIG. A7.8 CTOD TRANSITION DATA FOR FCAW HAZ (PWHT) - (D0697E25)TRANSVERSE - SURFACE NOTCH a/w 0.15 -
HIGHLY OVERMATCHED CONDITION (M ~2.15)
-100 -80 -60 -40 -20 0 20 40 600
0.2
0.4
0.6
0.8
1
1.2
1.4
1.6
1.8
2
2.2
2.4
Temperature (°C)
CTOD (mm)
GCHAZ
WM
GRHAZ
FL
QA Code Y6A21G1 to 15
-80 -60 -40 -20 0 20 40 600
0.2
0.4
0.6
0.8
1
1.2
1.4
1.6
1.8
2
Temperature (°C)
CTOD (mm)
GCHAZ
WM
GRHAZ
QA Code Y6A20G1 to 15

BRITE-EURAM SINTAP S454 BRPR-CT95-0024Contribution to BE95-1426 Task 1 Sub-Task 1.3 24/3/99 CONFIDENTIAL
A8/1
APPENDIX 8
CTOD TRANSITION DATA FOR SAW HAZS

BRITE-EURAM SINTAP S454 BRPR-CT95-0024Contribution to BE95-1426 Task 1 Sub-Task 1.3 24/3/99 CONFIDENTIAL
A8/F1
FIG. A8.1 CTOD TRANSITION DATA FOR SAW HAZ (PWHT) - (D0697E27)TRANSVERSE - SURFACE NOTCH a/w 0.5 -
UNDERMATCHED CONDITION (M ~0.71)
FIG. A8.2 CTOD TRANSITION DATA FOR SAW HAZ (PWHT) - (D0697E27)TRANSVERSE - SURFACE NOTCH a/w 0.5 -
MATCHED CONDITION (M ~1.01)
-20 0 20 40 60 80 100 1200
0.2
0.4
0.6
0.8
1
1.2
1.4
1.6
1.8
2
Temperature (°C)
CTOD (mm)
GCHAZ
WM
GRHAZ
QA Code Y6A19K1 to 15
-20 0 20 40 60 80 100 1200
0.2
0.4
0.6
0.8
1
1.2
1.4
1.6
1.8
2
Temperature (°C)
CTOD (mm)
GCHAZ
WM
QA Code Y6A21K1 to 15
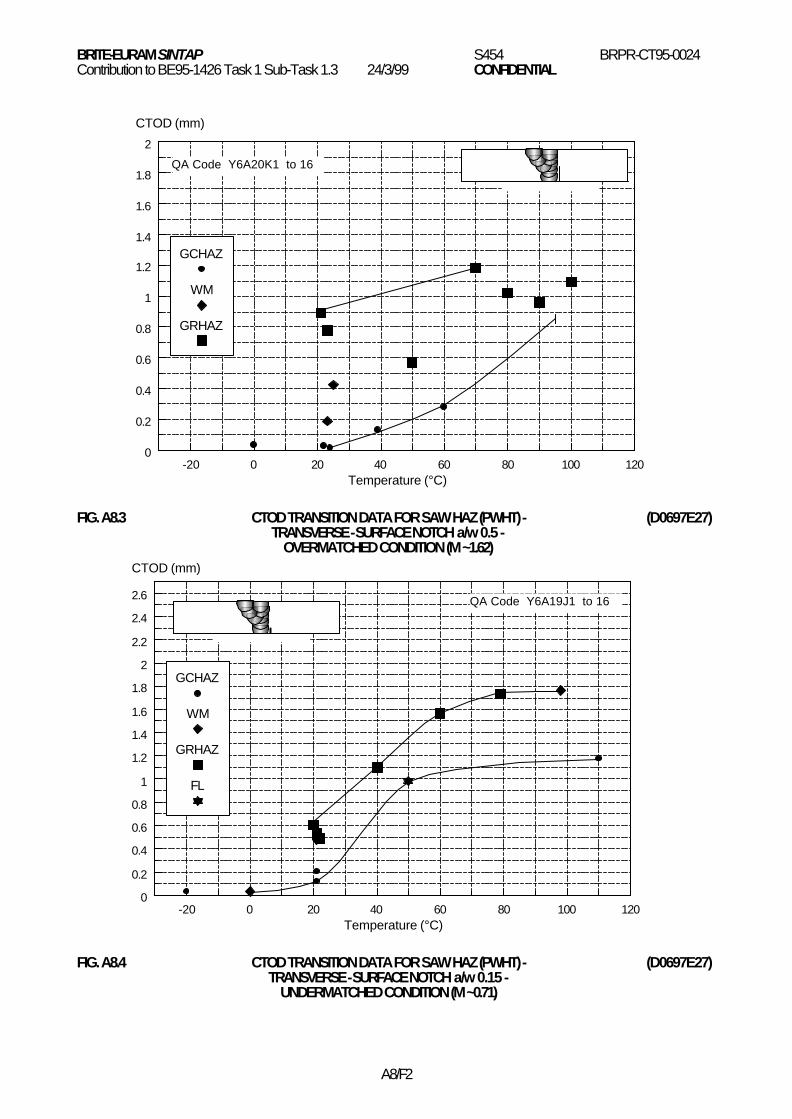
BRITE-EURAM SINTAP S454 BRPR-CT95-0024Contribution to BE95-1426 Task 1 Sub-Task 1.3 24/3/99 CONFIDENTIAL
A8/F2
FIG. A8.3 CTOD TRANSITION DATA FOR SAW HAZ (PWHT) - (D0697E27)TRANSVERSE - SURFACE NOTCH a/w 0.5 -
OVERMATCHED CONDITION (M ~1.62)
FIG. A8.4 CTOD TRANSITION DATA FOR SAW HAZ (PWHT) - (D0697E27)TRANSVERSE - SURFACE NOTCH a/w 0.15 -
UNDERMATCHED CONDITION (M ~0.71)
-20 0 20 40 60 80 100 1200
0.2
0.4
0.6
0.8
1
1.2
1.4
1.6
1.8
2
Temperature (°C)
CTOD (mm)
GCHAZ
WM
GRHAZ
QA Code Y6A20K1 to 16
-20 0 20 40 60 80 100 1200
0.2
0.4
0.6
0.8
1
1.2
1.4
1.6
1.8
2
2.2
2.4
2.6
Temperature (°C)
CTOD (mm)
GCHAZ
WM
GRHAZ
FL
QA Code Y6A19J1 to 16

BRITE-EURAM SINTAP S454 BRPR-CT95-0024Contribution to BE95-1426 Task 1 Sub-Task 1.3 24/3/99 CONFIDENTIAL
A8/F3
FIG. A8.5 CTOD TRANSITION DATA FOR SAW HAZ (PWHT) - (D0697E27)TRANSVERSE - SURFACE NOTCH a/w 0.15 -
MATCHED CONDITION (M ~1.01)
FIG. A8.6 CTOD TRANSITION DATA FOR SAW HAZ (PWHT) - (D0697E27)TRANSVERSE - SURFACE NOTCH a/w 0.15 -
OVERMATCHED CONDITION (M ~1.62)
-20 0 20 40 60 80 100 1200
0.2
0.4
0.6
0.8
1
1.2
1.4
1.6
1.8
2
2.2
2.4
2.6
Temperature (°C)
CTOD (mm)
GCHAZ
WM
GRHAZ
QA Code Y6A21J1 to 15
-20 0 20 40 60 80 100 1200
0.2
0.4
0.6
0.8
1
1.2
1.4
1.6
1.8
2
2.2
2.4
2.6
Temperature (°C)
CTOD (mm)
GCHAZ
WM
QA Code Y6A20J1 to 16
BRITE-EURAM SINTAP S454 BRPR-CT95-0024Contribution to BE95-1426 Task 1 Sub-Task 1.3 24/3/99 CONFIDENTIAL
A9/1
APPENDIX 9
CENTRE CRACKED TENSILE TEST DATA FOR PARENT PLATES

BRITE-EURAM SINTAP S454 BRPR-CT95-0024Contribution to BE95-1426 Task 1 Sub-Task 1.3 24/3/99 CONFIDENTIAL
A9/F1
FIG. A9.1 CCT TEST LOAD v DISPLACEMENT DATA FOR PARENT (D0697E29)MATERIALS - TRANSVERSE - SURFACE NOTCH a/t 0.5, a/c 0.5
FIG. A9.2 CCT TEST LOAD v CMOD DATA FOR PARENT MATERIALS - (D0697E29)TRANSVERSE - SURFACE NOTCH a/t 0.5, a/c 0.5
0 2 4 6 8 10 120
500
1,000
1,500
2,000
Displacement (mm)
Load (kN)
Q & T Normalised Tempered
100 mm
25 mm
2c
0 0.5 1 1.5 2 2.5 3 3.50
500
1,000
1,500
2,000
CMOD (mm)
Load (kN)
Q & T Normalised Tempered
100 mm
25 mm
2c

BRITE-EURAM SINTAP S454 BRPR-CT95-0024Contribution to BE95-1426 Task 1 Sub-Task 1.3 24/3/99 CONFIDENTIAL
A9/F2
FIG. A9.3 CCT TEST CMOD v DISPLACEMENT DATA FOR PARENT (D0697E29)MATERIALS - TRANSVERSE - SURFACE NOTCH a/t 0.5, a/c 0.5
FIG. A9.4 CCT TEST STRAIN v DISPLACEMENT DATA FOR PARENT (D0697E29)MATERIALS - TRANSVERSE - SURFACE NOTCH a/t 0.5, a/c 0.5
0 1 2 3 4 50
0.5
1
1.5
2
2.5
3
3.5
Displacement (mm)
CMOD (mm)
Q & T Normalised Tempered
100 mm
25 mm
2c
0 1 2 3 4 50
5
10
15
20
Displacement (mm)
Strain (%)
Q & T
Normalised
Tempered
100 mm
25 mm
2c
Local
Remote (sg2)

BRITE-EURAM SINTAP S454 BRPR-CT95-0024Contribution to BE95-1426 Task 1 Sub-Task 1.3 24/3/99 CONFIDENTIAL
A9/F3
FIG. A9.5 CCT TEST LOAD v DISPLACEMENT DATA FOR PARENT (D0697E29)MATERIALS - TRANSVERSE - THROUGH THICKNESS NOTCH a/t = 1
FIG. A9.6 CCT TEST LOAD v δδ 5 DATA FOR PARENT MATERIALS - (D0697E29)TRANSVERSE - THROUGH THICKNESS NOTCH a/t = 1
0 1 2 3 4 5 6 70
200
400
600
800
1,000
1,200
Displacement (mm)
Load (kN)
Q & T Normalised Tempered
100 mm
25 mm
2a
-1 0 1 2 3 4 5 6 70
200
400
600
800
1,000
1,200
(mm)
Load (kN)
Q & T Normalised Tempered
100mm
25mm
2a
δ5

BRITE-EURAM SINTAP S454 BRPR-CT95-0024Contribution to BE95-1426 Task 1 Sub-Task 1.3 24/3/99 CONFIDENTIAL
A9/F4
FIG. A9.7 CCT TEST δδ 5 v DISPLACEMENT DATA FOR PARENT (D0697E29)MATERIALS - TRANSVERSE - THROUGH THICKNESS NOTCH a/t = 1
FIG. A9.8 CCT TEST STRAIN v DISPLACEMENT DATA FOR PARENT (D0697E29)MATERIALS - TRANSVERSE - THROUGH THICKNESS NOTCH a/t = 1
0 1 2 3 4 5 6 70
1
2
3
4
5
Displacement (mm)
(mm)
Q & T
Normalised
Tempered
100 mm
25 mm
2a
δ5
0 1 2 3 4 50
2
4
6
8
10
Displacement (mm)
Strain (%)
Q & T
Normalised
Tempered
100 mm
25 mm
2a
Local
Remote (sg2)

BRITE-EURAM SINTAP S454 BRPR-CT95-0024Contribution to BE95-1426 Task 1 Sub-Task 1.3 24/3/99 CONFIDENTIAL
A10/1
APPENDIX 10
CENTRE CRACKED TENSILE TEST DATA FOR TESTSNOTCHED AT FCAW WELD METAL CENTRELINE

BRITE-EURAM SINTAP S454 BRPR-CT95-0024Contribution to BE95-1426 Task 1 Sub-Task 1.3 24/3/99 CONFIDENTIAL
A10/F1
FIG. A10.1 CCT TEST LOAD v DISPLACEMENT DATA FOR PARENT (D0697E31)MATERIALS AND FCAW WELDS - TRANSVERSE - SURFACE
NOTCH a/t 0.5, a/c 0.5 - NOTCH AT WELD CENTRELINE
FIG. A10.2 CCT TEST LOAD v CMOD DATA FOR PARENT (D0697E31)MATERIALS AND FCAW WELDS - TRANSVERSE - SURFACE
NOTCH a/t 0.5, a/c 0.5 - NOTCH AT WELD CENTRELINE
0 2 4 6 8 10 120
500
1,000
1,500
2,000
Displacement (mm)
Load (kN)
Q & T Parent
Normalised Parent
Q & T HAZM = 0.95
Normalised HAZM = 2.15
Tempered HAZM = 1.35
100 mm
25 mm
2c
M = 1.35
M = 2.15
M = 0.95
0 1 2 3 4 50
500
1,000
1,500
2,000
CMOD (mm)
Load (kN)
Q & TParent
NormalisedParent
Q & T HAZM = 0.95
Normalised HAZM = 2.15
Tempered HAZM = 1.35
100 mm
25 mm
2c
M = 1.35
M = 2.15
M = 0.95

BRITE-EURAM SINTAP S454 BRPR-CT95-0024Contribution to BE95-1426 Task 1 Sub-Task 1.3 24/3/99 CONFIDENTIAL
A10/F2
FIG. A10.3 CCT TEST CMOD v DISPLACEMENT DATA FOR PARENT (D0697E31)MATERIALS AND FCAW WELDS - TRANSVERSE - SURFACE
NOTCH a/t 0.5, a/c 0.5 - NOTCH AT WELD CENTRELINE
FIG. A10.4 CCT TEST STRAIN v DISPLACEMENT DATA FOR FCAW (D0697E31)WELDS - TRANSVERSE - SURFACE NOTCH a/t 0.5,
a/c 0.5 - NOTCH AT WELD CENTRELINE
0 1 2 3 4 50
0.5
1
1.5
2
2.5
3
3.5
Displacement (mm)
CMOD (mm)
Q & T Parent
Normalised Parent
Q & T HAZM = 0.95
Normalised HAZM = 2.15
Tempered HAZM = 1.35
100 mm
25 mm
2c
M = 1.35
M = 2.15
M = 0.95
0 1 2 3 4 50
2
4
6
8
10
Displacement (mm)
Strain (%)
Q & T HAZM = 0.95
Normalised HAZM = 2.15
Tempered HAZM = 1.35
100 mm
25 mm
2cM = 0.95 (L)
M = 0.95 (R)
M = 2.15 (R)
M = 2.15 (L)
M = 1.35 (L)
M = 1.35 (R)

BRITE-EURAM SINTAP S454 BRPR-CT95-0024Contribution to BE95-1426 Task 1 Sub-Task 1.3 24/3/99 CONFIDENTIAL
A10/F3
FIG. A10.5 CCT TEST LOAD v DISPLACEMENT DATA FOR PARENT (D0697E31)MATERIALS AND FCAW WELDS - TRANSVERSE - THROUGHTHICKNESS NOTCH a/t = 1 - NOTCH AT WELD CENTRELINE
FIG. A10.6 CCT TEST LOAD v δδ 5 DATA FOR PARENT MATERIALS AND (D0697E31)FCAW WELDS - TRANSVERSE - THROUGH THICKNESS
NOTCH a/t = 1 - NOTCH AT WELD CENTRELINE
0 2 4 6 8 100
200
400
600
800
1,000
1,200
Displacement (mm)
Load (kN)
Q & TParent
NormalisedParent
Q & T HAZM = 0.95
Normalised HAZM = 2.15
100 mm
25 mm
2a
M = 2.15
M = 0.95
-1 0 1 2 3 4 5 6 70
200
400
600
800
1,000
1,200
(mm)
Load (kN)
Q & T Normalised Q & T HAZM = 0.95
Normalised HAZM = 2.15
100 mm
25 mm
2a
M = 2.15
M = 0.95
δ5

BRITE-EURAM SINTAP S454 BRPR-CT95-0024Contribution to BE95-1426 Task 1 Sub-Task 1.3 24/3/99 CONFIDENTIAL
A10/F4
FIG. A10.7 CCT TEST δδ 5 v DISPLACEMENT DATA FOR PARENT MATERIALS (D0697E31)AND FCAW WELDS - TRANSVERSE - THROUGH THICKNESS
NOTCH a/t = 1 - NOTCH AT WELD CENTRELINE
FIG. A10.8 CCT TEST STRAIN v DISPLACEMENT DATA FOR FCAW (D0697E31)WELDS - TRANSVERSE - THROUGH THICKNESSNOTCH a/t = 1 - NOTCH AT WELD CENTRELINE
0 1 2 3 4 5 60
1
2
3
4
5
6
7
Displacement (mm)
(mm)
Q & T
Normalised
Q & T HAZM = 0.95
Normalised HAZM = 2.15
100 mm
25 mm
2a
M = 2.15
M = 0.95
δ 5
0 1 2 3 4 50
2
4
6
8
10
Displacement (mm)
Strain (%)
Q & T HAZM = 0.95
Normalised HAZM = 2.15
100 mm
25 mm
2a
M = 0.95 (L)
M = 0.95 (R)M = 2.15 (R)
M = 2.15 (L)

BRITE-EURAM SINTAP S454 BRPR-CT95-0024Contribution to BE95-1426 Task 1 Sub-Task 1.3 24/3/99 CONFIDENTIAL
A11/1
APPENDIX 11
CENTRE CRACKED TENSILE TEST DATA FORTESTS NOTCHED AT FCAW HAZ

BRITE-EURAM SINTAP S454 BRPR-CT95-0024Contribution to BE95-1426 Task 1 Sub-Task 1.3 24/3/99 CONFIDENTIAL
A11/F1
FIG. A11.1 CCT TEST LOAD v DISPLACEMENT DATA FOR PARENT (D0697E33)MATERIALS AND FCAW WELDS - TRANSVERSE -SURFACE NOTCH, a/t 0.5, a/c 0.5 - NOTCH IN HAZ
FIG. A11.2 CCT TEST LOAD v CMOD DATA FOR PARENT (D0697E33)MATERIALS AND FCAW WELDS - TRANSVERSE -SURFACE NOTCH, a/t 0.5, a/c 0.5 - NOTCH IN HAZ
0 2 4 6 8 10 120
500
1,000
1,500
2,000
Displacement (mm)
Load (kN)
Q & T Parent
Normalised Parent
Q & T HAZM = 0.95
Normalised HAZM = 2.15
Tempered HAZM = 1.35
100 mm
25 mm
2c
M = 1.35
M = 2.15
M = 0.95
0 1 2 3 4 50
500
1,000
1,500
2,000
CMOD (mm)
Load (kN)
Q & TParent
NormalisedParent
Q & T HAZM = 0.95
Normalised HAZM = 2.15
Tempered HAZM = 1.35
100 mm
25 mm
2c
M = 1.35
M = 2.15
M = 0.95

BRITE-EURAM SINTAP S454 BRPR-CT95-0024Contribution to BE95-1426 Task 1 Sub-Task 1.3 24/3/99 CONFIDENTIAL
A11/F2
FIG. A11.3 CCT TEST CMOD v DISPLACEMENT DATA FOR PARENT (D0697E33)MATERIALS AND FCAW WELDS - TRANSVERSE -SURFACE NOTCH, a/t 0.5, a/c 0.5 - NOTCH IN HAZ
FIG. A11.4 CCT TEST STRAIN v DISPLACEMENT DATA FOR FCAW (D0697E33)WELDS - TRANSVERSE - SURFACE NOTCH, a/t 0.5,
a/c 0.5 - NOTCH IN HAZ
0 1 2 3 4 50
1
2
3
4
5
Displacement (mm)
CMOD (mm)
Q & T Parent
Normalised Parent
Q & T HAZM = 0.95
Normalised HAZM = 2.15
Tempered HAZM = 1.35
100 mm
25 mm
2c
M = 1.19
M = 2.15
M = 0.95
0 1 2 3 4 50
2
4
6
8
10
Displacement (mm)
Strain (%)
Q & T HAZM = 0.95
Normalised HAZM = 2.15
Tempered HAZM = 1.35
100 mm
25 mm
2c
M = 0.95 (L)
M = 0.95 (R)
M = 2.15 (R)
M = 2.15 (L)
M = 1.35 (L)
M = 1.35 (R)

BRITE-EURAM SINTAP S454 BRPR-CT95-0024Contribution to BE95-1426 Task 1 Sub-Task 1.3 24/3/99 CONFIDENTIAL
A11/F3
FIG. A11.5 CCT TEST LOAD v DISPLACEMENT DATA FOR PARENT (D0697E33)MATERIALS AND FCAW WELDS - TRANSVERSE -
THROUGH THICKNESS NOTCH, a/t = 1 - NOTCH IN HAZ
FIG. A11.6 CCT TEST LOAD v δδ 5 DATA FOR PARENT MATERIALS (D0697E33)AND FCAW WELDS - TRANSVERSE - THROUGH
THICKNESS NOTCH, a/t = 1 - NOTCH IN HAZ
0 2 4 6 8 100
200
400
600
800
1,000
1,200
Displacement (mm)
Load (kN)
Q & TParent
NormalisedParent
Q & T HAZM = 0.95
Normalised HAZM = 2.15
100 mm
25 mm
2a
M = 2.15
M = 0.95
-1 0 1 2 3 4 5 6 70
200
400
600
800
1,000
1,200
(mm)
Load (kN)
Q & T Normalised Q & T HAZM = 0.95
Normalised HAZM = 2.15
100mm
25mm
2a
M = 2.15
M = 0.95
δ 5

BRITE-EURAM SINTAP S454 BRPR-CT95-0024Contribution to BE95-1426 Task 1 Sub-Task 1.3 24/3/99 CONFIDENTIAL
A11/F4
FIG. A11.7 CCT TEST δδ 5 v DISPLACEMENT DATA FOR PARENT (D0697E33)MATERIALS AND FCAW WELDS - TRANSVERSE -
THROUGH THICKNESS NOTCH, a/t = 1 - NOTCH IN HAZ
FIG. A11.8 CCT TEST STRAIN v DISPLACEMENT DATA FOR FCAW (D0697E33)WELDS - TRANSVERSE - THROUGH THICKNESS
NOTCH, a/t = 1 - NOTCH IN HAZ
0 1 2 3 4 5 60
1
2
3
4
5
6
Displacement (mm)
(mm)
Q & T
Normalised
Q & T HAZM = 0.95
Normalised HAZM = 2.15
100 mm
25 mm
2a
M = 2.15
M = 0.95
δ5
0 1 2 3 4 50
2
4
6
8
10
Displacement (mm)
Strain (%)
Q & T HAZM = 0.95
Normalised HAZM = 2.15
100 mm
25 mm
2a
M = 0.95 (L)
M = 0.95 (R)M = 2.15 (R)
M = 2.15 (L)

BRITE-EURAM SINTAP S454 BRPR-CT95-0024Contribution to BE95-1426 Task 1 Sub-Task 1.3 24/3/99 CONFIDENTIAL
A12/1
APPENDIX 12
CENTRE CRACKED TENSILE TEST DATA FORTESTS NOTCHED AT SAW HAZ

BRITE-EURAM SINTAP S454 BRPR-CT95-0024Contribution to BE95-1426 Task 1 Sub-Task 1.3 24/3/99 CONFIDENTIAL
A12/F1
FIG. A12.1 CCT TEST LOAD v DISPLACEMENT DATA FOR PARENT (D0697E35)MATERIALS AND SAW WELDS - TRANSVERSE -SURFACE NOTCH, a/t 0.5, a/c 0.5 - NOTCH IN HAZ
FIG. A12.2 CCT TEST LOAD v CMOD DATA FOR PARENT MATERIALS (D0697E35)AND SAW WELDS - TRANSVERSE - SURFACE NOTCH,
a/t 0.5, a/c 0.5 - NOTCH IN HAZ
0 2 4 6 8 10 120
500
1,000
1,500
2,000
Displacement (mm)
Load (kN)
Q & T Parent
Normalised Parent
Q & T HAZM = 0.71
Normalised HAZM = 1.62
Tempered HAZM = 1.01
100 mm
25 mm
2c
M = 1.01M = 1.62
M = 0.71
0 0.5 1 1.5 2 2.5 3 3.50
500
1,000
1,500
2,000
CMOD (mm)
Load (kN)
Q & TParent
NormalisedParent
Q & T HAZM = 0.71
Normalised HAZM = 1.62
Tempered HAZM = 1.01
100 mm
25 mm
2c
M = 1.01 M = 1.62
M = 0.71
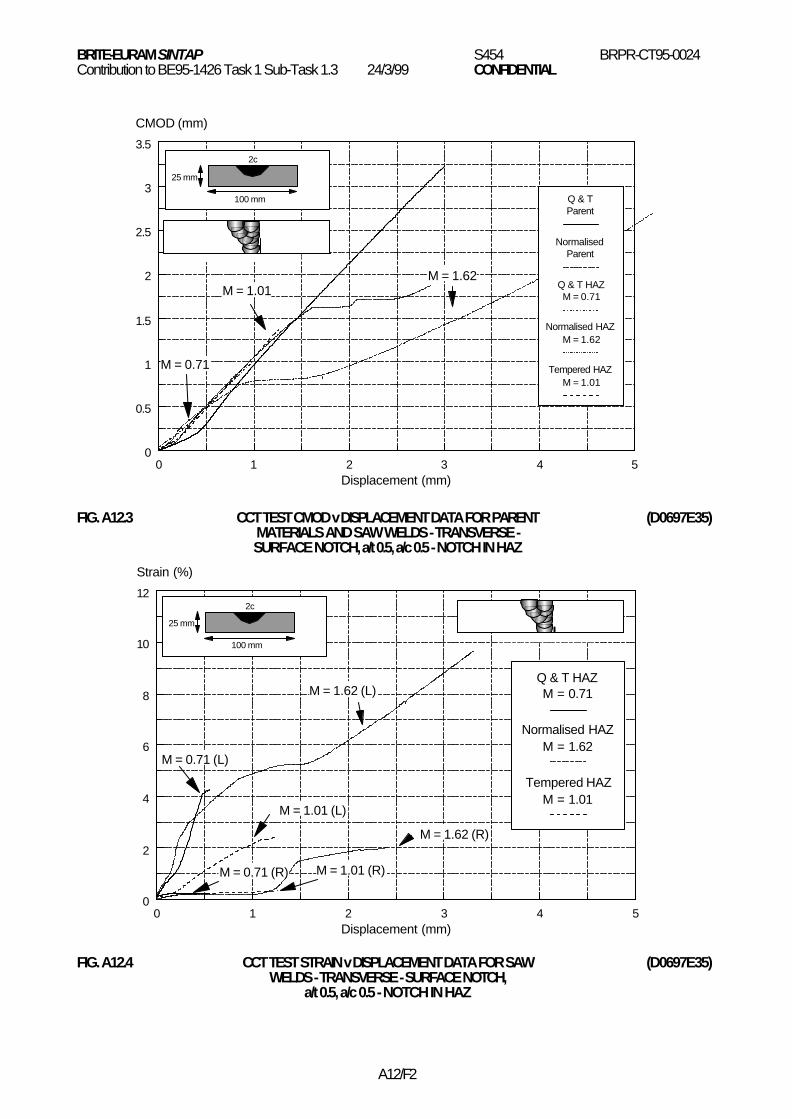
BRITE-EURAM SINTAP S454 BRPR-CT95-0024Contribution to BE95-1426 Task 1 Sub-Task 1.3 24/3/99 CONFIDENTIAL
A12/F2
FIG. A12.3 CCT TEST CMOD v DISPLACEMENT DATA FOR PARENT (D0697E35)MATERIALS AND SAW WELDS - TRANSVERSE -SURFACE NOTCH, a/t 0.5, a/c 0.5 - NOTCH IN HAZ
FIG. A12.4 CCT TEST STRAIN v DISPLACEMENT DATA FOR SAW (D0697E35)WELDS - TRANSVERSE - SURFACE NOTCH,
a/t 0.5, a/c 0.5 - NOTCH IN HAZ
0 1 2 3 4 50
0.5
1
1.5
2
2.5
3
3.5
Displacement (mm)
CMOD (mm)
Q & T Parent
Normalised Parent
Q & T HAZM = 0.71
Normalised HAZM = 1.62
Tempered HAZM = 1.01
100 mm
25 mm
2c
M = 1.01M = 1.62
M = 0.71
0 1 2 3 4 50
2
4
6
8
10
12
Displacement (mm)
Strain (%)
Q & T HAZM = 0.71
Normalised HAZM = 1.62
Tempered HAZM = 1.01
100 mm
25 mm
2c
M = 1.01 (L)
M = 1.62 (R)
M = 0.71 (L)
M = 0.71 (R) M = 1.01 (R)
M = 1.62 (L)

BRITE-EURAM SINTAP S454 BRPR-CT95-0024Contribution to BE95-1426 Task 1 Sub-Task 1.3 24/3/99 CONFIDENTIAL
A13/1
APPENDIX 13
MICRO-TENSILE TESTING OF MULTI-PASS WELDS

BRITE-EURAM SINTAP S454 BRPR-CT95-0024Contribution to BE95-1426 Task 1 Sub-Task 1.3 24/3/99 CONFIDENTIAL
A13/2
SINTAPBrite-Euram Project No: BE95-1426Task No: 1Sub Task No: 1.3Date: February 1999Contributing Organisation: GKSSDocument No: SINTAP/GKSS/18
CONFIDENTIAL
STRUCTURAL INTEGRITY ASSESSMENT PROCEDURESFOR EUROPEAN INDUSTRY
SINTAP
Sub Task 1.3Multi-Pass Weld Evaluation:
Micro-Tensile Testing of Multi-Pass Welds
Reported By: GKSS Research CenterInstitute for Materials ResearchD-21502 Geesthacht, Germany
Authors: S. Riekehr and M. Koçak
SINTAP Doc. Nr: SINTAP-GKSS-18
WELD STRENGTH MIS-MATCH EFFECTS:

BRITE-EURAM SINTAP S454 BRPR-CT95-0024Contribution to BE95-1426 Task 1 Sub-Task 1.3 24/3/99 CONFIDENTIAL
A13/3
MULTIPASS WELD EVALUATION
1. IntroductionSINTAP Sub Task 1.3 was set up to investigate the effects of weld strength mismatch in multipass C-Mn steel weld joints. Two weld joints (SAW and FCAW representing high and low heat input weldingprocesses) prepared by the British Steel were sent to the GKSS for preparation and testing of the microflat tensile (MFT) specimens, Figure 1. The objective of these tests was to determine the tensileproperty variation across the weld joint and hence to establish the true strength mis-match level(s)between multipass weld deposit (WM) and base metal (BM) as well as between HAZ and other parts ofthe weld joints. Furthermore, it is aimed to make comparisons between the tensile results obtained fromsimulated HAZ and real HAZ regions. It is also intended to establish the hardness vs. strengthrelationship for the weld joints which can be used to determine the strength of the HAZ regions.
This report includes the results of the SAW weld joints manufactured using SD3 1Ni1/4Mo wire withOP121TT flux on 25 mm thick steel plates in three conditions.
SAW weld metal tensile properties as determined from standard round all-weld metal tensilespecimens at BS:
YS= 480 MPaUTS= 591 MPan= 0.147
FCAW weld metal tensile properties as determined from standard round all-weld metal tensilespecimens at BS:
YS= 545 MPaUTS= 619 MPan= 0.111
The base plate conditions prior to the welding and resulting tensile properties were:
1. High Strength Level: Quenched & Tempered: Reheating to 930°C for 50 min. prior to water quenching and tempering at
580°C for 1hr.YS= 675 MPaUTS= 753 MPan= 0.088Mis-match ratio for SAW weld metal M= 0.71 (Undermatching)Mis-match ratio for FCAW weld metal M= 0.95 (Undermatching)
2. Medium Strength Level: High Temperature Tempering at 675 °C for 1 hr.
YS= 475 MPaUTS= 610 MPan= 0.117Mis-match ratio for SAW weld metal M= 1.01 (Matching)Mis-match ratio for FCAW weld metal M= 1.35 (Overmatching)
3. Low Strength Level: Normalising heat treatment at 900°C for 1hr.
YS= 297 MPaUTS= 510 MPan= 0.239Mis-match ratio for SAW weld metal M= 1.62 (Overmatching)Mis-match ratio for FCAW weld metal M= 2.15 (Overmatching)

BRITE-EURAM SINTAP S454 BRPR-CT95-0024Contribution to BE95-1426 Task 1 Sub-Task 1.3 24/3/99 CONFIDENTIAL
A13/4
Further deatils of the welding & PWHT conditions and standard mechanical testing results are alreadyreported in SINTAP/BS/24.
2. Micro Flat Tensile (MFT) Testing:
The variation in local tensile properties of the joints was determined by extracting (EDM machining using0.2 mm Cu-wire) and testing of large numbers of micro flat tensile specimens at room temperature.Figure 1 shows the basic principles of this testing procedure and specimen dimensions.
2.1 SAW welded Q&T high strength steel weld joint:
The results of the SAW welded Q&T high strength steel weld joint are given in Figure 2. The yield (Rp0.2)and ultimate tensile (Rm) strength values as well as strain to fracture values are plotted againstspecimen number (location). The results are clearly showing the presence of significantly wider andlower strength HAZ region due to high heat input process. The lowest yield strength level for the HAZ isabout 380 MPa. This level yields a strength undermatching between base and HAZ region of 0.56 whichis much lower than the mismatch level (M=0.71) between weld and base metals. The strength vs.hardness data developed by BS using thermal simulated specimens reveals the peak yield strength levelfor the CGHAZ for the SAW welds approx. 510 MPa. However, this level can not yet be confirmed andthe second set of specimen results (curently at progress) will provide further data for this purpose.
These results are also confirming the BS results with respect to undermatching level (approx. 0.71) ofthe weld metal which exhibits a yield strength level of 480 MPa. Furthermore, no significant yieldstrength peak (for the CGHAZ) adjacent to the fusion line was observed in this specimen set. Theresults of the second set (W7K102-2) of specimens will confirm this trend.
The diagram also gives for each specimen the lower yield strength (ReL) values (open symbols) whichmay slightly lower the curves at some locations.
The ultimate tensile strength (Rm) profile of the weld joint follows very similar trend as of yield strengthdistribution across the weld.
2.2 SAW welded normalised lower strength steel weld joint:
Figure 3 presents the strength and respective ductility across the weld joint of lower strength base metal(normalised+PWHT). The peak value of yield strength (approx. 560 MPa) was obtained for the CGHAZregion. This value is higher than the mean CGHAZ strength value of 510 MPa obtained from hardness vs.strength correlation at BS. Consequently the lower level (10%) of strain to fracture value was obtained forthe MFT specimen extracted from the microstructure adjacent to the fusion line.
The strength gradient obtained for HAZ region presents the minimum yield strength of approx. 320 MPafor softened HAZ region which is slightly higher than the base metal yield strength of 297 MPa.Complete trend of strength distribution towards base plate will be confirmed or adjusted by the results ofsecond set of specimens which is currently in evaluation stage. The arrows at the end of the yieldstrength distribution curves are indicating an expected trends.
The weld metal strength level obtained from MFT specimens, in average slightly lower than the levels(YS of 480 MPa and UTS of 591 MPa) obtained by using standard round tensile specimens at BS.Naturally, the MFT specimens are capable to identify local microstructural variations due to thecolumnar and refined/reheated weld metal regions.
Figure 3 again provides for each specimen the lower yield strength (ReL) values (open symbols) whichmay slightly lower the curves at some locations.
2.3 SAW welded tempered medium strength steel weld joint:

BRITE-EURAM SINTAP S454 BRPR-CT95-0024Contribution to BE95-1426 Task 1 Sub-Task 1.3 24/3/99 CONFIDENTIAL
A13/5
Figure 4 presents a similar fashion as Figures 2 and 3, the results for medium strength level steel. Forthis steel weld joint, unfortunately, the first set of specimens did not reveal full HAZ strength profile dueto sectioning mistake of MFT specimens. Most of the specimens were obtained for the weld metal.However, the peak strength level obtained for the CGHAZ region which gives the yield strength of 580MPa. The HAZ strength profile will be completed with the second set of results.
The weld metal region (particularly at the middle of the weld) exhibits higher yield strength level (approx.530 MPa) than the level determined by round tensile specimens as 480 MPa. Consequently, the level ofstrength mismatch established for this weld joint could be influenced and higher strength region of theSAW weld metal may lead to the undermatching condition.
3. Conclusions (Tentative)
Partial results of the micro flat tensile (MFT) specimens for the SAW process welded three steels arereported. Approximately 90 MFT specimens were tested at room temperature for determination of thestrength gradient of the HAZ region of multipass welds.
The results are clearly indicating the softening nature of the real HAZ regions for all three steels andMFT specimen technique can provide the YS, UTS and strain data for respective locations.
It is shown that the hardness vs. strength correlation method used for determination of the HAZ (FL toFL+2.5 mm region) strength level can not provide real strength level of the HAZ. The minimum HAZ yieldstrength level determined so far (for Q&T and normalised steels) is varying between 310 MPa to 370MPa). Therefore, an average HAZ strength level of 430 MPA given in BS report SINTAP/BS/24 is nonconservative.
4. Current WorkThe evaluation of the tested MFT and SENB specimens for SAW and FCAW welds are in progress.Final report will cover all these results.
AcknowledgementWe wish to acknowledge the technical assistance of Mr. H. Mackel for his careful preparation work andhelp to testing of large numbers of MFT specimens.
S. RiekehrM. Koçak
8th February 1999

BRITE-EURAM SINTAP S454 BRPR-CT95-0024Contribution to BE95-1426 Task 1 Sub-Task 1.3 24/3/99 CONFIDENTIAL
A13/F1
SINTAP Doc. Nr: SINTAP-GKSS-18
Sub Task 1.3 Micro Tensile Testing of SAW Multi-Pass Welds
Figure 1. Extraction and testing principles of the flat micro tensile specimens to determine local variations and distributions of the tensile properties across the weld joint.

BRITE-EURAM SINTAP S454 BRPR-CT95-0024Contribution to BE95-1426 Task 1 Sub-Task 1.3 24/3/99 CONFIDENTIAL
A13/F2
SINTAP
Sub Task 1.3 Micro Tensile Testing of SAW Multi-Pass Welds
Base Plate: Q&T+PWHTConsumables: SD3 1Ni1/4Mo wire with OP121TT flux +PWHTWELD No: W7K102-Set 1 Conditon: UNDERMATCHING (UM)
Figure 2. Distribution of the tensile properties across the SAW weld of Q&T steel

BRITE-EURAM SINTAP S454 BRPR-CT95-0024Contribution to BE95-1426 Task 1 Sub-Task 1.3 24/3/99 CONFIDENTIAL
A13/F3
SINTAP
Sub Task 1.3 Micro Tensile Testing of SAW Multi-Pass Welds
Base Plate: Normalised+PWHTConsumables: SD3 1Ni1/4Mo wire with OP121TT flux+PWHTWELD No: W7K139-Set 3 Condition: OVERMATCHING (OM)
Figure 3. Distribution of the tensile properties across the SAW weldof normalised steel
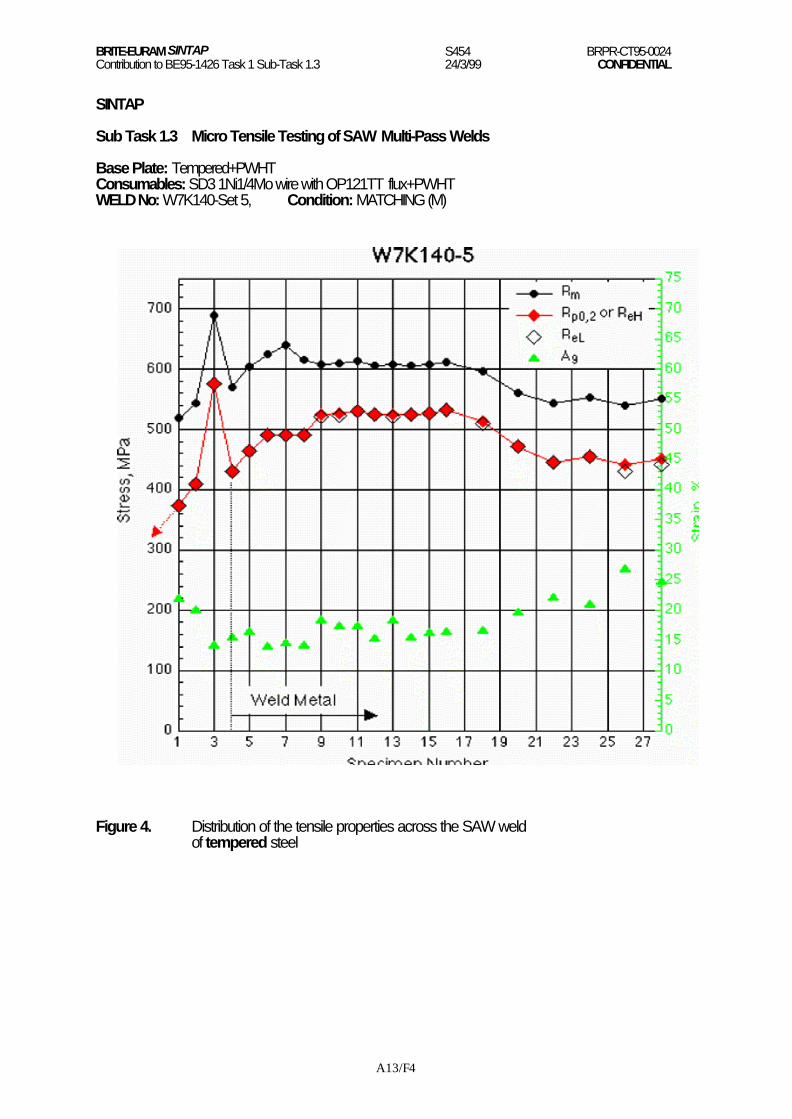
BRITE-EURAM SINTAP S454 BRPR-CT95-0024Contribution to BE95-1426 Task 1 Sub-Task 1.3 24/3/99 CONFIDENTIAL
A13/F4
SINTAP
Sub Task 1.3 Micro Tensile Testing of SAW Multi-Pass Welds
Base Plate: Tempered+PWHTConsumables: SD3 1Ni1/4Mo wire with OP121TT flux+PWHTWELD No: W7K140-Set 5, Condition: MATCHING (M)
Figure 4. Distribution of the tensile properties across the SAW weldof tempered steel