Prediction of weld strength and seam width for laser transmission welding of thermoplastic using...
12
Prediction of weld strength and seam width for laser transmission welding of thermoplastic using response surface methodology Bappa Acherjee a, , Dipten Misra b , Dipankar Bose a , K. Venkadeshwaran b a Department of Mechanical Engineering, National Institute of Technical Teachers’ Training & Research, Salt lake city, Kolkata 700106, India b School of Laser Science & Engineering, Jadavpur University, Jadavpur, Kolkata 700032, India article info Article history: Received 16 March 2009 Received in revised form 8 April 2009 Accepted 8 April 2009 Available online 13 May 2009 Keywords: Laser transmission welding Response surface methodology (RSM) Thermoplastics abstract In the present work, a study is made to investigate the effects of process parameters, namely, laser power, welding speed, size of the laser beam and clamp pressure, on the lap-shear strength and weld- seam width for laser transmission welding of acrylic (polymethyl methacrylate), using a diode laser system. Response surface methodology (RSM) is employed to develop mathematical relationships between the welding process parameters and the output variables of the weld joint to determine the welding input parameters that lead to the desired weld quality. In addition, using response surface plots, the interaction effects of process parameters on the responses are analyzed and discussed. The statistical software Design-Expert v7 is used to establish the design matrix and to obtain the regression equations. The developed mathematical models are tested by analysis-of-variance (ANOVA) method to check their adequacy. Finally, a comparison is made between measured and calculated results, which are in good agreement. This indicates that the developed models can predict the responses adequately within the limits of welding parameters being used. & 2009 Elsevier Ltd. All rights reserved. 1. Introduction Plastics are found in a wide variety of products from the very simple to the extremely complex, from domestic products to food and medical product packages, electrical devices, electronics and automobiles because of their good strength to weight ratio, ease of fabrication of complex shapes, low cost and ease of recycling. They are replacing metals in certain applications. Plastics can also be used as a better alternative for glass. Laser transmission welding is a novel method of joining a variety of thermoplastics, which offers specific process advantages over conventional plastic welding techniques, such as short welding cycle times while providing optically and qualitatively high-grade joints. The technique offers accuracy, is non-contact and introduces apposite energy with the possibility of optimizing the welding temperature. There is an absence of vibration of the parts in the process and it imposes minimal thermal stress and avoids particle generation. Further- more, this method shows excellent integration capabilities and potential for automation. The laser transmission welding process can be justified over its conventional counterparts by the increase in reproducibility of the process, ease of processing, decrease of rejection rate and increase in productivity [1–4]. In laser transmission welding, a laser beam is aimed at two overlapping thermoplastic parts of different optical properties. The first part is designed to be transparent to the radiation at the laser wavelength and the second part is to be absorbent to that radiation. Depending on the thickness and absorption coefficient of the absorbing part, the transmitted energy is absorbed over a certain depth of that material. Laser energy in the near-infrared spectrum that is absorbed in the absorbing part causes vibration of electron bonds resulting in localized heating of the material. This heat is transferred to the transparent thermoplastic part via thermal conduction between the joining partners; consequently, surface layers of both the parts are melted at the joining interface. After cooling and re-solidification, a bond is formed at the weld seam [5,6]. The efficiency of laser transmission welding strongly depends on the optical properties of the plastic parts to be joined and the process parameters. The influence of the plastic composition, colorants and thickness of plastic parts on the laser transmission and absorption and finally on the mechanical performance of the weld have been studied extensively [3,6–10]. It is evident from the literature that the presence of reinforce- ment, mineral fillers, impact modifiers, color pigments and some heat stabilizers in polymer matrix lower the transmissivity of the polymer due to particulate scattering and increased absorption by colorants. It is also observed that thickness of plastic part influences the optical properties, especially in the presence of fillers, crystallites, etc. ARTICLE IN PRESS Contents lists available at ScienceDirect journal homepage: www.elsevier.com/locate/optlastec Optics & Laser Technology 0030-3992/$ - see front matter & 2009 Elsevier Ltd. All rights reserved. doi:10.1016/j.optlastec.2009.04.007 Corresponding author. Tel.: +9133 23374125; fax: +9133 23376331. E-mail addresses: [email protected], [email protected] (B. Acherjee). Optics & Laser Technology 41 (2009) 956–967
-
Upload
independent -
Category
Documents
-
view
1 -
download
0
Transcript of Prediction of weld strength and seam width for laser transmission welding of thermoplastic using...

ARTICLE IN PRESS
Optics & Laser Technology 41 (2009) 956–967
Contents lists available at ScienceDirect
Optics & Laser Technology
0030-39
doi:10.1
� Corr
E-m
journal homepage: www.elsevier.com/locate/optlastec
Prediction of weld strength and seam width for laser transmission welding ofthermoplastic using response surface methodology
Bappa Acherjee a,�, Dipten Misra b, Dipankar Bose a, K. Venkadeshwaran b
a Department of Mechanical Engineering, National Institute of Technical Teachers’ Training & Research, Salt lake city, Kolkata 700106, Indiab School of Laser Science & Engineering, Jadavpur University, Jadavpur, Kolkata 700032, India
a r t i c l e i n f o
Article history:
Received 16 March 2009
Received in revised form
8 April 2009
Accepted 8 April 2009Available online 13 May 2009
Keywords:
Laser transmission welding
Response surface methodology (RSM)
Thermoplastics
92/$ - see front matter & 2009 Elsevier Ltd. A
016/j.optlastec.2009.04.007
esponding author. Tel.: +9133 23374125; fax
ail addresses: [email protected], bappa.ran
a b s t r a c t
In the present work, a study is made to investigate the effects of process parameters, namely, laser
power, welding speed, size of the laser beam and clamp pressure, on the lap-shear strength and weld-
seam width for laser transmission welding of acrylic (polymethyl methacrylate), using a diode laser
system. Response surface methodology (RSM) is employed to develop mathematical relationships
between the welding process parameters and the output variables of the weld joint to determine the
welding input parameters that lead to the desired weld quality. In addition, using response surface
plots, the interaction effects of process parameters on the responses are analyzed and discussed. The
statistical software Design-Expert v7 is used to establish the design matrix and to obtain the regression
equations. The developed mathematical models are tested by analysis-of-variance (ANOVA) method to
check their adequacy. Finally, a comparison is made between measured and calculated results, which
are in good agreement. This indicates that the developed models can predict the responses adequately
within the limits of welding parameters being used.
& 2009 Elsevier Ltd. All rights reserved.
1. Introduction
Plastics are found in a wide variety of products from the verysimple to the extremely complex, from domestic products to foodand medical product packages, electrical devices, electronics andautomobiles because of their good strength to weight ratio, ease offabrication of complex shapes, low cost and ease of recycling. Theyare replacing metals in certain applications. Plastics can also beused as a better alternative for glass. Laser transmission welding isa novel method of joining a variety of thermoplastics, which offersspecific process advantages over conventional plastic weldingtechniques, such as short welding cycle times while providingoptically and qualitatively high-grade joints. The technique offersaccuracy, is non-contact and introduces apposite energy with thepossibility of optimizing the welding temperature. There is anabsence of vibration of the parts in the process and it imposesminimal thermal stress and avoids particle generation. Further-more, this method shows excellent integration capabilities andpotential for automation. The laser transmission welding processcan be justified over its conventional counterparts by the increasein reproducibility of the process, ease of processing, decrease ofrejection rate and increase in productivity [1–4].
ll rights reserved.
: +9133 2337 6331.
[email protected] (B. Acherjee).
In laser transmission welding, a laser beam is aimed at twooverlapping thermoplastic parts of different optical properties.The first part is designed to be transparent to the radiation at thelaser wavelength and the second part is to be absorbent to thatradiation. Depending on the thickness and absorption coefficientof the absorbing part, the transmitted energy is absorbed over acertain depth of that material. Laser energy in the near-infraredspectrum that is absorbed in the absorbing part causes vibrationof electron bonds resulting in localized heating of the material.This heat is transferred to the transparent thermoplastic part viathermal conduction between the joining partners; consequently,surface layers of both the parts are melted at the joining interface.After cooling and re-solidification, a bond is formed at the weldseam [5,6].
The efficiency of laser transmission welding stronglydepends on the optical properties of the plastic parts to be joinedand the process parameters. The influence of the plasticcomposition, colorants and thickness of plastic parts on the lasertransmission and absorption and finally on the mechanicalperformance of the weld have been studied extensively [3,6–10].It is evident from the literature that the presence of reinforce-ment, mineral fillers, impact modifiers, color pigments and someheat stabilizers in polymer matrix lower the transmissivity of thepolymer due to particulate scattering and increased absorption bycolorants. It is also observed that thickness of plastic partinfluences the optical properties, especially in the presence offillers, crystallites, etc.

ARTICLE IN PRESS
B. Acherjee et al. / Optics & Laser Technology 41 (2009) 956–967 957
The key process parameters for laser transmission welding are:laser power, welding speed, beam spot area and clampingpressure, which control the temperature field inside the weldseam, and hence the weld quality [11]. A number of experimentalprograms have been carried out to study the effect of processparameters on weld quality, with various plastic materials andapplication strategies [1,4,12–15]. However, only a few reportshave detailed the role of the key parameters on the responses. Toget the desired weld quality, i.e., weld bead size and weldstrength, the combination of the process parameters should beselected carefully. An extensive work is, therefore, needed toanalyze and optimize the process parameters to understand theireffect on the seam width and weld strength. The response surfacemethodology (RSM) of experimental design is one of the bestknown optimization techniques, which helps in carrying out theanalysis of experiments with the least experimental effort [16].RSM is widely used to predict the weld bead geometry andmechanical properties in different welding processes, such aslaser welding [17], submerged arc welding [18,19], etc. In thiswork, mathematical models are developed to predict the lap-shear strength and weld-seam width for laser transmissionwelding of acrylic (polymethyl methacrylate), widely used inhousehold products, construction, automobiles, aviation, lightingand displays. These mathematical models are very useful not onlyfor predicting the weld quality, but also for selecting the optimumprocess parameters for achieving the desired quality and processoptimization [19]. RSM is applied to plan and analyze theexperiments.
Table 1Process control parameters and their limits.
Parameters Units Notations Limits
�2 �1 0 +1 +2
Power Watt P 16.00 19.00 22.00 25.00 28.00
Welding speed mm/min S 240.00 300.00 360.00 420.00 480.00
Stand-off-distance mm F 24.00 28.00 32.00 36.00 40.00
Clamp pressure MPa C 3.30 6.30 9.30 12.30 15.30
2. Response surface methodology
Response surface methodology is a collection of mathematicaland statistical techniques that are useful for the modeling andanalysis of problems in which a response of interest is influencedby several variables and the objective is to optimize the response[16]. The field of response surface methodology consists of theexperimental strategy for exploring the space of the process orindependent variables, empirical statistical modeling to developan appropriate approximating relationship between the yield andthe process variables, and optimization methods for finding thevalues of the process variables that produce desirable values ofthe response. When all independent variables (x1, x2,y,xk) aremeasurable, controllable and continuous in the experiments, withnegligible error, the response surface y can be expressed by
y ¼ f ðx1; x2; . . . ; xkÞ þ � (1)
where the form of the true response function f is unknown andperhaps very complicated, and e is a term that represents othersources of variability not accounted for in f. Usually e includeseffects such as measurement error on the response, backgroundnoise, the effect of other variables, and so on. Usually e is treatedas a statistical error, often assuming it to have a normaldistribution with mean zero and variance s2. Then, the expectedresponse can be written as
EðyÞ ¼ Z ¼ E½f ðx1;x2; . . . ; xkÞ� þ Eð�Þ ¼ f ðx1; x2; . . . ; xkÞ. (2)
The variables x1, x2,y, xk in Eq. (2) are usually called the naturalvariables, because they are expressed in the natural units ofmeasurement, such as 1C, kg/m2, etc. In RSM, it is convenient totransform the natural variables to coded variables x1, x2,y, xk,which are usually defined to be dimensionless with mean zeroand the same standard deviation. In terms of the coded variables,the response function (2) will be written as
Z ¼ f ðx1; x2; . . . ; xkÞ. (3)
In the practical application of RSM, it is necessary to develop anapproximating model for the true response surface. The approx-imating model is based on observed data from the process orsystem and is an empirical model. Multiple regression is acollection of statistical techniques useful for building the typesof empirical models required in RSM. Usually, a second-orderpolynomial Eq. (4) is used in RSM
y ¼ b0 þXk
j¼1
bjxj þXk
j¼1
bjjx2j þ
X
ioj
Xk
j¼2
bijxixj (4)
where parameters bi,j ¼ 0, 1,y, k are called the regressioncoefficients.
3. Experimental design
The experiment is designed, based on a four-factor five-levelcentral composite rotatable design, with full replication [16]. Thefollowing independently controllable process parameters areidentified to carry out the experiments: power (P), welding speed(S), stand-off-distance (F) and clamp pressure (C). The beam spotarea is controlled by varying the stand-off-distance, i.e., thedistance between the laser optics and the work material. In thepresent study, intimate contact between the work materials isensured by the use of highly finished work materials and byemploying pressure between the contacting pairs. Trial runs areconducted by varying one of the process parameters at a time,while keeping the rest of them at constant value. The workingrange is decided by inspecting the weld seam for a smoothappearance and the absence of any visible defects.
The selected process parameters and their limits, units andnotations are given in Table 1. Statistical software Design-Expertv7 is used to code the variables and to establish the design matrix.RSM is applied to the experimental data using the same softwareto obtain the regression equations and to generate the statisticaland response plots.
4. Experimental work
4.1. Experimental procedure
In the present work, natural and black (containing 0.2 wt%carbon black as color pigment) acrylic plaques of dimensions80 mm�35 mm�4 mm each, cut from injection-molded acrylicsheets of size 2000 mm�1500 mm�4 mm, are used as the workmaterials. They are placed on the welding fixture with the naturalsample on top, with an overlap between the natural and blackplaques of about 20 mm, centering the target weld line at adistance of about 10 mm from the end of the natural sample, asshown in Fig. 1. Using a hydraulic piston, the welding fixtures andsamples are raised until the mild steel upper plate of the jackholder presses the natural plaque. A uniform pressure on thewhole length of the joint is generated by an additional transparentacrylic plaque of same size that is placed across and above the
ARTICLE IN PRESS
Fig. 1. Weld joint configuration.
0
5
10
15
20
25
30
0
Pressure gauge readings (Kgf/cm2)
Pres
sure
ava
ilabl
e on
spe
cim
en (
MPa
)
12010080604020
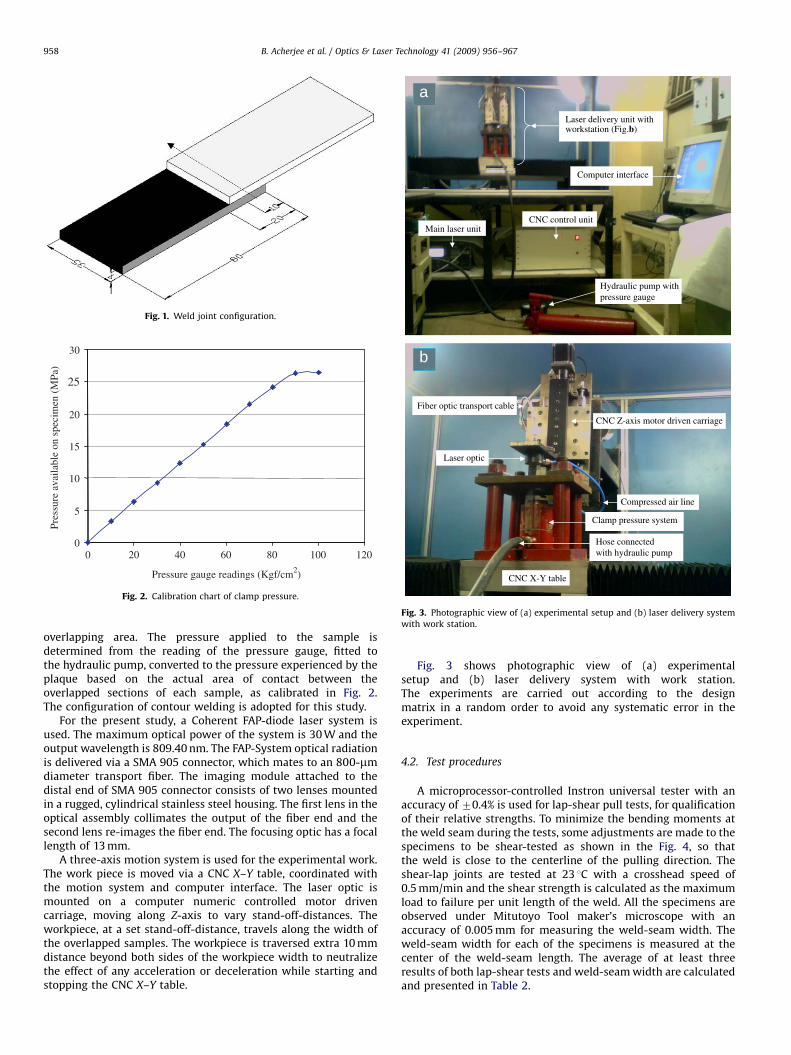
Fig. 2. Calibration chart of clamp pressure.
b
Hose connected with hydraulic pump
Fiber optic transport cable
Clamp pressure system
CNC X-Y table
aLaser delivery unit with workstation (Fig.b)
Computer interface
Hydraulic pump with pressure gauge
Main laser unit CNC control unit
Compressed air line
Laser optic
CNC Z-axis motor driven carriage
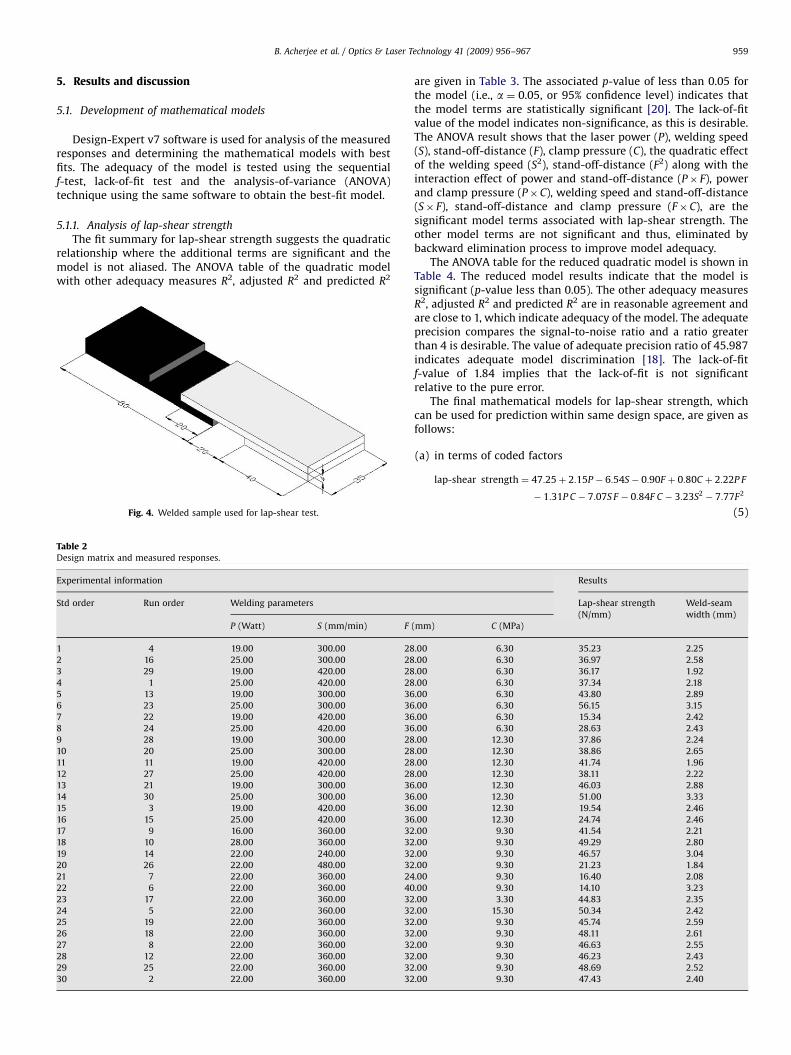
Fig. 3. Photographic view of (a) experimental setup and (b) laser delivery system
with work station.
B. Acherjee et al. / Optics & Laser Technology 41 (2009) 956–967958
overlapping area. The pressure applied to the sample isdetermined from the reading of the pressure gauge, fitted tothe hydraulic pump, converted to the pressure experienced by theplaque based on the actual area of contact between theoverlapped sections of each sample, as calibrated in Fig. 2.The configuration of contour welding is adopted for this study.
For the present study, a Coherent FAP-diode laser system isused. The maximum optical power of the system is 30 W and theoutput wavelength is 809.40 nm. The FAP-System optical radiationis delivered via a SMA 905 connector, which mates to an 800-mmdiameter transport fiber. The imaging module attached to thedistal end of SMA 905 connector consists of two lenses mountedin a rugged, cylindrical stainless steel housing. The first lens in theoptical assembly collimates the output of the fiber end and thesecond lens re-images the fiber end. The focusing optic has a focallength of 13 mm.
A three-axis motion system is used for the experimental work.The work piece is moved via a CNC X–Y table, coordinated withthe motion system and computer interface. The laser optic ismounted on a computer numeric controlled motor drivencarriage, moving along Z-axis to vary stand-off-distances. Theworkpiece, at a set stand-off-distance, travels along the width ofthe overlapped samples. The workpiece is traversed extra 10 mmdistance beyond both sides of the workpiece width to neutralizethe effect of any acceleration or deceleration while starting andstopping the CNC X–Y table.
Fig. 3 shows photographic view of (a) experimentalsetup and (b) laser delivery system with work station.The experiments are carried out according to the designmatrix in a random order to avoid any systematic error in theexperiment.
4.2. Test procedures
A microprocessor-controlled Instron universal tester with anaccuracy of 70.4% is used for lap-shear pull tests, for qualificationof their relative strengths. To minimize the bending moments atthe weld seam during the tests, some adjustments are made to thespecimens to be shear-tested as shown in the Fig. 4, so thatthe weld is close to the centerline of the pulling direction. Theshear-lap joints are tested at 23 1C with a crosshead speed of0.5 mm/min and the shear strength is calculated as the maximumload to failure per unit length of the weld. All the specimens areobserved under Mitutoyo Tool maker’s microscope with anaccuracy of 0.005 mm for measuring the weld-seam width. Theweld-seam width for each of the specimens is measured at thecenter of the weld-seam length. The average of at least threeresults of both lap-shear tests and weld-seam width are calculatedand presented in Table 2.
ARTICLE IN PRESS
B. Acherjee et al. / Optics & Laser Technology 41 (2009) 956–967 959
5. Results and discussion
5.1. Development of mathematical models
Design-Expert v7 software is used for analysis of the measuredresponses and determining the mathematical models with bestfits. The adequacy of the model is tested using the sequentialf-test, lack-of-fit test and the analysis-of-variance (ANOVA)technique using the same software to obtain the best-fit model.
5.1.1. Analysis of lap-shear strength
The fit summary for lap-shear strength suggests the quadraticrelationship where the additional terms are significant and themodel is not aliased. The ANOVA table of the quadratic modelwith other adequacy measures R2, adjusted R2 and predicted R2
Fig. 4. Welded sample used for lap-shear test.
Table 2Design matrix and measured responses.
Experimental information
Std order Run order Welding parameters
P (Watt) S (mm/min) F
1 4 19.00 300.00 28
2 16 25.00 300.00 28
3 29 19.00 420.00 28
4 1 25.00 420.00 28
5 13 19.00 300.00 36
6 23 25.00 300.00 36
7 22 19.00 420.00 36
8 24 25.00 420.00 36
9 28 19.00 300.00 28
10 20 25.00 300.00 28
11 11 19.00 420.00 28
12 27 25.00 420.00 28
13 21 19.00 300.00 36
14 30 25.00 300.00 36
15 3 19.00 420.00 36
16 15 25.00 420.00 36
17 9 16.00 360.00 32
18 10 28.00 360.00 32
19 14 22.00 240.00 32
20 26 22.00 480.00 32
21 7 22.00 360.00 24
22 6 22.00 360.00 40
23 17 22.00 360.00 32
24 5 22.00 360.00 32
25 19 22.00 360.00 32
26 18 22.00 360.00 32
27 8 22.00 360.00 32
28 12 22.00 360.00 32
29 25 22.00 360.00 32
30 2 22.00 360.00 32
are given in Table 3. The associated p-value of less than 0.05 forthe model (i.e., a ¼ 0.05, or 95% confidence level) indicates thatthe model terms are statistically significant [20]. The lack-of-fitvalue of the model indicates non-significance, as this is desirable.The ANOVA result shows that the laser power (P), welding speed(S), stand-off-distance (F), clamp pressure (C), the quadratic effectof the welding speed (S2), stand-off-distance (F2) along with theinteraction effect of power and stand-off-distance (P� F), powerand clamp pressure (P�C), welding speed and stand-off-distance(S� F), stand-off-distance and clamp pressure (F�C), are thesignificant model terms associated with lap-shear strength. Theother model terms are not significant and thus, eliminated bybackward elimination process to improve model adequacy.
The ANOVA table for the reduced quadratic model is shown inTable 4. The reduced model results indicate that the model issignificant (p-value less than 0.05). The other adequacy measuresR2, adjusted R2 and predicted R2 are in reasonable agreement andare close to 1, which indicate adequacy of the model. The adequateprecision compares the signal-to-noise ratio and a ratio greaterthan 4 is desirable. The value of adequate precision ratio of 45.987indicates adequate model discrimination [18]. The lack-of-fitf-value of 1.84 implies that the lack-of-fit is not significantrelative to the pure error.
The final mathematical models for lap-shear strength, whichcan be used for prediction within same design space, are given asfollows:
(a)
(mm
.00
.00
.00
.00
.00
.00
.00
.00
.00
.00
.00
.00
.00
.00
.00
.00
.00
.00
.00
.00
.00
.00
.00
.00
.00
.00
.00
.00
.00
.00
in terms of coded factors
lap-shear strength ¼ 47:25þ 2:15P � 6:54S� 0:90F þ 0:80C þ 2:22P F
� 1:31P C � 7:07S F � 0:84F C � 3:23S2� 7:77F2
(5)
Results
Lap-shear strength
(N/mm)
Weld-seam
width (mm)
) C (MPa)
6.30 35.23 2.25
6.30 36.97 2.58
6.30 36.17 1.92
6.30 37.34 2.18
6.30 43.80 2.89
6.30 56.15 3.15
6.30 15.34 2.42
6.30 28.63 2.43
12.30 37.86 2.24
12.30 38.86 2.65
12.30 41.74 1.96
12.30 38.11 2.22
12.30 46.03 2.88
12.30 51.00 3.33
12.30 19.54 2.46
12.30 24.74 2.46
9.30 41.54 2.21
9.30 49.29 2.80
9.30 46.57 3.04
9.30 21.23 1.84
9.30 16.40 2.08
9.30 14.10 3.23
3.30 44.83 2.35
15.30 50.34 2.42
9.30 45.74 2.59
9.30 48.11 2.61
9.30 46.63 2.55
9.30 46.23 2.43
9.30 48.69 2.52
9.30 47.43 2.40

ARTICLE IN PRESS
B. Acherjee et al. / Optics & Laser Technology 41 (2009) 956–967960
(b)
TablANO
Sour
Mod
P
S
F
C
PS
PF
PC
SF
SC
FC
P2
S2
F2
C2
Resi
Lack
Pure
Cor
Stan
Mea
Coef
Pred
TablANO
Sour
Mod
P
S
F
C
PF
PC
SF
FC
S2
F2
Resi
Lack
Pure
Cor
Stan
Mea
Coef
Pred
in terms of actual factors
lap-shear strength ¼ � 798:03505� 3:84824P þ 1:48034Sþ 38:04079F
þ 5:72250C þ 0:18505P F � 0:14590P C
� 0:029471S F � 0:070156F C � 8:97591E� 004S2
� 0:48555F2 (6)
5.1.2. Analysis of weld-seam width
For weld-seam width, the fit summary recommends thequadratic model where the additional terms are significant andthe model is not aliased. Table 5 presents the ANOVA table ofthe quadratic model with other adequacy measures R2, adjustedR2 and predicted R2. The associated p-value of less than 0.05
e 3VA analysis for the lap-shear strength model (before elimination).
ce Sum of squares df Mean s
el 3976.59 14 284.0
110.90 1 110.9
1026.65 1 1026.6
19.53 1 19.5
15.47 1 15.4
1.02 1 1.0
78.90 1 78.9
27.59 1 27.5
800.47 1 800.4
1.59 1 1.5
11.34 1 11.3
1.24 1 1.2
283.82 1 283.8
1649.24 1 1649.2
2.98 1 2.9
dual 32.34 15 2.1
-of-fit 25.86 10 2.5
error 6.48 5 1.3
total 4008.93 29
dard deviation ¼ 1.47
n ¼ 38.45
ficient of variation ¼ 3.82
icted residual error of sum of squares (PRESS) ¼ 158.31
e 4VA analysis for the lap-shear strength model (after backward elimination).
ce Sum of squares df Mean s
el 3969.11 10 396.9
110.90 1 110.9
1026.65 1 1026.6
19.53 1 19.5
15.47 1 15.4
78.90 1 78.9
27.59 1 27.5
800.47 1 800.4
11.34 1 11.3
297.00 1 297.0
1716.76 1 1716.7
dual 39.82 19 2.10
-of-fit 33.35 14 2.3
error 6.48 5 1.3
total 4008.93 29
dard deviation ¼ 1.45
n ¼ 38.45
ficient of variation ¼ 3.76
icted residual error of sum of squares (PRESS) ¼ 111.52
(i.e., a ¼ 0.05, or 95% confidence level) indicates that the modelterms can be considered as statistically significant. The lack-of-fitvalue of the model indicates non-significance as desired. Theanalysis-of-variance result shows that the main effect of the laserpower (P), welding speed (S), stand-off-distance (F), clamppressure (C), the quadratic effect of the stand-off-distance (F2),clamp pressure (C2), along with the interaction effect of powerand welding speed (P� S), power and stand-off-distance (P� F),welding speed and stand-off-distance (S� F), are the significantmodel terms associated with weld-seam width. Nevertheless, themain effect of clamp pressure is added to support hierarchy. Theother model terms are not significant and thus, eliminated bybackward elimination process to improve model adequacy.
The ANOVA table for the reduced quadratic model is presentedin Table 6. The reduced model results indicate that the model is
quares f-value Prob4f
4 131.74 o0.0001 Significant
0 51.44 o0.0001
5 476.18 o0.0001
3 9.06 0.0088
7 7.18 0.0172
2 0.47 0.5031
0 36.59 o0.0001
9 12.80 0.0028
7 371.27 o0.0001
9 0.74 0.4034
4 5.26 0.0367
4 0.58 0.4592
2 131.64 o0.0001
4 764.95 o0.0001
8 1.38 0.2582
6
9 2.00 0.2305 Not significant
0
R2¼ 0.9919
Adjusted R2¼ 0.9844
Predicted R2¼ 0.9605
Adequate precision ¼ 39.4580
quares f-value Prob4f
1 189.38 o0.0001 Significant
0 52.91 o0.0001
5 489.85 o0.0001
3 9.32 0.0066
7 7.38 0.0137
0 37.65 o0.0001
9 13.16 0.0018
7 381.93 o0.0001
4 5.41 0.0312
0 141.71 o0.0001
6 819.13 o0.0001
8 1.84 0.2595 Not significant
0
R2¼ 0.9901
Adjusted R2¼ 0.9848
Predicted R2¼ 0.9722
Adequate precision ¼ 45.9870

ARTICLE IN PRESS
Table 5ANOVA analysis for the weld-seam width model (before elimination).
Source Sum of squares df Mean squares f-value Prob4f
Model 3.980 14 0.280 50.4700 o0.0001 Significant
P 0.420 1 0.420 73.8100 o0.0001
S 1.660 1 1.660 295.2600 o0.0001
F 1.660 1 1.660 295.2600 o0.0001
C 0.011 1 0.011 2.0000 0.1778
PS 0.053 1 0.053 9.3800 0.0079
PF 0.018 1 0.018 3.2300 0.0923
PC 4.225E�003 1 4.225E�003 0.7500 0.4003
SF 0.068 1 0.068 11.9900 0.0035
SC 4.000E�004 1 4.000E�004 0.0710 0.7936
FC 6.250E�004 1 6.250E�004 0.1100 0.7438
P2 1.190E�004 1 1.190E�004 0.0210 0.8864
S2 9.219E�003 1 9.219E�003 1.6400 0.2204
F2 0.034 1 0.034 6.1000 0.0260
C2 0.028 1 0.028 5.0100 0.0408
Residual 0.085 15 5.637E�003
Lack-of-fit 0.048 10 4.822E�003 0.6600 0.7287 Not significant
Pure error 0.036 5 7.267E�003
Cor total 4.07 29
Standard deviation ¼ 0.075 R2¼ 0.9792
Mean ¼ 2.500 Adjusted R2¼ 0.9598
Coefficient of variation ¼ 3.000 Predicted R2¼ 0.9189
Predicted residual error of sum of squares (PRESS) ¼ 0.330 Adequate precision ¼ 25.9790
Table 6ANOVA analysis for the weld-seam width model (after backward elimination).
Source Sum of squares df Mean squares f-value Prob4f
Model 3.970 9 0.4400 89.05 o0.0001 Significant
P 0.420 1 0.4200 84.03 o0.0001
S 1.660 1 1.6600 336.12 o0.0001
F 1.660 1 1.6600 336.12 o0.0001
Ca 0.011 1 0.0110 2.28 0.1471
PS 0.053 1 0.0530 10.68 0.0038
PF 0.018 1 0.0180 3.68 0.0694
SF 0.068 1 0.0680 13.65 0.0014
F2 0.041 1 0.0410 8.28 0.0093
C2 0.025 1 0.0250 5.01 0.0367
Residual 0.099 1 4.951E�003
Lack-of-fit 0.063 20 4.180E�003 0.58 0.8135 Not significant
Pure error 0.036 15 7.267E�003
Cor total 4.070 29
Standard deviation ¼ 0.070 R2¼ 0.9757
Mean ¼ 2.500 Adjusted R2¼ 0.9645
Coefficient of variation ¼ 2.810 Predicted R2¼ 0.9500
Predicted residual error of sum of squares (PRESS) ¼ 0.200 Adequate precision ¼ 33.4760
a Hierarchical term added after backward elimination regression ¼ C.
B. Acherjee et al. / Optics & Laser Technology 41 (2009) 956–967 961
significant (p-value less than 0.05). The other adequacy measuresR2, adjusted R2 and predicted R2 are in reasonable agreement andare close to 1, which indicate adequate model. The value ofadequate precision ratio 33.476 indicates adequate modeldiscrimination. The lack-of-fit f-value of 0.58 implies that thelack-of-fit is not significant relative to the pure error.
The final mathematical models for weld-seam width, asdetermined by Design expert software are given as follows:
(a)
in terms of coded factorsweld-seam width ¼ 2:50þ 0:13P � 0:26Sþ 0:26F þ 0:022C � 0:057P S
� 0:034P F � 0:065S F þ 0:038F2� 0:030C2
(7)
in terms of actual factors
(b)weld-seam width ¼ � 4:54693þ 0:24889P þ 0:011306S
þ 0:073333F þ 0:068253C � 3:19444E� 004P S
� 2:81250E� 003P F � 2:70833E� 004S F
þ 2:37305E� 003F2� 3:28125E� 003C2 (8)
5.1.3. Validation of the developed models
To validate the developed response surface equations, derivedfrom multiple regression analysis, three confirmation experimentsare conducted with welding conditions chosen randomly withinthe ranges for which the equations are derived. The actual resultsare calculated as the average of three measured results for each

ARTICLE IN PRESS
Table 7Validation test results.
Experiment no. P (Watt) S (mm/min) F (mm) C (MPa) Lap-shear strength (N/mm) Weld-seam width (mm)
1 19 360 32 12.3 Actual 44.34 2.21
Predicted 47.23 2.36
|Error| % 6.51 6.79
2 22 300 32 9.3 Actual 48.83 2.90
Predicted 50.56 2.76
|Error| % 3.54 4.83
3 22 360 28 9.3 Actual 36.94 2.09
Predicted 40.39 2.27
|Error| % 9.34 8.61
14
25
36
47
58
14 25 36 47 58
1.8
2.2
2.6
3.0
3.4
1.8 2.2 2.6 3.0 3.4
Actual lap-shear strength, N/mm
Pred
icte
d la
p-sh
ear
stre
ngth
, N/m
m
Predicted vs. Actual
Actual weld-seam width, mm
Pred
icte
d w
eld-
seam
wid
th, m
m
Predicted vs. Actual
Fig. 5. Plot of actual vs. predicted response of (a) lap-shear strength results and (b)
weld-seam width results.
Design-Expert ® Software Lap-shear strength
Actual Factors P: Power = 22.00S: Welding speed = 360.00F: Stand-off distance = 32.00 C: Clamp pressure = 9.30
Perturbation
Deviation from Reference Point (Coded Units)
Lap
-she
ar s
tren
gth
N/m
m
-1.0 -0.5 0.0 0.5 1.0
14
25
36
47
58
P
S
F
C
Fig. 6. Perturbation plot showing the effect of all factors on the lap-shear strength.
B. Acherjee et al. / Optics & Laser Technology 41 (2009) 956–967962
response. The actual results, predicted values and calculatedpercentage error of confirmation experiments are furnished inTable 7. It is observed from the validation experiments that there
is a small percentage error between the estimated and theexperimental values, which indicate that the developed modelscan yield nearly accurate results. Fig. 5(a) and (b) are showing therelationship between the actual and predicted values of lap-shearstrength and weld-seam width, respectively. These figures alsoindicate that the developed models are adequate and predictedresults are in good agreement with measured data.
5.2. Effects of process parameters on the responses
5.2.1. Lap-shear strength
Fig. 6 is a perturbation plot, which illustrates the effect of allthe factors at the center point in the design space. It is apparentfrom this figure that the welding speed has a negative effect onthe lap-shear strength. This is because the energy deposition andheat diffusion into the material in laser transmission weldingdepends on the laser power density and the irradiation time, and ahigher welding speed lowers the irradiation time, causing low-heat input to the weld zone, leading to less volume of basematerial being melted. Consequently, the joint strength decreases.It can also be observed from this plot that the laser power and theclamp pressure both have a little positive effect on the lap-shearstrength. These effects could be attributed to the following
ARTICLE IN PRESS
19.00300.00
330.00
360.00
390.00
420.0038.45
41.35
44.24
47.14
50.04
51.87
6
19.00 20.50
22.00 23.50
25.00
300.00 330.00
360.00 390.00
420.00
35
39.5
44
48.5
53
Power, W
Wel
ding
spe
ed, m
m/m
in
Lap-shear strength, N/mm
Power, W Welding speed, mm/min
Lap
-she
ar s
tren
gth,
N/m
m
25.0023.5022.0020.50
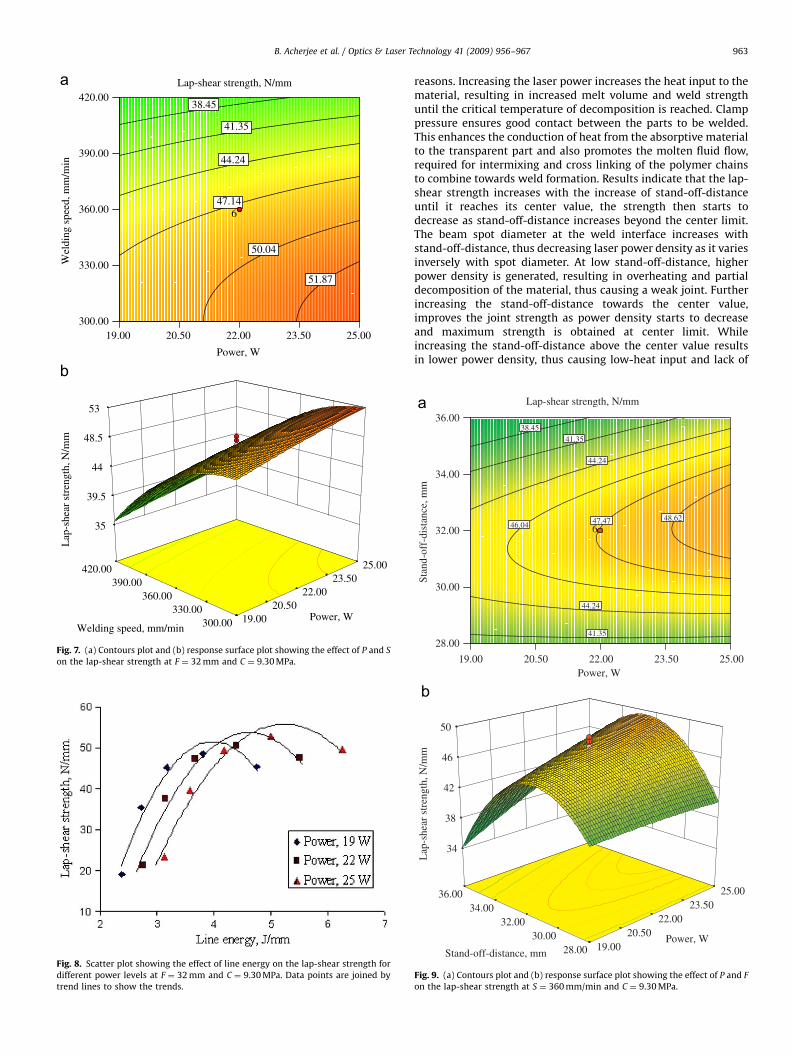
Fig. 7. (a) Contours plot and (b) response surface plot showing the effect of P and S
on the lap-shear strength at F ¼ 32 mm and C ¼ 9.30 MPa.
Fig. 8. Scatter plot showing the effect of line energy on the lap-shear strength for
different power levels at F ¼ 32 mm and C ¼ 9.30 MPa. Data points are joined by
trend lines to show the trends.
B. Acherjee et al. / Optics & Laser Technology 41 (2009) 956–967 963
reasons. Increasing the laser power increases the heat input to thematerial, resulting in increased melt volume and weld strengthuntil the critical temperature of decomposition is reached. Clamppressure ensures good contact between the parts to be welded.This enhances the conduction of heat from the absorptive materialto the transparent part and also promotes the molten fluid flow,required for intermixing and cross linking of the polymer chainsto combine towards weld formation. Results indicate that the lap-shear strength increases with the increase of stand-off-distanceuntil it reaches its center value, the strength then starts todecrease as stand-off-distance increases beyond the center limit.The beam spot diameter at the weld interface increases withstand-off-distance, thus decreasing laser power density as it variesinversely with spot diameter. At low stand-off-distance, higherpower density is generated, resulting in overheating and partialdecomposition of the material, thus causing a weak joint. Furtherincreasing the stand-off-distance towards the center value,improves the joint strength as power density starts to decreaseand maximum strength is obtained at center limit. Whileincreasing the stand-off-distance above the center value resultsin lower power density, thus causing low-heat input and lack of
19.00
28.00
30.00
32.00
34.00
36.0038.45
41.35
41.35
44.24
44.24
48.6246.04 47.47
6
19.00 20.50
22.00 23.50
25.00
28.00 30.00
32.00 34.00
36.00
34
38
42
46
50
Power, W
Stan
d-of
f-di
stan
ce, m
m
Lap-shear strength, N/mm
Power, W Stand-off-distance, mm
Lap
-she
ar s
tren
gth,
N/m
m
25.0023.5022.0020.50
Fig. 9. (a) Contours plot and (b) response surface plot showing the effect of P and F
on the lap-shear strength at S ¼ 360 mm/min and C ¼ 9.30 MPa.
ARTICLE IN PRESS
B. Acherjee et al. / Optics & Laser Technology 41 (2009) 956–967964
penetration, which decreases the joint strength. High-heat inputalso results in a wider HAZ, which may decrease the shearstrength of the joint. As the results indicate, it is notrecommended that very high or low power densities be used.
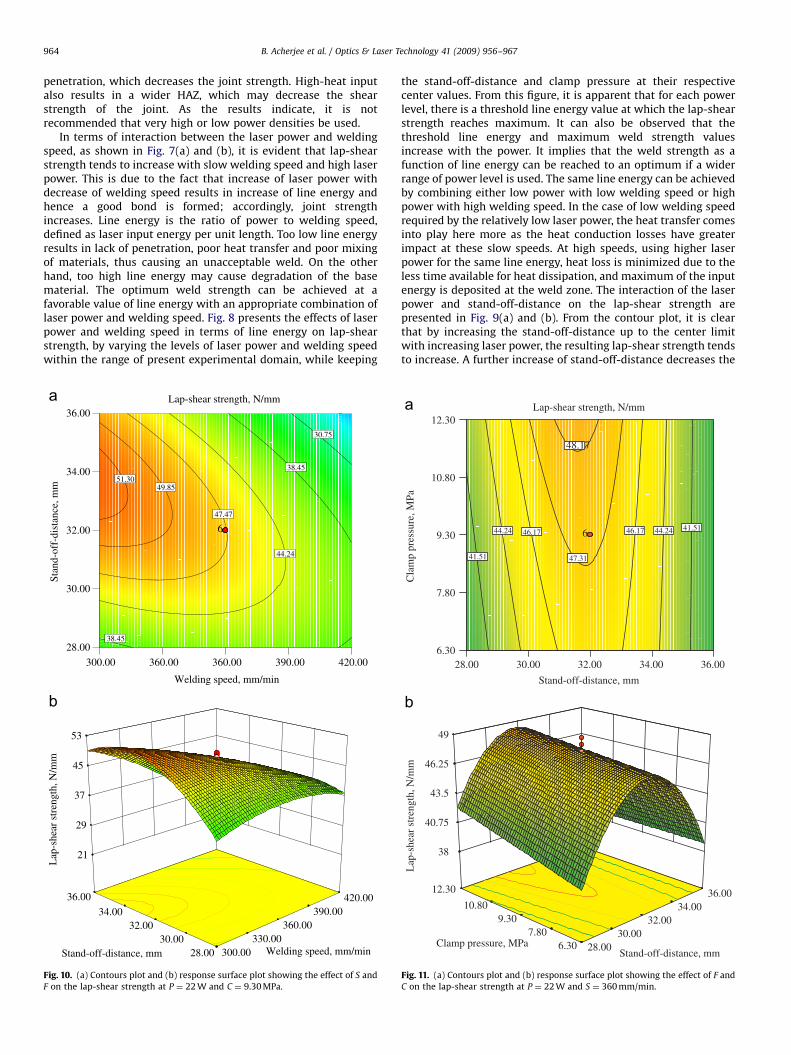
In terms of interaction between the laser power and weldingspeed, as shown in Fig. 7(a) and (b), it is evident that lap-shearstrength tends to increase with slow welding speed and high laserpower. This is due to the fact that increase of laser power withdecrease of welding speed results in increase of line energy andhence a good bond is formed; accordingly, joint strengthincreases. Line energy is the ratio of power to welding speed,defined as laser input energy per unit length. Too low line energyresults in lack of penetration, poor heat transfer and poor mixingof materials, thus causing an unacceptable weld. On the otherhand, too high line energy may cause degradation of the basematerial. The optimum weld strength can be achieved at afavorable value of line energy with an appropriate combination oflaser power and welding speed. Fig. 8 presents the effects of laserpower and welding speed in terms of line energy on lap-shearstrength, by varying the levels of laser power and welding speedwithin the range of present experimental domain, while keeping
300.00
28.00
30.00
32.00
34.00
36.00
38.45
38.45
44.24
47.47
30.75
51.3049.85
6
300.00 330.00
360.00 390.00
420.00
28.00 30.00
32.00 34.00
36.00
21
29
37
45
53
Welding speed, mm/min
Stan
d-of
f-di
stan
ce, m
m
Lap-shear strength, N/mm
Welding speed, mm/min Stand-off-distance, mm
Lap
-she
ar s
tren
gth,
N/m
m
420.00390.00360.00360.00
Fig. 10. (a) Contours plot and (b) response surface plot showing the effect of S and
F on the lap-shear strength at P ¼ 22 W and C ¼ 9.30 MPa.
the stand-off-distance and clamp pressure at their respectivecenter values. From this figure, it is apparent that for each powerlevel, there is a threshold line energy value at which the lap-shearstrength reaches maximum. It can also be observed that thethreshold line energy and maximum weld strength valuesincrease with the power. It implies that the weld strength as afunction of line energy can be reached to an optimum if a widerrange of power level is used. The same line energy can be achievedby combining either low power with low welding speed or highpower with high welding speed. In the case of low welding speedrequired by the relatively low laser power, the heat transfer comesinto play here more as the heat conduction losses have greaterimpact at these slow speeds. At high speeds, using higher laserpower for the same line energy, heat loss is minimized due to theless time available for heat dissipation, and maximum of the inputenergy is deposited at the weld zone. The interaction of the laserpower and stand-off-distance on the lap-shear strength arepresented in Fig. 9(a) and (b). From the contour plot, it is clearthat by increasing the stand-off-distance up to the center limitwith increasing laser power, the resulting lap-shear strength tendsto increase. A further increase of stand-off-distance decreases the
28.006.30
7.80
9.30
10.80
12.30
44.24 44.2446.17 46.17
41.51
41.51
47.31
48.17
6
28.00 30.00
32.00 34.00
36.00
6.30 7.80
9.30 10.80
12.30
38
40.75
43.5
46.25
49
Stand-off-distance, mm
Cla
mp
pres
sure
, MPa
Lap-shear strength, N/mm
Stand-off-distance, mm Clamp pressure, MPa
Lap
-she
ar s
tren
gth,
N/m
m
36.0034.0032.0030.00
Fig. 11. (a) Contours plot and (b) response surface plot showing the effect of F and
C on the lap-shear strength at P ¼ 22 W and S ¼ 360 mm/min.

ARTICLE IN PRESS
300.00
330.00
360.00
390.00
420.00
2.29
2.42
2.55
2.69
2.82
6
Wel
ding
spe
ed, m
m/m
in
Weld-seam width, mm
B. Acherjee et al. / Optics & Laser Technology 41 (2009) 956–967 965
joint strength. The lap-shear strength is restricted at very highpower density, which causes material decomposition and a verylow power density results in lack of fusion. Fig. 10(a) and (b)shows the interaction of welding speed and stand-off-distance onthe lap-shear strength. It is evident from these figures thatincreasing the welding speed at lower stand-off-distanceincreases the joint strength, while at higher stand-off-distanceincreasing the welding speed causes reduction in joint strength.This suggests that a decrease in stand-off-distance canaccommodate an increase in welding speed to maintainadequate joint strength. Fig. 11(a) and (b) represent theinteraction of stand-off-distance and clamp pressure on the lap-shear strength. In relation to interaction of these two processparameters, the results indicate that increasing stand-off-distanceup to the center value with increasing clamp pressure increasesthe lap-shear strength. Further increase of stand-off-distancedecreases the lap-shear strength, while the clamp pressure doesnot show such a significant effect.
5.3. Weld-seam width
Fig. 12 shows a perturbation plot to compare the effect of allthe process parameters at the center point in the design space.From this figure, it can be noticed that the weld-seam widthincreases with laser power. This is due to the fact that greatervolume of base material is melted with increased laser power, andconsequently the width of the weld zone increases. The resultshows that the welding speed has a negative effect on weld-seamwidth as the seam width decreases at a higher welding speed. Thisis due to the fact that with increase welding speed, the irradiationtime reduces and less heat is delivered with consequent reductionin volume of the molten material characterized by a narrow andweak weld. It can be observed from this plot that the weld-seamwidth varies positively with the stand-off-distance. Increasingstand-off-distance increases the beam spot size at weld interface,which results in spreading the laser energy onto a wide area.Therefore, the base material of the wide zone being meltedleading to an increase in weld-seam width. The clamp pressurecontributes a slightly positive but statistically insignificant effecton the weld-seam width. This is due to the widest molten areaachieved which is well below the width of overlap of the plaques
Design-Expert® Software Weld-seam width
Actual Factors P: Power = 22.00 S: Welding speed = 360.00 F: Stand off distance = 32.00 C: Clamp pressure = 9.30
Perturbation
Deviation from Reference Point (Coded Units)
Wel
d-se
am w
idth
, mm
-1.0 -0.5 0.0 0.5 1.0
1.8
2.2
2.6
3.0
3.4
P
S
F
C
Fig. 12. Perturbation plot showing the effect of all factors on the weld-seam width.
during this study. As most of the overlapped area is not affected byheat, that zone resists the applied pressure, which minimizes theeffect of this parameter. The clamp pressure ensures good contactconduction between overlapped materials, allowing more andmore heat to reach the natural material and leaving less heat toflow in the absorptive material.
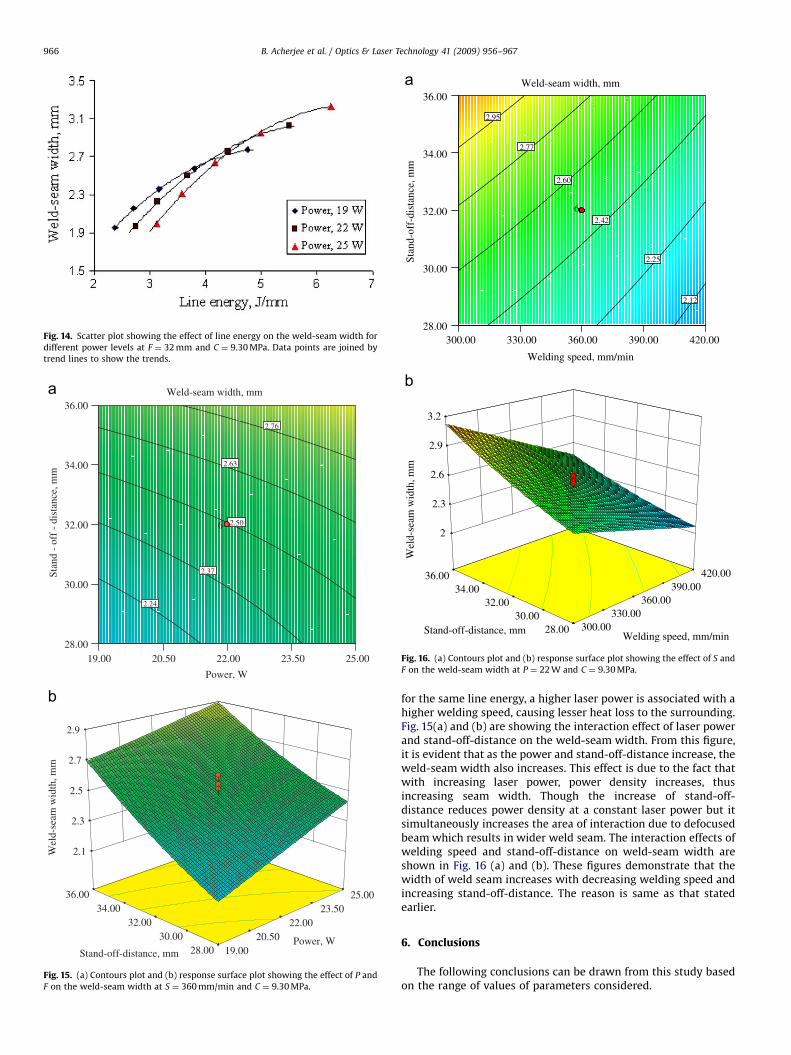
This is clear from the Fig. 13(a) and (b) that the interaction ofhigher laser power with lower welding speed results in greaterweld width. This is because the line energy is directly proportionalto the laser power and inversely varies with the welding speed.The increased line energy maximizes the heat input to the weldzone leading to high volume of material being melted, resulting ina wider seam. The effects of laser power and welding speed interms of line energy on weld-seam width is presented in Fig. 14,by varying the levels of laser power and welding speed within therange considered in the present work, while keeping the stand-off-distance and clamp pressure at their respective center values.The figure shows that at higher line energy, the weld width tendsto attain a maximum. Further increase of line energy does notincrease the weld width. It is also evident that the threshold valueof weld-seam width increases with laser power. This is so because
19.00
19.00 20.50
22.00 23.50
25.00
300.00 330.00
360.00 390.00
420.00
2.15
2.35
2.55
2.75
2.95
Power, W
Welding speed, mm/min
Wel
d-se
am w
idth
, mm
Power, W
25.0023.5022.0020.50
Fig. 13. (a) Contours plot and (b) response surface plot showing the effect of P and
S on the weld-seam width at F ¼ 32 mm and C ¼ 9.30 MPa.
ARTICLE IN PRESS
Fig. 14. Scatter plot showing the effect of line energy on the weld-seam width for
different power levels at F ¼ 32 mm and C ¼ 9.30 MPa. Data points are joined by
trend lines to show the trends.
19.0028.00
30.00
32.00
34.00
36.00
2.24
2.37
2.50
2.63
2.76
6
19.00 20.50
22.00 23.50
25.00
28.00 30.00
32.00 34.00
36.00
2.1
2.3
2.5
2.7
2.9
Power, W
Stan
d -
off
- di
stan
ce, m
m
Weld-seam width, mm
Power, W Stand-off-distance, mm
Wel
d-se
am w
idth
, mm
25.0023.5022.0020.50
Fig. 15. (a) Contours plot and (b) response surface plot showing the effect of P and
F on the weld-seam width at S ¼ 360 mm/min and C ¼ 9.30 MPa.
300.0028.00
30.00
32.00
34.00
36.00
2.25
2.42
2.60
2.77
2.95
2.12
6
300.00 330.00
360.00 390.00
420.00
28.00 30.00
32.00 34.00
36.00
2
2.3
2.6
2.9
3.2
Welding speed, mm/min
Stan
d-of
f-di
stan
ce, m
m
Weld-seam width, mm
Welding speed, mm/min Stand-off-distance, mm
Wel
d-se
am w
idth
, mm
420.00390.00360.00330.00
Fig. 16. (a) Contours plot and (b) response surface plot showing the effect of S and
F on the weld-seam width at P ¼ 22 W and C ¼ 9.30 MPa.
B. Acherjee et al. / Optics & Laser Technology 41 (2009) 956–967966
for the same line energy, a higher laser power is associated with ahigher welding speed, causing lesser heat loss to the surrounding.Fig. 15(a) and (b) are showing the interaction effect of laser powerand stand-off-distance on the weld-seam width. From this figure,it is evident that as the power and stand-off-distance increase, theweld-seam width also increases. This effect is due to the fact thatwith increasing laser power, power density increases, thusincreasing seam width. Though the increase of stand-off-distance reduces power density at a constant laser power but itsimultaneously increases the area of interaction due to defocusedbeam which results in wider weld seam. The interaction effects ofwelding speed and stand-off-distance on weld-seam width areshown in Fig. 16 (a) and (b). These figures demonstrate that thewidth of weld seam increases with decreasing welding speed andincreasing stand-off-distance. The reason is same as that statedearlier.
6. Conclusions
The following conclusions can be drawn from this study basedon the range of values of parameters considered.

ARTICLE IN PRESS
B. Acherjee et al. / Optics & Laser Technology 41 (2009) 956–967 967
1.
Increasing laser power increases the lap-shear strength and theweld-seam width; whereas, increasing welding speed de-creases both the responses.2.
For each power level, there is a threshold line energy value, atwhich the lap-shear strength reaches maximum. The optimumweld strength can be achieved at a favorable value of lineenergy with an appropriate combination of laser power andwelding speed.3.
The weld-seam width increases with line energy until it attainsa maximum limit.4.
In the case of stand-off-distance, the lap-shear strengthincreases with the stand-off-distance until it reaches its centervalue, the strength then starts to drop as stand-off-distance isincreased above the center limit.5.
The weld-seam width increases as the stand-off-distanceincreases.6.
Clamp pressure has slight positive effect on the lap-shearstrength.7.
Clamp pressure contributes positively with statistically insig-nificant effect on the weld-seam width.8.
It can be observed from the ANOVA tables that the weldingspeed has a stronger effect on lap-shear strength. In contrast,welding speed and stand-off-distance both have strongereffects on weld-seam width. These parameters should beselected carefully, because the responses are very sensitive tothese process parameters.9.
It is observed from the validation experiments that theestimated results are in good agreement with the measureddata, which indicate that the developed model can predict theresponses adequately within the limits of welding parametersbeing used.References
[1] Jansson A, Kouvo S, Salminen A, Kujanpaa V. The effect of parameters on lasertransmission welding of polymers. In: Proceedings of the 22nd internationalCongress on applications of lasers & electro-optics, Jacksonville, Florida, USA,vol. 95, 2003. LMP Sec-A, p. 124–33.
[2] Bachmann FG, Russek UA. Laser welding of polymers using high powerdiode lasers. In: Proceedings of photonics West conference, San Jose, CA, USA,2002.
[3] Kagan VA, Bray RG, Kuhn WP. Laser transmission welding of semi-crystallinethermoplastics: part I: Optical characterization of nylon based plastics. J ReinfPlast Compos 2002;21(12):1101–22.
[4] Coelho JMP, Abreu MA, Pires MC. High-speed laser welding of plastic films.Opt Laser Eng 2000;34:385–95.
[5] Van de Ven JD, Erdman AG. Laser transmission welding of thermoplastic-s—part I: temperature and pressure modeling. J Manuf Sci Eng 2007;129:849–58.
[6] Jansson A, Kouvo S, Kujanpaa V. Preliminary investigations of laser welding ofplastics in massproduction. In: Proceedings of the 23rd internationalCongress on applications of lasers and electro-optics, San Francisco,California, USA, vol.97, 2004.
[7] Kagan VA, Pinho GP. Laser transmission welding of semicrystalline thermo-plastics–part II: Analysis of mechanical performance of welded nylon. J ReinfPlast Compos 2004;23(1):95–107.
[8] Kagan VA, Bray R, Chambers A. Forward to better understanding of opticalcharacterization and development of colored polyamides for the infra-red/laser welding: part I–Efficiency of polyamides for infra-red welding. J ReinfPlast Compos 2003;22(6):533–47.
[9] Kagan VA, Chambers A, Bray R. Forward to better understanding of opticalcharacterization and development of colored polyamides for the infra-red/laser welding, part II–Family of colored polyamides. J Reinf Plast Compos2003;22(7):593–603.
[10] Grewell D, Rooney P, Kagan VA. Relationship between optical properties andoptimized processing parameters for through-transmission laser welding ofthermoplastics. J Reinf Plast Compos 2004;23(3):239–47.
[11] Abed S, Laurens P, Carretero C, Deschamps JR, Duval C. Diode laser welding ofpolymers: microstructures of the welded zones for polypropylene. In:Proceedings of the 20th international Congress on applications of lasers &electro-optics, Jacksonville, Florida, USA, 2001.
[12] Prabhakaran R, Kontopoulou M, Zak G, Bates PJ, Baylis BK. Contourlaser—Laser-transmission welding of glass reinforced nylon 6. J ThermoplastCompos Mater 2006;19:427–39.
[13] Baylis B. Welding thermoplastic elastomers to polypropylene witha diode laser. In: Proceedings of the 21st international Congresson applications of lasers & electro-optics, Scottsdale, Arizona, USA, vol. 94,2002.
[14] Russek UA, Staub H, Palmen A, Kind H. Simultaneous laser beam welding ofthermoplastics—innovations and challenges. In: Proceedings of the 22ndinternational Congress on applications of lasers & electro-optics, Jacksonville,Florida, USA, vol. 95, 2003. LMP Sec-A, p. 99–107.
[15] Douglass DM, Wu CY. Laser welding of polyolefin elastomers to thermoplasticpolyolefin. In: Proceedings of the 22nd international Congress on applicationsof lasers & electro-optics, Jacksonville, Florida, USA, vol.95, 2003. LMP Sec-A,p. 118–23.
[16] Montgomery DC. Design and analysis of experiments. 5th Edition. New York:Wiley; 2001.