Automated time-lapse microscopy and high-resolution tracking of cell migration
13
Abstract We describe a novel fully automated high-throughput time-lapse microscopy system and evaluate its performance for precisely track- ing the motility of several glioma and osteoblastic cell lines. Use of this system revealed cell motility behavior not discernable with conventional tech- niques by collecting data (1) from closely spaced time points (minutes), (2) over long periods (hours to days), (3) from multiple areas of inter- est, (4) in parallel under several different exper- imental conditions. Quantitation of true individual and average cell velocity and path length was obtained with high spatial and tem- poral resolution in ‘‘scratch’’ or ‘‘wound healing’’ assays. This revealed unique motility dynamics of drug-treated and adhesion molecule-transfected cells and, thus, this is a considerable improvement over current methods of measurement and anal- ysis. Several fluorescent vital labeling methods commonly used for end-point analyses (GFP expression, DiO lipophilic dye, and Qtracker nanocrystals) were found to be useful for time- lapse studies under specific conditions that are described. To illustrate one application, fluores- cently labeled tumor cells were seeded onto cell monolayers expressing ectopic adhesion mole- cules, and this resulted in consistently reduced tumor cell migration velocities. These highly quantitative time-lapse analysis methods will promote the creation of new cell motility assays and increase the resolution and accuracy of existing assays. Keywords Cell migration Green fluorescent protein Scratch assay Time-lapse Tumor cell lines Vital fluorescent labeling Introduction Analysis of cell migratory behavior in vitro in response to chemical agents, genetic manipula- tions, or molecule-coated surfaces is used to dissect mechanisms that occur during develop- ment, normal physiological responses, or abnor- mal pathological conditions (Gavert et al. 2005; Petridis et al. 2004; Nishio et al. 2005; Yoshida Joseph S. Fotos and Vivek P. Patel contributed equally to this work J. S. Fotos V. P. Patel N. J. Karin M. K. Temburni D. S. Galileo (&) Department of Biological Sciences, University of Delaware, Wolf Hall, Newark, DE 19716, USA e-mail: [email protected] J. T. Koh M. K. Temburni Chemistry and Biochemistry, University of Delaware, Newark, DE 19716, USA N. J. Karin Pacific Northwest National Laboratory, 902 Battelle Blvd., Richland, WA 99352, USA Cytotechnology (2006) 51:7–19 DOI 10.1007/s10616-006-9006-7 123 ORIGINAL PAPER Automated time-lapse microscopy and high-resolution tracking of cell migration Joseph S. Fotos Vivek P. Patel Norman J. Karin Murali K. Temburni John T. Koh Deni S. Galileo Received: 18 January 2006 / Accepted: 3 April 2006 / Published online: 8 August 2006 ȑ Springer Science+Business Media B.V. 2006
-
Upload
independent -
Category
Documents
-
view
0 -
download
0
Transcript of Automated time-lapse microscopy and high-resolution tracking of cell migration
Abstract We describe a novel fully automated
high-throughput time-lapse microscopy system
and evaluate its performance for precisely track-
ing the motility of several glioma and osteoblastic
cell lines. Use of this system revealed cell motility
behavior not discernable with conventional tech-
niques by collecting data (1) from closely spaced
time points (minutes), (2) over long periods
(hours to days), (3) from multiple areas of inter-
est, (4) in parallel under several different exper-
imental conditions. Quantitation of true
individual and average cell velocity and path
length was obtained with high spatial and tem-
poral resolution in ‘‘scratch’’ or ‘‘wound healing’’
assays. This revealed unique motility dynamics of
drug-treated and adhesion molecule-transfected
cells and, thus, this is a considerable improvement
over current methods of measurement and anal-
ysis. Several fluorescent vital labeling methods
commonly used for end-point analyses (GFP
expression, DiO lipophilic dye, and Qtracker
nanocrystals) were found to be useful for time-
lapse studies under specific conditions that are
described. To illustrate one application, fluores-
cently labeled tumor cells were seeded onto cell
monolayers expressing ectopic adhesion mole-
cules, and this resulted in consistently reduced
tumor cell migration velocities. These highly
quantitative time-lapse analysis methods will
promote the creation of new cell motility assays
and increase the resolution and accuracy of
existing assays.
Keywords Cell migration Æ Green fluorescent
protein Æ Scratch assay Æ Time-lapse Æ Tumor cell
lines Æ Vital fluorescent labeling
Introduction
Analysis of cell migratory behavior in vitro in
response to chemical agents, genetic manipula-
tions, or molecule-coated surfaces is used to
dissect mechanisms that occur during develop-
ment, normal physiological responses, or abnor-
mal pathological conditions (Gavert et al. 2005;
Petridis et al. 2004; Nishio et al. 2005; Yoshida
Joseph S. Fotos and Vivek P. Patel contributed equally tothis work
J. S. Fotos Æ V. P. Patel Æ N. J. Karin ÆM. K. Temburni Æ D. S. Galileo (&)Department of Biological Sciences, University ofDelaware, Wolf Hall, Newark, DE 19716, USAe-mail: [email protected]
J. T. Koh Æ M. K. TemburniChemistry and Biochemistry, University of Delaware,Newark, DE 19716, USA
N. J. KarinPacific Northwest National Laboratory, 902 BattelleBlvd., Richland, WA 99352, USA
Cytotechnology (2006) 51:7–19
DOI 10.1007/s10616-006-9006-7
123
ORIGINAL PAPER
Automated time-lapse microscopy and high-resolutiontracking of cell migration
Joseph S. Fotos Æ Vivek P. Patel ÆNorman J. Karin Æ Murali K. Temburni ÆJohn T. Koh Æ Deni S. Galileo
Received: 18 January 2006 / Accepted: 3 April 2006 / Published online: 8 August 2006� Springer Science+Business Media B.V. 2006

et al. 2004; Zhang et al. 2005; Herren et al. 2001;
Lee et al. 2004; Maschler et al. 2005; Zhu et al.
2004; Moyano et al. 2003). Many analyses, how-
ever, lack ability to analyze individual cells, pre-
cision of measurements, or temporal resolution.
Sometimes, analyses are limited to single distance
measurements of a cell ‘‘front’’ at the end point of
an experiment. Automated systems often require
specific chambers or dishes that limit the types of
experiments that can be done. Thus, most ques-
tions that are addressed in current cell motility
studies are constrained by technical limitations.
One simple and widely used cell migration as-
say that can be done without complicated instru-
mentation is the ‘‘scratch’’ or ‘‘wound healing’’
assay (Endo et al. 2005; Motegi et al. 2003; Pratt
et al. 2005; Wadham et al. 2003; Besson et al.
2004). For this, an instrument such as a pipettor tip
is used to scrape a linear interruption in a con-
fluent or subconfluent cell monolayer, after which
cells at the edge migrate into the denuded area.
Measurements from micrographs are made either
of linear distances between the scratch edges or of
cell densities into the denuded areas at a single or
a few time points after scratching. These are be-
lieved to provide a reasonable measurement of the
average migration of the cells under study, and
have shown differences under experimental
treatments. Differences in measurements are used
to make conclusions about the effects of experi-
mental manipulations on cell migration distances
and rates. Sometimes, however, measurements are
not taken, and conclusions are based on qualita-
tive inspection of the scratched area.
Here, we describe a highly quantitative ap-
proach to measurements of the scratch assay and
random cell motility under different experimental
treatments using automated time-lapse micros-
copy. In each case, a small population of indi-
vidual cells was tracked through closely spaced
time intervals over approximately 20 h using
commercial tracking software designed for sub-
cellular objects. This allowed accurate average
distances and velocities to be calculated and
plotted with high resolution. Conventional dis-
tance measurements in the scratch assay were
found to be substantial over-estimates compared
to averages for tracked cell populations. Treat-
ments sometimes resulted in changes of migration
velocity during the experiment that would have
been overlooked by conventional approaches. We
also evaluated different methods of vital fluores-
cent labeling and applied this to tracking tumor
cells on cell monolayers, and were successful in
this by demonstrating the effect on motility of a
single cell surface adhesion molecule. Details are
provided to construct and utilize this versatile
custom time-lapse microscopy and analysis sys-
tem and for its application to several types of cell
motility experiments.
Materials and methods
Time-lapse microscopy
Cells were prepared for time-lapse microscopy in
three ways. For scratch assays, 9L rat gliosarcoma,
U-87 human glioma, or MC3T3-E1 murine osteo-
blastic cells were grown to confluence in 35 mm
plastic tissue culture dishes. Confluent monolayers
were ‘‘wounded’’ in serum-free media by intro-
ducing scratches with a sterile 1 ml or 200 ll
pipettor tip. Any treatments were then applied to
wounded monolayers. Fluorescent vital labeled C6
glioma cells were plated at low density either on
35 mm culture dishes with a glass coverslip bottom
insert (MatTek Corporation), or onto confluent
NIH 3T3 cells pre-plated onto these dishes. Some
experiments involved 3T3 cells that were stably
transfected with an expression plasmid encoding
the NgCAM/L1 adhesion molecule (kindly pro-
vided by Dr. Marty Grumet).
Cultures were placed into a custom culture
chamber mounted on a ProScan II automated
stage (Prior Scientific) on a Nikon TE-2000E
microscope (Fig. 1). Temperature was maintained
at 37�C by a combination of a warm air temper-
ature controller (Air Therm; World Precision
Instruments) and thermoelectric warming with an
optical temperature-controlled stage insert
(Thermo Plate; Tokai Hit, Japan). The atmo-
sphere within the chamber was kept at 5% CO2/
95% air using a gas injection controller (Forma
Scientific). A Photometrics CoolSnap ES CCD
camera (Roper Scientific, Inc.) was used to cap-
ture images over the course of the experiment.
The system was controlled using MetaMorph
8 Cytotechnology (2006) 51:7–19
123

Premier Software (Molecular Devices Corpora-
tion), and images were collected using a Nikon
CFI Plan Fluor ELWD DM 20· C Ph1 (correc-
tion collar 0–2 mm; 0.45 NA) objective lens at
areas of interest on each plate at 5 min intervals
for approximately 20 h. Illumination for phase
contrast images contained a green filter inline.
Fluorescent illumination was with a standard
100 watt mercury vapor lamp with an ND4, ND8,
or no neutral density filter inline. Fluorescence
exposure times ranged from 500 ms to 1,000 ms.
Experiments usually consisted of collecting ima-
ges from several areas of interest in each dish
from three or four dishes to result in a total of
several thousand images per experiment. Images
from each location were separated into their own
image stacks and converted into an avi movie at a
speed of 15 frames per second for viewing, which
corresponded to a time compression of approxi-
mately 1 h of experiment into 1 s of video.
Fig. 1 Custom time-lapse microscopy apparatus compo-nents. This system is based on a standard automatedinverted microscope with phase contrast and epifluores-cence illumination. Phase contrast optics were chosen overother types because nuclei and fine cellular details can beseen clearly, and they are compatible with plastic tissueculture dishes and glass coverslips. Objectives (20· and40·) contain correction collars so that they can be adjustedto compensate for the thickness of the dish or slide. The12-bit cooled monochrome CCD camera is suitable forboth phase contrast and fluorescence. The automated stagecontains an optical sensor to improve accuracy of travel.(a) Time-lapse microscopy system. (1) Fully-automatedNikon TE-2000E with epifluorescence and external con-troller, (2) Prior ProScan II flat-top automated stage, stagecontroller, and joystick, (3) incubator chamber, (4) WPItemperature controller, (5) Photometrics CoolSNAP ESCCD camera, (6) Tokai Hit stage insert warmer controller,(7) custom 3 GHz computer with 2 gigabytes of RAM, 2hard drives, dual monitors, and MetaMorph Premiersoftware, (8) uninterruptible power supply capable ofrunning entire system, (9) external USB backup harddrive, (10) CO2 sensor for CO2 injection system that is outof view. The stage contained a custom thermal platewarmer insert instead of a standard open slide or plateholder. The insert consisted of approximately coverslip-thick glass heated to a set temperature (37�C) bythermoelectric warming. This resulted in a transparentstage surface large enough for a multiwell tissue cultureplate or any configuration of smaller plates, yet maintaineda constant temperature at the sample surface. A smallincubator chamber box could, thus, be designed to sit atopthe stage and could be disconnected and removed easily,
rather than awkwardly enclosing the whole microscopelike some commercial systems. Warmed air was circulatedthrough the chamber by large diameter hoses connected tothe air warmer using plastic plumbing fittings and adapters.The remote temperature sensor was placed in the airoutflow hose. CO2 was injected into the chamber using anexternal CO2 injector controller of which the sensor‘‘block’’ was removed from its case and placed inline withthe air flow of the chamber. The correct CO2 injectionpressure was empirically determined so that when theinjector was set to 4% CO2, the short burst of CO2 resultedin a transient rise in the chamber to 6%. Thus, the CO2
levels in the chamber fluctuated between 4% and 6%,averaging to the desired 5% CO2 level. This was furtherconfirmed by the correct orange-red color of the phenolred indicator dye in the culture media of samples in thechamber. Our development and testing of this customincubator chamber configuration ultimately resulted in onethat is more convenient, much more versatile, and several-fold less costly than current commercial configurations. Italso allows direct parallel comparison between differentdesired experimental treatments while maintaining desiredconstant environmental conditions. MetaMorph softwarecontrolled the automated functions of the microscope andacquisition of images well. (b) Custom incubator chamber.(1) Prior automated stage, (2) clear plastic stage-topincubator chamber, (3) rear hinges securing glass incubatorlid to plastic chamber, (4) plastic fittings for warmed airinflow (left) and outflow (right) of chamber, (5) lead forthermal sensor inserted into warm air outflow fitting, (6)tubing for CO2 injection into air inflow side of chamber,(7) clear glass plate warmer stage insert
Cytotechnology (2006) 51:7–19 9
123

Cell motility measurements
Motility of cells was measured after collection of
sequential time-lapse images. Analyses were
performed on sequential phase contrast images
with MetaMorph software manually using the
‘‘Track Points’’ feature with individual nucleoli
serving as imaging targets. This proved to be an
easily identifiable and stable intracellular marker.
The automatic ‘‘Track Objects’’ feature was used
for fluorescent images with the search box
surrounding the entire cell in some cases or
fluorescent intracellular puncta in other cases.
Automatic tracking with the Track Objects
feature was not possible with phase contrast
images in scratch assays because cell boundaries
did not retain distinct contrast. Tracking by both
manual Track Points or automatic Track Objects
methods resulted directly in tabulation of data in
a MetaMorph file of multiple motility parameters
including object coordinates, distance traveled
from last timepoint, velocity from last coordinate,
absolute angle, and distance to origin in a straight
line. Tabulated data were exported into Microsoft
Excel, graphed, and evaluated statistically using
Student’s two-tailed t-test. DeltaGraph 5.6 (Red
Rock Software) was also used for some analyses.
The conversion factor for measured pixels to
microns (0.46 for 20· objective) was determined
by tracking using a Nikon stage micrometer.
Vital fluorescent labeling
QtrackerTM cell labeling was accomplished by
following the manufacturer’s directions using the
Qtracker� 565 Cell Labeling Kit (Quantum Dot
Corp.). Cells were incubated in Qtracker label
mixture for 1 h in suspension at 37�C. Cells were
plated on uncoated 35 mm MakTek coverslip-
bottomed dishes, placed in the incubator over-
night, and experiments were started the next day.
Qtracker labeled cells contained extremely bright
intracellular fluorescent puncta that were
compatible with the MetaMorph automatic
tracking feature. The filter cube used for evalua-
tion of Qtracker contained a 505 nm dichroic
mirror, a 510 nm long-pass emission filter,
but contained interchanged excitation bandpass
filters of differing wavelengths (400–500 nm,
420–500 nm, and 450–500 nm; Chroma Technology
Corporation).
DiO cell membrane labeling was accom-
plished by incubating trypsinized C6 cells in a
solution of 100 lg/ml DiO (3,3¢-dioctadecyloxa-
carbocyanine perchlorate; Molecular Probes/In-
vitrogen) in normal culture medium (DMEM
with 10% serum) similarly to that in Galileo
et al. (1991). Cells were incubated for 1 h at
37�C, rinsed, and plated in 35 mm MatTek
dishes. Cells were allowed to adhere overnight,
during which time this membrane label was
internalized and was visible as intracellular
puncta. The filter cube used for DiO experi-
ments was the Nikon EN GFP HQ BP cube with
a 450–490 nm excitation filter, 495 nm dichroic
mirror, and a 500–550 nm emission filter.
Green fluorescent protein (GFP) labeling was
accomplished by using a recombinant lentiviral
vector that encoded GFP and puromycin resis-
tance (kindly provided by Dr. John Kappes, Univ.
of Alabama). C6 cells were transduced with the
GFP vector and selected to homogeneity using
puromycin. C6/GFP cells were plated on the
MatTek dishes as described above. The filter cube
used for GFP experiments visualization was the
same as for DiO.
Cell TrackerTM Green labeling was accom-
plished by Cell Tracker Green CMFDA (5-chlo-
romethylfluorescein diacetate; Molecular Probes/
Invitrogen) according to the manufacturer’s
directions. This molecule readily crosses the
plasma membrane of intact cells and is retained
intracellularly after reacting with cytoplasmic
thiols. Cells were labeled in suspension with 5 lM
reagent for 45 min at 37�C, rinsed, plated on
MatTek dishes, and used the following day for
experiments. The filter cube used for Cell Tracker
Green experiment visualization was the same as
for DiO and GFP.
Results
High-resolution time-lapse microscopy
The significance of observing and quantitating
cell movements at closely spaced time intervals
can be seen in Fig. 2. As a population of indi-
10 Cytotechnology (2006) 51:7–19
123

vidually tracked U-87 cells migrates, their aver-
aged velocity varies substantially at any particular
timepoint (Fig. 2a, blue graph). A curve of best fit
can approximate the overall average velocity of
the migrating cells if the migration rate is fairly
constant, as is the case here. However, neither the
best fit curve nor the single overall velocity value
(Fig. 2b) accurately represents the range of tran-
sient velocities at which cells can move. Even
averaged velocities of a small population of cells
can vary five-fold over average values at specific
timepoints. Rare peak values of migration veloc-
ity (max. and min.) are obscured by overall
averaged values, but may be an important com-
ponent of the cell behavior of interest.
The custom time-lapse microscopy system we
designed and assembled has resulted in collection
of parallel time-lapse images under a wide variety
of conditions. When tested for its ability to return
to a single programmed coordinate, the stage re-
turned to an average of 0.065 – 0.002 lm (SEM)
with a range of 0.001–0.178 lm (Fig. 2c). When
velocity errors due to the stage movement inac-
curacy were plotted with velocities of migrating
cells (Fig. 2a, red graph), they were a constant but
minor component of measured velocities. Overall
average velocity error due to stage inaccuracy was
calculated to be 0.020 – 0.001 lm/min (SEM),
which is small compared to the migrating cells
(0.341 – 0.016 lm/min SEM; Fig. 2b). These er-
rors in stage movement are mostly imperceptible
in time-lapse movies and, thus, the high-through-
put advantage of the automated stage outweighs
the disadvantage of the negligible inaccuracy.
A novel approach was taken for the cell incu-
bator chamber that was used for time-lapse
studies and it is described in Fig. 1. This design
allowed cells to be analyzed in a variety of tissue
culture dishes and plates, including 35 mm,
60 mm, 10 cm, multiwell plates, chamber slides,
and small T-flasks. This makes our design much
more versatile than currently available commer-
cial systems. We initially found that vibrations
generated by the motors in the automated stage
would cause the dishes to move slightly on the
Tokai Hit insert over the course of the experi-
ment. This was easily remedied by brushing a thin
coat of rubber cement along the bottom edge of
the dish and allowing it to dry before plating cells.
This created a non-skid surface that prevented
dish movement.
The super scratch assay
A successful application of our time-lapse
microscopy and quantitation of motility has been
to the conventional ‘‘scratch’’ or ‘‘wound heal-
ing’’ assay. This simple semi-quantitative assay
Fig. 2 High-resolution time-lapse microscopy. (a) Aver-age velocity of a population of U-87 glioma cells treatedwith a stimulating antibody in a scratch assay experiment,plotted with stage accuracy data from (c) as velocity with5 min time intervals. Shown is the 3rd-order polynomialcurve of best fit for U-87 cell velocity. (b) Overall averageof all U-87 cell and stage accuracy velocities. (c) Theautomated stage was programmed to travel to several
distinct coordinates several centimeters apart. Sequentialimages were collected every 5 min for 23 h and at onecoordinate a stationary mark on the tissue culture dish wastracked with the MetaMorph Track Object feature toevaluate the stage’s ability to return to the exactprogrammed coordinate (graph origin). Plotted are 276tracked points. Bars shown are SEM
Cytotechnology (2006) 51:7–19 11
123
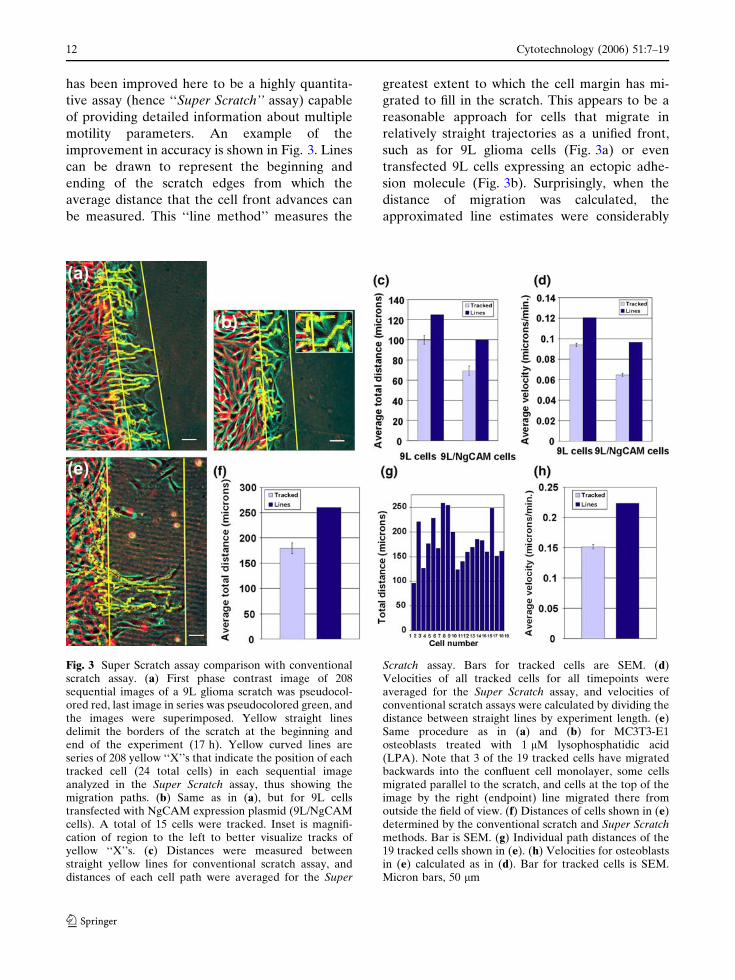
has been improved here to be a highly quantita-
tive assay (hence ‘‘Super Scratch’’ assay) capable
of providing detailed information about multiple
motility parameters. An example of the
improvement in accuracy is shown in Fig. 3. Lines
can be drawn to represent the beginning and
ending of the scratch edges from which the
average distance that the cell front advances can
be measured. This ‘‘line method’’ measures the
greatest extent to which the cell margin has mi-
grated to fill in the scratch. This appears to be a
reasonable approach for cells that migrate in
relatively straight trajectories as a unified front,
such as for 9L glioma cells (Fig. 3a) or even
transfected 9L cells expressing an ectopic adhe-
sion molecule (Fig. 3b). Surprisingly, when the
distance of migration was calculated, the
approximated line estimates were considerably
Fig. 3 Super Scratch assay comparison with conventionalscratch assay. (a) First phase contrast image of 208sequential images of a 9L glioma scratch was pseudocol-ored red, last image in series was pseudocolored green, andthe images were superimposed. Yellow straight linesdelimit the borders of the scratch at the beginning andend of the experiment (17 h). Yellow curved lines areseries of 208 yellow ‘‘X’’s that indicate the position of eachtracked cell (24 total cells) in each sequential imageanalyzed in the Super Scratch assay, thus showing themigration paths. (b) Same as in (a), but for 9L cellstransfected with NgCAM expression plasmid (9L/NgCAMcells). A total of 15 cells were tracked. Inset is magnifi-cation of region to the left to better visualize tracks ofyellow ‘‘X’’s. (c) Distances were measured betweenstraight yellow lines for conventional scratch assay, anddistances of each cell path were averaged for the Super
Scratch assay. Bars for tracked cells are SEM. (d)Velocities of all tracked cells for all timepoints wereaveraged for the Super Scratch assay, and velocities ofconventional scratch assays were calculated by dividing thedistance between straight lines by experiment length. (e)Same procedure as in (a) and (b) for MC3T3-E1osteoblasts treated with 1 lM lysophosphatidic acid(LPA). Note that 3 of the 19 tracked cells have migratedbackwards into the confluent cell monolayer, some cellsmigrated parallel to the scratch, and cells at the top of theimage by the right (endpoint) line migrated there fromoutside the field of view. (f) Distances of cells shown in (e)determined by the conventional scratch and Super Scratchmethods. Bar is SEM. (g) Individual path distances of the19 tracked cells shown in (e). (h) Velocities for osteoblastsin (e) calculated as in (d). Bar for tracked cells is SEM.Micron bars, 50 lm
12 Cytotechnology (2006) 51:7–19
123
greater than the averaged distances calculated by
tracking individual cell paths at the wound edge
using object tracking software (Fig. 3c).
The apparent inaccuracy for gliomas was a
25% overestimate (100 lm tracked vs. 125 lm by
the line method), and for transfected gliomas was
a 45% overestimate (69 lm tracked vs. 100 lm by
the line method). The overestimates by the line
method are due to the fact that not all cells of the
advancing front migrate equally fast or far as the
most advanced cells, which is where the second
line was drawn. The greater inaccuracy for
transfected cells might be attributed to their more
irregular paths (i.e. less straight; see yellow
‘‘X’’s). The difference in migration distance
caused by the adhesion molecule expression as
determined by cell tracking was a 31% reduction
of control distance (31 lm/100 lm), compared to
a 20% reduction (25 lm/125 lm) as determined
by the line-method. These line-method inaccura-
cies in distance, then, are also translated into
discrepancies in velocity when conversions are
done using the duration of the experiment for the
line method (Fig. 3d). Thus, a substantial mis-
representation of cell behavior can result from
measurements made by distance measurements
between advancing fronts of cells in a conven-
tional scratch assay.
Cell migration during the scratch assay also can
lead to the appearance of a very irregular border
of advancing cells. In such cases, a line can still be
drawn at the end of the experiment that is parallel
to the initial scratch border delimiting the extent
of the farthest migrating cells (Fig. 3e). However,
it seems reasonable to predict that measurements
using the line-method might not be accurate
under this condition. The approximated distance
of migration in such a case determined by the
line-method was a large over-estimation (44%;
260 lm by line-method vs. 180 lm by tracking;
Fig. 3f), similar to that for transfected cells with a
more regular border. Individual tracked cell
migration distances varied over 2.5-fold (Fig. 3g).
Since the treatment conditions employed here
were expected to induce random motility
(chemokinesis) as opposed to directed cell
movement (chemotaxis), it was not surprising that
several cells migrated backwards into the mono-
layer (Fig. 3e; leftmost yellow paths). Average
migration velocity was also an over-estimate by
the line-method (Fig. 3h). Thus, actual cell
migratory behavior can be inaccurately repre-
sented by methods employing gross measure-
ments, and inspection of an endpoint image does
not reliably assess the cell behavior up to that
point. Although such a conclusion might be sus-
pected, the high resolution data gathered by the
tracking methods clearly demonstrates this.
Cell migration dynamics
The conventional scratch assay, when quantitated,
is often scored as a single distance measurement.
Deduction of migration velocity from a single
measurement must either assume that migration
rates do not change over the course of the exper-
iment (i.e., velocities are constant), or ignore
potential changes. We found that this assumption
was not true for certain experimental cell treat-
ments, as well as for some control untreated cells.
This can be appreciated when either average
cumulative distances or velocities are plotted
against elapsed time. For distance versus time, a
line represents constant velocity whereas a curve
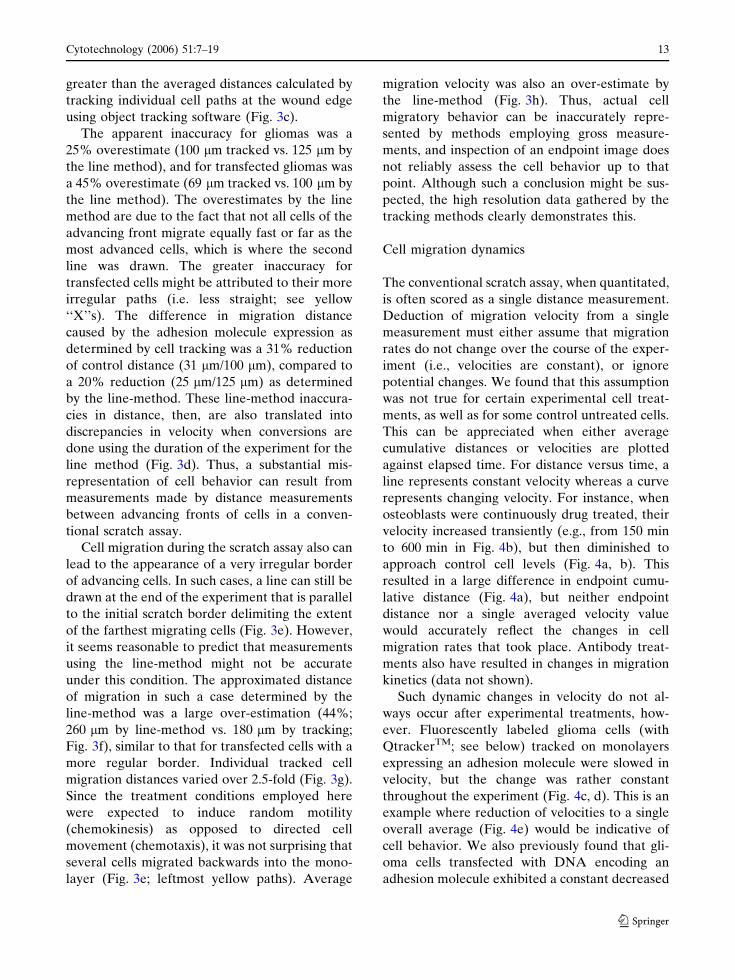
represents changing velocity. For instance, when
osteoblasts were continuously drug treated, their
velocity increased transiently (e.g., from 150 min
to 600 min in Fig. 4b), but then diminished to
approach control cell levels (Fig. 4a, b). This
resulted in a large difference in endpoint cumu-
lative distance (Fig. 4a), but neither endpoint
distance nor a single averaged velocity value
would accurately reflect the changes in cell
migration rates that took place. Antibody treat-
ments also have resulted in changes in migration
kinetics (data not shown).
Such dynamic changes in velocity do not al-
ways occur after experimental treatments, how-
ever. Fluorescently labeled glioma cells (with
QtrackerTM; see below) tracked on monolayers
expressing an adhesion molecule were slowed in
velocity, but the change was rather constant
throughout the experiment (Fig. 4c, d). This is an
example where reduction of velocities to a single
overall average (Fig. 4e) would be indicative of
cell behavior. We also previously found that gli-
oma cells transfected with DNA encoding an
adhesion molecule exhibited a constant decreased
Cytotechnology (2006) 51:7–19 13
123
migration velocity (Cretu et al. 2005). Thus, our
method of quantitation and analysis of cell
migration rates over closely spaced time points
allowed detection of dynamic changes in migra-
tion velocity, such as initial or subsequent in-
creases or decreases, or of constant velocity. The
possibility of such changes in velocity so far has
not been considered by others in conventional
cell migration analyses, but clearly should be.
Time-lapse using fluorescent vital labeling
Fluorescent vital labeling is not necessary for
tracking cells in scratch assays or when migrating
randomly on coated or plain plastic or glass sur-
faces. However, if cells of interest are plated on a
cell monolayer or a tissue slice, then single cells of
interest are not discernable with normal optics.
To overcome this limitation, several different
methods of vital fluorescent cell labeling were
evaluated for their suitability in time-lapse
experiments. Of the four methods evaluated,
three could be used successfully with our system:
QtrackerTM 565, DiO, and GFP expression. The
results are summarized in Table 1. A fourth
method using Cell TrackerTM Green was found
not to be satisfactory due to extreme bleaching
and, thus, disappearance of the fluorescent label
under illumination conditions similar to that for
the other labeling methods. The other methods
Fig. 4 Cell migration dynamics. (a) MC3T3-E1 cells weretracked in the scratch assay as either untreated or treatedwith 2.5 lM LPA. Plotted are the average cumulativedistances at each 5-min interval (260 total). Note thatuntreated cells migrated with a fairly constant velocity(y = 0.4184x + 0.1024; R2 = 0.9983), but treated cellsmigrated with a changing velocity (y = 1E-07x4 ) 9E-05x3 + 0.0189x2 ) 0.0877x + 3.8552; R2 = 0.9996). (b)MC3T3-E1 cells were tracked in the scratch assay as eitheruntreated or treated with 1 lM LPA. Plotted is the average
velocity (blue) with 3rd-order curve of best fit (red) andaverage cumulative distance. Average cumulative distanceis shown in green. (c) C6 cells labeled with fluorescentQtracker were plated on either 3T3 cells (blue) or NgCAMtransfected 3T3 cells (red), tracked, and average cumula-tive distances are plotted. Note that reduced velocity of C6/Qt cells on 3T3/NgCAM cells is constant. (d) Same cells in.(c) plotted as average velocities over time with 3rd-ordercurves of best fit. (e) Overall average velocities of C6/Qtcells shown in (d). Bars indicate SEM
14 Cytotechnology (2006) 51:7–19
123

could be used under specific combinations of
illumination intensity and time interval. Initial
assessment was performed at standard time
intervals of 5 min, with full epifluorescent illu-
mination (blue light, no ND filter), and a 20-h
experiment duration. At each time point, the cells
were subjected to epifluorescent illumination for
a few seconds, which was determined by the
software’s ability to control the hardware. We
found that conditions had to be optimized for
each labeling method to enable visualization of
labeled cells without adverse effects due to
repeated exposure to blue light.
For cells expressing GFP label, full fluores-
cence illumination intensity was not satisfactory
and resulted in lowered initial migration rates and
death of cells (Fig. 5a–d) compared to phase
illumination (Fig. 5a). This assay was performed
with non-confluent cells undergoing non-directed
random migration in a glass bottom culture dish.
To determine if GFP expression itself or illumi-
nation intensity was responsible for slowed
migration and death, cells with and without GFP
expression were analyzed similarly with full illu-
mination intensity and with a neutral density filter
in the illumination path. All samples including
cells with or without GFP label were adversely
affected by full illumination (Fig. 5e). Insertion of
an ND4 filter inline with the epifluorescent light
source (25% illumination intensity) resulted in
stable motility of both labeled and unlabeled cells
over an 18 h experiment (Fig. 5f). Thus, cells
were vulnerable in our experiments to repeated
over-illumination with blue light, but GFP was a
useful vital label when excitation intensity was
reduced by a factor of four.
DiO carbocyanine dye labeling was not useful
under the above conditions for GFP, and required
even less intense and less frequent illumination.
Stable migration velocities were found with
12.5 min time intervals, ND8 filter, and 17-hour
experiment duration (Fig. 5g). The day after
labeling cells, DiO was visible as intracellular
puncta (Fig. 5h), which could be used to track
cells automatically. Intracellular puncta form as
cells endocytose labeled plasma membrane and
incorporate label into endocytotic vesicles. These
large intracellular vesicles were stable inside cells
and could be used for tracking cell migration
using the Track Objects feature. Viewing movies
compiled from time-lapse images revealed that
there was noticeable, but tolerable, DiO photo-
bleaching over the course of the experiment.
Thus, DiO is useful for time-lapse experiments
under appropriate conditions. But, it evidently
was toxic when illuminated with blue light that
normally would not affect unlabeled cells (ND4
filter, 5 min intervals) and so 12.5 min intervals
and ND8 filter needed to be used.
QtrackerTM 565 labeling was evaluated using
fluorescence filter cubes with three different
increasingly narrow excitation bandpass ranges
(see Methods). This was done because the cad-
mium selenide nanocrystal core of the quantum
dot absorbs mostly ultraviolet light, which is toxic
to living cells. We found that the two shorter
wavelength excitation bandpasses resulted in
cell death (data not shown) and that only the
450–500 nm excitation resulted in viable cells
under our conditions of repeated time-lapse
exposure. This label was still extremely bright and
allowed the use of an ND8 filter in the excitation
pathway, and no detectable photobleaching oc-
curred.
QtrackerTM labeling was applied to the anal-
ysis of glioma cell behavior on normal NIH 3T3
Table 1 Properties of vital fluorescent labeling agents for time-lapse microscopy
GFP expression DiO QtrackerTM Cell trackerTM green
Detectable fluorescence Moderatethroughout
High buttapered off
Highthroughout
Moderate at first,bleached rapidly
Bleaching Low Moderate Very low Extreme and rapidCell viability High with
ND filtersHigh with
ND filtersHigh with
ND filtersUnknown due
to bleachingUsable conditions ND4 filter ND8 filter ND8 filter None with our system
5 min intervals 12.5 min intervals 5 min intervals450–500 nm excitation
Cytotechnology (2006) 51:7–19 15
123
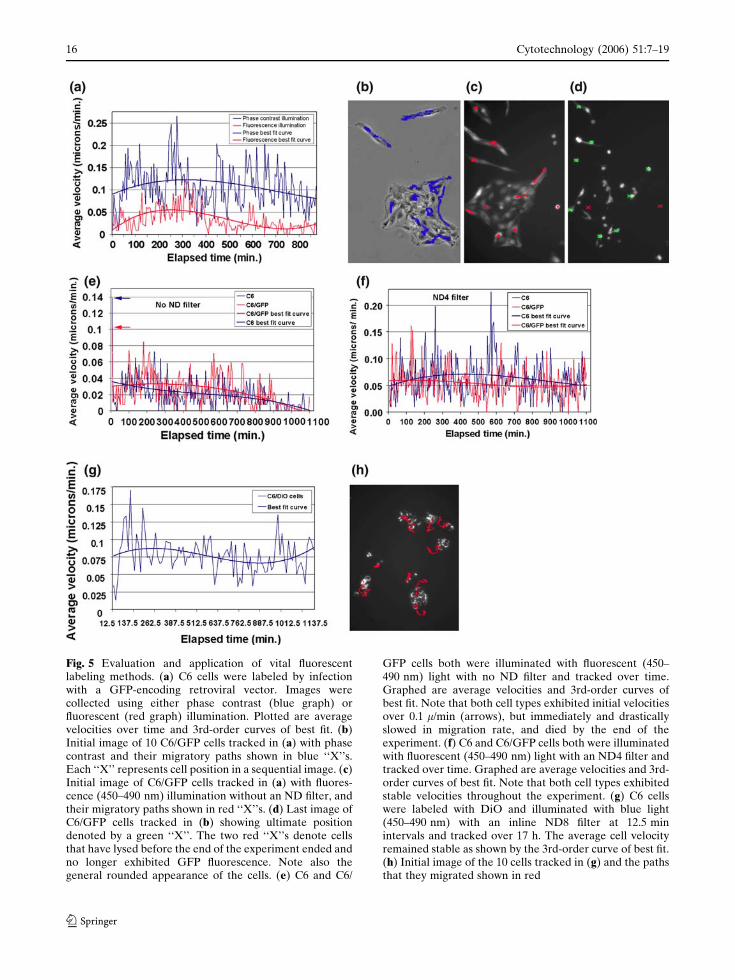
Fig. 5 Evaluation and application of vital fluorescentlabeling methods. (a) C6 cells were labeled by infectionwith a GFP-encoding retroviral vector. Images werecollected using either phase contrast (blue graph) orfluorescent (red graph) illumination. Plotted are averagevelocities over time and 3rd-order curves of best fit. (b)Initial image of 10 C6/GFP cells tracked in (a) with phasecontrast and their migratory paths shown in blue ‘‘X’’s.Each ‘‘X’’ represents cell position in a sequential image. (c)Initial image of C6/GFP cells tracked in (a) with fluores-cence (450–490 nm) illumination without an ND filter, andtheir migratory paths shown in red ‘‘X’’s. (d) Last image ofC6/GFP cells tracked in (b) showing ultimate positiondenoted by a green ‘‘X’’. The two red ‘‘X’’s denote cellsthat have lysed before the end of the experiment ended andno longer exhibited GFP fluorescence. Note also thegeneral rounded appearance of the cells. (e) C6 and C6/
GFP cells both were illuminated with fluorescent (450–490 nm) light with no ND filter and tracked over time.Graphed are average velocities and 3rd-order curves ofbest fit. Note that both cell types exhibited initial velocitiesover 0.1 l/min (arrows), but immediately and drasticallyslowed in migration rate, and died by the end of theexperiment. (f) C6 and C6/GFP cells both were illuminatedwith fluorescent (450–490 nm) light with an ND4 filter andtracked over time. Graphed are average velocities and 3rd-order curves of best fit. Note that both cell types exhibitedstable velocities throughout the experiment. (g) C6 cellswere labeled with DiO and illuminated with blue light(450–490 nm) with an inline ND8 filter at 12.5 minintervals and tracked over 17 h. The average cell velocityremained stable as shown by the 3rd-order curve of best fit.(h) Initial image of the 10 cells tracked in (g) and the pathsthat they migrated shown in red
16 Cytotechnology (2006) 51:7–19
123
cell monolayers and on monolayers expressing
cell surface adhesion molecule NgCAM/L1
(Fig. 4c, d). Labeled cells were extremely bright
and were clearly visible through the monolayers
with an ND8 filter. Cell movements were
tracked as they migrated randomly about on the
cell monolayers. C6/Qt cell migration velocities
are shown in Fig. 4d where a consistent decrease
was apparent for cells on the 3T3/NgCAM
monolayers throughout the experiment. When
reduced to overall average velocity values, cell
migration was reduced by 29% and was highly
significant (Fig. 4e; P << 0.001). Thus, fluores-
cent vital labeling allowed cell motility to be
tracked and quantitated in response to a single
cell surface molecule (NgCAM/L1) when pre-
sented in the context of a living cellular sub-
stratum (3T3 cells).
Discussion
The methods currently in use to measure cell
movements often lack ability to provide answers
to specific questions about migrating cells. For
instance, it is difficult or impossible to approach
questions such as: What are the actual velocities
of untreated cells versus those treated with a
drug? What is the range of individual velocities
within a cell population? What are the paths that
the individual cells took? Do the migration rates
of the treated cells change over time? These
questions are important to answer in a detailed
analysis of cell migration. Our methods have re-
sulted in higher spatial precision and higher
temporal resolution and, therefore, more accurate
representation of cell motility behavior than
heretofore. A requisite for precise quantitation of
cell movements is that measurements be accurate,
especially when the stage travels between several
points of interest at each time interval. The
automated system described here is stable and
accurate and introduces remarkably small errors
to measured distances and velocities for stage
movements that approach 10 cm.
We have presented several examples of how
our time-lapse microscopy system and application
of object tracking software to migrating cells
overcame conventional limitations. One of our
main focuses was to refine the commonly used
scratch or wound healing assay into a highly
quantitative Super Scratch assay. The scratch as-
say before this work had not progressed beyond a
single or few timepoint assay where measure-
ments were made of distance between edges
(Maschler et al. 2005; Zhu et al. 2004; Pratt et al.
2005; Wadham et al. 2003; Besson et al. 2004;
Cretu et al. 2005; Hoang et al. 2004; John et al.
2004; Ray et al. 2003; Lynch et al. 2005; Yarrow
et al. 2004), number of cells entering a defined
area (Petridis et al. 2004; Nishio et al. 2005; Zhu
et al. 2004; Piccolo et al. 2002; Robinet et al.
2005; Raftopoulou et al. 2004; Zhu et al. 2005),
or qualitative assessment without quantitation
(Gavert et al. 2005; Yoshida et al. 2004; Zhang
et al. 2005; Herren et al. 2001; Lee et al. 2004;
Motegi et al. 2003; Laurent-Matha et al. 2005;
Miao et al. 2005). We have shown that such a
method of analysis is not as accurate a represen-
tation of cell migration as tracking individual cells
starting from the advancing front of the wound.
‘‘Average’’ distances and velocities calculated by
using the line or similar method, although they
provide a measurement of the extent to which a
gap is filled in by cells, cannot be used with cer-
tainty to accurately measure a cell population’s
actual average migration distance or velocity.
And since experimental treatments can affect
direction of migration and other cell behavior, an
inaccurate conclusion might be drawn about cell
migration distance, direction, or velocity using the
line-method or any method measuring only the
advancement of the leading edge at the experi-
ment endpoint. Such analyses are based on the
several assumptions that cells maintain relatively
straight trajectories, that cells at the advancing
front are indicative of those cells behind them,
that motility kinetics do not change throughout
the time period, and that significant cell division
does not take place, some or all of which may be
false within a given experiment. Here, examples
are shown where most of these assumptions
would not have been valid, and we speculate that
this may often be the case. Thus, conclusions
made in other studies without further analysis of
individual cell migration velocity or direction
might be subject to error.
Cytotechnology (2006) 51:7–19 17
123
Others have tracked individual cells over peri-
ods of time, but have reported only overall aver-
aged velocity values and not plotted values over
time (Edme et al. 2002; Harms et al. 2005; Huang
et al. 2003; Six et al. 2004; Sun et al. 2004). The
highly quantitative Super Scratch assay has been
useful already for determining the effects on cell
behavior after drug treatment, transfection, and
antibody treatment. In two of these treatments,
the effect on cell velocity changed with time,
which underscores the ability of our assay to re-
veal previously unknown dynamics of cell migra-
tion. Using this assay, delays in the effects of drug
treatment on migration as well as desensitization
(i.e., return to control values) of cells to a treat-
ment can be detected. This method provides the
means to study treatments that might have effects
on migration where the changes in kinetics
themselves are the most important results. By
analogy, then, the Super Scratch assay may be to
the scratch assay what real-time PCR is to PCR.
This work provides a starting point for per-
forming time-lapse experiments and for using
several vital fluorescent labeling methods. It im-
proves upon existing time-lapse video microscopy
systems currently in use in that it enables moni-
toring of cells over long experimental durations.
The assessment of the several labels and condi-
tions presented in Table 1 should allow selection
of an appropriate label and experimental condi-
tions for other investigators. This evaluation was
necessary for our application of motility analyses
on cell monolayers, but can also be applied to
migration on tissue slices, or to determining cell
behaviors when two or more cell populations with
different color labels are mixed. A supplementary
document detailing the construction of the incu-
bator chamber will be provided upon request and
will allow investigators to determine whether this,
or a commercial incubator system, is most suit-
able for their needs.
Acknowledgements This work was supported by grantsfrom NIH to D.S.G. (NS040317), to J.K. (NS049523), andto N.J.K. (HD042066). We gratefully acknowledge that thefilter cube with custom excitation bandpass filters wasprovided by Chroma Technology Corporation. J. Fotosand V. Patel were awarded undergraduate researchfellowships through grants to the Univ. of Delaware from
the Howard Hughes Medical Institute and the RonaldE. McNair Program. We gratefully thank Dr. John Kappesfor the GFP lentiviral vector construct and Dr. MartyGrumet for the NgCAM/L1 cDNA construct.
References
Besson A, Gurian-West M, Schmidt A, Hall A, RobertsJM (2004) p27Kip1 modulates cell migration throughthe regulation of RhoA activation. Genes Dev18:862–876
Cretu A, Fotos JS, Little BW, Galileo DS (2005) Humanand rat glioma growth, invasion, and vascularizationin a novel chick embryo brain tumor model. ClinExper Metas 22:225–236
Edme N, Downward J, Thiery JP, Boyer B (2002) Rasinduces NBT-II epithelial cell scattering through thecoordinate activities of Rac and MAPK pathways. JCell Sci 115:2591–2601
Endo Y, Wolf V, Muraiso K, Kamijo K, Soon L, Uren A,Barshishat-Kupper M, Rubin JS (2005) Wnt-3a-dependent cell motility involves RhoA activation andis specifically regulated by dishevelled-2. J Biol Chem280:777–786
Galileo DS, Gee AP, Linser PJ (1991) Neurons arereplenished in cultures of embryonic chick optic tec-tum after immunomagnetic depletion. Dev Biol146:278–291
Gavert N, Conacci-Sorrell M, Gast D, Schneider A, Alt-evogt P, Brabletz T, Ben-Ze’ev A (2005) L1, a noveltarget of beta-catenin signaling, transforms cells and isexpressed at the invasive front of colon cancers. J CellBiol 168:633–642
Harms BD, Bassi GM, Horwitz AR, Lauffenburger DA(2005) Directional persistence of EGF-induced cellmigration is associated with stabilization of lamel-lipodial protrusions. Biophys J 88:1479–1488
Herren B, Garton KJ, Coats S, Bowen-Pope DF, Ross R,Raines EW (2001) ADAM15 overexpression inNIH3T3 cells enhances cell–cell interactions. Exp CellRes 271:152–160
Hoang MV, Whelan MC, Senger DR (2004) Rho activitycritically and selectively regulates endothelial cellorganization during angiogenesis. Proc Natl Acad SciUSA 101:1874–1879
Huang C, Rajfur Z, Borchers C, Schaller MD, Jacobson K(2003) JNK phosphorylates paxillin and regulates cellmigration. Nature 424:219–223
John GR, Chen L, Rivieccio MA, Melendez-Vasquez CV,Hartley A, Brosnan CF (2004) Interleukin-1beta in-duces a reactive astroglial phenotype via deactivationof the Rho GTPase-Rock axis. J Neurosci 24:2837–2845
Laurent-Matha V, Maruani-Herrmann S, Prebois C,Beaujouin M, Glondu M, Noel A, Alvarez-GonzalezML, Blacher S et al (2005) Catalytically inactive hu-man cathepsin D triggers fibroblast invasive growth. JCell Biol 168:489–499
18 Cytotechnology (2006) 51:7–19
123

Lee CC, Putnam AJ, Miranti CK, Gustafson M, WangLM, Vande Woude GF, Gao CF (2004) Overexpres-sion of sprouty 2 inhibits HGF/SF-mediated cellgrowth, invasion, migration, and cytokinesis. Onco-gene 23:5193–5202
Lynch L, Vodyanik PI, Boettiger D, Guvakova MA (2005)Insulin-like growth factor I controls adhesion strengthmediated by alpha5beta1 integrins in motile carci-noma cells. Mol Biol Cell 16:51–63
Maschler S, Wirl G, Spring H, Bredow DV, Sordat I, BeugH, Reichmann E (2005) Tumor cell invasivenesscorrelates with changes in integrin expression andlocalization. Oncogene 24:2032–2041
Miao H, Strebhardt K, Pasquale EB, Shen TL, Guan JL,Wang B (2005) Inhibition of integrin-mediated celladhesion but not directional cell migration requirescatalytic activity of EphB3 receptor tyrosine kinase.Role of Rho family small GTPases. J Biol Chem280:923–932
Motegi S, Okazawa H, Ohnishi H, Sato R, Kaneko Y,Kobayashi H, Tomizawa K, Ito T et al (2003) Role ofthe CD47-SHPS-1 system in regulation of cell migra-tion. EMBO J 22:2634–2644
Moyano JV, Maqueda A, Casanova B, Garcia-Pardo A(2003) Alpha4beta1 integrin/ligand interaction inhib-its alpha5beta1-induced stress fibers and focal adhe-sions via down-regulation of RhoA and inducesmelanoma cell migration. Mol Biol Cell 14:3699–3715
Nishio T, Kawaguchi S, Yamamoto M, Iseda T, KawasakiT, Hase T (2005) Tenascin-C regulates proliferationand migration of cultured astrocytes in a scratchwound assay. Neuroscience 132:87–102
Petridis AK, El-Maarouf A, Rutishauser U (2004) Poly-sialic acid regulates cell contact dependent neuronaldifferentiation of progenitor cells from the subven-tricular zone. Dev Dyn 230:675–684
Piccolo E, Innominato PF, Mariggio MA, Maffucci T,Iacobelli S, Falasca M (2002) The mechanisminvolved in the regulation of phospholipase Cgamma1activity in cell migration. Oncogene 21:6520–6529
Pratt SJ, Epple H, Ward M, Feng Y, Braga VM, LongmoreGD (2005) The LIM protein Ajuba influencesp130Cas localization and Rac1 activity during cellmigration. J Cell Biol 168:813–824
Raftopoulou M, Etienne-Manneville S, Self A, Nicholls S,Hall A (2004) Regulation of cell migration by the C2domain of the tumor suppressor PTEN. Science303:1179–1181
Ray RM, McCormack SA, Covington C, Viar MJ, ZhengY, Johnson LR (2003) The requirement for polyam-ines for intestinal epithelial cell migration is mediatedthrough Rac1. J Biol Chem 278:13039–13046
Robinet A, Fahem A, Cauchard JH, Huet E, Vincent L,Lorimier S, Antonicelli F, Soria C et al (2005) Elastin-derived peptides enhance angiogenesis by promotingendothelial cell migration and tubulogenesis throughupregulation of MT1-MMP. J Cell Sci 118:343–356
Six EM, Ndiaye D, Sauer G, Laabi Y, Athman R, CumanoA, Brou C, Israel A, Logeat F (2004) The notch ligandDelta1 recruits Dlg1 at cell–cell contacts and regu-lates cell migration. J Biol Chem 279:55818–55826
Sun S, Wise J, Cho M (2004) Human fibroblast migrationin three-dimensional collagen gel in response tononinvasive electrical stimulus. I. Characterization ofinduced three-dimensional cell movement. Tissue Eng10:1548–1557
Wadham C, Gamble JR, Vadas MA, Khew-Goodall Y(2003) The protein tyrosine phosphatase Pez is amajor phosphatase of adherens junctions anddephosphorylates beta-catenin. Mol Biol Cell14:2520–2529
Yarrow JC, Perlman ZE, Westwood NJ, Mitchison TJ(2004) A high-throughput cell migration assay usingscratch wound healing, a comparison of image-basedreadout methods. BMC Biotechnol 4:21
Yoshida H, Cheng W, Hung J, Montell D, Geisbrecht E,Rosen D, Liu J, Naora H (2004) Lessons from bordercell migration in the Drosophila ovary: a role formyosin VI in dissemination of human ovarian cancer.Proc Natl Acad Sci USA 101:8144–8149
Zhang L, Deng M, Parthasarathy R, Wang L, Mongan M,Molkentin JD, Zheng Y, Xia Y (2005) MEKK1transduces activin signals in keratinocytes to induceactin stress fiber formation and migration. Mol CellBiol 25:60–65
Zhu N, Lalla R, Eves P, Brown TH, King A, Kemp EH,Haycock JW, MacNeil S (2004) Melanoma cellmigration is upregulated by tumour necrosis factor-alpha and suppressed by alpha-melanocyte-stimulat-ing hormone. Brit J Cancer 90:1457–1463
Zhu X, Jiang J, Shen H, Wang H, Zong H, Li Z, Yang Y,Niu Z et al (2005) Elevated beta1,4-galactosyltrans-ferase I in highly metastatic human lung cancer cells.Identification of E1AF as important transcriptionactivator. J Biol Chem 280:12503–12516
Cytotechnology (2006) 51:7–19 19
123