
Super resolution of time-lapse seismic images
9
SUPER RESOLUTION OF TIME-LAPSE SEISMIC IMAGES Sergio E. Zarantonello 1,2 , Bonnie Smithson 3 , Youli Quan 4 1 Algorithmica LLC ([email protected]) 2 Department of Applied Mathematics, Santa Clara University ([email protected]) 3 Department of Electrical Engineering, Santa Clara University ([email protected]) 4 School of Earth Sciences, Stanford University ([email protected]) Abstract We present results of an on-going project to assess the applicability in reflection seismology of emerging super resolution techniques pioneered in digital photography. Our approach involves: (1) construction of a forward model connecting low resolution seismic images to high resolution ones, and (2) solution of a Tikhonov-regularized ill conditioned optimization problem to construct a high resolution image from several lower resolution counterparts; the high and low resolution images derived, respectively, from dense and sparse seismic surveys. Keywords: cloud computing, compressed sensing, reflection seismology, reverse time migration, seismic image, seismic survey, shot gather, super-resolution 1. Introduction Seismic imaging is a technology for building images of the Earth's subsurface based on the propagation of artificially created seismic waves - explosions or mechanically-generated vibrations - that penetrate the Earth, reflect at discontinuities, and travel back to the surface where they are recorded by arrays of sensors. The construction of accurate 3-D images of the Earth’s subsurface is extremely computationally and data intensive, requiring dense seismic surveys, data volumes in the order of 10-15 terabytes, and 3-D parallel applications running on thousands of processors. This cost is compounded in 4-D seismic imaging, where a sequence of time-lapse seismic images is required to monitor a time- evolving process below the Earth's surface. In this article we outline a novel, cost-effective, 4-D procedure based on reverse time migration [3], an advanced application for building high-quality seismic images. We do not attempt to image below the diffraction limit. Our procedure relies on a much smaller than normally required set of shot-gathers, i.e. seismic sources and associated sensors, and is thus much less expensive than conventional 4-D monitoring with dense surveys. Furthermore, it can improve the resolution of seismic images by incorporating what would be the effects of added sources. We interpret a sparse collection of shot-gather images as observation points, and apply a compressed sensing [5, 6, 8] methodology to recreate the seismic image that would have been obtained with a full set of shot-gathers. The procedure presents the advantage of requiring fewer sources, considerably lower operational costs, less data, and significantly less processing. In a continuing project the relevant algorithms will be implemented on graphical processing units (GPUs) with expected improvements in price/performance. To assess our procedure we used a 3-D geologic model consisting of a shallow coal layer below the Earth’s surface with corresponding overburden and underburden. We modeled the injection and sequestration of CO2 in the coal layer, and simulated 4-D seismic monitoring of this process with both, dense and sparse seismic surveys. The objectives were: 1. To detect with seismic images the leakage of CO2 to an overlaying sand unit. 2. Using the sparse survey data, to reconstruct the high resolution images obtained with the dense survey. Visual Information Processing XX, edited by Zia-ur Rahman, Stephen E. Reichenbach, Mark A. Neifeld, Proc. of SPIE Vol. 8056, 80560C · © 2011 SPIE · CCC code: 0277-786X/11/$18 · doi: 10.1117/12.883629 Proc. of SPIE Vol. 8056 80560C-1 Downloaded from SPIE Digital Library on 02 Dec 2011 to 171.64.173.107. Terms of Use: http://spiedl.org/terms
Transcript of Super resolution of time-lapse seismic images
SUPER RESOLUTION OF TIME-LAPSE SEISMIC IMAGES
Sergio E. Zarantonello1,2, Bonnie Smithson3, Youli Quan4
1Algorithmica LLC ([email protected]) 2Department of Applied Mathematics, Santa Clara University ([email protected])
3Department of Electrical Engineering, Santa Clara University ([email protected]) 4School of Earth Sciences, Stanford University ([email protected])
Abstract
We present results of an on-going project to assess the applicability in reflection seismology of emerging super resolution techniques pioneered in digital photography. Our approach involves: (1) construction of a forward model connecting low resolution seismic images to high resolution ones, and (2) solution of a Tikhonov-regularized ill conditioned optimization problem to construct a high resolution image from several lower resolution counterparts; the high and low resolution images derived, respectively, from dense and sparse seismic surveys. Keywords: cloud computing, compressed sensing, reflection seismology, reverse time migration, seismic image, seismic survey, shot gather, super-resolution
1. Introduction Seismic imaging is a technology for building images of the Earth's subsurface based on the propagation of artificially created seismic waves - explosions or mechanically-generated vibrations - that penetrate the Earth, reflect at discontinuities, and travel back to the surface where they are recorded by arrays of sensors. The construction of accurate 3-D images of the Earth’s subsurface is extremely computationally and data intensive, requiring dense seismic surveys, data volumes in the order of 10-15 terabytes, and 3-D parallel applications running on thousands of processors. This cost is compounded in 4-D seismic imaging, where a sequence of time-lapse seismic images is required to monitor a time-evolving process below the Earth's surface. In this article we outline a novel, cost-effective, 4-D procedure based on reverse time migration [3], an advanced application for building high-quality seismic images. We do not attempt to image below the diffraction limit. Our procedure relies on a much smaller than normally required set of shot-gathers, i.e. seismic sources and associated sensors, and is thus much less expensive than conventional 4-D monitoring with dense surveys. Furthermore, it can improve the resolution of seismic images by incorporating what would be the effects of added sources. We interpret a sparse collection of shot-gather images as observation points, and apply a compressed sensing [5, 6, 8] methodology to recreate the seismic image that would have been obtained with a full set of shot-gathers. The procedure presents the advantage of requiring fewer sources, considerably lower operational costs, less data, and significantly less processing. In a continuing project the relevant algorithms will be implemented on graphical processing units (GPUs) with expected improvements in price/performance. To assess our procedure we used a 3-D geologic model consisting of a shallow coal layer below the Earth’s surface with corresponding overburden and underburden. We modeled the injection and sequestration of CO2 in the coal layer, and simulated 4-D seismic monitoring of this process with both, dense and sparse seismic surveys. The objectives were: 1. To detect with seismic images the leakage of CO2 to an overlaying sand unit. 2. Using the sparse survey data, to reconstruct the high resolution images obtained with the dense survey.
Visual Information Processing XX, edited by Zia-ur Rahman, Stephen E. Reichenbach, Mark A. Neifeld, Proc. of SPIE Vol. 8056, 80560C · © 2011 SPIE · CCC code: 0277-786X/11/$18 · doi: 10.1117/12.883629
Proc. of SPIE Vol. 8056 80560C-1
Downloaded from SPIE Digital Library on 02 Dec 2011 to 171.64.173.107. Terms of Use: http://spiedl.org/terms
The organizaalgorithm. Insynthetic mocomment on
Reverse timespurred muchperformance wave equatioof the receivgathers. By implementatimedium. Theconditions foto this paper which involvgather), and t
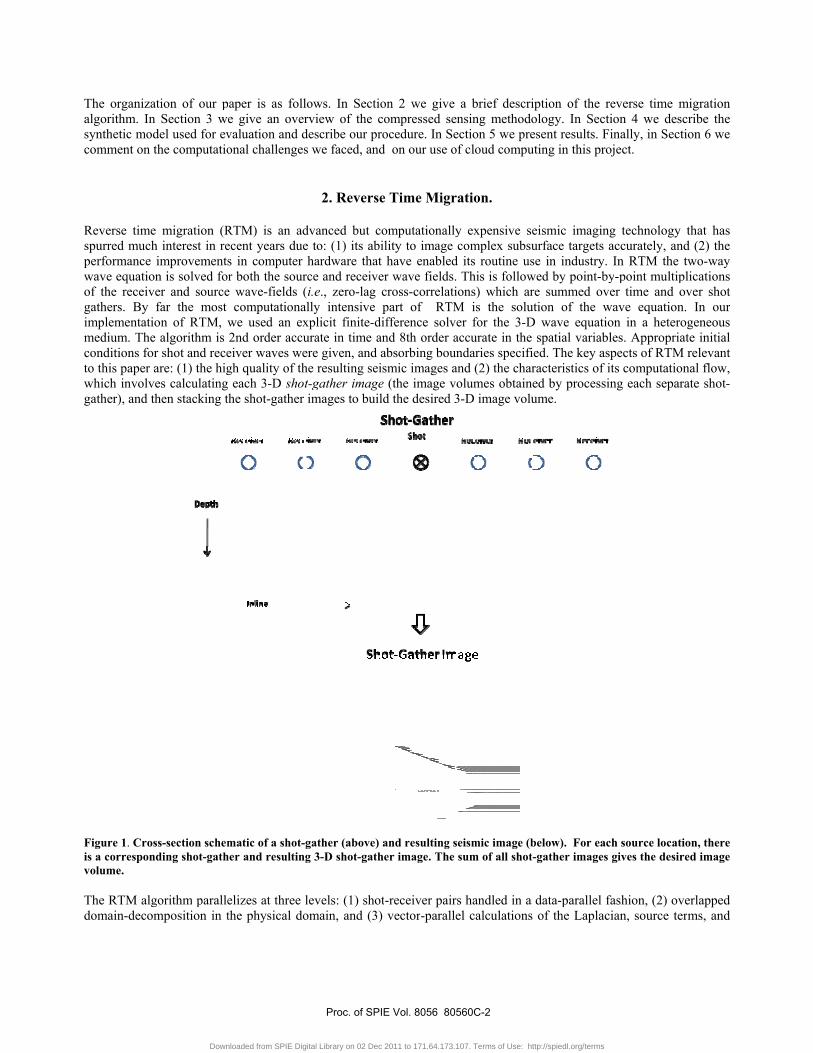
Figure 1. Crois a corresponvolume. The RTM algdomain-deco
ation of our pn Section 3 wedel used for evthe computatio
e migration (Rh interest in reimprovements
on is solved forver and source
far the most ion of RTM, we algorithm is or shot and receare: (1) the hig
ves calculatingthen stacking t
oss-section schemnding shot-gath
gorithm paralleomposition in t
aper is as folle give an overvaluation and donal challenges
RTM) is an adecent years dues in computer r both the sour
e wave-fields (computationa
we used an ex2nd order accueiver waves wegh quality of th each 3-D sho
the shot-gather
matic of a shot-her and resultin
elizes at three the physical do
lows. In Sectirview of the cdescribe our prs we faced, and
2. Reverse
dvanced but ce to: (1) its abhardware that
rce and receive(i.e., zero-lag ally intensive xplicit finite-durate in time aere given, and he resulting seit-gather imageimages to buil
-gather (above) ng 3-D shot-gath
levels: (1) shoomain, and (3)
on 2 we give compressed serocedure. In Sed on our use o
e Time Migr
computationallyility to imaget have enableder wave fields.cross-correlatipart of RTM
difference solvand 8th order aabsorbing bounismic images ae (the image vld the desired 3
and resulting sher image. The
ot-receiver pair) vector-paralle
a brief descriensing methodoection 5 we preof cloud compu
ration.
y expensive secomplex subsu
d its routine us This is follow
ions) which arM is the soluer for the 3-Daccurate in the ndaries specifi
and (2) the charolumes obtain3-D image volu
seismic image (bsum of all shot
rs handled in a el calculations
iption of the rology. In Sectesent results. Futing in this pro
eismic imaginurface targets se in industry. wed by point-byre summed ovution of the wD wave equatio
spatial variabied. The key asracteristics of ied by processiume.
below). For eact-gather images
data-parallel fs of the Laplac
reverse time mtion 4 we descFinally, in Sectioject.
ng technology accurately, andIn RTM the t
y-point multipver time and owave equationon in a heteroles. Appropria
spects of RTM its computationing each separa
ch source locatigives the desir
fashion, (2) ovcian, source ter
migration cribe the ion 6 we
that has d (2) the two-way
plications over shot . In our
ogeneous ate initial
relevant nal flow, ate shot-
ion, there ed image
erlapped rms, and
Proc. of SPIE Vol. 8056 80560C-2
Downloaded from SPIE Digital Library on 02 Dec 2011 to 171.64.173.107. Terms of Use: http://spiedl.org/terms
time-updatesstreaming mprice/perform
Figur
In [7] Cao eknown exactexceeding thwhere N is thseismic imag
Compressed is as followcombination the correspon
s. For a GPU ode. A compl
mance over con
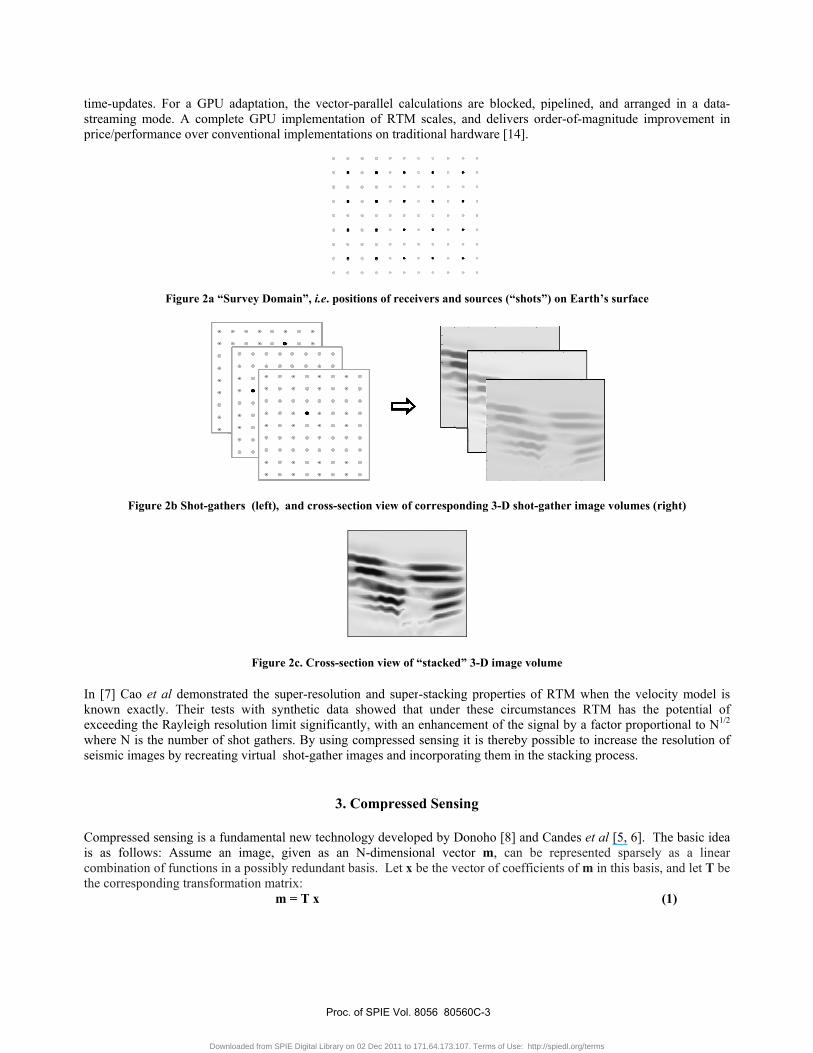
Figure 2a “S
re 2b Shot-gath
et al demonstratly. Their teste Rayleigh reshe number of
ges by recreatin
sensing is a fuws: Assume an
of functions innding transform
adaptation, thete GPU impl
nventional imp
Survey Domain”
hers (left), and
Figure 2c.
ated the super-ts with synthesolution limit sshot gathers. Bng virtual shot
undamental newn image, given a possibly redmation matrix:
m = T
e vector-paralllementation oflementations o
”, i.e. positions
cross-section v
Cross-section v
-resolution andetic data showsignificantly, wBy using compt-gather images
3. Comp
w technology dn as an N-didundant basis.
T x
lel calculationf RTM scales,on traditional h
of receivers and
view of correspo
view of “stacked
d super-stackinwed that underwith an enhancpressed sensings and incorpora
pressed Sens
developed by Dmensional vec Let x be the v
ns are blockedand delivers
hardware [14].
d sources (“sho
onding 3-D shot
d” 3-D image vo
ng properties or these circumement of the s
g it is thereby pating them in th
sing
Donoho [8] anctor m, can b
vector of coeffi
, pipelined, anorder-of-magn
ts”) on Earth’s
t-gather image v
olume
of RTM whenmstances RTMsignal by a factpossible to inche stacking pro
d Candes et albe representedicients of m in
nd arranged innitude improve
surface
volumes (right)
n the velocity mM has the pote
tor proportionacrease the resolocess.
l [5, 6]. The bad sparsely as this basis, and
(1)
n a data-ement in
)
model is ential of al to N1/2 lution of
asic idea a linear
d let T be
Proc. of SPIE Vol. 8056 80560C-3
Downloaded from SPIE Digital Library on 02 Dec 2011 to 171.64.173.107. Terms of Use: http://spiedl.org/terms
Sampling theof samples ofto seek the sp
Once x is fou
Since K<<N,system of eq(2). The usuamathematicanonzero commissing data the data is ecommonly us An alternativ
where γ is a rand extend thand the set y
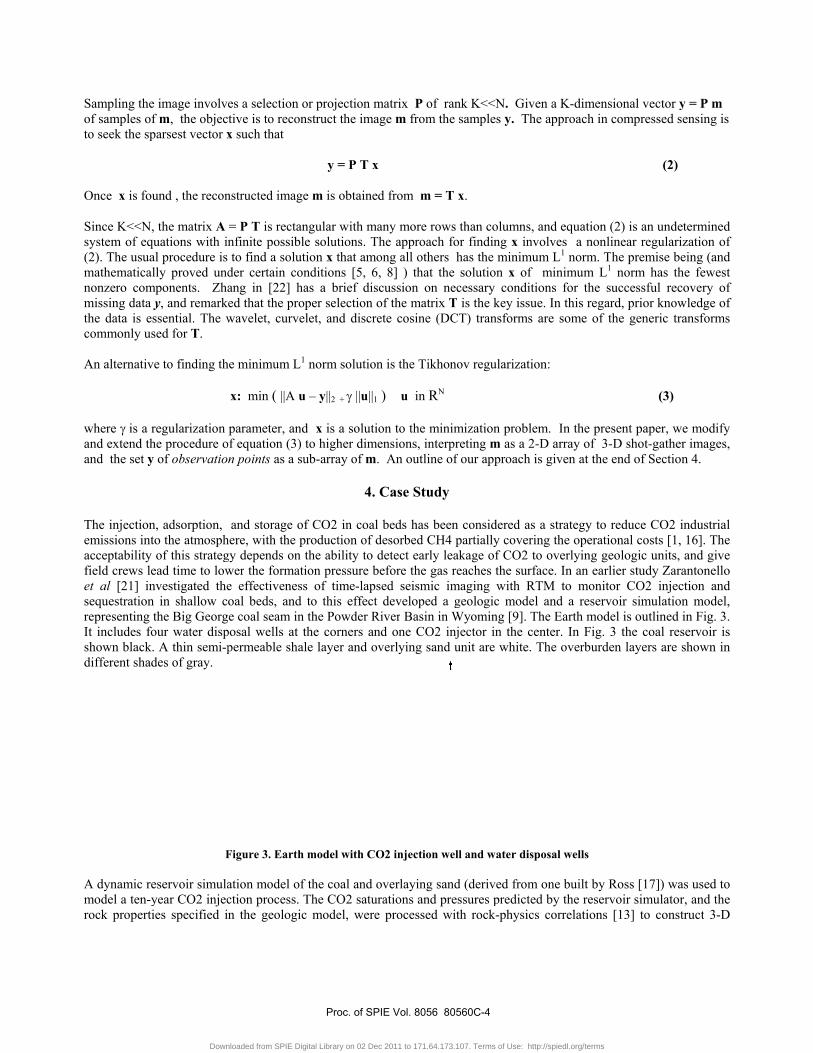
The injectionemissions intacceptability field crews leet al [21] insequestrationrepresenting It includes foshown blackdifferent shad
A dynamic remodel a ten-yrock properti
e image involvef m, the objecparsest vector x
und , the recon
, the matrix A quations with inal procedure is lly proved und
mponents. Zhay, and remarkssential. The wsed for T.
ve to finding th
regularization he procedure oy of observatio
n, adsorption, to the atmosphof this strateg
ead time to lownvestigated then in shallow cthe Big Georgour water disp. A thin semi-pdes of gray.
F
eservoir simulayear CO2 injecies specified in
es a selection otive is to reconx such that
nstructed image
= P T is rectannfinite possiblto find a solut
der certain conang in [22] haed that the prowavelet, curve
he minimum L1
x: min ( ||A u
parameter, andof equation (3) n points as a su
and storage ofhere, with the pgy depends on wer the formatie effectivenessoal beds, and e coal seam in
posal wells at tpermeable shal
Figure 3. Earth
ation model ofction process. Tn the geologic
or projection mnstruct the imag
y = P T x
e m is obtained
ngular with mae solutions. Thtion x that amonditions [5, 6,as a brief disc
oper selection oelet, and discre
norm solution
u – y||2 + γ ||u||1
d x is a solutioto higher dimeub-array of m.
4. C
f CO2 in coal production of dthe ability to dion pressure bes of time-lapsto this effect the Powder R
the corners anle layer and ov
model with CO
f the coal and oThe CO2 saturc model, were
matrix P of range m from the
d from m = T
any more rows he approach foong all others h, 8] ) that the cussion on neof the matrix Tete cosine (DC
n is the Tikhon
) u in RN
on to the minimensions, interpr An outline of
Case Study
beds has beendesorbed CH4 pdetect early leaefore the gas r
sed seismic imdeveloped a giver Basin in W
nd one CO2 injverlying sand u
O2 injection wel
overlaying sandrations and pre
processed wit
nk K<<N. Givsamples y. Th
x.
than columns,or finding x inhas the minimusolution x of
cessary conditT is the key issuCT) transforms
nov regularizati
mization problreting m as a 2f our approach
n considered aspartially coverakage of CO2 teaches the surf
maging with Rgeologic modeWyoming [9]. Tjector in the cunit are white.
ll and water dis
d (derived fromessures predicteth rock-physic
ven a K-dimenshe approach in
, and equation nvolves a nonlum L1 norm. T
f minimum L1
tions for the sue. In this regas are some of t
ion:
em. In the pre2-D array of 3is given at the
s a strategy to ring the operatito overlying gface. In an ear
RTM to monitel and a reservThe Earth modcenter. In Fig.
The overburd
sposal wells
m one built by ed by the resercs correlations
sional vector ycompressed se
(2)
(2) is an undetlinear regularizThe premise be1 norm has thsuccessful recoard, prior knowthe generic tra
(3)
esent paper, we-D shot-gatherend of Section
reduce CO2 inional costs [1, eologic units, lier study Zarator CO2 injectvoir simulationdel is outlined i3 the coal res
den layers are s
Ross [17]) wasrvoir simulator
[13] to constr
y = P m ensing is
termined zation of eing (and e fewest overy of
wledge of ansforms
e modify r images, n 4.
ndustrial 16]. The and give antonello tion and n model, in Fig. 3. ervoir is
shown in
s used to , and the ruct 3-D
Proc. of SPIE Vol. 8056 80560C-4
Downloaded from SPIE Digital Library on 02 Dec 2011 to 171.64.173.107. Terms of Use: http://spiedl.org/terms
velocity fieldgenerated. Fbeginning anof its superiothat the CO2CO2 injectiovelocities at t
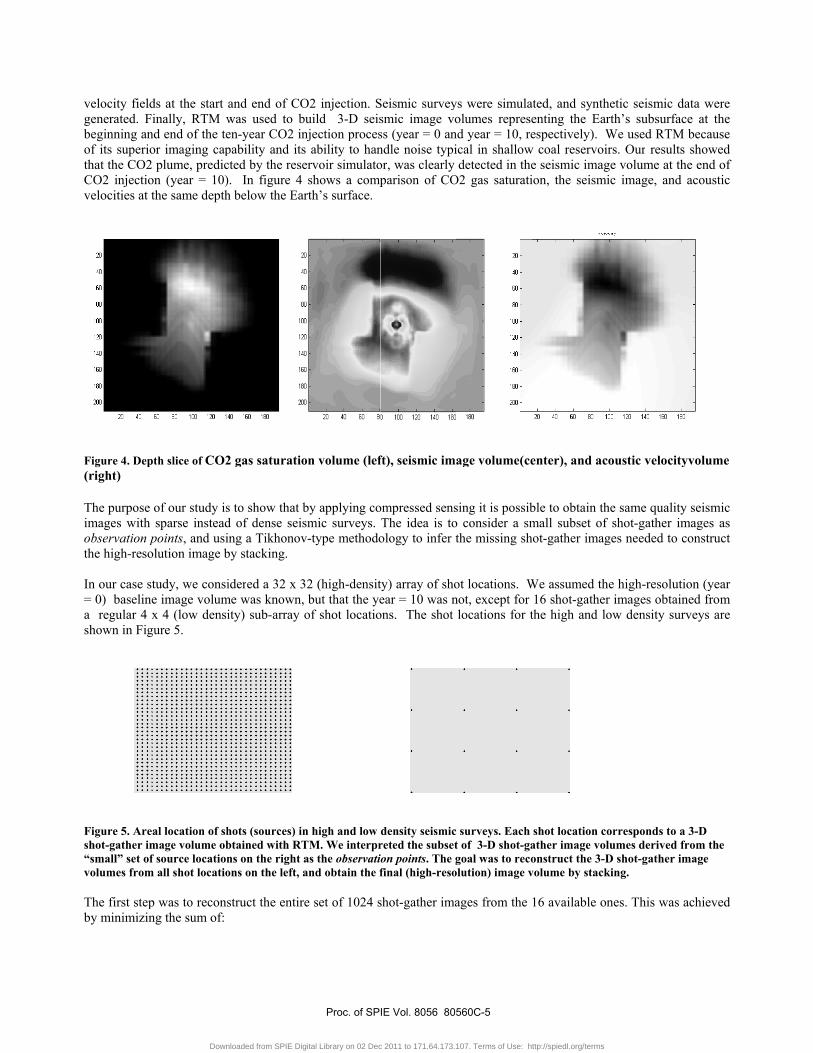
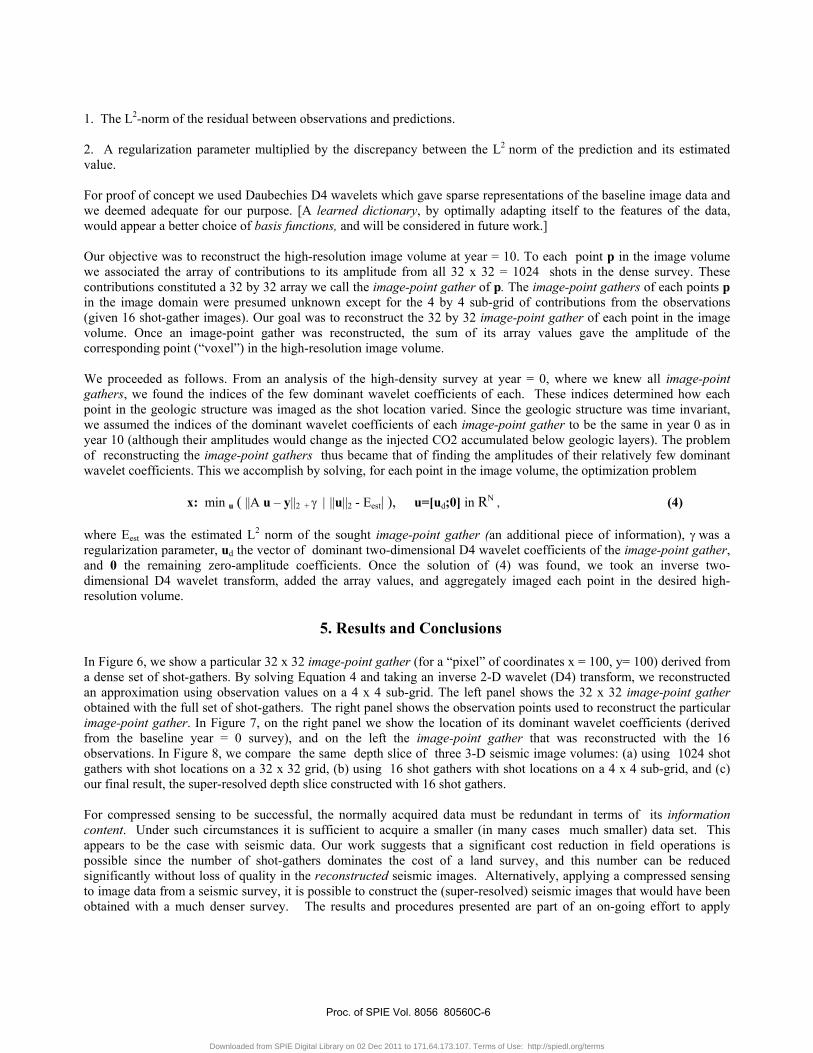
Figure 4. Dep(right) The purpose images with observation pthe high-reso In our case st= 0) baselinea regular 4 xshown in Fig
Figure 5. Areshot-gather im“small” set ofvolumes from The first stepby minimizin
ds at the start inally, RTM w
nd end of the teor imaging cap plume, predic
on (year = 10)the same depth
pth slice of CO2
of our study issparse instead
points, and usiolution image b
tudy, we consie image volumx 4 (low densi
gure 5.
al location of shmage volume obf source location
m all shot locatio
p was to reconsng the sum of:
and end of COwas used to ben-year CO2 inpability and itscted by the rese). In figure 4 h below the Ear
2 gas saturatio
s to show that bd of dense seising a Tikhonovby stacking.
idered a 32 x 3me was known,ity) sub-array
hots (sources) inbtained with RTns on the right aons on the left, a
struct the entir
O2 injection. Sbuild 3-D seisnjection process ability to hanervoir simulatoshows a comp
rth’s surface.
on volume (lef
by applying cosmic surveys. v-type methodo
32 (high-densit but that the yeof shot locatio
n high and low TM. We interpras the observatiand obtain the f
e set of 1024 s
Seismic surveysmic image voss (year = 0 anndle noise typior, was clearly parison of CO
ft), seismic ima
ompressed sensThe idea is toology to infer t
ty) array of shoear = 10 was n
ons. The shot
density seismicreted the subsetion points. The gfinal (high-reso
shot-gather ima
ys were simulaolumes represe
nd year = 10, reical in shallowdetected in the
O2 gas saturati
age volume(ce
sing it is possibo consider a smthe missing sh
ot locations. Wnot, except forlocations for t
c surveys. Each t of 3-D shot-gagoal was to reco
olution) image v
ages from the
ated, and synthenting the Earespectively). W
w coal reservoire seismic imagion, the seismi
enter), and aco
ble to obtain thmall subset of hot-gather imag
We assumed th16 shot-gatherthe high and lo
shot location coather image volonstruct the 3-Dvolume by stack
16 available on
hetic seismic drth’s subsurfacWe used RTM rs. Our results
ge volume at thic image, and
oustic velocity
he same qualityshot-gather im
ges needed to c
e high-resolutir images obtainow density sur
orresponds to alumes derived fD shot-gather imking.
nes. This was a
ata were ce at the
because s showed he end of
acoustic
yvolume
y seismic mages as construct
ion (year ned from rveys are
a 3-D from the mage
achieved
Proc. of SPIE Vol. 8056 80560C-5
Downloaded from SPIE Digital Library on 02 Dec 2011 to 171.64.173.107. Terms of Use: http://spiedl.org/terms
1. The L2-norm of the residual between observations and predictions. 2. A regularization parameter multiplied by the discrepancy between the L2 norm of the prediction and its estimated value. For proof of concept we used Daubechies D4 wavelets which gave sparse representations of the baseline image data and we deemed adequate for our purpose. [A learned dictionary, by optimally adapting itself to the features of the data, would appear a better choice of basis functions, and will be considered in future work.] Our objective was to reconstruct the high-resolution image volume at year = 10. To each point p in the image volume we associated the array of contributions to its amplitude from all 32 x 32 = 1024 shots in the dense survey. These contributions constituted a 32 by 32 array we call the image-point gather of p. The image-point gathers of each points p in the image domain were presumed unknown except for the 4 by 4 sub-grid of contributions from the observations (given 16 shot-gather images). Our goal was to reconstruct the 32 by 32 image-point gather of each point in the image volume. Once an image-point gather was reconstructed, the sum of its array values gave the amplitude of the corresponding point (“voxel”) in the high-resolution image volume. We proceeded as follows. From an analysis of the high-density survey at year = 0, where we knew all image-point gathers, we found the indices of the few dominant wavelet coefficients of each. These indices determined how each point in the geologic structure was imaged as the shot location varied. Since the geologic structure was time invariant, we assumed the indices of the dominant wavelet coefficients of each image-point gather to be the same in year 0 as in year 10 (although their amplitudes would change as the injected CO2 accumulated below geologic layers). The problem of reconstructing the image-point gathers thus became that of finding the amplitudes of their relatively few dominant wavelet coefficients. This we accomplish by solving, for each point in the image volume, the optimization problem x: min u ( ||A u – y||2 + γ | ||u||2 - Eest| ), u=[ud;0] in RN , (4)
where Eest was the estimated L2 norm of the sought image-point gather (an additional piece of information), γ was a regularization parameter, ud the vector of dominant two-dimensional D4 wavelet coefficients of the image-point gather, and 0 the remaining zero-amplitude coefficients. Once the solution of (4) was found, we took an inverse two-dimensional D4 wavelet transform, added the array values, and aggregately imaged each point in the desired high-resolution volume.
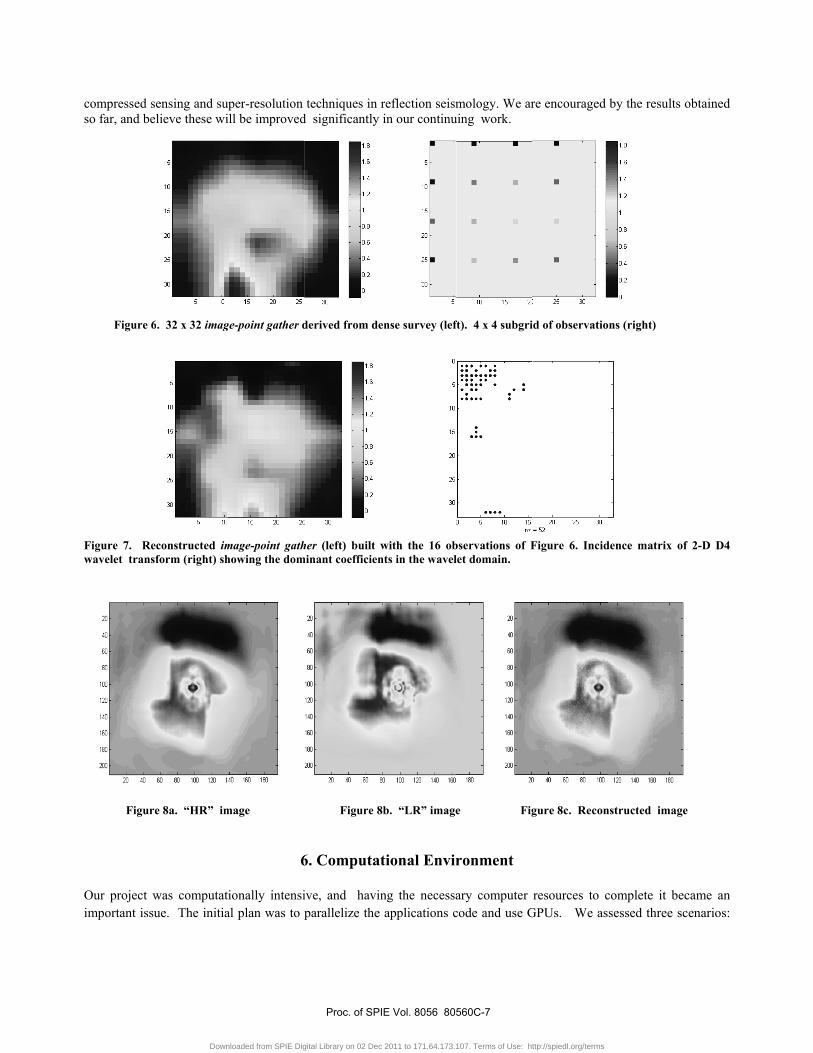
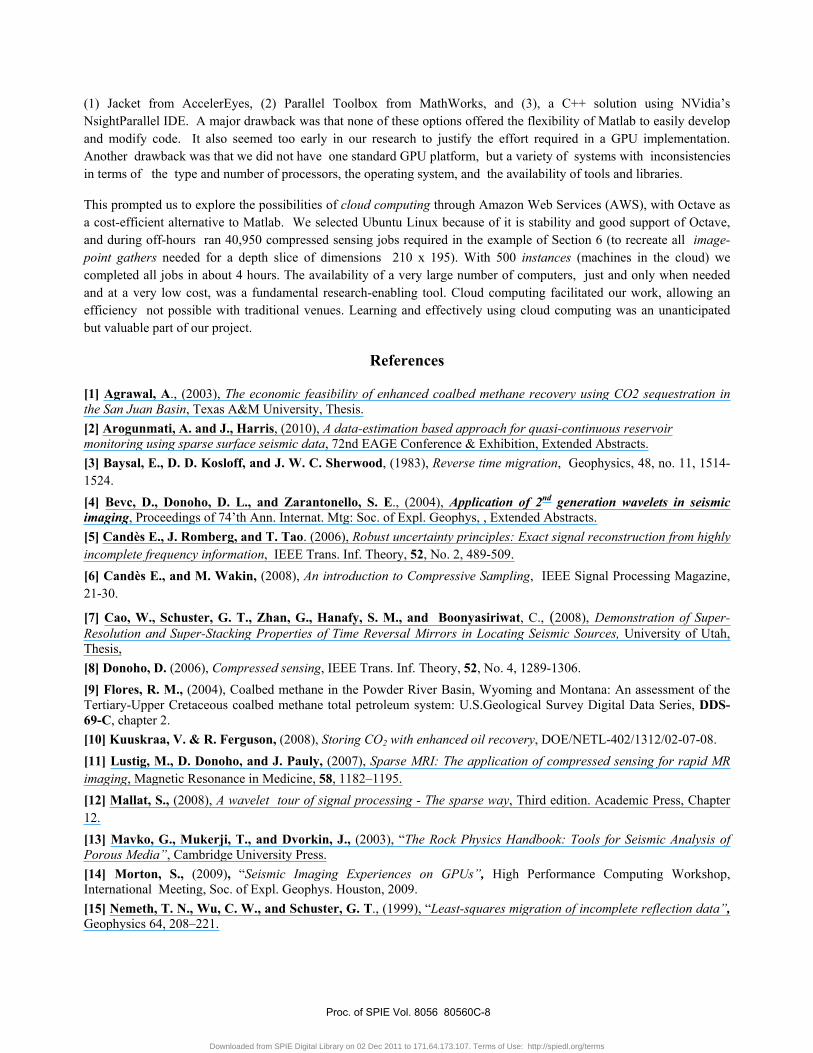
5. Results and Conclusions In Figure 6, we show a particular 32 x 32 image-point gather (for a “pixel” of coordinates x = 100, y= 100) derived from a dense set of shot-gathers. By solving Equation 4 and taking an inverse 2-D wavelet (D4) transform, we reconstructed an approximation using observation values on a 4 x 4 sub-grid. The left panel shows the 32 x 32 image-point gather obtained with the full set of shot-gathers. The right panel shows the observation points used to reconstruct the particular image-point gather. In Figure 7, on the right panel we show the location of its dominant wavelet coefficients (derived from the baseline year = 0 survey), and on the left the image-point gather that was reconstructed with the 16 observations. In Figure 8, we compare the same depth slice of three 3-D seismic image volumes: (a) using 1024 shot gathers with shot locations on a 32 x 32 grid, (b) using 16 shot gathers with shot locations on a 4 x 4 sub-grid, and (c) our final result, the super-resolved depth slice constructed with 16 shot gathers. For compressed sensing to be successful, the normally acquired data must be redundant in terms of its information content. Under such circumstances it is sufficient to acquire a smaller (in many cases much smaller) data set. This appears to be the case with seismic data. Our work suggests that a significant cost reduction in field operations is possible since the number of shot-gathers dominates the cost of a land survey, and this number can be reduced significantly without loss of quality in the reconstructed seismic images. Alternatively, applying a compressed sensing to image data from a seismic survey, it is possible to construct the (super-resolved) seismic images that would have been obtained with a much denser survey. The results and procedures presented are part of an on-going effort to apply
Proc. of SPIE Vol. 8056 80560C-6
Downloaded from SPIE Digital Library on 02 Dec 2011 to 171.64.173.107. Terms of Use: http://spiedl.org/terms
compressed sso far, and be
Figure 6
Figure 7. Rewavelet trans
Figur
Our project important iss
sensing and suelieve these wi
6. 32 x 32 imag
econstructed imsform (right) sh
re 8a. “HR” im
was computatsue. The initia
uper-resolution ill be improved
ge-point gather d
mage-point gathhowing the dom
mage
6
ionally intensial plan was to p
techniques in d significantly
derived from de
her (left) built wminant coefficien
Figure 8
6. Computa
ive, and havinparallelize the
reflection seismin our continu
ense survey (lef
with the 16 obnts in the wavel
8b. “LR” image
tional Envir
ng the necessaapplications c
mology. We aruing work.
ft). 4 x 4 subgri
bservations of Flet domain.
e Fig
ronment
ary computer code and use G
re encouraged
id of observatio
Figure 6. Incid
gure 8c. Recon
resources to cGPUs. We as
by the results
ns (right)
dence matrix of
nstructed image
complete it besessed three sc
obtained
f 2-D D4
e
came an cenarios:
Proc. of SPIE Vol. 8056 80560C-7
Downloaded from SPIE Digital Library on 02 Dec 2011 to 171.64.173.107. Terms of Use: http://spiedl.org/terms
(1) Jacket from AccelerEyes, (2) Parallel Toolbox from MathWorks, and (3), a C++ solution using NVidia’s NsightParallel IDE. A major drawback was that none of these options offered the flexibility of Matlab to easily develop and modify code. It also seemed too early in our research to justify the effort required in a GPU implementation. Another drawback was that we did not have one standard GPU platform, but a variety of systems with inconsistencies in terms of the type and number of processors, the operating system, and the availability of tools and libraries.
This prompted us to explore the possibilities of cloud computing through Amazon Web Services (AWS), with Octave as a cost-efficient alternative to Matlab. We selected Ubuntu Linux because of it is stability and good support of Octave, and during off-hours ran 40,950 compressed sensing jobs required in the example of Section 6 (to recreate all image- point gathers needed for a depth slice of dimensions 210 x 195). With 500 instances (machines in the cloud) we completed all jobs in about 4 hours. The availability of a very large number of computers, just and only when needed and at a very low cost, was a fundamental research-enabling tool. Cloud computing facilitated our work, allowing an efficiency not possible with traditional venues. Learning and effectively using cloud computing was an unanticipated but valuable part of our project.
References [1] Agrawal, A., (2003), The economic feasibility of enhanced coalbed methane recovery using CO2 sequestration in the San Juan Basin, Texas A&M University, Thesis. [2] Arogunmati, A. and J., Harris, (2010), A data-estimation based approach for quasi-continuous reservoir monitoring using sparse surface seismic data, 72nd EAGE Conference & Exhibition, Extended Abstracts. [3] Baysal, E., D. D. Kosloff, and J. W. C. Sherwood, (1983), Reverse time migration, Geophysics, 48, no. 11, 1514-1524. [4] Bevc, D., Donoho, D. L., and Zarantonello, S. E., (2004), Application of 2nd generation wavelets in seismic imaging, Proceedings of 74’th Ann. Internat. Mtg: Soc. of Expl. Geophys, , Extended Abstracts. [5] Candès E., J. Romberg, and T. Tao. (2006), Robust uncertainty principles: Exact signal reconstruction from highly incomplete frequency information, IEEE Trans. Inf. Theory, 52, No. 2, 489-509. [6] Candès E., and M. Wakin, (2008), An introduction to Compressive Sampling, IEEE Signal Processing Magazine, 21-30.
[7] Cao, W., Schuster, G. T., Zhan, G., Hanafy, S. M., and Boonyasiriwat, C., (2008), Demonstration of Super-Resolution and Super-Stacking Properties of Time Reversal Mirrors in Locating Seismic Sources, University of Utah, Thesis, [8] Donoho, D. (2006), Compressed sensing, IEEE Trans. Inf. Theory, 52, No. 4, 1289-1306. [9] Flores, R. M., (2004), Coalbed methane in the Powder River Basin, Wyoming and Montana: An assessment of the Tertiary-Upper Cretaceous coalbed methane total petroleum system: U.S.Geological Survey Digital Data Series, DDS-69-C, chapter 2. [10] Kuuskraa, V. & R. Ferguson, (2008), Storing CO2 with enhanced oil recovery, DOE/NETL-402/1312/02-07-08. [11] Lustig, M., D. Donoho, and J. Pauly, (2007), Sparse MRI: The application of compressed sensing for rapid MR imaging, Magnetic Resonance in Medicine, 58, 1182–1195. [12] Mallat, S., (2008), A wavelet tour of signal processing - The sparse way, Third edition. Academic Press, Chapter 12. [13] Mavko, G., Mukerji, T., and Dvorkin, J., (2003), “The Rock Physics Handbook: Tools for Seismic Analysis of Porous Media”, Cambridge University Press. [14] Morton, S., (2009), “Seismic Imaging Experiences on GPUs”, High Performance Computing Workshop, International Meeting, Soc. of Expl. Geophys. Houston, 2009. [15] Nemeth, T. N., Wu, C. W., and Schuster, G. T., (1999), “Least-squares migration of incomplete reflection data”, Geophysics 64, 208–221.
Proc. of SPIE Vol. 8056 80560C-8
Downloaded from SPIE Digital Library on 02 Dec 2011 to 171.64.173.107. Terms of Use: http://spiedl.org/terms

[15] Nguyen, N., (2000), “Numerical Techniques for Image Superresolution”. Stanford University, PhD thesis. [16] Prusty, B.K., (2008), “Sorption of methane and CO2 for enhanced coalbed methane recovery and carbon dioxide sequestration”, Journal of Natural Gas Chemistry, Elsevier B.V. [17] Ross, H. (2007), “Carbon Dioxide Sequestration and Enhanced Coalbed Methane Recovery in unmineable coalbeds of the Powder River Basin, Wyoming”, Ph.D. thesis, Stanford University. [18] Selesnick, I., R. Van Slyke and O. Guleryuz, (2004), “Pixel recovery via L1 minimization in the wavelet domain”, 2004 International Conference on Image Processing (ICIP), 3, 1819-1822. [19] Sengupta, M., G. Mavko, and T. Mukerji, (2003). “Quantifying sub resolution saturation scales from time-lapse seismic data, a reservoir monitoring case study”, Geophysics, 68, pp 803-814. [20] Zarantonello, S. E., and Bevc, D., (2005), “Compression of seismic data using ridgelets”, Proceedings of 75’th Ann. Internat. Mtg: Soc. of Expl. Geophys. , Extended Abstracts. [21] Zarantonello, S.E., Bevc, D., Harris, J.M., (2010), “Integrated Reservoir, petrophysical, and seismic simulation of CO2 storage in coal beds”, The Leading Edge, 2010, Vol 29, No. 2, pp184-190 [22] Zhang, Y., (2006), “When is missing data recoverable”, CAAM Technical Report TR06-15 Department of Computational and Applied Mathematics, Rice University. _____________________________________________
The first author and third author were supported by the United States Department of Energy through Grant Number DE_SC0004402 .
Proc. of SPIE Vol. 8056 80560C-9
Downloaded from SPIE Digital Library on 02 Dec 2011 to 171.64.173.107. Terms of Use: http://spiedl.org/terms