Auroral magnetospheric cyclotron emission processes: numerical and experimental simulations
12
This content has been downloaded from IOPscience. Please scroll down to see the full text. Download details: IP Address: 138.251.254.238 This content was downloaded on 12/12/2013 at 09:52 Please note that terms and conditions apply. Auroral magnetospheric cyclotron emission processes: numerical and experimental simulations View the table of contents for this issue, or go to the journal homepage for more 2011 Plasma Phys. Control. Fusion 53 074015 (http://iopscience.iop.org/0741-3335/53/7/074015) Home Search Collections Journals About Contact us My IOPscience
-
Upload
st-andrews -
Category
Documents
-
view
1 -
download
0
Transcript of Auroral magnetospheric cyclotron emission processes: numerical and experimental simulations
This content has been downloaded from IOPscience. Please scroll down to see the full text.
Download details:
IP Address: 138.251.254.238
This content was downloaded on 12/12/2013 at 09:52
Please note that terms and conditions apply.
Auroral magnetospheric cyclotron emission processes: numerical and experimental
simulations
View the table of contents for this issue, or go to the journal homepage for more
2011 Plasma Phys. Control. Fusion 53 074015
(http://iopscience.iop.org/0741-3335/53/7/074015)
Home Search Collections Journals About Contact us My IOPscience
IOP PUBLISHING PLASMA PHYSICS AND CONTROLLED FUSION
Plasma Phys. Control. Fusion 53 (2011) 074015 (11pp) doi:10.1088/0741-3335/53/7/074015
Auroral magnetospheric cyclotron emission processes:numerical and experimental simulations
K Ronald1, D C Speirs1, S L McConville1, K M Gillespie1, A D R Phelps1,R Bingham1,2, I Vorgul3, R A Cairns3, A W Cross1, C W Robertson1,C G Whyte1, W He1 and B J Kellett2
1 SUPA, Department of Physics, University of Strathclyde, Glasgow, G4 0NG, UK2 STFC Rutherford Appleton Laboratory, Chilton, Didcot, Oxfordshire, OX11 0QX, UK3 School of Mathematics and Statistics, University of St Andrews, Fife, KY16 9SS, UK
E-mail: [email protected]
Received 7 October 2010, in final form 30 January2011Published 18 May 2011Online at stacks.iop.org/PPCF/53/074015
AbstractSatellites have observed powerful radio waves (up to 1 GW peaked at 300 kHz)radiating from regions of reduced plasma density about 3200 km above theEarth’s surface in the polar magnetosphere. The emission is associated withthe observation of horseshoe or ‘shell’ distributions in the velocity space ofthe Earthbound flux of electrons, arising from magnetic compression. It hasbeen postulated that this distribution holds the free energy required to explainthe radiation emission. To verify this proposition, a series of numerical andexperimental simulations of the mechanism scaled to microwave frequencieshave been conducted in concert with a theoretical analysis of the growth rateand propagation of the resultant radiation. The numerical simulations wereconducted with electron beams of 75 keV and currents of 18 and 34 A gyratingin a magnetic field of 0.18 T, and 85 keV and 18 A in a magnetic field of 0.48 T.The simulations predicted that the radiation would be emitted close to thecyclotron frequency (4.42 and 11.7 GHz) in near cut-off TE modes (TE0,1 andTE0,3/TE2,3, respectively) with efficiencies of 2% and 1.3%. The experimentalmeasurements demonstrated mode content very close to that predicted by thesimulations with output powers of 19 kW and 35 kW from electron beamsof 75 keV energy and 12 A and 34 A of current, respectively, at 4.42 GHz.Powers of 9.4 kW and 30 kW from 85 keV electron beams of 12 and 30 A wereobserved at 11.7 GHz. The spectral, polarization and propagation propertiesof the radiation are similar to those observed in the magnetosphere. A schemewill be outlined for introducing a background plasma into the apparatus, withωpe < ωce/10 to enhance the comparison with the auroral magnetosphere.
(Some figures in this article are in colour only in the electronic version)
0741-3335/11/074015+11$33.00 © 2011 IOP Publishing Ltd Printed in the UK & the USA 1
Plasma Phys. Control. Fusion 53 (2011) 074015 K Ronald et al
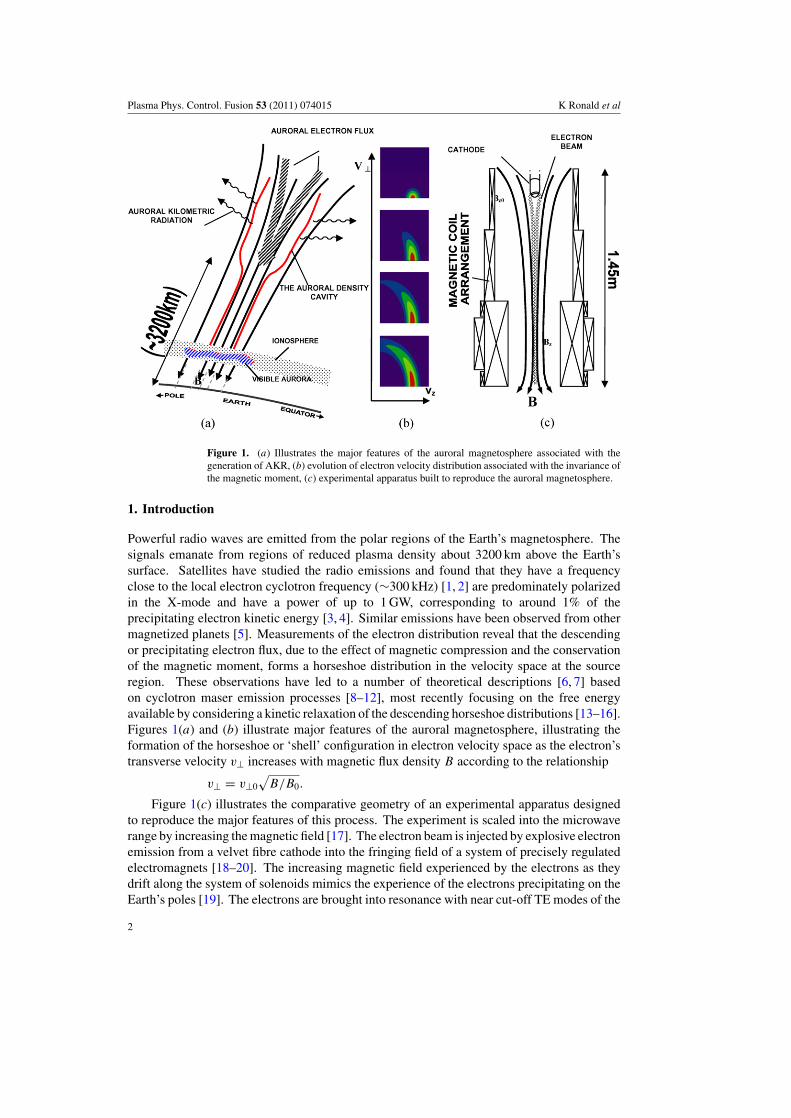
Figure 1. (a) Illustrates the major features of the auroral magnetosphere associated with thegeneration of AKR, (b) evolution of electron velocity distribution associated with the invariance ofthe magnetic moment, (c) experimental apparatus built to reproduce the auroral magnetosphere.
1. Introduction
Powerful radio waves are emitted from the polar regions of the Earth’s magnetosphere. Thesignals emanate from regions of reduced plasma density about 3200 km above the Earth’ssurface. Satellites have studied the radio emissions and found that they have a frequencyclose to the local electron cyclotron frequency (∼300 kHz) [1, 2] are predominately polarizedin the X-mode and have a power of up to 1 GW, corresponding to around 1% of theprecipitating electron kinetic energy [3, 4]. Similar emissions have been observed from othermagnetized planets [5]. Measurements of the electron distribution reveal that the descendingor precipitating electron flux, due to the effect of magnetic compression and the conservationof the magnetic moment, forms a horseshoe distribution in the velocity space at the sourceregion. These observations have led to a number of theoretical descriptions [6, 7] basedon cyclotron maser emission processes [8–12], most recently focusing on the free energyavailable by considering a kinetic relaxation of the descending horseshoe distributions [13–16].Figures 1(a) and (b) illustrate major features of the auroral magnetosphere, illustrating theformation of the horseshoe or ‘shell’ configuration in electron velocity space as the electron’stransverse velocity v⊥ increases with magnetic flux density B according to the relationship
v⊥ = v⊥0
√B/B0.
Figure 1(c) illustrates the comparative geometry of an experimental apparatus designedto reproduce the major features of this process. The experiment is scaled into the microwaverange by increasing the magnetic field [17]. The electron beam is injected by explosive electronemission from a velvet fibre cathode into the fringing field of a system of precisely regulatedelectromagnets [18–20]. The increasing magnetic field experienced by the electrons as theydrift along the system of solenoids mimics the experience of the electrons precipitating on theEarth’s poles [19]. The electrons are brought into resonance with near cut-off TE modes of the
2

Plasma Phys. Control. Fusion 53 (2011) 074015 K Ronald et al
resonant waveguide, 8.28 cm diameter, at the 20 cm long maximum plateau of the magneticfield system [21]. These modes have their E-field and propagation wavevector perpendicular tothe waveguide axis (and hence the bias magnetic field), hence presenting a first approximationto the X-mode [21]. The electron beam was measured using a Faraday cup [19] whilst themicrowave measurements were obtained by receiving waveguide stub antennae in the farfield of the experiment’s output aperture [21]. The angular pattern of the microwave signalmeasured by adjusting the position of the receiving antenna identified the radiation mode,which was integrated to yield the output power from the experiment, allowing the efficiencyto be calculated. The microwave frequency was obtained by Fourier transform of the signalrecorded on a 12 GHz real time oscilloscope. The Faraday cup combined with progressivemagnetic mirroring allowed the estimation of the electron velocity distribution function.
2. Numerical simulations
Numerical simulations have been conducted using the 2D and 3D versions of the FDTD PiCcode KARAT [22–24]. Since the most important question to be addressed by the programmewas the efficiency of wave generation supported by the electron horseshoe distributions inelectron velocity space, experimental measurements of the electron beam in the interactionspace [19, 25] were used to define the electron distribution functions used in the interactionwaveguide of the simulations. This allows direct, meaningful comparisons between thepredicted and observed microwave generation process [23, 25]. Two regimes were investigatedin the experiments [22, 23, 25], at cyclotron frequencies of around 11.7 GHz and 4.42 GHz,respectively.
The 2D simulations were conducted in the r–z axisymmetric version of the PiC code,which cannot describe fields which vary in the θ direction (i.e. it could only considerinteraction with the TE0,n modes of the waveguide); however, since the waveguide walls areconformal in this geometry, the accuracy of the boundary conditions is high. These simulationswere ‘whole experiment’ calculations over the interaction space and the electron injector.The 3D simulations were conducted in x–y–z Cartesian geometry to avoid the difficultiesassociated with the near axis mesh cells in 3D r , θ , z models; however, this of course leadsto approximations representing the cylindrical boundaries. In the 3D simulations only theinteraction waveguide was modelled (the electron injector would require too much computermemory) and the electron beam was injected into a uniform region of magnetic field with anumerically defined horseshoe velocity distribution. The resolution was determined by theradiation wavelength, the need to resolve the potentially high order transverse mode structureand the location of the waveguide walls. The resolution was varied by up to a factor of 2 to checkthat the results were not strongly sensitive to the configuration of the code, whilst parameterssuch as energy conservation were monitored and the E and B field strengths monitored acrossthe entire simulation region to guard against numerical instability. A merging factor of 3×10⁶–3 × 10⁷ real electrons per PiC particle was used. Details of the simulation parameters are intable 1.
2.1. Simulations of 11.7 GHz resonance
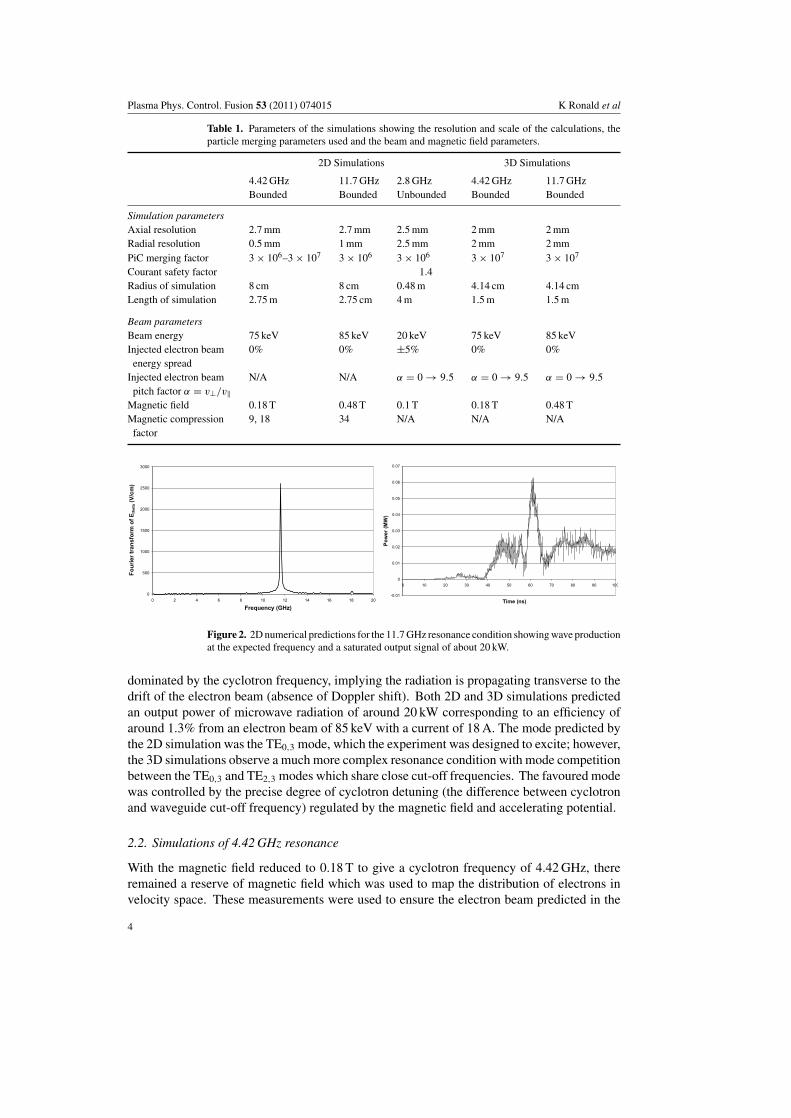
The 11.7 GHz resonance condition corresponds to a wavelength of 2.56 cm, in a waveguideof 8.28 cm diameter, this allows for several wavelengths across the interaction waveguide,similar to the magnetospheric conditions where the overall transverse size is many times thewavelength. This gives the potential for transverse phase variation in the radiation. The resultsof the simulations are shown in figures 2 and 3. The frequency of the output radiation is
3
Plasma Phys. Control. Fusion 53 (2011) 074015 K Ronald et al
Table 1. Parameters of the simulations showing the resolution and scale of the calculations, theparticle merging parameters used and the beam and magnetic field parameters.
2D Simulations 3D Simulations
4.42 GHz 11.7 GHz 2.8 GHz 4.42 GHz 11.7 GHzBounded Bounded Unbounded Bounded Bounded
Simulation parametersAxial resolution 2.7 mm 2.7 mm 2.5 mm 2 mm 2 mmRadial resolution 0.5 mm 1 mm 2.5 mm 2 mm 2 mmPiC merging factor 3 × 10⁶–3 × 10⁷ 3 × 10⁶ 3 × 10⁶ 3 × 10⁷ 3 × 10⁷
Courant safety factor 1.4Radius of simulation 8 cm 8 cm 0.48 m 4.14 cm 4.14 cmLength of simulation 2.75 m 2.75 cm 4 m 1.5 m 1.5 m
Beam parametersBeam energy 75 keV 85 keV 20 keV 75 keV 85 keVInjected electron beam 0% 0% ±5% 0% 0%
energy spreadInjected electron beam N/A N/A α = 0 → 9.5 α = 0 → 9.5 α = 0 → 9.5pitch factor α = v⊥/v‖
Magnetic field 0.18 T 0.48 T 0.1 T 0.18 T 0.48 TMagnetic compression 9, 18 34 N/A N/A N/A
factor
0
500
1000
1500
2000
2500
3000
0 2 4 6 8 10 12 14 16 18 20
Frequency (GHz)
Fo
uri
er
tran
sfo
rm o
f E
the
ta (
V/c
m)
-0.01
0
0.01
0.02
0.03
0.04
0.05
0.06
0.07
0 10 20 30 40 50 60 70 80 90 100
Time (ns)
Po
wer
(MW
)
Figure 2. 2D numerical predictions for the 11.7 GHz resonance condition showing wave productionat the expected frequency and a saturated output signal of about 20 kW.
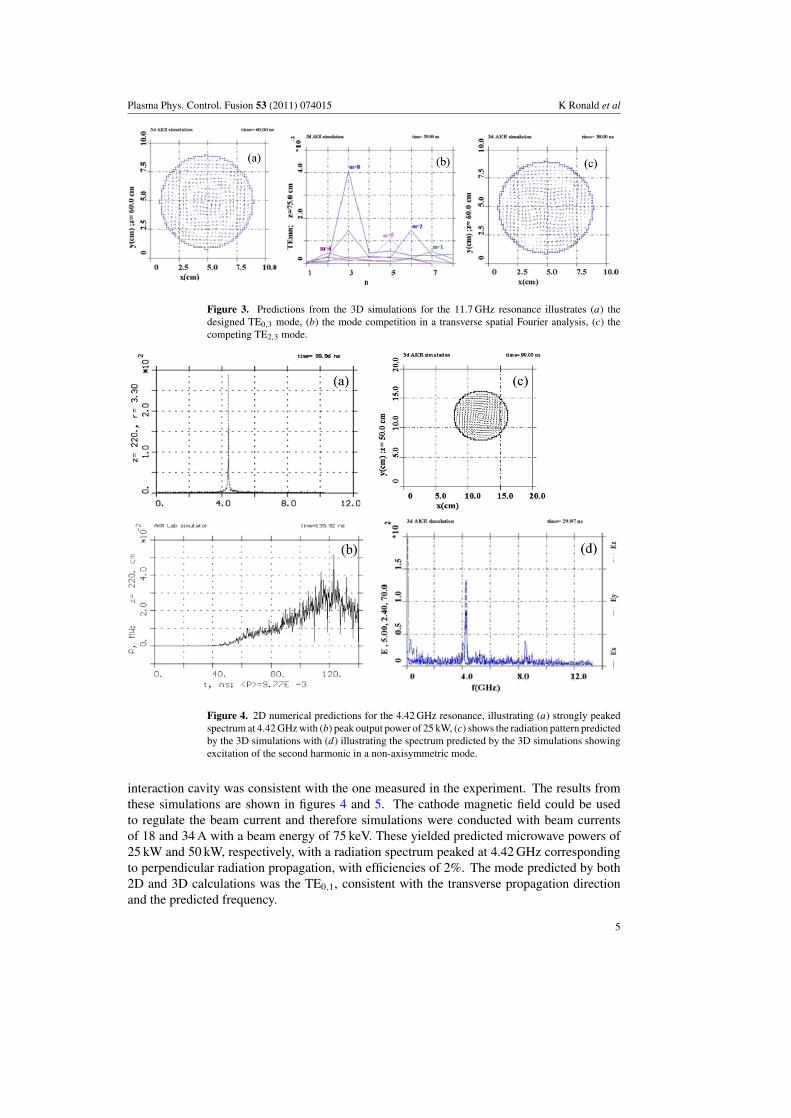
dominated by the cyclotron frequency, implying the radiation is propagating transverse to thedrift of the electron beam (absence of Doppler shift). Both 2D and 3D simulations predictedan output power of microwave radiation of around 20 kW corresponding to an efficiency ofaround 1.3% from an electron beam of 85 keV with a current of 18 A. The mode predicted bythe 2D simulation was the TE0,3 mode, which the experiment was designed to excite; however,the 3D simulations observe a much more complex resonance condition with mode competitionbetween the TE0,3 and TE2,3 modes which share close cut-off frequencies. The favoured modewas controlled by the precise degree of cyclotron detuning (the difference between cyclotronand waveguide cut-off frequency) regulated by the magnetic field and accelerating potential.
2.2. Simulations of 4.42 GHz resonance
With the magnetic field reduced to 0.18 T to give a cyclotron frequency of 4.42 GHz, thereremained a reserve of magnetic field which was used to map the distribution of electrons invelocity space. These measurements were used to ensure the electron beam predicted in the
4
Plasma Phys. Control. Fusion 53 (2011) 074015 K Ronald et al
Figure 3. Predictions from the 3D simulations for the 11.7 GHz resonance illustrates (a) thedesigned TE0,3 mode, (b) the mode competition in a transverse spatial Fourier analysis, (c) thecompeting TE2,3 mode.
Figure 4. 2D numerical predictions for the 4.42 GHz resonance, illustrating (a) strongly peakedspectrum at 4.42 GHz with (b) peak output power of 25 kW, (c) shows the radiation pattern predictedby the 3D simulations with (d) illustrating the spectrum predicted by the 3D simulations showingexcitation of the second harmonic in a non-axisymmetric mode.
interaction cavity was consistent with the one measured in the experiment. The results fromthese simulations are shown in figures 4 and 5. The cathode magnetic field could be usedto regulate the beam current and therefore simulations were conducted with beam currentsof 18 and 34 A with a beam energy of 75 keV. These yielded predicted microwave powers of25 kW and 50 kW, respectively, with a radiation spectrum peaked at 4.42 GHz correspondingto perpendicular radiation propagation, with efficiencies of 2%. The mode predicted by both2D and 3D calculations was the TE0,1, consistent with the transverse propagation directionand the predicted frequency.
5

Plasma Phys. Control. Fusion 53 (2011) 074015 K Ronald et al
Figure 5. 2D numerical predictions for the 4.42 GHz resonance condition showing the evolutionof the electron velocity distribution in (a), (b) vr , vθ space illustrating rotational phase bunchingdue to RF interaction and (c), (d) v⊥, v‖ space illustrating the evolution of the horseshoe velocitydistribution as it surrenders free energy to the wave.
2.3. Unbounded simulations
A significant difference between the experiment and the magnetosphere is the presence of hardradiation boundaries necessitated by the magnet coils in the experiment. In the magnetosphere,although theories have supposed that variation in the plasma density across the source regioncan give rise to a reflective or partially reflective boundary, these boundaries are inherentlyless robust than the stainless steel cylindrical waveguide used in the experiment. Given thatthe KARAT simulations had been successfully benchmarked against the experiments, it wasdecided to use the code to study the emissions from an electron beam gyrating in a magneticfield in the absence of radiation boundaries [26]. In this case the magnetic field was selectedto be 0.1 T, whilst the electron beam was defined to be a uniform distribution horseshoe invelocity space of energy 20 keV with a spread of 5% and a current of 14 A. The beam driftedthrough a hole in the centre of a dielectric absorber with a radially increasing conductivitywhilst radial radiation egress was permitted. The simulations showed radiation emission in thebackward wave mode, which required a significantly greater distance to grow (approximately0.5 m) from noise. The ac oscillation in the radial Poynting flux indicates an emitted outputpower of some 3 kW at a frequency of 2.68 GHz, figure 6, corresponding to an efficiency of alittle over 1%. These simulations, however, show that the instability can develop even in theabsence of strong feedback.
6

Plasma Phys. Control. Fusion 53 (2011) 074015 K Ronald et al
Figure 6. Predictions of unbounded radio emission process, (a) Poynting’s flux showing 3 kWoscillation corresponding to the radiation frequency, (b) FFT of the Eθ component of the ac field,(c) the evolution of the electron horseshoe velocity distribution as the electrons interact with theEM field, (d) The spatial distribution and propagation of the electric field amplitude.
3. Experimental measurements
The experiments used stub receiving waveguide antennae [21, 25] in the far field of theapparatus output antenna to measure the output radiation amplitude as a function of time andposition, yielding the radiation mode and hence its propagation and polarization propertieswhen combined with a spectral measurement by FFT on a real time 12 GHz CRO [21, 25].Integration of the antenna pattern yielded the output power [21, 25] whilst the electron currentand velocity distribution were measured by a Faraday cup [19, 25].
3.1. Experimental measurements, resonance at 11.7 GHz
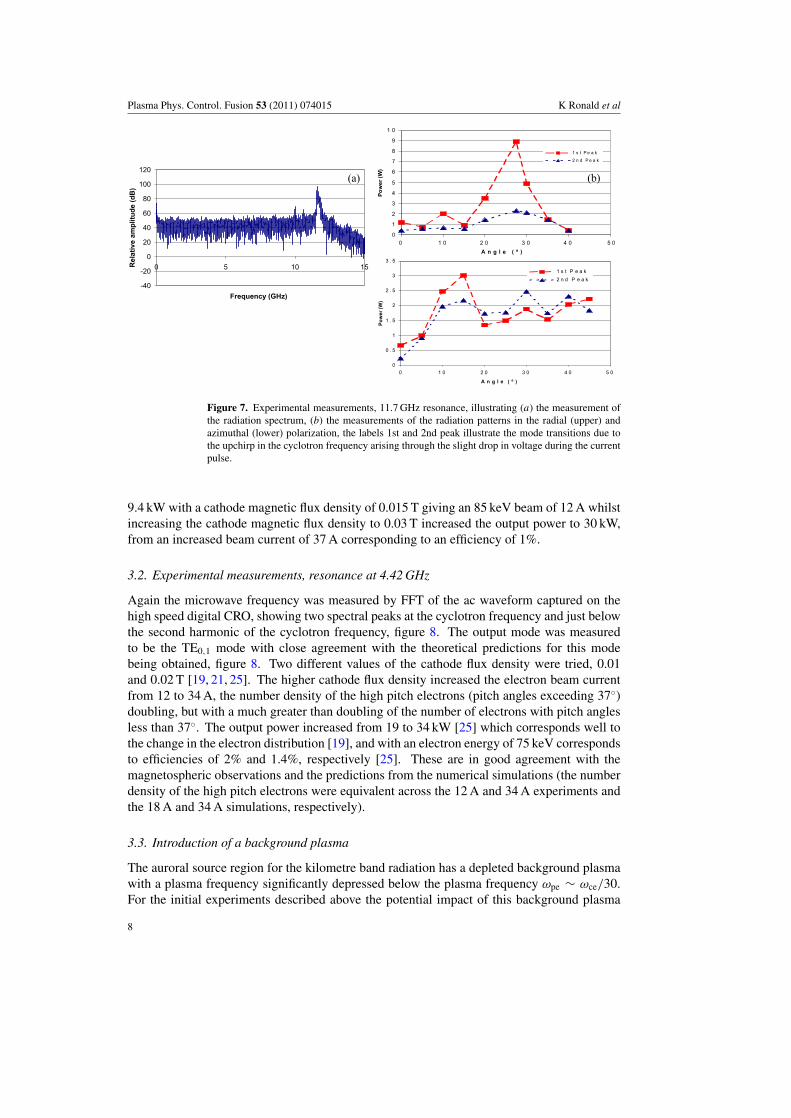
The microwave frequency was measured by FFT of the real time ac waveform, confirmed bywaveguide cut-off filters as being 11.7 GHz, close to the cyclotron frequency and the cut-offof the TE0,3 mode predicted by the 2D simulations, figure 7. The antenna patterns illustratedstrong mode competition, figure 7, as predicted by the 3D PiC simulations, the TE0,3 andTE2,3 modes being most significant, with significant mode hopping occurring as the electronbeam energy dropped slightly during its 100 ns duration, the mode switching as the cyclotrondetuning changed (1st and 2nd peaks in figure 7(b)). The peak output power observed inthe experiment was obtained by integration of the antenna patterns and was measured to be
7
Plasma Phys. Control. Fusion 53 (2011) 074015 K Ronald et al
-40
-20
0
20
40
60
80
100
120
0 5 10 15
Frequency (GHz)
Re
lati
ve
am
plitu
de
(d
B)
0
0 . 5
1
1 . 5
2
2 . 5
3
3 . 5
0 1 0 2 0 3 0 4 0 5 0
A n g l e ( º )P
ow
er
(W)
1 s t P e a k
2 n d P e a k
0
1
2
3
4
5
6
7
8
9
1 0
0 1 0 2 0 3 0 4 0 5 0
A n g l e ( º )
Po
we
r (W
)
1 s t P e a k
2 n d P e a k
(a) (b)
Figure 7. Experimental measurements, 11.7 GHz resonance, illustrating (a) the measurement ofthe radiation spectrum, (b) the measurements of the radiation patterns in the radial (upper) andazimuthal (lower) polarization, the labels 1st and 2nd peak illustrate the mode transitions due tothe upchirp in the cyclotron frequency arising through the slight drop in voltage during the currentpulse.
9.4 kW with a cathode magnetic flux density of 0.015 T giving an 85 keV beam of 12 A whilstincreasing the cathode magnetic flux density to 0.03 T increased the output power to 30 kW,from an increased beam current of 37 A corresponding to an efficiency of 1%.
3.2. Experimental measurements, resonance at 4.42 GHz
Again the microwave frequency was measured by FFT of the ac waveform captured on thehigh speed digital CRO, showing two spectral peaks at the cyclotron frequency and just belowthe second harmonic of the cyclotron frequency, figure 8. The output mode was measuredto be the TE0,1 mode with close agreement with the theoretical predictions for this modebeing obtained, figure 8. Two different values of the cathode flux density were tried, 0.01and 0.02 T [19, 21, 25]. The higher cathode flux density increased the electron beam currentfrom 12 to 34 A, the number density of the high pitch electrons (pitch angles exceeding 37◦)doubling, but with a much greater than doubling of the number of electrons with pitch anglesless than 37◦. The output power increased from 19 to 34 kW [25] which corresponds well tothe change in the electron distribution [19], and with an electron energy of 75 keV correspondsto efficiencies of 2% and 1.4%, respectively [25]. These are in good agreement with themagnetospheric observations and the predictions from the numerical simulations (the numberdensity of the high pitch electrons were equivalent across the 12 A and 34 A experiments andthe 18 A and 34 A simulations, respectively).
3.3. Introduction of a background plasma
The auroral source region for the kilometre band radiation has a depleted background plasmawith a plasma frequency significantly depressed below the plasma frequency ωpe ∼ ωce/30.For the initial experiments described above the potential impact of this background plasma
8

Plasma Phys. Control. Fusion 53 (2011) 074015 K Ronald et al
Figure 8. Experimental measurements, 4.42 GHz resonance, illustrating (a) the spectrum of theoutput signal, displaying a strong resonance close to the cyclotron frequency, 4.42 GHz and a weaksecond harmonic at just under 9 GHz, and (b) the antenna patterns confirming the excitation of nearcut-off modes and yielding the efficiency by integration. The increase in output power associatedwith the increase in beam power with cathode magnetic field strength (0.01–0.02 T) is apparent.
Figure 9. Measurements of (a) temporal evolution of Penning discharge, (b) corresponding I–V
characteristics.
was ignored and the experiments were conducted with an electron beam drifting through avacuum chamber. Cyclotron emissions from an energetic electron beam will be close to theupper hybrid absorption band of the thermal background plasma [27]. It was therefore decidedthat a low temperature thermal background plasma would be added to the experiment. Thedifficulty in this process is that in order to ensure collisionless propagation of the electronbeam, the mean free path for the thermal electrons had to exceed the size of the apparatus.However, the experiment already contained an axial magnetic field which enabled the formationof a Penning discharge whereby electrons are electrostatically confined by means of a pair ofcathodes, normal to the magnetic flux direction and placed at the ends of the plateau of themagnetic field system. One of these cathodes was constructed to ensure that the radiationcould propagate through it without impediment. By biasing these cathodes up to several kVnegative with respect to the waist of the trap region it was possible to ignite the discharge dueto the electrons being confined axially by the electrostatic repulsion and radially by the Lorentzforce. Temporal evolution of the discharge current and voltage is illustrated in figure 9(a),whilst figure 9(b) illustrates these quantities plotted against each other. It is interesting tonote that the discharge requires approximately 4 kV to ignite but is then sustained at the lower
9
Plasma Phys. Control. Fusion 53 (2011) 074015 K Ronald et al
voltage of 1 kV, with the current and voltage initially showing a regime of negative differentialresistance until reaching a condition where the current increases almost independent of thevoltage, reaching up to 2 mA, limited by the power supply. This is reminiscent of the transitionfrom Townsend breakdown to glow discharge in higher pressure discharges. The dischargechamber was 7 cm in diameter and 20 cm long.
4. Summary and future work
This paper has summarized experimental and numerical progress towards reproducing themajor aspects of the electrodynamics of the auroral magnetosphere. The numerical simulationshave predicted that the horseshoe velocity distributions are indeed unstable to the emission oftransverse propagating and transverse polarized EM radiation, both in the presence and theabsence of radiation boundaries, with efficiencies of around 1–2%. These results are closelyconfirmed by the experimental measurements. The simulations also accurately predict thespectra, modes and mode competition observed in the experiment. The simulations undertakenwithout radiation boundaries imply that the evolution of the instability occurs over a longerspatial extent than is required when the strong feedback is present, and has a component of itspropagation direction in the direction opposite to the drift of the electron beam. These resultsare similar to the measurements of the auroral process strongly supporting the propositionthat the cyclotron maser instability in the descending electron flux is responsible for AKR.It has proven possible to ignite a discharge in the experimental source region, which willallow the study of any impact the background plasma may have on the wave productionprocess.
Acknowledgments
The authors would like to thank Mr I S Dinwoodie and Mr D Barclay for their assistance withbuilding the apparatus, Professor V L Tarakanov for assistance with the numerical simulationsand Professor A Savilov for helpful discussions. The EPSRC and the STFC Centre forFundamental Physics are thanked for their sponsorship of this research.
References
[1] Delory G T et al 1998 Geophys. Res. Lett. 25 2069–72[2] Ergun R E et al 2000 Astrophys. J. 538 456–66[3] Gurnett D A 1974 J. Geophys. Res. 79 4227–38[4] Pritchett P L and Strangeway R J 1985 J. Geophys. Res. 90 9650–62[5] Zarka P 1992 Adv. Space Res. 12 99[6] Wagner J S et al 1984 Radio Sci. 19 509–18[7] Wu C S and Lee L C 1979 Astrophys. J. 230 621–6[8] Bingham R and Cairns R A 2000 Phys. Plasmas 7 3089–92[9] Twiss R Q 1958 Aust. J. Phys. 11 564–79
[10] Gaponov A V 1959 Izv. VUZ. Radiofizika 2 450–62Gaponov A V 1959 Izv. VUZ. Radiofizika 2 837
[11] Sprangle P and Drobot A T 1977 IEEE Trans. Microw. Theory Tech. 25 528–44[12] Chu K R 2004 Rev. Mod. Phys. 76 489–540[13] Bingham R and Cairns R A 2002 Phys. Scr. T98 160–2[14] Bingham R et al 2004 Contrib. Plasma Phys. 44 382–7[15] Vorgul I et al 2005 Phys. Plasmas 12 122903[16] Melrose D B 2009 Universal Heliophysical Processes Proc. IAU Symp. 257 305–15[17] Cairns R A et al 2005 Phys. Scr. T116 23–6
10
Plasma Phys. Control. Fusion 53 (2011) 074015 K Ronald et al
[18] Ronald K et al 1998 IEEE Trans. Plasma Sci. PS-26 375–82[19] Ronald K et al 2008 Plasma Sources Sci. Technol. 17 035011[20] Mesyats G A and Proskurovski D I 1989 Pulsed Electrical Discharges in Vacuum (Berlin: Springer) ISBN
3540507256[21] Ronald K et al 2008 Phys. Plasmas 15 056503[22] Speirs D C et al 2005 J. Plasma Phys. 71 665–74[23] Speirs D C et al 2008 Plasma Phys. Control. Fusion 50 074011[24] Gillespie K M et al 2008 Plasma Phys. Control. Fusion 50 124038[25] McConville S L et al 2008 Plasma Phys. Control. Fusion 50 074010[26] Speirs D C et al 2010 Phys. Plasmas 17 056501[27] Allen J E and Phelps A D R 1977 Rep. Prog. Phys. 40 1305–68
11


![CYCLOTRON PRODUCED RADIONUCLIDES:GUIDANCE ON FACILITY DESIGN AND PRODUCTION OF [18F]FLUORODEOXYGLUCOSE (FDG)](https://static.fdokumen.com/doc/165x107/631647d8c32ab5e46f0db468/cyclotron-produced-radionuclidesguidance-on-facility-design-and-production-of-18ffluorodeoxyglucose.jpg)