Cyclotron radiation from electron streams gyrating in the ...

Mansoura University Faculty of ScienceDepartment of Physics
STUDY OF THE EXCITATION FUNCTIONS FOR SOMECYCLOTRON PRODUCED RADIONUCLIDES
A Thesis
Presented by
Mohsen Bekheet MohamedLecturer Assistant
Experimental Nuclear Physics Department (Cyclotron Project)Nuclear Research Center – Atomic Energy Authority
Supervisors
Prof. Dr. M. A. Abou-ZeidProf. of Nuclear Physics – Physics Department
Faculty of Science – Mansoura University
Prof. Dr. M. N. H. ComsanProf. of Nuclear Physics – Experimental Nuclear Physics Department
Nuclear Research Center – Atomic Energy Authority
Submitted for the Ph. D. Degree of Science, Physics
(Experimental Physics).
2006

II

III
Mansoura University Faculty of ScienceDepartment of Physics
SUPERVISORS COMMITTEE
Thesis Title:
STUDY OF THE EXCITATION FUNCTIONS FOR SOMECYCLOTRON PRODUCED RADIONUCLIDES
Presented by: Mohsen Bekheet Mohamed
Supervisors Committee:
Name/Position SignatureProf. Dr. Mahmoud A. M. Abou-ZeidProf. of Nuclear Physics, Faculty of Science,Mansoura University.Prof. Dr. Mohamed N. H. ComsanProf. of Nuclear Physics, Experimental NuclearPhysics Department, Nuclear Research Center,Atomic Energy Authority.
Head of Physics Vice-Dean Dean Department
Prof. Dr. M. A. Madkour Prof. Dr. E. M. Elabbasy Prof. Dr. T. Z. Sokkar

IV

V
Mansoura University Faculty of ScienceDepartment of Physics
REFEREES COMMITTEEThesis Title:
STUDY OF THE EXCITATION FUNCTIONS FOR SOMECYCLOTRON PRODUCED RADIONUCLIDES
Presented by: Mohsen Bekheet Mohamed
Supervisors Committee:Name/Position Signature
Prof. Dr. Mahmoud A. M. Abou-ZeidProf. of Nuclear Physics, Faculty of Science,Mansoura University.Prof. Dr. Mohamed N. H. ComsanProf. of Nuclear Physics, Experimental NuclearPhysics Department, Nuclear Research Center,Atomic Energy Authority.
Referees Committee:Name/Position Signature
Prof. Dr. Ibrahim. I. M. BondoukFaculty of Science, Tanta University.Prof. Dr. Fayez M. A. ShahinFaculty of Science, Bani-Swaif University.Prof. Dr. Mohamed N. H. ComsanNuclear Research Center, Atomic Energy Authority.Prof. Dr. Mahmoud A. M. Abou-ZeidFaculty of Science, Mansoura University.
Head of Physics Vice-Dean Dean Department
Prof. Dr. M. A. Madkour Prof. Dr. E. M. Elabbasy Prof. Dr. T. Z. Sokkar

VI

VII
CONTENTS
Acknowledgment Abstract List of Figures List of Tables
Chapter I
General Introduction
1-1 Introduction 11-2 Reaction Q-Values, and Thresholds 21-3 Status of Available Nuclear Data 51-4 Nuclear Data Needs and Compilation 71-5 Cyclotron Production of Medically Used Radionuclides 9
1-5.1 Target Chemistry and Targetry 131-5.2 High Current Irradiation at Cyclotrons 14
1-6 Calculation of the Activation Cross-Section 161-6.1 Cumulative Cross-Sections 211-6.2 Isomeric Cross Section Ratios 23
1-7 Yield, and Effective Cross Section 241-7.1 Production Cross-Section 251-7.2 Production Yield 251-7.3 Thin Target Yield, Effective Cross Section 281-7.4 Thick Target Yield Calculation 29
1-8 The Aim of the Present Study 31
Chapter II
Literature Review
2-1 Literature Review 332-1.1 Technetium-99m 332-1.2 Technetium-99m Analogues 372-1.3 Terbium 38
2-2 Summary of Earlier Investigations 40

VIII
Chapter III
Experimental Techniques and Measurements
3-1 Introduction 433-2 The Cyclotron 433-3 Stacked Foils Technique 483-4 Calibration of Cyclotron Beam Energy 503-5 Beam Intensity Monitoring 533-6 Associated Counting Electronics 54
3-6.1 γ−Spectrometer 543-6.2 HPGe-Detector Efficiency 56
3-7 Analysis of Gamma Spectra 603-7.1 Nuclide Identification 633-7.2 Selection of Reliable Data 673-7.3 Definition of Detection Probability 67
3-8 The Sources of Uncertainties 693-8.1 Uncertainties in Proton Energies, Beam Fluctuation 693-8.2 Uncertainties in Net Peak Area, Decay Data 703-8.3 Uncertainties in the Absolute Efficiency,
Time Factor, and Dead Time 713-8.4 Uncertainties in Irradiated Nuclei, Impurities,
Recoil Contamination 713-8.5 Uncertainties due to γ-Interference, γ-Self-
Absorption, and γ-Attenuation 723-8.6 Uncertainties due to Interfering Processes 733-8.7 Uncertainties due to Random Coincidence Summing 763-8.8 Uncertainties due to True Coincidence 80
3-8.8.1 γ−γ Coincidence for Extended Sources 823-8.8.2 The Volume Effect Factor FV 853-8.8.3 Peak Area Correction 88
3-8.9 Uncertainties of Fluence Response 913-8.9.1 Neutron-Production Probability 943-8.9.2 Neutron Transmission Probability 97
3-9 Estimated Correction Values for Uncertainty Sources 102

IX
Chapter IV
Nuclear Model Calculations
4-1 Introduction 1054-2 Outline of Nuclear Reaction Mechanisms 1064-3 Description of Code ALICE-91 1064-4 Description of Code EMPIRE-II 109
4-4.1 Multi-Step Direct Model 1114-4.2 Multi-Step Compound Model 1124-4.3 Coupling Between MSC, and MSD 1144-4.4 Exciton Model 1154-4.5 Monte Carlo Preequilibrium Model 1174-4.6 Compound Nucleus Model 1204-4.7 Level Densities 121
4-4.7.1 Gilbert-Cameron Approach 1224-4.7.2 Dynamic Approach 1234-4.7.3 Hartree-Fock-BCS Approach 124
4-4.8 Width Fluctuation Correction 1254-4.9 Flow of EMPIRE-II Calculations 1274-4.10 RIPL-2 Input Parameters Libraries 1294-4.11 Input and Output Files 1314-4.12 Models Compatibility and Priorities 131
Chapter V
Results and Discussion
5-1 Calculation of the Theoretical Cross-Section 1335-1.1 Analysis with Code ALICE-91 1335-1.2 Analysis with Code EMPIRE-II 1345-1.3 Discrete Level Cross Sections 136
5-2 The Excitation Function for Produced Radionuclidesfrom Mo Targets 1425-2.1 The natMo(p,x)92mNb Reaction 1435-2.2 The natMo(p,x)94gTc Reaction 1435-2.3 The natMo(p,x)95gTc Reaction 1465-2.4 The natMo(p,x)95mTc Reaction 1485-2.5 The natMo(p,x)96m+gTc Reaction 1505-2.6 The natMo(p,x)99mTc Reaction 152
5-3 The Excitation Function for Produced Radionuclidesfrom Gd Targets 1555-3.1 The natGd(p,x)152m+gTb Reaction 155

X
5-3.2 The natGd(p,x)154gTb Reaction 1575-3.3 The natGd(p,x)154mTb Reaction 1595-3.4 The natGd(p,x)155Tb Reaction 1615-3.5 The natGd(p,x)156Tb Reaction 1615-3.6 The natGd(p,x)160Tb Reaction 164
5-4 Differential, and Integral Yields for Mo, and Gd Targets 1665-5 Calibration Curves for Thin Layer Activation Technique 1725-6 Discussion 175
5-6.1 Influence of Interfering Processes 1755-6.2 Trends in Integral Cross Sections 1765-6.3 Prospective for Fluence Response Modelling 178
5-7 Conclusion 179References

XI
ACKNOWLEDGMENTThanks to ALLAH who enabled me to perform this work
The author wishes to give his gratitude, appreciation, sincere thanks to:
Prof. Dr. Mohamed N. H. Comsan (supervisor) Professor of NuclearPhysics, Experimental Nuclear Physics Department, Atomic EnergyAuthority, for his scientific support throughout this study. Prof. Comsanwas my supervisor during my M.Sc. degree work and I enjoyed hiskindness and encouragement. I thank him for his keeping the study planeachievable, and steady interest, encouragement feelings, progressivediscussion. He helped me very much to accelerate procedure of the Ph.D.work.
Prof. Dr. Mahmoud A. M. Abou-Zeid (supervisor) Professor ofNuclear Physics, Faculty of Science, Mansoura University for his kindsupervision during this thesis, Prof. Abou-Zeid was my Supervisor duringmy M.Sc. degree work and I enjoyed his kindness and encouragement. Ithank him for the fruitful discussion and for his interest. Also my greatthanks to his nuclear physics group for their interest, all the generousefforts, valuable suggestions, and continuos encouragement.
The Author gratefully acknowledges Prof. Dr. Mohammed A.Madcore the Head of Physics Department, Faculty of Science, MansouraUniversity, and Prof. Dr. Shokry M. Saad the Supervisor of CyclotronProject for their kind help. My deep thanks for Prof. Dr. Zeinab AbduSaleh for here usual helpful, kind support, and Prof. Dr. M. A. Ali for hiskind advice. I am also indebted to Prof. Dr. Samia El-Gibely the Head ofExperimental Nuclear Physics Department, NRC, Atomic EnergyAuthority for her valuable help.
The Author deeply thanks Demonstrator Gamal S. Moawad, Dr. Eng.Adel L. Ismail, Dr. Eng. Mohamed N. El-Shazly, and Mr. Nasr Abd-Alrahman, for their valuable help. My appreciation to the Technical, andOperation Group of the Inshas Cyclotron Facility, Department ofExperimental Nuclear Physics, especially my friend, and colleague M. Sc.Megahed Al-Abyad, for their kind helps in various aspects of experimentpreparation and data collection.

XII

XIII
Abstract
Measurement of reaction cross sections is one of the main aims ofmany experimentalists due to the need of proven cross section data for thereactions. Moreover, the lack and discrepancies among the available dataare still existing. Our concern is focused on targets that can produceradionuclides of main use in nuclear medicine and thin layer activationtechniques.
Excitation functions of some Molybdenum and Gadolinium isotopeswere measured using the gamma spectra from the (p,x) reactions of highpurity natural targets. These reactions could be produced by means ofrelatively low projectile energies.
We measured the excitation functions of (92,94,95,96,97,98,100Mo, and152,154,155,156,157,158,160Gd) reactions induced by protons in the energy rangefrom 5 to 18 MeV.
The measured cross sections have been carried out by applying theactivation technique using a HPGe detector as a γ–ray spectrometer. So, wewere planing to produce a reliable data with the help of multi monitorsimultaneous measurements such as the natTi(p,x)48V, natCu(p,x)62Zn,natCu(p,x)63Zn, natCu(p,x)65Zn. This study was performed at the compactvariable energy cyclotron (VEC), model MGC-20 of the Inshas CyclotronFacility, AEA, Cairo, Egypt.
Since, 99mTc is the power horse among the radionuclides used innuclear medicine, special attention was devoted to its production. Not only99mTc but also some other isotopes such as 94Tc, 95mTc, 95gTc, 96Tc could beproduced from Mo via charged particle induced reactions with its relatedquality and security. We have also chosen the rare earth elementGadolinium as a target to produce Terbium radionuclides(152,154m,154g,155,156,160Tb) of deficient nuclear data. These radionuclides couldbe promising for their radiation characters that nominate its uses in nuclearmedicine, especially 152m+gTb, 154mTb in magnetic resonance imaging,155,156Tb, 160Tb could be used in diagnosis, and therapy, respectively.
We surveyed the existing data for 99mTc production, and found thatfor some works, the results are promising, while the results obtained fromsome others are discrepant. So we here look for a new aspects. Theseaspects are looking for the effects of presence of secondary beams thatcould produce the same reactions, while these particles propagate throughthe stack targets.

XIV
The present study pays attention to investigate the contribution ofsecondary beams. The consideration of presence the secondary beamsenable us to verify this prospective, which providing us with reliablereaction cross sections, a substantial understand information on theinvestigated processes. The data obtained from these measurements couldbe of benefit for routine production of concered radionuclides.
We aimed to investigate to how extent these secondary reactionsmay contribute or not to the essential production cross sections for theseradionuclides. The main induced secondary reactions originate frompropagating protons and neutrons. From the obtained data we calculated theintegrated yield to investigate the possibility of using these reactions indifferent applications technique such as radionuclides production routes,and thin layer activation technique. The yield profile enables us to deducesome criteria in the production process.
Theoretical model calculations using the EMPIRE-II and theALICE-91 codes were undertaken to describe the cross sections of allinduced reactions. In most of the cases, the calculated values fit fairly wellwith the experimental results.

XV
List of Figures
Figure Description Page
Fig. (1-1): Scheme of Disciplines and Activities Involved in aCyclotron Facility. 10
Fig. (3-1): Picture for the 103 AVF (MGC-20) Cyclotron (Level-II) at the Inshas Cyclotron Facility. 45
Fig. (3-2): Layout of Cyclotron and Beam Transport System atthe Cyclotron Laboratory of Inshas MGC-20 (AVF). 46
Fig. (3-3): Stacked Foils Technique Arrangement. 50
Fig. (3-4):Indicates the Agreement between RecommendedCross Section Variation for Monitor Reactions and theCorresponding Experimental Data of this Work.
52
Fig. (3-5): Gamma Ray Spectrometer. 55
Fig. (3-6):Sample of Gamma Ray Spectrum of Natural CopperSample Irradiated with Protons for Beam IntensityMonitoring.
56
Fig. (3-7):Sample of Gamma Ray Spectrum of Natural TitaniumSample Irradiated with Protons for Beam IntensityMonitoring.
57
Fig. (3-8):Absolute Full Energy Peak Efficiency of HPGe-Detector, Experimental Points, and Fitted Curves atDifferent Distance.
58
Fig. (3-9): Evaluation of one Spectrum Peak by Using GaussianFit, and Linear Background Subtraction 59
Fig. (3-10):
Sample of Gamma Ray Spectra of NaturalMolybdenum Sample Irradiated with Protons forReaction Cross Section Measurements one hour afterEOB.
61
Fig. (3-11):
Sample of Gamma Ray Spectra of NaturalMolybdenum Sample Irradiated with Protons forReaction Cross Section Measurements 19 day afterEOB.
61
Fig. (3-12):Sample of Gamma Ray Spectra of Natural GadoliniumSample Irradiated with Protons for Reaction CrossSection Measurements one hour after EOB.
62
Fig. (3-13):Sample of Gamma Ray Spectra of Natural GadoliniumSample Irradiated with Protons for Reaction CrossSection Measurements 10 day after EOB.
62
Fig. (3-14): The Decay Scheme of 96Tc 65Fig. (3-15): The Decay Scheme of 99mTc 65Fig. (3-16): The Decay Scheme of 152Tb 66

XVI
Fig. (3-17): The Decay Scheme of 160Tb 66
Fig. (3-18):
A Simple Decay Scheme Showing (a) True-Coincidence Summing A=B+C. (b) True-CoincidenceLoss γ−γ and γ−KX (IC), and (c) True-CoincidenceLoss γ−γ and γ−KX (EC) Effects.
81
Fig. (3-19):
Neutron Production Cross Section from ProtonInduced Reaction for Natural Gadolinium, andMolybdenum Target Foils as a Function of the ProtonEnergy, Ep up to 20 MeV, ALICE-91 Code.
93
Fig. (3-20):Differential Cross-Section Neutron Spectrum fromNatural Gadolinium, and Molybdenum Target FoilsBombarded with 20 MeV Protons, ALICE-91 Code.
93
Fig. (3-21):
Neutron Production Cross Section from NeutronInduced Reaction for Natural Gadolinium, andMolybdenum Target Foils as a Function of theNeutron Energy, En up to 5 MeV, Using ALICE-91Code.
96
Fig. (3-22):
Neutron Induces Capture Cross Section for NaturalGadolinium, and Molybdenum Target Foils as aFunction of the Neutron Energy, En up to 5 MeV inLog-Log Scale.
97
Fig. (3-23):
Relative Values of the Neutron ProductionProbability, f(1)(Ei,t), in Arbitrary Units, forGadolinium, and Molybdenum Target Foils ofThickness t= 10, and 25 µm, respectively as aFunction of the Proton Energy, Ep (MeV).
97
Fig. (3-24):
Relative Values of the Ejected Neutron TransmissionProbability, f(2)(Ei,t), in Arbitrary Units, forGadolinium, and Molybdenum Target Foils as aFunction of the Ejected Neutron Energy, En (MeV).
99
Fig. (3-25):
Relative Values of the Overall Proton FluenceResponse Probability per unit Proton Energy,F(Ei,t)/Ep, in Arbitrary Units, for Gadolinium, andMolybdenum Target Foils, as a Function of theIncident Proton Energy, Ep (MeV).
101
Fig. (4-1): Flow Chart of EMPIRE-II Calculations 131
Fig. (5-1): The Excitation Function of the natMo(p,x)92mNbReaction. 144
Fig. (5-2): The Excitation Function of the natMo(p,x)94gTcReaction. 145
Fig. (5-3): The Excitation Function of the natMo(p,x)95gTcReaction. 147

XVII
Fig. (5-4): The Excitation Function of the natMo(p,x)95mTcReaction. 148
Fig. (5-5): The Isomeric Cross Section Ratios Values for95gTc/95mTc. 149
Fig. (5-6): The Excitation Function of the natMo(p,x)96mgTcReaction. 151
Fig. (5-7): The Excitation Function of the natMo(p,x)99mTcReaction. 154
Fig. (5-8): The Excitation Function of the natGd(p,x)152gTbReaction. 156
Fig. (5-9): The Excitation Function of the natGd(p,x)154gTbReaction. 158
Fig. (5-10): The Excitation Function of the natGd(p,x)154mTbReaction. 159
Fig. (5-11): The Isomeric Cross Section Ratios Values for154gTb/154mTb. 160
Fig. (5-12): The Excitation Function of the natGd(p,x)155TbReaction. 162
Fig. (5-13): The Excitation Function of the natGd(p,x)156TbReaction. 163
Fig. (5-14): The Excitation Function of the natGd(p,x)160TbReaction. 165
Fig. (5-15):The Differential Thin Targets Yields for theProduction of 92mNb, 94Tc, 95mTc, 95gTc, 96mgTc, and99mTc via the natMo(p,x) Reactions.
166
Fig. (5-16):The Differential Thin Targets Yields for theProduction of 152gTb, 154mTb, 154gTb, 155Tb, 156Tb, and160Tb via the natGd(p,x) Reactions.
167
Fig. (5-17):The Integral Thick Target Yield as a Function ofTarget Thickness (in MeV) for the Production of92mNb.
168
Fig. (5-18):The Integral Thick Target Yield as a Function ofTarget Thickness (in MeV) for the Production of94gTc.
168
Fig. (5-19):The Integral Thick Target Yield as a Function ofTarget Thickness (in MeV) for the Production of95gTc.
168
Fig. (5-20):The Integral Thick Target Yield as a Function ofTarget Thickness (in MeV) for the Production of95mTc.
169
XVIII
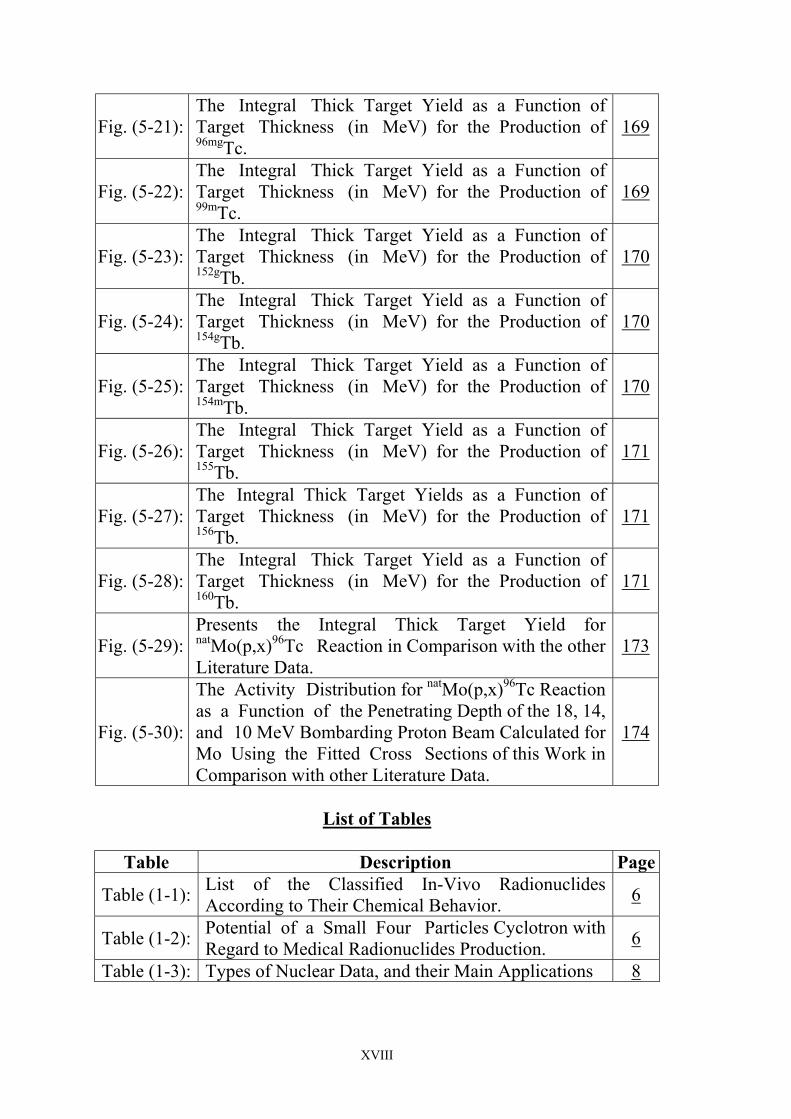
Fig. (5-21):The Integral Thick Target Yield as a Function ofTarget Thickness (in MeV) for the Production of96mgTc.
169
Fig. (5-22):The Integral Thick Target Yield as a Function ofTarget Thickness (in MeV) for the Production of99mTc.
169
Fig. (5-23):The Integral Thick Target Yield as a Function ofTarget Thickness (in MeV) for the Production of152gTb.
170
Fig. (5-24):The Integral Thick Target Yield as a Function ofTarget Thickness (in MeV) for the Production of154gTb.
170
Fig. (5-25):The Integral Thick Target Yield as a Function ofTarget Thickness (in MeV) for the Production of154mTb.
170
Fig. (5-26):The Integral Thick Target Yield as a Function ofTarget Thickness (in MeV) for the Production of155Tb.
171
Fig. (5-27):The Integral Thick Target Yields as a Function ofTarget Thickness (in MeV) for the Production of156Tb.
171
Fig. (5-28):The Integral Thick Target Yield as a Function ofTarget Thickness (in MeV) for the Production of160Tb.
171
Fig. (5-29):Presents the Integral Thick Target Yield fornatMo(p,x)96Tc Reaction in Comparison with the otherLiterature Data.
173
Fig. (5-30):
The Activity Distribution for natMo(p,x)96Tc Reactionas a Function of the Penetrating Depth of the 18, 14,and 10 MeV Bombarding Proton Beam Calculated forMo Using the Fitted Cross Sections of this Work inComparison with other Literature Data.
174
List of Tables
Table Description Page
Table (1-1): List of the Classified In-Vivo RadionuclidesAccording to Their Chemical Behavior. 6
Table (1-2): Potential of a Small Four Particles Cyclotron withRegard to Medical Radionuclides Production. 6
Table (1-3): Types of Nuclear Data, and their Main Applications 8

XIX
Table (1-4):
Presents a list of some Important Positron EmittingRadionuclides Used for PET, their Half-Lives andTypical Nuclear Reactions for their Production AreGiven.
11
Table (1-5):Presents a list of some Important PET, and SPECTRadionuclides, and a Classification of CyclotronsUsed in their Production.
12
Table (1-6): Characteristics of the Direct Detection of the EmittedParticles, and Activation Technique. 18
Table (2-1):
Principal Direct Nuclear Reactions, Decay DataLeading to the Main Radionuclides we are Interestedin, that Occur in Proton Irradiated natMo and theirCalculated Threshold Energies, Eth.
36
Table (2-2):
Principal Nuclear Reactions, Decay Data Leading tothe Main Radionuclides We Are Interested in, thatOccur in Proton Irradiated natGd and their CalculatedThreshold Energies, Eth.
40
Table (2-3): Gives a Summary of the Earlier Investigations of theProton Induced Data from the Available Literature. 41
Table (3-1): Particles Species, Their Energies and Intensities forthe External Beam of the Inshas Cyclotron MGC-20. 44
Table (3-2): Gives a Relation Between the Machine and theParticles, Particle Energy, Available Current. 47
Table (3-3): Isotopic Composition of Natural Molybdenum, andGadolinium Used in this Study. 49
Table (3-4): Gamma-Ray Standard Sources Used in EfficiencyDetermination. 59
Table (3-5): Parameters Used to Fit the Efficiency Function. 60
Table (3-6): Formulae Used for Numerical Analysis of SpectraPeaks. 64
Table (3-7): Major Uncertainty Sources and their EstimatedValues in the Cross Section Measurements. 103
Table (5-1):
The Resultant Output Cross Section Values fromSeveral Proton Induced Reactions on MolybdenumTargets, The Calculation of the Total Cross Sectionfrom the Individual Contributing Reactions HaveBeen Performed by Using ALICE-91 Code.
138
Table (5-2):
The Resultant Output Cross Section Values fromSeveral Proton Induced Reactions on MolybdenumTargets, The Calculation of the Total Cross Sectionfrom the Individual Contributing Reactions HaveBeen Performed by Using EMPIRE-II Code.
139

XX
Table (5-3):
The Resultant Output Cross Section Values fromSeveral Proton Induced Reactions on GadoliniumTargets, The Calculation of the Total Cross Sectionfrom the Individual Contributing Reactions HaveBeen Performed by Using ALICE-91 Code.
140
Table (5-4):
The Resultant Output Cross Section Values fromSeveral Proton Induced Reactions on GadoliniumTargets, The Calculation of the Total Cross Sectionfrom the Individual Contributing Reactions HaveBeen Performed by Using EMPIRE-II Code.
141
Table (5-5): Measured Cross Sections Values for Production of92mNb, on Natural Mo Targets at Different Energies. 144
Table (5-6): Measured Cross Sections Values for Production of94Tc, on Natural Mo Targets at Different Energies. 145
Table (5-7): Measured Cross Sections Values for Production of95gTc, on Natural Mo Targets at Different Energies. 147
Table (5-8):Measured Cross Sections Values for Production of95mTc, and Isomeric Ratios on Natural Mo Targets atDifferent Energies.
149
Table (5-9): Measured Cross Sections Values for Production of96m+gTc, on Natural Mo Targets at Different Energies. 151
Table (5-10): Measured Cross Sections Values for Production of99mTc on Natural Mo Targets at Different Energies. 154
Table (5-11): Measured Cross Sections Values for Production of152gTb, on Natural Gd Targets at Different Energies. 156
Table (5-12): Measured Cross Sections Values for Production of154gTb, on Natural Gd Targets at Different Energies. 158
Table (5-13):Measured Cross Sections Values for Production of154mTb, and Isomeric Ratios on Natural Gd Targets atDifferent Energies.
160
Table (5-14): Measured Cross Sections Values for Production of155Tb, on Natural Gd Targets at Different Energies. 162
Table (5-15): Measured Cross Sections Values for Production of156Tb, on Natural Gd Targets at Different Energies. 163
Table (5-16): Measured Cross Sections Values for Production of160Tb, on Natural Gd Targets at Different Energies. 165

Chapter I
1
1-1 Introduction
Through this study many questions could be declared concerning thecross sections as a physical values, also the way in which to use them inpractical applications or to assess their accuracy. All these questions can beanswered by recourse to simple theoretical principles. Actually, the basicknowledge is needed even to ask a question in clear form about a crosssection. Studying the nuclear reactions induced by charged particle isrequired to obtain data about the probability of emission of ejected particlesor nuclei. As well as the concern to produce residual nucleus that involvesthe population of discrete, or discrete collective or collective levels in thecompound nucleus that leads to the formation of radionuclide.
Medical applications of nuclear radiations are of considerableinterest for the humankind nowadays. Cyclotrons and accelerators,available in recent years in an increasing number all over the world, arebeing used for the production of radioisotopes for both diagnostic andtherapeutic purposes. The physical basis of this production is describedthrough interactions of charged particles, such as protons, deuterons andalpha particles, with matter. These processes have to be well understood inorder to produce radioisotopes in an efficient and clean manner. In additionto medical radioisotope production, reactions with low energy chargedparticles are of primary importance for two major applications. Techniquesof ion beam analysis use many specific reactions to identify materialproperties, and thin layer activation technique as a probe for wears andcorrosion assessment.
Thus it became clear that there are definite needs for a clear andconcise explanation of the principles of cross section theory, accuratemeasurements, and reliable compilations of data. This is the first objectiveof this work on an experimental base.
The second objective of this work also is to present the principles ofcross section measurement and use, as well as sufficient theory predictionso that the general behavior of cross sections is made understandable.
In recent years, low energy small cyclotrons have been installed inseveral countries. Producing standard gamma emitting radioisotopes suchas 67Ga, 111In, 201T1 and 123I commonly employed in medical diagnosticinvestigations using gamma cameras “Single Photon Emission ComputedTomography” (SPECT). Although the production methods are wellestablished, there are no evaluated and recommended nuclear data setsavailable for production routes of many radionuclides.

Chapter I
2
The need for standardization of methods, techniques, data evaluation,data analysis have become necessary [cf. 1, 2]. Many of importantradionuclides production routs are still under investigation. Others need toimprove the precision of their existing data or to extend the covered energyranges. For quantitative study of nuclear reactions, the cross section valuesfor both ejected particle and residual intimate nucleus at certain incidentenergy have been considered. In this chapter, a review for reaction crosssection explanation and the necessary formulae are given.
1-2 Reaction Q-Values, and Thresholds
During radionuclide production with accelerators the reactiondepends on energy threshold value, cross section which depends in its turnon the energy of the incident projectile. Usually at these accelerators lightcharged particles (proton, deuteron, 3He, or α) are used as bombardingparticles. A nuclear reaction A(x,y)B is generally described in terms of thecross section. This quantity essentially gives a measure of the probabilityfor a reaction to occur and may be calculated.
In a nuclear reaction:
( )1 1A AZ Zx A B y Q′
′+ → + + −
The number of nucleons, charge, energy, momentum, angularmomentum, parity, and isospin are conserved. The conservation of energycan describe the Q-value of a reaction. It can be derived from the differencein the nucleic masses and is an indication whether the reaction isenergetically possible or not. However a minimum energy is required toinitiate a reaction and called the threshold energy Eth, can be described by:
1 (1 2)xth
A
mE Q M = ⋅ + −
where mx and MA are the masses of the projectile and target nucleus,respectively. The energy liberated in the reaction is defined by the quantityQ, its value is given by:
( )1 3B y xQ E E E = + − −
Or,( ) ( ) ( )2 1 4x A y BQ m M m M c = + − + ⋅ −

Chapter I
3
where Ex, EA, Ey, EB refer to the kinetic energy of the projectile x, the targetA, the products y, and B, respectively. mxc2, MAc2 are the rest mass energyof the projectile and the target, and myc2, MBc2 are the rest mass energy ofthe products.
It should be pointed out that most of the experimental studies arecarried out in the laboratory frame of reference (Laboratory System, LS) inwhich the target is at rest. Theoretical studies are more suitable in a centerof mass reference frame (Center of Mass System, CMS) in which onecenter of mass represents the reactants and the other corresponds to theproducts. In most of the nuclear reactions the mass of the projectile isusually smaller than that of the target nucleus, so that for low incidentenergy the center of mass almost coincides almost with the coordinate ofthe target nucleus, i.e., LS and CMS practically coincide. The differencebetween these two frames becomes large for high-energy reactions, whenthe kinetic energy of the projectile exceeds the sum of rest masses of bothcolliding particles. In this case, CMS frame moves relative to LS framewith a velocity close to the velocity of light.
If Q > 0, the reaction is termed exoergic, i.e. accompanied by liberation ofenergy. If Q < 0, absorption of energy is needed to start the reaction; it istermed endoergic. For elastic collision, Q = 0. Exoergic reaction and elasticscattering can take place at any energy of the incident particle. For anendoergic reaction (Q < 0) the bombarding particle should have an energyvalue sustaining the absorbed energy due to atomic mass difference, this ischaracterized by the threshold energy. Note that the threshold energy, Eth,generally does not coincide with the reaction energy Q .
For the reactions in which the projectile mass is considerably lessthan the mass MA of the target nucleus, the threshold practically coincideswith |Q|. From Eq. (1-2) at mx « MA, this leads to Eth ? |Q|.
Due to Coulomb potential between the projectile and the targetnucleus, additional energy should be added to the projectile energy, namelyEc. This energy depends on the charges of the projectile (Zxe) and the targetnucleus (ZA e). where Zx, ZA, and e are the atomic number of the projectile,the atomic number of the target, and the electron charge, respectively, andthe minimum distance of impact (rmin):
( )2
min
1 5x Ac
Z Z eE k
r
⋅ ⋅= ⋅ −

Chapter I
4
where 29
21 8.988 10
4 o
mk CoulombConstant NCπε
= = = × ⋅ , oε is the
permitivity of the free space min x Ar R R+ , Rx and RA are the radii of thecolliding particle and the target nucleus, respectively. By using theelectromagnetic radius formula:
( )1/ 30 1 6R r A= ⋅ −
where 131.2 10or cm−× and A is the mass number, finally we get:
( ) ( )2
1/3 1/30
1 7x Ac
x A
Z Z eE k
r A A
⋅ ⋅= ⋅ −
⋅ +
The energy thresholds for proton p on target T and Incoming particleCoulomb Barrier (ICB) are calculated with kinematics in the laboratorysystem [cf. 3]. By the mass defects from Firestone [cf. 4], and Eqs (1-2),and (1-8) in which the charges Z are non dimensional, nuclear radii areapproximated as ≈1.4 A1/3 ×10-15 m, and e2 =1.44×10⁻¹⁵ m MeV (let usremember that 1fm=10-15 m and 1b=10-28 m2):
( ) ( )( ) ( ) ( )1/ 3 1/ 3
1.44 1 81.4x A x A
A x A
M M Z ZICB MeVM A A
+ ≈ × − +
In case of (p,xn) reactions, the ICB values varies in the range 7.92MeV for (92Mo) to 7.73 MeV for (100Mo), thus their values are larger thansome (p,n) reaction thresholds. Nevertheless as it happens in most similarcases, several experimental data show that below the (p,n) reaction barriercross-sections are not negligible, due to the tunneling phenomena. In thecase of production of metastable nuclide production, the energy ofmetastable level must be added to calculated Q-value. Finally, in the caseof cluster emission, the Coulomb Barrier of the outgoing particle (OCB)must be added to the calculated Eth values. The OCB value is calculated byan equation similar to Eq. (1-8), in which, both masses, charges, and massnumbers of reaction products must be used, and is given by:
( ) ( )( ) ( ) ( )1/ 3 1/ 3
1.44 1 91.4y B y B
B y B
M M Z ZICB MeVM A A
+≈ × − +

Chapter I
5
1-3 Status of Available Nuclear Data
All of the radioisotopes used for in-vivo studies can be arbitrarydivided into five groups according to their chemical behavior, andbiological function or mode of formation.
(1) The “Organic” short-lived β+ emitters are ideally suited for labelingbiomolecules and find their applications in PET (Positron EmissionTomography).
(2) Radiohalogens may also be regarded as “organic” isotopes since theyare also useful for labeling biomolecules; some of them are suitable forin-vivo studies using the conventional γ-Cameras while the others findtheir applications in PET.
(3) Rare-gases are generally used for ventilation studies since many ofradiohalogens are formed via rare-gas precursors, these two types ofradionuclides are grouped together. Short-lived generator radionuclidesare practical for general medicine use since an on-site or nearbycyclotron is not required.
(4) Alkali and alkali-like metals find their applications in myocardialperfusion studies.
(5) The List of “Inorganic” Radionuclides is large but their applicationsare limited.
Table (1-1) gives a list of the classified in-vivo radionuclidesaccording to their chemical behavior [cf. 5]. Each radionuclide can begenerally produced via several nuclear reactions. Not every reaction issuitable for large-scale production of a particular nuclide. Apart from crosssection data others considerations must be available as ease of targetconstruction, capability of withstanding high beam currents, as well as thesubsequent chemical processing.
Table (1-2) shows the potential of a small four particle cyclotron withregard to medical radionuclides production. In practice one of the particles(p, d, 3He, 4He) is used in the medium and heavy mass regions, the protonmostly gives a high yield. In recent years 3He-particle have foundincreasing applications since the energies of 3He2+-particles available atcompact cyclotron are generally higher than those of other particles.

Chapter I
6
Table (1-1): List of the Classified In-Vivo RadionuclidesAccording to Their Chemical Behavior [cf. 5].
Types of Radionuclides for In-Vivo Studies1. “Organic” Short-Lived β+-Emitters: 11C, 13N, 15O, 18F, 30P.2. Halogens and Rare Gases: 18F, 34mCl, 75,77Br, 125Xe.3. Generator Radionuclides: [produced by cyclotrons]
(Diagonostic i.e. SPECT).195mHg/195mAu, 109Cd/109mAg, 178W/178Ta. (Therapeutic radionuclide i.e. β--emitters)212Pb-212Bi,(PET) they are β+-emitters generators.44Ti/44Sc, 52Fe/52mMn^, 62Zn/62Cu^, 68Ge/68Ga*, 72Se/72As,82Sr/82Rb*, 128Ba/128Cs.
4. Alkali and Alkali Like Metals: 38,43K, 81Rb, 128,129Cs, 201Tl.5. “Inorganic” radionuclides:
28Mg, 45Ti, 48Cr, 67Ga, 111In, 73Se, 97Ru.*Commercially available; ^Have been used clinically
Table (1-2): Potential of a Small Four Particles Cyclotron with Regard toMedical Radionuclides production [cf. 5].
(Ep=18MeV;Ed=10MeV;E3He=27MeV, Eα=20MeV)Radio-nuclide T1/2
NuclearProcess Radionuclide T1/2 Nuclear Process
Proton induced reactions Deuteron induced reactions15O18F
67Ga75Br123I
2m110m78h1.6h13.2h
14N(d,n)20Ne(d, α)66Zn(d,n)*74Se(d,n)*
122Te(d,n)*3He-particles induced reactions18F
76Br77Kr97Ru
110m16h1.2h2.9d
16O(3He,p)75As(3He,2n)
76Se(3He, 2n)*96Mo(3He,2n)*
α-particles induced reactions
11C13N18F
22Na67Ga75Se86Y
94mTc111In123I124I
201Tl
20m10m
110m2.6y78h120d14.7h52m2.8d13.2h4.2h3d
14N(p,α)16O(p, α)18O(p,n)*
22Ne(p,n)*67Zn(p,n)*75As(p,n)86Sr(p,n)*
94Mo(p,n)*111Cd(p,n)*123Te(p,n)*124Te(p,n)*201Hg(p,n)* 30P
38K2.5m7.5m
27Al(α,n)35Cl(α, n)
* Using isotopically enriched target material.

Chapter I
7
1-4 Nuclear Data Needs, and Compilation
The term “nuclear data” is very broad, it includes any type of dataoriginating from “the decay of radioactive nuclei” or from “the interactionof nuclei with matter”. However, as shown in Table (1-3) all data can begenerally grouped into two categories:
i) Nuclear Structure and Decay Data
ii) Nuclear Reaction Cross Section Data
From the viewpoint of nuclear physics and nuclear chemistry thedatabase in nuclear structure, decay data, and nuclear cross section dataconsidered to be sufficiently extensive. From the user-oriented point ofview the existing nuclear structure and decay data are also extensive. Onlyin some special cases the branching ratios or gamma-ray transitionintensities are less certain. On the other hand, the application-orientednuclear reaction data are concerned, the available information is extensivein some cases and scanty in the others.
In the case of neutron induced reactions which uses one of thefollowing four (n,γ), (n,p), (n,α) and (n,f) reactions, the cross-sections forall pertinent reactions concerned are well known. On the other hand, in thecase of charged particle induced reactions, the integral cross-section dataneeded for short-lived radionuclide production using cyclotrons wereinitiated recently, and have received comparatively less attention so itneeds exhaustive compilation and also a salient treatment.
During the past thirty years, many laboratories have reported a largebody of experimental data relevant to medical radioisotope production, andthe charged particle data centers have compiled most of these data.However, no systematic efforts have been devoted to their standardization.Such a task would be too ambitious for any single national laboratory,implying a need for well-focused international effort. Under thesecircumstances, the International Atomic Energy Agency (IAEA) decided toundertake and organize the Coordinated Research Project (CRP) onDevelopment of Reference Charged Particle Cross-Section Database forMedical Radioisotope Production. The project was initiated in (1995).

Chapter I
8
Table (1-3): Types of Nuclear Data, and Their Main Applications [cf. 6].Nuclear Data
Nuclear Structure and Decay Data(Main application in choice of theradionuclides for medical use)
Nuclear Reaction Cross Section Data(Main application in production ofthe radionuclides)
Nuclear LevelsSpins and ParitiesDecay Modes and Half-LivesDecay Energies (Q-values)Branching Ratiosα, β, and γ Ray EnergiesMultipolarities of γ-TransitionsConversion CoefficientsFluorescence YieldsX-rays Bremsstrahlung and Auger e-
Decay Schemes
Scattering and Capture Cross-SectionsResonance IntegralsFission YieldsRange-Energy RelationshipQ-ValuesReaction ThresholdsAngular Energy Distribution DataDifferential and Integral Cross-SectionsExcitation FunctionThin and Thick Target Yields
In recent years the IAEA has been paying a considerable attention tothe subject. It focused on radioisotopes for diagnostic purposes and on therelated beam monitors reaction in order to meet the current needs. The CRPof the IAEA constituted the first major international effort dedicated tostandardization of nuclear data for radioisotope production, and covered thefollowing areas:
(1) Compilation of data on the most important reactions for monitoringlight ion charged particle beams (p, d, 3He, and α).
(2) Evaluation of the available data (both by fitting and theory).
(3) Compilation of production cross-section data on radioisotopes mostcommonly used in medicine.
(4) Development of calculation tools for predicting unknown data.
The Coordinated Research Program (CRP) of the IAEArecommended reaction cross sections for the production of medicallyimportant radionuclides have been made available in numerical form. TheCRP produced a much-needed database and a handbook, covering reactionsused for monitoring beam currents and for routine production of medicallyimportant radioisotopes. It is believed that the recommended cross-sectionsare accurate enough to meet the demands of all current applications,However, further development of evaluation methodology and moreexperiments will be needed for exact determination of the errors and theircorrelations related to beam monitor, beam energy, and detection

Chapter I
9
efficiency. In addition to the reaction cross-sections data, yields of theproduced radioisotopes could be calculated from the recommended cross-sections data.
Considering nuclear data involved in radionuclide production fordifferent uses, in areas of interest, existing data from the evaluated files,recent measurements, and model calculations were examined. It was foundthat there is a clear need of precise nuclear data for many technologicallyimportant materials in the energy region where few nuclear data exist.Systematic calculations and predictions resulting from theoretical modelsmay complement the data for the unmeasured energy regions and nuclei.
The systematic calculations are less accurate, however it is lesslaborious than the theoretical models method of predicting an unknowncross section. Nevertheless, such systematic trends allow a quick predictionof unknown cross section. In cases where the experimental measurementsare extremely tedious or where theory cannot be applied with certainty, thesystematic calculations, if done with precision and caution, could provideuseful information on the various competing reactions.
1-5 Cyclotron Production of Medically Used Radionuclides
The use of radionuclides as tracers in medicine (nuclear medicine) isa well-established field of science, with a long history [cf. 7]. The spatialdistributions of labeled compounds in the human body are of muchimportance. The comparatively recent developments in instrumentation forimagining have shifted the forefront of the research away from simplequalitative distribution studies towards quantifying biochemical pathwaysin the human body. Positron Emission Tomography (PET), and SinglePhoton Emission Computed Tomography (SPECT) are the most commontechniques have used in nuclear medicine.
The major use of radionuclides in medical applications is in-vivoimaging. The effective use of PET or SPECT scanners is dependent on theavailability of suitable radioactively labeled compounds of sufficientquality (chemical, radiochemical, and pharmaceutical), and quantity. ForPET applications, the positron emitting radionuclides that are used asprecursors for radiotracer synthesis are readily produced with a chargedparticle accelerator through nuclear reactions during bombardment of atarget material. Produced radionuclides are used either immediately afterthe end of bombardment, or even on-line in some special cases. Alsogenerator systems can be used, where a longer lived “parent” radionuclidedecays to a shorter-lived “daughter” radionuclide. For SPECT applications,

Chapter I
10
single photon emitting radionuclides are produced both with particleaccelerators and through neutron bombardment and fission in a nuclearreactor.
The PET or SPECT facility requires: an accelerator (smallcyclotron), a chemistry laboratory for radiotracer and/orradiopharmaceutical synthesis and a radiography camera, PET Camera forPositron Emission Tomographs (PET) or Gamma Camera for SinglePhoton Emission Computed Tomographs (SPECT), see Figure (1-4). Anintegral part of a cyclotron facility is a team of specialist consisting ofexperts in biochemistry, chemistry, computer science, instrumentation,mathematics, medicine and physics.
Figure (1-1): Scheme of Disciplines and Activities Involvedin a Cyclotron Facility.
The choice of a suitable radionuclide for certain medical applicationdepends on several nuclear and chemical aspects. The nuclear decay data ofradionuclide help to decide whether they can be used for therapeutic ordiagnostic purposes. The medical requirements impose many restrictionson the half-life of the tracer, its biological half-life, its path to the targetedorgan, the way of its absorption and distribution in the organ, the energy ofits radiation, the requires specific activity, etc. On the other hand, thechemical characteristics of the radionuclides are very important to be usedin their proper function. Important parameters of radionuclide productionare:
(1) Yield of the desired radioisotope
(2) Chemical form
(3) Chemical purity

Chapter I
11
(4) Radiochemical purity
(5) Radionuclidic purity,
(6) Specific radioactivity
As all important positron emitting radionuclides are short lived(T1/2<3h), the requirements on the synthetic chemistry for the labeledtracers are rather special. Fast chemical reactions and methods are thereforerequired. It is mandatory that the production of the short-lived isotopes isclosely interrelated to the radiochemical work. Some importantradionuclides used for PET imaging are listed in Table (1-4).
Table (1-4): Presents a list of some Important Positron EmittingRadionuclides Used for PET, their Half Lives and Typical Nuclear
Reactions for Their Production are given [cf. 5].
Nuclide T1/2[min]
Nuclear reaction(typical)
Type of cyclotronused in production(see next section)
11C 20.4 14N(p,α) or 11B(p,n) Level I or II13N 10.0 16O(P,α) or 13C(p,n) Level I or II15O 2.1 14N(d,n) or 13N(p,n) Level I or II18F 19.8 20Ne(d,α) or 18O(p,n) Level I or II38K 7.6 40Ca(d,α) or 38Ar(p,n) Level II
68Ge*/68Ga 68.3 69Ga(p,2n)68Ge Level III75Br 98
76Se(p,2n) or75As(3He,3n) Level III
82mRb*/82Rb 1.3 Mo(p,spall)82SrRb(p,xn)82Sr Level IV
* Marks refer to radionuclide generator product
Among the entire important positron emitters only 18F can beproduced in quantities with sufficiently high specific radioactivity for PET[cf. 8], using a nuclear reactor. Other positron emitters must be producedwith particle accelerators, preferably a cyclotron. The recent developmentin radionuclide production for PET has been directed towards small in-hospital cyclotrons [cf. 9].
Cyclotrons used for radionuclide production are usually classified infour levels, I-IV, depending on their maximum proton beam energy [cf.5,8]. The higher levels III and IV cyclotrons can mostly be found in bigresearch centers or big industrial laboratories. However, for the production

Chapter I
12
of short-lived positron emitter radionuclides only levels I and II cyclotronsare suitable, see Table (1-5).
Some small cyclotrons are exclusively devoted to the production andon-site use of short-lived β+-emitters. Medium and larger-size machineshave often-interdisciplinary utilization, with a considerable fraction ofbeam-time for radionuclide production, they are capable of delivering avariety of radionuclides.
Table (1-5): Presents a list of some Important PET, and SPECTRadionuclides, and a Classification of Cyclotrons
Used in Their Production [cf. 5].
Classification
Characteristics Energy(MeV)
Major RadionuclidesProduced
LevelI
Single Particle, (p, d)
Ep, d ≤ 10(MeV)
11C, 13N,15O, 18F
LevelII
Single or MultipleParticles (p, d, 3He, α) Ep ≤ 20
(MeV)
11C, 13N, 15O, 18F,67Ga, 75Se, 111In,
123I,124I, 201Tl,
Level III Single or MultipleParticles (p, d, 3He, α)
Ep ≤ 40(MeV)
38K, 73Se, 75-77Br, 123I,67Ga, 111In, 201Tl,
22Na, 57Co, 81Rb(81Kr)
Level IVSingle or Multiple
Particles (p, d, 3He, α)Ep ≤ 100(MeV)
123I, 72Se(72As),82Sr(82Rb), 117mSn
LevelV
Single or MultipleParticles (p, d, 3He, α) Ep ≥ 200
(MeV)
26Al, 32Si, 44Ti, 67Cu,68Ge(68Ga), 95mTc82Sr(82Rb), 109Cd,
The development of the Anger camera [cf. 10] and the 99mTc-nuclideavailable from the 99Mo generator [cf. 11-13] for the labeling ofcompounds further strengthened the position of the single photon emittingradionuclides in the field of nuclear medicine [cf. 14]. The development ofcoincidence techniques for the measurement of annihilation radiationproduced in positron emission, and the fact that the radionuclides ofcarbon, nitrogen and oxygen emit positrons, gave the impetus for arenewed interest in accelerator produced radionuclides in the earlyseventies [cf. 15]. Some special advantages of the cyclotron products ascompared to reactor products are:

Chapter I
13
(1) Possibility of in-vivo quantitative study of regional physiologicalfunctions using organic radionuclides β+-emitters,(2) High specific activity of the produced radionuclide,(3) Low radiation dose to patient.
1-5.1 Target Chemistry, and Targetry
Target chemistry is controlling the form of the radioisotope after thebombardment is over. The chemical form of the element is chosen to havegood mechanical and thermal properties. The irradiated material could besolid, liquid or gaseous. During irradiation, the target is exposed for a longperiod to high-intensity particle beam, neutron and gamma ray fluxes.Targetry is meant by the thermal stability of the target and its contents,these include the window material, the interior surface of the target holder,and the material used for construction. The radiolytic and chemical stabilityof the contents is a function of both the state (gas, liquid, and solid), andreactivity of the contents.
In order to put this complex subject into perspective, practical yieldsof radionuclides in elemental or simple compound form is a function of thefollowing parameters [cf. 14, 16, 17]:(1) Energy of the beam impinging on the target, high melting point, andhigh thermal conductivity(2) Target optimum current,
As a function of chemical processes could take place in target thatimply no decomposition on heating, no gaseous byproducts, and nochemical reaction with the encapsulating material.As a function of target design (cooling, etc.)
(3) Time of irradiationOptimization of yield versus on-time of the cyclotron,Optimization of yield because of dynamics of reactions in targetversus time.
(4) Activity recoverable from target(5) Chemical and physical form required, that will permit simple chemical
and physical manipulation to remove the target from the irradiationcapsule, and which will subsequently allow post irradiationprocessing to be performed simply and rapidly with remote handling
(6) Dependence in turn on possible on-stream chemical conversion.(7) Stable to irradiation environment

Chapter I
14
A successful radionuclide production is crucially dependent on thequality and composition of the target materials. The radionuclidiccomposition of the product is of course influenced by the isotopiccomposition of the target itself. By using isotopically enriched (depleted)targets both the yield and the radionuclidic purity of a given product can beincreased. By the use of additives to the target the chemical form of theproduct can be influenced. Minute amounts of chemical contaminants inthe target can have a detrimental effect both on the specific radioactivityand chemical composition of the product.
1-5.2 High Current Irradiations at Cyclotrons
The target holder is used mainly to support the irradiated material,activity handling, and prevents overheating or evaporation which isachieved using efficient cooling system, and suitable design ensure quicktransportation. The target holder should satisfy the following conditions:
- Its material producing low background radioactivity- Simple loading and unloading mechanisms of the irradiated target from itsholder- Good thermal contact between the holder and the irradiated material- Electrical isolation from the surroundings for beams current monitoring.
In routine production the design of the cyclotron target is morecomplicated than in the test experiments. Pneumatic arms and remotecontrol are usually used for loading and unloading of the target. Forexample, if the target material does not have good thermal properties, thecooling is applied on both sides of the target material [cf. 15], which makesthe design more complicated.
To decrease the heat effect of the beam on the target material severallaboratories used inclined targets relative to the beam direction [cf. 18]. Ininclined position the path of the projectile within the target materialbecomes longer than in the normal position. This allows use of a thin layerof the target material. In addition, the power deposited per unit area is lessthan that for normal position, and the cooling becomes more efficient.
The absorbed energy within the target produces thermal power perelemetary charge which, can be estimated from the following formula:

Chapter I
15
( )( ) ( )( ) 1 10( )
Absorbed Energy MeV Beam Current APower Watt
Elementary Charge e
µ⋅= −
The desired energy range for production determines the thickness ofthe target. It is calculated from the tabulated stopping power or the rangevalues. Heat transfer in solids is somewhat simpler than in other mediasince the heat usually flows through the target matrix mainly byconduction. The heat will be conducted from the hotter region of a materialto the cooler region according to Fourier’s Law, which is in one dimension.
( )2
1
1 11T
condT
dTQ k A dx= − ⋅ ⋅ −
where,Qcond = heat transferred by conduction in (watts)A = cross section area (cm2)k = coefficient of thermal conductivity (watts/cm⋅K)dT = temperature difference in Kelvin; dx = differential distance (cm)If this equation is integrated holding k, A, and Q constants, then the resultis the heat transfer equation in one dimension given by:
( )1 2( ) / 1 12condQ k A T T x= − ⋅ ⋅ − −
T1 = temperature of the hotter part (K);T2 = temperature of the cooler part (K).
Once the heat has been transferred to the cooled surface of the target,the heat will usually be removed by a fluid such as water flowing againstthe back of the target. For a compound target the stopping power isestimated for every elemental composition over the desired energy range.The resulting values are added according to the fractional composition ofevery element in the target.
In some instances, the thermal properties of the compounds or alloysmay be more favourable than that of their respective pure elements. Forexample, many metals of low melting temperature form oxides whosemelting points are very high. As an example, tellurium metal melts at about

Chapter I
16
450°C, while the melting point of its oxide, TeO2, is 733°C and its heatconduction properties is very poor.
1-6 Calculation of the Activation Cross Sections
The reaction cross section refers to the probability that the reactionof interest can occur. The cross section for the reaction A(x,y)B is denotedby σ and is defined as the number of reactions (x,y) for one target nucleusplaced in unit incident flux. The cross section is measured in barns(1b=10−28 m2). It does not represent the geometrical effective area overwhich the reaction occurs.
The reaction cross section is a string function of the incident particleenergy to induce a certain reaction. It is known as an integral cross sectionwhen integrated over all angles. The variation of the cross section withincident energy is called the excitation function. The reaction cross sectionis calculated for a certain type of the produced nuclide, and dependspecifically on the final state of this nuclide. So, it is namely called reactionchannel for specific initial conditions (i.e. energy, projectile type, polarity,etc.,) of a nuclear reaction, determining the cross section for that channel,differs whenever gives a nuclide in ground or metastable states, wherethere are different competing processes could take place. Accompany acollision between a proton beam of considerable energy with target nucleusvariety of channels could be open and relieve cross section for everychannel simultaneously. If the energy of the projectile is less than thethreshold of some endoergic reaction, then it is called a closed channel. Atvery low energies of the projectile, only the elastic and exoergic channelsare open. As the energy increases, the endoergic reaction channels becomeenergetically possible, one after the other, according to their respectiveenergy thresholds.
The excitation functions for nuclear reactions are utilized whendesigning the strategy for a production route. Important considerations areparticle energies available, the yield of the desired product and thesuppression of unwanted side reactions [cf. 19]. Two standard methodscommonly used for charged particle induced reaction cross sectionmeasurements. The first one is applicable in the case of variable energycyclotrons. Thin samples of the target material are irradiated either withextracted beams of varying energies or at appropriate radius in the internal
Chapter I
17
beam. At external beam thin foil enable direct detection of the emittedparticles and identification of the activated products. The directmeasurement is also known as the spectral measurement technique, thesemethods have their own advantages and limitations. An outline of thecharacteristics of the two methods is given in Table (1-6). The secondmethod is known as the “stacked-foil” or “stacked-pellet” technique and ismore commonly used with the direct detection of residual activity. A set offoils or pellets in a stack is irradiated whereby the incident particle exhibitsfractional loss of its energy at each foil. Therefore it is possible to produceactivity at different energy values over a certain energy range. Plotting ofthe calculated cross section deduced from the absolute activity, as afunction of incident energy of the projectile is known as excitationfunction.
Both techniques are commonly used for determination of theexcitation function. The number of interactions N′ taking place per unittime when N nuclei are bombarded by projectiles of density n per cm3 andvelocity ν, cm per sec, is given by [cf. 20]:
( ), 1 13N N n ν σ′= ⋅ ⋅ ⋅ −
Assuming that N′ is small enough so that the nuclei do not changethe projectile density appreciably, thus the interaction rate is proportional tothe product of projectile density n and velocity ν, which is the flux densityI. For simplicity it may be called projectile flux. Thus a unit cross section σis one that gives one interaction per unit time when a unit projectile densityis incident on a single nucleus.
It is noted that the interaction rate depends on the total number ofnuclei, N, not on the number per cm3. From this point the simple concept ofreaction cross-section as nuclear area could be declared as following. Thenumber of projectiles in the volume νσ will hit a given nucleus per second.This number is nνσ for one nucleus or Nnνσ for all nuclei, regardless ofthe density of the sample or orientation, if N is sufficiently small so thatthere is no self-shielding. Although the practical utility of the concept of across section as nuclear area is obvious, its unreality is clearly shown bythe variation in size of cross sections, enormous compared to the relativelyconstant true nuclear size. From the measured radioactivity the crosssection is obtained using the well known activation formula [cf. 20]:

Chapter I
18
( ) ( )1 1 14tA I N e λσ − ⋅= ⋅ ⋅ ⋅ − −
whereA = the activity of the produced radionuclide (Ci),
I = flux intensity of the incident particles (number of particles/cm2. sec),
N = number of target i.e. surface density (atoms/cm2),
σ = cross section of the reaction (cm2),
λ = decay constant of the resulting nuclei (sec-1),
t = irradiation time (sec).
Table (1-6): Characteristics of the Direct Detection of the EmittedParticles, and Activation Technique.
EXPERIMENTAL TECHNIQUESCHARACTERISTICS Direct Detection of the
Emitted Particle Activation Technique
Type On-Line Off-LineDetection Selectivity Particle Product
Target Must be thin Can be thick
Product May be stableor radioactive Has to be radioactive
Measured Data Double differentialdata Integral data
In order to calculate the cross section of a proton-induced reaction,the well-known activation formula is considered. In the basic underlyingequation the production rate of a radioactive nuclide is described as afunction of the irradiation time [cf. 21]:
( ) ( ) ( )1 15it i i
dNN t N t
dtσ ϕ λ= − −

Chapter I
19
where Ni, is the number of induced atoms (produced), Nt the number oftarget atoms, σi the reaction cross section, λi the decay constant and ϕ(t) thetime dependent particle flux. The increase in Ni due to the activationprocess is expressed as the first term whereas the second term denotes thedecrease resulting from the decay of Ni.
To obtain the number of reaction products Ni at time t, the aboveequation is solved with the initial condition: Ni = 0, and ϕ = ϕ0 at t = 0 andti being the activation time (time of irradiation), and is expressed as thefollowing:
( ) ( ) ( )0
exp 1 16it
i t i o iN t N t dtσ ϕ λ= − −∫
At the time td (decay time) which is the time elapsed from the end ofactivation time and beginning of counting, the activity is give by:
( ) ( ) ( )0 1 exp 1 17t ii i i
i
NN t t
σ ϕλ
λ= − − −
( ) ( ) ( )0 1 exp 1 18i i irr t i i iN t A N tλ σ ϕ λ= = − − −
where Airr is the activity at the end of irradiation. The induced activitybecomes Ad at the time td after the end of irradiation:
( ) ( )exp 1 19d irr i dA A tλ= − −
The net counts N of a full energy peak of gamma-transition of the samenuclide for a counting time tc is given by:
( ) ( )0
exp 1 20ct
irr iN A t I dtγ γλ ε= − −∫
where εγ is the peak efficiency of the detector with necessary corrections, Iγ
is the absolute branching ratio for a particular γ-energy of the producednuclide. Integrating Eq. (1-20), the activity at the end of irradiation is:

Chapter I
20
( ) ( )( ) ( ), 1 211 exp
iirr i i i d
i c
NA N t t
t Iγ γ
λλλ ε
= = −− −
The induced activity at the time td after the end of irradiation becomes:
( )( ) ( ) ( )exp 1 221 exp
iirr i d
i c
NA t
t Iγ γ
λλ
λ ε= ⋅ −
− −
Combining Eq. (1-18), and Eq. (1-22), we obtain:
( )( )( ) ( )( ) ( )exp
1 231 exp 1 exp
i i d
t i i i c
N t
N I t tγ γ
λ λσ
ϕ ε λ λ= −
− − − −
Which is the required activation formula for the determination of crosssection.
In principle, the activation technique allows a more precisedetermination of the cross sections when the residual nucleus is radioactiveand emits easily measurable radiation [cf. 20,21]. At proton energies near18 MeV, several reaction channels are likely to be open. For example the(p,xn), cross section is the sum of (p,n), (p,2n), …etc. The activationmethod does not allow a distinction between (p,d) and (p,np) processes, asall of these lead to the same final nucleus. Often one of the residual nucleireached by proton or alpha particle decay channel is stable, making anactivation measurement incomplete.
Another approach to the activation method involves the combinationof radiochemical separations. In case physical methods of measurementalone are mostly insufficient; good radiochemical separations together withhigh selective counting methods are required to identify the radioactiveproducts. The radiochemical technique is needed especially when:
i) Reactions with low yield are studied,
ii) Thin samples are prepared for beta and X-ray measurements toreduce self-absorption effects,
iii) Short-lived isotopes have to be separated from strong long-livedmatrix activities (overlapping gamma-rays and high detector deadtime.

Chapter I
21
The criteria for a good radiochemical separation are:
(1) Efficient removal of radioactive impurities,
(2) High chemical separation yield,
(3) Simplicity, reproducible, and fast chemistry.
1-6.1 Cumulative Cross-Sections
The equation (1-23) is strictly valid only for the so-calledindependently produced radionuclides because the only productionmechanism is the nuclear reaction leading to the produced nuclide. But inthe majority of cases a further production by β−, β+, EC, or α-decays of aradioactive precursor has to be taken into account. Since there aresometimes ambiguities existing about the terms independent andcumulative cross-sections we have to give some clarifications.
A cross-section for the production of a nuclide is denoted asindependent if the nuclide can only be produced directly via the nuclearreaction between the projectile and the target nucleus and not viasubsequent β−, β+, EC, or α-decays. Such independent cross-sections areobtained if:
1. The nuclide is shielded by nuclides that are stable against β-decay, 2. The nuclide is shielded by a long-lived progenitor (e.g. 60Co by 60Fe
with T1/2 = 1.5 x 10⁶ y, or 194Au by 194Hg with T1/2 = 520 y), 3. The cross-section for the production of a progenitor is also measured
so that the production via decay can be corrected.
In all other cases the cross-sections are cumulative since they includealso the production via decay of precursors. If we consider, e.g. theproduction of a nuclide D (daughter) on the one hand by the nuclearreaction and on the other by decay of a radioactive precursor M (mother).Then the solution of the differential equation corresponding to Eq. (1-24)for the activity AD(t) of D for times t > tirr is given by [cf. 3]:

Chapter I
22
( )( )( ) ( )
( )( ) ( )( )
1 exp exp1 24
1 exp exp
MD M D irr D
M D
D T
MM M irr M
M D
t t
A t N
t t
λσ σ λ λλ λ
λσ λ λλ λ
+ ⋅ − − − − = Φ − + ⋅ − − − −
where σD, σM are the independent cross sections for the daughter D and themother M, respectively. Provided that the half-life of M is short comparedto that one of D (λM>>λD), we can neglect the second term in Eq. (1-24) forlarge td. This yields:
( ), 1 25MD cum D M
M D
λσ σ σ
λ λ= + ⋅ −
−
With the cumulative cross-section σD, cum of the nuclide D calculatedaccording to Eq. (1-25).
The assumption of very short-lived progenitors holds in many cases,but not in all. There are cases e.g. 86Zr (T1/2= 16.5 h) and 86Y (T1/2= 14.74h), 88Zr (T1/2= 83.4 d) and 88Y (T1/2= 106.6 d), 95Zr (T1/2= 64.0 d) and 95gNb(T1/2= 34.97d), 96mTc (T1/2= 51.5 m), 96gTc (T1/2= 4.28 d) and 96gTc (T1/2=4.28 d), 96gNb (T1/2= 23.35 h). Assume a mother nuclide M of knownactivity AM decaying with decay constant λM into the daughter D with λD
for which wrong activities A*M are calculated according to Eq. (1-25), with
a decay constant λM, comparable to λD. In this case use of Eq. (1-25) resultsin a wrong Ap(tEOI) which here shall be denoted as A*D(tEOI). The trueAD(tEOI) is calculated from AD*(tEOI) by Michel et al., (1997) [cf. 22]:
( ) ( ) ( )
( )( ) ( )( ) ( )
*
1 exp1 exp 1 26
1 exp
DD EoI D EoI M EoI
D M
M CDM D D
M D C
A t A t A t
tt
t
λλ λ
λλλ λ
λ λ
= + ⋅−
− −× − ⋅ ⋅ − − − − −
In this case the (cumulative) cross section of the mother nuclide canbe measured and an independent cross section for the daughter product D isdetermined using the correction of Eq. (1-26). If the condition (λM>>λD)under which we derived the cumulative cross-section σD, cum of the nuclide

Chapter I
23
D is fulfilled and we were able to measure σM, then we can derive theindependent cross-section σD for the production of D from Eq. (1-26).
Higher orders of grandparent progenitors can be neglected in allcases because of the strong decrease of half-lives with increasing distancefrom the valley of stability.
Solving the system of coupled differential equations describing thedecay of the mother and the decay and buildup of the daughter after the endof irradiation (t = 0) we calculate the corrected activity AD according to Eq.(1-26) and obtain the independent cross-section of the daughter via Eq. (1-27) [cf. 22]:
( )( )( )
( )( ) ( )
*
1 exp
1 exp1 1 1 27
1 exp
D EoID M
T D irr
M irrD
D M D irr
A t
N t
t
t
σ σλ
λλλ λ λ
= − ×Φ − −
− −× − − − − − −
1-6.2 Isomeric Cross Section Ratios
When the produced nucleus is in an excited state, it is usuallydeexcited to the ground state in a time of the order of 10−14 seconds or less.In some cases however, the time may be long enough to be measured, ~ 0.1seconds or longer. Such a nucleus is said to be in a metastable state and isdistinguished from its ground state by an asterisk B*. The nucleus B of thesame mass number and atomic number that differ in this way in their stateof energy are called isomers. Moreover, the state itself is known as anisomeric state. The isomeric state decays either by gamma-ray emission tothe ground state or by electron capture (EC), β or alpha particle emission toanother nuclide. The process of reversion to the ground state by emission ofthe gamma ray is called the isomeric transition (IT).
For some nuclide, metastable states with long half-life can be formedand activation experiments can sometimes give information on theproduction of both the ground (σg) and metastable state (σm) cross sections.The cross sections for these individual discrete states are difficult tosystematize since they are strongly dependent on the spin and parity of the
Chapter I
24
states concerned [cf. 23-25]. Hence in contrast to the available systematiccalculations of the integral cross sections of neutron induced reactions,those predicting the isomer cross section ratios for proton induced reactionsare very scarce [cf. 24]. Therefore it is important to determine if there isany significant correlation of this ratio, if exists, to any parameter thatcould provide a model.
Systematic analyses of the isomeric cross-section ratios σm/(σm+σg)for (n,2n) reactions were also performed using the pre-equilibrium andstatistical Hauser-Feshbach code GNASH (Young 1977) [cf. 25] to studythe dependence of the branching ratio on the isomeric spin by calculatingthe pertinent isomeric cross section ratio.
Recent mechanistic studies on isomer distribution in nuclearreactions have included investigations about the effect of:
i) Increasing projectile energy,ii) Increasing mass and charge of the projectile,iii) Role of different reaction channels leading to the same product
nucleus,iv) Low cross sections for the population of individual levels,v) Necessity of X-ray spectroscopy due to the highly converted low
energy transitions,vi) Chemical separations and low level β− counting due to the pure β−
emitters of some of the isomeric states.
1-7 Yield, Effective Cross Section
The term cross-section and yield, widely used in practicalradioisotope production, often differ from basic definitions used in nuclearreactions theory. Different application-oriented groups use these terms in anon-standard way. In order to avoid misinterpretation of the data we brieflysummarize definitions of the most important quantities describing nuclearreactions in the field of practical radioisotope production and activationtechnology.

Chapter I
25
1-7.1 Production Cross-Section
In isotope production and application of monitor reactions, usuallythe activity of the product radioisotope is measured. The related quantity ofinterest is then the integral cross-section or the production cross-section. Itrefers to a sum of cross-sections of all reaction channels on a well-definedtarget nucleus, which lead to direct production of the final nuclide. Thesame final nuclide can also be produced indirectly via the decay ofprogenitors produced simultaneously on the target nucleus. In many casesthe separation of direct and indirect routes becomes not important and oneuses the cumulative production cross-section to describe these two routestogether. This becomes even more complicated when one uses a naturalmulti-isotopic target element where different reaction channels on differenttarget nuclei can contribute to the production of the same finalradioisotope. In this case one uses the elemental production cross-section todescribe all production routes together.
It should be noted that in doing so one must properly calculate thenumber of target nuclei, by summing nuclei of all contributing targetisotopes. If one considers also indirect production routes, the elementalcumulative production cross-section should be used.
Similarly, the notation isotopic production cross-section is used todescribe reactions with mono-isotopic target elements. The present sectionaims to address the needs of everyday practice, where one uses elementaltargets that are generally multi-isotopic and sometimes mono-isotopic.Throughout this section we consistently use the term cross-section. Forbeam monitor reactions, this term means cumulative elemental productionor cumulative isotopic production cross-section of the final nuclide. Formedical radioisotope production, this term means elemental production orisotopic production cross-section of the final nuclide.
1-7.2 Production Yield
A thin target has a thickness so small that the reaction cross-sectioncan be considered as constant through the whole target. This is equivalentto the energy loss being negligible when compared to the energy rangeneeded to see significant changes in the reaction cross-section. A thick
Chapter I
26
target has its thickness comparable or larger than the range of the incidentparticle in the target material.
The yield for a target having any thickness can be defined as the ratioof the number of nuclei formed in the nuclear reaction to the number ofparticles incident on the target. It is termed as the physical yield, Y. It iscustomary to express the number of radioactive nuclei in terms of theactivity, and the number of incident particles in terms of the charge. Thus,Y can be given as activity per Coulomb, in units of GBq/C. The analyticalmeaning of the physical yield is the slope (at the beginning of theirradiation) of the curve of the growing activity of the producedradionuclide versus irradiation time.
Radioisotopes disintegrate during the bombardment, therefore forpractical applications other yield definitions are used taking into accountthis effect. The activity at the end of a bombardment performed at aconstant 1µA beam current on a target during 1 hour is closely related tothe measured activity. In everyday isotope production by accelerators, theso called lµA-lh yield, A1. In practice, this latter quantity can be used whenthe bombardment time is significantly shorter than or comparable with thehalf-life of the produced isotope.
When the irradiation time is much longer than the half-life of theproduced isotope, a saturation of the number of the radioactive nucleipresent in the target is reached, and their activity becomes practicallyindependent of the bombardment time (at a constant beam current). Thisactivity produced by a unit number of incident beam particles is the so-called saturation yield, A2. There are close relationships between the above-mentioned yields. Using the decay constant of the radionuclide λ and theirradiation time t one gets:
( ) ( )1 2 1 281 exp
Y A At
λλ
= = −− −
Several other definitions are often used. Differential or thin targetyield is defined for negligibly small (unit) energy loss of the incident beamin the thin target material. Thick target yield is defined for a fixedmacroscopic energy loss, Ein−Eout, in a thick target. Integral yield is defined

Chapter I
27
for a finite energy loss down to the threshold of the reaction, Ein-Eth. Thethin target yield is easily related to the reaction cross-section and thestopping power of the target material for the beam considered [cf. 26].
To this end, recommended cross-sections discussed in the presentstudy were used. The Yield for any target thickness, Ythick can be obtainedfrom the simple formula:
( ) ( ) ( ) ( ), 1 29thick in out in outY E E Y E Y E− = − −
where Ein is the incident particle energy and Eout is its outgoing energy. Fora more detailed discussion and for practical calculations we refer to theextensive list of references in the literature [cf. 26,28].
In addition, the target stopping powers of Ziegler [cf. 27], and nucleardecay data of Firestone [cf. 4] were used. The stopping-power of the targetelement could be calculated by the SRIM-2003 Code [cf. 27]. SRIM-2003is a software package concerning the stopping and range of ions in matter.Since its introduction in 1985, major upgrades are made about every fiveyears.
For SRIM-2003, the following major improvements were made: (1)About 2200 new experimental stopping powers were added to the database,is increasing it to over 25,000 stopping values. (2) Improved correctionswere made for the stopping of ions in compounds. (3) New heavy ionstopping calculations have led to significant improvements on SRIMstopping accuracy. (4) A self-contained SRIM module has been included toallow SRIM stopping and range values to be controlled and read by othersoftware applications. A full catalog of stopping power plots has beenpublished at www.SRIM.org. Over 500 plots show the accuracy of thestopping and ranges produced by SRIM along with 25,000 experimentaldata points. References to the citations that reported the experimental dataare included. The SRIM-2003 Code in particular, allows the calculation ofboth longitudinal and lateral range and energy straggling of any energeticion in different materials. The SRIM 2003, in particular, allows thecalculation of both longitudinal and lateral range and energy straggling ofany energetic ion in different materials.

Chapter I
28
1-7.3 Thin Target Yield, Effective Cross-Sections
Calculation of the thin-target yields y(E,0) were carried out as afunction of projectile energy E. at the End of an InstantaneousBombardment (EOIB), the yield y(E)EOIB is given by the slope at the originof the growing curve of the activity per unit current (A/I) of a radionuclidesvs. irradiation time, for a target in which the energy loss is negligible inrespect to the projectile energy [cf. 3].
In practice, y(E) is defined from Eq. (1-30), as the second derivativeof A/I in respect to particle energy and irradiation time, calculated when theirradiation time τ tends to zero (i.e., EOIB) [cf. 3]:
( ) ( ) ( )( )
( ),0 0 ( ), 1 30EOIB
AI Bqy E y E y E with C MeVE
ττ
∂ ∂ = = = → − ∂ ∂
where A=Nλ is the radionuclides activity (Bq), I is the beam current(Amp.).
Experimentally, the function y(E)EOIB is calculated by the Eq. (1-31),that holds for a radionuclide produced by direct nuclear reaction only,without any decay charging and for very low dead counting times (i.e.,LT≅RT; DT →0):
( ) ( ) ( ) ( ) ( ) ( )exp ( ) 1 31EOIB
C Bqy E D RT G WT C MeVI LT Q Eγ
γ γ
τε
= − ∆
where N the number of radioactive atoms, Q is the integrated proton charge(C) (obtained either from Faraday cup read-out or beam monitor reactions),Cγ is the net photo-peak counts at energy Eγ above background continuum,Iγ is the γ-emission absolute intensity, εγ is the experimental efficiency atthe γ-energy considered, λ= ln(2)/T1/2 the decay constant (sec.−1), LT isthe live counting time (sec.), DT is the dead counting time (s), RT is thereal counting time (sec.) =LT + DT ; WT is the waiting time from the EOB(sec.), t is the Irradiation Time (sec.), ∆E is the beam energy loss in thetarget (MeV) and the non-dimensional quantities D(RT) is the decay factorto correct decay during counting time and G(τ) is the growing factor tocorrect decay during irradiation, are defined as:

Chapter I
29
( ) ( )RTD(RT)= 1 321-exp - RT
λλ
−
( ) ( )G( )= 1 331-exp -
λττλτ
−
Eq. (1-31) can be deduced from the Eq. (1-34) that defines the thin-targetyield at the energy E:
( ) ( )( ) ( )( ) ( ) ( )
*
, 1 34AE N Bqy E C MeVdEM Z e EdS
σ λ−
= −⋅⋅
where M is the target atomic mass (g/mol), NA the Avogadro’s constant=6.022045(31)×1023 (atom/mol), E = <E> the ‘‘average’’ proton beamenergy in the “thin” target (MeV), σ*(E) the “effective”, or “weighed” (asexplained below) reaction cross-section (cm2), dE/dS the mass stopping-power (MeV/g/cm2), e−= 1.6022×10⁻¹⁹ C, Z the atomic number of theprojectile, S the mass thin-target thickness (g/cm2).
In practice, the approximation ∆E≈S (dE/dS) was considered toocrude for an accurate energy loss evaluation to be used in Eq. (1-34), thus∆E was calculated by the difference of ranges of incoming and outgoingparticle in the target from fitted proton range tables from [cf. 27].
The “effective” cross-section σ*(E) (cm2) as a function of projectileenergy is defined by Eqs. (1-34), and (1-35) [cf. 3]. Even if the physicalmeaning of this parameter is poor, being only a mere summation of theseveral cross sections σi(E) of the reaction channels concerned, weightedon target isotopic composition (i.e. wi and ∑wi = 1), as obtained by thedefinition of Eq. (1-35):
( ) ( ) ( )* , 1 35i ii
E w Eσ σ= −∑
1-7.4 Thick-Target Yield Calculation
The thick-target yield Y(E, ∆E) is defined as a two parameterfunction of incident particle energy E(MeV) on the target and energyloss in the target itself ∆E (MeV) by Eq. (1-36). It holds in theapproximation of a monochromatic beam of energy E; not affected byeither intrinsic energy spread or straggling:

Chapter I
30
( ) ( ) ( ), , 1 36E
E EY E E y x dx
−∆∆ = −∫
in which the integrand y(x) represents the thin-target excitation functionsof Eqs. (1-31), and (1-34). In case of total particle energy absorption in thetarget (i.e., energy loss ∆E=E), the function Y(E, ∆E) reaches a valueY(E,E-Eth); for ∆E = E−Eth; that represents mathematically the envelope ofthe Y(E, ∆E) family of curves. This envelope is a monotonically increasingcurve, never reaching either a maximum or a saturation value, even if itsslope becomes negligible for high particle energies, and energy losses.
Eq. (1-36) states that the production yield of a thick-target does notincrease further, if the residual energy in the target is lower then thenuclear reaction energy threshold, Eth. In practice, the use of a targetthickness larger than the “effective” value is unsuitable from technologicalpoint of view, due to the larger power density Pd(W/g) deposited by thebeam in target material itself, instead of target cooling system [cf. 3].
The expected yield Y of a radioisotope from a particular thickness oftarget and nuclear reaction can be calculated using Eq. (1-37):
( )( ) ( ) ( )1
1 exp 1 37Ab
N F dEY I t E dE
M dxλ σ
− = − − − ∫
In this equation F is the fraction of the target isotope of the element,M is the molecular weight, Ib is the beam current, t is the irradiation time, λis the decay constant of the produced nuclide, dE/dx is the stopping power,and σ(E) cross section correspond to energy E.
As the incident beam propagates through a thick target, its energydecreases due to the stopping power of the material. The reaction cross-section values in this case varying with the energy degradation. Supposingthose values steady within successive intervals of thickness 1 MeVcorresponding to stopping power of the target, the calculation of the yield isperformed by integration over the whole energy range for themultiplication of the resulting stopping powers by cross section values.
The calculated value represents the maximum yield which, can beexpected from a given target. In practice the experimentally obtained yieldin high-current production runs is always lower than the theoreticallycalculated value, due to radiation damage effects, inhomogeneity inincident beam, losses of target material caused by the intense ion beam.The accurate knowledge of excitation functions, and therefore, the

Chapter I
31
theoretical thick target yield, helps in designing target systems capable ofgiving optimum yields [cf. 17].
1-8 The Aim of the Present Study
The aim of the present work is to study the excitation functions ofthe proton induced reactions on natural Mo and Gd, the radioactiveproducts obtained from the physical processes involved in charged particleirradiation of individual isotopes. The experience gained from this studyhas been helpful in describing the adopted method in our laboratories toproduce 94gTc, 95gTc, 95mTc, 96mgTc, 152mgTb, 154mTb, 154gTb, 155Tb, 156Tb, and160Tb radionuclides via proton-cyclotron irradiation on molybdenum,gadolinium targets of natural isotopic composition. The development ofroutine methods for radioactively labeled precursor production fordiagnosis and therapy as well as the development of procedure for themeasurement of charged particle radiation. The technical aspects related tothe uses of produced radionuclides for thin layer activation technique, andreadjusting of nuclear data used Mo as a monitor are included in the study.The need for this study arose from the increasing number of medicalapplications that use 99mTc and its analogues 94Tc, 95Tc and 96Tcradionuclides. Several nuclear tools are used to produce theseradionuclides. Neutron induced reactions in reactors as well as protoninduced reactions in cyclotrons and accelerators are used in the productionof these radionuclides from natural and enriched elements, respectively.Small sized cyclotron is a promising means in the production of high purityradioisotopes with high specific activity. These small sized cyclotrons areof low energy range from 5 up to 20 MeV. The reaction cross sections ofthe studied reactions were determined experimentally and validated usingnuclear model calculations.
To verify published experimental cross section data sets measuredearlier, a new set of experimental thin-target excitation functions and''effective'' cross-sections for direct nuclear reactions are performed, withincident proton energies in the range from threshold up to 18 MeV. Newexperimental observations and data might help theoreticians in developingsome models for a concise description of the data. Dealing with one of thefactors affecting the accuracy of measured data that is due to fluxdetermination. This new approach revealed a new effect that clarified someaspects of the beam broadening due to straggling, and scattering effectswere observed as a non-uniform increase in the beam penetration region.The multi monitors were then utilized in a new method for measuringcharged particle beam fluxes. Thick-target yield values were calculated andoptimized, by numerical fitting and integration of the measured excitation

Chapter I
32
functions. These values allow optimization of production yield of oneradionuclide, minimizing at the same time the yield of the others.
To perform this study, the available cyclotron and the associatedfacilities at Inshas Cyclotron Facility matched with the above mentionedrequirements. The fundamental data of nuclear reactions useful for theirproduction should be studied. For low energy cyclotrons (E < 20 MeV) theproton induced reactions on selected targets were chosen to produce theseisotopes. The study includes cross section measurements of the investigatedreactions. The activation method and the stacked foil technique using highresolution HPGe gamma ray spectrometer were applied to determine theexcitation function.
Reliable data sets were produced with the help of simultaneousmeasurements of the excitation functions of natTi(p,x)48V, natCu(p,x)63Zn,and natCu(p,x)65Zn monitor reactions. From the measured cross-sections theexcitation functions are drawn and the integral yields are estimated for theentire product radionuclides. To validate the obtained cross section datanuclear model calculations of the same reaction cross sections areperformed. The computer codes ALICE-91 [cf. 29] and EMPIRE-II [cf.30], have been used in this work. The resulting cross-sections by the codescalculation are compared with the measured values for comparison.

Chapter II
33
2-1 Literature Review
2-1.1 Technetium-99m
The element of Technitium has isotopes with half-lives ranging fromsix hours up to sixty day, the decay schemes of these isotopes of mostimportance. Table (2-1) gives the decay data of radioisotopes of technetiumand their gamma ray energies. 94mTc, 95mTc, 95gTc, and 96m,gTc have aconvenient half-lives and a reasonable γ-ray energies. Many Tcradioisotopes have been artificially synthesized and sometimes chemicallyseparated from irradiated targets. Some Tc isotopes can be used as general-purpose radiotracers to study the physicochemical properties of theelement. Among them, 99mTc is at present, without any doubt, the mostextensively used radiotracer in Nuclear Medicine imaging. In fact the short-lived 99mTc, which is commercially available from the decay of its parentradionuclide 99Mo (T1/2 = 2.7477 d), is widely used to label a wide range oforganic complexes and coordination compounds for diagnostic purposessince (1956), when the generator was developed at Brookhaven NationalLaboratory [cf. 31-33].
In more recent years, Nuclear Medicine has shown a growing interestin the cyclotron-produced short-lived positron-emitter 94mTc, as a flowagent bridging Single Photon Emission Computerized Tomography(SPECT) and Positron Emission Tomography (PET) imaging [cf. 34-36].This last radionuclide seems promising for human PET investigations [cf.37-41] in spite of low spatial resolution, due to its high energy positronemissions (End Point=3460 keV, <753> keV, Firestone et al, (1996) [cf. 4].One aim of the present investigation is to define whether the very importantmedical radionuclide 99mTc and/or the 99Mo−99mTc generator, can bepractically produced using an alternative technology such as acceleratoractivation of Mo with protons.
Radioisotopes of technetium are of considerable interest in medicinebecause of their suitable nuclear and chemical characteristics. Technetiumisotopes could label Organic and inorganic compounds due to multidentatecoordination bonds according to chelation [cf. 42,43]. During the earlyyears of the last decade the available γ-cameras were suitable only for thelow-energy rather than for the higher energy γ-rays. Therefore more effortshave been devoted to the production of 99mTc, and its analogues withanother root rather than reactor by using cyclotrons. Furthermore, theAuger electrons emitted in the decay of 96m,gTc are of some therapeuticinterest. Experimental thin-target excitation functions shall lead to deduce

Chapter II
34
the "effective" cross-sections. Thick-target yield values calculated from theobtained data will be helpful in:
(1) Optimizing the production yield of one radionuclide,(2) Ease in radiochemical separation of NCA (no carrier added)
radionuclides,(3) Minimizing at the same time the yield of the others by numerical
fitting and integration of the measured excitation functions,(4) High radionuclidic purity.
Reliable data sets can be produced with the help of simultaneousmeasurement of the excitation functions of natTi(p,x)48V, natNi(p,x)57Ni,natCu(p,x)62Zn, natCu(p,x)63Zn, natCu(p,x)65Zn monitor reactions in the wholeinvestigated energy range. The new cross-section values indicate thenecessity of normalizing the excitation functions of about 250 of protoninduced nuclear reactions by a factor of 0.8 measured earlier by V.N.Levkowski using the natMo(p,x)96mgTc process as monitor reaction. 96m,gTcis a gamma emitter and its half-life is suitable for long-term physiologicalinvestigation using Single Photon Emission Computed Tomography(SPECT).
Excitation functions for the 100Mo(p,2n)99mTc, 100Mo(p,pn)99Mo and98Mo(p,γ)99mTc nuclear reactions which are responsible for the productionof 99mTc from natural element. The optimum energy range for the100Mo(p,2n)99mTc reaction is 22 to 12 MeV with a peak at ∼17 MeV andmaximum cross section of ∼200 mb as suggested by Scholten et al., see [cf.44]. Over this energy range the production yield of 99mTc amounts to 11.2mCi (415 MBq)/µA h or 102.8 mCi (3804 MBq)/ µA at saturation. There isno serious radionuclidic impurity problem. Production of 99Mo is not viabledue to the low cross section (∼1.3 mb) over the proton energy range of 30to 50 MeV. The 98Mo(p,γ)99mTc reaction was found to have a cross sectionof <0.2 mb over the proton energy range studied.
The earlier assignment of this reaction channel as a potential routefor production of 99mTc with a medical cyclotron is explained in [cf. 44].The countries that do not have access to fission molybdenum-99 for the99Mo→99mTc generator, could consider use of protons energy higher than>17 MeV at the cyclotrons for regional production of 99mTc. The99Mo→99mTc generator and 99mTc radiopharmaceuticals account for over80% of nuclear medicine procedures worldwide. It is estimated that in theUnited States, Europe and Japan over 20 million nuclear medicine scansare performed annually that involve application of 99mTc [cf. 42,43]. The

Chapter II
35
present study was undertaken because of the continuing concern about thefuture supply of fission molybdenum-99 which is produced by nuclearreactors.
The feasibility of direct production of Curie quantities of 99mTc witha compact medical cyclotron by the 100Mo(p,2n)99mTc nuclear reaction andlesser quantities of 99Mo for the 99Mo→99mTc generator by the100Mo(p,pn)99Mo nuclear reaction was reported by Beaver and Hupf (1971)[cf. 46], and confirmed by Almeida and Helus (1977) [cf. 47]. Theinvestigators used Mo foils of natural isotopic composition andextrapolated the radionuclidic yields to a target of 97.4% isotopicenrichment in 100Mo. The need for measurement of the excitation functions,production yields and resultant radionuclidic purity, as controlled by theisotopic composition of the target, was identified by Lambrecht et al.(1988) at an IAEA-Consultants Meeting on Nuclear Data for MedicalRadioisotope Production [cf. 48]. Subsequently, Lagunas-Solar et al.(1991); (1993) reported data using protons on Mo foils [cf. 49,50].
Another data set was reported by Levkowski (1991) [cf. 51], asmentioned by Schopper (1993) [cf. 52], but no details are available.Lagunas-Solar et al. reported puzzling results (1991) and interpretation(1993) of the cross section data measured on Mo of natural isotopiccomposition. They were extrapolated to predict the excitation functions thatwould be expected to yield Tc radionuclides resulting from the protonirradiation of isotopically enriched Mo isotopes. There were considerablediscrepancies between their prediction of the optimum proton beam energyand expected thick target yield and the earlier reports of Beaver and Hupf(1971), and Almeida and Helus (1977) [cf. 46, 47]. All the three groups hadused Mo of natural isotopic composition for their irradiations, and thenextrapolated the results to 100Mo of 97.4% isotopic enrichment. Thesignificant discrepancies in the nuclear data from the various laboratoriesaroused both interest and concern whether accelerator production of 99mTcand/or 99Mo was a viable option for routine production of these importantmedical radionuclides. This is an important consideration fortechnologically developing countries or countries contemplatingreplacement of aging nuclear reactors for the purpose of medicalradionuclide production.

Chapter II
36
Table (2-1): Principal Direct Nuclear Reactions, Decay Data Leading to theMain Radionuclides we are Interested in, that Occur in Proton Irradiated
natMo and their Calculated Threshold Energies, Eth [cf. 45]. All theRadionuclides Cited are Identified in the γ-Spectra of this Experiment,
either at EOB or some Time Later [cf. 4].Nuclide Half-Life Decay Mode
(%)Eγ
(MeV) Iγ (%) ContributingReactions
Threshold(MeV)
99mTc 6.01h IT(100) 140.5 89.06100Mo(p,2n)98Mo(p,γ)100Mo(p,pn)
7.790.0
6.1399Mo 65.94h β−(100) 181.0 6.07 100Mo(p,pn) 6.13
96mTc 51.5m EC(98) 778.21200.2
1.91.08
96Mo(p,n)97Mo(p,2n)98Mo(p,2n)
3.7910.6919.42
96gTc 4.28d EC(100)
778.2812.5849.9
1126.81200.2
99.7682.098.015.00.37
96Mo(p,n)97Mo(p,2n)98Mo(p,3n)96mTc decay
3.7910.6919.42
96Nb 23.4h β− (100)
568.8778.2849.9
1200.2
58.096.4520.4519.97
96Mo(p,2p)97Mo(p,2pn)98Mo(p,pd)98Mo(p,3He)100Mo(p,αn)
9.3218.0515.8010.253.82
95mTc 61.0d EC(96.12) 835.1 26.695Mo(p,n)96Mo(p,2n)97Mo(p,3n)
2.5011.7518.64
95gTc 20.0h EC(100) 765.8 93.8
95Mo(p,n)96Mo(p,2n)97Mo(p,3n)95mTc decay
2.5011.7518.64
94mTc 52.0m EC(100) 1868.7 5.794Mo(p,n)95Mo(p,2n)96Mo(p,3n)
5.0912.5421.56
94gTc 4.9h EC(100) 702.7 99.7
94Mo(p,n)95Mo(p,2n)96Mo(p,3n)94mTc decay
5.0912.5421.56
92mNb 10.15d EC(100) 934.4 99.07
94Mo(p,3He)95Mo(p,α)96Mo(p,αn)
9.710.0
5.6148V 15.97d EC(89),
β+(11)944.1983.5
7.7699.98
natTi(p,x) 4.89
57Ni 35.6h EC+β+(100) 127.21377.6
16.781.7
natNi(p,x) 10.17
62Zn 9.168h EC+β+(100) 548.3596.6
15.326.0
natCu(p,x) 13.47
63Zn 38.47m EC+β+(100) 669.6962.1
8.06.5
natCu(p,x) 4.2165Zn 244.26d EC+β+(100) 1115.5 50.6 natCu(p,x) 2.17

Chapter II
37
While 99Mo→99mTc generator is usually produced in nuclear reactorby both thermal neutron irradiation of natural 98Mo(n,γ)99Mo→99mTc andthermal fission on highly enriched 235U via 235U(n,f)99Mo-processes Boyd,(1983) [cf. 33]. 94mTc is more commonly produced by accelerators viairradiation by protons, deuterons, helium-3 and alpha beams of either 93Nbor 94Mo enriched targets [cf. 38,39,40,53-55]. Up to now, less effort in thisarea was devoted to production of other very short-lived Tc radionuclides,such as 92Tc and 93gTc, even if their application in the Nuclear Medicineimaging field by PET, seems promising, as suggested by [cf. 38,56].
2-1.2 Technetium-99m Analogues
The 99mTc analogues that could be produced from natural Mo targetvia irradiating molybdenum targets of natural isotopic composition byprotons are 94gTc, 95gTc, 95mTc and 96gTc radionuclides [cf. 3].
In the literature, several experimental data and theoreticalcalculations are available, which describe either the nuclear cross-sectionsor the thin-target yields of Tc isotopes from targets of natural isotopiccomposition, in a sufficiently wide energy range [cf. 56-58]. The studieswere mostly carried out with proton [cf. 58-63], deuteron [cf. 54], alpha [cf.41,53,65], 3He [cf. 38] beams. In particular, alpha and helium-3 irradiationon 93Nb is justified from basic nuclear physics point of view by the mono-isotopic composition of natural niobium.
Some papers were published on photo-nuclear reactions on 99gTc [cf.64,65] deal with irradiation of 99gTc to produce Ru radionuclides, reportingdata concerning, also the production of 95,96,99mTc via side reactions [cf. 66].For production purposes proton beams are normally preferred [cf. 3], due tothe lower stopping-power and larger range than deuterons and helions, ascalculated by the SRIM-2003 code [cf. 27]. The use of variable energyproton-cyclotron beams presents remarkable advantages to induce (p,xn)reactions on either natural or isotopically enriched targets with the aim ofdetermining excitation functions and cross-sections. For this reason, weengaged a set of experimental determination of the thin-target excitationfunctions and the “effective” cross-sections for the nuclear reactionsnatMo(p,xn)ATc (with A = 94, 95, 96 and 99) [cf. 4].
Production via irradiation of Mo is very advantageous due to the lowcost of natural metallic molybdenum, its good thermal and electricalconductivity and its very high melting point (2623 °C) [cf. 4]. Someliterature works comparable with the present we do exist, but were carriedout with different aims. They report only some thick-target yield values at

Chapter II
38
specific energies for wear studies Ouellet et al., (1993) [cf. 67], or consistof systematic studies, but in a lower energy range Roesch and Qaim, (1993)[cf. 39]. Besides the direct (p,xn) reactions, other side reactions thatproduce some Mo, Nb and Zr radionuclides occur in the natMo target [cf.44,49,50,51].
Recommended cross-sections for monitor reactions induced withproton to produce 96m,gTc, and 96Nb by the reactions natMo(p,x)96m,gTc;natMo(p,x)96Nb processes also are of a great benefit in TLA (Thin LayerActivation Technique). Cumulative cross-sections, thick target yields andactivation functions would be deduced and compared with availableliterature data. Molybdenum targets of natural abundance used for protoninduced reactions to obtain the cumulating, and isomeric cross-sectionsratios, and thick target yields and the excitation functions aid in assigningactivation curves can be used in the field of TLA-technique and beammonitoring for proton beam.
2-1.3 Terbium
Our research interests for Terbium is related to the field of MedicinalInorganic Chemistry, in particular the chemistry of complexes of thelanthanides, such as terbium, gadolinium, and europium as luminescentsensors. Tb complexes could be used as contrast agents in MRI (magneticresonance imaging), which visualizes water molecules in the human bodyWe are also interested in the use of radioisotopes of certain lanthanides andgroup 13 metals in diagnostic and therapeutic nuclear medicine. Severalterbium complexes in macroscopic amounts are used in medical research ascontrast agents for Magnetic Resonance Imaging (MRI) [cf. 68, 69].
In order to study the bio-distribution of those magneto-pharmaceuticals in vivo experiments were done on animals using 152mTb(TI/2 = 17.5 h) as a radionuclidic marker [cf. 70,71]. Due to its short half-life, this radioisotope, however, terbium could be used in humans ratherthan gadolinium 153Gd (TI/2 = 241.6 d) of longer half-life which, cannot beused. To study the detailed behavior of MRI contrast agents, it would bemeaningful to combine the techniques of MRI and Single Photon EmissionComputed Tomography (SPECT) by using an appropriately labeledmagnetopharmaceutical [cf. 72,73]. The data obtained on the uptakekinetics would allow a better estimate of the diagnostic potential of newTb-compounds in MRI. Of all the radioisotopes of terbium, 152mTb seem tobe the most suitable for SPECT imaging: it has a half-life of 17.5 h and astrong γ-ray of 344 keV (65%). 160Tb is of considerable importance due toits decay mode by electron emission of 209 keV (100%) as well as a

Chapter II
39
cascade of auger electrons accompanying its γ-ray emission [cf. 74,75].Table (2-2) gives the decay data of radioisotopes of technetium and theirgamma ray energies. 154mTb, 154gTb, 155Tb, 156Tb, and 160Tb have aconvenient half-lives and a reasonable γ-ray energies.
The water present in various tissues behaves differently, allowing adetailed, non-invasive image of the body to be generated. Signal intensity islargely dependent on the time excited water molecules take to relax back totheir normal states. When in close contact with certain metal ions (e.g.gadolinium) this can be rapid. Terbium complexes (contrast agents) arethus injected into the body to enhance image contrast [cf. 72,73].
The slower the Terbium complex tumbles in solution, the faster itrelaxes giving a more intense signal. One method of slowing the tumblinghas been the formation of host-guest non-covalent interactions between theTerbium chelate and slowly tumbling macromolecules. The mostsuccessful applications to date have been the design of chelates bearinghydrophobic units that can bind to the protein Human Serum Albumin(HSA). By careful design of novel hydrophobic moieties and rigid spacers,aims to produce complexes that remain in the blood stream and image thecardiac region. Such compounds are being sought for use in MagneticResonance Angiography [cf. 76]. All the Radionuclides Cited are Identifiedin the γ-Spectra of this Experiment, either at EOB or some Time Later fromthe decay data that are taken from the Table of Isotopes [cf. 4].
A review of the past decades research into lanthanides complexes asMRI contrast agents reveals a paucity of other examples than terbium, withmost research concentrating on subtle variations on these themes. In lightof this, we believe there is scope to develop new types of ligandarchitectures for the lanthanides [cf. 77]. By reviewing the computer indexfor experimental nuclear data library for proton induced reaction that couldbe carried out on gadolinium target we did not find any available for152,154,155,156,157,158,160Gd. So this is a fact reaction explain itself theimportance to carry out such a measurements to find out this route ofreactions that can lead to produce some radionuclides of most importancein several technological purposes. For example to produce 152,154,155,156,160TbFrom the isotopes natGd only one work done by C. Birattari et al., 1973 [cf.78], for (p,n) reaction cover the energy range from 3.4-43.6 MeV. Werecommand the use of terbium radioisotopes in nuclear medicine fortherapy and diagnosis, due to its decay scheme properties.
The significant discrepancies in the nuclear data from the variouslaboratories aroused both interest and concern whether accelerator

Chapter II
40
production of 99mTc and/or 99Mo was a viable option for routine productionof these important medical radionuclides. This is an importantconsideration for technologically developing countries or countriescontemplating replacement of aged nuclear reactors for the purpose ofmedical radionuclide production. Excitation functions were measured bythe conventional stacked-foil technique Piel et al., (1992); Scholten et al.,(1995); Takacs et al., (2002) [cf. 79,80,81].
Table (2-2): Principal Nuclear Reactions, Decay Data Leading to the MainRadionuclides We Are Interested in, that Occur in Proton Irradiated natGd
and their Calculated Threshold Energies, Eth [cf. 4,45].Nuclide Half-
LifeDecay
Mode (%) Eγ (MeV) Iγ (%) Contributing Reaction Threshold(MeV)
152Tb 17.5h EC(100) 344.4596.3
65.09.4
152Gd(p,n) 4.80
154mTb 9.4h EC(78.2)
247.9540.1649.5996.31004.7
22.020.011.09.0
11.0
154Gd(p,n)155Gd(p,2n)156Gd(p,3n)
4.3710.8519.44
154gTb 21.5m EC(100)722.1996.31274.4
8.05.0
11.0
154Gd(p,n)155Gd(p,2n)156Gd(p,3n)
154mTb decay
4.3710.8519.44
155gTb 5.32d EC(100)
86.55105.32180.1262.3
31.8124.91
7.45.2
154Gd(p,γ)155Gd(p,n)
156Gd(p,2n)157Gd(p,3n)
0.001.61
10.2116.61
156Tb 5.35h EC(100)199.2262.54537.99
41.05.8
67.0
155Gd(p,γ)156Gd(p,n)
157Gd(p,2n)158Gd(p,3n)
0.003.259.65
17.64
160Tb 72.3d β− (100)
879.4298.58966.2
1177.96
30.025.5125.2115.1
160Gd(p,n) 0.89
2-2 Summary of Earlier Investigations
Table (2-3) gives a summary of the earlier investigations of theproton-induced data from the available literature. From the literaturesurvey, it is noticed that some excitation functions of proton inducedreactions producing Tc and Tb were not well investigated, specially in thelow energy range of 5 to 18 MeV.
The major objective of this work was to evaluate the potential ofutilizing proton accelerators as a supply source of 99mTc and its analoguesfamily as well as Tb new radionuclides for use in diagnostic and therapynuclear medicine.

Table (2-3): Gives a Summary of the Earlier Investigations of the Proton Induced Data from the Literature.
Author [cf.] Target Irradiation MonitorReaction
Measurementof Activity
Decay Data (D)Stopping Power S)
ReactionMeasured
QuantityNo. of Data
PointsEnergy Range
Hogan[cf. 59]
Mixture ofMo-Oxides,Cu-Oxides,Enrichment96.8%
CyclotronStacked foilmethod
Cu-monitor
Ge(Li) noChemicalSeparation
Not given96Mo(p,x)96mTc96Mo(p,x)96gTc
Sig. No.10Sig. No.10
10.0-80.010.0-80.0
Almeida andHelus[cf. 47]
natMo, foils150 µm thick
CyclotronStacked foilmethod
FaradayCup, Cu-monitor
Ge(Li)ChemicalSeparation
Not given
natMo(p,x)99mTcnatMo(p,x)96TcnatMo(p,x)95TcnatMo(p,x)94TcnatMo(p,x)93TcnatMo(p,x)99Mo
Yield No.7Yield No.7Yield No.7Yield No.7Yield No.7Yield No.7
8.0-24.55.0-24.53.0-24.55.5-24.510.0-24.59.0-24.5
Skakun et al[cf. 81]
96Mo, 1-5mg/cm2
Linac, Ep=9MeV
FaradayCup,
Ge(Li) noChemicalSeparation
Lederer and Shirley1978 (D)
96Mo(p,x)96mTc96Mo(p,x)96gTc
Sig. No.10Sig. No.10
4.5-9.04.5-9.0
Lagunas-Solar[cf. 49]
natMo, foils12.7 µm thick
CyclotronStacked foilmethod
FaradayCup, Cu-monitor
Ge(Li) noChemicalSeparation
Lederer and Shirley1978 (D)Williamson et al.,1966 (S)
natMo(p,x)99mTcnatMo(p,x)96TcnatMo(p,x)95TcnatMo(p,x)94TcnatMo(p,x)99Mo
Sig. No.75Sig. No.75Sig. No.75Sig. No.75Sig. No.62
9.54-24.69.54-24.69.54-24.69.54-24.613.3-24.6
Levkowski[cf. 82]
Oxide ofEnriched97Mo, 98Mo,100Mo,
CyclotronRotatingtarget
Mo-monitornatMo(p,x)96Tc
Ge(Li) noChemicalSeparation
Not given
96Mo(p,n)96mgTc97Mo(p,2n) 96mgTc98Mo(p,3n) 96mgTc97Mo(p,2p)96Nb98Mo(p,2pn) 96Nb100Mo(p,αn) 96Nb
Sig. No.13Sig. No.21Sig. No.11Sig. No.7Sig. No.5Sig. No.16
7.7-18.311.0-29.520.3-29.524.0-29.525.7-29.515.8-29.5
Zuravlev et al.,[cf. 83]
Enriched 96Mo, 96.7 %
CyclotronStacked foilmethod
FaradayCup,
Ge(Li) noChemicalSeparation
Not given94Mo(p,n)96gTc95Mo(p,n)95mTc96Mo(p,n)95gTc
Sig. No.2Sig. No.2Sig. No.2
5.43-5.955.15-6.025.5-5.95

Table (2-3): Gives a Summary of the Earlier Investigations of the Proton Induced Data from the Literature, (Followed).
Author [cf.] Target Irradiation MonitorReaction
Measurementof Activity
Decay Data (D)Stopping Power S)
ReactionMeasured
Quantity No.of DataPoints
EnergyRange
Lagunas-Solar[cf. 84]
natMo, foils12.7 µm thick
CyclotronStacked foilmethod
FaradayCup,
Ge(Li) noChemicalSeparation
Lederer and Shirley1978 (D)Williamson et al.,1966 (S)
natMo(p,x)99mTcnatMo(p,x)96TcnatMo(p,x)95TcnatMo(p,x)94TcnatMo(p,x)93TcnatMo(p,x)99Mo
Sig. No.50Sig. No.50Sig. No.51Sig. No.50Sig. No.49Sig. No.49
10.6-67.57.6-67.55.1-67.55.1-67.512.0-67.519.0-67.5
Wenrong etal.,[cf. 85]
natMo, foils, 6-20 mg/cm2 thick
TandemVdG
FaradayCup,
HPGe noChemicalSeparation
Williamson et al.,1966 (S)
natMo(p,n)96gTcnatMo(p,n)95mTcnatMo(p,n)95gTc
Sig. No.17Sig. No.17Sig. No.17
6.81-21.856.81-21.856.81-21.85
Scholten et al.,[cf. 44]
Enriched 100Mo-Foil, 98Mo-Oxide
CyclotronStacked foilmethod
FaradayCup, Cu-monitor
HPGe noChemicalSeparation
Firestone, 1996 (D)Brown and Firestone1986 (D) Williamson et al.,1966 (S)
100Mo(p,2n)99mTc98Mo(p,γ)99mTc100tMo(p,2p)99Mo
Sig. No.27Sig. No.22Sig. No.26
16.0-3.038.2-22.145.5-29.745.5-13.765.0-42.0
Bonardi et al.,[cf. 3]
natMo, foilsCyclotronsingle foilirradiation
FaradayCup, Cu-monitor
HPGe noChemicalSeparation
Brown and Firestone1986 (D)Williamson et al.,1966 (S)
natMo(p,x)96mgTcnatMo(p,x)95gTcnatMo(p,x)95mTcnatMo(p,x)94gTc
Yield No.17Yield No.17Yield No.17Yield No.17
4.9-43.74.9-43.74.9-43.74.9-43.7
Takacs et al.,[cf. 86]
natMo, foilsCyclotronStacked foilmethod
FaradayCup, Cu-monitor
HPGe noChemicalSeparation
Brown and Firestone1986 (D)Anderson Ziegler1983 (S)
natMo(p,x)96mgTcnatMo(p,x)96Nb
Sig. No.24Sig. No.18
5.7-37.9119.0-37.9
Birattari et al.,[cf. 78]
natGd, foils19 mg/cm2
CyclotronStacked foilmethod
FaradayCup,
Ge(Li) noChemicalSeparation
Not given natGd(p,x)160Tb Sig. No.24 4.3-43.6

Chapter III
43
3-1 Introduction
This chapter contains the experimental procedures used in thepreparation of stacks, irradiation conditions, gamma ray counting of theresulting radionuclides, beam energy, flux determination, the correctionerror considered through this study, and cross section measurements byusing the activation technique. Before cross section determination, we havepaid attention to the uncertainties in beam energy, detector absoluteefficiency, and beam flux determination. These three quantities are ofconsiderable importance, affecting the resultant cross section values. Theexact incident energy and the effective detector efficiency were quite dealtby a settled technique. We introduced an approach to determine theincident flux more accurately. The Inshas Cyclotron facility that used forirradiation and measurement is demonstrated by schematic diagrams anddetailed descriptions. The estimation of uncertainty and sources ofexperimental errors are given at the end of this chapter.
3-2 The Cyclotron
Ernest Lawrence first demonstrated the use of charged particleaccelerators for radionuclide production in (1934) [cf. 9]. The developmentof the fission nuclear reactor during World War-II, and the availability ofthe comparatively cheap and long lived fission products and neutroninduced isotopes, resulted in a retardation of cyclotrons used inradionuclide production.
The cyclotrons are finding increased applications in the productionof radionuclides, especially for medical purposes. Today a large number ofcyclotrons are used worldwide for medical radioisotope production [cf.15,87]. The common terminology for these cyclotrons is “medicalcyclotron” or “compact cyclotron”. Many of them have been installed inhospital environments and are employed extensively for preparation ofshort-lived radionuclides with very high-specific activities for direct use onsite. For reasons of cost and efficiency, cyclotrons are the most commonlyused accelerators for some radionuclide production. More specifically,cyclotrons are technically less complicated than other accelerators and theobtained particle beam currents obtainable are high.
Level I cyclotrons, having rather low beam energy ≤10 MeV, oftenrequire the use of isotopically enriched target isotopes in order to producesufficient amounts of the desired radionuclides. When using level IIcyclotrons the targets turned to enriched target materials, mostly in order toavoid interferring reactions, resulting in a contamination of the

Chapter III
44
radionuclidic product. The work presented in this thesis has been carriedout with the 103 cm AVF (level II) cyclotron at Inshas, Nuclear ResearchCenter, Atomic Energy Authority, Cairo, Egypt. Figure (3-1) displays apicture for the 103 AVF (MGC-20) cyclotron. A variable energy, multi-particle isochronous cyclic accelerator is installed. This compact machineis particularly suited for regional production of commercially distributingradioisotopes for clinical use. In Figure (3-2) a scheme of the layout of thelaboratory is shown [cf. 88]. The characteristics of the machine aresummarized in Table (3-1). The scope of any radionuclide productionprogram is the determining factor in cyclotron choice. Table (3-2) makes arelation between the program and the particles, particle energy, availablecurrent of the machine would be used in radionuclides production [cf. 89].While there can be an extension of scope of nuclide production in fourparticles cyclotron Level-II machine.
Table (3-1): Particles Species, Their Energies and Intensities for theExternal Beam of the Inshas Cyclotron MGC-20 [cf. 88].
Particle Energy Range[MeV]
Maximum Particle Beam Intensity[µΑ]
Proton 5-18 50Deuteron 3-10 50
3He 8-24 25Alpha 6-20 25
Level-II machines can support a research program in addition to theclinical program. But due to the small quantities of acceptable pureradionuclides produced using 3He and 4He (in the 6-24 MeV) the machinemay be of single use in research program more than in a clinical program.To produce 13N, 15O and 18F (all p-induced) enriched stable isotopes mustbe used, beside the cost factors involved, efficient targetry and recoverysystems have to be developed. Level-II machine has the flexibility forswitching source gases, H2, D2 at the control console and automated controlof the requisite RF. Thus particle switching and beam readjustment timeshould not exceed 5-10 minutes. Once the beam has passed through thevacuum isolation foil of the machine, the energy and the current bringingheat into the foil itself. Generally up to 2000 Watts presents no problemand the design of most system tolerating higher. The vacuum system of themachine must be protected with rapidly closing automated valves might theisolation in case of foil rupture.
.

Chapter III
45
Figure (3-1): Picture for the 103 AVF (MGC-20) cyclotron (level-II) at the Inshas Cyclotron Facility.

Chapter III
46
Figure (3-2): Layout of Cyclotron and Beam Transport System at theCyclotron Laboratory of Inshas MGC-20 (AVF) [cf. 88].

Table (3-2): Gives a Relation Between the Machine and the Particles, Particle Energy, Available Current.
Level II Cyclotrons
Manufacturer Scand MC16F JSW8C168 BC1710 CG12
Sum 325 CS-18 CP-18^ MGC-20
Proton (MeV)Deuteron (MeV)
Other avail. ParticleProton Current (µA)
Deuteron Current (µA)Weight (Kt)Ion Source
Dee SystemMag. Field Stg. Tesla
Accel. Frequency, MHz (p)Accel. Frequency, MHz (d)
Pumping
Installed PowerSelf Shielding
178.5yes5050
17Ktaxial
2 x 90°---
Diffusion
110 KVAAvail.
168
no5050
> 22axial-
penning2 x 451.544747
Turbomolec.
183KVAPartial
1710no5050
> 33axial-
penning2 x 45
1.4p, 1.5d43.547
Diffusion
-partial
168
no5050
> 14radial-Living-
stone-Jones1x 1801.7826
40.5Diffusion
150KVAnone
179
yes6010023
radial-penning2 x 901.752714
Oil-Diffusion120KVAAvail.,
179
no50-
23radial-
penning----
Oil-Diffusion
-none
1810yes505024
axial-penning2 x 140
1.4--
Diffusion
260KVAnone
All machines listed are isochronous AVF, MC16F–Scanditronix, Upsala, Sweden; JSWBC-168 and BC-1710 Japan Steel works, Muroran, Japan; CG-12 and Sum-325, CGR-MeV-SUMITOMO, Buc, France, Tokyo,Japan; CS, CP The Cyclotron Corporation, Berkeley, CA, USA. (^ Variable energy negative ion machine) [cf. 89].

Chapter III
48
The beam shape emerging from a cyclotron usually is roughlyrectangular, some shaping may be introduced inside the cyclotron by theuse of magnetic channels, and exterior manipulation of the beam toproduce an optimum shape. To maximize the use of rectangular beamtargets constructed with the same shape, advantages of the cylindrically orconically shaped targets are so mandate and concordant. Using of focusingmagnet systems can shape beams, the complexity of the system determinethe quality of the shape. Usually an elliptical shape with relatively shortsemi-major axis (cross section from 0.5 to 4.0 cm sometime to 10 cm) isdesirable. Since the optimization of the yield from particular target dependson the chemistry of the target which is sensitive to both Dose/Unit volumeand Dose rate/Unit volume during irradiation. That providing focusing,expansion or contraction of the beam. The beam should also have auniform density in the cross-section, lake of uniformity, especially thepresence of hot spots (i.e. very small areas of beam where the particle fluxcan be 10-104 higher than the average beam), can cause repeated foilruptures. Where heat transfer from these microscopic areas is notsufficiently rapid. This becomes especially important in high-pressuretarget systems. The solution is in the use of rapid oscillation (500-1000 Hz)of a small beam in a spiral or raster pattern to improve windowperformance.
3-3 Stacked Foils Technique
Studying the experimental behavior of the excitation functions forTc, and Tb radionuclides, thin Mo, and Gd foil targets of uniform thicknesswere irradiated with protons of energies 15, and 18 MeV. The protonenergy degradate through each foil was about 500 keV. High purity Gd(99.9%) metallic foils (Goodfellow Metals, UK), and high purity Mo(99.9%) metallic foils (Sigma-Aldrich Chemie, Germany) have been used.The thickness uniformity of the foils were determined by weighting of alarge piece of foil having a well defined surface area. They were10.0µm±2.0% for Gd, equivalent to 7.901 mg/cm2±2.0%, and25.0µm±1.4% for Mo, equivalent to 25.7 mg/cm2±1.4%. Table (3-3)contains the isotopic composition of natural Molybdenum, andGadolinium.
In order to obtain the excitation function of any reaction, a number ofcross section values over the energy range under investigation need to bemeasured. It is essential to use thin samples so that minimum energydegradation in each sample is achieved. On the other hand, the sampleshould be thick enough to produce measurable activity to be able to obtaingood counting statistics.

Chapter III
49
Table (3-3): Isotopic Composition of Natural Molybdenum,Gadolinium Used in this Study [cf. 4].Isotopic Mass/Isotopic Abundance (%)
92Mo 94Mo 95Mo 96Mo 97Mo 98Mo 100Mo14.84 9.25 15.92 16.68 9.55 24.13 9.63152Gd 154Gd 155Gd 156Gd 157Gd 158Gd 160Gd0.20 2.18 14.8 20.47 15.65 24.84 21.86
Excitation functions of the concerned reactions were measured bythe conventional stacked-foil technique [cf. 79,80,81]. Figure (3-3) shows aschematic diagram for stacked foils arrangement. This technique allowingthe examination of many target elements at different energy values in onerun with a minimum requirement of beam-line time. The simultaneousirradiation of the samples (the stack) is not only economical but also couldassure a good relative accuracy.
The stacked target technique could be applied for targets that consistof thin foils. Among the stack target foils one or more monitor foils areinserted for particle beam monitoring. In special cases energy degrade foilsare placed in the stack, their purposes are to be used as a catcher forrecoilled nuclei as well as to enhance the energy degradation in the stack.Otherwise, to cover the whole energy region a large number of target foilsmust be necessary. Every sample sandwiched between to monitor reactionfoils of Copper, and Titanium in one case. In the other case the two monitorfoils putted as a couple separate every two successive samples. After thestacked foils have been irradiated, the gamma rays spectrometer was usedfor counting the samples. The targets were irradiated with the proton beamat the AVF (Azimutally Variable Field) Cyclotron of the Inshas CyclotronFacility, using the “stacked foils” activation technique for one hour.
The targets were all set in the same geometric configuration, with abeam current of about 100-200 nA and an integrated charge varying from375 to 750 mC, measured with a long shaped Faraday cup. The beamintensity was corrected by the monitor reactions at every sample target foil,obtaining the exact flux within the 2%. The cyclotron maximum extractedbeam energy was 18.0±0.2 MeV; with an intrinsic energy spread of ±0.05MeV. Two irradiation facilities have been used. In the first the target holderstand at the end of beam line inside the vacuum, in the second a 25 µmthick tantalum window was used to separate the beam line from irradiationtarget holder that was irradiated in atmosphere. The beam energy wasdegraded from the nominated value to reaction thresholds, at about 1.0MeV intervals through the stack. Calibrations were used to set the energy

Chapter III
50
[cf. 27]. The beam energy was calibrated with a ±0.2 MeV accuracy, by theactivity ratios of two reactions generated simultaneously in Cu foils.
Figure (3-3): Stacked Foils Technique Arrangement.
Systematic errors related to both stopping-power calculations andabsolute γ-emission intensities were not considered. The high-resolutiongamma-spectrometry measurements were carried out in geometricalconditions (not less than 20–25 cm distance from the detector) suitable forminimizing any counting loss due both to counting dead time and randompile up [cf. 90,91,92]. In the case of 94gTc, the dead time (DT) was of theorder of 10%, which is acceptable for an accurate correction, bycommercial electronics (EG&G, Ortec 570 spectroscopy amplifier),without use of constant frequency pulse generator correction method. Incase of 96Tc the cumulative yield, and “effective” cross-sections σ* of bothmetastable and ground levels are reported.
3-4 Calibration of Cyclotron Beam Energy
The primary beam incident energies were nominated from thecyclotron parameters, and derived from our calibration measurementsbased on the activation technique according to Sonck et al., (1997);Tarkanyi et al., (2001) [cf. 93,94]. Since we applied a stacked-foiltechnique we had to calculate the proton energies in all the different targetfoils. Although the energy degradation was small for the highest initialproton energies we performed such calculations for all irradiations. Protonenergies for each target and monitor foil were determined by range energycalculation using a computer program originally based on the polynomialapproximation of Ziegler [cf. 27]. The energy scale was checkedadditionally by comparing the measured excitation function of the threemonitor reactions with their recommended values.

Chapter III
51
Determination of the beam energy of a variable energy multiparticlecyclotron of type MGC-20 is required for accurate measurements ofreaction cross sections, and optimization of commercial production of GBqbatches of radioisotopes by using the threshold nuclear reactions, whichprovide us with a precise knowledge of the particle beam energy. Literaturestudy of recently published articles on cross-section determination shows anumber of reactions with well-established values for their cross sectionbehavior. Experimental determination of the cross sections for thesereactions often referred to as monitor reactions, and comparing them withthe literature values allows an estimation of the incident beam energy. Thenuclear reactions of interest in beam monitorng are natCu(p,x)62Zn[Kopecky, (1985); natNi(p,x)55Co (Tarkanyi et al., 1991); natCu(p,x)65Zn(Kopecky, 1985); natNi(p,x)57Ni (Tarkanyi et al., 1991) [cf. 95-98].
Target stacks of 10-15 foils (99.9 % pure) were irradiated for 60 minwith external beam currents up to ~0.2 µA. Yields and cross sections of thenuclides of interest were calculated from the γ emission rates usingdisintegration data from Firestone et al., (1996) [cf. 4].
Figure (3-4) shows the agreement between the recommended cross sectionvariation for monitor reactions and the corresponding experimental data ofthis work are plotted as a function of the mean energy in each foil, withproton energy from thresholds up to ~20 MeV for natCu(p,x)63Zn,natCu(p,x)65Zn reactions induced in Cu foils produce 63Zn, 65Zn, andnatTi(p,x)48V reactions induced in Ti foils produce 48V, respectively. Thecandidate incident energy Eincident = Eb
cal calculated by using cyclotronparameters, and the other incident mean energy derived from Eq. (3-1) ineach foil, obtained applying the activation technique Eincident = Eb
act. Thedegradation in beam energies are computed from Ziegler's polynomialestimation formulae [cf. 27], After applying any proposed energy shiftsdeduced from activation technique, we obtain much better agreement withthe reference values for the cross-sections.
( )
( )( )
1
1
0
0
3 1
E
m E
E E dE
E
E dE
σ
σ
⋅ ⋅= −
⋅
∫
∫
Where σ(E) is the cross section at the energy E and E1 is the incidentenergy. In Eq. (3-2) instead of using cross section values one can also usethick yields, which are easier to measure at different energies (Ishii, 1978)[cf. 99], the mean beam energy formula becomes:.

Chapter III
52
( )( )
( )1
1
012
0 1 0
3 21
m E
EE
A EE dEA E E
= − − ⋅ ∫
Where, A0(E) = thick target yield in the given target at energy E.
Monitor Reactions
0
50
100
150
200
250
300
350
400
450
0 5 10 15 20Proton Energy (MeV)
Cro
ss S
ectio
n (m
b)
Zn-63Zn-65V-48CRP Fit
Figure (3-4): Indicates the Agreement between Recommended CrossSection Variation for Monitor Reactions and the Corresponding
Experimental Data of this Work.
It is possible to apply the average stopping power method also for a“defined thickness” target. In this case, Eq. (3-3) becomes:
( )
( )( )
1
2
1
2
3 3
E
E
m E
E
E E dE
E
E dE
σ
σ
⋅ ⋅
= −⋅
∫
∫
Following the same procedure as for a thick target, we obtain for a “definedthickness” target as:
( ) ( )( ) ( ) ( )
( )1
2
0 1 0 2
0 1 0 2 02
1 2
3 4m E
E
A E A EE
A E A E A EdE
E E E
−= −
− + ⋅ ∫
When E2=0, Eq.(3-4) reduces to Eq.(3-2).

Chapter III
53
With known incident energy E1 the energy E2 of the particle thatleaves the target can be calculated theoretically by knowing its thickness,from the range energy tables or more precisely by measuring the activityratio of two nuclides from different nuclear reactions induced in a suitablemonitor placed in front or behind the target. Such an energy measurementwhich is independent of foil thickness, flux etc., is relatively simple andless erroneous than an absolute method.
In some cases, for nuclear reactions with high threshold values, thethickness of the sample can be so “defined” as to give E2 a value below thethreshold for the nuclear reaction with the sought element. So that anysmall error in measuring E2 will have a negligible influence on thecalculation of Em. The uncertainty in the incident energy estimation derivedfrom excitation curve matching depends furthermore on the slope of thecross-section plots in presence of energy shift.
3-5 Beam Intensity Monitoring
One of the most important parameters in the determination of a crosssection is the acculate measurement of the beam current incident on eachfoil. The beam current is measured using a Faraday cup as an indicativevalue. This value should be corrected with the values determined from themeasured activities of the foils adjacent and surrounding the specifiedsample under investigation. These foils are called monitor foils. Bothmethods are employed simultaneously to achieve more accuracy. Theactual value of the beam current during irradiation is estimated from themeasured activity of the monitor foils using the activation formula Eq.(1-23), where the recommended cross section is substituted from the tabulateddata of the monitor reaction.
The choice of the monitor material depends on severalconsiderations, such as:(1) Monitor should have a high cross section within the energy range of
irradiation.(2) The monitor reaction cross sections used should have accurate values,
recommended, and up to date.(3) The monitor products should have compatible half-lives with the
resulting nuclides.
The beam current value is a very significant parameter in thecalculation of the cross section. It depends mainly on the uncertainty of themonitor reaction cross section. Also it can be affected by the geometricalscattering of the beam within the stack. The uncertainty of the measured

Chapter III
54
activity arises mainly from the uncertainty in the efficiency of the countingsystem. In most cases the efficiency is known well so that in general thetotal uncertainty due to this source does not exceed 5%. The uncertaintiesof energy degradation within the stack lead to shift in the energy scale up to±1 MeV, depending on the thickness of the stack and the homogeneity ofthe irradiated samples. The cross section data reported in literature havegeneral uncertainties of about 10 to 25%.
The irradiations were carried out in the target holder at the end of abeam line, in two geometeries external, and internal irradiation, externalwhich, at the unit which is used in the radionuclide production. Internalwhere, the sample irradiated inside the beam guideline in vacuum, thebeam hit the target normally. So, both are equipped with cooling system, along collimator, electron suppresser, and current measurement. At 18 MeVnominal primaries beam energy, and in each case the beam was stopped ina thick Al disc immediately behind the stack. The irradiation wasperformed with a 10-mm diameter at ~200 nA intensity for one hour. Thebeam intensity was kept constant during irradiation. The beam currentmeasured with Faraday-Cup was corrected after analyzing the results of themonitor reactions. High purity foils of Cu, and Ti served as simultaneouslybeam monitor foils for the accurate measurement of the incident protonflux. For this purpose, we used high purity natural Cu foils of 10µm thick(99.9%), and high purity natural Ti foils of 25µm thick metallic naturalfoils (99.9%). The thicknesses of the stacks were sufficient to provideadequate energy overlaps of the successive data sets for the consistency ofthe data to be thoroughly checked.
3-6 Associated Counting Electronics
The activation products were identified by the characteristic energiesof γ-ray lines and their half-lives. The γ-activities in the samples wererecorded using high performance gamma ray spectrometer.
3-6.1 γ-Spectrometer
Proton-induced activities were determined using the counting systemconsisting of vertical coaxial closed end 70% HPGe detector (Canberra, 2keV full width at half-maximum at energy of 1332.5 keV), detector biassupply (Ortec-447), main amplifier (Ortec-570 amplifier), multichannelanalyzer buffers, with built-in ADC digitized the pulses into spectra of8192 channels (TRUMP-8192), and lead shield of thickness 10cmsurrounds the system.. The connection of the components of the completegamma ray spectrometer system is shown in Figure (3-5).

Chapter III
55
Figure (3-5) Gamma Ray Spectrometer
The γ-spectrometric measurements started after the end ofirradiation. The amplification was chosen for the registration of γ-quantawith energies between some tens of keV and about 2MeV. Typicalresolutions ranged from about 1 keV at 122 keV of 57Co to about 2 keV at1332 keV of 60Co. The absolute calibration of the γ-spectrometer wasperformed for each geometry used by calibrated radionuclide sources (22Na,57Co, 60Co, 137Cs, 133Ba, 152,154,155Eu, 109Cd, 65Zn, 54Mn, and 232Ra) as seen intable (3-3) with certified accuracies of ≤2% (Oak Ridge, Tennessee, USA).
To avoid problems with high dead-times and pile-up effects thedistances between sample and detector window were varied between 5 and50 cm. Thus it was possible to keep the dead time below 10% with nodetectable pile-up effects. The large distances were used especially for theshort T1/2 measurements shortly after the irradiations because of the highactivities of the samples. In these geometries no lead shielding of thedetector was possible but interference with background γ-lines werenegligible anyway due to the short counting times as well as due to the highCompton-background caused by the measured samples themselves.
For the latter measurements we used lead-shielded detector withshield of 10cm thickness, having an additional 5mm low activity coppershielding inside. Background spectra were taken for these measurements.These spectra were used in the data evaluation procedure to correctmeasured activities for background interference. Measurement timesranged from 10 min., at the beginning up to about 2 hours in some cases atthe end of a measurement series.

Chapter III
56
The spectra of the irradiated samples were analyzed, and the gammalines of produced radionuclides were identified. Figures (3-5), (3-6)represent samples of the recorded spectra of the irradiated monitors ofnatCu, and naTi. The areas under the peaks of the gamma lines 596.6, 669.6,1115.5, and 983.5 keV as illustrated in these figures were used for thecalculation of the reaction cross section of the radionuclides 62Zn, 63Zn,65Zn, and 48V, respectively. The gamma lines were well separeated and nogamma lines overlaps were observed.
3-6.2 HPGe-Detector Efficiency
In the case of measuring proton fluence, we usually do not use pointlike samples but extended samples, this causes a common problem in thequantitative analysis of these samples by gamma spectrometer, see Figure(3-7). If we seek to achieve absolute result of high accuracy, then thegamma-ray detection efficiency for geometrically extended sources mustbe well known. It is therefore, important to have available method tocorrect measurements taken with HPGe for the effect of finite extendedsamples, bearing in mind that the HPGe detector efficiency curves that aremost often and conveniently determined using point-like standard sources.
So to perform that, the HPGe detector efficiency was firstdetermined using a variety of point radionuclides. Using different gammaray emitters placed on the axis of the detector at several distances from itsface, the full energy peak efficiency (FEPE) of the detector from 60 to~2000 keV gamma-ray energies was achieved with 2.2% overallinaccuracy. Then we used Ganaas program [cf. 100] in estimating thecorrection coefficients for extended samples (disc) by correcting thereference efficiency data for detector-source solid angle, gammaattenuation through source-detector space, gamma self absorption in thesamples, and random and true coincidence summing corrections for theseextended samples.

Chapter III
57
Figure (3-6): Sample of Gamma Ray Spectrum of Natural Copper SampleIrradiated with Protons for Beam Intensity Monitoring.
Figure (3-7): Sample of Gamma Ray Spectrum of Natural Titanium SampleIrradiated with Protons for Beam Intensity Monitoring.

Chapter III
58
Absolute Full-Energy Peak Efficiencies at Different Distances
0.000
0.010
0.020
0.030
0.040
0.050
0.060
0 200 400 600 800 1000 1200 1400 1600 1800 2000
Gamma Ray Enegy (keV)
Eff
icie
ncy
Exp Points at 5CmFit at 5CmExp Points at 10CmFit at 10CmExp Points at 20CmFit at 20CmExp Points at 30CmFit at 30Cmat 10 cm
at 20
at 30
at 5 cm
Figure (3-8): Absolute Full Energy Peak Efficiency of HPGe-Detector,Experimental Points, and Fitted Curves at Different Distances.
The gamma ray points-like standard sources used for theexperimental determination detector efficiency are listed in Table (3-3). Atypical plot for the full energy peak efficiency of HPGe-detector withsource to detector distances 5, 10, 20 and 30 cm is shown in figure (3-8).These sources cover gamma ray energies from 60−2000 keV. The standardsources were positioned on axis above the cap of the detector at distancesranged from 5 to 50cm from detector end cap by placing them onlightweight card tray atop light weight card cylinders. Distances weremeasured from the center of the source to the external front face of thedetector end cap. Following the corrections for dead time and roombackground, the number of counts C in the full energy peak (FEP) wasobtained by fitting a Gaussian profile superimposed on a linear backgroundto the spectrum. This was related to the absolute efficiency ξ in count pergamma emitted according to [cf. 91]:
( ) ( )( ) ( )3 5
expo
C EE
A I tγ
γγ
ξλ
= −⋅ ⋅ − ⋅
where:C(Eγ): the count rate of the peak corresponding to a certain γ-ray energy Eγ;Ao: the activity of the sample (Bq) at some arbitrary reference time;Iγ : the absolute γ-intensity;λ : the decay constant.;t : the decay time.

Chapter III
59
Figure (3-9): Evaluation of one Spectrum Peak by Using Gaussian Fit, andLinear Background Subtraction
Table (3-4): Gamma Ray Standard Sources Used inthe Efficiency Determination.
StandardSource*
T1/2 StandardSource*
T1/2
133Ba 10.52 154Eu 3140 y109Cd 462.2 d 155Eu 1740 y57Co 271.79 d 54Mn 312.3 d60Co 5.271 y 22Na 2.602 y137Cs 30.19 y 226Ra 620500 y152Eu 4960 y 65Zn 244.26 d
*Supplied from (Oak Ridge, U.S.A.).
Figure (3-9) shows an evaluation of one spectrum peak by usinggaussian tail fit, linear background subtraction. A six-order logarithmicenergy function was used to fit the plot. The efficiency functions wereobtained by fitting a logarithmic energy negative power transfer seriesfunction to the experimental efficiency point data from 60 keV up to 2MeV. The efficiencies were repeatedly checked for every-geometry.Energy calibration was done using a least-squares fit to a third-orderpolynomial for the energies of the calibrated radionuclide sources.

Chapter III
60
Table (3-5): Parameters Used to Fit the Efficiency Function Eq. (3-6).
Fit parameters Value at Different DistancedPar.At 5cm At 10cm at 20cm at 30cm
A0 -5.60497 -3.60156 -1.75206 -0.58176
A1 -3.74942 -3.55185 -3.42532 -3.35633
A2 -1.66771 -1.56893 -1.50566 -1.47117
A3 0.195127 0.260982 0.30316 0.326156
A4 0.423646 0.473037 0.50467 0.521917
A5 0.529916 0.569429 0.594736 0.608534
The fitting function used in efficiency calculation at 5,10,20, and30cm is the logarithmic energy power transferred series, it is defined as:
( ) ( ) ( )( ) ( )5
0
1 ln 3 6i
ii
E A EEε −
=
= ⋅ ⋅ −∑
Where, E is the gamma ray energy; Ai is the fitting parameters. Table (3-5)shows these parameters (Ai) of the experimental points using the above-mentioned function obtained from running the Monte Carlo program [cf.100].
3-7 Analysis of Gamma Spectra
The analysis of the γ-spectra, the identification of nuclides and theselection of activities used in the final calculation of cross-section are beingthe most time consuming step in the experiments. Figures (3-10):(3-13)represent the γ-spectra for some samples of the irradiated targets for natMo,and natGd. The γ-spectra are not extremely complex, exhibiting quietseparated peaks. The gamma lines of energies 934.4, 702.5, 204.1, 765.8,778.2, 140.5, 344.3, 540.1, 996.3, 262.3, 534.3, and 879.4 keV areillustrated in these figures. These gamma lines were used for thecalculation of the reaction cross section of the radionuclides 92mNb, 94Tc,95mTc, 95gTc, 96m+gTc, 99mTc, 152m+gTb, 154mTb, 154gTb, 155Tb, 156Tb, and 160Tb,respectively.

Chapter III
61
Figure (3-10): Samples of Gamma Ray Spectra of Natural MolybdenumSample Irradiated with Protons for Reaction Cross Section Measurements
one hour after EOB.
Figure (3-11): Samples of Gamma Ray Spectra of Natural MolybdenumSample Irradiated with Protons for Reaction Cross Section Measurements
19 day after EOB.

Chapter III
62
Figure (3-12): Samples of Gamma Ray Spectra of Natural GadoliniumSample Irradiated with Protons for Reaction Cross Section Measurements
one hour after EOB.
Figure (3-13): Samples of Gamma Ray Spectra of Natural GadoliniumSample Irradiated with Protons for Reaction Cross Section Measurements
10 day after EOB.

Chapter III
63
The complexity of the spectra has two reasons. Firstly, due toadjacent of some peaks close to each other, the net counts of some peaksdepend on the presence of the adjacent peaks. Secondly, dues to hereditaryorigin or pile up contribution to the continuum background. After shortdecay times the spectra are dominated with some long-lived radionuclideswhich are produced with large cross-sections also have quiet separatepeaks.
The analysis of the γ-spectra was done using the commerciallyavailable code APTEC-MCA [cf. 101]. APTEC-MCA to calculate the netpeak areas via an unfolding algorithm using a least-squares fit [cf.102,103]. For an evaluation, regions of a spectrum are defined in which allpeaks are unfolded simultaneously after the background has beencalculated. Peak shapes are assumed to be Gaussian with a low-energytailing. For each detector and measuring geometry, parameters weredetermined and supplied to the code which is a function of energy orchannel numbers the full-width at half-maximum of full-energy peaks andtheir tailings [cf. 103,104].
The user can do the whole evaluation procedure either in anautomatic mode or interactively. Although APTEC-MCA is a sophisticatedand successful code, detailed tests showed in our case that the automaticmode is not reliable enough with respect to the necessary region of thespectrum, peak recognition, background determination, and multipletdeconvolution and net-peak area calculation. Thus, we analyzed eachspectrum interactively, making sure to get a maximum of information outof each spectrum. Proceeding in this way means, however, to give up thereproducibility of a spectrum analysis in contrast to the automatic and strictapplication of a mathematical algorithm. Therefore, repeated spectraanalyses were performed independently by both modes. The resultsobtained in this way always were in good agreement within the limits ofuncertainties of the unfolding procedure.
3-7.1 Nuclide Identification
Besides the spectrum analysis, an automatic and unambiguousidentification of product nuclides turned out to be rather complicated. Mostcodes and also APTEC-MCA offer such capabilities, with a generalapplicable algorithm, which can be used, with some confidence forcomplex spectra. But capable to assign the isotope library file whichconcern the region of isotopes, match the ROI centroide energy with theenergy of isotope within a tolerance of plus minus fraction of peak in keVor its full width at half maximum. Fraction limit value, before accepting a

Chapter III
64
peak as a possible match to a certain isotope check the active library todetermine where any or all other lines for that isotope would be located.These lines are then checked to see if there is a ROI (i.e. peak) at thatlocation. If there is a match at the other energies, then the yield at that ROIis compared to the yield at the line in question. The identification processstarts with the spectra having the longest decay times. Then, successivelygoing back in time, the identified nuclides are searched in the precedingspectra by calculating their respective activities and looking whether theseactivities should be detectable in the spectrum under consideration.Applying this algorithm decreases the number of possible nuclides in aspectrum. Table (3-5) contains the formulae repeatedly used in theprocedures for bumerical analysis of spectra’s peaks.
The identification of radionuclides was only performed for γ-energies above 60 keV. Below this energy it was impossible to getquantitative results due to the variety of overlapping x-rays and γ-rays ofthe produced radionuclides. In the step of identification of nuclides, thehalf-lives from the Table of Isotopes Firestone et al., (1996) [cf. 4],energies and branching ratios of γ-rays were taken too. Samples of thedecay schemes of the produced radionuclides obtained in this study arepresented in the figures (3-14) to (3-28).
Table (3-6): Formulae Used for Numerical Analysis of Spectra.Quantity Formula
( )Peak Area A ( )x xC B−∑Peak Statistical Precision
% (1 )Error A Sigmaδ( )
*
100x xC B
A
+⋅∑
( )Centroid Weighting x ( )x xC B x
A
− ⋅∑
Centroid Precision
xδ( ) ( )
*
x xC B x x
A
+ ⋅ −∑
( )Half Width w− ( ) ( )2
x xC B x x
A
− ⋅ − ∑
Half Width Pricision−
wδ ( ) ( ) [ ]*
22 21 1 2
2x x
x x
C Bx x w C B
AwA
− − ⋅ − ⋅ − ⋅ − ∑
( ) ( ), ,x xWhere C Counts in channel x B Background in channel x= =
* i iError formulaebased ontheconservative assunptionthat B Bδ = .

Chapter III
65
Figure (3-14): The Decay Scheme of 96Tc [cf. 4].
Figure (3-15): The Decay Scheme of 99mTc [cf. 4].

Chapter III
66
Figure (3-16): The Decay Scheme of 152Tb [cf. 4].
Figure (3-17): The Decay Scheme of 160Tb [cf. 4].

Chapter III
67
3-7.2 Selection of Reliable Data
After nuclide identification and calculation of their activities for eachtarget, the last step before calculating cross-sections is to gather allactivities calculated from the spectra in one file sorted by nuclide. By thisway we get a survey over all measurements for each nuclide and its γ-linesallowing for half-life control as well as checking for consistency ofactivities determined using different γ-lines of a nuclide. By selectingactivities, which are judged to be reliable, cross-sections are calculated asdescribed below.
This judgment is performed on the basis of objective and subjectivecriteria. Objective criteria are, e.g. the agreement of the activities derivedfrom different γ-lines of a nuclide and constancy of the activity calculatedfor the end of irradiation from several measurements (our half-life control).Subjective criteria are based on the experience and knowledge of theevaluator about the entire spectrometric method and their characteristicproperties, about spectrometric interference and about the physics of theunderlying problem.
3-7.3 Definition of the Detection Probability
Suppose that subsequent to an induced reaction, the radioactivedecay of the produced nucleus takes place via a given cascade CJ consistingof a number of individual γ-rays of energy E1, E2, …, Ei. The probabilityWj
(t) of detecting by a HPGe detector counting a reaction event using atarget of thickness δ can be expressed as a product of six functions, i.e.,
( ) ( ) ( ) ( ) ( ) ( ) ( ) ( )1, ,...., , , , , . 3 7tj j i j i ai i S i i j t g i
i
W P E G E E S E C E E D C F E tδ τ= Ω −∑
Which represent the total sum for correcting the erroneous estimates ofuncertainty magnitudes concerning some error sources. Where:
Pj(Ei) is the probability that a gamma ray of energy Ei belonging tothe cascade Cj will be emitted. Pj(Ei) will be referred to as the “emissionprobability” due to the probability of γ-ray belonging to competitivereaction channel, for low gamma or x-ray that repeatedly suffer fromelectron-capture fraction, internal conversion coefficients, and fluorescenceyields.
Gj(Ω,E1, ..., Ei) the probability that a gamma ray of energy,belonging to the cascade Cj and unaccompanied by other coincident

Chapter III
68
gammas will enter the detector which subtends an effective solid angle, Ω,at the source. This will be referred to as the “geometrical probability”.
Sai is the probability that photons emitted within a differentialgeometry solid angle dΩ and impinging on the detector, interactincoherently with the active detector crystal. Including the attenuationfactors through the source itself whenever by using non-selfabsorbencestandard source and samples also due to Air gab, end cap cover, Aluminumor Beryllium window, fronted dead layer of detector, and any absorberintroduced between detector source geometry.
Csi true coincidence correction that involved in measurements of aradionuclide that emits cascade radiation. When two or more cascadingphotons give arise to a total or partial energy deposition in the detectorwithin the response (or resolving) time of the detecting systems,coincidence detection of these photons appears. True coincidence mayresult in summing effects or loss effects in the forms of γ−γ, γ−x ray due tointernal conversion (IC), γ− x ray due to electron capture (EC), etc., [cf.105,106]. The significance of these effect increases with increasingcounting efficiency, therefore, the correction for true-coincidence effects isof vital importance.
Dt accidental coincidence summing, their number could be measureexperimentally by a recently developed a Multi-channel time scalingtechnique, but it is usually obtained by means of appropriate mathematicalformulae which depend on the value of the dead time used in theexperiments [cf. 107,108]. The accidental coincidence on the vice of true-coincidence which is independent of resolving times, dead times, andbaseline fluctuation. The pile up effects especially in high count ratespectroscopic circuits that cause the distortion of pulse height spectra. Aconvenient computation used to analyze the distortion of the spectra, takinginto account the analyzer dead time. The distortion of the spectra can bedescribed as follow. Pulses from a detector having a finite duration arestatistically distributed in time and their superposition generates a randomprocess at the amplifier output, which can be considered partially as abaseline fluctuation at the analyzer input.
F(Ei,t) the probability that a γ-ray of energy; belonging to thecascade CJ and originated from produced radionuclide due to reactionsinduced by primary proton fluence, secondary build up particle, gammafluence may induce production of the same residual radionuclide or others.This in course may alter what so-called “effective primary beam”. Thatcauses an increase or decrease on the primary beam and also tempt a

Chapter III
69
degrade on the primary proton fluence and it acts due to secondary beamfluence through the stacked foils, which will yield an effective fluencepulse. F(Ei,t) is termed as the “Fluence Response Probability”.
3-8 The Sources of Uncertainties
The following major sources of uncertainties were considered andtaken into account according to the laws of error propagation, in the totalerrors quoted for the measured cross sections. For the results obtained twotypes of uncertainties have to be considered: those of the proton-energies inthe targets and those of the cross-sections themselves. There are manysources of uncertainties of the cross-sections and some may result inconsiderable uncertainties. The following sources of uncertainties wereconsidered.
3-8.1 Uncertainties in Proton Energies, Beam Fluctuation
For calculating the uncertainty of the proton energy in a target, threefactors have to be considered. First, the protons leaving the acceleratorhave an energy uncertainty ∆EA. Second, the protons are slowed down inthe target foil from an initial energy En,i to the final energy En,f (resulting inan energy spread with a half-width ∆Eloss = (En,i − En,f)/2. Third, due to thestatistical nature of the slowing down process there is an energy stragglingwhich can be described by a Gaussian distribution with a width (straggling)parameter αi. The uncertainties in range-energy calculations lead to errorsin the energy scale. Use of thick foils in the case of low energy projectileleads to considerable errors. Especially, in the case of sharply increasing ordecreasing cross-section of an excitation function. Consequently, theuncertainty of proton energy En in the nth target foil of a stack over allthree-type losses is given by:
( ) ( )22 21
. 3 8n B loss iiE E E α
=∆ = ∆ + ∆ + −∑
The fluctuation in beam intensity during irradiation is esenssial, theconstancy of flux density over irradiation time could not be ensured. Thebeam intensities were continuously monitored and recorded. Thefluctuations and interruptions of the irradiations were taken into accountwhen calculating fluxes and cross sections. Using the followingreplacement in the activation formula Eq. (1-23) Gloris et al., (2001) [cf.109].

Chapter III
70
( )( )( )
( ) ( ),
1
exp1 3 91 exp 1 exp
nEOI EOI i
iirr irr
t t
t t
λ
λ λ=
−→ −
− − − −∑
Because the flux density itself may not be constant during irradiation wereplaced Φ in Eq. (1-23) by:
( ) ( )* *1 . 3 10EOI
BOI
t
tEOI BOI
dt tt t
Φ → Φ −− ∫
With Φ(t*) being the relative measurements of the beam current. Usingthese replacements the uncertainties due to fluctuations in the beamintensity become negligible. Moreover, they would affect only the cross-sections for very short-lived nuclides.
3-8.2 Uncertainties in Net Peak Area, Deacy Data
The uncertainty of each single net-peak area is determined by thespectrum evaluation code. It takes into account the Poisson uncertainties ofthe counts in the individual channels. As well as the uncertainty of thebackground determination, propagating them according to the law of errorpropagation through the unfolding procedure. Implying reproducibility ofphotopeak integration, and Statistical counting errors. Sometimes a peakcannot be attributed unambiguously to a single nuclide. If the contributionswere not negligible and the activity of one of the contributing nuclides canbe determined using another line or in a later spectrum, the interfering lineswere corrected using this activity. If it seemed that the contributions ofother nuclides to a peak are very small, no correction was applied. Due tothis procedure we assume a maximum inaccuracy of 2% due tocontributions of other nuclides but it must be pointed out that on theaverage this uncertainty should be smaller.
The half-lives of produced nuclei were taken from Firestone et al.,(1996) [cf. 4]. Larger uncertainties in any time dependent terms incalculation of the cross-sections via Eq. (1-23) would result in observabledisagreements between different measurements due to the exponentialdependence on time. Uncertainties of the half-lives were considered to beof the order of 1 % for the nuclides measured. Larger uncertainties wouldhave shown up during the half-life control.

Chapter III
71
The γ-abundances of residual nuclei were also taken from Firestoneet al., (1996) [cf. 4]. Since we used normally the strongest γ-lines, whichwere rather well known, we assume a global uncertainty of 1%. However,it must be pointed out that the errors given for the cross sections alsoaccount for inconsistencies between the absolute γ-intensities of the γ-linesused.
3-8.3 Uncertainties in the Absolute Efficiency, Time Factor, andDead Time
Uncertainty of the absolute efficiency calibration of γ-spectrometerscould be deduced from the comparison of different calibrated radionuclidesets, The calibration standards used had a certified accuracy of ~2%. Theerror of absolute efficiency calibration can be adopted with a totaluncertainty of the full energy-peak efficiency of 4.5%. It is larger than theerror of relative efficiency calibration. From comparisons of measurementsperformed on different detectors, the relative uncertainty of the efficiencycalibrations can be considered to be 2%. Since the error in the absoluteefficiency calibration affects the flux determination.
Uncertainty of time factor represents the uncertainties in theirradiation time, decay time and counting time: For time scales determinedby the half-lives of nuclides observed within this work, we assume thatuncertainties of the above-mentioned quantities are negligible.
Dead time and pile-up losses in the γ-spectrometer wereautomatically corrected. Pile-up effects were not seen because the distancesbetween samples and detector were varied in the way that the countingrates were low enough (kept below 10%) to avoid both pile-up and failureof the automatic dead-time correction. Where, the internal life timescorrection of the ADC/MCA system was checked to be correct.
3-8.4 Uncertainties in Irradiated Nuclei, Impurities, RecoilContaminations
The number of irradiated nuclei in each foil was well known. Where,each foil was weighted with an absolute uncertainty of ±30 µg. In case ofthe Gadolinium foils of 10 µm equivalent to 7.901 mg cm-2, this resulted inan inaccuracy of about 1%, with pinhole free and good homogeneity. Whilethe uncertainty for the heavier foils, with weights of about 20 or 25 µgbecomes negligible.

Chapter III
72
Uncertainty of impurities in the target materials causing interferingnuclear reactions and errors resulting from the correction of contributionsof other target constituents: Due to the high purity of the target foils used,contributions of other constituents were not considered.
Recoil losses, and recoil contaminations could be assigned byanalyzing the foils in the inner part of each "target element unit" consistingof more than two identical foils (mini-stack) these errors cancel out. Fortarget elements from vanadium to cobalt the mean ranges of recoil nuclei Rcan be approximately calculated by the empirical formula R (mg/cm2) ≈0.045⋅∆A [cf. 110] with ∆A being the difference between target andproduct masses. The recoil contamination from the adjacent foils had to becorrected.
3-8.5 Uncertainties due to γ-Interference γ-Self Absorption, andγ-Attenuation
From the very complex spectra, the cross-sections for some nuclidescould only be determined after the correction of interfering γ-lines fromanother nuclide, which could not be resolved by our detectors. Assume thatA1(tEOB) and A2(tEOB) are the activities of two nuclides at the end ofirradiation which have interfering γ-lines with Iγ1 and Iγ2, being theabundance of the corresponding γ-quanta. Then first a wrong activityA1
*(tEOB) is calculated according to Eq. (1-23) in our evaluation procedureunder the assumption that the peak is only caused by nuclide 1. If A2(tEOB)is known, e.g. from other γ-lines of nuclide 2, we can calculate the correctvalue of A1(tEOB) to be [cf. 22]:
( ) ( ) ( ) ( )( )
( )( ) ( )
1 1 2*1 1 2
2 2 1
2 1
1 exp1 exp
exp 3 11
CEoI EoI EoI
C
d
I tA t A t A t
I t
t
γ
γ
λ λλ λ
λ λ
− −= − ⋅ ⋅
− −
× − − −
Although it is in principle possible to apply this scheme to more than onlyone interfering γ-line, we limit ourselves to one correction term since theresulting uncertainty of the corrected activity quickly becomes rather highif the correction is large.
Self-absorption of γ-rays in the sample, and in the aluminum catcherfoils played no role, it did in the sample foils. For γ-energies above 120keV and for thin, light- and medium weight-target elements this source oferror was negligible (corrections <1%). For thicker targets, heavy target

Chapter III
73
elements and low γ-energies corrections had to be partially applied. Sincewe evaluated our spectra for energies down to 60 keV we had to applycorrections for this effect. This was done using the tables for photonattenuation coefficient taken from [cf. 111]. Based on these data wecalculated in dependence of the mass of the foil and the energy-dependentabsorption coefficient (µ) for each single peak in a spectrum the fractionr(Eγ) of γ-quanta, which leave the foil and can be registered by the detectorby Eq. (3-12), by dividing each net-peak area by r(Eγ) we took into accountthis effect.
( ) ( ) ( ) ( )0
1 exp1 exp 3 12d d
r E x dxd dγ
µµ
µ− − ⋅
= − ⋅ = −⋅∫
For all measurements of low energy lines, special low attenuationsample holders were used and correction for self-absorption in the metalfoils was applied. We could rewritten Eq. (3-13) in the form as:
( ) ( )( )
( )( )0 , 3 13
1 exp
Ed
A E A EE
d
µρ ρ
µρ ρ
⋅ ⋅ = ⋅ −
− − ⋅ ⋅
Where, A0(E) is the measured activity for low energy lines at energyE, A(E) is the corrected activity, d is the thickness of the foil (µm), ρ is thedensity of the foil (g/cm3), and (µ(E)/ρ) is the mass attenuation coefficientfor the photon energy E, taken from. [cf. 111]
3-8.6 Uncertainties due to Interfering Processes
Nuclide production as a consequence of severe interference bysecondary neutrons produced in the stacks was observed in experimentscaused partially large corrections. The cross sections derived from targetsirradiated accounting for this contribution agreed within experimentaluncertainties with those from single thin measurements. A method wasdeveloped to describe quantitatively the influence of secondary particlesproduced in the target stacks and to correct the measured data for theirinterference [cf. 22,110]. The additional uncertainty caused by thecorrection for each individual reaction is considered in the errors given forthe cross sections.

Chapter III
74
Due to the high cross section for all individual isotopes included innatural element of Mo, and Gd. Especial attention paid to the reactionsbetween incident particles and target nuclei. Secondary particles areproduced in the target could produce residual nuclei, this phenomenon isobviously clear above 200 MeV, imply a special care had to be taken toavoid its contributions. Secondary neutrons could formerly produce asignificant interference Michel et al., (1982) [cf. 22]; Schiekel et al., (1996)[cf. 112]. Still at low and medium energy this attention must be paid forthat reaction accompanied with high cross section for integrated secondaryparticle “neutrons” in our case which in course have a high interactingcross section at low energy, especially in presence of moderating agents.Nuclide production by medium-energy protons irradiating thick orextended targets is extremely complicated [cf. 109]. By reactions of theprimary particles a variety of secondary particles is produced whichthemselves are responsible for most of the production of residual nuclides.This production of secondary neutrons, protons, and light complex particlesdepends on the energy of the primary particles and on the bulk chemicalcomposition of the irradiated target.
In order to describe nuclide production at a depth d inside a thick orextended target with a vector of bulk chemical constituents Cb = (Cb,L,L=1,…,n) and a size parameter R irradiated with protons having an initialenergy Ep,ini. We have to calculate the transport of primary particles insidethe target as well as the production and transport of secondary particles. Inorder to derive the differential flux densities dJk(Ek, d, R, Cb, Ep,ini)/dEk ofall primary and secondary particles k which themselves can undergonuclear reactions. Then the production rate of a residual nucleus i in aspecial part of the target having Cs=(Cs,j, J=1,…,n) can be calculated by M.Gloris et al., (2001) [cf. 109] as follows:
( ) ( ) ( ) ( ),,, , , ,0
, , , , , , ,1, 3 14p iniEs j ki s b p ini A k i j k k k p ini
j kj k
C JP d R C C E N x dE E E d R E
A dEσ ∂
= −∑ ∑ ∫
In Eq. (3-14), the σi,j,k(Ek) are the thin target cross sections for theproduction of a residual nucleus i by particle type k from the target elementj. NA is Avogadro’s number, and Aj the atomic mass of target element j.
The difference between thin, thick, and extended targets can becoarsely defined on the basis of the classification of targets according totheir size parameter τ in terms of the interaction length µ [cf. 109].

Chapter III
75
( )1,
3 15n l
lA a l
A
Nµ
σ=
= − ⋅ ∑
We speak-of thin targets if µ >> τ, of thick targets if 10µ > τ > 0.1 µ,and of extended targets if τ >> µ. For protons, typical interaction length areµ(O) = 84 g⋅cm-2, µ(Fe) = 127 g⋅cm-2, µ(Bi) = 196 g⋅cm-2, and µ(U) = 207g⋅cm-2 for oxygen, iron, bismuth, and uranium target, respectively. If oneuses the geometric cross-section as a crude approximation of the absorptioncross section σa, l.
In thin targets the contributions of secondary particles to nuclideproduction can mostly be neglected. In thick or extended targets, primaryand secondary neutrons cause most of the production of residual nuclides.Especially in cases sensitive producing of secondary particle andinteracting of them with bulk targets. In the experiments the followingapproach was used to estimate the influence of secondary neutrons.According to Gilbert et al., (1993) [cf. 110] a differential flux densitydΦn/dEn was estimated by introducing a cobalt foil in the middle and theend of the stacks. In these foils 59Fe was generated and measured which isproduced exclusively by secondary neutrons via 59Co(n,p)59Fe with athreshold energy of 0.8 MeV (Q-value −0.78 MeV):
[ ]
( )
0
0,
1,3.13
3.13, 3 16
nn
n
nn p prim
nn
dfor E MeV
dE
dfor E E MeVEdE
Φ= Φ ∈
Φ Φ = ∈ −
where Φ0 is a normalization constant according to Gilbert et al., (1993) [cf.110]. The contribution of secondary neutrons was estimated withdetermined Φ0 via:
( ) ( ),
13 17p primE
nn n n
n
dF E dE
dEσ
Φ= ⋅ −∫
With F being the response integral by secondary neutrons and σn(En) beingthe cross section for the neutron induced reaction. As σn(En) experimentaldata from EXFOR database were used as far as available. Otherwise theywere calculated with the ALICE-91 or EMPIRE-II codes Blann et al.,(1988); Herman et al., (2005) [cf. 29,30]. Values for Φ0 were derived fromthe measured 59Fe in the Co-foils. Then the expected neutron induced

Chapter III
76
responses were exemplary calculated for a reaction with a low threshold,i.e. 89Y(n,2n)88Y.
3-8.7 Uncertainties due to Random Coincidence Summing
The non-linear dependence of a photo-peak count rate measured witha multichannel analyzer on the actual source strength of the considerednuclide arises from summing effects.
True summing of γ-rays emitted in cascade is rate-independent andneed not be considered in the case of comparative activation analysis(where the same nuclide is measured in different samples). Opposed to thisis random summing (often-termed pulse pile-up). Where the pulse ofinterest sums with a pulse originating from a genetically not related γ-rayand as a consequence is lost from the photo-peak. This effect is rate-dependent and must always be taken into account except for the veryseldom realized situation where sample and standard source have the sametotal source strength. Random summing takes place whether the sourceconsidered is composed of only a single nuclide or a mixture of severalnuclides. Especially, errors due to random summing where there is usuallya large difference between the total source strengths of the sample andstandard used in detector efficiency calibration.
At proton energies above 10 MeV, due to the thresholds that openingof several other strong reaction channels among difference isotopes ofnatural abundant targets, a further correction may become mandatory. For asingle reaction which, dominates in presence of other reactions crosssection is low and since a radiochemical separation of radionuclidesconcerned from sample matrix activity could not be applied, it wasnecessary to measure the irradiated sample close to the detector. The highactivity of samples probably sometimes caused a significant dead time,which could not be avoided decreased with time. A correction for thechanging dead time was therefore developed, represented in the form:
*D(t) D(0) exp(- t) (3 18)λ= ⋅ ⋅ −
where D(t) is a correction factor at time t, D(0) is the value of the factor atthe end of irradiation, and λ* is the decay constant which causes the deadtime.
By using a pulse generator of constant frequency connected to thepreamplifier we could determine the averaged dead times of the

Chapter III
77
measurements or with previously determined system time constant, forapproximation equal double value of amplifier time constant A.Wyttenbach, (1971); F. Cserpak, et al., (1994) [cf. 107,108]. During thecourse of repeated spectrum measurements after an irradiation (mentionedabove), dead times were also registered. Fitting a curve to those measureddead-time values we got D(0) and λ* values. In general, for measured deadtimes of less than 10%.
Random summing is due to the finite time resolution of the detectorsystem. The condition for a pulse not to be summed is that. This pulse ispreceded and followed by a certain time τ into which no other pulse falls.Since, the time distribution of pulses originating from the detection of γ-rays emitted by a radioactive source is governed by a Poisson distribution,the probability p1 of having no pulse in the time interval τ is:
( ) ( )1 exp 3 19p N τ= − ⋅ −
where, N is the mean rate of pulses emitted by the detector. It follows thatthe probability p2 for not observing a random coincidence is
( ) ( )2 1 1 exp 2 3 20p p p N τ= ⋅ = − ⋅ −
where, the probability p3 for observing a random coincidence.
( ) ( )3 21 1 exp 2 3 21p p N τ= − = − − ⋅ −
Since a random coincidence entails the loss of a pulse from thephoto-peak, p3 gives the fractional loss suffered by this photo-peak:
( )
( ) ( )
03
0
0
1 exp 2
exp 2 3 22
I Ip N
I
And
IN
I
τ
τ
−= = − − ⋅
= − ⋅ −
Where,I0 photopeak count rate of the nuclide i, measured from a source ofnegligible strength,I photopeak count rate of the same amount of nuclide i, measured as acomponent of a source of the total pulse rate N.

Chapter III
78
Supposing that the time interval τ is not a function of the pulseamplitude, it follows from Eq. (6) that all photo-peaks of a given spectrumsuffer the same fractional loss. It can also readily be seen that a givenphotopeak in two different spectra suffers the same loss only when the totalsource strengths of these two spectra are equal. Since this condition ishardly ever realized in practical work, one is forced to use the count rate I0when comparing the intensities of a given photopeak in several differentspectra.
One way to obtain I0 is to feed a pulser with known repetition rate C0into the preamplifier and to measure its peak count rate C in the spectrum.When the pulses of the pulser are randomly distributed with respect to thepulses of the source, a relation identical to Eq. (3-22) holds:
( ) ( )0
exp 2 3 23CN
Cτ= − ⋅ −
And from Eqs., (3-22) and (3-23) we have
( )00 3 24
IC C
I= ⋅ −
A procedure working along these lines has shown that there is anegligibly small correction term to Eq.(3-37), which is due to the fact thatpulses cannot sum with each other. Another way to obtain I0 is to estimateN, which can be done simply by integrating over the whole spectrum, andto apply Eq. (3-35) directly. The resolving time τ, the knowledge of whichis required, can be measured with a double pulser; alternatively, it can beevaluated by measuring the photopeak count rate as a function of N. Since
( ) ( )0
2 3 25IN
Iτ≈ − ⋅ −
Equation (3-25) is the first order approximation to Eq. (3-23), a plotof (I0-I)/I0 vs. N gives the value of τ. In the detector system used in thiswork, τ turned out to be somewhat larger than double the shaping time ofthe amplifier (2.5 µsec against 1 µsec. Instead of determining N byintegration, we found it more practical to determine the duration of themeasuring interval in both the live-time and true-time modes; when using amultichannel analyzer, these time intervals are related by:

Chapter III
79
( ) ( )3 26T t t α β− = ⋅ + −
whereT- measuring interval (true time); t- measuring interval (live time)α- fixed conversion time of memory cycle,β- mean channel-dependent conversion lime of the memory cycle.For a given spectrum, β will be constant, and Eq. (3-26) reduces to
( ) ( )3 27T t t N θ− = ⋅ ⋅ −
With
( ) ( )3 28θ α β= + −
Combining Eqs (3-25) and (3-27) we get:
( )0
21 1 3 29I T
I t
τθ⋅ = − ⋅ − −
and finally
( )1
021 1 3 30T
I It
τθ
− ⋅ = ⋅ − ⋅ − −
As can be seen from Eq. (3-30), the correction for randomcoincidence losses can be made in a first order approximation by measuringthe counting interval simultaneously in the true-lime and live-lime modes.The factor 2τ/θ, the knowledge of which is required to make the correction,can be obtained from a linear plot of I/I0 (or Y/Y0) vs. T/t.
Coincidence losses may introduce a considerable error in γ-rayspectrometry and are thus a serious potential source of inaccurate activationanalysis. A simple first order correction for coincidence losses can beapplied by measuring the counting interval in both the true-time and in thelive-time modes; the proposed equation is Shown by two experiments tohold up to an integral count rate of at least 4000 cps. The influence of highcount rates on the resolution of HPGe or Ge(Li) detectors is a well knownphenomenon. Contrary to this, the influence of high count rates on themeasured intensity of a γ-line is little appreciated; there is hardly any

Chapter III
80
publication on proton induced activation reactions using gammaspectrometers (where high count rates are often encountered) that paysattention to the difficulties of measuring correct intensities. This situation isvery unsatisfactory, since to our experience the error in the intensitydetermination is in many cases much greater than the other errors involvedin the spectra analysis. We want to pay an attention to this situation andpropose a simple first order correction for coincidence losses.
3-8.8 Uncertainties due to True Coincidence
True-coincidence occurs in measurements involving a radionuclidethat emits multiple cascade radiation. When two or more cascading photonsgive rise to a total or partial energy deposition in the detector within theresponse (or resolving) time of the detecting system, coincident detectionof these photons appears. True-coincidence may result in summing effectsor loss effects in the forms of γ−γ, γ−KX (IC), γ−KX (EC), etc. [cf. 90].The significance of these effect increases with increasing countingefficiency, therefore, the correction for true coincidence effects is of vitalimportance. We will deal with this matter first in a semi-empiricalapproach just for illustration in primary simple stage, then will turn to usinga Monte Carlo treatment.
γ−γ Coincidences losses or gains in the net-peaks of γ-lines due toγ−γ-coincidences have to be taken into account at very small distancesbetween sample and detector, and for some nuclides decaying by β+-decaythe 511 keV γ-radiation caused some problems. Since distances from thedetector down to 5 cm were used to get a sufficient counting statistics, itwould have been necessary to correct them in some cases depending on themeasuring geometry. However, the corrections were in general less than1% if one carefully avoids γ-transitions with high coincidence probabilities.
The true-coincidence effects for extended volume sources is morecomplicated than the situation of point sources, since the interactions ofradiation within the source itself has to be taken into consideration. In thiscase peak and total efficiencies have to be well known not only as afunction of photon energy but also as a function of space vector inside thesource volume (V) According to [cf. 105,106]. In order to circumvent thetedious integration over εp(r), and εt(r) at each differential element dV at r,a volume effect factor Fv needs to be introduced.

Chapter III
81
Let us first consider a radionuclide with a simple decay scheme asshown in Figure (3-18). The probability for γ−γ coincidence summingA=B+C can be expressed as:
( )( ) ( )
( )( )3 31
p B p CB Vc c
A p AV
r r dVS A B C a c
r dV
ε εγγ ε
⋅ ⋅
⋅
⋅ ⋅= + = ⋅ ⋅ ⋅ −
⋅∫
∫
( ) ( ) ( ), 3 32p B p CBc c V
p AA
S A B C a c F B Cγ ε εγ ε
⋅ ⋅
⋅
⋅= + ≡ ⋅ ⋅ ⋅ ⋅ −
Where, γ is the absolute gamma intensity, a is the branching ratio;c=1/(1+α1), α1=αK+αL+...., is the total internal conversion coefficient.
Figure (3-18): A simple Decay Scheme Showing (a) True-CoincidenceSumming A=B+C. (b) True-Coincidence Loss γ−γ and γ−KX (IC), and (c)
True-Coincidence Loss γ−γ and γ−KX (EC) Effects.
Consider the simple γ−γ and γ−KX (IC) coincidence as shown inFigure (3-18). Similarly, the probability for coincidence loss can beexpressed as:
( ) ( ) ( )( )( ) ( ) ( ), ,,, , 3 33t B t BB B V B B K B K i V i
I
L A L A B L A KX B
a c F A B a c k F A kε α ω ε
= − + −
= ⋅ ⋅ ⋅ + ⋅ ⋅ ⋅ ⋅ ⋅ ⋅ −∑
With CBαK,B the probability that a K-electron is emitted, ωK thefluorescence yield of the KX-ray, ki, the relative emission rate and i can beα1, α2, etc.

Chapter III
82
The εp and εt, in the above two equations are the source-volume-averaged peak and total efficiencies, which can be determined by efficiencycalibrations. (In the following text εp and εt, will be used to replace thesymbols εp and εt, for simplicity).
The above reasoning based on simple decay schemes Figure (3-18)can be extended to more complicated decay schemes.
3-8.8.1 γ−γ Coincidence for Extended Sources
To illustrate the correction of true-coincidence effects, let usconsider a radionuclide with a simple decay scheme as shown in Figure (3-18) where the gamma line of photon A is to be measured. The rate ofpulses from full-energy absorption of photon A in the detecting system is:
( ), , 3 34p A A p AN I γ ε= ⋅ ⋅ −
with I = source activity; γ = absolute gamma intensity; εp = full-energypeak efficiency.
Now, if we take into consideration the γ−γ coincidence summing A= B + C. Figure (3-18), the recorded full-energy peak in the spectrumwould become:
( ), , , , , 3 35p A A p A B p B C C p CN I I a cγ ε γ ε ε′ = ⋅ ⋅ + ⋅ ⋅ ⋅ ⋅ ⋅ −
( ) ( ), ,, , ,
,
1 1 3 36p B p CBp A A p A C C p A
A p B
N I a c N S Aε εγγ ε
γ ε ⋅ ′ = ⋅ ⋅ ⋅ + ⋅ ⋅ ⋅ = + −
where S(A) is the probability for full-energy peak gains of photon A dueto γ−γ coincidence summingA = B+C:
( ) ( ) ( ), ,
,
3 37p B p CBc c
A p A
S A S A B C a cε εγ
γ ε⋅
= = + = ⋅ ⋅ ⋅ −
Where,a = branching ratio
= the probability for the transition from one energy level to another(e.g., cc gives the probability for the transition from level 2 to level 3 inFigure (3-18):

Chapter III
83
c = conversion factor = the probability that gamma photon is emitted during the transition,i.e., internal conversion does not take part during the transition (e.g., ccgives the probability that gamma photon B is emitted in Figure (3-18));
εp = full-energy peak efficiency.
If other series of cascading gamma lines (not shown in Figure (3-18)are also present, e.g., A = M+N+ O, one should also consider:
( ) ( ), , ,
,
3 38p N p N p OMN N O O
A p A
S A M B C a c a cε ε εγ
γ ε⋅ ⋅
= = + = ⋅ ⋅ ⋅ ⋅ ⋅ −
Leading to:
( ) ( ) ( )( ) ( ). 3 39
S A S A B C S A M N O
S A other possibl sum gammas
= = + + = + +
+ = −
If we consider the γ−γ coincidence loss A − D, as shown in Figure(3-18) the recorded full-energy peak in the spectrum would become:
( ), , , , , 3 40p A A p A A p A D D t DN I I a cγ ε γ ε ε′ = ⋅ ⋅ − ⋅ ⋅ ⋅ ⋅ ⋅ −
( ) ( ), , , ,1 1 3 41p A A p A D D t B p AN I a c N L Aγ ε ε ′ = ⋅ ⋅ ⋅ − ⋅ ⋅ = − − Where, L(A) is the probability for full-energy peak losses of photon A dueto γ−γ coincidence loss A −D:
( ) ( ) ( ), 3 42D D t DL A L A D a c ε= − = ⋅ ⋅ −
with εt, the total detecting efficiency. If other coincidence losses (notshown in Figure (3-18) are also present, e.g., A−F. one should alsoconsider:
( ) ( ), 3 4 3F F t FL A F a c ε− = ⋅ ⋅ −
Leading to
( ) ( ) ( ) ( ) ( )3 44L A L A D L A F L A other possible gammas= − + − + = −

Chapter III
84
The above formulae can be extended to more complicated decay schemes,details have been reported elsewhere [cf. 105,106].
For extended volume sources, the true-coincidence effects becomemore complicated, since the differential peak- and total-efficiencydistributions within the source itself have to be taken into consideration. Inthis case simple formulae such as from Eq. (3-43) to Eq. (3-50) are nolonger valid, and peak and total efficiencies have to be known not only as afunction of photon energy but also as a function of space vector inside thesource volume V.
Considering the γ−γ coincidence summing A = B – C, Figure (3-18) for an extended source. Eqs. (3-41), and (3-42) have to be rewritten intheir differential forms:
( ) ( ) ( ), , 3 45p A A p An dV i r r dVγ ε⋅ = ⋅ ⋅ −
( ) ( ) ( ) ( ) ( ), , , , 3 46p A A p A B p B C C p Cn dV i r r dV i r r a c dVγ ε γ ε ε′ ⋅ = ⋅ ⋅ + ⋅ ⋅ ⋅ ⋅ −
where i(r) is the source activity density, εp(r) and εt(r) the peak and totalefficiencies at r. If the radionuclides are homogeneously distributed in thesource with volume V. i(r) = I/V, and by integration one may have:
( ), ,1 3 47p A A p AV
N dVV
γ ε= ⋅ ⋅ ⋅ −∫
( ), ,, ,
,
1 3 48p B p CVB
p A p A C CA p AV
dVN N a c
dV
ε εγγ ε
⋅ ⋅ ′ = + ⋅ ⋅ ⋅ ⋅ − ⋅
∫∫
Therefore, the probability for γ−γ coincidence summing S is appearing inEqs. (3-37), should be modified as:
( ) ( ), ,
,
3 49p BV p CB
C CA p AV
dVS A B C a c
dV
ε εγγ ε
⋅ ⋅= + = ⋅ ⋅ ⋅ −
⋅
∫∫
Similarly, the probability for γ−γ coincidence loss L is appearing in Eqs. (3-33), should be modified as:

Chapter III
85
( ) ( ), ,
,
3 50p AV t D
D D
p AV
dVL A D a c
dV
ε ε
ε
⋅ ⋅− = ⋅ ⋅ −
⋅
∫∫
Please note that the εp, A(r) term now appears in both the numeratorand the denominator in Eq. (3-56) and cannot be cancelled one with theother.
The summing and loss probabilities for more complicatedcoincidences can be obtained based on the same reasoning as above.
The determination of S and L values, in the forms such as Eqs. (3-49), and (3-50), needs information about εp,A(r) and εt,A(r) at eachdifferential volume element dV at r, for each counting geometry and foreach specific photon energy. It is very impractical and an almostimpossible mission for most laboratories to obtain this information byexperimental measurements. To circumvent tedious and immeasurableexperimental efforts involved in S and L determination, a computationalmethod is suggested in this work by introducing a “volume-effect factor” aswill be discussed in the following subsection.
3-8.8.2 The Volume-Effect Factor FV
In this work, we define εp, A(r) and εt, A(r), the source-volume-averaged peak and total efficiencies, ξp(r) and ξt(r) the normalizeddistribution functions of peak and total efficiencies, then for a given photonY, we may have:
( ) ( ) ( )( ) ( ) ( )
,, ,
,, ,
3 51.1
3 51.2
p Yp Y p Y
t Yt Y t Y
r r
r r
ε ε ξ
ε ε ξ
= ⋅ −
= ⋅ −
Where,
( ) ( )
( ) ( )
( ) ( )
( ) ( )
, ,
, ,
,
,
1 3 52.1
1 3 52.2
1 1, 3 53.1
1 1, 3 53.2
p Y p YV
t Y t YV
p YV
t YV
r dVV
r dVV
r dVV
r dVV
ε ε
ε ε
ε
ε
= ⋅ ⋅ −
= ⋅ ⋅ −
⋅ ⋅ ≡ −
⋅ ⋅ ≡ −
∫
∫
∫
∫Now, Eq. (3-61) can be re-written as:

Chapter III
86
( ) ( ) ( )
( )
, ,, ,
,
, ,
,
1
3 54
p B p CBC C p B p CV
p AA
p B p CBC C V
p AA
S A B C a c r r dVV
a c F
γ ε ε ξ ξγ ε
γ ε εγ ε
⋅= + = ⋅ ⋅ ⋅ ⋅
⋅= ⋅ ⋅ ⋅ ⋅ −
∫
Where, FV is the volume-effect factor and is defined as:
( ) ( ) ( ) ( ), ,1, . 3 55V p p p B p CV
F B C r r dVV
ξ ξ≡ −∫
Similarly, Eq. (3-56) can be re-written as:
( ) ( ) ( )
( )
, , ,
,
1 ,
. 3 56
t DD D p A t DV
t DD D V
L A D a c r r dVV
a c F
ε ξ ξ
ε
− = ⋅
= ⋅ −
∫
With,
( ) ( ) ( ) ( ), ,1, 3 57V p t p A t DV
F A D r r dVV
ξ ξ≡ −∫
Please note that if the volume-effect FV factor is removed then Eqs.(3-54), and (3-55) reduce to Eqs. (3-49), and (3-50). In other words, FV is afactor that accounts for the fact that true-coincidence effects are actuallydepending on not only the source-volume-averaged peak and totalefficiencies but also the differential-efficiency distributions within thesource, if extended sources are encountered.
Where εp and εt, have a similar variation with distance to detector,and that the propagation of the uncertainty in the εt value to the COI valueis of minor importance, in this work. We further assume:
( ) ( ) ( ) ( ), , . 3 58p Y t Y Yr r rξ ξ ξ= ≡ −
With this assumption we have:
( ) ( ) ( ) ( )( ) ( ) ( )
, , , , 3 59.1
, , . 3 59.2
V p t V p p V
V p p V
F A D F A D F A D
F B C F B C
= ≡ −
≡ −
This means FV is only a function of ξY(r) combinations no matter εp or εt, isinvolved.

Chapter III
87
For coincidences involving more than two gammas energies, sayYl,Y2,Y3, etc., we have:
( ) ( ) ( ) ( )
( ) ( ) ( ) ( ) ( )
( ) ( ) ( ) ( ) ( ) ( )
1 2
1 2 3
1 2 3 4
11, 2 , 3 60.1
11, 2, 3 , 3 60.2
11, 2, 3, 4 , 3 60.3
V Y YV
V Y Y YV
V Y Y Y YV
F Y Y r r dVV
F Y Y Y r r r dVV
F Y Y Y Y r r r r dVV
ξ ξ
ξ ξ ξ
ξ ξ ξ ξ
= −
= −
= −
∫
∫
∫etc.,,
In summary, the probabilities for true-coincidence summing (S) andloss (L) can now be determined by (1) finding the γ. V, and c values fromtabulated or reported nuclear data. (2) determining the εp and εt, values byefficiency calibration, and (3) determining the FV Factors by calculation.
The εt-Eγ curves can be constructed by the conversion formula:
( ) ( ). 3 61t pT
pε ε= −
Where P/T is the peak-to-total ratio, i.e. the ratio between full-energy peakarea and the total area in the spectrum originating from the same decaytransition. The P/T ratio is an experimentally determined quantity, and is afunction of gamma-ray energy and the counting geometry.
The calculations of FV factors were performed with the aid of theMonte Carlo program [cf. 100]. This program can calculate the effectivesolid angle FV for a specific energy of photon, for a specific source andcounting geometry. The effective solid angle is:
( )source
att effdetectorF F . 3 62dΩ = Ω −∫
Where, Feff is the probability for a photon emitted within a differentialgeometrical solid angle dΩ and impinging on the detector to interactincoherently with the active detector crystal. Fatt is the attenuation factor ofthe photon by the source itself, and by any material between the source andthe detector crystal. Since Ω is proportional to the peak efficiency εp [cf.113,114]. We can directly relate the distribution of Ω(r) to the distributionfunction ξ(r). From Eqs., (3-54) and (3-56) we have:

Chapter III
88
( ) ( ) ( )1 1, 3 63V
r dVV ξ = −∫
The equation can be re-written as:
( ) ( ) ( )1 1, 3 64.1V
C r dVV ⋅Ω = −∫
Where C is the normalization constant and can be expressed as:
( )( ), 3 64.2
V
V VC
Er dV= = −
Ω∫
With
( ) ( ), 3 64.3V
E r dV= Ω −∫And
( ) ( ) ( ) ( ), 3 64.4Vr C r r
Eξ = ⋅Ω = ⋅Ω −
Taking the FV factor Y1-Y2 coincidence as an example and applying theabove formulae, we have:
( ) ( ) ( ) ( )
( ) ( ) ( )
1 2
1 2
1 2
11, 2 , 3 65.1
, 3 65.2
V Y YV
Y YV
Y Y
F Y Y r r dVV
Vr r dV
E E
ξ ξ= −
= Ω Ω −
∫
∫
Now, based on determined E andΩ(r) values, FV can easily be calculatedusing the above equation. The FV factors for other coincidences can becalculated similarly.
3-8.8.3 Peak Area Correction
With the probabilities for γ−γ coincidence summing [S(A)] and loss[L(A)] determined, the observed full-energy peak area for photon A from ameasurement N'p,A can be expressed as:

Chapter III
89
( ) ( )( ) ( ) ( ) ( ) ( )
, ,
,
1 1
1 3 66.1
p A p A
p A
N N L A S A
N L A S A L A S A
′ = − ⋅ + = − + − −
Or
( ),, , 3 66.2p A
p A
NN COI
′= −
where Np,A is the corrected peak area and the coincidence correction factorCOI is defined as:
( ) ( ) ( ),
,1 1 3 66.3p A
p A
NCOI L A S AN
′ = = − ⋅ + −
Could be re-written as:
( )( ) ( ),exp
,
. 3 66.4 .COIp t
freep p
ECOI
Eγ
γ
εε
= −
Where, ( ),freep i Eγε is the peak efficiency measured by using coincidence free
sources, ( ),COIp i Eγε is the peak efficiency measured for gamma-lines Eγ from
coincidence gamma-ray nuclide i.
It is worth mentioning here that the last term shown on the right handside of Eq. (3-72.1), L(A)S(A). Using the simple decay scheme of Figure(3-18) as an example, accounts for the fact that the sum pulses originatingfrom B+C are subject to the same true coincidence loss (with D) as A itself[cf.115]. For other complicated decay schemes, the situations are the same.Therefore, we used the program “TRUECOINC” [cf. 116] as a global formfor number of cascades in the decay scheme data relieved from the isotopeconcerned data file.
True coincidence losses could be caused by every gamma ray in acascade chain for the investigated one (g0), which is emitted within the timeresolution of the detector system. The ktcl correction factor is theprobability of the detection of a given g0 gamma-quantum without thedetection of any other gamma-quanta from its cascade chain. Furtherproblem comes when during the de-excitation X-rays are emitted. If thedetector is able to detect the low energy gamma, the X-rays also couldcause true coincidence losses. X-rays are produced during the EC and thegamma conversion to electron processes. If the angular correlation betweenthe cascading gamma is neglected this correction factor can be calculated

Chapter III
90
as declared from the following equation by using “TRUECOINC”. [cf.116]
( )
0
0
1 1
1 1
(1 ) (1 (1 ))3 67
(1 )
i
i
nn
i i ij ij ijk k kl li k lj
tcl nn
i ij ijk k kli k lj
Sβ ε ω δ εκ
β ω δ
= =
= =
− Γ + Γ − + − = −
Γ + Γ − +
∑ ∑ ∑∏
∑ ∑ ∑∏,
Where
n0 is the number of cascade chains containing the g0 transition, ni is the number of the cascade gamma transitions in the i-th cascade
chain (i=1,2,...,n0) bi is the branching ratio of the β− (or β+, EC, α) transition populating
the i-th cascade chain, Gij is the branching ratio of the j-th gamma transition in the i-th
cascade chain, Gijk is the conversion ratio of the j-th transition trough creating vacancy
on the k-th atomic shell (K,L1, L2…) in the i-th cascade chain, wk is the fluorescence yield of the k-th atomic shell (K,L1, L2, …), dkl is the emission ratio of l-th x –ray from the k-th atomic shell (K,L1,
L2…), el is the product of the total detection efficiency and the self
absorption for the energy of the l-th x-ray l= (εt* εsa)l , eij is the product of the total detection efficiency and the self
absorption for the energy of the j-th gamma transition in the i-thcascade chain εij= (εt* εsa)ij , (use eij=0 for the g0 transition)
Si Si=1 for β− or a decay; and Si=[1-2*( εt* εsa)511keV] for β+ decaywhile for EC i.
( )(1 (1 )) 3 68i i ik k kl lk l
Sβ ω δ ε= ∆ − + − −∑ ∑ Dik is the branching ratio of the EC transition trough generating
vacancy on the k-th atomic shell (K, L1, L2…), while populatingthe i-th cascade chain.
True coincidence gains could also be occured if there are more levels
between the levels of the investigated g0, then the coinciding gamma rayscan produce the same amplitude as the original transition.

Chapter III
91
[ ] ( )1 1
0 0
( )1 3 69
( )
imn
ij p iji j
tcg
p
ε γκ
ε γ= =
Γ= + −
Γ
∑∏
In most cases this true Coincidence gain correction is negligible
while the peak efficiency of the detectors is much less than the totalefficiencies. In some case when G0 is small the correction can be important.
Alias lines (or pseudo-lines) are non-existing gamma lines shown inthe spectrum produced by the true coincidence of two or more non-neighboring gamma transition and X-rays. In the case of a complicatedspectrum these alias line may coincide in energy with a real gamma line.Therefore the knowledge of the energies and relative intensity of these lineis very important in the identification of the isotopes and to avoid the errorin the data evaluation. The intensities are calculated by the followingexpression:
( ) ( )( ) ( )
0
, ,1 1
(1 ) 3 70inn
p a p balias a b i ij ijk k kl a b
i k lj p a b
E EI R R
E E
ε εβ ω δ
ε= =
= Γ + Γ − + − +∑ ∑ ∑∏
where Rx is the branching ratio of the x type of transition to the totaltransition between the selected level. The calculation takes account onlytwo coinciding lines.
3-8.9 Uncertainties of Fluence Response
Uncertainty of the flux densities were determined via the monitorreaction natCu(p,x)63Zn, natCu(p,x)65Zn, natTi(p,x)48V using cross-sections asdescribed in detail by Tarkanyi et al., (2001) in [cf. 94]. The uncertainty offlux density is mainly determined by the uncertainties of efficiency and ofthe mass of the monitor foil, the monitor cross-sections, which sum up tobe about 5%. Uncertainty of the measurement of the monitoringradionuclides, the relative precision of this determination was checked bymultiple measurements and no error was assigned to the monitor crosssection.
In this study we will deal with an approach to simply determine thebeam intensity, and increasing the accuracy of data gained. An establishedmethod for measuring the neutron, proton fluence-rate and beam energyinvolves placing a standard sample in the beam and detecting the γ-raysgiven off by the reference reactions that take place.

Chapter III
92
To estimate the accurate flux through sample foils does not fullfilledwith assigning the sources of flux uncertainties, and its correctionmagnitudes as menstioned above. In addition to that, we may consider forpossible effects of secondary neutron activation to be ruled out to a largeextent as reported by Weinreich et al., (1980) [cf. 117]. The effects of thatprocesses could be take place inside a single foil as well as a multiple foilsused in stacked foils technique.
This approach is built to audit the beam intensity, to utilize from thestacked foils techinque in modeling its change. The degraded fluence,whatever it was proton or neutron beam is effected with several reasonsScattering which causes also an electric stopping power for chargedparticle, beam get out fraction which is responsible for nuclear stoppingpower, Straggling effects due to essential property of generated beam fromcharged particles accelerators. (i.e. emittance angle, focusing, anddefocusing properties, etc.,). The effects of spaced media through whichthe beam pass before reach to stacked foils in case of internal or externalirradiation. Figure (3-19) shows the neutron production cross section fromproton induced reaction for natural Molybdenum, and Gadolinium targetfoils as a function of the proton energy, Ep up to 20 MeV, calculationsperformed using ALICE-91 Code [cf. 29]. The Differential Cross-Sectionsfor neutron spectrum generated from the natural Molybdenum, Gadoliniumtargets bombarded with 20 MeV Protons are shown in Figure (3-20).
We will deal with this dilemma by dividing the problem into twoparts, first part will be evaluated experimentally and the second part will bedealt theoretically. The effective fluence through stacked foils will bedetermined, taking into account the different causes for beam degradation.The stack will be cured by a precisely determined flux using multiplemonitors, then fitting these experimental points to theoretical formulae. It isproposed that the treatment will not remedy allover corrections but stillsome errors unresolved may cause the values of cross sections to besuffering deviation from absolute values.
In spite of, in the actual case where the product may be effected withother building up reactions make a partial contribution of second beam ofseven orders less than incident beam. Especially when using a natural thicksample, the affinity of this second beam differs from the incident beam intype and reactivity (photon and particle induce reactions). Where the crosssection for neutron is high especially with slowing down, through theinteractions upon successive foil layers of target nuclei.

Chapter III
93
0
1
10
100
1000
10000
100000
0 5 10 15 20Proton Enrgy (MeV)
Cro
ss S
ectio
n (m
b)
Mo-nat.
Gd-nat.
Figure (3-19): Neutron Production Cross Section from Proton InducedReaction for Natural Gadolinium, and Molybdenum Target Foils as a
Function of the Proton Energy, Ep up to 20 MeV, ALICE-91 Code [cf. 29].
0
200
400
600
800
1000
1200
1400
0 5 10 15 20Neutron Energy (MeV)
Diff
eren
tial C
ross
Sec
tion
(mb/
MeV
)
Mo-nat. Neutron SpectrumGd-nat. Neutron Spectrum
Integral Angle
Figure (3-20): Differential Cross-Section Neutron Spectrum fromNatural Gadolinium, and Molybdenum Target Foils Bombarded with 20
MeV Protons, ALICE-91 Code [cf. 29].
The secondary beam build up will be remedied through calculatingthe produced nuclei during interaction of neutron along the stacked foilswhich can be approximated as an increase in number of target nuclei or asan increase in primary beam intensity. F(Ei,t) represent the fluenceresponse probability, probability means that percentage valued from 0 to 1could be represence change in the specific fluence through one stacked foil.F(Ei,t) can be expressed as a product of two functions (excluding primarybeam buildup and subsequent neutrons). We write:

Chapter III
94
( ) ( ) ( ) ( ) ( ) ( )1 2, , , , 3 71i i iF E t f E t f E t= ⋅ −
3-8.9.1 f(1)(Ei,t), Neutron-Production Probability
In principle f(1)(Ei,t) depends upon all (p,xnγ) cross sections, wherex=1,2,…etc. For the present purposes we assume that proton scatteringcross section predominates. The assumption is reasonable because of theneutron spectrum resulting from the proton-induced reaction isconsiderably low. Furthermore, for proton energy between 1 and 4 MeV,the proton scattering cross section is more than 95% of the total (p,xnγ)cross section.
The discussion of the neutron-production probability is convenientlypresented in terms of the differential probability, (d/dx)[f(1)(Ei,x)]dx. It isdefined, as the probability that a proton of energy Ei propagate from atarget foil of thickness dx located at a depth x against Coulomb interaction,will give rise to a nuclear neutron due to absorbed proton per unit massdensity per unit flux density. Functionally we write S.S. Malik (1975) [cf.118]:
( ) ( )( ) ( )
( ) ( )
( ), ,1
0
1 exp, , 3 72
t n p i t n p i
i
p i
n E x n Ef E t dx dx
x t
R E t x
σ σ − − ⋅ ⋅ ⋅ ⋅∂ = ⋅ − ∂ ∆ − −
Where, nt is the number of target foil atoms per cm3, and the totalneutron production cross section. The neutron-production probability ofpractical interest is one, which contains the provision that the ejectedneutron will reach the stacked foil end. The path lengths associated withsuch neutrons will depend upon a number of factors. Of these the finitesizes of the target foil contribute to the geometrical variation of the pathlengths. A procedure, which incorporates the above provision andsimplifies the treatment, is to write:
( ) ( )( ) ( )
( ) ( )
( ), ,1exp
, , 3 73t p s i t n p i
i
p i
n E x n Ef E t dx dx
x t
R E t x
σ σ −∂ → ⋅ − ∂ ∆ − −
Where, σp,s(Ei) is the total proton scattering cross section

Chapter III
95
( ) ( )2 ,2
, 0 0
1 cos sin , 3 744
n pn p i
dE d d
d
ππ σσ φ ψ ψ ψ
π
= − ′Ω ∫ ∫
Eq. (3-79) indicates the probability that an incident proton of energy Eipropagate at a depth x in the range dx will pass through a stacked foil.R(Ei) is the straight-ahead range of the proton in the material of the targetfoil. The ∆ function has the property:
( ) ( ) ( ) ( ) ( )( ) ( ) ( )
1 , 3 75
0 . 3 76p i p i
p i
R E t x if R E t x
if R E t x
∆ − − = ≥ − − = − −≺
Through a straightforward integration yields:
( ) ( ) ( ) ( )0
. 3 77p i p iR E t x R E
tt
∆ − − → −
In defining the ∆ function through the Eqs. (3-75) and (3-76) it has beentacitly assumed that there is no straggling.
It is further assumed that the range R(Ei) is parallel to the axis of thetarget foil. The actual range R(Ei) is however, not parallel to the target foilaxis. The direction of the produced neutron changes due to collisions withthe nuclei in the target foil.
In Eq. (3-74) dσ/dΩ′ is the differential cross section per unit solidangle for the amount of neutron energy scattered in the direction ψ [cf.118]. Use of σn,p(Ei) enables us to preferentially discriminate against thoseneutrons which possess small kinetic energy less and the associatedneutrons need long path lengths to reach the stacked foils end. In addition ityields an ejected proton beam with an initial direction that is parallel to theincident proton beam. Values of σn,p(Ei) per target atom are numericallycomputed.
In order to integrate Eq. (3-73) it is assumed that “a parallel protonbeam of small cross-sectional area is incident axially upon a cylindricaltarget foil”. This procedure assigns the same x value to all the protonspresent at a given depth in the target foil. The integration is nowstraightforward and we have:

Chapter III
96
( ) ( ) ( ) ( )
( ) ( ) ( )( ) ( )
1 1
0
,,
,
, ,
1 exp . 3 78
t
i i
n p ip it p s
p s i
f E t f E t dxx
ER En t
t E
σσ
σ
∂ = ∂
= ⋅ − − −
∫
The neutrons produced in the stack could also be respomsible for theproduction of more extra neutron, the neutron production cross sectionfrom neutron induced reaction for natural Molybdenum, and Gadoliniumtarget foils as a function of the neutron energy, En up to 5 MeV. Theconcerned data could be estimated by using ALICE-91 Code as representedin Figure (3-22).
0
1
10
100
1000
10000
100000
0 1 2 3 4 5 6Neutron Energy (MeV)
Cro
ss S
ectio
n (m
b)
Mo-nat.
Gd-nat.
Figure (3-21): Neutron Production Cross Section from Neutron InducedReaction for Natural Gadolinium, and Molybdenum Target Foils as a
Function of the Neutron Energy, En up to 5 MeV, Using ALICE-91 Code.
The neutrons generated in the stack could produce radionuclide dueto different types of reaction, depends on the reaction threshold and neutronenergy. One of the most important reaction is the radiative capture crosssection, which is generate gamma rays in the stack couls be responsible fordriving more reactions produce neutrons by photoneutron reaction. Figure(3-22) represence some literatured experimental data concerning thecapture cross section for natural target foils of Molybdenum, andGadolinium as a function of neutron energy up to 5 MeV, which producesin the stack with high differential cross section as previously shown inFigure (3-20). In Figure (3-23) the relative values of the neutron productionprobability, f(1)(Ei,t), in arbitrary units, for Molybdenum, and Gadoliniumtarget foil of thickness t= 25, and 10 µm, respectively as a function of theproton energy, Ep (MeV). We can see from the figure that the neutronproduction increases with the increase in the incident proton energy.

Chapter III
97
The production begins at threshold energy and increases withdifferent values for Molybdenum and Gadolinium. Gd has the probabilityto produce neutrons more than Mo.
1
10
100
1000
10000
100000
0 1 10 100 1000 10000Neutron Energy (keV)
d σ/d
E (m
b/M
eV)
Gd-nat Exp. PointsGd-nat Exp. Points FitMo-nat Exp. PointsMo-nat Exp. Points Fit
NatGd(n,γ)xNatMo(n,γ)xEn max = 5 MeV
Figure (3-22): Neutron Induces Capture Cross Section for NaturalGadolinium, and Molybdenum Target Foils as a Function of the Neutron
Energy, En up to 5 MeV in Log-Log Scale [cf. 119, 120].
00
Incident Proton Energy (MeV)
Mo
Neu
tron
Pro
duct
ion
0
Gd
Neu
tron
Pro
duct
ion
Mo-nat
Gd-nat
Nat
Figure (3-23): Relative Values of the Neutron Production Probability,f(1)(Ei,t), in Arbitrary Units, for Gadolinium, and Molybdenum Target Foils
of Thickness t=10, and 25 µm, respectively as a Function of the ProtonEnergy, Ep (MeV).
3-8.9.2 f (2)(Ei,t), Neutron Transmission Probability
Once a produced neutron is emitted in the forward direction it mustreaches the stacked foil end before it vanishes in a single target foil. Wedefine the function f(2)(Ei,t), as the probability that a produced neutron of

Chapter III
98
energy E≤Ei will pass through the target foil. The neutron transmissionprobability, providing that the neutrons will reach the stacked foils end willdepend upon the total absorption cross section σn,a(Ei). Due to the finitesizes of the target foil contribute to the geometrical variation of the neutronpath lengths is minimum. A procedure, which incorporates the aboveprovision and simplifies the treatment, is to write
We now introduce a differential probability for f(2)(Ei,t), and expressit as:
( ) ( ) ( ) ( ) ( )2, ,, exp , 3 79i t n s i t n a if E t dx n E x n E dx
xσ σ∂ → − ⋅ − ∂
Eq. (3-79) indicates the probability that a neutron produced at a depth x inthe range dx (by a proton of energy Ei) will reach the stacked foil end.σn,s(Ei) is the total scattering cross section for neutron, which affects the theneutron fluence in the material of the target foil.A straightforward integration yields:
( ) ( ) ( ) ( )
( ) ( )( ) ( )
2 2
0
,,
,
, ,
1 exp . 3 80
t
i i
n a it n s
n s i
f E t f E t dxx
En t
E
σσ
σ
∂ = ∂
= − − −
∫
It has been tacitly assumed that there is no straggling. It is furtherassumed that the actual path for the neutrons is parallel to the normal axisof the target foil. The direction of the produced neutron changes due tocollisions with the nuclei in the target foil. Subsequent to these collisionsthe scattered neutrons possess an angular distribution. If we assume that thenumber of collisions is sufficiently large (>20), the angular distribution isGaussian about a certain mean direction. We take the direction of thescattered neutron to be that defined by the mean scattering angle, θ, on aplane parallel to the incident proton beam.
The value of θ for an neutron with initial kinetic energy E and for afoil of thickness t (surface density in gm/cm2), atomic number Z and atomicweight A has been calculated by Paul C. Brand, NIST, (1999) [cf. 121].Using the values of θ are calculated as a function of neutron energy as:

Chapter III
99
( )( )4.52182arcsin 3 81
t E MeVθ
= −
The thickness x in the present calculations is not unique but variesbetween 0 and a length equal to the path R(Ei) of the neutron in target foil.This necessitates averaging of the angle Ω in accordance with the formula:
( ) ( )R
av 0
1 . 3 82E dxR
Θ = Θ − ∫
The value of average path R0(Ei) is thus taken to be:
( ) ( ) ( ) ( )0av
cos , 3 83n i n iR E R E E t= Θ ≈ −
( ) ( ) ( ) ( )( ) ( ),2
,,
, 1 exp . 3 84n a ii t n s
n s i
Ef E t n t
E
σσ
σ = − − ⋅ ⋅ −
0
5
10
15
20
25
0 1 2 3 4 5 6Ejected Neutron Energy (MeV)
Mo
Neu
tron
Tr
ansm
issi
on
Prob
abili
ty, f
(2) (E
i,t),
in
Arb
itrar
y U
nits
0
100
200
300
400
500
600
700
Gd
Neu
tron
Tr
ansm
issi
on
Prob
abili
ty, f
(2) (E
i,t),
in
Arb
itrar
y U
nits
Mo-nat
Gd-nat
NatMo(p,xn)XNatGd(p,xn)X
Figure (3-24): Relative Values of the Ejected Neutron TransmissionProbability, f(2)(Ei,t), in Arbitrary Units, for Gadolinium, and Molybdenum
Target Foils as a Function of the Ejected Neutron Energy, En (MeV).
The value f(2)(Ei,t) for ejected neutrons of energy E resulting fromthe interacting protons of energy Ei, is given in Figure (3-24) as a functionof the incident proton energy. We can see the probability of neutrontransmission for Molybdenum is higher than that for Gadolinium, thisimplies that Gadolinium could consume a large amount from the producedneutron, at the same time the Gd has the probability to produce neutron

Chapter III
100
than Mo. This can be explained with that Gd could react with neutronthrough the radiative capture as shown in Figure (3-22), as well as (n,2n)reaction to produce more neutron with shifted energies toward the lowerneutron energy. In this coarse, with respect to the secondary particlescontribution in nuclear reaction producing readionuclides. We could use acombination of Mo, and Gd elements in certain arrangement forradionuclide production. In this arrangement the Molybdenum has the jobto produce the neutrons and the Gadolinium has the job to moderate theseneutron to a suitable energy needed.
We are now in a position to write down the overall expression for F(Ei, t),)the “Fluence Response Probability”, Eq. (3-85) as:
( ) ( ) ( ) ( ) ( ) ( )1 2, , , 3 71i i iF E t f E t f E t= −
( ) ( )
( ) ( )( ) ( ) ( )
( ) ( )
0
, ,, ,
, ,
,
1 exp 1 exp . 3 85
p ii
n p i n a ic p s c n s
p s i n s i
R EF E t
t
E En t n t
E E
σ σσ σ
σ σ
= ×
⋅ − − ⋅ − − −
This completes the discussion of the “Fluence Response Probability”.
The quantity in the square brackets is plotted in figure (3-25) for Mo,and Gd. We can see the increase in both Mo and Gd as the incident energyincreases. With respect to its behavior the fluence response probabilty forGd is higher than Mo.Some qualifying remarks F(Ei,t) are appropriate atthis juncture. For incident neutron with energy E>0.3 MeV the number ofradioactive capture produced (specific primary capture) is only slightlydependent upon the energy of the neutrons. In our calculations it is notpossible to assign any specific energy values to the neutron incident uponthe successive foils.
Even if all the neutrons at their production had the same value of thekinetic energy, their energy distribution after passage through target foilwill be fairly broad. This has the effect of dispersing the individual valuesthat determining the overall value of activity. For incident neutrons havingan energy E≤0.33 MeV the increase in the specific absorbing reaction isaccompanied by the reduction of the effective thickness of the target foils.The number of absorbing captures produced by neutrons for medium toheavy nuclei with E<0.3 MeV would thus be increased on vice for lightnuclei.

Chapter III
101
0.00
0.05
0.10
0.15
0.20
0.25
0.30
0 5 10 15 20Incident Proton Energy (MeV)
Mo
Flue
nce
Res
pons
e Pr
obab
ility
F(E
i,t)/E
p, A
rbitr
ary
Uni
t
0.0
0.2
0.4
0.6
0.8
1.0
1.2
Gd
Flue
nce
Res
pons
e Pr
obab
ility
F(E
i,t)/E
p, A
rbitr
ary
Uni
t
Mo-nat
Gd-nat
NatMo(p,xn)XNatGd(p,xn)X
Figure (3-25): Relative Values of the Overall Proton Fluence ResponseProbability per unit Proton Energy, F(Ei,t)/Ep, in Arbitrary Units, for
Gadolinium, and Molybdenum Target Foils, as a Function of the IncidentProton Energy, Ep (MeV).
The theory presented here is the first attempt, to our knowledge, tobuild a systematic theoretical structure of the sensitivity toward effectiveflux estimation, that is subsequent of radionuclide production of stackedfoils. That implies considering the production cross section of monitorreaction, with the neutron production cross section of the sample. Theneutrons produced itself represent a physical quantity for all-secondaryscontribution, its spatial distribution, and transmission properties within thesample. We show that the combined effect of neutron production andneutron transmission through the target foil coupled with the primary,secondary beam, and may be the photonuclear activation also render theaccuracy of the nuclear data measured with respect to the proton inducedreactions. As we can see in molybdenum targets the neutron totalproduction is high, for integral angles, and energies.
The cross section for neutron production approached two barn, withmaximum at individual energy about 300 mb, at the same time thescattering cross section is high in the energy range of high population inneutron yield spectrum. From this we can imagine a yield affected with aconsideration to those reasons, not only to the primary beam flux. At thesame time gamma induces decay is a verified phenomenon, it appreciableto consider. If we looking for neutron as intermediate particle could beproduced even with gamma induces decay of metastable state, or long livedradionuclides.

Chapter III
102
In brief as flux introduces as erroneous parameter imply a correctionto remove the accompanied error, in turn the true one appear, this reflect tothe number of count under the peak. As we know this count joint to activitythrough detector efficiency as a proportional constant. We nominateyttrium-89 for this mission because it has low threshold energy for neutroninteraction, it can estimate the neutron content in the foil. The wholesystem then become has an unique efficiency that could varying the flux atdifferent places is for sure effective and a number of probabilities representall the corrections that could be considered during calculation of thereaction cross section, reaction yield.
3-9 Estimated Correction Values for Uncertainty Sources
From the corrected decay rates of the radioactive products and themeasured beam currents, the cross sections of the proton induced nuclearreactions were calculated using the usual activation formula. Theassociated uncertainties are discussed below:
In the worst case all these uncertainties except for that of the net-peak counts summed up quadratically to about 10%. To this the latterindividual uncertainty had to be added quadratically. As a generaltendency, we obtained smaller uncertainties for longer-lived radionuclidesthan for short-lived ones. In most cases, however, the total uncertaintieswere less than 10%. All these errors were considered to be independent.Consequently, they were quadratically added according to the laws of errorpropagation to obtain total errors of the cross sections relative to thestandard cross sections. However, some of the sources of errors arecommon to all data of our experiments in the same way, while othersindividually affect each reaction. The common errors sum up quadraticallyand have to be quadratically subtracted when discussing ratios of crosssections from this work or the precision of the measured cross sectionsinstead of their accuracy.

Chapter III
103
Table (3-7): Major Uncertainty Sources and their EstimatedValues in the Cross Section Measurements.
Sources of UncertaintiesError
Magnitude in(%)
Number of Target Nuclei in the Sample (Target mass) < 1.0Flux Fluctuation During Irradiation Time < 1.0Irradiation, cooling and measuring times < 1.0Gamma-gamma coincidence summing < 1.0Half-Lives of the radionuclides 1.0Intensity of Gamma Rays 1.0Absolute Efficiency Calibration 2.5Solid angle, γ-attenuation, and γ-self absorption 2.0Contamination Due to Recoil Losses Not ConsideredEnergy derived from stopping power range Not ConsideredQuality of the Monitor Data (Proton Fluence) 5.0Dead Time and Pile-up Losses in γ-Spectroscopy < 1.0Statistical Uncertainty in Net Peak Areas 1.0-5.0Secondary Particles contribution in NuclidesProduction, and Beam Intensity Loss as the BeamTraverses the Stack Thickness
7.0
The Root Average of Total Error Due to all theseFactors after Quadrate Sum is Estimated to Be 10.2-11.3

Chapter III
104

Chapter IV
105
4-1 Introduction
Though several investigations are available in the literature for thedetermination of reaction cross-sections related to the production ofradionuclides, there are large discrepancies in the cross-sections measuredfor the same reaction by different authors. Further, there are largeuncertainties in the measured cross-sections due to the use of low-resolution detectors. Moreover, the details of errors and their evaluation arenot discussed in general. Recent experiments have clearly indicated that instatistical nuclear reactions, at moderate excitation energies, particles areemitted prior to the establishment of thermodynamic equilibrium of thecompound nucleus (CN). This process is generally known as pre-equilibrium emission (PE).
Through this study measurement and analysis of the excitationfunctions for a number of reactions using proton beams, the cross-sectionsfor natMo(p,x)92mNb, 94,95m,95g,96m+g,99mTc, and natGd(p,x)152,154m,154g,155,156,160Tbreactions have been measured from threshold up to 18 MeV, using theactivation technique. The computer codes ALICE-91 [cf. 29] is a hybridcode uses the Weisskopf-Ewing evaporation model [cf. 122], the Bohr-Wheeler model for fission and the geometry dependent hybrid model forprecompound decay. Thus it is interesting to compare the excitationfunctions calculated using this code with the known experimental data.While code EMPIRE-II (M. Herman, 2005) [cf. 30], this is the modifiedversion of previous release EMPIRE-MSC [cf. 123], that uses the multistepcompound (MSC), and multistep direct (MSD) formulations (Feshbach etal., 1980) [cf. 124], has been employed for the quantum mechanicalcalculations. The details of the measurements are presented in next section,while analysis of the data is discussed in next chapter. The excitationfunctions for the proton induced reactions natGd(p,x)154m,154g,155,156,160Tb tothe best of our knowledge, have been reported for the first time and henceno comparison with literature data is presented.
Signatures of pre-equilibrium emission are often found in the highenergy tails of the excitation functions. The pre-equilibrium emissionmechanism has attracted considerable attention from both the experimentaland theoretical viewpoints of Gadioli and Hodgson, (1992) [cf. 125]. Thecomputer codes ALICE-91 Blann, (1971) [cf. 126-130] have beensuccessfully used to describe the experimental data on pre-equilibriumemission. Recently, quantum mechanical (QM) theories have also beenused to analyze the experimental data mostly on nucleon induced reactionsFeshbach et al., (1980) [cf. 124,125].

Chapter IV
106
4-2 Outline of Nuclear Reaction Mechanisms
In the present work the measured excitation functions for thereactions natMo(p,x) and natGd(p,x) have been analyzed using both ALICE-91 as well as code EMPIRE-II computer codes with consistent sets ofparameters. These parameters for the ALICE-91 approach were obtainedfrom the recent analysis of proton, neutron and alpha induced reactions.The computer codes ALICE-91 Blann et al., (1971, 1972, 1975, 1982,1988, and 1991; Blann and Vonach, 1983) [cf. 34, 126-130], the codeEMPIRE-II (M. Herman, 2005) [cf. 30] has been used for description of thedata. Brief details of these codes and the parameters used in thecalculations are summarized in the following sections. These codesincludes models describing the nuclear reaction induced with a projectilehave a certain amount of energy through three mechanisms that are theDirect, Pre-equilibrium emission and compound nucleus mechanisms.
4-3 Description of Code ALICE-91
The theoretical cross section calculations of nuclear reactions topredict relevant excitation functions using the ALICE-91 code developedby Blann et al., (1991) [cf. 29]. The Algorithm of this code depends mainlyon evaluation of the emitted nucleon spectra using the following formula:
( ) ( ) ( )( ) ( )
0
2
0
1, ,2 1 4 1
, ,
xprex x c
l x nx xl n nx c
p h E Qdl T R n g D
d p h E
π ω ε λσ πε ω λ λ
∞
= = +
− − −= + ⋅ ⋅ ⋅ ⋅ −
+∑ ∑
Where, is the reduced wavelength of the incident particle, Tl is thetransmission coefficient calculated using optical model, εx is the energy ofthe nucleon emitted, Qx is the binding energy of nucleon in compoundnucleus, ω(p,h,E) is the density of n-exciton states having p particles and hholes (p+h=n) at the excitation energy E, x
cλ is the intranuclear transitionrate corresponding to the absorption of nucleon in nucleus, g is the singleparticle level density, Rx(n) is the number of x-particles in n-exciton state,Dn is the Depletion factor for n-exciton state, n0 is the initial excitonnumber. More details of formulae used to calculate the above parametersare found in [cf. 130].
The density of exciton states has been calculated with Strutinski-Ericson formula:
( ) ( )( ) ( )
2 1
, , , 4 21
g gE Ap h E
p h nω
−−= −
⋅ ⋅ −

Chapter IV
107
To calculate the emission rate of nucleon, the following relation hasbeen used:
( ) ( ) ( )2 3
2 1, 4 3
xx x x inv xx
c
x
s
g
µ ε σ ελ
π+ ⋅
= −⋅
Where, sx and µx are the spin and the reduced mass for particle of x-type,xinvσ is the inverse reaction cross section for considered particle level density
for x-particle.
The internuclear transition rate has been calculated with thefollowing formula:
( ) ( )0 4 5xx lVλ σ ε ρ+ = −
Where, V is the velocity of nucleon moving inside the nucleus, σ0 is thePauli principle corrected cross section of nucleon-nucleon interaction, ρl isthe nuclear density in the range ( )1ll r l +≺ ≺ .
The factor Rx(n) included in formula (4-1) was calculated for neutroninduced reactions by the following way:
( ) ( )( )
( ) ( )
( ) ( ) ( )
23 ;
2
3 2 3 ;
33 . 4 64
n
p x
x x
Z AR
Z A
R R
nR n R
+=
+
= −
−= + −
The calculation of nonequilibrium spectra was carried out taking intoaccount multiple precompound nucleon. It was assumed that the number ofparticles emitted from a particular Exciton State is equal:
( );
/ 2 ( ), (4 7)n p n p
n n n n
P P P for emission of neutron and proton
P P P for emission of two neutrons
=
= −
Here, Pn and Pp are the total number of neutrons and protons emitted fromconsidered n-exciton configuration.

Chapter IV
108
For the code ALICE-91 (release April, 1991), which is amodification from the earlier releases versions of the commonly usedhybrid exciton model code ALICE-85/300 (cf. 128), in the followingrespects:
(a) Level density options due to Kataria-Ramamurthy [cf. 131] withinclusion of shell corrections may be selected. Level density optionsdue to Ignatyuk, (1979) (Superfluid Nuclear model) [cf. 132] may beselected. Some work needs to be done on fine tuning input for thisoption.
(b) Kalbach systematics C. Kalbach-Cline, (1973) [cf. 133] for pre-compound angular distributions in as option; it provides much fasteralgorithm than the option based on n-n scattering kinematics and givesbetter agreement with experimental results.
(c) Gamma ray spectra, and gamma rays compete with nucleon emissioncould be produced, this helps to simplfy the problems in case oftrapped protons for very proton rich nuclei.
This version may be used to for isotopically mixed targets, e.g.natural isotopic composition. For proton calculations on natural target, thetotal cross section for the formation of a particular residual isotope wasobtained by summing over all fractional isotopic constituents according tothe natural abundance of each isotope constitute the natural target. Thecode has been successfully applied up to 20 MeV to the calculation of(p,xn) reaction cross sections on medium mass target nuclei Lambrecht etal., (1999); Nandy et al., (2001); Hohn et al., (2001) [cf. 134,135,136].However, more complex reactions, like (p,α), were not reproduced wellLambrecht et al., (1999) [cf. 134]. The ALICE-91 code has been used forthe estimation of parameters for the production of medical radioisotopes[cf. 137-141].
With a light projectile (A<5) ALICE-91 describes the interactionpotential with the standard optical model code SCAT2 of Bersillon [cf.142] in case of spherical nucleus target. The pre-equilibrium mechanismdescribes the intermediate state between the reactions via a compoundnucleus and direct processes. The ALICE-91 code is a hybrid model, thehybrid model is relevant to the precompound decay not to the compounddecay. The hybrid means a combination between two theories on theprecompound decay. The geometry dependent hybrid model is a furtherrevision of the hybrid model. The statistical model describes the excitedstates of the nucleons, where Fermi Gas model is applied.

Chapter IV
109
According to this model a particle below the Fermi energy isconsidered to be in the ground state and the excited particle occupies alevel above Fermi energy. The vacant place, which the excited particleleaves below the Fermi level, is called a hole. In advanced approach, aparticle-hole system was considered as a quasi particle or exciton [cf. 143].From the density of the exciton states and several other parameters it ispossible to evaluate the probability of nucleon to be ejected at certainincident particle energy. This calculation results in a particle spectrum overa certain emission energy range. The reaction cross section at a certainincident energy is obtained by integration over produced spectrum.
In the present work, the excitation functions of all natMo(p,x),natGd(p,xn)-reactions were calculated from their respective thresholds up to20 MeV. The two cases for which the calculations could not be done werethe natMo(p,x)95mTc,natMo(p,x)95gTc and natGd(p,x)154mTb, natGd(p,x)154gTbsince ALICE-91 gives only the summed cross section and not theformation of the isomeric states. In all the calculations, standardrecommended input data without any additional parameter fitting wereused.
4-4 Description of Code EMPIRE-II
In this code theoretical calculations are performed for all reactionscontributing to the observed radionuclides, according to Herman et al.,(2005) [cf. 30]. EMPIRE-II is a modular system of nuclear reaction codes,comprising various nuclear models for major reaction mechanisms such asdirect, pre-equilibrium, and compound nucleus. If the target is a sphericalnucleus, then the interaction with a light projectile (A<5) EMPIRE-IIdescribes the interaction potential, and calculate the transmissioncoefficients with SCAT2-code the standard Spherical Optical Model ofBersillon [cf. 142]. EMPIRE-II could be also use the ECIS-code (CoupledChannel Model), and DWBA (Distrorted Wave Born Apploximation) of J.Raynal, (1994) [cf. 144], especially in the case of deformed targets,Coupled Channel calculations have to be involved in order to obtainadequate transmission coefficients and the low-lying discrete collectivelevel population. The input for ECIS-95 is prepared automatically withparameters retrieved also from RIPL-2 [cf. 145] or provided by the user..All calculate the total, elastic and reaction cross sections and providestransmission coefficients for emission of neutrons, protons, α-particles andeventually the ejection of a single light particle (d, t,...). The optical modelparameters are retrieved from the RIPL-2 [cf. 145], prepared internallyaccording to the built-in systematics, or provided by user.

Chapter IV
110
This code originally contained the Hauser-Feshbach theory [cf. 146],and the classical HYBRID model is simulated employing the geometrydependent hybrid (GDH) model of Blann, (1972) [cf. 127], to account forthe preequilibrium effects. The decay of the compound nucleus is treatedeither in terms of the Hofmann-Richert-Tepel-Weidenmuller et al., (1975)[cf. 147], (HRTW) theory accounts for the width fluctuation effects or interms of standard Hauser-Feshbach (1952) theory [cf. 146]. The widthfluctuation correction was implemented in terms of the (HRTW) approach[cf. 147], in case open particle channels cause the fluctuations to cancel.The code contains also the multi-step compound mechanism represented in(NVWY) model by Nishioka et al., (1986) [cf. 148]. This version alsoincluded combinatorial calculations of particle-hole level densities. It isdesigned for calculations over abroad range of energies and incidentparticles. A comprehensive library of input parameters covers nuclearmasses, optical model parameters, ground state deformation, discrete levelsand decay schemes, level densities, strength functions, etc.
The reaction cross section is calculated by EMPIRE-II in terms oftransmission coefficients ( )a
lT ε using the expression:
( ) ( )( )( ) ( ) ( ) ( )2
2 1, , , , 4 8
2 1 2 1
J S J Sa
a lS l i l J S
JU J f l T
k I i
πσ π π ε+ +
= − = −
+= −
+ + ∑ ∑
Where, k is the wave number of the relative motion, i, I, J, and S indicatethe spin of the projectile, target, compound nucleus, and the channel spin,respectively, and l is the orbital angular momentum of the projectile a. Thefunction f(l, π) ensures parity conservation. It is unity if * *( 1)lp P π− = andzero otherwise. Here p, P, and π are projectile, target, and compoundnucleus parities and ε and U stand for the projectile and compound energy.
In the following section we will demonstrate different modelsincluded in the EMPIRE-II code with mathematical interpretation, besidethat the code has a graphical user interface which allow an easyexploitation of its capabilities. Graphical representation can be obtainedusing the plotting package ZVView [cf. 149].
The program calculates spectra and cross sections for capture andmultistep nuclear reactions in the frame of combined pre-equilibriumemission and compound nucleus mechanisms model. Angular momentumis observed throughout the whole calculation and its considerations havebeen incorporated into the model describing the nucleon emission prior toequilibrium of the excited nucleus. The full γ–cascade, containing

Chapter IV
111
transitions from and between the continuum states as well as between thediscrete levels, is included in the calculations providing the γ–spectra andthe populations of the discrete levels in the residual nuclei.
4-4.1 Multi-Step Direct Model
The approach to statistical Multi-step Direct reactions is based on theMulti-step Direct MSD theory of the pre-equilibrium scattering to thecontinuum, originally M. Chadwick [cf. 150] through the code (ORION &TRISTAN). This approach has been revised, especially the part related tostatistical and dynamical treatment of nuclear structure. The evolution ofthe projectile-target system from small to large energy losses in the openchannel space is described in the MSD theory with a combination of directreaction DR, microscopic nuclear srtucture, and statistical methods. Astypical for the DR-approach, it is assumed that the closed channel space,i.e. the MSC contributions, have been projected out and can be treatedseparately within the Multi-step Compound mechanism.
Second-chance preequilibrium Emission after MSD has beenincorporated in connection with the MSD model. A semi-classicalformulation proposed by M. Chadwick [cf. 150] has been adopted. Thecurrent implementation assumes that MSD emission leaves residualnucleus containing a single particle-hole pair of energy equal to theexcitation energy of the residual. The excited particle (neutron or proton) isgiven a chance to escape the nucleus. The emission rate is defined by theproduct of the related s-wave transmission coefficient and the probabilityfor the exciton to have excitation energy compatible with the channelenergy. Angular momentum coupling assumes lp-lh spin distribution forthe exciton pair. This treatment allows accounting only for the secondchance emission. Thus it extends applicability of the MSD model up to theenergies at which higher order emissions can still be neglected. In general itresults in a modest increase of the central part of the emission spectra. Thefinal formula for the two step MSD cross section is:
( ) ( )( )
( ) ( )2 1 2
1 2
22 2
1 1 1 1, ,0 , . 4 9dd dE S E E S E E EdE d dλ λ λ λλ λ
σσ = −Ω Ω∑∫
( )2d
d
σΩ
, is an averaged cross section,

Chapter IV
112
( )( ) ( )
( ) ( )11
11
1 1
11
,, , 4 11
cc
cc
P E S E cS E E
P E
λ
λ = −∑
∑
Sλ(E,c) is the transition strength function. Theoretically, goodapproximation of Sλ(E, c) could be achieved by taking the average over theresponse functions belonging to c1 at energy E1:
( ) ( ) ( )( ) ( )int1 , 4 10rcP E I m dE g E E c G E c
π ′ ′ ′= − − − ∫
Pc(E) is the probability per energy to find the system in the configuration c,is given by the spectroscopic densities. Integrating Pc(E) over an interval∆E, we obtain the spectroscopic factor for the configuration c in ∆E.
In the present version of the code only one and two step MSD contributionare considered.
4-4.2 Multi-Step Compound Model
The modeling of Multi-step Compound (MSC) processes follows the(NVWY) approach of Nishioka et al., (1986) [cf. 148]. Like most of thepre-compound models, the (NVWY) theory describes the equilibration ofthe composite nucleus as a series of transitions along the chain of classes ofclosed channels of increasing complexity. In the present context, we definethe classes in terms of the number of excited particle-hole pairs (n) plus theincoming nucleon, i.e. excitons. Thus the exciton number is N = 2n + 1 fornucleon induced reactions. Assuming that the residual interaction is a two-body force only neighboring classes are coupled (An = ±1).
According to NVWY, the average MSC cross-section leading fromthe incident channel a to the exit channel b is given by:
( ) ( ),,
1 , 4 12ab a aab n nn m
n m
dT T
dE
σδ= + −∑ ∏
Which also has to be summed over spins and parities of the intermediatestates and where we have omitted kinematic and angular-momentumdependent factors. The summation includes all classes n and m. Thetransmission coefficients a
nT describing the coupling between channel a andclass n are given as:

Chapter IV
113
( )( )
2
22
4 , 4 131
aa n
namm
UT
U
π
π= −
+ ∑
where ,a bn n n aU Wρ= is microscopically defined in terms of the average
bound level density anρ of class n, and in terms of the average matrix
elements Wn,a connecting channel a with the states in class n. Theprobability transport matrix mnΠ is defined via its inverse:
( ) ( )( ) ( ) ( )1 2,2 1 2 2 , 4 14b ext b b
nm n n n nm n n m mnmVδ πρ δ πρ πρ− ↓Π = Γ + Γ − − −
in terms of the mean squared matrix element 2,m nV coupling states in classes
n and m, the average spreading width n↓Γ of states in class n, and the
average total decay width extnΓ in class n. The spreading width n
↓Γ is againrelated to the mean squared matrix element 2
,m nV as follow:
( )2,2 . 4 15b
n n m mm
Vπ ρ↓Γ = −∑
Under the chaining hypothesis 2,m nV couples only neighboring classes ( 2
,m nV =0 unless | n—m | = 1). The decay width ext
nΓ is determined by the sum of thetransmission coefficients a
nT over all open channels:
( ) ( )12 , 4 16ext b a
n n na
Tπρ−
Γ = −∑
More explicitly extnΓ may be expressed through the energy integral of the
product of transmission coefficients and level densities:
( ) ( ) ( ) ( )11
1
2 . 4 17m n
ext b a bn n n m m p
a m n
T E Q dπρ ε ρ ε ε= +−
+= −
Γ = − − −∑ ∑ ∫
Here, ε stands for the ejectile p energy, Qp for its binding in a compositesystem, and a symbolically accounts for the angular momentum couplingof the residual nucleus spin, ejectile spin and orbital angular momentum tothe composite nucleus spin. Again, due to the chaining hypothesis, onlythose emissions which change class number by | n—m | < 1 are allowed.

Chapter IV
114
We note that, in the NVWY theory, the transmission coefficients Tn→ m
carry two class indices.
4-4.3 Coupling Between MSC, and MSD
The NVWY theory includes a possibility of feeding higher MSCclasses directly from the MSD chain, in addition to the normal transitionsbetween bound states of increasing complexity. This process is taken intoaccount by a double sum over classes in the cross section formula Eq. (4-18). The second sum over n refers to the contribution of different classes tothe particle emission, while the first one (over m) corresponds precisely tothe population of various classes directly from the open channel spacerather than through the transitions along the MSC chain. This effect isincluded in the EMPIRE-11 code by distributing the incoming channeltransmission coefficient over different MSC classes. It is done according tophase space, and global coupling arguments requiring that the incomingflux splits between the first MSD and MSC classes in proportion to therespective state densities, and to the average value of the squared matrixelements coupling unbound to unbound ( )2
u uV and unbound to bound
states ( )2u bV . Introducing 2 2
u u u uR V V= , denoting the optical modeltransmission coefficient by Tom, the density of bound and unbound statesin class n by b
nρ and u
nρ respectively, and their sum by p, the transmission
coefficient populating the first MSC class may be written as:
( )( ) ( ) ( ) ( )
( )
( )2
11 2 2
11 1
1
, 4 181
bub
om omb uub uu
b
V E RT T T
EV E V ER
E
ρρρ ρρ
= = −+
− +
The same reasoning may be applied to the flux remaining in the openspace, which may enter the MSC chain in subsequent steps of the reaction.Assuming R to be independent of the class number, the transmissioncoefficient Tn populating the nth MSC class is written as:
( )( )
1
1
, 4 191
n
m om ii n
bn
RT T T
Rρρ
−
=
= − −− +
∑

Chapter IV
115
If the MSD option is- selected the absorption cross section availableto MSC (σabs) is reduced by the total MSD emission cross section (σMSD) morder to ensure flux conservation and becomes:
( ) ( ) ( )1 , 4 20MSDabs OM
OM
J Jσ
σ σσ
= − −
Where, (σOM) is optical model reaction cross section and J stands for thecompound nucleus spin.
4-4.4 Exciton Model
This module was incorporated to improve (n, γ), and (p, γ) reactionsfor fast neutrons and to add the capability of predicting spectra for thecharge-exchange reactions that are not provided by the currentimplementation of the MSD model (ORION & TRISTAN). DEGAS is theexciton model code with angular-momentum conservation written by E.Betak [cf. 151]. DEGAS is the exciton model code with angular-momentum conservation. Inclusion of the Monte Carlo PreequilibriumEmission (DDHMS) by M.B. Chadwick [cf. 150] extends useful energyrange of EMPIRE-II up to the intended limit of about 200 MeV for nucleoninduced reactions. The HMS model, developed by M. Blann [cf. 152] is anexciton model inspired treatment of the intranuclear cascade. Certainfeatures of the DEGAS code were intentionally disabled for compatibilitywith other models present in the EMPIRE-II code. Thus, γ-cascade hasbeen limited to primary γs in the composite nucleus and multiple pre-equilibrium emissions have been blocked. In particular, DEGAS treatmentof the equilibrium emission was disabled and left to the Hauser-Feshbachmodel coded in EMPIRE. Within the above simplifications DEGAS solvesthe classical (apart of spin) set of master equations:
( ) ( ) ( ) ( ) ( )
( ) ( ) ( ) ( )( ) [ ] [ ]( ) ( )
, ,
, , ,, , 2, , , 2 , , 2, , , 2
, , , , , , , , ,
, , , , , , , , 4 21xJ n x
dP E J n tP E J n t E J n P E J n t E J n
dt
P E J n t E J n E J n L E J n
P E J n t E J n E J n d
λ λ
λ λ
λ ε
+ +
+ −
′ ′
= − − + + +
+ + + ′ ′ ′ ′ ′ ′ ′+ → −∑ ∫
Where, P(E,J,n,t) is the occupation probability of the composite nucleus atthe excitation energy E, spin J and the exciton number n, λ+ and λ− are thetransition rates for decay to neighboring states, and L is the total integrated

Chapter IV
116
emission rate for particles protons, neutrons, and γ-rays. Note that the lastterm ensures coupling of different spins.
The nucleon emission rate per energy and time is defined as:
[ ] [ ]( ) ( )( ) ( ) ( ) ( ),
12
1, ,1, , , , 1 , 4 22, ,
J j
l
L S l J j
n U SE J n U S n n T
h n U Sπ ν πν
ωλ ε
ω
−
= − = −
−→ − = ℜ −∑
Where, ω(n, E, J) is the particle-hole state density, Tl,S are the transmissioncoefficients of the emitted nucleon, and ℜx(n) is a fraction of x-typenucleons in the n-th stage. The particle-hole state density is:
( ) ( )( )
( ) ( ),, , , 4 231p h
n
g gE An E J R J
p h nω
−= −
−
Where, g is the single-particle level density, p and h are the number ofparticles and holes (n = p + h), and Ap,h is the Pauli correction term. Thespin distribution reads:
( )( )
( )2
2
12 1 2exp , 4 242 2n
n
JJR J
σ
++ = − −
With σn being the spin cut-off parameter ( )( )2 2 / 30.24 0.0038n E nAσ = + .The energy and spin dependence are assumed to factorized as follow:
( ) ( )22, , , 4 25n n JE J n M Y Xπ
λ± ↓ ↓= −
Where, 2M is the energy part of the average squared transition matrix
element of the residual interaction, nY ↓ is the energy part of the density ofaccessible final state, and ,n JX ↓ factor take care of angular momentumcoupling.
DEGAS solves the set of master equations Eq. (4-21) and calculate theintegrals of occupation probabilities:

Chapter IV
117
( ) ( ) ( )0
, , , , , , 4 26E J n P E J n t dtτ∞
= −∫
DEGAS pre-equilibrium emission cross sections is given by:
( ) ( ) ( ) ( ), ,
, , , , , , , 1 . 4 27c r
xc c c c x c c r r r
J J nx
dE J E J n E J n E J n dE
d
σ σ τ λε
= → − −∑ ∫
Here c and r subscriptions refer to the composite and residual nucleirespectively.
4-4.5 Monte Carlo Preequilibrium Model
The intermediate state between the reactions via a compound nucleusand direct processes is described by the pre-equilibrium mechanism.Inclusion of the Exciton Model DEGAS was incorporated to add thecapability of predicting spectra for charge exchange reaction that is notprovided by the current implementation of the MSD model(ORION&TRISTAN codes). DEGAS is the exciton model code withangular-momentum conservation. E. Betak (1993) [cf. 151]. Inclusion ofthe Monte Carlo Preequilibrium Emission (DDHMS) by M.B. Chadwick[cf. 150] extends useful energy range of EMPIRE-II up to the intendedlimit of about 200 MeV for nucleon induced reactions.
The Hybrid Monte-Carlo Simulation (HMS) approach to thepreequilibrium emission of nucleons is the third precompound modelincluded in EMPIRE-11 (the other two are (MSD)&(MSC) and the excitonmodel (DEGAS)). M. Blann [cf. 126] has formulated, the original HMSmodel as a hybrid model inspired version of the intranuclear cascadeapproach. Contrary to other classical preequilibrium models, this approachavoids multi-exciton level densities to be used inconsistently n he xciton,and in the hybrid formulations. The HMS model, developed by M. Blann[cf. 152] is an exciton model inspired treatment of the intranuclear cascade.Each exciton is allowed to create a new particle-hole pair or escape thecomposite nucleus if the exciton is of a particle (rather than hole) type.
The Monte Carlo method is used to decide whether the interactioncounterpart is a neutron or proton, to select particle-hole pair energy and tochoose exciton directions. The cascade is terminated when all excitons fallbelow binding energy. The HMS model needs only lp-lh level densities,therefore it avoids inconsistent use of multi-exciton level densities typicalof classical preequilibrium models. An important feature of the model isthat it takes into account unlimited number of multi-chance preequilibrium

Chapter IV
118
emissions and observes angular momentum and linear momentumcoupling. It provides double differential emission spectra of neutrons andprotons, the populations of residuals depend on its spin and its excitationenergy, as well as the recoil spectra depends on the excitation energy too.
These results are transferred onto EMPIRE-II arrays and used as astarting point for the subsequent compound nucleus decay. The HMSmodel has a number of attractive features. First of all, there are no physicallimits on a number of preequilibrium emissions (apart from energyconservation). With the addition of linear momentum conservation by M.Chadwick and P. Oblozinsky (DDHMS) [cf. 150], the model provides anearly complete set of observables. Spin and excitation-energy dependentpopulations of residual nuclei can also be obtained an essential feature forcouplng the pre-equilibrium mechanism to be the subsequent CompoundNucleus decay.
The binding energies in the HMS model are thermodynamicallycorrect, this is clear improvement over the intranuclear cascade model,although of the exact account, typical of the Compound Nucleus model, isstill out of reach. The DDHMS model proved to perform very well up to atleast 250 MeV, extending energy range of the EMPIRE-11 applicability tothe desired limit.
The calculation flow in the DDHMS model can be summarized in terms ofthe following steps:
1. Draw collision partner for the incoming nucleon (2p-lh state created)2. Draw energy (c) of the scattered nucleon (if bound go to step 5)3. Draw scattering angles for both particles4. Decide whether the-scattered nucleon will be emitted, re-scattered or
trapped,a) if emitted appropriate cross section is augmentedb) if re-scatters additional particle-hole is created and we return to step 2c) if trapped, go to step 5
5. Draw excitation energy of a particle in the remaining Ip-lh configuration(between 0: (U- ε), if unbound go to step 3, if bound choose anotherexisting Ip-lh pair and repeat step 5.
All excitons (including holes) are treated on equal footing and eachof them is given a chance to interact or being emitted in priority with anequal probability. The cascade ends when all excitons are bound. Below,we summarize various probability distributions that are used in concertwith a random number generator.

Chapter IV
119
For choosing a collision partner it is assumed that the unlikeinteraction is 3 times more probable than the like one (σnp = 3σnn). Thus,for the incident neutron we have Pnn and Pnp for the probability of excitingneutron and proton respectively, defined as:
( )( ) ( ), 4 28
3n n
A ZP
A Z Z
−= −
′− +
( )1 , 4 29n p n nP P= − −
Similarly for the incident proton is:
( ) ( ), 4 303p p
ZP
Z A Z= −
+ −
( )1 , 4 31p n p pP P= − −
The energy distribution of the scattered particles P(ε) is given by the ratioof the (n-1), and n-exciton level densities ρn:
( ) ( )( ) ( )1 , 3 32n
n
E gP d
E
ρ εε ε
ρ− −
= −
The emission probability is calculated as:
( ) ( )( ) ( ) ( ), 4 33c
c
QP Q
Qν
λ εε
λ ε λ ε+
−− = −
− +
The emission rate being:
( ) ( )( )( ) ( )2 1
. 4 34c
Q Q SQ
gν νσ ε ε µ
λ ε− − +
− −∼
σν, is an inverse reaction cross section, Q is a binding energy, g is a singleparticle density, S denotes nucleon spin, and µν stands for the reducednucleon mass. Following the hybrid model, λ+(ε) is calculated from themean free path of a nucleon in nuclear matter.

Chapter IV
120
4-4.6 Compound Nucleus Model
The statistical compound nucleus model in the Hauser-Feshbachformalism [cf. 146] is implemented in EMPIRE-II. Exact angular momentand parity coupling is considered. The emission of neutrons, protons, andα-particles is taken into account in competition with full γ-cascade in theresidual nuclei. When the compound nucleus is populated at low excitationenergies, elastic channel enhancement and width fluctuations must be takeninto account. In EMPIRE-II these effects are considered in the frame ofHRTW model [cf. 147].
The main quantities entering the Hauser-Feshbach formalism forreaction cross section calculations of non-fissioning nuclei are thetransmission coefficients for particles and gamma decay. The particletransmission coefficients are provided by SCAT2 or ECIS-95 subroutines.The gamma-transmission coefficients are calculated taking into account E1,E2 and M1 multipolarities. An arbitrary mixture of Weisskopf singleparticle model and giant multipole resonance of Brink-Axel [cf. 153] canbe used.
After particle or gamma ray emission the nuclei can be populated indiscrete or continuum states. Therefore, the transmission coefficientscalculation requires the knowledge of the discrete level schemes and of thedensity functions describing the continuum part of the excitation spectra forall the nuclei involved in reaction. The level densities are described inEMPIRE-II by different models and parameterizations. These may beGilbert-Cameron, (1965) [cf. 154] type formulae (with constant or energy-dependent constant level density parameter a) or dynamical approacheswhich taken into account collective enhancements [cf. 30]. For each option,the parameters can be retrieved from built-in systematics, from RIPL-2 [cf.145], or provided by the user.
The statistical compound nucleus model in the Hauser-Feshbachformalism [cf. 146] is implemented in EMPIRE-II. The exact angularmomentum and parity coupling is observed. The emission of neutrons,protons, α-particles, and a light ion is taken into account along with thecompeting fission channel. The full γ-cascade in the residual nuclei isconsidered. Particular attention is dedicated to the determination of thelevel densities, which can be calculated in the non-adiabatic approachallowing for the rotational and vibrational enhancements. These collectiveeffects are gradually removed above certain energy. Level densities acquiredynamic features through the dependence of the rotational enhancement onthe shape of a nucleus.

Chapter IV
121
The particle transmission coefficients are provided by SCAT2 orECIS-95 subroutines. The gamma-transmission coefficients are calculatedtaking into account E1, E2 and M1 multipolarities. An arbitrary mixture ofWeisskopf single particle model and giant multipole resonance of Brink-Axel [cf. 153] can be used.
In the frame of the statistical model of nuclear reactions thecontribution of the Compound Nucleus (CN) satate a with spin J, parity π,and excitation energy E to a channel b is given by the ratio of channelwidth Γb, to the total width Γtot = Σc Γc multiplied by the population of thisstate σa(E,J,π). This also holds for secondary CNs that are formed due tosubsequent emissions of particles. The only difference is that while the firstCN is initially excited to the unique (incident channel compatible) energy,the secondary CNs are created with excitation energies which spread overthe available energy interval. Each such state contributes to the crosssection by:
( ) ( ) ( )( ) ( ), ,
, , , , , 4 35, ,
bb a
cc
E JE J E J
E J
πσ π σ π
πΓ
= −Γ∑
4-4.7 Level Densities
EMPIRE-11 accounts for various models describing level densitiesand includes several respective parameterizations. In each case equal paritydistribution ρ(E, J, π) = ½ ρ(E, J, π) is assumed. Choice of the properrepresentation depends on a case being considered. For the nucleon-induced reactions, with CN excited up to about 20 MeV, the Gilbert-Cameron approach is recommended. It assures the most accuratedescription of level densities in the energy range up to the neutron bindingenergy. The collective effects are included in the level density parameter a,providing reasonable estimate of the level densities as long as damping ofthe collective effects is irrelevant. The relatively low angular momentumintroduced by the incident projectile justifies neglect of dynamical effects.However, these effects have to be taken into account in case of the HeavyIon induced reactions and/or higher excitation energies. In these cases, thedynamic approach that accounts for the shape-dependent collectiveenhancements, their damping with increasing energy, and the temperaturedependence of the a-parameter should be adopted.

Chapter IV
122
4-4.7.1 Gilbert-Cameron Approach
The Gilbert-Cameron approach [cf. 154] splits excitation energy intwo regions. Different functional forms of level densities are applied ineach of them. At low excitation energies (below the matching point Ux) theconstant temperature formula is used:
( ) ( ) ( )1 , 4 360T
E - - EE exp TT
ρ ∆ = −
Where T is the nuclear temperature, E is the excitation energy (E = U + ∆with ∆ being the pairing correction), and E0 is an adjustable energy shift.Above Ux the Fermi gas formula is applied:
( )( )( )
( )51
4 4
, 4 37F
exp 2 aUU
12 a U a Uρ
σ= −
The level density parameter a is assumed to be energy independent. Thespin cut-off factor σU) is given by:
( ) ( )22 30.146 , 4 38U A aUσ = −
Three model parameters, T, Ux, and E0 , are determined by the requirementthat the level density and its derivative are continuous at the matching pointUx, and by fitting cumulative number of discrete levels with the integral ofEq. (4-36). The first of the conditions implies:
( )1 3 , 4 392x x
aUT U
= − −
The code will not stop if the discrete level scheme is incompatiblewith the level density parameter a (i.e., there is no real solution to Eq. (4-39). It is essential that only complete level schemes be used for thedetermination of T and E0 parameters. With increase in the excitationenergy, some levels could be considered in the calculations, numbers of thelevels that are supposed to form a complete set is read by EMPIRE-II(starting with version 2.17) directly from the file containing discrete levels(empire/'data/RIPL /levels/Z*.DAT). This database makes part of the RIPL-2 library [cf. 145].

Chapter IV
123
Choosing the FITLEV option in the input can inspect cumulativeplots of discrete levels along with the constant temperature fits. For eachnucleus involved in the calculations an appropriate plot is created andstored in the CUMULPLOT.PS (*-cum.ps) file, which can be viewed oncethe calculations are done (NOTE: this option requires "gnuplot" packet and"ps2ps" which is a part of the “ghostscript”).
Calculations can be performed using constant level densityparameter a read from the input file. No energy dependence is allowed insuch a case. Alternatively, one of the built in systematics can be used. Thelatter ones account for the shell effects, which fade-out with increasingenergy implying energy dependence of the (a) parameter. The general formof this dependence was proposed by Ignatyuk et al., (1979) [cf. 132].
( ) ( ) ( )1 , 4 40Wa U a f U
U
δ = + −
Where δW is the shell correction, ã is the asymptotic value of the a-parameter, and f(U) is given by:
( ) ( ) ( )1 , 4 41f U exp - Uγ= − −
Where, γ is a systematic constant, we stress again that Gilbert-Cameron approach does not account explicitly for the collectiveenhancements of the level densities. These are included implicitly in the (a)when fitting neutron resonance spacings. Such an approach leads to theover-estimation of the level densities above 20 MeV. This deficiency canbe overcome using the dynamic approach described below.
4-4.7.2 Dynamic Approach
The dynamic approach to the level densities is specific to theEMPIRE-II code. It takes into account collective enhancements of the leveldensities due to nuclear vibration and rotation. The formalism uses thesuper-fluid model below critical excitation energy (when the EMPIRE-IIspecific parameterization of the level density parameter is selected) and theFermi gas model above. Differently from other similar formulations, thelatter one accounts explicitly for the rotation induced deformation of thenucleus, which becomes spin dependent. The deformation enters leveldensities formulas through moments of inertia and through the level densityparameter (a) that increases with increase in the surface of the nucleus.

Chapter IV
124
Assuming that the prolate nuclei rotate along the axis perpendicularto the symmetry axis the explicit level density formulas reads:
( )
( )
51422 2 21
4
122 2
1, ,216 6
, 4 422
J
K J eff
eff
KE J a U
Kexp 2 a U -
ρ ππ
−
=−
= − ℑ ℑ
− ℑ
∑
In the case of the oblate nuclei which are assumed to rotate parallelto the symmetry axis we have:
( )( )
( )( )
51 42 222 14
122 2
11, ,216 6
1, 4 43
2
J
K J eff
eff
J J KE J a U
J J Kexp 2 a U -
ρ ππ
−
=−
+ − = − ℑ ℑ + − − ℑ
∑
a is a level density parameter, J is a nucleus spin and K itsprojection, E is the excitation energy and U is the excitation energy lesspairing (A).
4-4.7.3 Hartree-Fock-BCS Approach
EMPIRE can read precalcuated level densities from the RIPL-2library, which contains tables of level densities [cf. 145] for more than8000 nuclei calculated in the frame of the Hartree-Fock-BCS approach, isthe generalized Hartree-Fock theory presented by John Bardeen, LeonCooper, and Robert Schieffer (BCS). These microscopic results include aconsistent treatment of shell corrections, pairing correlations, deformationeffects and rotational enhancement. The results were re-normalized to theexperimental s-wave neutron resonance spacings and adjusted to thecumulative number of discrete levels, so that the degree of accuracy iscomparable to the phenomenological formulae.
Using the partition function method, the state density can be obtainedas:
( ) ( )( ) ( )
( )32
, 4 442
exp S UU
Det Uω
π
= −

Chapter IV
125
Entropy S, and excitation energy U are drived from the summationover single particle levels, and Det stands for the determinant. Pairingcorrelations are treated within the standard BCS theory in the constant Gapproximation with blocking. Consequently single particle energies arereplaced by their quasi-particle equivalents with BCS equationsdetermining gap parameter ∆ and the chemical potential λ.
Spherical and deformed nuclei are treated in a distinct mode. Thelevel density for spherical nuclei is simply related to the state density:
( ) ( ) ( ) ( )23
2 1, . , 4 4522 2
sph
-J J +1JU J exp Uρ ω
σπ
+= ⋅ −
While for deformed nuclei the formula is similar to the one used in theEMPIRE-specific level densities:
( ) ( ) ( ) ( )2
2 2 22
11 1 1 1, . . , 4 462 2 22
J
defK J
J J KU J exp Uρ ω
σ σ σπσ=− ⊥ ⊥
+ = − + − −
∑
Where, σ is the spin cut-off parameter and σ⊥ the perpendicular spin cut-offparameter, both affected by the pairing correlations, and σ⊥ being related tothe perpendicular moment of inertia.
4-4.8 Width Fluctuation Correction
The Hauser-Feshbach model assumes that there are no correlationsamong various reaction channels contributing to the formation and decay ofa certain compound nucleus state Jπ. An obvious case for which thisassumption breaks down is the elastic channel, for which entrance and exitchannels are the same. This correlation leads to an increase of the elasticchannel cross section compared to the Hauser-Feshbach predictions. Athigher incident energies, at which the elastic channel is one among manyinelastic ones, this increase can be safely neglected. However, if there areonly a few open channels the increase of the elastic channels turns out tohave serious consequences on other channels (particularly on inelasticscattering and capture).
Hofmann, Richert, Tepel and Weidenmueller (HRTW) [cf. 147] haveproposed one of the models, which allow these effects to be taken intoaccount. In the case of no direct reaction contribution, the averaged S-matrix element connecting channels a and b can be written as:

Chapter IV
126
( ) ( ) ( )1
2 , 4 47a b a b aa bS exp i S 1 Tδ= ⋅ ⋅ − −
Where,
( )2, 4 48a a a
T 1 S= − −
Ta is an optical model transmission coefficient. The HRTW model assumesthat the Compound Nucleus (CN) cross sections factorize and can beexpressed through a product of the channel dependent quantities ξ. Thiswould be the famous Bohr's assumption if not for the elastic enhancementfactor Wa, which has been introduced by HRTW in order to account for theelastic channel correlation as follow:
( ), 4 49fl fla b a b a a aa b and Wσ ξ ξ σ ξ= ≠ = −
Setting
( ), 4 50aa
cc
V
Vξ = −
∑
We get for the Compound Nucleus (CN) cross section as:
( ) ( )1
1 1 , 4 51CN flab ab a b c ab a
c
V V V Wσ σ δ−
= = + − − ∑
Taking into account that the incoming flux has to be conserved (unitaritycondition) we find the relation between VS, the elastic enhancement factor(Wa), and the transmission coefficient (Ta):
( ) ( ) ( )1
1 1 , 4 52aa a a
cc
VV T W
V
− = + − − ∑
This equation can be solved for Va by iteration once all Wa are known. Thecurrent version of EMPIRE-11 uses Wa derived from the analysis ofnumerically generated sets of s-matrices. This exercises was tailored to thecases that include many weak channels coupled to a few strong channels,

Chapter IV
127
which is typical of neutron capture reactions. The resulting formula for theelastic enhancement factor is:
( )2 5
1, 4 53F a ave a
a ac cc c
T T TW 1 2 1 T 87
T T
− − = + + + − ∑ ∑
With
( )1
, 4 54ave a ave
c c cc c c
T T TF 4 1 1 3
T T T
−
= + + − ∑ ∑ ∑
Which completes formulation of the model.
4-4.9 Flow of EMPIRE-II Calculations
Listed below are the essential steps in the execution of the generalcase involving MSD and MSC calculations:
1. Read EMPIRE-II input file (.inp),
2. Construct table of nuclei involved,
3. Read from the input parameter library (or input/output files if theyexist),
a) Discrete levels,b) Binding energies,c) Level density parameters,d) Shell corrections,e) Ground state deformations,
4. Calculate:a) Transmission coefficients,b) Level densities,c) Fission barriers
5. Retrieves experimental data from the EXFOR library.
6. Writes input/output files:a) *-exf,b) *-omp.int,

Chapter IV
128
c) *-omp.dir,d) *-omp.ripl,e) *.lev,f) *-lev.col,
7. Determine fusion cross section,
8. Select the compound nucleus for consideration,
9. Calculate double-differential cross sections for inelastic scattering interms of the MSD mechanism, populate residual nucleus continuumand discrete levels, store recoil spectra (first CN only),
10. Calculate second-chance preequilibrium emission following MSDmechanism, store spectra of particles and recoils and incrementresiduals populations. Although MSD is limited to a single type ofnucleon, both neutron and protons are emitted in the second-chanceprocess (first CN only),
11. Calculate neutron, proton, and γ emission spectra in terms of theexciton model (code DEGAS), populate residual nuclei continuum anddiscrete levels (first CN only),
12. Calculate neutron, proton, and γ emission spectra in terms of the HMSmodel (code DDHMS), populate residual nuclei continuum anddiscrete levels, store recoil spectra (first CN only),
13. Calculate neutron, proton, and γ emission spectra in terms of the MSCmechanism, populate residual nuclei continuum and discrete levels(first CN only),
14. Calculate neutron, proton, α, γ, and eventually light ion emissionwidths in the frame of the Hauser-Feshbach model,
15. Calculate fission width in the frame of the Hauser-Feshbach model,
16. Normalize emission and fission widths with the Hauser-Feshbachdenominator and fusion cross section to obtain compound nucleusspectra and population of continuum and discrete levels in residualnuclei,
17. Save, print results for the decay of the nucleus considered,
18. Select new nucleus and repeat steps 14 through 18 until all requestednuclei have been processed. The selection scheme is as follows:

Chapter IV
129
Starting from the compound nucleus, neutrons are subtracted untilthe number of neutron emissions specified in the input is reached. Then oneproton is subtracted from the compound nucleus, and all nuclei withdecreasing neutron number are considered again. In the Z-N plane thecalculations are performed row-wise from the top-right corner (compoundnucleus) to the left. When a row is completed the one below is considered,
19. Save, print inclusive spectra, read new incident energy from the inputfile (*.inp) and repeat steps 4 and 7 through 19.
4-4.10 RIPL-2 Input Parameters Libraries
When not provided by the user, EMPIRE-II retrieves the inputparameters either from internal systematics or from different segments ofRIPL-2 (Reference Input Parameters Library, version 2) [cf. 145]. Thesegments of interest for this work are masses, levels and optical modelparameters. The masses file contains the most recent experimental massesrecommended by Audi and Wapstra, (1995) [cf. 155] and the calculationsof Moller and Nix, (1981) [cf. 156]. Besides masses, the file contains thenuclear deformations in the ground state expressed in differentparameterizations.
The Levels file contains more than 2500 level schemes originatingfrom ENSDF 1998. For the purpose of reaction calculations the basicENSDF sets were completed the spins and the parities up to certain cut-offenergies by Budapesta group. Details concerning these assignments arepublished in RIPL-2 documentation [cf. 145]. The optical modelparameters file includes 409 sets of optical parameters for nuclei up toZ=103 for neutrons, protons, deuterons, tritons, 3He and α-particles.EMPIRE-II contains also optical parameters for 6Li, 7Li, and 7Be.

Chapter IV
130
Figure (4-1): Flow Chart of EMPIRE-II Calculations
From Input File: ConstructTable of Involved Nuclei
Activation Cross Section
Read From RIPL-2:Discrete LevelsBinding EnergiesLevel Density ParametersShell CorrectionsGround State Deformation
Calculate:Transmission CoefficientsLevel DensitiesFission BarriersRetrieve:EXFOR Data
EMPIRE-II
Write Intermediate Files:*.exf*-omp.int*-omp.dir*-omp.ripl*.lev*-lev.col
Population of Isomeric States
Production CrossSection for γ-raysFrom Low Excited
Levels
Energy Spectra ofEmitted Particles
and γ-rays
1
2
3
4
5
6
7
8
9

Chapter IV
131
4-4.11 Input and Output Files
EMPIRE-II has default options for all the input parameter. Themandatory input provided by the user contains the masses and charges ofthe target and of the projectile and the incident energies. Simply editing theoptional input can change the default options and introducing an identifierof the quantity to be changed followed by the label of the desired option.
Among the quantities included in the output file the most important forus through this study are the discrete level populations of the residualnuclei and the discrete γ-transitions. The discrete level populations arecalculated after γ-cascade in the continuum but before their de-excitationthrough discrete transitions. They are directly comparable with theexperimental excitation cross-sections measured considering the absoluteyield of the gamma rays populating and depopulating the levels.
The γ-cascade between discrete levels starts from the highest discretelevel and ends with the first excited state. For each level the population isgiven, including the complete feeding from the levels above. The γ-linesoriginating from the level are identified by the energy and spin of the finallevel and the energy and intensity of the γ-transition. If the branchingratios for the de-population of a given level are not known (are not includedin the library LEVELS) the cross-section is trapped at the level and notdistributed further [cf. 30].
4-4.12 Models Compatibility and Priorities
EMPIRE-II allows including different preequilibrium models in asingle calculation run, which rises the problem of double counting. Ingeneral, ECIS-95 is compatible with DEGAS and HMS, as the latter twodo not calculate collective excitations. By the same way ECIS-95 in notcompatible with MSD as both include collectivity of discrete levels.However, ECIS-95 and MSD can be combined providing that only thecontinuum contribution from MSD is retained [cf. 157].
When combining different models the priorities are the following:

Chapter IV
132
• ECIS-95 provides inelastic scattering to collective levels independently ofsettings for the remaining models.• MSD provides inelastic continuum independently of other settings.Inelastic to discrete levels is suppressed if ECIS-95 is active.• MSC results are taken for inelastic and charge-exchange to continuum ifnot suppressed by use of DEGAS or HMS.• DEGAS provides inelastic and charge-exchange to continuum and todiscrete levels if MSD and MSC are not active. Otherwise only charge-exchange contribution is used. Gamma emission is used if not provided byMSC.• HMS provides inelastic and charge-exchange to continuum and todiscrete levels if MSD and MSC are not active. Otherwise only charge-exchange contribution is used. Suppresses DEGAS results for particleemission if DEGAS is active, it does not provide γ-rays, thus DEGAS orMSC results are taken.
At incident energies below 20 MeV the best results are expected bycombining the four models. At higher incident energies these should bereplaced by HMS model, which accounts for the multiple pre-equilibriumemission.

Chapter V
133
5-1 Calculation of the Theoretical Cross-Sections
5-1.1 Analysis with Code ALICE-91
The calculations were performed using the framework of thegeometry dependent hybrid model Blann et al., [cf. 29,126-131]. For thepre-equilibrium emission of neutrons and protons in combination with thecompound nucleus (CN) calculations were performed using the Weisskopf-Ewing formalism (Weisskopf and Ewing, 1940) [cf. 122]. While the pre-equilibrium emission component was simulated employing the geometrydependent hybrid (GDH) model Blann, (1972) [cf. 127] for the subsequentequilibrium emission of neutrons and protons, deuterons and alphaparticles. The calculations were based almost on default options in the codeBlann, (1988) [cf. 29]. The initial exciton configuration given by Blann andVonach, (1983) [cf. 130] were used for the pre-equilibrium calculations.The initial exciton number, the initial excited neutron number and theinitial excited proton number were assumed to be 3.0, 0.8 and 1.2,respectively. The exciton includes the particle and the hole in the nucleus.The initial exciton number (3) is the sum of particles and holes. The initialexcited proton number (1.2) corresponds to the initial proton particlenumber, which includes a portion of the projectile proton. The number 3 -0.8 - 1.2 = 1 is the initial hole number. The number 0.8 + 1.2 = 2 is theinitial particle number. The optical model potential based on the nucleonmean free paths was used to estimate the intranuclear transition rates.Particle binding energies were internally calculated using the Myers andSwiatecki mass formula Myers and Swiatecki, (1967) [cf. 158]. Inversecross sections were also given by the code.
The level density parameter “a” is calculated from a = A/K, where,A is the mass number of the compound system, and K is a constant, whichmay be varied to match the excitation functions. The initial excitonnumbers are important parameters of pre-equilibrium emission formalism,is defined by no= (p+h). It is however, reasonable to assume that anincident proton (particle) in its first interaction excites a particle above theFermi level leaving behind a hole, i.e., in all two particles and one hole, increating the initial exciton state. Further, the mean free path (MFP) inthese calculations is generated using free nucleon-nucleon scattering crosssections. The calculated MFP for two-body residual interactions may differfrom the actual MFP. To account for that, the parameter COST is provided.In this code the MFP is multiplied by (COST+1). As such, by varying theparameter COST, the nuclear MFP can be adjusted to fit the experimentaldata. The default value of K=10; no= 3(2p+1h) and COST=9; for protoninduced reactions gave a satisfactory reproduction of the measured data in
Chapter V
134
the earlier analyses of excitation functions Mustafa et al., (1995) [cf. 159].The same values of these parameters have been used in the presentcalculations, and a pairing energy shift of the effective ground state wascalculated internally from the Myers and Swiatecki (1967) [cf. 158] massformula. Which was introduced together with a shell effect correction shift.
The calculated excitation functions with the above parametersreproduce the measured excitation functions for the natMo(p,x) reactionssatisfactorily. However, for the natGd(p,x) reactions the calculations donewith these parameters do not give satisfactory agreement with theexperimental data. In order to reproduce the experimental data for thisreaction the values of K and mean-free-path multiplier are varied and thecorresponding excitation functions are in agreement. A value of K=8; withCOST=9; has been found to satisfactorily reproduce the excitation functionfor natGd(p,x) reactions. A larger value of K in case of natGd(p,x) reactionsmeans a relatively smaller value of the level density parameter “a” for theresidual nucleus, which is expected in the case of 64Gd. Further,Weisskopf-Ewing calculations do not include spin effects [cf. 122].
5-1.2 Analysis with Code EMPIRE-II
Initially, the program calculates the tables of the partial wavetransmission coefficients and the spin dependent level densities of nuclei inthe decay channels of the composite nucleus. If the (PE) option is selected,the geometry dependents Hybrid model Blann (1972) [cf. 127]. Subroutineis used to calculate neutron and proton spectra, separately for each partialwave. The (PE) yields are distributed over the continuum of states and thediscrete levels of the residual nuclei according to the energy, angularmomentum and parity conservation laws.
In a next step the (CN) decay is followed and its contributions arerecorded, on local files ascribed to each residual nucleus, and added to thepreviously calculated (PE) populations.
Multiparticle emission is assumed to take place after the nucleus hasreached equilibrium. At each stage, a multiparticle emission process, thedecaying nucleus appropriately replaces its ancestor and the decay istreated in terms of the transmission coefficients and level densities. Thisprocedure is repeated until the list of particles emitted in the reaction isexhausted. The population of the discrete levels in the residual nucleus andthe spectra of particles and photons emitted at each step of the reaction areprinted.

Chapter V
135
Particles considered in the program are neutrons, protons and alphas,in addition, deuterons in the entrance channel and γ’s in the exit channelare included. The (PE) emission does not allow for α–particles. Themaximum energy and number of subsequently emitted particles are notrestricted in the program. The maximum number of partial wavesconsidered in the calculations is 3D. Only E1, M1, and E2 γ–transitions areallowed to contribute to the γ–cascade. Up to 50 discrete levels for eachnucleus taken into account can be used. In the γ–decay of these levels, upto 11 transitions depopulating each level might be concerned.
The input data in the EMPIRE-II code should include the incomingparticle energy, the mass and the atomic numbers of the composite nucleus,the mass and the atomic numbers of the incoming particle, the spin of thetarget nucleus, the number of partial waves accounted in the calculations,the energy step in integration, the number of discrete levels in compositenucleus (5–50), the initial exciton number (in our cases it is set to 3), list ofenergies followed by list of spins which define discrete levels in compositenucleus, the energy cut off for continuum (taken to be the energy of highestdiscrete level), the number of discrete levels in the residual nuclei afterneutron, proton and α–emission, and the spin cut off factor for n–excitonlevels.
The binding energies are taken from Audi and Wapstra (1995) tables[cf. 155]. The pairing energies and shell corrections are taken from Gilbertand Cameron (1965) [cf. 154] tables. The inverse cross-sections whichrepresent a parameter of great importance are calculated using the codeSCAT2, Bersillon (1991) [cf. 142]. Several options for the level densityparameters are allowed in the EMPIRE-II code. The intranuclear transitionrates are calculated from the imaginary optical potential.
The Excitation functions of the reactions natMo and natGd (p,xn) havebeen performed at proton energies from threshold up to 20 MeV. Thecalculated cross sections are analyzed in terms of a sum of statistical andpre-equilibrium contributions. Using the EMPIRE-II code-2.19 (Londi)March, (2005) [cf. 30], which is an energy dependent hybrid model,accounting for the major nuclear reaction mechanisms. Including theOptical Model (OM), the Multi-step Compound, Exciton Model, and thefull featured Hauser-Feshbach Model, with a comprehensive parameterlibrary mainly converting nuclear masses, OM data, Discrete nuclearlevels, and decay schemes. The Monte Carlo Pre-equilibrium approach hasbeen particularly successful in approximating the experimental values. Asthe determination of the nuclear level density is of main impact on theresults.

Chapter V
136
The (p,xn) reactions offer a promising approach to the study of theinteraction mechanisms of protons beam with target nuclei of Mo, Gd. Theexcitation functions of this type of reactions exhibit a bell-shaped patternwith a rather broad top. The compound nucleus (CN) picture of the processpredicts this behavior but fails to account for the high-energy tail of theexcitation functions. This tail is assumed to derive from a non-compoundprocess by means of which the incident particle can eject a neutron fromthe target nucleus before the (CN) is formed, that is before thermalequilibrium is reached between the nucleons. In this case, the resultingresidual nuclei will have low excitation energies and the neutrons emittedin the subsequent evaporation process will be fewer than expected if all theincident energy were to go in (CN) formation. The first problem in theinterpretation of the experiments is then to determine the partial crosssections for the two interaction mechanisms. The problems encountered arethose of a correct choice of the parameter values and a sensible assessmentof the effects of the approximations introduced.
5-1.3 Discrete Level Cross Section
EMPIRE-II is a valuable tool in the spin-parity assignment fordiscrete levels of residual nuclei populated in nuclear reaction evolvingthrough compound nucleus mechanism. So there is several applicationsillustrating the method and the code’s predictive power.
A major problem in the experimental nuclear spectroscopy is thespin-parity (Jπ) assignment for the nuclear levels. In direct reactions withhadronic probes, the transferred angular momentum can be deduced fromthe shape of the angular distributions of the outgoing particles. In gamma-spectroscopy, measurements of gamma-ray angular distributions andconversion electron coefficient are the main tools in establishing a certainrange for (Jπ) values of the nuclear levels.
Another way leading to possible (Jπ) values for nuclear levels is toexploit the dependence of the compound nucleus decay probabilities on thespin-parity of the discrete levels of the residual nuclei. These decayprobabilities enter the level population cross section calculated in theframework of compound nucleus statistical theory of nuclear reactions. Bycomparing the measured discrete level population cross sections with thecalculated one, and assuming different hypothesis for the (Jπ) of final statea certain restricted range in the (Jπ) values can be obtained. Several studiesof (p,nγ), (α,nγ), (n,n’γ) reactions applied this procedure in selecting certain(Jπ) values for levels measured by γ-spectroscopical means [cf. 160-164].

Chapter V
137
In completing this task, a compound nucleus statistical model code has tobe used.
There are many model codes, but they usually require an extensiveinput including particle transmission coefficients provide by directinteraction codes. EMPIRE-II [cf. 30], is a nuclear reaction code which hasnot this inconvenience because, it directly accesses the most recentReferences Input Parameter Library RIPL-2 [cf. 145], and contains thewell-known direct interaction code system, used mainly in nuclear reactiondata evaluation.
The goal of this work is to use EMPIRE-II in conjunction withRIPL-2 as a valuable spectroscopic tool for spin-parity assignment todiscrete nuclear levels. On the basis of population of the computationalinstruments, the application of spin-parity assignment is served us indetermining the discrete level cross for the predicted nuclear level values.This is one application from several applications that reveal the predictivepower of EMPIRE-II.
The EMPIRE-II prediction method of the nuclear level Jπ Valuespresented in this work is based on the dependence of the population cross-sections on the spin and parity of the discrete levels of the residual nuclei.The sensitivity of the population cross-section to the variation of the finallevel spin-parity values depends on the difference between the transmissioncoefficients entering the Hauser-Feshbach formula when different Jπ valuesare considered. It is difficult to make universal assumptions about thissensitivity and the prediction power of this method due to their dependenceon several factors such as: reaction type, energy range, odd-even characterof the target, spin-parity of the target's ground state, optical potentialparameters, etc. [cf. 165]. Therefore, detailed numerical calculations of thepopulation cross-sections have to be performed case-by-case. EMPIRE-II isan appropriate code system for performing this task especially because it isbased on the latest versions of the reaction models, takes into considerationall the open reaction channels, offers many choices for the input parametersand automatically creates the input files. Due to the short execution time ofEMPIRE-II, different input parameter values and a large set of Jπ
hypothesis can be tested until the best agreement with the experimentaldata is obtained. One complete calculation for the reactions presentedbelow on a Pentium IV machine takes only few seconds.
The predictive power of EMPIRE-II was verified in the case of thereaction (p,nγ) especially for discrete γ-ray spectroscopy. The cross sectiondata obtained from ALICE-91 code due to several proton induced reactions

Chapter V
138
on Natural Molybdenum, and Gadolinium targets are shown in the Tables(5-1), (5-3). The Resultant Output Cross Section Values from obtainedfrom EMPIRE-II code due to several proton induced reactions on NaturalMolybdenum, and Gadolinium targets are shown in the Tables (5-2), (5-4).
Table (5-1): The Resultant Output Cross Section Values from SeveralProton Induced Reactions on Natural Molybdenum Targets, The
Calculation of the Total Cross Section from the Individual ContributingReactions have Performed by Using ALICE-91 Code [cf. 29].
EP(MeV)
92Nbσ (mb)
95Tcσ (mb)
96Tcσ (mb)
94Tcσ (mb)
99Tcσ (mb)
1 0.00 0.00 0.00 0.00 0.002 0.00 0.00 0.00 0.00 0.003 0.00 0.00 0.00 0.00 0.004 0.00 1.23 0.00 0.00 0.005 0.01 6.69 7.24 0.00 0.006 0.04 20.22 22.02 11.10 0.007 0.14 41.71 45.20 23.50 0.008 0.41 66.23 71.06 37.83 0.009 0.77 88.52 94.58 51.06 18.49
10 1.22 106.66 113.76 61.70 43.5311 1.72 120.99 129.27 70.12 62.5012 2.28 132.93 142.28 76.96 75.6913 2.85 139.94 153.62 82.33 85.2314 3.35 99.02 163.13 87.78 92.2615 3.61 58.43 170.14 82.79 97.2616 3.15 34.07 174.97 51.25 100.1517 2.67 21.01 178.14 32.19 102.0818 2.25 14.44 180.34 20.44 95.8219 1.73 11.05 182.71 13.69 79.1620 1.37 9.49 185.70 9.99 61.25
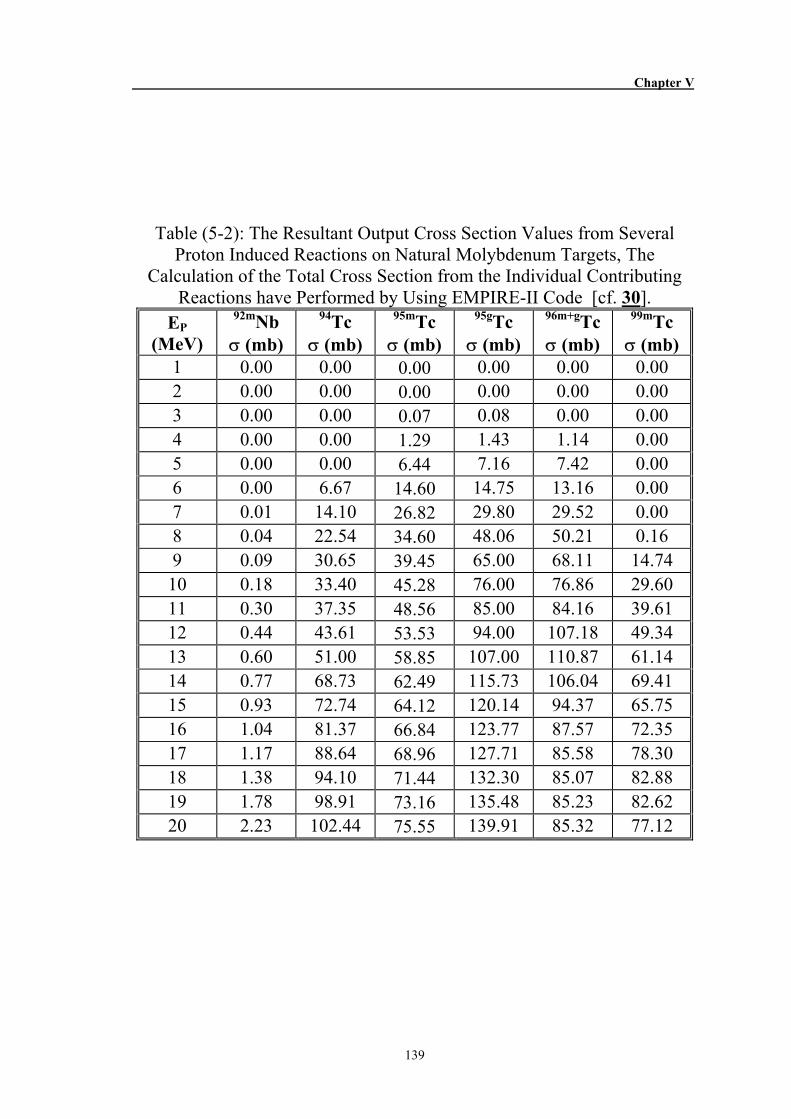
Chapter V
139
Table (5-2): The Resultant Output Cross Section Values from SeveralProton Induced Reactions on Natural Molybdenum Targets, The
Calculation of the Total Cross Section from the Individual ContributingReactions have Performed by Using EMPIRE-II Code [cf. 30].
EP(MeV)
92mNbσ (mb)
94Tcσ (mb)
95mTcσ (mb)
95gTcσ (mb)
96m+gTcσ (mb)
99mTcσ (mb)
1 0.00 0.00 0.00 0.00 0.00 0.002 0.00 0.00 0.00 0.00 0.00 0.003 0.00 0.00 0.07 0.08 0.00 0.004 0.00 0.00 1.29 1.43 1.14 0.005 0.00 0.00 6.44 7.16 7.42 0.006 0.00 6.67 14.60 14.75 13.16 0.007 0.01 14.10 26.82 29.80 29.52 0.008 0.04 22.54 34.60 48.06 50.21 0.169 0.09 30.65 39.45 65.00 68.11 14.7410 0.18 33.40 45.28 76.00 76.86 29.6011 0.30 37.35 48.56 85.00 84.16 39.6112 0.44 43.61 53.53 94.00 107.18 49.3413 0.60 51.00 58.85 107.00 110.87 61.1414 0.77 68.73 62.49 115.73 106.04 69.4115 0.93 72.74 64.12 120.14 94.37 65.7516 1.04 81.37 66.84 123.77 87.57 72.3517 1.17 88.64 68.96 127.71 85.58 78.3018 1.38 94.10 71.44 132.30 85.07 82.8819 1.78 98.91 73.16 135.48 85.23 82.6220 2.23 102.44 75.55 139.91 85.32 77.12

Chapter V
140
Table (5-3): The Resultant Output Cross Section Values from SeveralProton Induced Reactions on Natural Gadolinium Targets, The Calculationof the Total Cross Section from the Individual Contributing Reactions have
Performed by Using ALICE-91 Code [cf. 29].
Ep(MeV)
152Tbσ (mb)
154Tbσ (mb)
155Tbσ (mb)
156Tbσ (mb)
160Tbσ (mb)
1 0.00 0.00 0.00 0.00 0.002 0.00 0.00 0.00 0.00 0.003 0.00 0.00 0.00 0.00 0.004 0.00 0.00 0.01 0.01 0.025 0.00 0.01 0.15 0.20 0.326 0.03 0.13 1.18 1.61 2.277 0.02 0.64 4.94 6.84 9.128 0.10 1.88 13.66 19.04 24.779 0.25 4.03 28.42 39.71 39.7410 0.50 6.93 48.25 67.55 40.7411 0.79 10.12 70.00 95.39 33.5312 1.07 23.66 80.07 105.01 25.5913 1.30 54.31 67.34 88.23 19.1814 1.27 85.41 49.28 64.89 14.9015 1.04 107.44 38.48 45.24 12.2516 0.79 129.36 26.94 31.11 10.5617 0.58 145.95 19.54 22.11 9.4918 0.42 158.98 14.80 16.50 7.5819 0.31 167.32 11.94 13.14 7.2320 0.24 169.97 10.18 11.14 7.00
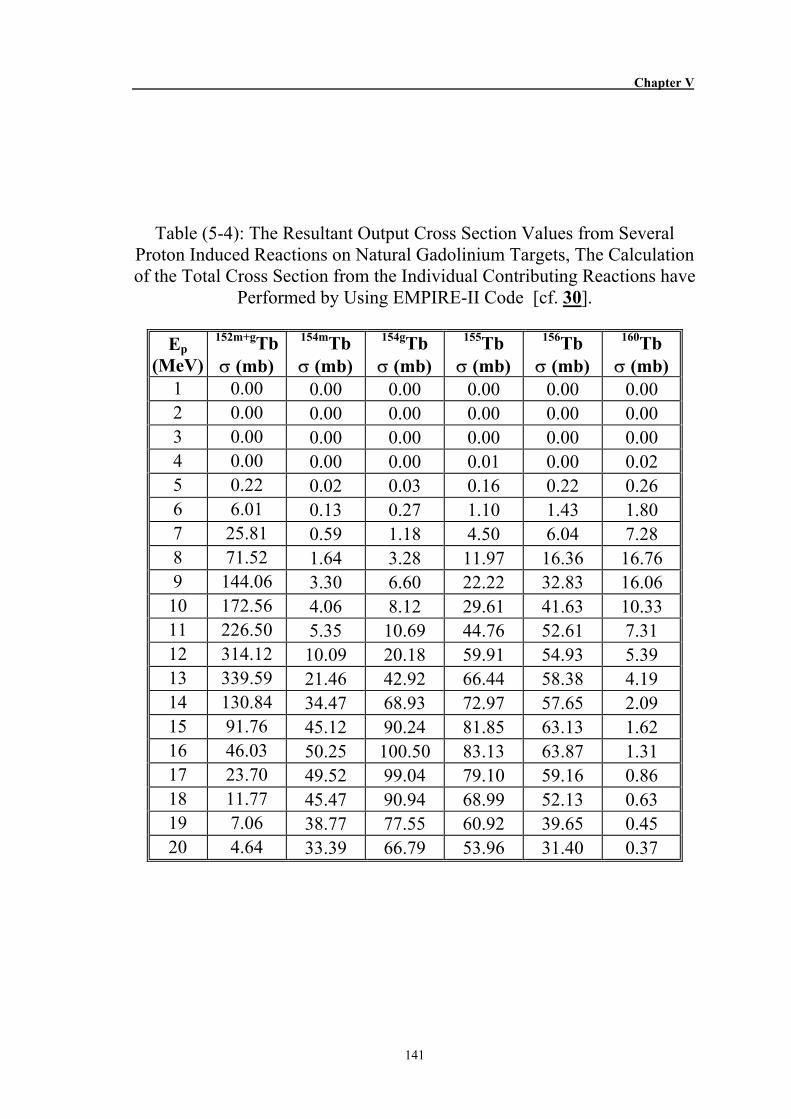
Chapter V
141
Table (5-4): The Resultant Output Cross Section Values from SeveralProton Induced Reactions on Natural Gadolinium Targets, The Calculationof the Total Cross Section from the Individual Contributing Reactions have
Performed by Using EMPIRE-II Code [cf. 30].
Ep(MeV)
152m+gTbσ (mb)
154mTbσ (mb)
154gTbσ (mb)
155Tbσ (mb)
156Tbσ (mb)
160Tbσ (mb)
1 0.00 0.00 0.00 0.00 0.00 0.002 0.00 0.00 0.00 0.00 0.00 0.003 0.00 0.00 0.00 0.00 0.00 0.004 0.00 0.00 0.00 0.01 0.00 0.025 0.22 0.02 0.03 0.16 0.22 0.266 6.01 0.13 0.27 1.10 1.43 1.807 25.81 0.59 1.18 4.50 6.04 7.288 71.52 1.64 3.28 11.97 16.36 16.769 144.06 3.30 6.60 22.22 32.83 16.06
10 172.56 4.06 8.12 29.61 41.63 10.3311 226.50 5.35 10.69 44.76 52.61 7.3112 314.12 10.09 20.18 59.91 54.93 5.3913 339.59 21.46 42.92 66.44 58.38 4.1914 130.84 34.47 68.93 72.97 57.65 2.0915 91.76 45.12 90.24 81.85 63.13 1.6216 46.03 50.25 100.50 83.13 63.87 1.3117 23.70 49.52 99.04 79.10 59.16 0.8618 11.77 45.47 90.94 68.99 52.13 0.6319 7.06 38.77 77.55 60.92 39.65 0.4520 4.64 33.39 66.79 53.96 31.40 0.37

Chapter V
142
5-2 The Excitation Function for Produced Radionuclidesfrom Mo Targets
When measuring the cross-sections of the (p,n) reaction on enrichedtargets, the data do not contain the contributions of the (p,2n) and otherreactions with higher Q values taking place on natural targets. Aftertransforming this data to "natural" composition, the “elemental” crosssection data has been derived. That, allowing comparison with other data.
Several reactions contribute to the production of 96mTc, 96gTc and96Nb isotopes as can be seen in Table (2-3). The radioisotope 96mTc decaysto 96gTc by internal conversion (98%) followed by a low energy and veryweak gamma-line not suitable for quantitative assessment. 96mTc alsodecays to 96Mo by electron capture and positron emission but the gammalines emitted during the decay are too weak and/or not independent since96gTc and 96Nb also decay to 96Mo producing the same gamma-lines.Separation of the radiation of 96mTc and 96gTc is not straightforward. Itrequires an inconvenient time consuming series of measurement, asdetection of the isomeric state through its direct radiation is very difficult(weak and common gamma lines, 2% branching ratio). Detection of theground state decay is also disturbed by the decay of 96Nb resulting insimilar gamma lines. However, determination with good accuracy of thecumulative 96mgTc cross-section is possible after the complete decay of96Nb. For monitoring and TLA use measurements have to start after totaldecay of 96Nb i.e. 3-4 days after EOB (End of Bombardment).
Separation of intense independent gamma lines on the other handmake it possible to determine independently the excitation function of theprocesses for production of 96mgTc and 96Nb. Decay analysis shows that thecross-section for production of 96mTc is significant compared to directproduction of ground state, therefore in monitoring it is necessary to waituntil the 96mTc decays completely. The excitation function of thecommutative natMo(p,x)96mgTc process can be measured precisely aftercomplete decay of 96Nb. Three reactions contribute to the production of96Nb are 100Mo(p,αn), 97Mo(p,2p), and 98Mo(p,2pn) with thresholds 3.82,9.32, and 18.05 MeV respectively. As 96Nb decays into the 96Mo like 96Tc,independent gamma line is not available to determine the activity of 96Nbseparately. The determination of the cross-section for production of 96Nb ishowever possible by following the decay and decomposing the measuredgamma lines. The published measured cross-section is in the range of a fewmillibarns in the investigated energy region up to 40 MeV [cf. 86], due tothe statistical error and the applied peak de-composition technique theexperimental points have an estimated uncertainty of about 30%.

Chapter V
143
5-2.1 The natMo(p,x)92mNb Reaction
The excitation function of natMo(p,x)92mNb reaction measured in thiswork is shown in Figure (5-1). The production of 92mNb from natural Motargets, total cross section, and thin, thick yields as a function of protonenergies, data obtained and their estimated errors are tabulated in Table (5-5). In this work the obtained data are consistent with the available data ofN.V. Levkowski (1991) [cf. 82]. The good agreement, especially in theoverlapping energy regions, gives more convenient to our work. 92mNb,96Nb radionuclides were identified as reaction product in this work, theproduction of 92mNb radionuclide is most likely due to (p,α) reaction typeon Mo targets. The production of Nb radioactivities must be considered asa potential source of radionuclidic contamination in the production of Tcradionuclides. Therefore, the radiochemical processing of Mo targetsshould provide for an efficient separation of Nb radioactivities and or theirZr, and Mo decay products. The comparisons of EMPIRE-II data with thatbelong to us, show that to some extend seem to be close to our data thanALICE-91 results.
5-2.2 The natMo(p,x)94gTc Reaction
The excitation function of the natMo(p,x)94gTc reaction based on this workis shown in Figure (5-2). The production of 94gTc from natural Mo targets,total cross section, and thin, thick yields as a function of proton energies,the data obtained and their estimated errors are tabulated in Table (5-6). Forcomparison the literature data of M. Bonardi et al., (2002); Yu. Zuravlev etal., (1994) [cf. 3] are also given. Again, the data reported by Bonardi et al.,Zuravlev et al., were obtained via measurements on natMo and extrapolationof the results to high isotopic enrichment. The Zuravlev et al., values agreeto some extent with our data near the threshold, and at the higher region,the data of Bonardi et al., on the other hand, are in complete agreementwith our data. It is shown in the figure too, the agreement betweenEMPIRE-II and our data and the literature obtained data.

Chapter V
144
0
2
4
6
8
10
12
14
5 7 9 11 13 15 17 19Proton Energy (MeV)
Cro
ss S
ectio
n (m
b)
This WorkRef. N. V. Levkovskij (1991)ALICE Results for 92NbEMPIRE Results for 92mNb
natMo(p,x)92mNbEth = 5.61 MeV
Figure (5-1): The Excitation Function of the natMo(p,x)92mNb Reaction.
Table (5-5). Measured Cross Sections Values for Production of 92mNb,on Natural Mo Targets at Different Energies.
Incident Energy
Ep (MeV)
natMo(p,x)92mNbσ (mb)
DifferentialYields
mCi/µA⋅h
IntegralYieldsMBq/C
17.74±0.75 9.00±0.92 1.94E-04 1.44E+0117.21±0.73 8.60±0.88 2.00E-04 1.36E+0116.67±0.71 8.90±0.91 2.03E-04 1.26E+0116.12±0.68 8.00±0.82 2.06E-04 1.16E+0115.56±0.66 9.90±1.07 2.06E-04 1.06E+0114.98±0.64 9.60±1.04 2.03E-04 9.51E+0013.83±0.59 11.00±1.19 1.89E-04 8.40E+0013.62±0.58 9.00±0.97 1.84E-04 7.28E+0013.56±0.57 7.29±0.82 1.75E-04 6.18E+0012.84±0.54 7.67±0.86 1.54E-04 5.12E+0012.56±0.53 6.35±0.71 1.34E-04 4.14E+0012.15±0.52 5.20±0.59 1.11E-04 3.27E+0011.79±0.50 5.39±0.65 8.88E-05 2.52E+0011.49±0.49 4.34±0.53 6.88E-05 1.90E+0010.67±0.45 3.33±0.40 4.94E-05 1.41E+0010.54±0.45 2.41±0.29 3.67E-05 1.03E+0010.34±0.44 2.79±0.37 2.65E-05 7.50E-019.46±0.40 1.61±0.21 1.75E-05 5.41E-019.10±0.39 0.89±0.12 1.22E-05 3.89E-018.73±0.37 0.51±0.07 8.40E-06 2.80E-018.11±0.34 0.41±0.08 5.67E-06 2.01E-01

Chapter V
145
0
50
100
150
200
4 6 8 10 12 14 16 18 20 22Proton Energy (MeV)
Cro
ss S
ectio
n (m
b)This WorkRef. M. Bonardi et al., (2002)Ref. Yu.Yu. Zhuravlev et al., (1994)ALICE Results for 94Tc EMPIRE Results for 94Tc
natMo(p,x) 94 gTcEth = 5.09 MeV
Figure (5-2): The Excitation Function of the natMo(p,x)94gTc Reaction.
Table (5-6). Measured Cross Sections Values for Production of 94Tc, onNatural Mo Targets at Different Energies.
Incident EnergyEp (MeV)
natMo(p,x)94Tcσ (mb)
DifferentialYields
MCi/µA⋅h
IntegralYieldsMBq/C
17.74±0.75 60.68±6.22 2.04E+01 4.44E+0017.21±0.73 58.70±6.02 1.99E+01 4.17E+0016.67±0.71 55.16±5.66 1.91E+01 3.89E+0016.12±0.68 54.25±5.56 1.83E+01 3.57E+0015.56±0.66 56.54±6.11 1.73E+01 3.25E+0014.98±0.64 50.74±5.49 1.63E+01 2.94E+0013.83±0.59 46.69±5.05 1.45E+01 2.64E+0013.62±0.58 47.79±5.17 1.36E+01 2.34E+0013.56±0.57 42.97±4.84 1.27E+01 2.06E+0012.84±0.54 30.50±3.43 1.10E+01 1.80E+0012.56±0.53 31.21±3.51 9.60E+00 1.56E+0012.15±0.52 29.80±3.35 8.12E+00 1.35E+0011.79±0.50 30.04±3.64 6.80E+00 1.16E+0011.49±0.49 23.60±2.86 5.70E+00 1.00E+0010.67±0.45 19.86±2.41 4.58E+00 8.61E-0110.54±0.45 18.64±2.26 3.94E+00 7.41E-0110.34±0.44 16.20±2.16 3.41E+00 6.36E-019.46±0.40 13.36±1.78 2.78E+00 5.44E-019.10±0.39 10.52±1.40 2.42E+00 4.62E-018.73±0.37 9.90±1.32 2.12E+00 3.88E-018.11±0.34 9.73±1.99 1.81E+00 3.20E-017.71±0.33 8.94±1.83 1.59E+00 2.58E-01

Chapter V
146
5-2.3 The natMo(p,x)95gTc Reaction
The excitation function of the natMo(p,x)95gTc reaction obtained inthis work is shown in Figure (5-3). The production of 95gTc from naturalMo targets, total cross section, and thin, thick yields as a function of protonenergies, the data obtained are tabulated in Table (5-7). The directformation of the ground, metastable states is assessed in the first hours afterEOB by measuring its characteristic γ-line. The ground state has a shorterhalf-life (94gTc, T1/2=20h) than its metastable state (94mTc, T1/2=61d), thisimplying that the signal from it with suitable energy is clear quite separate.As no appreciable amount 94mTc was generated, the resulting cross sectiondata obtained and their estimated errors are entirely determined andrepresented in Table (5-7). The data of all investigators M. Bonardi et al.,(2002); N.V. Levkowski (1991) [cf. 3,82] show on average good agreementover the large energy region, especially with Bonardi et al., but Levkowskidata tend to lower data at the tapering end of the excitation function. Thesedata and our measurements are surrounded by an envelope with the higherarm of ALICE-91 and the lower of EMPIRE-II, on average both arms areclose to experimental results. Again, the data reported by Bonardi et al., butLevkowski et al., were obtained via measurements on natMo andextrapolation of the results to high isotopic enrichment. EMPIRE-II hereuses the default option of the Optical Model Parameters (OMP) whichrepresent the key ingredients in this type of calculations. One of thestrongest points of EMPIRE-II code is that it allows a rapid, and easytesting of various sets of OMP. The default option taking into account thefollowing OMP sets from the built in systematics: Wilmore-Hodgson forneutrons, Becchetti-Greenless for protons, and McFadden-Satchler for α-particles [cf. 176].
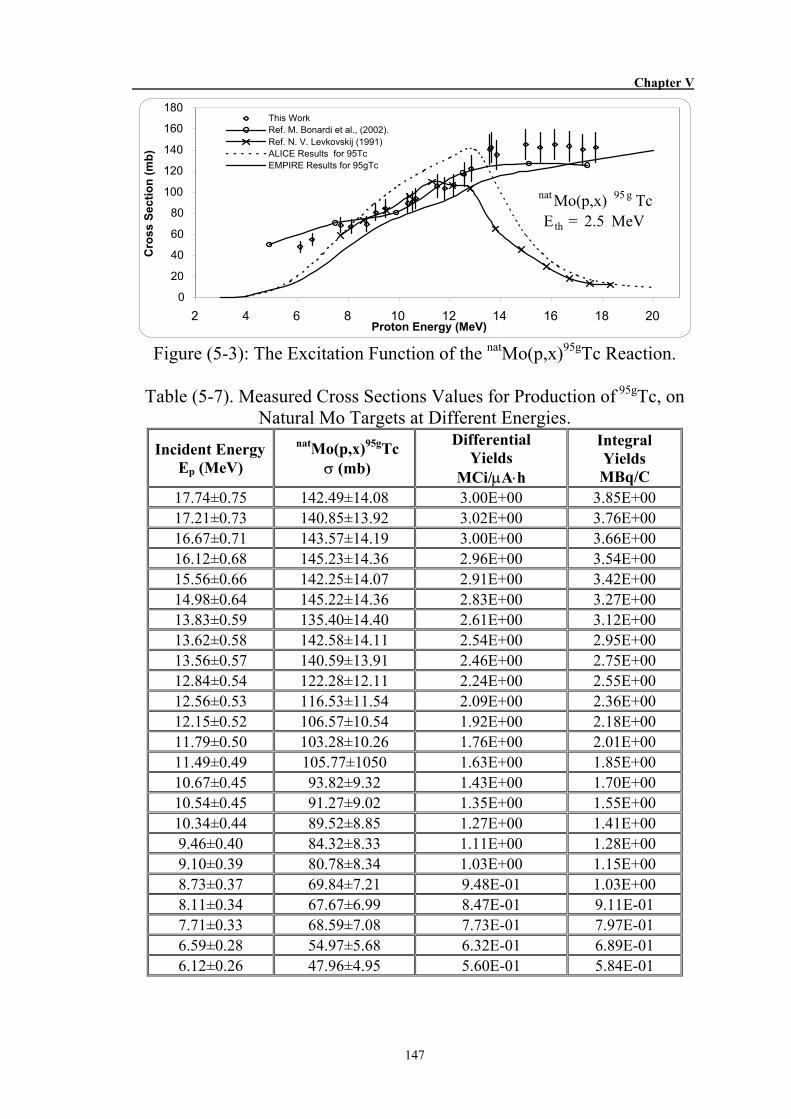
Chapter V
147
0
20
40
60
80
100
120
140
160
180
2 4 6 8 10 12 14 16 18 20Proton Energy (MeV)
Cro
ss S
ectio
n (m
b)
This WorkRef. M. Bonardi et al., (2002).Ref. N. V. Levkovskij (1991)ALICE Results for 95TcEMPIRE Results for 95gTc
nat Mo(p,x) 95 g TcEth = 2.5 MeV
Figure (5-3): The Excitation Function of the natMo(p,x)95gTc Reaction.
Table (5-7). Measured Cross Sections Values for Production of 95gTc, onNatural Mo Targets at Different Energies.
Incident EnergyEp (MeV)
natMo(p,x)95gTcσ (mb)
DifferentialYields
MCi/µA⋅h
IntegralYieldsMBq/C
17.74±0.75 142.49±14.08 3.00E+00 3.85E+0017.21±0.73 140.85±13.92 3.02E+00 3.76E+0016.67±0.71 143.57±14.19 3.00E+00 3.66E+0016.12±0.68 145.23±14.36 2.96E+00 3.54E+0015.56±0.66 142.25±14.07 2.91E+00 3.42E+0014.98±0.64 145.22±14.36 2.83E+00 3.27E+0013.83±0.59 135.40±14.40 2.61E+00 3.12E+0013.62±0.58 142.58±14.11 2.54E+00 2.95E+0013.56±0.57 140.59±13.91 2.46E+00 2.75E+0012.84±0.54 122.28±12.11 2.24E+00 2.55E+0012.56±0.53 116.53±11.54 2.09E+00 2.36E+0012.15±0.52 106.57±10.54 1.92E+00 2.18E+0011.79±0.50 103.28±10.26 1.76E+00 2.01E+0011.49±0.49 105.77±1050 1.63E+00 1.85E+0010.67±0.45 93.82±9.32 1.43E+00 1.70E+0010.54±0.45 91.27±9.02 1.35E+00 1.55E+0010.34±0.44 89.52±8.85 1.27E+00 1.41E+009.46±0.40 84.32±8.33 1.11E+00 1.28E+009.10±0.39 80.78±8.34 1.03E+00 1.15E+008.73±0.37 69.84±7.21 9.48E-01 1.03E+008.11±0.34 67.67±6.99 8.47E-01 9.11E-017.71±0.33 68.59±7.08 7.73E-01 7.97E-016.59±0.28 54.97±5.68 6.32E-01 6.89E-016.12±0.26 47.96±4.95 5.60E-01 5.84E-01

Chapter V
148
5-2.4 The natMo(p,x)95mTc Reaction
The production of 95mTc from natural Mo targets, total cross section,and thin, thick yields as a function of proton energies, the data obtained andtheir estimated errors are tabulated in Table (5-8). The excitation functionof the natMo(p,x)95mTc reaction obtained in this work is shown in Figure (5-4), and compared with the collected literature values. The individual crosssections of reactions constituting natMo(p,x)95mTc product measured onnatural target by M. Bonardi et al., (2002); N.V. Levkowski (1991) [cf.3,82]. We note that the metastable cross section data are rather low thanground state, this character contrary to the usual case. Our measured valuesand the data obtained from published results on the formation of 95mTcshow good agreement except for the results of Levkowski, that showingtapering tend toward a lower values at higher energies. ALICE-91 couldnot assign isomeric cross section for a certain level, but EMPIRE-II couldable to do that, assigned the higher spin state 95gTc (9/2)+, Lower spin state95mTc (9/2)− . Which, enable us to determine also the isomeric ratio incomparison with experimental isomeric ratio as shown in Figure (5-5). Byinspecting Figure (5-4) we see the agreement between EMPIRE-II and ourresults, of course the taper trend of Levkowski data causes a higher valuesfor the isomeric ratios. Data obtained by M. Bonardi et al., (2002) [cf. 3]show good agreement with our isomeric ratios as shown in Figure (5-5), theIsomeric cross section ratios values for 95gTc/95mTc are tabulated in Table(5-8). Formations of cross-section ratios are obtained with dividing thehigher spin isomer by the low spin isomer.
0
20
40
60
80
100
120
140
160
180
2 7 12 17Proton Energy (MeV)
Cro
ss S
ectio
n (m
b)
This WorkRef. M. Bonardi et al., (2002).Ref. N. V. Levkovskij (1991)ALICE Results for 95TcEmpire Results
nat Mo(p,x) 95 m TcEth = 2.5 MeV
Figure (5-4): The Excitation Function of the natMo(p,x)95mTc Reaction.

Chapter V
149
Table (5-8). Measured Cross Sections Values for Production of 95m Tc, andIsomeric Ratios on Natural Mo Targets at Different Energies.
Incident Energy
Ep (MeV)
natMo(p,x)95mTcσ (mb)
IsomericRatiosσg/σm
DifferentialYields
mCi/µA⋅h
IntegralYieldsMBq/C
17.74±0.75 60.58±6.22 2.35 1.76E-02 1.55E+0017.21±0.73 52.14±5.36 2.70 1.73E-02 1.51E+0016.67±0.71 59.87±6.15 2.40 1.67E-02 1.48E+0016.12±0.68 54.27±5.51 2.68 1.61E-02 1.44E+0015.56±0.66 58.98±5.99 2.41 1.54E-02 1.40E+0014.98±0.64 60.14±6.11 2.41 1.48E-02 1.35E+0013.83±0.59 61.99±6.29 2.18 1.35E-02 1.29E+0013.62±0.58 50.47±5.12 2.83 1.32E-02 1.22E+0013.56±0.57 54.24±5.50 2.59 1.30E-02 1.14E+0012.84±0.54 40.97±4.13 2.98 1.21E-02 1.07E+0012.56±0.53 46.46±4.69 2.51 1.17E-02 9.95E-0112.15±0.52 42.35±4.27 2.52 1.10E-02 9.23E-0111.79±0.50 39.19±3.89 2.64 1.05E-02 8.52E-0111.49±0.49 44.05±4.37 2.40 9.88E-03 7.83E-0110.67±0.45 34.15±3.39 2.75 8.84E-03 7.15E-0110.54±0.45 41.23±4.46 2.21 8.34E-03 6.51E-0110.34±0.44 43.88±4.75 2.04 7.73E-03 5.89E-019.46±0.40 32.27±3.49 2.61 6.56E-03 5.30E-019.10±0.39 28.29±3.09 2.86 5.76E-03 4.76E-018.73±0.37 26.42±2.88 2.64 4.90E-03 4.27E-018.11±0.34 29.85±3.26 2.27 4.53E-03 3.83E-017.71±0.33 25.98±2.84 2.64 4.23E-03 3.39E-016.59±0.28 24.15±2.64 2.28 3.55E-03 2.96E-016.12±0.26 21.00±2.29 2.28 3.25E-03 2.54E-01
0
1
2
3
4
4 6 8 10 12 14 16 18 20Proton Energy (MeV)
Cro
ss S
ectio
n R
atio
s
This Work
Ref. M. Bonardi et al., (2002).
Ref. N. V. Levkovskij (1991)
95gTc / 95mTc Ratios
Figure (5-5): The Isomeric Cross Section Ratios Values for 95gTc/95mTc.

Chapter V
150
5-2.5 The natMo(p,x)96m+gTc Reaction
A literature survey showed that several authors measured cross-sections for the production of the 96Tc isotope using enriched and/or naturalmolybdenum targets. A summary of the works for the production of 96mgTcfrom natural Mo targets, total cross section, and thin, thick yields as afunction of proton energies, the data obtained and their estimated errors aretabulated in Table (5-9). The excitation function of the natMo(p,x)96m+gTcreaction obtained in this work is shown in Figure (5-6). Experimental datafor more recent works are collected and presented in Figure (5-6). The datareported by S. Takacs et al., (2002) [cf. 86] present cross-section data forthe natMo(p,x)96mgTc process in their paper measured the stacked sampleswere irradiated in vacuum at an external beam line of a cyclotronaccelerator with high energy precision. Data are given up to 38 MeV andare in fair agreement with our data, in the match energy range. M. Bonardiet al., [cf. 3] presented numerical data measured on natural molybdenumtargets up to 43.7 MeV. The type of cross-section they present concernscumulative elemental cross-section for the natMo(p,x)96mgTc process. Thetrend of the high-energy tail of the excitation function is reproduced by theinclusion of the pre-equilibrium calculation of ALICE-91 code while thecross section obtained by EMPIRE-II disagree with the experimental data,this disagreement reveal that the good selection of optical modelparameters produces particles transmission coefficient which is responsibleelevating the cross sections results. As well as the level densitiescalculation could uses different models or even a mix such as Fermi Gasmodel (FG) + Hartree-Fock approach (BCS) which is the default option forlevel density functions in EMPIRE-II, which consider the deformation-dependent collective effects. For the nuclei involved in the reaction inducedby protons with a few MeV show more suitable with Gilbert-Camerondensity function; its parameters are adjusted to the cumulative number oflow-lying states and to the mean level distance at neutron binding energy.In discrete-level spectroscopy with light particle induced reactions ingeneral and particularly not in this case 96gTc (7+), 96mTc (4+), the residualnuclei are not populated in states with very high excitation energies.Therefore, the level density functions describing the continuum spectra arenot crucial for the calculated cross sections. The total cross section (σm+σg)of the reaction producing 96Tc which is a better agreement in the highenergy tail region of the excitation function is achieved with ALICE-91,using all default parameters with a 2p-1h initial exciton configuration of theHybrid model (Blann, 1971) [cf. 126], used Superfluid nuclear model forlevel density function.

Chapter V
151
Table (5-9). Measured Cross Sections Values for Production of 96m+gTc, onNatural Mo Targets at Different Energies.
Incident Energy
Ep (MeV)
natMo(p,x)96m+gTcσ (mb)
DifferentialYields
MCi/µA⋅h
IntegralYieldsMBq/C
17.74±0.75 117.00±11.70 8.95E-02 7.47E-0117.21±0.73 115.14±11.51 9.23E-02 7.26E-0116.67±0.71 120.00±12.00 9.41E-02 7.02E-0116.12±0.68 111.25±11.13 9.57E-02 6.73E-0115.56±0.66 121.34±12.13 9.70E-02 6.42E-0114.98±0.64 125.74±12.57 9.78E-02 6.08E-0113.83±0.59 154.72±15.47 9.43E-02 5.72E-0113.62±0.58 148.95±14.90 9.63E-02 5.34E-0113.56±0.57 134.97±13.50 9.89E-02 4.95E-0112.84±0.54 151.37±15.14 9.57E-02 4.55E-0112.56±0.53 154.47±15.45 9.47E-02 4.14E-0112.15±0.52 144.21±14.42 9.15E-02 3.73E-0111.79±0.50 134.29±13.43 8.75E-02 3.31E-0111.49±0.49 128.42±12.84 8.25E-02 2.91E-0110.67±0.45 111.67±11.17 7.28E-02 2.51E-0110.54±0.45 109.15±10.92 6.71E-02 2.13E-0110.34±0.44 117.59±11.76 6.01E-02 1.78E-019.46±0.40 108.23±10.82 4.92E-02 1.46E-019.10±0.39 92.18±9.22 4.16E-02 1.18E-018.73±0.37 78.52±7.85 3.44E-02 9.27E-028.11±0.34 67.99±6.80 2.69E-02 7.10E-027.71±0.33 43.80±4.38 2.11E-02 5.28E-02
020406080
100120140160180200
3 5 7 9 11 13 15 17 19 21Proton Energy (MeV)
Cro
ss S
ectio
n (m
b)
This WorkRef. M. Bonardi et al., (2002).Ref. S. Takacs et al., (2002).ALICE Results for 96TcEMPIRE Results for 96Tc
nat Mo(p,x) 96 m+g TcEth = 3.79 MeV
Figure (5-6): The Excitation Function of the natMo(p,x)96m+gTc Reaction.

Chapter V
152
5-2.7 The natMo(p,x)99mTc Reaction
Three reactions contribute to the production of natMo(p,x)99mTc bydirect way are 98Mo(p,γ), 100Mo(p,2n), and indirect way by 100Mo(p,pn).The excitation function of the natMo(p,x)99mTc reaction obtained in thiswork is shown in Figure (5-8). The production of 96mgTc from natural Motargets, total cross section, and thin, thick yields as a function of protonenergies, the data obtained and their estimated errors are tabulated in Table(5-10). The excitation function of the 98Mo(p,γ)99mTc reaction cross sectionis very small and the errors are large as reported by B. Scholten et al.,(1999) [cf. 44]. This reaction is of no practical relevance for the productionof 99mTc. This result obtained by Scholten is contrary to that previouslyclaimed by Lagunas-Solar et al. (1991) [cf. 49] who supposed a high (p,γ)cross section, is responsible for 99mTc production. Presumably, “as Scholtenproposed due to some impurity effect. He also noted that, capture reactionsin the MeV region have a cross section typically of the order of 1 mb, bothin (n,γ) and (p,γ) processes [cf. 44].
Possibly the whole trend may be a reaction of the 100Mo(p,2n)99mTcreaction (on the 9.63% 100Mo present in the naturally highly pure Mosample). In contrast, our results on the natMo(p,x)99mTc reaction are higherthan the data reported by Scholten et al., (1999) [cf. 44] in the same timeare in good agreement with others Lagunas-Solar et al., (1991); Levkowskiet al., (1991) [cf. 49,82] in the same energy region. It is shown from thefigure (5-8) that, the cross sections produced by ALICE-91 code is awayfrom the whole experimental date. However, it was for our data, and thepublished literature. This is because ALICE-91 could not able to predict across section for isomeric state. But only for the whole 99Tc produced.EMPIRE-II is capable to predict, assign the level spin and parity forisomeric state responsible mainly for this process and evaluate the crosssection pertained to it.
Lagunas-Solar et al., (1991) [cf. 49] postulated that the production of99mTc could be due to two distinct reaction channels. The excitationfunction shows the first maximum at 19 MeV and was ascribed to thereaction channel 98Mo(p,γ)99mTc (Q=-6.36 MeV). It was strongly argued byLagunas-Solar (1993) that the 98Mo(p,γ)99mTc nuclear reaction with20→10 MeV protons on enriched 98Mo was viable and would have theadded advantage of potentially reducing costs of cyclotron installation andoperation. The second maximum in the cross section appeared at 42 MeVand was suggested to be due to the 100Mo(p,2n)99mTc (Q=-7.85 MeV)reaction. Scholten measurements using highly enriched Mo as target

Chapter V
153
material depict clearly that the peak at Ep≈17 MeV is due to the100Mo(p,2n)99mTc reaction and not the 98Mo(p,γ)-process at higher energiesno other peak was observed. The second maximum in the excitationfunction at higher energies reported by Lagunas-Solar et al. (1991) [cf. 49]is thus obscure.
It should be emphasized that the 100Mo(p,2n)99mTe reaction cannot becompared to a normal (p,2n) reaction in this mass region, since theproduced activity is an isomeric state. The systematics is generally valid fortotal (p,xn) cross sections but not for the formation of higher spins isomers.Even detailed statistical model calculations, incorporating precompoundmodel and nuclear structure effects are often incapable of reproducing theisomeric cross section Nagame et al., (1994) [cf. 24]. An accurateexperimental database is thus crucial to consider the feasibility of the100Mo(p,2n)99mTe reaction for a possible production of 99mTc at a cyclotron.A limiting factor in this regard would be the level of co-produced long-lived 99gTc impurity. Experimentally this is very hard to determine and wasoutside the scope of the present work.

Chapter V
154
0
200
400
600
800
1000
1200
1400
7 9 11 13 15 17 19 21Proton Enrgy (MeV)
Cro
ss S
ectio
n (m
b)This WorkB. Scholten et al., (1999).M. Lagunas-Solar et al., (1991).V. N. Levkovskij (1991).ALICE Results for 99TcEMPIRE Results for 99mTc
nat Mo(p, x) 99 m TcE th = 7.79 MeV
Figure (5-7): The Excitation Function of the natMo(p,x)99mTc Reaction.
Table (5-10). Measured Cross Sections Values for Production of 99mTc onNatural Mo Targets at Different Energies.
Incident Energy
Ep (MeV)
natMo(p,x)99mTcσ (mb)
DifferentialYields
mCi/µA⋅h
IntegralYieldsMBq/C
17.74±0.75 388.00±39.80 8.24E+00 2.48E+0117.21±0.73 372.16±38.17 8.14E+00 2.31E+0116.67±0.71 369.42±37.89 7.96E+00 2.14E+0116.12±0.68 374.00±38.36 7.77E+00 1.98E+0115.56±0.66 361.68±39.10 7.57E+00 1.81E+0114.98±0.64 355.44±38.43 7.36E+00 1.63E+0113.83±0.59 388.35±41.98 6.85E+00 1.46E+0113.62±0.58 362.75±39.22 6.78E+00 1.29E+0113.56±0.57 344.47±38.78 6.71E+00 1.11E+0112.84±0.54 352.39±39.67 6.17E+00 9.36E+0012.56±0.53 275.45±31.01 5.62E+00 7.67E+0012.15±0.52 265.52±29.89 4.81E+00 6.09E+0011.79±0.50 254.27±30.85 3.95E+00 4.69E+0011.49±0.49 224.27±27.21 3.16E+00 3.51E+0010.67±0.45 156.31±18.96 2.36E+00 2.54E+0010.54±0.45 123.24±14.95 1.82E+00 1.76E+0010.34±0.44 111.65±14.88 1.35E+00 1.15E+009.46±0.40 85.51±11.40 8.85E-01 6.89E-019.10±0.39 50.12±6.68 5.60E-01 3.59E-018.73±0.37 36.52±4.87 2.87E-01 1.42E-018.11±0.34 14.72±3.01 5.87E-02 2.55E-02

Chapter V
155
5-3 The Excitation Functions for Produced Radionuclidesfrom Gd Targets
It has been found by surveying for all the available literature data,that no experimental data is existing for this reaction type on natural orenriched Gd targets in our energy range. So, our data represent the firstone. We will then compare our results with those obtained by theoreticalcode evaluation using ALICE-91 and EMPIRE-II codes. This contextmention above will applying to all reactions induced by proton on naturalGadolinium targets, except for the reaction natGd(p,x)160Tb. There is foundone available data carried out by C. Birattari et al., (1973) [cf. 78].
5-3.1 The natGd(p,x)152m+gTb Reaction
The excitation function of the natGd(p,x)152gTb reaction obtained inthis work is shown in Figure (5-8). The production of 152Tb from naturalGd targets, total cross section, and thin, thick yields as a function of protonenergies, data obtained and their estimated errors are tabulated in Table (5-11). However, in the energy scale of the natGd(p,x)152gTb the cross sectionsobtained for the entire 152Tb production below 20 MeV responsible from152Gd(p,n)152gTb only, has Q value of –4.77 MeV. The earlier contributingcross sections (measured on natural targets) are also presented and forcomparison they are summarized and normalized to isotopic enrichment toget "isotopic" cross sections for comparison with code calculation. Ourmeasured isotopic production cross sections and the data obtained from theseparate individual reaction of EMPIRE-II results, after conversion is inclose agreement. While the ALICE-91 output data are in agreement withour measurements at low proton energies below 9 MeV, but in the rest ofenergy region its data are elevated in disagreement manner.

Chapter V
156
0.0
100.0
200.0
300.0
400.0
500.0
600.0
700.0
7 9 11 13 15 17 19 21Proton Energy (MeV)
Cro
ss S
ectio
n (m
b)This Work
ALICE Results
EMPIRE Results
nat Gd(p,x) 152 m+g TbEth = 4.80 MeV
Figure (5-8): The Excitation Function of the natGd(p, x)152m+gTb Reaction.
Table (5-11). Measured Cross Sections Values for Production of 152m+gTb,on Natural Gd Targets at Different Energies.
IncidentEnergy
Ep (MeV)
natGd(p,x)152m+gTbσ (mb)
DifferentialYields
mCi/µA⋅h
IntegralYieldsMBq/C
17.87±0.76 165.59±19.27 2.466E-02 1.68E+0116.95±0.72 189.25±22.02 2.442E-02 1.62E+0115.99±0.68 175.56±18.34 2.389E-02 1.55E+0114.99±0.64 248.27±25.94 2.343E-02 1.48E+0113.94±0.59 251.42±39.18 2.306E-02 1.41E+0113.50±0.57 309.77±48.27 2.396E-02 1.33E+0112.87±0.55 331.70±107.38 2.489E-02 1.24E+0112.82±0.54 309.15±100.08 2.736E-02 1.15E+0112.21±0.52 302.04±57.96 2.884E-02 1.05E+0111.63±0.49 245.56±47.12 2.981E-02 9.36E+0011.53±0.49 227.03±24.78 3.050E-02 8.14E+0010.82±0.46 195.12±21.29 2.745E-02 6.88E+0010.34±0.44 210.12±26.94 2.355E-02 5.67E+0010.08±0.43 200.16±25.67 1.986E-02 4.59E+009.29±0.39 145.20±28.11 1.569E-02 3.65E+008.92±0.38 110.28±21.35 1.296E-02 2.84E+008.45±0.36 51.32±9.93 1.058E-02 2.15E+007.55±0.32 15.56±3.01 8.073E-03 1.55E+00

Chapter V
157
5-3.2 The natGd(p,x)154gTb Reaction
The excitation function of the natGd(p,x)154gTb reaction obtained inthis work is shown in Figure (5-9). The resulting cross section data incomparison with the currently obtained from ALICE-91 and EMPIRE-IIcodes are presented in Figure (5-8). The production of 154gTb from naturalGd targets, total cross section, and thin, thick yields as a function of protonenergies, data obtained and their estimated errors are tabulated in Table (5-12). Three reactions contribute to the formation of 154Tb as mentionedabove, the 154Gd(p,n)154Tb, 155Gd(p,2n)154Tb, and 156Gd(p,3n) 154Tb, havingQ-values of –4.34, –10.78, and –19.32 MeV, respectivily. The cross-sections derived from the two irradiation are in good agreement in theoverlapping energy region and they are also fit well to the resulting valuesgiven by the ALICE-91, EMPIRE-II codes. The experimental cross sectiondata are in good agreemen with EMPIRE-II calculationst, there are a smallshift towards higher values could be observed between the excitationfunction reproduced by ALICE-91, and EMPIRE-II codes. This shiftbecause the data obtained from ALICE-91 represent the total cross sectionthat produces the radionuclide 154Tb, but EMPIRE-II gives the levelexcitation energy responsible for the 154gTb in ground state, with spin Jπ(0).

Chapter V
158
0
20
40
60
80
100
120
140
160
180
7 9 11 13 15 17 19 21Proton Energy (MeV)
Cro
ss S
ectio
n (m
b)
This Work
ALICE Results
EMPIRE Results
nat Gd(p,x) 154 gTbEth = 4.37 MeV
Figure (5-9): The Excitation Function of the natGd(p, x)154gTb Reaction.
Table (5-12). Measured Cross Sections Values for Production of 154gTb, onNatural Gd Targets at Different Energies.
IncidentEnergy
Ep (MeV)
natGd(p,x)154gTbσ (mb)
DifferentialYields
mCi/µA⋅h
IntegralYieldsMBq/C
17.87±0.76 122.0±16.01 5.27E+00 3.30E+0016.95±0.72 107.0±14.07 4.72E+00 2.96E+0015.99±0.68 99.00±11.81 4.27E+00 2.64E+0014.99±0.64 80.85±9.65 3.81E+00 2.33E+0013.94±0.59 63.11±7.45 3.31E+00 2.04E+0013.50±0.57 55.77±6.58 2.96E+00 1.76E+0012.87±0.55 47.15±6.29 2.58E+00 1.51E+0012.82±0.54 44.25±5.91 2.34E+00 1.28E+0012.21±0.52 35.78±4.56 2.00E+00 1.06E+0011.63±0.49 26.25±3.34 1.68E+00 8.74E-0111.53±0.49 23.46±2.31 1.42E+00 7.06E-0110.82±0.46 16.24±1.60 1.09E+00 5.63E-0110.34±0.44 13.50±1.61 8.04E-01 4.47E-0110.08±0.43 12.32±1.47 5.82E-01 3.57E-019.29±0.39 12.51±1.81 3.98E-01 2.90E-018.92±0.38 10.62±1.54 3.08E-01 2.40E-018.45±0.36 12.31±1.78 2.76E-01 2.00E-017.55±0.32 3.31±0.48 2.58E-01 1.62E-01

Chapter V
159
5-3.3 The natGd(p,x)154mTb Reaction
The excitation function of the natGd(p,x)154mTb reaction obtained inthis work is shown in Figure (5-10). The production of 154mTb from naturalGd targets, total cross section, and thin, thick yields as a function of protonenergies, data obtained and their estimated errors are tabulated in Table (5-13). The experimental data are compared with the output of EMPIRE-IIcode result. The individual cross sections of the 154Gd(p,n)154Tb,155Gd(p,2n)154Tb, and 156Gd(p,3n)154Tb carried out on natural target, havingQ-values of –4.34, –10.78, –19.32 MeV, respectivily. Our measured crosssection data on the formation of 154mTb are in good agreement with thepredicted cross sections from EMPIRE-II, but ALICE-91 code failed topredict the reaction cross sections, that because ALICE-91 can notdetermine the cross section for isomeric level. EMPIRE-II gives the levelexcitation energy responsible for the 154mTb in two metastable states. Thelower spin state of the first metastable state with spin Jπ (3−), half-life 9.4 h,and the ground state with higher spin Jπ (7−), half-life 22.7 h. The crosssections for the first metastable state with spin Jπ (3−) and half life 9.4 hhave been calculated. EMPIRE-II could enable us to determine theisomeric ratio in comparison with experimental isomeric ratio as shown inFigure (5-11). The Isomeric cross section ratio values for 154gTb/154mTb aretabulated in Table (5-12). Formations of cross-section ratios are obtainedwith dividing the higher spin isomer by the low spin isomer.
0
10
20
30
40
50
60
70
4 6 8 10 12 14 16 18 20 22Proton Energy (MeV)
Cro
ss S
ectio
n (m
b)
This Work
EMPIRE Results
nat Gd(p,x) 154 mTbEth = 4.37 MeV
Figure (5-10): The Excitation Function of the natGd(p, x)154mTb Reaction.

Chapter V
160
Table (5-13). Measured Cross Sections Values for Production of 154mTc,and Isomeric Ratios on Natural Gd Targets at Different Energies.
IncidentEnergy
Ep (MeV)
natGd(p,x)154mTbσ (mb)
IsomericRatiosσg/σm
DifferentialYields
mCi/µA⋅h
IntegralYieldsMBq/C
17.87±0.76 52.50±5.19 2.33 1.34E+01 3.64E+0016.95±0.72 47.50±4.70 2.26 1.28E+01 3.26E+0015.99±0.68 45.00±4.46 2.20 1.19E+01 2.89E+0014.99±0.64 42.50±4.21 1.90 1.09E+01 2.52E+0013.94±0.59 37.50±3.73 1.68 9.89E+00 2.16E+0013.50±0.57 24.27±2.41 2.30 9.21E+00 1.80E+0012.87±0.55 17.97±1.90 2.62 8.27E+00 1.46E+0012.82±0.54 18.20±1.92 2.43 7.44E+00 1.14E+0012.21±0.52 13.43±1.46 2.66 5.91E+00 8.53E-0111.63±0.49 9.84±1.07 2.67 4.18E+00 6.11E-0111.53±0.49 8.04±0.80 2.92 2.84E+00 4.32E-0110.82±0.46 5.36±0.53 3.03 1.83E+00 3.08E-0110.34±0.44 5.08±0.51 2.66 1.24E+00 2.24E-0110.08±0.43 4.35±0.43 2.83 8.79E-01 1.65E-019.29±0.39 3.61±1.25 3.47 6.04E-01 1.21E-018.92±0.38 2.71±0.94 3.92 4.38E-01 8.85E-028.45±0.36 2.54±0.88 4.84 3.13E-01 6.40E-027.55±0.32 0.72±0.25 4.59 2.09E-01 4.55E-02
0
1
2
3
4
5
6
7
8
3 5 7 9 11 13 15 17 19 21Proton Energy (MeV)
Cro
ss S
ectio
n R
atio
s This Work
EMPIRE-II Results
154 gTb / 154 mTb R ti
Figure (5-11): The Isomeric Cross Section Ratios Values for 154gTb/154mTb.

Chapter V
161
5-3.4 The natGd(p,x)155Tb Reaction
The excitation function of the natGd(p,x)155Tb reaction obtained inthis work is shown in Figure (5-12). The total cross section for productionof 155Tb from natural Gd targets, thin and thick yields as a function ofproton energies, data obtained, and their estimated errors are tabulated inTable (5-14). Three reactions contribute to the formation of 155Tb by protonbombardment below 20 MeV on a natural Gd target. There are threenuclear reactions could contribute in the production of 155Tb, the Q-valuesof the reactions 155Gd(p,n)155Tb, 156Gd(p,2n)155Tb, and 157Gd(p,3n)155Tb are–1.60, –10.14 and –16.50 MeV, respectively. The nuclear data (half-life,gamma energy and intensity) were taken from [cf. 4]. The target foils weremeasured after EOB in a well-calibrated geometry of a HPGe detector. Thetwo sets of experimental points show a good agreement in the overlappingenergy region and are also in good agreement with the data resulting fromALICE-91 and EMPIRE-II codes after application of the above discussedenergy scale and beam current corrections. The measured experimentalpoints are shown in Figure (5-12) together with the excitation functionreproduced from the ALICE-91 and EMPIRE-II codes.
5-3.5 The natGd(p,x)156Tb Reaction
The excitation function of the natGd(p,x)156Tb reaction obtained in thiswork is shown in Figure (5-13). Numerical date of the production of 156Tbfrom natural Gd targets, total cross section, and thin, thick yields as afunction of proton energies, data obtained and their estimated errors aretabulated in Table (5-15). In the production of 156Tb only the three protoninduced reactions 156Gd(p,n)156Tb, 157Gd(p,2n)156Tb, and 158Gd(p,3n)156Tbare involved, with Q-values of –3.23, –9.59 and –17.52 MeV, respectively.After evaluating the experimental data of the two irradiated stacks goodagreement was found in the overlapping energy region for the measuredcross sections. The measured experimental points are shown in Figure (5-13) together with the excitation function reproduced from the codescalculations by ALICE-91 and EMPIRE-II.

Chapter V
162
0
10
20
30
40
50
60
70
80
90
1 6 11 16 21Proton Energy (MeV)
Cro
ss S
ectio
n (m
b)
This Work
ALICE Results
EMPIRE Results
nat Gd(p,x) 155 TbEth = 1.61 MeV
Figure (5-12): The Excitation Function of the natGd(p, x)155Tb Reaction.
Table (5-14). Measured Cross Sections Values for Production of 155 Tc, onNatural Gd Targets at Different Energies.
IncidentEnergy
Ep (MeV)
natGd(p,x)155Tbσ (mb)
DifferentialYields
mCi/µA⋅h
IntegralYieldsMBq/C
17.87±0.76 66.24±7.62 9.101E-02 5.78E-0116.95±0.72 65.45±7.53 9.029E-02 5.45E-0115.99±0.68 74.00±8.40 8.753E-02 5.10E-0114.99±0.64 71.25±8.09 8.382E-02 4.75E-0113.94±0.59 68.42±7.74 7.902E-02 4.38E-0113.50±0.57 66.22±7.49 7.683E-02 4.01E-0112.87±0.55 61.80±6.83 7.266E-02 3.64E-0112.82±0.54 57.90±6.40 7.081E-02 3.26E-0112.21±0.52 55.89±6.39 6.498E-02 2.93E-0111.63±0.49 49.45±5.65 5.868E-02 2.57E-0111.53±0.49 45.05±4.81 5.435E-02 2.22E-0110.82±0.46 41.36±4.42 4.695E-02 1.90E-0110.34±0.44 37.35±4.04 4.074E-02 1.60E-0110.08±0.43 31.13±3.36 3.560E-02 1.33E-019.29±0.39 23.77±6.17 2.903E-02 1.09E-018.92±0.38 18.25±4.74 2.424E-02 8.79E-028.45±0.36 15.45±4.01 1.947E-02 6.93E-027.55±0.32 1.05±0.27 1.415E-02 5.36E-02

Chapter V
163
0
20
40
60
80
100
120
3 5 7 9 11 13 15 17 19 21Proton Energy (MeV)
Cro
ss S
ectio
n (m
b)This Work
ALICE Results
EMPIRE ResultsnatGd(p,x) 156 TbEth = 3.25 MeV
Figure (5-13): The Excitation Function of the natGd(p,x)156Tb Reaction.
Table (5-15). Measured Cross Sections Values for Production of 156Tb, onNatural Gd Targets at Different Energies.
IncidentEnergy
Ep (MeV)
natGd(p,x)156Tbσ (mb)
DifferentialYields
MCi/µA⋅h
IntegralYieldsMBq/C
17.87±0.76 47.12±4.69 6.439E-02 4.24E-0116.95±0.72 45.85±4.56 6.165E-02 4.01E-0115.99±0.68 46.71±4.93 5.806E-02 3.77E-0114.99±0.64 48.51±5.12 5.455E-02 3.53E-0113.94±0.59 51.22±5.48 5.104E-02 3.29E-0113.50±0.57 42.73±4.57 4.985E-02 3.04E-0112.87±0.55 41.77±4.26 4.789E-02 2.79E-0112.82±0.54 48.00±4.90 4.790E-02 2.53E-0112.21±0.52 46.28±4.75 4.547E-02 2.28E-0111.63±0.49 42.11±4.32 4.270E-02 2.02E-0111.53±0.49 37.97±3.75 4.119E-02 1.77E-0110.82±0.46 39.93±3.95 3.700E-02 1.52E-0110.34±0.44 27.00±2.68 3.320E-02 1.29E-0110.08±0.43 24.27±2.41 2.977E-02 1.07E-019.29±0.39 22.66±6.51 2.468E-02 8.66E-028.92±0.38 21.00±6.03 2.080E-02 6.83E-028.45±0.36 11.37±3.26 1.683E-02 5.23E-027.55±0.32 0.11±0.03 1.242E-02 3.86E-02
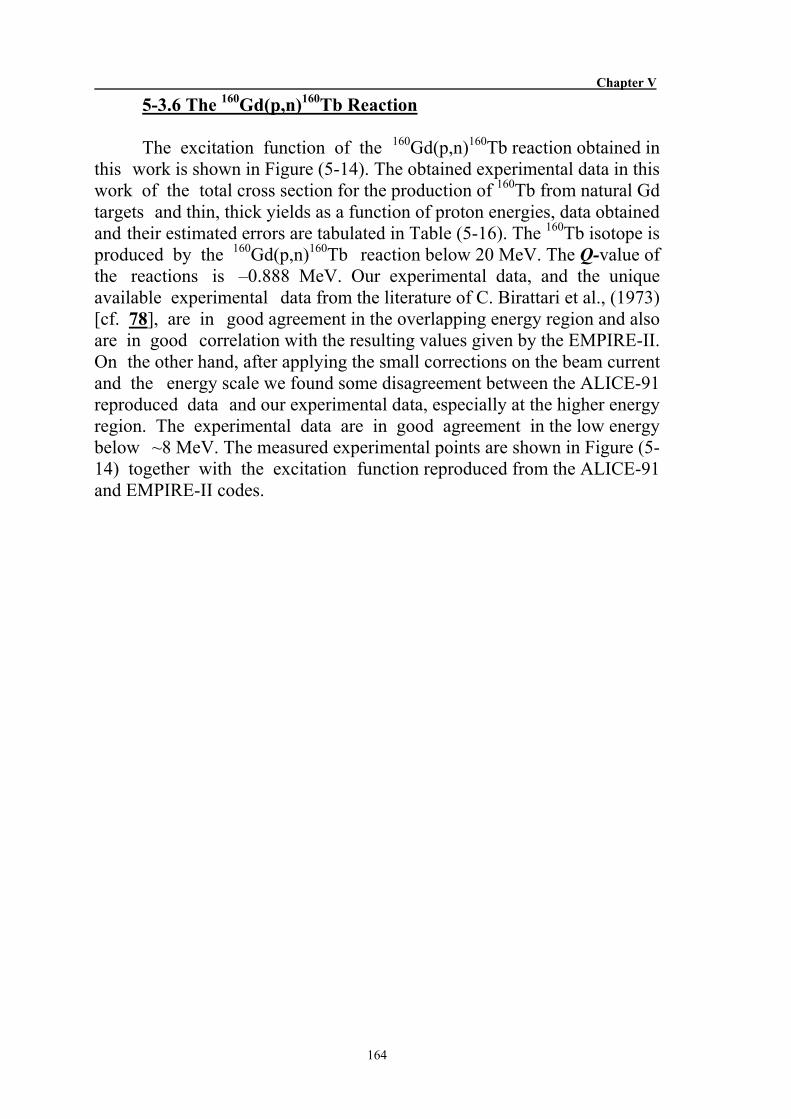
Chapter V
164
5-3.6 The 160Gd(p,n)160Tb Reaction
The excitation function of the 160Gd(p,n)160Tb reaction obtained inthis work is shown in Figure (5-14). The obtained experimental data in thiswork of the total cross section for the production of 160Tb from natural Gdtargets and thin, thick yields as a function of proton energies, data obtainedand their estimated errors are tabulated in Table (5-16). The 160Tb isotope isproduced by the 160Gd(p,n)160Tb reaction below 20 MeV. The Q-value ofthe reactions is –0.888 MeV. Our experimental data, and the uniqueavailable experimental data from the literature of C. Birattari et al., (1973)[cf. 78], are in good agreement in the overlapping energy region and alsoare in good correlation with the resulting values given by the EMPIRE-II.On the other hand, after applying the small corrections on the beam currentand the energy scale we found some disagreement between the ALICE-91reproduced data and our experimental data, especially at the higher energyregion. The experimental data are in good agreement in the low energybelow ~8 MeV. The measured experimental points are shown in Figure (5-14) together with the excitation function reproduced from the ALICE-91and EMPIRE-II codes.
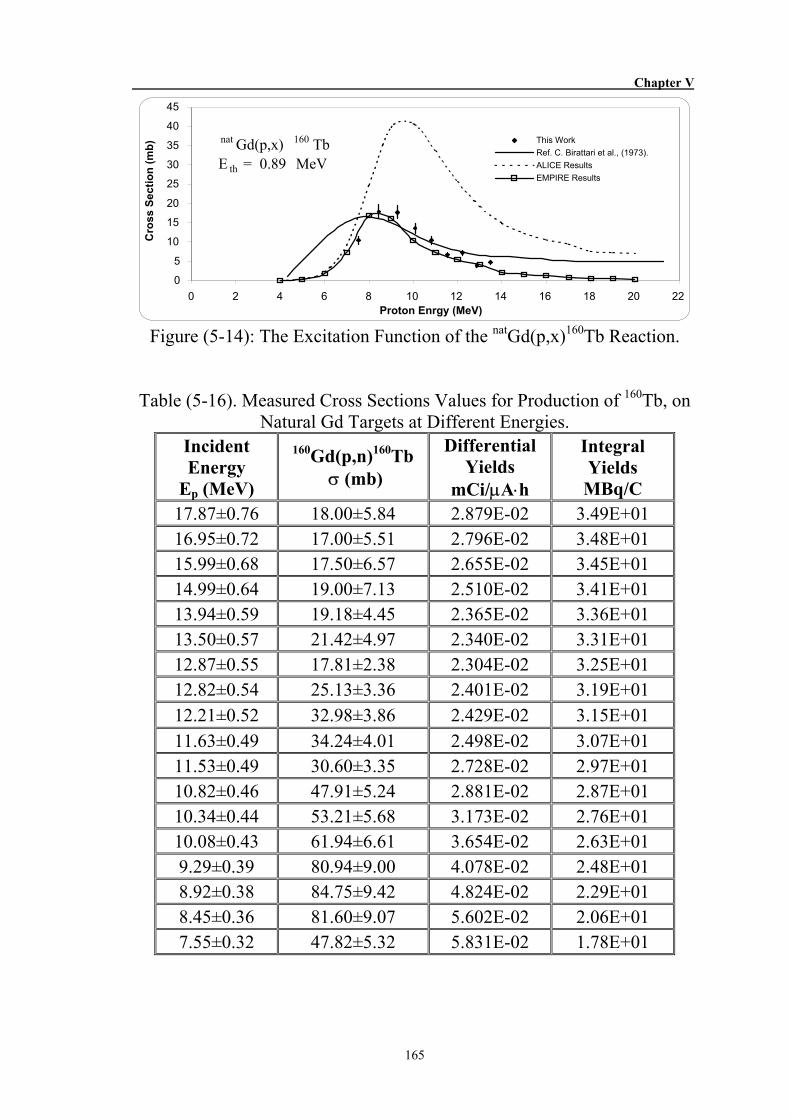
Chapter V
165
0
5
10
15
20
25
30
35
40
45
0 2 4 6 8 10 12 14 16 18 20 22Proton Enrgy (MeV)
Cro
ss S
ectio
n (m
b) This WorkRef. C. Birattari et al., (1973).ALICE ResultsEMPIRE Results
nat Gd(p,x) 160 TbE th = 0.89 MeV
Figure (5-14): The Excitation Function of the natGd(p,x)160Tb Reaction.
Table (5-16). Measured Cross Sections Values for Production of 160Tb, onNatural Gd Targets at Different Energies.
IncidentEnergy
Ep (MeV)
160Gd(p,n)160Tbσ (mb)
DifferentialYields
mCi/µA⋅h
IntegralYieldsMBq/C
17.87±0.76 18.00±5.84 2.879E-02 3.49E+0116.95±0.72 17.00±5.51 2.796E-02 3.48E+0115.99±0.68 17.50±6.57 2.655E-02 3.45E+0114.99±0.64 19.00±7.13 2.510E-02 3.41E+0113.94±0.59 19.18±4.45 2.365E-02 3.36E+0113.50±0.57 21.42±4.97 2.340E-02 3.31E+0112.87±0.55 17.81±2.38 2.304E-02 3.25E+0112.82±0.54 25.13±3.36 2.401E-02 3.19E+0112.21±0.52 32.98±3.86 2.429E-02 3.15E+0111.63±0.49 34.24±4.01 2.498E-02 3.07E+0111.53±0.49 30.60±3.35 2.728E-02 2.97E+0110.82±0.46 47.91±5.24 2.881E-02 2.87E+0110.34±0.44 53.21±5.68 3.173E-02 2.76E+0110.08±0.43 61.94±6.61 3.654E-02 2.63E+019.29±0.39 80.94±9.00 4.078E-02 2.48E+018.92±0.38 84.75±9.42 4.824E-02 2.29E+018.45±0.36 81.60±9.07 5.602E-02 2.06E+017.55±0.32 47.82±5.32 5.831E-02 1.78E+01

Chapter V
166
5-4 Differential, and Integral Yields for Mo, and Gd Targets
From the excitation function curves given in Figures from (5-1) to(5-14), the differential thin target yields for the production of 92mNb, 94Tc,95mTc, 95gTc, 96mgTc, and 99mTc via the natMo(p,x) reactions, and 152Tb,154mTb, 154gTb, 155Tb, 156Tb, and 160Tb via the natGd(p,x) reactions,respectively have been calculated. The differential yields as shown inFigures (5-15), and (5-16) were calculated by assuming the beam current as1 µA and the irradiation time as 1h. The calculated integral thick targetyields as a function of target thickness (in MeV) are shown in Figures (5-17) to (5-28) for the production of 92mNb, 94gTc, 95gTc, 95mTc, 96mgTc, 99mTc,152gTb, 154mTb, 154gTb, 155Tb, 156Tb, and 160Tb, respectively.
The integral yields were calculated by assuming the incident beamcurrent is collecting a charge of value one Coulomb. Whenever, bothactivities per microampere hour or per collected charge of one coulomb areinterrelated. This is a rational quantity, where one can use it to produce aconsiderable amount of activity. Thin target yields deduced from theexcitation fonction for natMo(p,x)92mNb, 94gTc, 95gTc, 95mTc, 96m+gTc, and99mTc processes. The yield of 92mNb, 95gTc, 95mTc, and 96m+gTc is multipliedby factors as shown in Figure (5-15).
0
5
10
15
20
25
30
0 2 4 6 8 10 12 14 16 18Proton Energy (MeV)
Thin
Tar
get Y
ield
(mC
i/ µA
.h)
92mNb*1e+594gTc95gTc*1095mTc*1e+396mgTc*1e+299mTc
Figure (5-15): The Differential Thin Targets Yields for the Production of92mNb, 94Tc, 95mTc, 95gTc, 96mgTc, and 99mTc via the natMo(p,x) Reactions.

Chapter V
167
0.00
2.00
4.00
6.00
8.00
10.00
12.00
14.00
16.00
3 5 7 9 11 13 15 17 19Proton Energy (MeV)
Thin
Tar
get Y
ield
(mC
i/ µA
.h) 152Tb*100
154mTb154gTb155Tb*100156Tb*100160Tb*100
Figure (5-16): The Differential Thin Targets Yields for the Production of152gTb, 154mTb, 154gTb, 155Tb, 156Tb, and 160Tb via the natGd(p,x) Reactions.
Thin target yields deduced from the excitation fonction fornatGd(p,x)152Tb, 154mTb, 154gTb, 155Tb, 156Tb, 160Tb processes. The yields of152Tb, 155Tb, 156Tb and 160Tb are multiplied by 100. Thick target yieldY(E,∆E) is defined as a two parameters function of incident energyE(MeV) on the target and energy loss in the target itself ∆E (MeV).theapproximation of a monochromatic beam of energy E is hold, not affectedby either intrinsic energy spread or straggling. In case of total particleenergy absorption in the target (i.e. energy loss ∆E=E), the functionY(E,∆E) reaches a value Y(E,E-Eth), for ∆E=E-Eth, that representmathematically the envelope of the Y(E,∆E) family of curves. Thisenvelope is a monotonically increasing curve, never reaching either amaximum or a saturation value, even if its slope becomes negligible forhigh particle energies and energy losses. It is obviously that the productionyield of a thick-target does not increase further, if the residual energy in thetarget is lower than the nuclear reaction energy threshold Eth. In practice,the use of a target thickness larger than the “effective” value, is unsuitablefrom technological point of view, due to the larger power density Pd(W/g)deposited by the beam in target material itself, instead of targetcooling system.
The analytical expressions of thick-target yields y(E) wereanalytically and numerically integrated at 0.5 MeV intervals obtaining thefamilies of curves reported in Figures (5-17), and (5-29). In the samepictures, the first and second calculated loci of the maxima of thick-targetyield are represented (the second maximum is present only in some cases).These maxima correspond to couples of optimized values (E, ∆E), havingdifferent values for each different radionuclide.

Chapter V
168
This set of thick-target yields allows calculating the optimumirradiation conditions to have radiotracers with higher radionuclidicpurity as possible. From the present cross section and yield datameasurements we conclude that the optimum energy range for theproduction of selected isotope via the reactions induced by protons onnatural natMo and natGd, the yield values for other ranges can be easilyobtained from Figure (5-15), (5-16). Considering that some laboratorieshaving a small-sized cyclotron with maximum proton energies of 16-18MeV may decide to produce 99mTc locally via this route, It seems to be afeasible option, i.e. a medium energy cyclotron could be used.
0123456789101112
18171615141312111098765Proton Energy (MeV)
∆E
(MeV
)
0
2
4
6
8
10
12
14
Thic
k Ta
rget
Yie
ld (M
Bq/
C )
nat Mo(p,x) 92 mNbEth = 5.61 MeV
Figure (5-17): The Integral Thick Target Yield as a Function of TargetThickness (in MeV) for the Production of 92mNb.
012345678910111213
18171615141312111098765Proton Energy (MeV)
∆E
(MeV
)
0.00.51.01.52.02.53.03.54.04.55.0
Thic
k Ta
rget
Yie
ld (G
Bq/
C )
nat Mo(p,x) 94 gTcE th = 5.09 MeV
Figure (5-18): The Integral Thick Target Yield as a Function of TargetThickness (in MeV) for the Production of 94gTc.

Chapter V
169
0123456789101112
18171615141312111098765432Proton Energy (MeV)
∆E
(MeV
)
0.0
0.5
1.0
1.5
2.0
2.5
3.0
3.5
4.0
Thic
k Ta
rget
Yie
ld (G
Bq/
C)
nat Mo(p,x) 95 g TcE th = 2.5 MeV
Figure (5-19): The Integral Thick Target Yield as a Function of TargetThickness (in MeV) for the Production of 95gTc.
0123456789101112
18171615141312111098765432Proton Energy (MeV)
∆E
(MeV
)
0.0
0.2
0.4
0.6
0.8
1.0
1.2
1.4
1.6
Thic
k Ta
rget
Yie
ld (G
Bq/
C)
nat Mo(p,x) 95 m TcE th = 2.5 MeV
Figure (5-20): The Integral Thick Target Yield as a Function of TargetThickness (in MeV) for the Production of 95mTc.
012345678910111213
181716151413121110987654Proton Energy (MeV)
∆E
(MeV
)
0.0
0.1
0.2
0.3
0.4
0.5
0.6
0.7
0.8
Thic
k Ta
rget
Yie
ld (G
Bq/
C)
nat Mo(p,x) 96 m+g TcE th = 3.79 MeV
Figure (5-21): The Integral Thick Target Yield as a Function of TargetThickness (in MeV) for the Production of 96m+gTc.

Chapter V
170
0.01.02.03.04.05.06.07.08.09.010.0
1817161514131211109876Proton Energy (MeV)
∆E
(MeV
)
0
5
10
15
20
25Th
ick
Targ
et Y
ield
(GB
q/C
)
nat Mo(p,x) 99 m TcE th = 7.79 MeV
Figure (5-22): The Integral Thick Target Yield as a Function of TargetThickness (in MeV) for the Production of 99mTc.
012345678910111213
181716151413121110987654Proton Energy (MeV)
∆E
(MeV
)
0
2
4
6
8
10
12
14
16
18
Thic
k Ta
rget
Yie
ld (G
Bq/
C)
nat Gd(p,x) 152 m+g TbE th = 4.80 MeV
Figure (5-23): The Integral Thick Target Yield as a Function of TargetThickness (in MeV) for the Production of 152m+gTb.
012345678910111213
181716151413121110987654Proton Energy (MeV)
∆E
(MeV
)
0.0
0.5
1.0
1.5
2.0
2.5
3.0
3.5
Thic
k Ta
rget
Yie
ld (G
Bq/
C)
nat Gd(p,x) 154 gTbE th = 4.37 MeV
Figure (5-24): The Integral Thick Target Yield as a Function of TargetThickness (in MeV) for the Production of 154gTb.

Chapter V
171
012345678910111213
181716151413121110987654Proton Energy (MeV)
∆E
(MeV
)
0.0
0.5
1.0
1.5
2.0
2.5
3.0
3.5
4.0
Thic
k Ta
rget
Yie
ld (G
Bq/
C)
nat Gd(p,x) 154 m TbE th = 4.37 MeV
Figure (5-25): The Integral Thick Target Yield as a Function of TargetThickness (in MeV) for the Production of 154mTb.
0123456789101112
181716151413121110987654332Proton Energy (MeV)
∆E
(MeV
)
0.0
0.1
0.2
0.3
0.4
0.5
0.6
Thic
k Ta
rget
Yie
ld (G
Bq/
C)
nat Gd(p,x) 155 TbE th = 1.61 MeV
Figure (5-26): The Integral Thick Target Yield as a Function of TargetThickness (in MeV) for the Production of 155Tb.
0123456789101112
1817161514131211109876543Proton Energy (MeV)
∆E
(MeV
)
0.00
0.05
0.10
0.15
0.20
0.25
0.30
0.35
0.40
0.45
Thic
k Ta
rget
Yie
ld (G
Bq/
C)
nat Gd(p,x) 156 TbE th = 3.25 MeV
Figure (5-27): The Integral Thick Target Yield as a Function of TargetThickness (in MeV) for the Production of 156Tb.

Chapter V
172
012345678910111213
1817161514131211109876543321Proton Energy (MeV)
∆E
(MeV
)
0
5
10
15
20
25
30
35
40Th
ick
Targ
et Y
ield
(MB
q/C
)
nat Gd(p,x) 160 TbE th = 0.89 MeV
Figure (5-28): The Integral Thick Target Yield as a Function of TargetThickness (in MeV) for the Production of 160Tb.
5-5 Calibration Curves for Thin Layer Activation Technique
For investigation of wear, corrosion or erosion the thin layeractivation (TLA) technique is a very useful method. The technique isbased, on the control of the removed surface layer through measurement ofits radioactivity. The knowledge of the distribution of the radioactivity as afunction of the depth (so-called, calibration curve) is essential. Theradioactivity is generally produced directly in the investigated sample.Reliable cross-section data play important rule for determination of thecalibration curves. The application of nuclear data accelerates significantlythe determination of the calibration curves or to select the proper primarybombarding energy particle to assure constant, well known activitydistribution in the investigated volume of the samples. Various applicationsrequire different activation profile, which can be fulfilled with differentnuclear reactions, different bombarding beams and different, primaryenergies. In such a way “the induced reaction play important role in theseapplications. In most TLA studies on Cu the proton induced reactions playmore important role, compared with other charged particle reactions. Theavailability of the proton is broader, and the yield of the natCu(p,x)65Znreaction is high. TLA is frequently used for copper, which is an importantbasic material of many tools and basic component of different alloys. Thehalf-life of 65Zn is usually used, the production yield of 65Zn is inconsiderable amount, suitable for TLA studies. In Figure (5-29), we presentthe integral thick target yield for natMo(p,x)96Tc reaction based on thepresent measurement in comparison with the other literature data reportedby M. Bonardi et al., (2002); S. Takacs et al., (2002) [cf. 3,86].

Chapter V
173
05
101520253035404550
3 5 7 9 11 13 15 17 19Proton Energy (MeV)
Act
ivity
(MB
q/µ
A.h
) This WorkS. Takacs et al (2002)M. Bonardi et al (2002)
Figure (5-29): Presents the Integral Thick Target Yield for natMo(p,x)96TcReaction in Comparison with the other Literature Data.
Comparing the three curves one can conclude that the yieldscalculated here are lower than the previously cited ones. Due to the suitableproduction and decay parameters of 96Tc using the TLA method caneffectively use it as tracer isotope for wears measurement of constructionelements of different structures with Mo contents. The activity distributionas function of the penetrating depth of the proton beam is shown in Figure(5-30). The calibration curve calculated from our cross-section data isshown in Figure (5-30) in comparison with the calibration curve taken fromthe database of the M. Bonardi et al., (2002); S. Takacs et al., (2002) [cf.3,86]. As it is seen in Figure (5-30), the comparison was made at threedifferent proton-bombarding energies (18, 14 and 10 MeV). The curvesexhibit some disagreement with M. Bonardi et al., (2002) [cf. 3]. At lowenergy the solid curve calculated from our data is lower in amplitude, whileat higher energy the ratio is opposite, which is not surprising taking intoaccount the above mentioned method, and original database.

Chapter V
174
05
101520253035404550
1 101 201 301 401 501 601 701Depth (µm)
Act
ivity
(MB
q/µA
.h) This Work
S. Takacs et al (2002)M. Bonardi et al (2002)
Ep= 18 MeV
0
5
10
15
20
25
30
35
40
1 51 101 151 201 251 301 351 401 451Depth (µm)
Act
ivity
(MB
q/µ
A.h
)
This Work
S. Takacs et al (2002)
M. Bonardi et al (2002)
Ep= 14 MeV
0
5
10
15
20
25
30
1 51 101 151 201 251Depth ( µ m)
Act
ivity
(MB
q/µ
A.h
)
This Work
S. Takacs et al (2002)
C. Bonardi et al (2002)
Ep= 10 MeV
Figure (5-30): The Activity Distribution for natMo(p,x)96Tc Reaction as aFunction of the Penetrating Depth of the 18, 14, and 10 MeV Bombarding
Proton Beam Calculated for Mo Using the Fitted Cross Sections of thisWork in Comparison with other Literature Data.

Chapter V
175
5-6 Discussion
5-6.1 Influence of Secondary Particles
The study presented here includes measurement of most nuclear datainduced by proton on natural Mo, Gd. All nuclear reactions considered areendoergic, with negative Q-values, thus the calculated energy threshold forthe different proton induced reactions Tables (2-3), (2-4) were also takeninto account, imposing a yield value equal to zero.
While measuring the natMo(p,2n)99mTe reaction cross section, acontribution via the 100Mo(p,pn)99Mo → 99mTc process to the count rate of99mTc had to be subtracted. Two methods could possibly be used to applythis correction: (a) via a calculation using the fitted excitation curve of the100Mo(p,pn)99Mo reaction. or (b) individual correction for each γ-raymeasurement of 99mTc via the independently determined 100Mo-activity(using the two above-mentioned γ-lines in the same sample). We decided tocorrect the count rates of 99mTc via the second method. This was moretedious but reduced the individual error caused by the uncertainties in thearea weight of the sample and the detector efficiency.
While studying the 98Mo(p,γ)99mTc reaction, account had to be takenof the two strong reactions on 100Mo leading to the formation of 99mTc (i.e.100Mo(p,2n)99mTc and 100Mo(p,pn)99Mo→99mTc, one reaction leads to 90Nbthrough natMo(p,x)-process. However, a correction was also needed for thefirst count due to the contribution of the 141.2 keV (66.7%) photons fromthe decay of 90Nb (14.6 h). After an elapsed time >170 h to allow for thedecay of the directly produced 99mTc (6.02 h), and of the 90Nb (14.6 h)radioactivities. A second radioassay was conducted to measure the directproduction of the longer-lived 66 h 99Mo parent. A correction in the countrate was therefore applied for the low 98Mo(p,γ)99mTc content due to itsvery low cross section, using the measured cross sections of the twocontributing processes, since the irradiation of natural Mo. The counts ratecorrections had large errors since large numbers had to be subtracted fromeach other, it should be mentioned that the 98Mo(p,γ)99mTc reaction, theobserved count rates of 99mTc were anyway rather low. So we used therevealed data reported by Scholten et al., (1999) [cf. 44] to correct itscontribution.
It has to be considered, that in the 98Mo sample secondary neutronscan also produce 99Mo via the 100Mo(n,2n)99Mo, 98Mo(n,γ)99Mo→99mTc,

Chapter V
176
and 98Mo(p,γ)99mTc reactions. However, no corrections were applied forsome of these possible contributions due to the following three reasons:
1. The Q-value of the 100Mo(n,2n)99Mo reaction is highly negative (−8.0MeV). The secondary neutron spectrum produced in the interaction ofprotons with the four elements encountered in each stack Ti, Al, Cu andMo would have the maximum intensity at 2-4 MeV and a tail extendingalmost up to the maximum energy of the incident protons. However,since low proton beam currents were used and the stacks were ratherthin, the intensity of the high energy neutrons would be very low andthus the contribution of the 100Mo(n,2n)99Mo process to the totalformation of 99Mo infinitesimally is small.
2. The cross section of the 98Mo(p,γ)99mTc reaction in the MeV region isonly a few mb as mentioned by McLane et al., (1988) [cf. 167].
3. In highly enriched 98Mo irradiated with protons carried out by Scholtenet al., (1999) [cf. 44], and the radioisotope 99Mo was definitelyobserved. However, the calculated contribution from the100Mo(p,pn)99Mo reaction on the small amount of 100Mo present in the98Mo sample was very nearly equal to the measured 99Mo activity asreported by Scholten et al., (1999) [cf. 44].
4. The contribution arising from the reactions induced by secondaryneutrons was thus, possibly originate from the difference in the casebetween the use of isotopically enriched or natural targets, where theproduction of neutron secondary particles, its built up is appreciablemay induce another indirect reactions such as 98Tc(n,γ)99mTc. So wecould not push it within the limits of experimental errors.
5-6.2 Trends in Integral Cross Sections
By simultaneous measurement of the excitation curves using multimonitor reactions giving a fair reproduction of the recommended crosssection values in the whole energy range covered, in spite of it is true forsome cases. We can not look at it as a global view. This implies many ofdeviations in the other cases, originated from many causes. The use of oneor more monitor attached to sample let us must make a comprehensiveunderstand for the relation could be generate between both, in theirresponse to the incident beam, profile of excitation functions belong toeach one for monitor (known) for sample (unknown). The change inthresholds between both in the interest energy range. For approximation,looking at monitor as an infinitesimal laminar could not affect anyinteractions carried around originate from itself, it represent only adetector. But, we can not extreme the effect of the surroundings on it thatcould be change its detect value.

Chapter V
177
In some cases the sample is sensitive to the primary beam as well asejected secondary beam. As we recognized in molybdenum, we stronglybelieve that our cross-section data measured on Mo have the samereliability as that measured on enriched samples by taking into account theeffect of the secondary beam that elevate the output results. Therefore,results were checked for the multi-monitor reactions we used in this workand the data calculated with inter-consistent flux were found to be higherthan the recommended values by 12-26% (in average 20%) around themaximum of the excitation function. Beside of using multi monitors todetect the primary incident beam we generate the effective incident beamvalue through correction operator for flux, considering the neutroninteraction properties of the sample introduced using experimental resultsor using theoretical model codes. That giving a glance for the neutronproduction, transmission and the value added to the currently incidentproton beam.
The short half-life of the 63Zn isotope could lead to high sampleactivity, overloading the detector system or improper dead time correctionand giving too low activity values. Also a slight energy shift can beobserved for the three-excitation functions toward lower energies.Accepting the average with a good agreement between the published dataset and our results. Detailed analyses were made on the most frequentlyused monitor reactions for proton beams, among them are the natTi(p,x)48V,natCu(p,x)63Zn, and natCu(p,x)65Zn processes.
The cross-section of the 96Nb producing process is however small.Improper waiting time or an incomplete separation of its contribution incalculating 96mgTc could cause only minor error in the resulting cross-section of the 96mgTc process.
We used ALICE-91, and EMPIRE-II (statistical and pre-equilibriummodel) to predict the production of 99Mo by proton induce reaction from100Mo. The codes were used to calculate the excitation functions for protoninduced reactions on 100Mo that led to the production of Nb, Mo and Tcisotopes. The codes predicts a maximum cross section of the order of 100mb for the 100Mo(p,pn)99Mo nuclear reaction. The ALICE-91 code cannotbe used to predict the cross sections for the isomeric states for the 100Mo(p,2p)99m+gNb→99Mo reactions. However, the predicted cross section forprotons on 100Mo to yield 99Nb suggests that the (p,2p) reaction channeldoes not contribute significantly to the thick target yield of 99Mo.
Chapter V
178
5-6.3 Prospective for Fluence Response Modeling
The treatment advanced in this work is built on a number ofassumptions. For the sake of providing a focus the main assumptions aresummarized below.
1. Proton interaction is predominantly Coulomb scattering.
2. The recoil neutrons for a given proton energy, Ep, are mono-energetic. (The value of the neutron energy, E, is taken to be equal tothe maximum-kinetic energy the recoil neutron can possess). Willsuppose also the generated neutron will have nearly the same energyand vector motion as the primitive beam generate it. So will consideronly for succeeding processes after generation.
3. The cross section for the production of neutrons used in thesecalculations is a certain energy-weighted component of the productioncross section. It also enables us to use a pseudo-recoil neutron beamparallel to the incident proton beam, which simplifies the treatment.
4. The integration or takings into account the sum of two contributingformulae for discrete energetic protons and (wide) range neutrons,also for single target foil and subsequent successive foils constitute thestacked foils.
5. We faced with an angular deviation due to a specific account issuffered by a neutron due to multiple and plural scattering through thetarget material. Our deal now arranged to determine the effective fluxthrough probability response function. The deviation from thestraight-ahead direction due to the scattering of recoil neutrons fromthe sample atoms is assumed to takes place along one direction,namely that corresponding to the mean angle of scattering in the limitof large numbers of collisions.
6. The assumption that the approximately linear relations betweenincident projectile energy using certain target foil, the (p,n) crosssection results remaining essentially constant with energy is invalid.The energy dependence of this cross section over the energy range ofinterest is essential. So, integration over the energy range involved incalculation over all energy range. The net response in turn will bedependent on the energy.

Chapter V
179
7. The energy spread in the incident beam will be neglected. Allrelevant quantities to head-on projections for incident proton, whichwe shall call the axial approximation. The effective region of thesample for a given Ep is bounded by lines originating from points onthe sample axis. The mean scattering angle and the range in samplegive the direction and length of the line. Edge effects are neglected inthat the volume of the effective region is taken to be independent ofthe location at which the recoil neutron is produced.
8. We gave a systematic development of the probability functionrelating to the production process, transmission of targeted neutrons.
We can conclude from these assumptions that, we bind some ofcorrecting errors to be originated from all counting techniques. Thoseretrieve the correction factor as a shift in the overall efficiencies of thedetecting system. To attain what so called, effective efficiency, now byintroducing the theory of fluence response model as a convenient tool todescribe the flux through the stacked foils. It seem to be representing anefficient method, we can condsider it as a proportional constant thatconnect the measured activity to measured flux. This constant represent theprobability response function for all processes contribute in it. So the overall correction seem to be as a multiplying of all the probabilities, theproduct is the proportional constant of the detection efficiency.
The extent and validity of these assumptions have been discussed inthe appropriate previous sections. The refinement or rather the eliminationof most of these assumptions must form the next stage of the fluenceresponse function calculations. Such a modification is expected to increasethe absolute flux accuracy, finally the measured cross sections.
5-7 Conclusion
1. Up to our best knowledge the obtained data for Gd are the first. Allnuclear reactions considered are endoergic, with negative Q-values.
2. The contributions in the measuring reaction cross section due tosecondary particle processes to the count rate have to be considered.
3. Two strong reactions on 100Mo leading to the formation of 99mTc (i.e.100Mo(p,2n)99mTc, 100Mo(p,pn)99Mo→99mTc), and one reaction leads to90Nb through natMo(p,x)-process which gives the same γ-lines.

Chapter V
180
4. A correction was also needed for the first count due to the contributionof the 141.2 keV (66.7%) photons from the decay of 90Nb (14.6 h). Afteran elapsed time >170 h to allow for the decay of the directly produced99mTc (6.02 h), and of the 90Nb (14.6 h) radioactivities.
5. Secondary neutrons could produce 99mTc via the100Mo(n,2n)99Mo→99mTc, 98Mo(p,γ)99mTc. However, no possiblecontribution due to the following reasons. The Q-value of the100Mo(n,2n)99Mo reaction is highly negative (−8.0 MeV). The crosssection of the 98Mo(p,γ)99mTc reaction in the MeV region is only a fewmb as mentioned by McLane et al., (1988).
6. Multi-monitor reactions giving a fair reproduction of the recommendedvalues in the whole energy range covered.
7. ALICE-91, and EMPIRE-II were used to calculate the excitationfunctions for proton induced reactions on natMo, and natGd. TheEMPIRE-II code could be used to predict the cross sections for theisomeric states. However, ALICE-91 not.
8. The response function probability for all processes contributing inradionuclide production is a convenient tool to account the elevation inthe measured activity.

References
181
References:
1- International Atomic Energy Agency, Vienna, Austria. TECDOC-1211,(2001).2- Pierre Marmier, Eric Sheldon, “Physics of Nuclei and Particles”,Laboratory of Nuclear Physics, Vol. I, Federal Institute of Technology,Zurich, Switzerland, Publisher Academic Press, New York, (1969).3- Mauro Bonardi, Claudio Birattari, Flavia Groppi, Enrico Sabbioni,“Thin-Target Excitation Functions, Cross-Sections and Optimized Thick-Target Yields for natMo(p,xn)94g,95m,95g,96(m+g)Tc Nuclear Reactions Inducedby Protons from Threshold up to 44 MeV. No Carrier AddedRadiochemical Separation and Quality Control”, Appl. Radiat., and Isot.57, 617–635, (2002).4- R.B. Firestone, C.M. Baglin, F.S.Y. Chu, and J. Zipkin, “Table ofIsotopes”, 8th Edition, Vols. I and II. Wiley, New York, (1996); R.B.Firestone, C.M. Baglin, and F.S.Y. Chu, “Table of Isotopes”, 8th Edition.Update on CD-ROM. Wiley, New York, (1998).5- S.M. Qaim, in the proceeding of the Second Conference and Workshopon Cyclotrons and Applications, Cairo, EGYPT, p.p. 202, March (1997)6- S. M. Qaim, Institut für Chemie 1 (Nukiearchemie),Kernforschungsanlage Julich GmbH, D-5170 Julich, Federal Republic ofGermany, “Nuclear Data Relevant to Cyclotron Produced Short-LivedMedical Radioisotopes”, Radiochimica Acta 30, 147-162 (1982).7- L.M. Freeman (ed.), Freeman and Johnsons “Clinical RadionuclideImaging”, 3rd edition., Grune & Stratton, USA, (1984).8- H. Vera Ruiz, Report of an International Atomic Energy Agency'sConsultants' Meeting on Fluorine 18: Reactor Production and Utilization,Appl. Radiat. Isot. 39, 31-39, (1988); H. Vera Ruiz (ed.), “Summary Reporton the Research Co-ordination Meeting of the Co-ordinated ResearchProject on “Standardized High Current Solid Targets for CyclotronProduction of Diagnosis and Therapeutic Radionuclides”, Brussels,Belgium, 27-30 Sep., (2000).9- D.J. Silvester, “Radioisotope Production: An Historical Introduction, InRadionuclides Production”, vol. I (Eds. F. Helus and L. G. Colombetti),CRC Press, Inc., Florida, (1983).10- H.O. Anger, “Scintillation Camera”, Rev. Sci. Instr., 29, 27-33, (1958).11- R.E. Boyd, “Molybdenum-99/Technetium-99m Generator”,Radiochim. Acta 30, 123-145, (1982).12- R.E. Boyd, “The Special Position of 99mTc in Nuclear Medicine, InRadionuclides Production”, vol. II (Eds. F. Helus and L. G. Colombetti),CRC Press, Inc., Florida (1983).13- P.O. Denzler, P. Rosch, and S.M. Qaim, “Excitation Functions of α-Particle Induced Nuclear Reactions on Highly Enriched 92Mo Comparative

References
182
Evaluation of Production Routes for 99mTc”. Radiochimica Acta. 68: 13-20, (1995).14- O. Solin, Ph.D. Thesis, “Interaction of High Energy Charged Particleswith Gases”, Acta Academia Aboensis, Ser. B, Vol., 48, No. 2, (1988).15- S.M. Qaim, A. Hohn, Th. Bastian, K.M. El-Azoney, G. Blessing, S.Spellerberg, B. Scholten, H.H. Coenen, "Some Optimization StudiesRelevant to the Production of High-Purity 124I and l22gI at a Small-SizedCyclotron", Appl. Radiat. Isot. 58, 69-78, (2003).16- J. Solin, A. Bergman, M. Haaparanta and A. Reissell, “Production of18F from Water Targets. Specific Radioactivity and AnionicContaminants”. Appl. Radiat. Isot. 39, 1065-1071, (1988).17- S.M. Qaim, “Target Development for Medical Radioisotope Productionat a Cyclotron”, Nucl. Instr. and Meth. A 282, 289-295 (1989); S. Zeister,and F. Helus (Eds), Proceedings of the Seventh Workshop on Targetry andTarget Chemistry (WTTC97), DKFZ Press Dept. Heidelberg, Germany,June 8-11, (1987).18- S. Spellerberg, P. Reimer, G. Blessing, H.H. Coenen, S.M. Qaim,“Production of 55Co and 57Co via Proton Induced Reactions on HighlyEnriched 58Ni” Appl. Radiat. Isot. 49, 1519-1522, (1998).19- K. Gul, A. Hermanne, M.G. Mustafa, F.M. Nortier, P. Oblozinsky,S.M.Qaim, B. Scholten, Yu. Shubin, S. Takacs, T.F. Tarkanyi, Y. Zhuang,“Charged-Particle Cross Section Database for Medical RadioisotopeProduction” IAEA-TECDOC-1211, IAEA, Vienna, Austria (2001).20- Donald J. Hughes, “Neutron Cross Section”, Brookhaven NationalLaboratory, and Published by Pergamon Press, London, (1957).21- Moazzem Hossein Maih, Jochen Kuhnhenn, Ulrich Herpers, RolfMichel, Peter Kubik, “Production of Residual Nuclides by Proton InducedReactions on Target W at an Energy of 72 MeV”, J. of Nucl. Sci. Tech.,Supplement 2, p. 369-372, (2002).22- R. Michel, R. Bodemann, H. Busemann, R. Daunke, M. Gloris, H. J.Lange, B. Klug, A. Krins, I. Leya, M. Lupke, S. Neumann, H. Reinhardt,M. Schhatz-Buttgen, U. Herpers, Th. Schiekel, F. Subdrock, B. Holmqvist,H. Conde, P. Malmborg, M. Suter, B. Dittrich-Hannen, P. W. Kubik, andH. A. Synal. Nucl. Instr. and Meth. B, 129, 153, (1997).23- S.M. Qaim, “Activation Cross Sections, Isomeric Cross Sections Ratiosand Systematics of (n,2n) Reactions at 14-15 MeV”. Nucl. Phys.A185:614-624, (1972)..24- Y. Nagame, S. Baba, and T. Saito, “Isomeric Yield Ratios for the95Mo(p,n)95m,gTc Reaction”, Appl. Radiat. Isot., Vol. 45, No. 3, pp. 281-285, (1994).25- P.G. Young, and E.D. Arthur, “GNASH: Pre-Equilibrium StatisticalNuclear Model Code for Calculations of Cross Sections and EmissionSpectra”. Report No. LA-6947. Los Alamos Scientific Laboratory, (1977).

References
183
26- M. Bonardi, "The contribution to nuclear data for biomedicalradioisotope production from the Milan Cyclotron Laboratory", DataRequirements for Medical Radioisotope Production, Proc. Consultants MtgTokyo, Japan, 1987 (K., Okamoto ed.), Rep. INDC(NDS)-193, IAEA,Vienna (1988).27- J.F. Ziegler, “SRIM 2003 code, SRIM.com, 1201 Dixona Dr.,Edgewater, 21037, USA, available from www.SRIM.org, (2003).28- P.P. Dmitriev, “Radionuclide Yield in Reactions with Protons,Deuterons, Alpha Particles and Helium-3” (Handbook), Moscow,Energoatomizdat, 1986; Rep. INDC(CCP)-263, IAEA, Vienna (1986).29- M. Blann, NEA Data bank, France, Report PSR-146, (1991); M. Blann,“Calculation of Excitation Functions with Code ALICE”. In K. Okamoto,(Ed.), INDC(NDS)-195/GZ. International Atomic Energy Agency, Vienna,(1988).30- M. Herman, “EMPIRE-II Statistical Model Code for Nuclear ReactionCalculations”, Version 2.19 (Londi), IAEA, Vienna, Austria, March,(2005). Available from: http://www-nds.iaea.org/empire/, (2005).31- D. Tucker, M.W. Greene, A.J. Weiss, A. Murrenhoff, “Methods ofPreparation of some Carrier-Free Radioisotopes Involving Sorption onAlumina”. Report BNL-3746, BNL, Upton, NY, (1958).32- R. Powell, J. Steigman, Technetium. In: G. Subramanian, B.A. Rhodes,J.F. Cooper, V.J. Sodd, (Eds.), “Radiopharmaceuticals”. The Society ofNuclear Medicine Inc., USA, pp. 21-70, (1975).33- R.E. Boyd, “The Special Position of 99gTc in Nuclear Medicine”. In: F.Helus, (Ed.), Radionuclides Production, Vol., II, CRC Press, Boca Raton,FL, pp. 125-152, (1983).34- R.J. Nickles, B.T. Christian, C.C. Martin, A.D. Nunn, C.K. Stone, “Tc-94m Radionuclidic Purity Requirements for Pharmacokinetic Studies withPET”. J. Nucl. Med. 32, 850, (1991).35- R.J. Nickles, A.D. Nunn, C.K. Stone, S.B. Perlman, R.L. Levine, “Tc-94m Flow Agents: Bridging PET and SPECT”. J. Nucl. Med. 32, 925,(1991).36- R.J. Nickles, B.T. Christman, A.D. Nunn, C.K. Stone, “CyclotronProduction of High-Purity Tc-94m by in situ Sublimation”. Proceedings ofthe 9th ISRC, Paris, pp. 447-448, (1992).37- M. Sajjad, and R.M. Lambrecht, “Cyclotron Production of MedicalRadionuclides”. Nucl. Instr. Meth. B 79, 911-915, (1993).38- M. Faβbender, A.F. Novgorodov, F. Roesch, and S.M. Qaim,“Excitation Functions of 93Nb(3He,xn)93m,g,94m,g,95m,gTc-Processes fromThreshold up to 35 MeV: Possibility of Production of 94mTc in HighRadiochemical Purity Using a Thermo-Chromatographic SeparationTechnique. Radiochim. Acta 65, 215-221, (1994).

References
184
39- F. Roesch, and S.M. Qaim, “Nuclear Data Relevant to the Productionof the Positron Emitting Technetium Isotope 94mTc via the 94Mo(p,n)-Reaction”. Radiochim. Acta 62, 115-121, (1993).40- F. Roesch, A.F. Novgorodov, and S.M. Qaim. “Thermo-Chromatographic separation of 94mTc from Enriched Molybdenum Targetsand its Large Scale Production for Nuclear Medical Application”.Radiochim. Acta 64, 113-120, (1994).41- F.O. Denzler, F. Roesch, and S.M. Qaim, “Excitation Functions of α-Particle Induced Nuclear Reactions on Highly Enriched 92Mo: ComparativeEvaluation of Production Routes for 94mTc”. Radiochim. Acta 68, 13-20,(1995).42- J. Rojas-Burke, “The Future Supply of Molybdenum-99”. Newsline J.Nucl. Med. 36, 15N, (1995).43- ALASBIN. XI Congress of the Latinamerican Association of Biologyand Nuclear Medicine (ALASBIN). Santiago, Chile October 8-11, (1989).44- Bernhard Scholten, Richard M. Lambrecht, Michel Cogneau, HernanVera Ruiz, and Syed M. Qaim, “Excitation Functions for the CyclotronProduction of 99mTc and 99Mo” Appl. Radiat. Isot., 51, 69-80, (1999).45- “Reaction Q-values, and Thresholds”, Los Alamos NationalLaboratory, T-2 Nuclear Information Service. Available from<http://t2.lanl.gov/data/qtool.html>, (2005).46- J.E. Beaver, H.B. Hupf, “Production of 99mTc on a Medical Cyclotron:a Feasibility Study”. J. Nucl. Med. 12, 739, (1971).47- G.L. Almeida, F. Helus, “On the Production of 99Mo and 99mTc byCyclotron”. Radiochem. Radioanal. Lett. 28, 205, (1977).48- R.M. Lambrecht, S.L. Waters, H. Lu, S.M. Qaim, H. Umezawa, G.J.Beyer, H. Heinzl, M. Bonardi, T. Nozaki, A. Hashizume, M.C. Lagunas-Solar, K. Kitao, and D. Berenyi, “Summary of Conclusions andRecommendations of Working Group I: Experimental Data. In: Okamoto,K. (Ed.), Consultants' Meeting on Data Requirements for MedicalRadioisotope Production, Tokyo, Japan, (1987). Report INDC (NDS)-195/GZ. IAEA, Vienna, pp. 13-16, (1988).49- M.C. Lagunas-Solar, P.M. Kiefer, O.F. Carvacho, C.A. Lagunas, Ya PoCha, “Cyclotron Production of NCA 99mTc and 99Mo. An Alternative Non-Reactor Supply Source of Instant 99mTc, and 99Mo→99mTc Generators”.Appl. Radiat. Isot. 42, 643, (1991).50- M.C. Lagunas-Solar, “Production of 99mTc and 99Mo for NuclearMedicine Applications via Accelerators as an Option to Reactor Methods”.Presented at the 18th Annual Conference of the Australian RadiationProtection Society. University of Sydney, Sydney, NSW, Australia, Oct. 6-8, (1993).

References
185
51- N. Levkowski, “Middle Mass Nuclides (A=40-100) Activation CrossSections by Medium Energy (E=10-50 MeV) Protons and α-Particles(Experiment and Systematics)’. Inter-Vesti, Moscow, pp. 215, (1991).52- H. Schopper, (Ed.), In: O. Madelung, (Ed.), Landolt Bornstein,Numerical Data and Functional Relationships in Science and Technology,Group I: Nuclear and Particle Physics, vol. 13: “Production ofRadionuclides at Intermediate Energies, Sub-vol. (b): “Interactions ofProtons with Targets from Kr to Te”. Springer Verlag, Berlin, pp. 286,(1993).53- H.P. Graf, and H. Muenzel, “Excitation Functions for α- ParticleReactions with Molybdenum Isotopes”. J. Inorg. Nucl. Chem. 36, 3647-3657, (1974).54- Z. Randa, and K. Svoboda, “Excitation Functions and Yields of (d,n)and (d,2n) Reactions on Natural Molybdenum”. J. Inorg. Nucl. Chem. 38,2289-2295, (1976).55- I.N. Vishnevskil, V.A. Zheltonozhskil, and T.N. Lashko,“Measurement of the Isomeric Ratios for the Isotopes 93,94Tc in ReactionsInduced by Protons and α-Particles”. Sov. J. Phys. 41, 910-912 (Englishtranslation from Yad. Fiz. 41, 1435-1439, (1985).56- R.M. Lambrecht, and S.M. Montner, “Production and RadiochemicalSeparation of 92Tc and 93Tc for PET”. J. Labeled Compd. Radiopharm. 19,1434-1435, (1982).57- R. Finn, T. Boothe, J. Sinnreich, E. Tavano, A. Gilson, and A.P. Wolf,“Ancillary Cyclotron Production of Technetium-95m for Clinical andChemical Research”. Radiopharmaceuticals and Labeled Compounds1984, (1985); IAEA-CN-45/22, IAEA, Vienna, Austria, pp. 47-54, (1985).58- M.C. Lagunas-Solar, R.P. Haff, “Theoretical and ExperimentalExcitation Functions for Proton Induced Nuclear Reactions on Z=10 toZ=82 Target Nuclides”. Radiochim. Acta 60, 57-67, (1993).59- J.J. Hogan, “96Mo(p,xn) Reaction from 10 to 80 MeV”. Phys. Rev. C 6,810-816, (1972).60- J.J. Hogan, “Isomer Ratios of Tc Isotopes Produced in 10-65 MeVBombardments of 96Mo”. J. Inorg. Nucl. Chem. 35, 705-712, (1973).61- J.J. Hogan, “Comparison of the 94Mo(p,n)94m,gTc and 96Mo(p,n)96m,gTcReactions”. J. Inorg. Nucl. Chem. 35, 2123-2125, (1973).62- E.A. Shakun, V.S. Batii, Yu.N. Rakivnenko, and O.A. Rastrepin,“Excitation Functions and Isomeric Ratios for the Interaction of Protons ofLess than 9 MeV with Zr and, Mo Isotopes”. Sov. J. Nucl. Phys. 46, 17-24(English translation from Yad. Fiz. 46, 28-39, (1987).63- M. Izumo, H. Matsuoka, T. Sorita, Y. Nagame, T. Sekine, K. Hata, andS. Baba, “Production of 95mTc with Proton Bombardment of 95Mo”. Appl.Radiat. Isot. 42, 297-301, (1991).

References
186
64- L. Lakosi, J. Safar, A. Vertes, T. Sekine, and K. Yoshihara,“Photonuclear Reactions of 99Tc, Isomer Excitation Functions andDeexcitation, Implications in Nucleosynthesis”. Radiochim. Acta 63, 23-28, (1993).65- T. Sekine, K. Yoshihara, J. Safar, L. Lakosi, A. Vertes. “95Tc, and 96TcProduction by (γ,xn) Reactions”. J. Radioanal Nucl. Chem. 186, 165-174,(1994).66- N.G. Zaitseva, E. Rurarz, M. Vobecky, Hwan Kim Hyn, K. Novak, T.Tethal, V.A. Khalkin, and L.M. Popinenkova, “Excitation Function, andYield for 97Ru Production in 99Tc(p,3n)97Ru Reaction in 20-100 MeVProton Energy Range”. Radiochim. Acta 56, 59-68, (1992).67- J.M.L. Ouellet, K. Oxorn, L.A. Hamel, L. Lessard, and C. Matte,“Cross Sections and Activation Profiles for Wear Monitoring”. Nucl. Instr.Meth. B 79, 579-581, (1993).68- R. B. Lauffer, “Paramagnetic Metal Complexes as Water ProtonRelaxation Agents for MRI Imaging: Theory and Design”. Chem. Rev. 87,901, (1987).69- S. C. Atlas, and R. C. Brasch, “Gadolinium Contrast Agents in Neuro-MRI”. J. Comput. Assist. Tomogr. 17, Suppl. 1, (1993).70- M. P. Lowe, “MRI Contrast Agents: The Next Generation”, Aust. J.Chem., 55, 551, (2002).71- D. Messeri, M. P. Lowe, D. Parker, and M. Botta, “A Stable, HighRelaxivity, Diaqua Gadolinium Complex that Suppresses Anion andProtein Binding”, Chem. Commun., 2742, (2001).72- M. P. Lowe, D. Parker, O. Reany, S. Aime, M. Botta, G. Castellano, E.Gianolio, and R. Pagliarin, “pH Dependent Modulation of Relaxivity andLuminescence in Macrocyclic Gadolinium and Europium ComplexesBased on Reversible Intramolecular Sulfonamide Ligation”, J. Am. Chem.Soc., 123, 7601, (2001).73- S. Blair, M. P. Lowe, C. E. Mathieu, D. Parker, P. K. Senanayake, andR. Kataky, “Optical pH Sensors Based on Luminescent Europium andTerbium Complexes Immobilized in a Soil Gel Glass”, Inorg. Chem., 40,5860, (2001).74- J. I. Bruce, M. P. Lowe, and D. Parker, “Chapter 11 - Luminescence ofLanthanide (III) Chelates” in “The Chemistry of Contrast Agents in MRI”,ed. A. E. Merbach, and E. Tóth, John Wiley & Sons, Ltd., Chichester,(2001).75- J. I. Bruce, R. S. Dickins, L. Govenlock, T. Gunnlaugsson, S. Lopinski,M. P. Lowe, D. Parker, R. D. Peacock, J. J. P. Perry, S. Aime, and M.Botta. “The Selectivity of Reversible Oxy-Anion Binding in AqueousSolution at a Chiral Europium, and Terbium Center.: Signalling ofHydrogencarbonate Chelation by Changes in the Form and Polarization of

References
187
Luminescence Emission Following Excitation at 365 nm”, J. Am. Chem.Soc., 122, 9674, (2000).76- S. Aime, E. Gianolio, E. Terreno, G. B. Giovenzana, R. Pagliarin, M.Sisti, G. Palmisano, M. Botta, M. P. Lowe, D. P. Parker, “TernaryGd(III)LHSA Adducts: Evidence for the Replacement of Inner SphereWater Molecules by Coordinating Groups of the Protein. Implications forthe Design of Contrast Agents for MRI”, J. Biol. Inorg. Chem., 5, 488,(2000).77- M. P. Lowe, and D. P. Parker, “Controllable pH Modulation ofLanthanide Luminescence by Intramolecular Switching of HydrationState”, Chem. Commun., 707, (2000).78- C. Birattari, E. Gadioli, E. Gadioli Erba, A.M. Grassi Strini, G. Strini,G. Tadiaferri, “Pre-Equilibrium Processes in (p,n) Reactions”, J., Nucl.Phys. A, 201, 579, (1973).79- H. Piel, S.M. Qaim, and G. Stőcklin, “Excitation Functions of (p,xn)-Reactions on natNi and Highly Enriched 62Ni: Possibility of Production ofMedically Important Radioisotope 62Cu at a Small Cyclotron”. Radiochim.Acta 57, 1, (1992).80- B. Scholten, Z. Kovacs, F. Tarkanyi, and S.M. Qaim,. “ExcitationFunctions of 124Te(p,xn)124,123I Reactions from 6 to 31 MeV with SpecialReference to the Production of 124I at a Small Cyclotron”. Appl. Radiat.Isot. 46, 255, (1995).81- E.A. Skakun, V.S. Batij, Y.U.N. Rakivnenko, O.A. Rasrtrepin, Isot.Sov. J. Nucl. Phys. 46, 17, (1987).82- V.N. Levkowski, “Cross Section of Medium Mass Nuclide Activation(A=40-100) by Medium Energy Protons and Alpha Particles”, Inter-Vesi,Moscow, USSR, (1991).83- Yu. Zuravlev, P.P. Zarubin, A.A. Kolozvari, Izv. Acad. Nauk. Ser.Phys. 58, 106, (1994).84- M.C. Lagunas-Solar, IAEA-TECDOC-1065, IAEA, Vienna, Austria,p.87, (1999).85- Z. Wenrong, Yu. Weixiang, H. Xiaogang, L.U. Hanlin, “ExcitationFunctions of Reactions from d+Ti, d+Mo, p+Ti, and p+Mo”. INDC(CRP)-044, p. 17, (1998).86- S. Takacs, F. Tarkanyi, M. Sonck, and A. Hermanne, “Investigation ofthe natMo(p,x)96mgTc Nuclear Reaction to Monitor Proton Beams: NewMeasurements and Consequences on the Earlier Reported Data”, Nucl.Instr. and Meth., 198, p.p. 183-196, (2002).87- Directory of Cyclotrons, IAEA-DCRP/CD, (2005).88- M.N.H. Comsan, ”Status Report of Inshas Ion Accelerators”, in theProceeding of the Fifth Conference and Workshop on Cyclotrons andApplications, Cairo, EGYPT, p.p. 7, 22-26 Feb., (2003).

References
188
89- Alfred P. Wolf, and W. Barclay, Chemistry Department, BNL, Upton,NY (1973).90- K. Debertin, and R.G. Helmer, “Gamma- and X-ray Spectrometry withSemiconductor Detectors”. North Holland, Amsterdam, (1988).91- G.F. Knoll, “Radiation Detection and Measurement”, 2nd Edition.Wiley, New York, (1989).92- G. Gilmore, and J.D. Hemingway, “Practical Gamma-RaySpectrometry”. Wiley, New York, (1995).93- M. Sonck, J. Van Hoyweghen, and A. Hermanne, “Determination ofthe External Beam Energy of a Variable Energy Multiparticle Cyclotron”,Appl. Radiat. Isot., Vol. 47, No. 4, pp. 445-449, (1996).94- F. Tarkanyi, S. Takacs, K. Gul, A. Hermanne, M.G. Mustafa, M.Nortier, P. Oblozinsky, S.M. Qaim, B. Scholten, Yu.N. Shubin, Z.Youxiang. IAEA-TECDOC-1211, International Atomic Energy Agency,Vienna, Austria, p. 49, (2001). Available from http://iaeand.iaea.org.at/medical, (2001).95- F. Tarkanyi, F. Szelecsenyi, and P. Kopecky. “Cross Section Data forProton, 3He and α-Particle Induced Reactions on natNi, natCu, and natTi forMonitoring Beam Performance”, Proc. Int. Conf. on Nuclear Data forScience and Technology (S. Qaim, Ed.), p. 529. Springer, Berlin, (1992).96- P. Kopecky “Proton Beam Monitoring via the natCu(p.x)58Co,63Cu(p,2n)62Zn, and 65Cu(p.n)65Zn Reactions in Copper”, Int. J. Appl.Radial. Isot. 36, 657, (1985).97- F. Tarkanyi, F. Szelecsenyi, and P. Kopecky “Excitation Functions ofProton Induced Nuclear Reactions on natNi for Monitoring Beam Energyand Intensity”, Int. J. Appl. Radial. Isot. 42, 513, (1991).98- F. Tarkanyi, F. Szelecsenyi, and S. Takacs, Acta Radiol. Suppl. 376,72, (1992).99 K. Ishii, M. Valladon, C. S. Sastri, and J. L. Debrun, Nucl. Instr.Methods 153, 503, (1978).100- Available from the International Atomic Energy Agency, nuclear datasection, directory: physics\Ganaas Ver. 3.11, Vienna, Austria, (1995).101- APTEC-MCA, verion 6.13, release 14, commercially available fromAptec Instruments Ltd., (1998).102- I. A. Slavic, Nucl. Instr. and Meth., 134, 285, (1976).103- W. Westmeier, Nucl. Instr. and Meth., 180, 205, (1981).104- W. Westmeier, Nucl. Instr. and Meth., A 242, 437, (1986).105- K. Debertin and U. Schotzig, Nuct. Instr. and Meth. 158, 471, (1979).106- Tien-Ko Wang, I-Min Hou, and Chia-Lian Tseng, “Well-type HPGeDetector Absolute Efficiency Calibration and True-CoincidenceCorrection”, Nucl. Instr. Meth. A 425, p.p. 504-515, (1999).107- A. Wyttenbach, Coincidence Losses in Activation Analysis, J. ofRadioanalytical Chemistry vol. 8, 335-343, (1971).

References
189
108- F. Cserpak, S. Sudar, J. Csikai, and S. M. Qaim, “Excitation Functionsand Isomeric Cross Section Ratios of the 63Cu(n,α)60m,gCo,65Cu(n,α)62m,gCo, and 60Ni(n,p)60m,gCo Processes from 6 to 15 MeV”. Phys.Rev., C, Vol. 49, No. 3, (1994).109- M. Gloris et al., “Proton Induced Production of ResidualRadionuclides in Lead at Intermediate Energies”. Nucl. Instr. and Meth., A463, pp. 593-633, (2001).
110- E. Gilbert et al., “Cross Section for the Proton Induced Production ofKrypton Isotopes from Rb, Sr, Y, and Zr for Enegries up to 1600 MeV”.Nucl. Instr. and Meth. B, 52, pp. 293-319, (1998).111- Photon Interaction Database, National Institute of Standards, andTechnology, http://physics.nist.gov/phys, Reference Data, (2005).112- Th. Schiekel, F. Subdrock, , U. Herpers, M. Gloris, H. J. Lange, I.Leya, R. Michel, B. Dittrich-Hannen, H. A. Synal, M. Suter, P. W. Kubik,M. Blann, D. Filges, Nucl. Instr. and Meth. B, 114, 557, (1996).113- L. Moens et al., Nucl. Instr. and Meth. 187,451, (1981).114- L. Moens and J. Hoste, Appl. Radiat. Isot. 34, 1085, (1983).115- Tien-Ko Wang, Tzung-Hua Ying, Wei-Yang Mar, Chia-Lian Tseng,Chi-Hung Liao, and Mei-Ya Wang, “HPGe Detector True-CoincidenceCorrection for Extended Cylinder, and Marinelli-Beaker Sources”. Nucl.Instr. and Meth. A 376,p.p. 192-202, (1996).116- Sandor Sudar “TRUECOINC: A Program for Calculation of TrueCoincidence Correction for Gamma Rays”, Institute of ExperimentalPhysics, Kossuth University, Debrecen, Hungary, (2000).117- R. Weinreich, H.J. Probst, S.M. Qaim, “Production of Chromium-48for Applications in Life Sciences”, Int. J. Appl. Radiat. Isot. 31, 223,(1980).118- S.S. Malik, Nucl. Instr. Meth. 125, 45-52, (1975).119- M.P. Fricke, W.M. Lopez, S.J. Friesenhahn, A.D.Carlson, D. Costello,“Measurements of Cross Sections for Radiative Capture of 1-keV to 1-MeV Neutrons by Mo, Rh, Gd, Ta, W, Re, Au, and U-238”. Conference,71KNOX, 1, 252, March, (1971); W.P. Poenitz, “Fast Neutron CaptureCross Section Measurement with the Argon National Laboratory LargeLiquid Scintillator Tank”. Symposium, ANL-83, 4, 239, April, (1982);A.R.DEL. Musgrove, B.J. Allen, J.W. Boldeman, R.L. Macklin, “AverageNeutron Resonance Parameters and Radiative Capture Cross Sections forthe Isotopes of Molybdenum”. Nucl. Phys. A, 270, 108, Oct., (1976); J.Voignier, S. Joly, G. Grenier. “Capture Cross Sections and Gamma-RaySpectra from the Interaction of 0.5 to 3 MeV Neutron with Nuclei in theMass Range A = 63 to 209”. Nucl. Sci. Eng., 93, 43, (1986).120- W.P. Poenitz, “Fast Neutron Capture Cross Section Measurementwith the Argon National Laboratory Large Liquid Scintillator Tank”.

References
190
Symposium, ANL-83, 4, 239, April, (1982); R.C. Block, G.G. Slaughter,L.W. Weston, F.C. Vonderlage. “Neutron Radiative Capture MeasurementsUtilizing a Large Liquid Scintillator Detector at the Oak Ridge NationalLaboratory Fast Chopper”. Conference, 61SACLAY, 203, July, (1961);J.H. Gibbons, R.L. Macklin, P.D. Miller, J.H. Neiler. “Average RadiativeCapture Cross Section for 7 to 170 keV Neutrons Detector (STANK)Liquid Scintillator Tank”. Phys. Rev., 122, 182, (1961); and Phys. Rev.,129, 2695, (1963); M.P. Fricke, W.M. Lopez, S.J. Friesenhahn, A.D.Carlson, D. Costello. “Measurements of Cross Sections for RadiativeCapture of 1-keV to 1-MeV Neutrons by Mo, Rh, Gd, Ta, W, Re, Au, andU-238”. Conference, 71KNOX, 1, 252, March, (1971).121- Paul C. Brand, Materials Research Engineer, NIST Center for NeutronResearch, Building 235, Gaithersburg, MD 20899, Interface between ICCand MCC, Revision - (DRAFT), (1999).122- V.F. Weisskopf, and D.H. Ewing, “On the Yield of Nuclear Reactionwith Heavy Elements”. Phys. Rev. 57, 472, (1940).123- M. Herman, A. Marcinkowski, and K. Stankiewicz, “Program Name:EMPIRE-MSC, Computer phys. Communicantion 33, pp. 373-398, (1984).124- H. Feshbach, A.K. Kerman, and S. Koonin, “The Inelastic Scatteringof Neutrons”. Ann. Phys. 125, 429, (1980); R. Bonetti, M.B. Chadwick,P.E. Hodgson, B.V. Carlson, and M.S. Hussein, “The Feshbach-Kerman-Koonin Multistep Compound Reaction Theory”. Phys. Rep. 202, 171,(1991); T. Tamura, and T. Udgawa, “Assessment of the Feshback-Kerman-Koonin Appproximation in Multistep Direct ReactionTheories”. Phys. Letts. B 78, 189, (1978).125- E. Gadioli, and P.E. Hodgson, “Pre-equilibrium Nuclear Reactions”,Oxford, Clarendon, (1992); V. Udgawa, and K.S. Low, “Assessment of theFeshbach-Kerman-Koonin Approximation in Multistep Direct ReactionTheories”. Phys. Rev. C 28, 1033, (1983); K.K. Gudima, G.S. Mashnik,and V.D. Toneev, “Cascade Exciton Model on Nuclear Reactions”. Nucl.Phys. A 401, 329, (1983).126- M. Blann, “Hybrid Model for Pre-equilibrium Decay in NuclearReactions”. Phys. Lett. 27, 337, (1971).127- M. Blann, “Importance of the Nuclear Density Distribution on Pre-equilibrium Decay”, Phys. Rev. Lett. 28, 757, (1972).128- M. Blann, “Overlaid ALICE: a statistical model computer codeincluding fission and pre-equilibrium models: FORTRAN, cross-sections”.Report COO-3494-29. University of Rochester, NY, (1975).129- M. Blann, Bisplinghoff, J., “Code ALICE/Livermore 82. ReportUCID-19614. Lawrence Livermore National Laboratory, (1982).130- M. Blann, Vonach, H.K., “Global Test of Modified Pre-compoundDecay Models”. Phys. Rev. C 28, 1475, (1983).

References
191
131- V.S. Ramamurthy, S.S. Kapoor, and S.K. Kataria, “Excitation EnergyDependence of Shell Effects on Nuclear Level Densities and FissionFragment Anisotropies”, Phys. Rev. Lett., 25, 386-390, (1970).132- A.V. Ignatyuk, K.K. Istekov, and G.N. Smirenkin, Sov. J. Nucl. Phys.,29, 450, (1979).133- C. Kalbach-Cline, “Residual two Body Matrix Elements for Pre-equilibrium Calculations”, Nucl. Phys., A210, p.p. 590-604, (1973).134- R.M. Lambrecht, T. Sekine, and H. Vera Ruiz, “Alice Prediction onAccelerator Production of Molybdenum-99”, Appl. Radiat. Isot. 51, pp.177-182, (1999).135- M. Nandy, and P.K. Sarkar, “Calculation of Excitation Functions ofNuclides Produced in Proton Induced Reactions on natSi”, Appl. Radiat.Isot. 54, pp. 101-111, (2001).136- A. Hohn, F.M. Nortier, B. Scholten, T.N. van der Walt, H.H. Coenen,and S.M. Qaim, “Excitation Functions of 125Te(p,xn)-Reactions from theirRespective Thresholds up to 100 MeV with Special Reference to theProduction of 124I”, Appl. Radiat. Isot. 55 , pp. 149 -156, (2001).137- M.C. Lagunas-Solar, Presented at The Consultants Meeting onProduction Technologies for Molybdenum-99 and Technetium-99m, 10-12April, Faure, South Africa, IAEA-TECDOC-1065, Vienna, Austria, (1999).138- M.C. Lagunas-Solar, R.P. Haff, “Theoretical and ExperimentalExcitation Functions for Proton Induced Nuclear Reactions on Z=10 toZ=82 Target Nuclides”. Radiochim. Acta 60, 55, (1993).138- M.C. Lagunas-Solar, P.M. Kiefer, O.F. Carvacho, C.A. Lagunas, andYa.Po. Cha, “Cyclotron Production of NCA 99mTc and 99Mo, an AlternativeNon-reactor Supply Source of Instant 99mTc and 99Mo→99mTc Generators”.Appl. Radiat. Isotopes 42, 643-657, (1991).139- M.G. Mustafa, “Nuclear Modeling Applied to RadioisotopeProduction”. Report UCRL-JC-126741. Lawrence Livermore NationalLaboratory, CA, p. 54, (1997).140- P. Oblozinsky, “Development of Reference Charged Particle CrossSection Data-Base for Medical Radioisotope Production”. ReportINDC(NDS)-371. IAEA, Vienna, p. 45, (1997).141- G.F. Steyn, S.J. Mills, F.M. Nortier, B.R.S. Simpson, and B.R. Meyer,Appl. Radiat. Isotopes 41, 315, (1990).142- O. Bersillon, “SCAT2: Un programme de modele optique spherique”.Report CEA-N-2227 NEANDC(FR), INDC(E)49, (1981); “Thc ComputerCode SCAT2”, NEA Data Bank 0829/03 version (1991).143- J.J. Griffin, “Statistical Model of Intermediate Structure”, Phys. Rev.Lett. 17, 478, (1966).144- J. Raynal, “Notes on ECIS”, CBA-N-2772, Commissariat a l'EnergieAtomique (1994).

References
192
145- “Handbook for Calculations of Nuclear Reaction Data: ReferenceInput Parameter Library”, IAEA-TECDOC-1034, 168 pages. See alsowww-nds.iaea.org/ripl/, IAEA, Vienna (1998).146- W. Hauser, and H. Feshbach, “The Statistical Theory of MultistepCompound, and Direct Reactions”. Phys. Rev. 87, 366, (1952).147- H.M. Hofmann, J. Richert, J.W. Tepel, and H.A. Weidenmuller,“Direct Reactions and Hauser-Feshbach Theory”, Ann. Phys. 90, 403,(1975).148- H. Nishioka, J. J. M. Verbaarschot, H. A. Weidenmuller, and S.Yoshida, Ann. Phys., 172, 67, (1986).149- V.V. Zerkin, “ZVView Graphics Software for Nuclear DataAnalysis”, Version 9.4, Available from: http://www-nds.iaea.org/ndspub/zvview/, (2001).150- M.B. Chadwick, P.O. Young, D.C. George, and Y. Watanabe“Multiple Preequilibrium Emission in Feshbach-Kerman-KooninAnalyses”, Phys. Rev. C 50, 996 (1994).151- E. Betak, and P. Oblozinski, “Code PEGAS”, Report INDC(SLK)-001, IAEA, Vienna, Austria, (1993).152- M. Blann, “New Precompound Decay Model”, Phys. Rev. C 54, 1341(1996).153- P.A. Axel, Phys. Rev. 126, 671, (1962).154- A. Gilbert, and A.G.W. Cameron, Can. J. Phys. 43, 1446, (1965).155- G. Audi, and A.H. Wapstra, Nucl. Phys. A 595, 409, (1995).156- P. Moller, and J.R. Nix, Atom. Data Nucl. Data Tables 26, 165,(1981).157- Mike Herman, Roparto Capote-Noy, Pavel Oblozinski, Andrej Trkov,and Victor Zerkin, “Recent Development of the Nuclear Reaction CodeEMPIRE”, J. Nucl. Sci. Tech., Suppl. 2, pp. 116-119, (Aug., 2002).158- W.D. Myers, and W.J. Swiatecki, Ark. Fys., 36, 343, (1967).159- M.M. Musthafa, B.P. Singh, M.G.V. Sankaracharyulu, H.D.Bhardwaj, and R. Prasad, “Semi-Classical and Quantum MechanicalAnalysis of the Excitation Function for the 130Te(p,n)130I Reaction”. Phys.Rev. C 52, (1995).160- I.D. Fedorets. et al., Phys. Atom. Nucl. 56 (4), 436, (1993).161- M.B. Chatterjee, Phys. Rev. C 2, 625, (1988).162- J. Pal, et al., Z. Phys. A 356, 281, (1996).163- T. Kibedi, et al., Phys. Rev. C 37, 6, 2391, (1988); G. Gulyas. et al.,Nucl. Phys. A 506, 196, (1990).164- P.E. Garrett. et al., Phys. Rev. Lett. 78 (24), 4545, (1997).165- Mihaela Sin, “Empire-II Code System with RIPL Database as a Toolfor Nuclear Spectroscopy”, Nucl. Instr. Meth., A 527, p.p. 462-470, (2004).

References
193
166- D. Wilmore, P.E. Hodgson, Nucl. Phys. 55, 673, (1964); F.D.Becchetti, G.W. Greenless, Phys. 182, 1190, (1969); L. McFadden, G.R.Satchler, Phys. 84, 177, (1979).167- V. McLane, C.L. Dunford, P.E. Rose, “Neutron Cross Sections”,Vol.2, Academic Press, New York, (1988).************************************************************

194
جامـعة المنـصورة كلــية: العــلوم قسـم: الفيــزياء
عنـوان الرســالة
دراسة دوال اإلثارة لبعض النويدات المشعة الناتجة من السيكلوترون
بحث مقـدمة مـن الطالب
محـسن بخـيت محـمد مدرس مساعد – مركز البحوث النووية
هيئة الطاقة الذرية
تحت إشراف
أ.د./ محمود أحمد محمد أبوزيد أستاذ متفرغ – كلية العلوم – جامعة المنصورة
أ.د./ محمد ناصف حسين قمصان أستاذ متفرغ – مركز البحوث النووية – هيئة الطاقة الذرية
للحـصول على درجـة دكتور الفلسفة في العـلوم، الفـيزياء
(فـيزياء تجـريبـية)
٢٠٠٦

ب

ج
جامـعة المنـصورة كلــية: العــلوم قسـم: الفيــزياء
لجــنة اإلشـراف
عنـوان الرسـالة: دراسة دوال اإلثارة لبعض النويدات المشعة الناتجة من السيكلوترون
أسم الباحث: محـسن بخـيت محـمد
المشرفون:
التوقيع االسم/الوظيفة أ.د./محمود أحمد محمد أبو زيد
أستاذ الفيزياء النووية، كلية العلوم، جامعة المنصورة. أ.د./محمد ناصف حسين قمصان
أستاذ الفيزياء النووية، مركز البحوث النووية، هيثة الطاقة الذرية.
رئيس القسم وكيل الكلية للدراسات العليا عميد الكلية
( ) ( ) ( ) أ.د./ طه زكى نبوي سكر أ.د./ المتولي محمد العباسي أ.د./ محمد عبد القادر مدكور

د

ه
جامـعة المنـصورة كلــية: العــلوم
قســم: الفيــزياء لجـنة المناقشة والحـكم
عنـوان الـرسـالة: دراسة دوال اإلثاره لبعض النويدات المشعة الناتجة من السيكلوترون
أسـم البـاحـث: محـسن بخـيت محـمد لجــنة اإلشـراف:
التوقيع االسم أ.د./ حممود أمحد حممد أبو زيد كلية العلوم – جامعة املنصورة.
أ.د./ حممد ناصف حسني قمصان مركز البحوث النووية – هيئة الطاقة الذرية.
لجـنة المنـاقـشة والحـكم:
التوقيع االسم
أ.د./ إبراهيم إبراهيم مصطفى بندق كلية العلوم – جامعة طنطا.
أ.د./ فـأيـز حممد عبد السالم شـاهني
كلية العلوم – جامعة بين سويف.
أ.د./ حممد ناصف حسني قمصان
مركز البحوث النووية – هيئة الطاقة الذرية.
أ.د./ حممود أمحد حممد أبو زيد كلية العلوم – جامعة املنصورة.
وكيل الكلية للدراسات العليا عميد الكلية رئيس القسم ( ) ( ) ( )
أ.د./ طه زكى نبوي سكر أ.د./ المتولي محمد العباسي أ.د./ محمد عبد القادر مدكور

و

ز
ملخـص تعتـبر دراسـات المقـاطـع المسـتـــعرضة للتــفاعالت المسـتحثة بالبروتونات (ما بيــن ٥-١٨ م.أ.ف) مــع المــواد، ذات أهمــية خاصــة ـــتاجها للـدارسـين من ناحـية الحـصول على البـيانـات النـوويـة التي يحــاج النظـائر الباحـثون في الدراسات الميـكروسكوبـية وكذلـك في مجـالي انتوتطبيقات التنشيط السطحي فــي دراسـة معـدل تـآكل السـطوح والقياســات ـــو متــاح مـن الدوزيمترية. هذا باإلضـافة إلى أن وجود إختـالف بين ما هـــاسات جديــدة دراسات على المقاطع المستـعرضة مما إستـوجب إجـراء قيــة مـن باستـخدام تقـنيات متـطورة يمكن عن طريقـها الوصـول بدرجة عاليالدقـة إلى القـيم الحقيـقية للمقـاطع المستـعرضة لهـذه التـفاعالت. ولهذا فإن الهـدف األسـاسي من هذه الرسالة هو قياس المقــاطع المستــعرضة لتــفاعل ــووي بغـرض البروترونات مع بعض العنـاصر ذات االهمية في مجال الطب النـها التشخيص أو العالج وكذلك في دراسة معدالت تآكل اسطح السبائك نتيجة تعرضــك لالجهاد. وعلى هذا فالقـياسات الجـارية لتـفاعل البروترونات مع بعـض تلالعنـاصر تمـثل أهمـية متـزايـدة لما لها من دور فــي تحــديد القصـور الوظيفي للمرضى وقد تشارك أخرى من النظائر المنتجة في العــالج. والدراسـه الدقيقة لكميات المقاطع المستعرضة تمكنا من تحديد الناتج ودرجة نقاوتــة، ومـن ـات تقـدير حـجم التنـشيط الحـادث لبعض أجـزاء ومكـونات المعدات والماكينتمكنا من دراسة التأثـيرات المتـلفة بإستخدام القياســات اإلشـعاعية وحســاب مقـدار اإلتالفات المتـولدة داخـل جسـم المعدات. وخـالل هذا العـمل تمــت NatMo(p,x)92mNb, NatMo(p,xn)94,95m,95g,96,99mTc, ـــالية دراسة التـفاعالت التـــفاعالت نظـائر ,and NatGd(p,xn)152,154m,154g,155,165,160Tb. وينـتج عن هذه الت
ــها مـن الخــواص الفيـزيائــية نتـيجة تـفاعل البروتـرونات معها يكون لــابقة الذكـر. ونهــدف والـكميائية واالشعاعية ما يمكننا من إجراء الدراسات ســـقة للمقــاطع خـالل هذه الدراسة الى الحـصول على نتـائج واضـحة ودقي
المستـعرضة لبعـض العـناصر ذات االثراء الطبيعي.

ح
Copyright © 2022 FDOKUMEN