![[W. Greiner] Classical Electrodynamics](https://static.fdokumen.com/doc/165x107/63256c64852a7313b70e7c12/w-greiner-classical-electrodynamics.jpg)
Classical to quantum crossover of the cyclotron resonance in ...
13
Classical to quantum crossover of the cyclotron resonance in graphene: a study of the strength of intraband absorption This article has been downloaded from IOPscience. Please scroll down to see the full text article. 2012 New J. Phys. 14 095008 (http://iopscience.iop.org/1367-2630/14/9/095008) Download details: IP Address: 82.248.220.51 The article was downloaded on 10/09/2012 at 19:26 Please note that terms and conditions apply. View the table of contents for this issue, or go to the journal homepage for more Home Search Collections Journals About Contact us My IOPscience
-
Upload
khangminh22 -
Category
Documents
-
view
0 -
download
0
Transcript of Classical to quantum crossover of the cyclotron resonance in ...
Classical to quantum crossover of the cyclotron resonance in graphene: a study of the
strength of intraband absorption
This article has been downloaded from IOPscience. Please scroll down to see the full text article.
2012 New J. Phys. 14 095008
(http://iopscience.iop.org/1367-2630/14/9/095008)
Download details:
IP Address: 82.248.220.51
The article was downloaded on 10/09/2012 at 19:26
Please note that terms and conditions apply.
View the table of contents for this issue, or go to the journal homepage for more
Home Search Collections Journals About Contact us My IOPscience

T h e o p e n – a c c e s s j o u r n a l f o r p h y s i c s
New Journal of Physics
Classical to quantum crossover of the cyclotronresonance in graphene: a study of the strength ofintraband absorption
M Orlita1,2,6, I Crassee3, C Faugeras1, A B Kuzmenko3,F Fromm4, M Ostler4, Th Seyller4, G Martinez1, M Polini5
and M Potemski11 Laboratoire National des Champs Magnetiques Intenses,CNRS-UJF-UPS-INSA, 25, avenue des Martyrs, 38042 Grenoble, France2 Faculty of Mathematics and Physics, Charles University, Ke Karlovu 3,121 16 Prague 2, Czech Republic3 Departement de Physique de la Matiere Condensee, Universite de Geneve,CH-1211 Geneve 4, Switzerland4 Lehrstuhl fur Technische Physik, Universitat Erlangen-Nurnberg,D-91058 Erlangen, Germany5 NEST, Istituto Nanoscienze-CNR and Scuola Normale Superiore,I-56126 Pisa, ItalyE-mail: [email protected]
New Journal of Physics 14 (2012) 095008 (12pp)Received 14 June 2012Published 10 September 2012Online at http://www.njp.org/doi:10.1088/1367-2630/14/9/095008
Abstract. We report on absolute magneto-transmission experiments on highlydoped quasi-free-standing epitaxial graphene targeting the classical-to-quantumcrossover of the cyclotron resonance. This study allows us to directly extractthe carrier density and also other relevant quantities such as the quasiparticlevelocity and the Drude weight, which is precisely measured from the strengthof the cyclotron resonance. We find that the Drude weight is renormalizedwith respect to its non-interacting (or random phase approximation) value andthat the renormalization is tied to the quasiparticle velocity enhancement. Thisfinding is in agreement with recent theoretical predictions, which attribute the
6 Author to whom any correspondence should be addressed.
Content from this work may be used under the terms of the Creative Commons Attribution-NonCommercial-ShareAlike 3.0 licence. Any further distribution of this work must maintain attribution to the author(s) and the title
of the work, journal citation and DOI.
New Journal of Physics 14 (2012) 0950081367-2630/12/095008+12$33.00 © IOP Publishing Ltd and Deutsche Physikalische Gesellschaft
2
renormalization of the Drude weight in graphene to the interplay between brokenGalilean invariance and electron–electron interactions.
Contents
1. Introduction 22. Experimental results 33. Discussion 74. Conclusions 8Acknowledgments 9Appendix. Extraction of the optical conductivity from transmission spectra 9References 10
1. Introduction
The low-frequency dynamical conductivity, σ(ω), a fundamental property of electricalconductors, is also central for the physics of graphene and for possible applications of thismaterial in opto-electronics [1–4]. A tempting description of σ(ω) in graphene refers to a simplemodel of non-interacting Dirac-fermion quasiparticles with the characteristic linear dispersionE(k) = ±vFh|k|, which at zero temperature occupy the electronic states up to the Fermienergy |EF| = hvF
√π |n|, where vF stands for the (Fermi) velocity parameter and n is the free-
carrier concentration. Such an effective single-particle (ESP) picture correctly reproduces themeasured strength of interband-absorption processes with the characteristic onset at 2|EF| andthe dispersionless universal amplitude σinter = σuni = e2/(4h) [5–11]. Further simple reasoningin terms of the Drude approach yields the well-known expression for the integrated strengthD =
∫∞
0 σintra(ω) dω of intraband processes (the so-called Drude weight):
D =e2
2hvF
√π |n| =
π |n|e2
2mc=
2σuni|EF|
h, (1)
in which mc = |EF|/v2F accounts for the effective cyclotron mass of carriers at the Fermi energy.
The experimental measurements available so far [12, 13] are in conflict with this simpleprediction. They suggest a suppression of the Drude weight up to 40% (notably, in grapheneswith high carrier concentrations) and therefore raise the issue of the applicability of the ESPpicture to describe the dynamical conductivity of graphene. These doubts are additionallyfostered by a startling report on non-vanishing absorption below the 2|EF| threshold forinterband processes [11].
Formally, the Drude approach follows from the commonly used random phaseapproximation (RPA) [14], which indeed grants equation (1), but, with the velocity parameterfixed at its bare value [15] vF,0 = 0.85 × 10⁶ m s−1—the value of vF,0 can be accuratelyestimated, for example, from calculations based on density-functional theory at the local densityapproximation (LDA) level [16–18]. Markedly, vF,0 is smaller than the apparent (renormalized)Fermi velocity, vF = (1.0–1.1) × 106 m s−1, which is derived from most of the spectroscopystudies on graphene-based systems [19–27] (and from beyond-LDA theoretical approaches).
New Journal of Physics 14 (2012) 095008 (http://www.njp.org/)
3
In fact, the Drude weight determined by the bare velocity, D0 = (vF,0/vF)D, could partiallyexplain the experimental claims [12, 13] of a suppressed D. However, the RPA approachleading to equation (1) with vF replaced by vF,0 misses some important physics [15]. A moreadequate formalism, based on many-body diagrammatic perturbation theory [15], providesa more complex scenario in which self-energy (i.e. velocity enhancement) and vertex (i.e.excitonic) corrections compete with each other. Nevertheless, when the carrier concentration issufficiently high, the approximate validity of the ESP model of non-interacting Dirac-fermionquasiparticles is expected to be recovered and equation (1), with the renormalized (apparent)velocity parameter, may be justified. Thus the issue of the strength of the Drude weight ingraphene, one of its very basic electronic properties, remains a matter of controversy.
In this paper, we report on testing the ESP model against the results of cyclotron-resonance(CR) absorption experiments, performed on highly doped graphene specimens. Consistentlyfollowing the ESP picture, we note that the Drude weight is fully transformed into the strengthof the CR absorption in the classical limit and, with a good precision, into the strength ofinter-Landau-level (LL) transitions in the quantum limit, i.e. into a quantity which is accuratelydetermined from our absolute magneto-transmission measurements. The carrier concentrationis deduced from the analysis of the oscillatory broadening of the CR response with LL fillingfactor, whereas the effective mass (and, in turn, the apparent Fermi velocity) is directly readfrom the dispersion of the CR with magnetic field. The Drude weight, as measured from thestrength of the CR absorption, is found to be consistent with the estimate given by equation (1)in which the velocity parameter has the meaning of its apparent (spectroscopically measured ortheoretically renormalized) value.
2. Experimental results
The investigated graphene sheet was prepared by thermal decomposition of the Si-terminatedsubstrate of 6H–SiC. Subsequent hydrogenation of the ‘zero layer’ yields a quasi-free-standingepitaxial graphene monolayer [28]. Such specimens are typically highly p-doped with the Fermienergy EF ≈ −0.3 eV and carrier mobility µ ≈ (2–3) × 103 cm2 (V s)−1 [29]. In this paper, wepresent data from one particular specimen; however, consistent results have been obtained onanother similar sample.
To measure the far-infrared transmittance, a macroscopic area of the sample (≈ 4 mm2) wasexposed to the radiation of a globar, which was analyzed by a Fourier transform spectrometerand delivered to the sample via light-pipe optics. The light was detected by a compositebolometer placed directly below the sample, kept at T = 1.8 K. From the substrate-normalizedtransmission T (B), the real part of the optical conductivity, <e [σxx(ω, B)], was obtainedfor each separate magnetic field. The extraction of the conductivity from the transmission isdescribed in detail in the appendix.
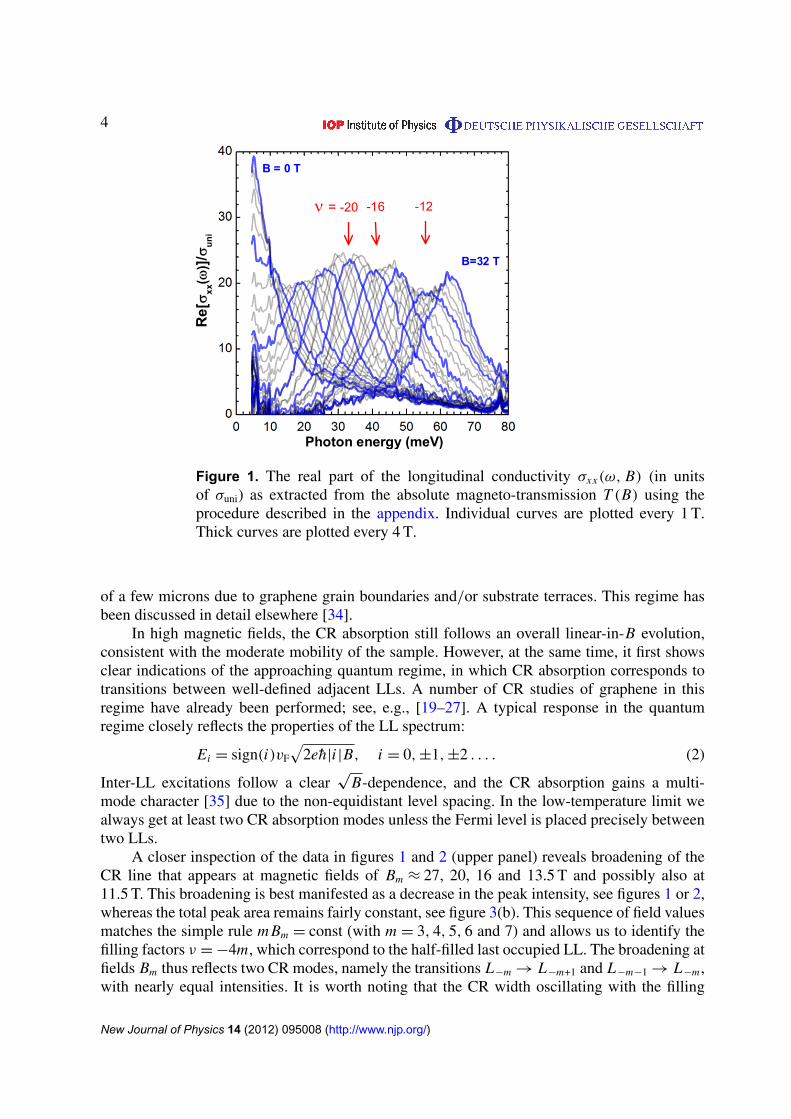
Experimental data are presented in figures 1 and 2 in the form of the conductivity spectraand as a false-color plot of <e [σxx(ω, B)], respectively. In agreement with previous studies onhighly doped graphene [29, 30], the magneto-optical response corresponds to the quasi-classicalregime of the CR [31–33], since the condition µB ∼ 1 applies. The CR line is approximatelya single Lorentzian, its position in the spectra increasing linearly with B, see figure 2. Atlow magnetic fields (in particular below B = 10 T), a departure from linearity is visible, seefigure 3(a). In this regime the optical response is dominated by plasmons confined on the scale
New Journal of Physics 14 (2012) 095008 (http://www.njp.org/)
4
Figure 1. The real part of the longitudinal conductivity σxx(ω, B) (in unitsof σuni) as extracted from the absolute magneto-transmission T (B) using theprocedure described in the appendix. Individual curves are plotted every 1 T.Thick curves are plotted every 4 T.
of a few microns due to graphene grain boundaries and/or substrate terraces. This regime hasbeen discussed in detail elsewhere [34].
In high magnetic fields, the CR absorption still follows an overall linear-in-B evolution,consistent with the moderate mobility of the sample. However, at the same time, it first showsclear indications of the approaching quantum regime, in which CR absorption corresponds totransitions between well-defined adjacent LLs. A number of CR studies of graphene in thisregime have already been performed; see, e.g., [19–27]. A typical response in the quantumregime closely reflects the properties of the LL spectrum:
Ei = sign(i)vF
√2eh|i |B, i = 0, ±1, ±2 . . . . (2)
Inter-LL excitations follow a clear√
B-dependence, and the CR absorption gains a multi-mode character [35] due to the non-equidistant level spacing. In the low-temperature limit wealways get at least two CR absorption modes unless the Fermi level is placed precisely betweentwo LLs.
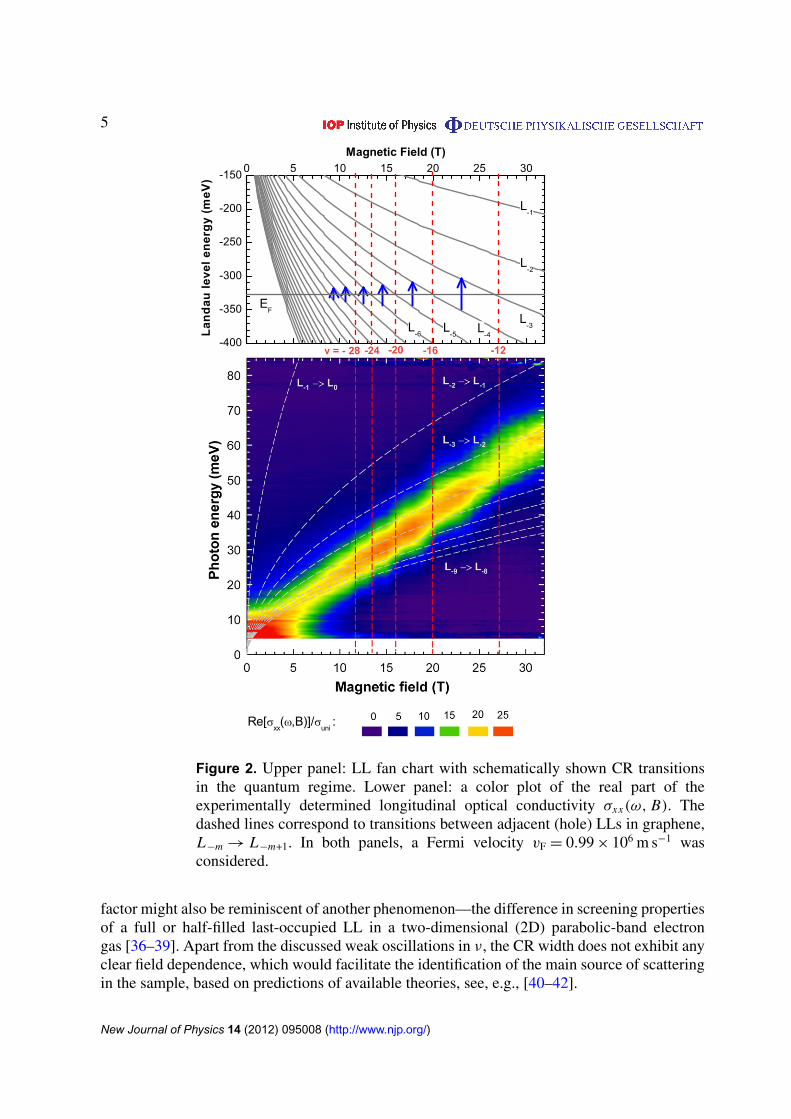
A closer inspection of the data in figures 1 and 2 (upper panel) reveals broadening of theCR line that appears at magnetic fields of Bm ≈ 27, 20, 16 and 13.5 T and possibly also at11.5 T. This broadening is best manifested as a decrease in the peak intensity, see figures 1 or 2,whereas the total peak area remains fairly constant, see figure 3(b). This sequence of field valuesmatches the simple rule m Bm = const (with m = 3, 4, 5, 6 and 7) and allows us to identify thefilling factors ν = −4m, which correspond to the half-filled last occupied LL. The broadening atfields Bm thus reflects two CR modes, namely the transitions L−m → L−m+1 and L−m−1 → L−m ,with nearly equal intensities. It is worth noting that the CR width oscillating with the filling
New Journal of Physics 14 (2012) 095008 (http://www.njp.org/)
5
Figure 2. Upper panel: LL fan chart with schematically shown CR transitionsin the quantum regime. Lower panel: a color plot of the real part of theexperimentally determined longitudinal optical conductivity σxx(ω, B). Thedashed lines correspond to transitions between adjacent (hole) LLs in graphene,L−m → L−m+1. In both panels, a Fermi velocity vF = 0.99 × 10⁶ m s−1 wasconsidered.
factor might also be reminiscent of another phenomenon—the difference in screening propertiesof a full or half-filled last-occupied LL in a two-dimensional (2D) parabolic-band electrongas [36–39]. Apart from the discussed weak oscillations in ν, the CR width does not exhibit anyclear field dependence, which would facilitate the identification of the main source of scatteringin the sample, based on predictions of available theories, see, e.g., [40–42].
New Journal of Physics 14 (2012) 095008 (http://www.njp.org/)

6
Figure 3. (a) Maximum of the CR absorption as a function of the magneticfield. The dashed line denotes the theoretical position of CR for the effectivemass of m = 0.058m0. The departure of the CR position from the linear-in-Bbehavior at low fields is consistent with the appearance of confined magneto-plasmons [34, 43]. (b) Drude weight (area) extracted using a Drude–Lorentzianformula (see [34, 43]) and the directly read-out amplitude of <e [σxx(ω, B)].The horizontal dotted lines show the expected ESP and ‘bare’ Drude weightsfor a specimen with a 95% graphene coverage (see the main text), takinginto account the apparent (renormalized) vF = 0.99 × 10⁶ m s−1 and bare vF,0 =
0.85 × 10⁶ m s−1 Fermi velocities, respectively.
The sequence of the CR line broadening m Bm = const is compatible with two possiblescenarios. Either the Fermi level in graphene is pinned by electronic states in the SiC substrate,i.e. EF = const = −vF
√2ehm Bm , or the carrier density n simply remains constant with varying
B. In the latter case, the density is given by |n| = const = Nfmζ(B), where ζ(B) is the LLdegeneracy eB/h and Nf = 4 is the number of fermion flavors in graphene (i.e. a degeneracyfactor associated with spin and valley degrees of freedom). Even though charge transfer betweenthe substrate and graphene cannot be excluded (EF = const), this effect is negligible as testifiedby the CR weight being nearly constant with B, see figure 3(b). Anyway, in both cases, thecarrier density at B = 0 and also at each Bm is |n| = 4em Bm/h = (7.9 ± 0.2) × 1012 cm−2.
New Journal of Physics 14 (2012) 095008 (http://www.njp.org/)
7
Importantly, this value of carrier density is extracted entirely from the LL occupation, i.e.independently of vF and EF. This represents a significant advantage over previous studies ofgraphene in the quasi-classical regime [29, 30]. We also note that the observation of individualfilling factors in data, revealed as well-defined steps in the position of the CR line in figure 2,serves as an indication of high homogeneity of the carrier density on the macroscopic scale.
Using the ESP expression for the cyclotron frequency, ωc = eB/mc, we can extractthe cyclotron mass at the Fermi level from the slope of the CR line directly: we findthat mc = (0.058 ± 0.01)me, where me is the electron mass in vacuum. Using the ‘Einsteinrelation’, |EF| = mcv
2F, together with |EF| = hvF
√π |n|, we obtain vF and EF. We find that
vF = (0.99 ± 0.02) × 106 m s−1, which is sensibly larger than the ‘bare’ value vF,0, and |EF| =
(325 ± 5) meV, which is in excellent agreement with the position of onset of the interbandabsorption (not discussed in this paper), which provides |EF| = (320 ± 10) meV. According tothe ESP model (1), the deduced Fermi level implies the expected Drude weight Dh/σuni =
2|EF| = 650 meV.On the other hand, the Drude weight can be directly extracted from our data by estimating
the area under <e [σxx(ω, B)], which bypasses the use of equation (1). To account for thepartial transfer of the Drude weight into the lower magneto-plasmon branch [44–46], whichis significant at lower magnetic fields, the Drude weight has been extracted by fitting witha standard Drude–Lorentz formula, see [34, 43], assuming the confined-plasmon frequencyof ω0 = 6.5 meV [34]. This approach provides at higher field results identical to the fittingwith a simple Lorentzian curve. From this fitting, we obtained the Drude weight close toDh/σuni ≈ 600 meV, see figure 3(b).
To compare both estimates of the Drude weight, the following corrections should betaken into account: (i) the coverage of the substrate by graphene is not full (see, e.g., AFMmeasurements on similarly prepared samples [34]), (ii) the hydrogenization process is notalways complete—a small part of the sample remains covered only by the non-graphene ‘zerolayer’ [47], (iii) bilayer graphene may also appear at selected locations [48] and (iv) the areabelow <e [σxx(ω, B)], extracted using the simplified equation (A.4), is suppressed with respectto the Drude weight by a few per cent, see the appendix. All these corrections tend to decreasethe Drude weight deduced from the area under <e [σxx(ω, B)] by approximately 5–10%.
To sum up, we find that our two independent estimates of the Drude weight agree witheach other with a precision better than 10% and conclude that we do not observe any significantdeviation from the validity of the ESP model (1). Our findings thus do not support recenttransmission studies [12, 13] in which a significant suppression of the Drude weight (incomparison with the ESP expectation) has been reported. The reason for this discrepancyremains unclear at the moment, although we believe that (at least a part of) the suppressionof the Drude weight found in [12] might stem from the normalization procedure used, in whichthe Drude-type absorption of graphene in the regime of electron–hole puddles (when the sampleis neutral on average) is neglected.
3. Discussion
The validity of the ESP model (1) for the description of the strength of intraband absorptionreminds us of Landau’s theory of normal Fermi liquids, which establishes a ‘mapping’between a system of interacting fermions and a gas of weakly interacting quasiparticles withrenormalized parameters [14]. The renormalized quasiparticle velocity vF is precisely one of
New Journal of Physics 14 (2012) 095008 (http://www.njp.org/)
8
these parameters, which is completely controlled by the real part of the quasiparticle self-energyevaluated at the Fermi level EF. Quasiparticles, however, do interact among each other and theirinteractions, which are described by the dimensionless Landau parameters F s,a
` , modify physicalobservables such as the compressibility and the spin susceptibility or, more generally, themacroscopic response of the interacting electron liquid to external fields [14]. Our experimentaltest of the validity of the ESP model (1) tells us that interactions among quasiparticles ingraphene, which diagrammatically are encoded in ‘vertex’ or ‘excitonic’ corrections, are weak,at least at large carrier densities.
Our experimental findings and the approximate validity of equation (1) can also beinterpreted in terms of an enhancement of the Drude weight D with respect to its non-interacting value D0, which is found to be given by D/D0 ≈ vF/vF,0 ≈ 1.2. This result is inexcellent agreement with the theoretical predictions of Abedinpour et al [15]. By taking intoaccount screening at the Thomas–Fermi level, the authors of [15] predicted D/D0 ≈ 1.25 at acarrier density |n| = 8 × 1012 cm−2 and for a dimensionless coupling constant αee ≈ 0.5—for adefinition of αee see, e.g., [1]. Note that this is the appropriate value of αee for our sample, asdeduced from a recent ARPES study carried out by Bostwick et al [49] in a nearly identicalsample. We stress that the theoretical proof of the approximate validity of equation (1) givenin [15] is far from trivial: it is based on a fully microscopic diagrammatic approach in whichsubstantial cancelations between the self-energy and vertex corrections play an essential role.In particular, the authors of [15] demonstrated the smallness of excitonic corrections to theintraband response of a doped graphene sheet, which tend to suppress the Drude weight—seeequations (21) and (23) in [15]. Our experimental study corroborates this finding too.
For the sake of completeness, we should note that the Drude weight D is strictly fullytransferred into the CR strength only in the quasi-classical limit. In the quantum regime, thetotal CR weight DCR may differ from D. When the Fermi level is placed just in between twoLLs (|ν| = 4m + 2, m = 1, 2, 3, . . .), we still have D = DCR, but for the half-filled last occupiedLL (|ν| = 4m, m = 1, 2, 3, . . .) we obtain DCR < D [50]:
DCR = D
[1
2+
1
4
(√1 +
1
m+
√1 −
1
m
)]. (3)
However, one can easily verify that this suppression, which is related to the transfer of theoscillator strength between intra- and inter-band absorptions, remains very small for m > 2(below 2%). The approximation D = DCR is thus very applicable as long as the zero LL is notinvolved in the CR absorption.
4. Conclusions
To conclude, an absolute magneto-transmission experiment on highly doped quasi-free-standinggraphene allowed us to follow the oscillator strength of the CR, which exactly matches thezero-field Drude weight. We found that this weight remains very close to D = 2|EF|σuni/h =
e2vF√
π |n|/(2h) = π |n|e2/(2mc) and that a single-particle-like picture is fully sufficient toaccount for our data, provided that the renormalized (quasiparticle) parameters EF, vF and/ormc are considered. This implies that the Drude weight in a doped graphene sheet is enhancedwith respect to its bare value due to electron–electron interactions and that the enhancementis tied to the Fermi velocity enhancement [51, 52]. Our findings are in excellent agreementwith a recent theoretical work [15], which predicted an enhancement of the Drude weight
New Journal of Physics 14 (2012) 095008 (http://www.njp.org/)
9
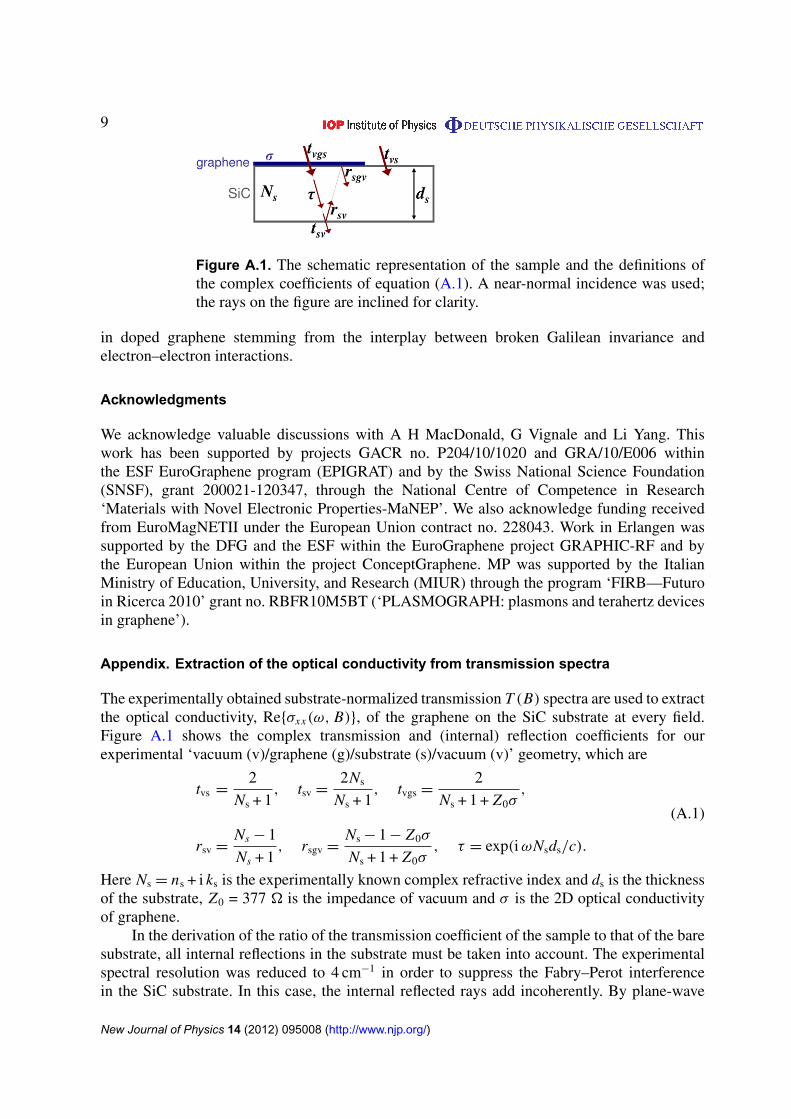
Figure A.1. The schematic representation of the sample and the definitions ofthe complex coefficients of equation (A.1). A near-normal incidence was used;the rays on the figure are inclined for clarity.
in doped graphene stemming from the interplay between broken Galilean invariance andelectron–electron interactions.
Acknowledgments
We acknowledge valuable discussions with A H MacDonald, G Vignale and Li Yang. Thiswork has been supported by projects GACR no. P204/10/1020 and GRA/10/E006 withinthe ESF EuroGraphene program (EPIGRAT) and by the Swiss National Science Foundation(SNSF), grant 200021-120347, through the National Centre of Competence in Research‘Materials with Novel Electronic Properties-MaNEP’. We also acknowledge funding receivedfrom EuroMagNETII under the European Union contract no. 228043. Work in Erlangen wassupported by the DFG and the ESF within the EuroGraphene project GRAPHIC-RF and bythe European Union within the project ConceptGraphene. MP was supported by the ItalianMinistry of Education, University, and Research (MIUR) through the program ‘FIRB—Futuroin Ricerca 2010’ grant no. RBFR10M5BT (‘PLASMOGRAPH: plasmons and terahertz devicesin graphene’).
Appendix. Extraction of the optical conductivity from transmission spectra
The experimentally obtained substrate-normalized transmission T (B) spectra are used to extractthe optical conductivity, Re{σxx(ω, B)}, of the graphene on the SiC substrate at every field.Figure A.1 shows the complex transmission and (internal) reflection coefficients for ourexperimental ‘vacuum (v)/graphene (g)/substrate (s)/vacuum (v)’ geometry, which are
tvs =2
Ns + 1, tsv =
2Ns
Ns + 1, tvgs =
2
Ns + 1 + Z0σ,
(A.1)
rsv =Ns − 1
Ns + 1, rsgv =
Ns − 1 − Z0σ
Ns + 1 + Z0σ, τ = exp(i ωNsds/c).
Here Ns = ns + i ks is the experimentally known complex refractive index and ds is the thicknessof the substrate, Z0 = 377 � is the impedance of vacuum and σ is the 2D optical conductivityof graphene.
In the derivation of the ratio of the transmission coefficient of the sample to that of the baresubstrate, all internal reflections in the substrate must be taken into account. The experimentalspectral resolution was reduced to 4 cm−1 in order to suppress the Fabry–Perot interferencein the SiC substrate. In this case, the internal reflected rays add incoherently. By plane-wave
New Journal of Physics 14 (2012) 095008 (http://www.njp.org/)
10
counting, the experimental transmission coefficients of the bare substrate and the sample arederived in terms of the complex coefficients:
Tvsv =|tvstsvτ |
2
1 −∣∣r 2
svτ2∣∣2 , Tvgsv =
∣∣tvgstsvτ∣∣2
1 −∣∣rsgvrsvτ 2
∣∣2 . (A.2)
The substrate-normalized transmission follows from equations (A.1) and (A.2):
T =Tvgsv
Tvsv=
|Ns + 1|4− |Ns − 1|
4|τ |
4
|(Ns + 1)(Ns + 1 + Z0σ)|2 − |(Ns − 1)(Ns − 1 − Z0σ)|2|τ |4. (A.3)
In the experimental spectral range, ks � ns, therefore ks is neglected in all complexcoefficients (A.1), except in τ . We introduce the absorption coefficient of the substrate α = |τ |
2
and the substrate–vacuum amplitude reflectivity r = (ns − 1)/(ns + 1) in equation (A.3), andafter some algebra the relation between the substrate-normalized transmission and the complexoptical conductivity is found:
T =
[1 +
2
ns + 1
1 + α2r 3
1 − α2r 4Re{Z0σ } +
1
(ns + 1)2
1 − α2r 2
1 − α2r 4|Z0σ |
2
]−1
. (A.4)
Evidently, from the experimental transmission spectra alone, the complex conductivity σ cannotbe extracted. However, note that the prefactor in the term depending on Re{σ } is significantlylarger than the prefactor in the term depending on |σ |
2; therefore the transmission is determinedpredominantly by Re{σ }. In this case, replacing |σ |
2 with Re{σ }2 is a reasonable approximation.
In a magnetic field, equation (A.4) remains valid for each circular polarization separately if σ
is substituted with σ±. For the unpolarized light used in our experiment, the transmission isan average of the two. In order to extract the diagonal conductivity at a finite field, we madea further simplification by ignoring the relatively small effect of σxy on the transmission andby substituting σ with Re{σxx} in equation (A.4). To estimate the error introduced by theseapproximations, we have tested the simplified version of equation (A.4) using the ideal classicalCR absorption described by the standard analytical formulae for σxx and σxy . We found that thearea under Re{σxx}, extracted using the above described procedure, is suppressed with respectto the Drude weight by roughly 5%.
References
[1] Castro Neto A H et al 2009 The electronic properties of graphene Rev. Mod. Phys. 81 109[2] Peres N M R 2010 Rev. Mod. Phys. 82 2673–700[3] Bonaccorso F et al 2010 Graphene photonics and optoelectronics Nature Photon. 4 611[4] Das Sarma S et al 2011 Rev. Mod. Phys. 83 407[5] Nair R R et al 2008 Fine structure constant defines visual transparency of graphene Science 320 1308[6] Kin Fai M et al 2008 Measurement of the optical conductivity of graphene Phys. Rev. Lett. 101 196405[7] Wang F et al 2008 Gate-variable optical transitions in graphene Science 320 206–9[8] Kuzmenko A B et al 2008 Universal optical conductance of graphite Phys. Rev. Lett. 100 117401[9] Stauber T, Peres N M R and Geim A K 2008 Optical conductivity of graphene in the visible region of the
spectrum Phys. Rev. B 78 085432[10] Fei Z et al 2008 High-energy optical conductivity of graphene determined by reflection contrast spectroscopy
Phys. Rev. B 78 201402[11] Li Z Q et al 2008 Dirac charge dynamics in graphene by infrared spectroscopy Nature Phys. 4 532–5[12] Horng J et al 2011 Drude conductivity of Dirac fermions in graphene Phys. Rev. B 83 165113
New Journal of Physics 14 (2012) 095008 (http://www.njp.org/)

11
[13] Yan H et al 2011 Infrared spectroscopy of wafer-scale graphene ACS Nano 5 9854–60[14] Giuliani G F and Vignale G 2005 Quantum Theory of the Electron Liquid (Cambridge: Cambridge University
Press)[15] Abedinpour S H et al 2011 Drude weight, plasmon dispersion and ac conductivity in doped graphene sheets
Phys. Rev. B 84 045429[16] Yang L et al 2009 Excitonic effects on the optical response of graphene and bilayer graphene Phys. Rev. Lett.
103 186802[17] van Schilfgaarde M and Katsnelson M I 2011 First-principles theory of nonlocal screening in graphene Phys.
Rev. B 83 081409[18] Attaccalite C and Rubio A 2009 Fermi velocity renormalization in doped graphene Phys. Status Solidi b
246 2523–6[19] Sadowski M L et al 2006 Landau level spectroscopy of ultrathin graphite layers Phys. Rev. Lett. 97 266405[20] Jiang Z et al 2007 Infrared spectroscopy of Landau levels of graphene Phys. Rev. Lett. 98 197403[21] Deacon R S et al 2007 Cyclotron resonance study of the electron and hole velocity in graphene monolayers
Phys. Rev. B 76 081406R[22] Orlita M et al 2008 Approaching the Dirac point in high-mobility multilayer epitaxial graphene Phys. Rev.
Lett. 101 267601[23] Orlita M and Potemski M 2010 Dirac electronic states in graphene systems: optical spectroscopy studies
Semicond. Sci. Technol. 25 063001[24] Henriksen E A et al 2010 Interaction-induced shift of the cyclotron resonance of graphene using infrared
spectroscopy Phys. Rev. Lett. 104 067404[25] Crassee I et al 2011 Multicomponent magneto-optical conductivity of multilayer graphene on SiC Phys. Rev.
B 84 035103[26] Orlita M et al 2011 Carrier scattering from dynamical magnetoconductivity in quasineutral epitaxial graphene
Phys. Rev. Lett. 107 216603[27] Booshehri L G et al 2012 Circular polarization dependent cyclotron resonance in large-area graphene in
ultrahigh magnetic fields Phys. Rev. B 85 205407[28] Riedl C et al 2009 Quasi-free-standing epitaxial graphene on SiC obtained by hydrogen intercalation Phys.
Rev. Lett. 103 246804[29] Crassee I et al 2011 Giant Faraday rotation in single- and multilayer graphene Nature Phys. 7 48[30] Witowski A M et al 2010 Quasiclassical cyclotron resonance of Dirac fermions in highly doped graphene
Phys. Rev. B 82 165305[31] Schliemann J 2008 Cyclotron motion in graphene New J. Phys. 10 043024[32] Gusynin V P, Sharapov S G and Carbotte J P 2009 On the universal ac optical background in graphene New
J. Phys. 11 095013[33] Mikhailov S A 2009 Nonlinear cyclotron resonance of a massless quasiparticle in graphene Phys. Rev. B
79 241309[34] Crassee I 2012 Intrinsic terahertz plasmons and magnetoplasmons in large scale monolayer graphene Nano
Lett. 12 2470[35] Neugebauer P et al 2009 How perfect can graphene be? Phys. Rev. Lett. 103 136403[36] Ando T 1975 Theory of cyclotron-resonance lineshape in a 2-dimensional electron-system J. Phys. Soc. Japan
38 989–97[37] Englert Th et al 1983 Observation of oscillatory linewidth in the cyclotron resonance of GaAs/Alx Ga1−x As
heterostructures Solid State Commun. 46 545–8[38] Englert Th et al 1983 Oscillations of the cyclotron resonance linewidth with Landau level filling factor in
GaAs/AlGaAs heterostructures Physica B + C 117–8 631[39] Potemski M et al 1992 Filling factor dependent Landau level broadening studied with inter- and intraband
magneto-optics in GaInAs/AlInAs MDQWs Surf. Sci. 263 591–4[40] Shon N H and Ando T 1998 Quantum transport in two-dimensional graphite system J. Phys. Soc. Japan
67 2421
New Journal of Physics 14 (2012) 095008 (http://www.njp.org/)
12
[41] Yang C H, Peeters F M and Xu W 2010 Landau-level broadening due to electron–impurity interaction ingraphene in strong magnetic fields Phys. Rev. B 82 075401
[42] Yang C H, Peeters F M and Xu W 2010 Density of states and magneto-optical conductivity of graphene in aperpendicular magnetic field Phys. Rev. B 82 205428
[43] Yan H, Li Z, Li X, Zhu W, Avouris P and Xia F 2012 Infrared spectroscopy of tunable Dirac terahertzmagneto-plasmons in graphene Nano Lett. 12 3766–71
[44] Allen S J, Stormer H L and Hwang J C M 1983 Dimensional resonance of the two-dimensional electron gasin selectively doped GaAs/AlGaAs heterostructures Phys. Rev. B 28 4875–7
[45] Heitmann D et al 1992 Spectroscopy of quantum dots and antidots Surf. Sci. 267 245–52[46] Heitmann D and Kotthaus J P 1993 The spectroscopy of quantum dot arrays Phys. Today 46 56[47] Forti S et al 2011 Large-area homogeneous quasifree standing epitaxial graphene on SiC(0001): electronic
and structural characterization Phys. Rev. B 84 125449[48] Ostler M et al 2010 Automated preparation of high-quality epitaxial graphene on 6H–SiC(0001) Phys. Status
Solidi b 247 2924–6[49] Bostwick A et al 2010 Observation of plasmarons in quasi-freestanding doped graphene Science
328 999–1002[50] Gusynin V P, Sharapov S G and Carbotte J P 2007 Anomalous absorption line in the magneto-optical response
of graphene Phys. Rev. Lett. 98 157402[51] Gonzalez J, Guinea F and Vozmediano M A H 1999 Phys. Rev. B 59 R2474–7[52] Elias D C et al 2011 Nature Phys. 7 701
New Journal of Physics 14 (2012) 095008 (http://www.njp.org/)