Many-body effects in the cyclotron resonance of a magnetic dot

Electron Cyclotron Current Drive and SuprathermalElectron Dynamics in the TCV Tokamak
S. Coda, S. Alberti, P. Blanchard1, T.P. Goodman,M.A. Henderson, P. Nikkola, Y. Peysson† and O. Sauter
Centre de Recherches en Physique des Plasmas, AssociationEURATOM-Confederation Suisse, Ecole Polytechnique Federale de Lausanne,CRPP - EPFL, CH-1015 Lausanne, Switzerland† Departement de Recherches sur la Fusion Controlee, AssociationEURATOM-CEA, CEA/Cadarache, 13108 Saint Paul-lez-Durance Cedex,France
E-mail: [email protected]
Abstract. Electron cyclotron current drive (ECCD) is an important prospectivetool for tailoring the current profile in next-step devices. To fill the remaininggaps between ECCD theory and experiment, especially in the efficiency andlocalization of current drive, a better understanding of the physics of suprathermalelectrons appears necessary. On TCV, the fast electron population is diagnosedby a multichordal, spectrometric hard X-ray camera and by a high field sideECE radiometer. The main modeling tool is the quasilinear Fokker-Planck codeCQL3D, which is equipped with a radial particle transport model. Systematicstudies of fast electron dynamics have been performed in TCV with modulatedor pulsed electron cyclotron power, followed by coherent averaging, in order toidentify the roles of collisional relaxation and radial transport in the dynamics ofthe suprathermal population. A consistent picture is emerging from experimentand modeling, pointing to the crucial role of the radial transport of suprathermalelectrons in the physics of ECCD.

ECCD and Suprathermal Electron Dynamics in TCV 2
1. Introduction
Electron cyclotron current drive (ECCD) is an important tool for current profileshaping in magnetically confined plasmas, thanks to the highly localized powerdeposition of the EC wave and the ease of external control of its deposition locationand wave-number spectrum [1, 2]. The strong influence exerted in turn by thecurrent profile shape on the stability of the plasma to MHD modes, as well as on itsconfinement properties, motivates much current ECCD research. In experimentallyrelevant plasma conditions, the EC waves propagate from vacuum or air to theresonance layer in the plasma without encountering any cutoff, allowing the launchingstructures to be placed far from the harsh plasma environment, as may be necessaryin a reactor.
The development of high power, high frequency, long pulse gyrotron sources inrecent years has provided the fusion community with a versatile and mature technologyfor next-step thermonuclear fusion devices [3, 4]. The TCV tokamak (R=0.88 cm,a=0.25 cm, Ip ≤1 MA, Bφ ≤1.54 T) is equipped with a 4.5 MW EC heating system,powered by six second harmonic (X2, 82.7 GHz) and three third harmonic (X3, 118GHz) 0.5 MW gyrotrons. An extremely flexible EC beam delivery system, allowingreal-time poloidal and toroidal steering, matches the equally flexible plasma positionand shape control system of TCV [5].
ECCD experiments have been performed in TCV with the X2 system, for a totaldelivered power of up to 2.8 MW, in a wide variety of plasma shapes, with a broadrange of parallel wave numbers and heating locations. In particular, steady-state,fully non-inductive discharges sustained entirely by ECCD and bootstrap current areroutinely obtained in TCV [6, 7, 8].
The high energy electron population created by ECCD is diagnosed primarilywith a hard X-ray (HXR) pinhole camera, on loan from Tore Supra, and with a highfield side electron cyclotron emission (ECE) system. HXR bremsstrahlung emissionis detected by a linear array of CdTe detectors [9] along 14 chords that cover theoutboard half of the cross section. The radial resolution is approximately 2 cm onthe midplane and the energy resolution is approximately 7 keV [10]. Spectral pulseheight analysis is performed, and eight energy bins are available for each chord withadjustable thresholds within the 10–200 keV range.
The second harmonic X-mode ECE radiometer observes the plasma along one ofthree possible horizontal viewlines, two on the high field side and one on the low fieldside, and operates in the 78–114 GHz range with 24 channels of 0.75 GHz bandwidth[11]. The EC radiation observed on the high field side is dominated by relativisticallydownshifted emission by the high energy end of the electron distribution functionand can thus be employed to diagnose the suprathermal population [12]. The resultsdiscussed in this paper were obtained exclusively with the high field side viewlines.
The quasilinear Fokker-Planck code CQL3D [13] is employed to model thedynamics of the electron distribution function. The code is coupled to the TORAY-GA ray-tracing module [14] and solves the Fokker-Planck equation in two velocity andone spatial dimensions. The equation includes a quasilinear EC wave damping term,a relativistic collision operator and a model for radial diffusion, with an optionaldependence on the parallel velocity, a radial dependence and a particle-conservingadvection term.
A concerted application of these diagnostic and numerical tools in a variety ofexperimental scenarios involving ECCD has generated significant evidence that cross-

ECCD and Suprathermal Electron Dynamics in TCV 3
field transport of suprathermal electrons plays a fundamental role in ECCD physics inTCV, as will be discussed in the remainder of this article. An initial discrepancybetween the predicted and measured ECCD efficiencies has been resolved by theintroduction in CQL3D of a suprathermal electron diffusion coefficient of the order ofthe thermal diffusivity [15]. This also brings the predicted HXR emission considerablycloser to the experimental measurements than in the absence of diffusion, althoughthe agreement is not yet satisfactory. Finally, direct experimental evidence of radialtransport is obtained from time-resolved HXR and ECE measurements in studies withmodulated and pulsed ECCD.
2. ECCD and suprathermal electrons
Current drive by electron cyclotron waves is theoretically predicted to operate onelectrons traveling at substantially suprathermal velocities [16, 17]. Experimentalmeasurements in TCV have confirmed that ECCD is accompanied by the creationand sustainment of a significant suprathermal population. Unmistakable suprathermalfeatures are observed when the EC toroidal injection angle Φ is larger than ∼10–12◦,i.e. when the parallel wave number is finite, as required for ECCD: the HXR spectraldistribution deviates from that of a Maxwellian plasma, and both the HXR photontemperature (calculated from an exponential fit to the high energy component of thespectrum) and the ECE radiative temperature are well in excess of the bulk plasmatemperature measured by Thomson scattering [11, 18, 19]. By contrast, with Φ ' 0(pure heating mode) the three temperatures coincide. (In this article Φ is definedas the angle between the EC beam and its projection on the poloidal plane at thelauncher, and is positive for co-ECCD.)
The dependence of the suprathermal population on the toroidal injection angleis clearly demonstrated by figure 1, which shows the effect of sweeping Φ during aplasma discharge on two out of three launchers: while the bulk temperature and thelower energy HXR signal remain constant, the high energy HXR emission and the ECEradiative temperature increase rapidly with Φ [19]. This example also illustrates thehigh degree of external control of multiple deposition locations and toroidal injectionangles available on TCV, which has proven instrumental in the application of ECCDto current and pressure profile tailoring [5, 6, 7, 20, 21, 22].
The presence of a suprathermal electron population created by X2 ECCD inTCV has also been shown to engender enhanced absorption of the X3 waves over thatexpected for a Maxwellian plasma [23].
As figure 1 shows, the energy resolved HXR measurement is a particularlysensitive indicator of the relative dynamics of the thermal and suprathermalcomponents. On the other hand, photon statistics in this spectral range tend tolimit the intrinsic temporal resolution of the measurement [9]. The ECE diagnostic,by contrast, offers the advantage of good time resolution. However, the interpretationof ECE data is complicated by the fact that a given emission frequency correspondsto a continuum of spatial positions and electron energies, since the EC frequencydepends, relativistically, on both magnetic field and energy. To deconvolve the twoquantities some constraints must be applied. The approach that has shown the mostpromise is based on the assumption of a bi-Maxwellian electron distribution function,describing the bulk and suprathermal populations. This assumption is qualitativelysupported by both HXR data and CQL3D modeling. By then applying constraints onthe profile shapes for the suprathermal density and temperature, the absolute values

ECCD and Suprathermal Electron Dynamics in TCV 4
0
1
(a) PECH
(MW)
0
20
40(b) Toroidal angle (deg)
Angle sweep
0
5 (c) Te,max
(keV)
0
10
20(d) 8−16 keV HXR (kHz)
0
10
20(e) 24−32 keV HXR (kHz)
0
5
10(f) 40−48 keV HXR (kHz)
0 0.5 1 1.5 20
5(g) Off−axis ECE (keV)
Time (s)
Figure 1. TCV discharge 22035 (limiter configuration, plasma currentIp=310 kA, line-averaged density ne=1.5×1019 cm−3, edge elongationκedge=1.4), featuring a sweep of the EC toroidal injection angle on two out ofthree launchers (from +11◦ to +32◦ and from +15◦ to +29◦, respectively): (a)total EC power, (b) toroidal angles of the three launchers (positive for co-ECCD),(c) peak electron temperature, (d–f) three energy channels of the HXR signal ona central chord (in units of 103 counts/s), (g) ECE radiative temperature on anoff-axis channel.
of these quantities can be derived from the ECE data [11].
3. Suprathermal electron dynamics: the role of spatial transport inECCD
The physical underpinnings of electron cyclotron resonance heating (ECRH),particularly the power absorption and the power deposition profile, have been validatedby numerous experimental measurements [24, 25]. Predictions for current drive have

ECCD and Suprathermal Electron Dynamics in TCV 5
also been tested experimentally, with less uniform results: while good agreement withFokker-Planck quasilinear theory is obtained in some devices [26], discrepancies remainin other cases. In particular, ECCD efficiency in TCV has been generally grosslyoverestimated by quasilinear theory, which predicted strong nonlinear enhancementby the unusually large EC power densities achieved [15]. On the other hand, thetotal driven current is underestimated by factors ranging from 1 to 3 [27] by linearcalculations performed by TORAY-GA, based on the Cohen model [28] whichneglects nonthermal effects as well as the current excited in the thermal portion of theelectron distribution by electron-electron collisions.
The key to resolving these discrepancies must lie in the dynamics of thesuprathermal electron population that governs the physics of ECCD. In particular,cross-field transport of the high energy current carriers would tend to reduce theirlocal density and correspondingly limit the nonlinear enhancement of the currentdrive efficiency. In TCV we have studied the suprathermal electron dynamics bothby direct experimental measurements and by numerical simulations, culminating incrucial comparisons between the two.
3.1. Experimental measurements
The spatially resolved, line-integrated HXR measurement can be inverted by varioustechniques to provide a measure of the local emissivity under the assumption ofpoloidal uniformity. A systematic study of the inverted profiles in different ECCDaiming geometries and plasma conditions reveals a complex phenomenology whichis beyond the scope of the present article. Here we shall focus on two nearlyuniversal observations for toroidal injection angles larger than 20◦, which have strongimplications for the topic under discussion. Firstly, with predominantly centraldeposition the inverted profiles are broader than the theoretical power depositionprofile calculated by either TORAY-GA or CQL3D (which are invariably in goodagreement). Secondly, with predominantly off-axis deposition, up to ρ=0.5, theinverted profiles are centrally peaked. (In this paper ρ is a normalized flux-surfacecoordinate proportional to the square root of the enclosed volume.)
These observations are exemplified by figure 2. The HXR emissivity profiles areclearly very different from, and in particular much broader than, the power depositionprofiles. Suprathermal electrons thus exist in regions in which the theoretical ECpower deposition is negligible; thus, either the deposition profile is highly anomalous,i.e. departs greatly from the theoretical predictions, or a mechanism must exist fortransporting fast electrons far from the deposition region. The former hypothesis isin disagreement with a large body of evidence showing that ray tracing accuratelypredicts the EC power deposition [24, 25, 29]. These data thus indicate that transportplays a significant role in determining the suprathermal electron distribution attoroidal injection angles > 20◦ and power densities in excess of 2 MW/m3.
While the similarity of the emissivity profiles in figure 2(a) and (b) appears tosuggest a possible profile resilience scenario, figure 2(c) shows that when the EC wavesare deposited at sufficiently large radii the central emissivity falls to zero.
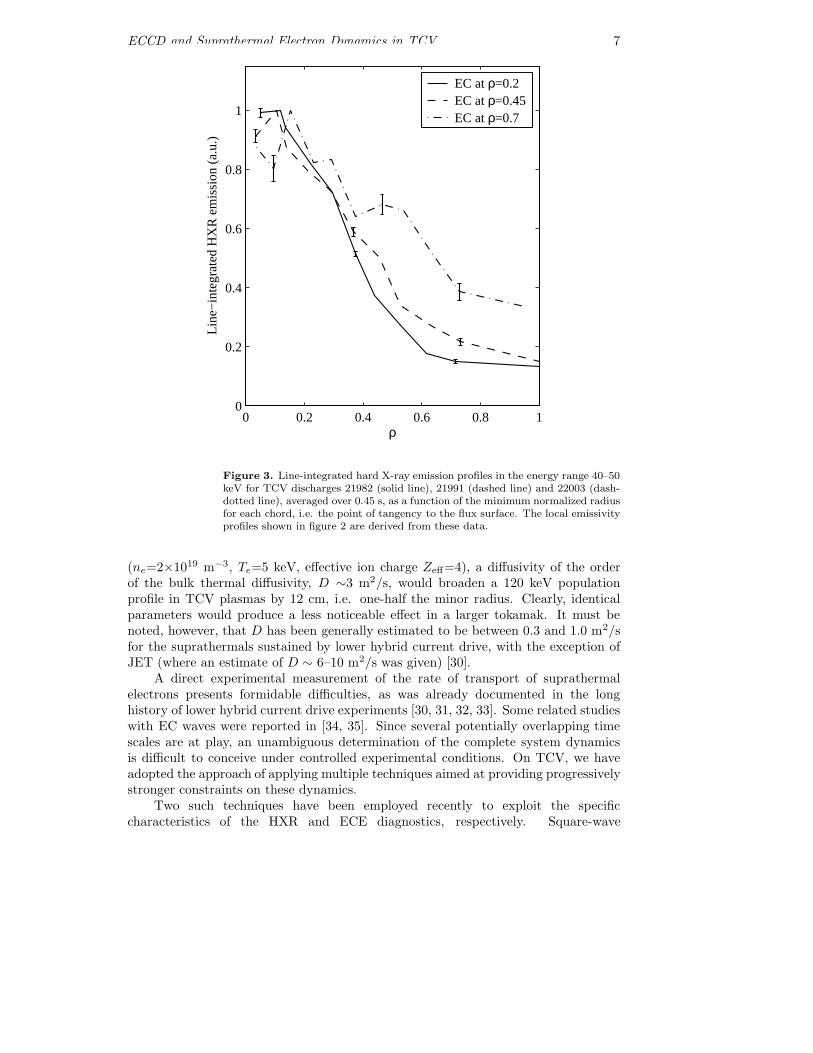
It is important to note that the main features of the profiles, i.e. their widthsand the locations of the main peaks, are not dependent on the details of the profileinversion, and can be readily identified directly in the line-integrated profiles, as shownin figure 3. While minor features of the inverted profiles, particularly the secondarypeaks or plateaus, are in some cases not significant within the statistical uncertainties

ECCD and Suprathermal Electron Dynamics in TCV 6
0
10
0
0.5
1
(a)
0
5E
C p
ower
den
sity
(M
W/m
3 )
0
0.5
1
Har
d X
−ra
y em
issi
vity
(a.
u.)
(b)
0
2
0
0.5
1
0 0.2 0.4 0.6 0.8 1
(c)
ρ
Figure 2. TCV discharges (a) 21982, (b) 21991 and (c) 22003: emissivity profilesof hard X-rays in the energy range 40–50 keV (solid lines), derived with the Fisherregularization method from the line-integrated profiles averaged from 0.67 to 1.12s; EC power density profiles (dashed lines) calculated by ray tracing. The totalinjected power is 1.15 MW, with 100% calculated first-pass absorption for (a)and (b) and 62% for (c) (multiple-pass absorption near the center is estimated tobe negligible in this launching geometry). The effective toroidal injection anglesfor all launchers are in the range +25–29◦. The three cases are similar limiteddischarges with Ip =230–240 kA, ne=1.5–1.7×1019 cm−3, κedge=1.5–1.6.
(shown on the integrated profiles), emissivity distributions as narrow as the EC powerdeposition profiles would clearly be incompatible with the measured line-integratedprofiles.
The dynamics of suprathermal electrons are governed by several competingdiffusive processes: collisional relaxation in velocity space (slowing-down and pitch-angle scattering), quasilinear rf diffusion in velocity space, and anomalous turbulence-driven transport in real space. There is no “source”, since the heating process itself isof a diffusive nature (albeit not energy conserving). In general, the dynamics will bedominated by the shortest relaxation time in the system. To illustrate the potentialeffect of radial transport in TCV, let us adopt the common assumption that therelevant time scale is the collisional slowing-down time τSD; in this case the effect ofa radial diffusion coefficient D will be to broaden the fast electron profile by
∆w ∼ (DτSD)1/2. (1)
As an example with typical central parameters for TCV discharges with ECCD
ECCD and Suprathermal Electron Dynamics in TCV 7
0 0.2 0.4 0.6 0.8 10
0.2
0.4
0.6
0.8
1
Line
−in
tegr
ated
HX
R e
mis
sion
(a.
u.)
ρ
EC at ρ=0.2EC at ρ=0.45EC at ρ=0.7
Figure 3. Line-integrated hard X-ray emission profiles in the energy range 40–50keV for TCV discharges 21982 (solid line), 21991 (dashed line) and 22003 (dash-dotted line), averaged over 0.45 s, as a function of the minimum normalized radiusfor each chord, i.e. the point of tangency to the flux surface. The local emissivityprofiles shown in figure 2 are derived from these data.
(ne=2×10¹⁹ m−3, Te=5 keV, effective ion charge Zeff=4), a diffusivity of the orderof the bulk thermal diffusivity, D ∼3 m2/s, would broaden a 120 keV populationprofile in TCV plasmas by 12 cm, i.e. one-half the minor radius. Clearly, identicalparameters would produce a less noticeable effect in a larger tokamak. It must benoted, however, that D has been generally estimated to be between 0.3 and 1.0 m2/sfor the suprathermals sustained by lower hybrid current drive, with the exception ofJET (where an estimate of D ∼ 6–10 m2/s was given) [30].
A direct experimental measurement of the rate of transport of suprathermalelectrons presents formidable difficulties, as was already documented in the longhistory of lower hybrid current drive experiments [30, 31, 32, 33]. Some related studieswith EC waves were reported in [34, 35]. Since several potentially overlapping timescales are at play, an unambiguous determination of the complete system dynamicsis difficult to conceive under controlled experimental conditions. On TCV, we haveadopted the approach of applying multiple techniques aimed at providing progressivelystronger constraints on these dynamics.
Two such techniques have been employed recently to exploit the specificcharacteristics of the HXR and ECE diagnostics, respectively. Square-wave

ECCD and Suprathermal Electron Dynamics in TCV 8
0
1
2
3(a) EC power (MW)
0
0.2
0.4(b) HXR > 30 keV (kHz)
0
1
2
3(c) <n
e> (1019 m−3)
1.18 1.2 1.22 1.24 1.26 1.28 1.30
5
(d) Peak Te (keV)
Time (s)
Figure 4. TCV shot 21978 (limiter configuration, Ip =240 kA, κedge=1.5–1.6):time histories, during one EC modulation period (Φ=+25◦), of (a) EC power, (b)HXR emission along a central chord for photon energies larger than 30 keV, (c)line-averaged electron density, (d) peak electron temperature.
modulation of the electron cyclotron power has been performed in order to enhancethe photon statistics and thus the temporal resolution of the HXR camera by coherentaveraging. Photon statistics also dictated high power levels (typically 2.25 MW with50% duty cycle), which resulted in strong modulation of the bulk plasma parameters,particularly the density and the temperature (see figure 4). Since the electron energyconfinement time is of the same order as the slowing-down time for electrons travellingat 5 to 8 times the thermal velocity, a separation of the relevant time scales becomesimpossible.
However, information on the suprathermal dynamics is contained in the temporalevolution of the spectral distribution of the HXR signals. If the slowing-down time ismuch shorter than the characteristic diffusion time, the spectra must be determinedby local properties, with no effective communication over distant regions in space.Heating is applied to different velocity classes in different spatial regions, becauseof the Doppler shift needed to match the resonance condition locally. Additionally,the physical parameters that govern the steady-state distribution function, i.e. theEC power density, the bulk plasma density and the bulk electron temperature, areall spatially varying functions. Therefore the resulting spectral distribution shouldnot be spatially uniform in general. However, in the relaxed state we invariablyfind that the spectral shape is essentially constant in space, even well outside thetheoretical deposition region (albeit at much lower amplitude) [36]; this is most

ECCD and Suprathermal Electron Dynamics in TCV 9
40 60 80 100
1e4
1e6
+2.5 ms
HX
R (
keV
/s/k
eV)
(a)
40 60 80 100
+5 ms
40 60 80 100
+7.5 ms
Energy (keV)40 60 80 100
+10 ms
40 60 80 100
+12.5 ms
0 0.50
10
20
30
40
+2.5 ms
Tph
(ke
V)
(b)
0 0.5
+5 ms
0 0.5
+7.5 ms
ρ0 0.5
+10 ms
0 0.5 1
+12.5 ms
Figure 5. TCV shot 21978 (cf. figure 4): (a) HXR emission (in units of powerper photon energy interval) as a function of energy in 5 snapshots after the ECCDswitch-on (t=0), for a central (circles, solid line) and an off-axis (triangles, dashedline, ρ ∼0.6) chord; (b) spatial profiles of the photon temperature for the samesnapshots (ρ here indicates the minimum normalized radius for each chord, i.e.the point of tangency to the flux surface). Data are coherently averaged over 13modulation periods [19].
naturally interpreted as an equilibration resulting from radial transport, but couldalso indicate an anomalous deposition profile in both physical and velocity space.
These dynamical measurements have shown for the first time that this uniformityis not present immediately after switch-on: as shown in figure 5(a) for a case withcentral co-ECCD (Φ=+25◦), the signal from a central chord is initially larger thanthe off-axis signal at low energy, while their roles are reversed at high energy. The on-axis spectrum does not change appreciably over time, whereas the off-axis spectrumbecomes similar to the former over a period of approximately 10 ms. A correspondingrelaxation of the photon temperature profile towards a flat profile is seen in figure 5(b)[19]. If we assume that the relaxation is of a diffusive nature, we can deduce from theobserved relaxation time a lower bound ∼1.5 m2/s for the diffusivity in this discharge.
The higher sensitivity of the ECE system is compatible with perturbative studies.In a second experiment, we have applied short periodic ECCD pulses to the plasmaand studied the ECE response by coherent averaging. Pulses longer than 0.3 ms wereseen to result in a first peak, followed by a descent and a further increase until the endof the pulse, indicating that the pulse length exceeded the characteristic rf diffusiontime. To avoid this complicating effect, the pulse was thus kept to a length of 0.25–0.3 ms. The applied power was 0.45–0.9 MW with a period of 10 ms, therefore a 3%duty cycle and an average power <27 kW, too low to affect the plasma parameters

ECCD and Suprathermal Electron Dynamics in TCV 10
0
1
EC
pow
er (
MW
)0
2
4
(a) TCV shot 23146
EC
E s
igna
ls (
a.u.
)
0
0.2
0.4
0 0.5 10
0.5
1
1.5
2
2.5
(b) TCV shot 23149
Time (ms)
Figure 6. Response of selected ECE signals to a short central ECCD pulse(ending at t=0), averaged over 170 coherent pulses; the ECE frequency increasesas the peak moves to later times: (a) ECE radiometer on the midplane, (b) ECEradiometer off-axis (ρ >0.55). (See geometry in figure 7.) The plasma conditionsare similar in the two discharges: limiter configuration, Ip =240 kA, ne=1.7–1.8×1019 cm−3, Te,max=1.6–1.7 keV, κedge=1.4–1.5. The EC power in case (a)is twice the power in case (b).
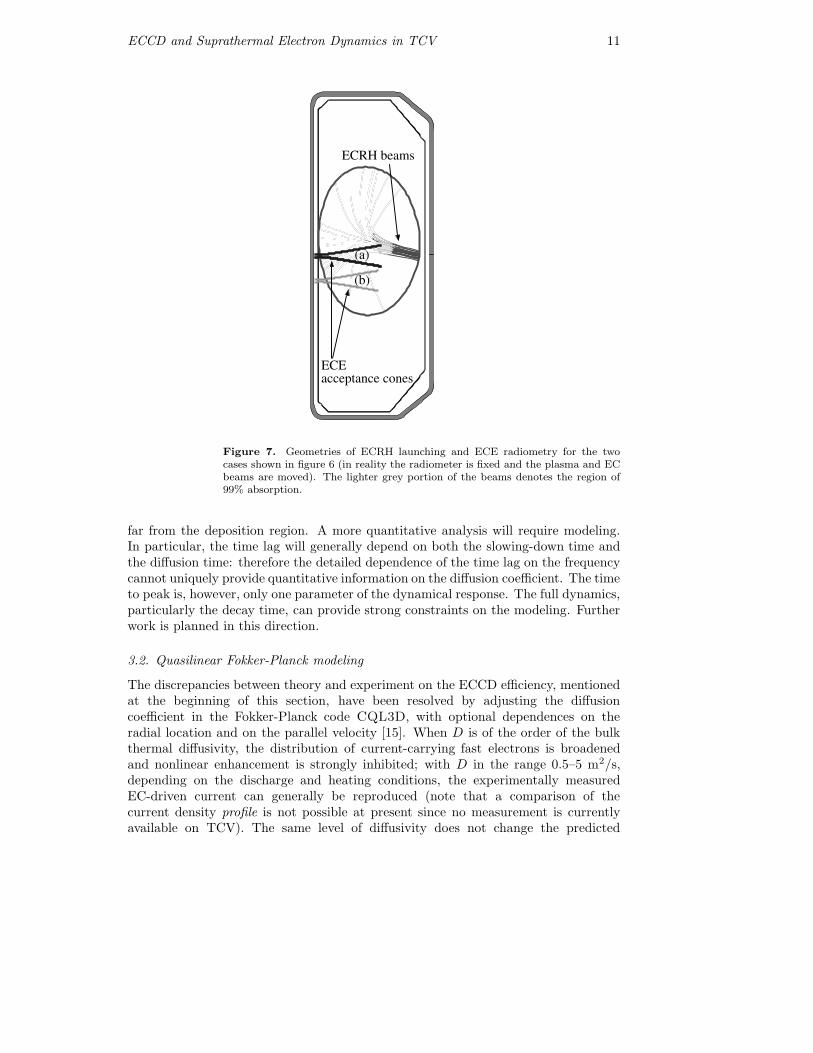
measurably.Two examples, both with central ECCD, are shown in figure 6, with the plasma
and ECE radiometer geometries shown in figure 7. In the case of figure 7(a) theECE chord traverses the plasma center, whereas in the case of figure 7(b) the smallestnormalized minor radius accessed by ECE is approximately 0.55. In both cases thetime to peak increases with the ECE frequency, as shown in figure 8. Moreover, thetime lags are clearly larger when the ECE radiometer is aimed off-axis: indeed, whenplotted versus the cold-resonance ρ, the two curves connect smoothly to each other[figure 8(II)].
The cold-resonance radial coordinate in figure 8(II) is to be taken only as a guidingparameter: indeed, in the presence of a substantial suprathermal tail, an increasein frequency can be associated either to a shift towards the high field side (largerminor radius) or to an increase in electron energy. However, for equal energy andfrequency, the signals from the two chords originate in different spatial regions. Thusthis observation corroborates the hypothesis that a transport mechanism is at play andthat a non-negligible fraction of the fast electrons generated by ECCD is transported
ECCD and Suprathermal Electron Dynamics in TCV 11
ECRH beams
(a)
(b)
ECEacceptance cones
Figure 7. Geometries of ECRH launching and ECE radiometry for the twocases shown in figure 6 (in reality the radiometer is fixed and the plasma and ECbeams are moved). The lighter grey portion of the beams denotes the region of99% absorption.
far from the deposition region. A more quantitative analysis will require modeling.In particular, the time lag will generally depend on both the slowing-down time andthe diffusion time: therefore the detailed dependence of the time lag on the frequencycannot uniquely provide quantitative information on the diffusion coefficient. The timeto peak is, however, only one parameter of the dynamical response. The full dynamics,particularly the decay time, can provide strong constraints on the modeling. Furtherwork is planned in this direction.
3.2. Quasilinear Fokker-Planck modeling
The discrepancies between theory and experiment on the ECCD efficiency, mentionedat the beginning of this section, have been resolved by adjusting the diffusioncoefficient in the Fokker-Planck code CQL3D, with optional dependences on theradial location and on the parallel velocity [15]. When D is of the order of the bulkthermal diffusivity, the distribution of current-carrying fast electrons is broadenedand nonlinear enhancement is strongly inhibited; with D in the range 0.5–5 m2/s,depending on the discharge and heating conditions, the experimentally measuredEC-driven current can generally be reproduced (note that a comparison of thecurrent density profile is not possible at present since no measurement is currentlyavailable on TCV). The same level of diffusivity does not change the predicted

ECCD and Suprathermal Electron Dynamics in TCV 12
80 85 90 95
0
0.2
0.4
0.6
0.8
1
(I)
(a)
(b)
ECE frequency (GHz)
Tim
e to
pea
k (m
s)
0 0.5 1
(II)
(a)
(b)
ρ
Figure 8. Time lag from the end of the ECCD pulse to the ECE peak, for thetwo cases (a) and (b) shown in figure 6, (I) as a function of ECE frequency, (II)as a function of the equivalent ρ at the cold resonance.
efficiency significantly in experimental situations in which nonlinear enhancement isnot expected [15]. Thus a unifying picture is beginning to emerge.
The achievement of fully non-inductive discharges driven entirely by off-axisECCD and bootstrap current [5, 20, 21] is a striking illustration of the effect of thissuprathermal transport. The value of D in the center (D0) having been set suchas to match the total driven current, the EC-driven current profile calculated byCQL3D is only slightly hollow in spite of the power being deposited approximatelyat half-radius, as illustrated by figure 9. (It should be noted that the total currentprofile is nevertheless calculated to be considerably more hollow, owing to a largeoff-axis bootstrap current contribution.) Within the experimental uncertainties, anacceptable match is obtained with D0 in the range 0.5–1.0 m2/s. In this case, Dhas been taken to be independent of the parallel velocity and to increase with radiusaccording to L-mode scaling [15]; in particular, at the EC power deposition location Dequals approximately 0.7–1.4 m2/s. It is important to note that even in the presenceof this radial diffusion, the total driven current (49±8 kA) remains substantially largerthan that predicted by linear theory (17 kA).
When the loop voltage is nonzero, CQL3D calculates the sum of the Ohmic andEC-driven current self-consistently taking into account the effect of the electric field.This current is then compared to the measured total current minus the bootstrapcurrent (calculated from pressure profile measurements by Thomson scattering). Thisprocedure is hampered by limited accuracy in the Ohmic component, which can beascribed in particular to uncertainties in Zeff [37]. For this reason, fully non-inductivedischarges in which the Ohmic current is zero provide an especially strong constraintto the modeling. Nevertheless, the need for a finite diffusion coefficient is readilyapparent also in discharges with a nonzero loop voltage, as shown in figure 10 for

ECCD and Suprathermal Electron Dynamics in TCV 13
0
5
10 (a) D0=0 I
EC=460 kA
0
0.5
1
1.5
EC
CD
cur
rent
den
sity
(M
A/m
2 )
(b) D0=0.2 m2/s I
EC=97 kA
0 0.2 0.4 0.6 0.8 10
0.2
0.4
0.6(c) D
0=1 m2/s I
EC=41 kA
ρ
Figure 9. (a)–(c) EC-driven parallel current density profiles calculated byCQL3D for TCV discharge 21657 at 1.8 s (limiter configuration, Ip =72 kA,ne=5.1×1018 cm−3, Te,max=3.3 keV, κedge=1.6, Zeff = 3.5), fully sustained by0.9 MW off-axis co-ECCD (Φ=+21◦), for three values of the central diffusivity D0
(0, 0.2, 1 m2/s), yielding different values of the EC-driven current (respectively460, 97, 41 kA); the current in case (c) matches the measurement at the low limitof the experimental uncertainty, since the bootstrap current Ip−IEC is 23±8 kA.Linear calculations yield a driven current of 17 kA. The power deposition profileis similar to the calculated current profile in (a) and peaks at ρ=0.4. A radialL-mode-like dependence is assumed for D, yielding a local diffusivity of 1.4 m2/sin case (c) at the deposition location; D is assumed to be independent of velocity.
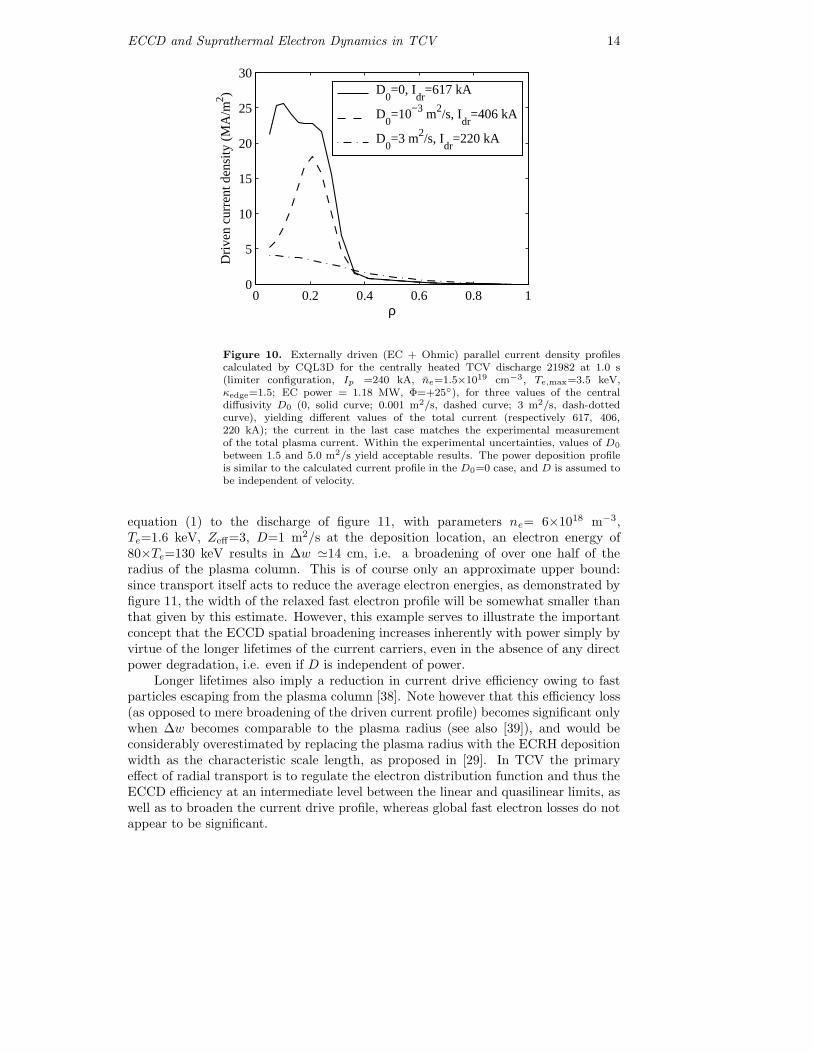
a centrally heated case. In the absence of diffusion, the overestimation of the totalcurrent far exceeds the uncertainty in the modeling.
To gain further insight into the physics of ECCD at the high power densities ofTCV, it is instructive to compare the calculated parallel current density distributionsin velocity space with and without diffusion. The differential densities dj/d|v‖| anddj/dv⊥ (where ‖ and ⊥ are relative to the total magnetic field) are plotted in figure 11for the same non-inductive discharge of figure 9 at the power deposition location(ρ = 0.4). Here, dj/d|v‖| = −e|v‖|
∫∞0
2π [f(v⊥, |v‖|) − f(v⊥,−|v‖|)] v⊥dv⊥, and
dj/dv⊥ = −2πev⊥∫∞−∞ f(v⊥, v‖) v‖dv‖, where f(v⊥, v‖) is the electron distribution
function. The average energy of the current-carrying electrons decreases from ∼70–100 times the thermal energy in the case of no diffusion to ∼10–20 times the thermalenergy with D0=1 m2/s.
The effectiveness of diffusion in broadening the spatial distribution of fastelectrons is enhanced at the high energies to which these electrons are acceleratedby the high-power EC waves: since the slowing-down time increases with velocity asv3, the broadening ∆w, according to equation (1), increases as v3/2. By applying
ECCD and Suprathermal Electron Dynamics in TCV 14
0 0.2 0.4 0.6 0.8 10
5
10
15
20
25
30
Dri
ven
curr
ent d
ensi
ty (
MA
/m2 )
ρ
D0=0, I
dr=617 kA
D0=10−3 m2/s, I
dr=406 kA
D0=3 m2/s, I
dr=220 kA
Figure 10. Externally driven (EC + Ohmic) parallel current density profilescalculated by CQL3D for the centrally heated TCV discharge 21982 at 1.0 s(limiter configuration, Ip =240 kA, ne=1.5×1019 cm−3, Te,max=3.5 keV,κedge=1.5; EC power = 1.18 MW, Φ=+25◦), for three values of the centraldiffusivity D0 (0, solid curve; 0.001 m2/s, dashed curve; 3 m2/s, dash-dottedcurve), yielding different values of the total current (respectively 617, 406,220 kA); the current in the last case matches the experimental measurementof the total plasma current. Within the experimental uncertainties, values of D0
between 1.5 and 5.0 m2/s yield acceptable results. The power deposition profileis similar to the calculated current profile in the D0=0 case, and D is assumed tobe independent of velocity.
equation (1) to the discharge of figure 11, with parameters ne= 6×10¹⁸ m−3,Te=1.6 keV, Zeff=3, D=1 m2/s at the deposition location, an electron energy of80×Te=130 keV results in ∆w '14 cm, i.e. a broadening of over one half of theradius of the plasma column. This is of course only an approximate upper bound:since transport itself acts to reduce the average electron energies, as demonstrated byfigure 11, the width of the relaxed fast electron profile will be somewhat smaller thanthat given by this estimate. However, this example serves to illustrate the importantconcept that the ECCD spatial broadening increases inherently with power simply byvirtue of the longer lifetimes of the current carriers, even in the absence of any directpower degradation, i.e. even if D is independent of power.
Longer lifetimes also imply a reduction in current drive efficiency owing to fastparticles escaping from the plasma column [38]. Note however that this efficiency loss(as opposed to mere broadening of the driven current profile) becomes significant onlywhen ∆w becomes comparable to the plasma radius (see also [39]), and would beconsiderably overestimated by replacing the plasma radius with the ECRH depositionwidth as the characteristic scale length, as proposed in [29]. In TCV the primaryeffect of radial transport is to regulate the electron distribution function and thus theECCD efficiency at an intermediate level between the linear and quasilinear limits, aswell as to broaden the current drive profile, whereas global fast electron losses do notappear to be significant.

ECCD and Suprathermal Electron Dynamics in TCV 15
0
0.5
1
1.5
2
dj/d
(v*/v
th)
(MA
/m2 ) (a) D
0=0 dj/d|v
par|
dj/dvperp
0 5 10 15 20 25
−0.05
0
0.05
0.1
0.15dj
/d(v
*/vth
) (M
A/m
2 ) (b) D0=1 m2/s
v*/v
th
dj/d|vpar
|dj/dv
perp
Figure 11. Differential parallel current densities in velocity space, dj/d|v‖| (solidcurves) and dj/dv⊥ (dashed curves), calculated by CQL3D for TCV shot 21657at ρ = 0.4 and 1.8 s (cf. figure 9): (a) D0=0, (b) D0=1 m2/s. In the abscissa v∗denotes |v‖| and v⊥, respectively, for dj/d|v‖| and dj/dv⊥.
It should be further noted that in a future reactor-scale tokamak such as ITERthe large machine size would result both in a reduced power density and in anincreased device scale length, rendering the spatial broadening negligible for allpractical purposes.
Different forms of functional dependence of the diffusivity on the parallel velocity,derived from different models of electrostatic or magnetic turbulence, have beenemployed in CQL3D, with no conclusive evidence thus far in favor of one or theother [37]. The reason for this can be gleaned from figure 11: different models willgive similar results provided the value of the diffusivity is approximately the same inthe current-carrying region of velocity space.
A remarkable similarity is observed between the current distributions in theparallel and perpendicular velocities. On the low field side of the nominal resonance,electrons that resonate with EC waves of finite parallel wave number possesssuprathermal parallel velocities; the wave-particle interaction, on the other hand, actsto increase the perpendicular velocity. The simulations show that the combinationof the two effects results in a current distribution that is approximately symmetricin |v‖| and v⊥ (a considerable weaker symmetry, however, than complete pitch-angleisotropy, which is certainly not satisfied).

ECCD and Suprathermal Electron Dynamics in TCV 16
3.3. Comparison of calculated and measured HXR emission
A further approach to studying the suprathermal electron relaxation phenomenaconsists of direct comparisons of HXR data with the bremsstrahlung emissionpredicted by the CQL3D code for the specific geometry of our diagnostic. The resultsof these comparisons have been mixed. Good agreement is generally found in thespectral distribution, i.e. in the photon temperature (see figure 12). The absoluteemission in the deposition region is often well reproduced [see figure 12(a)], althoughit is underestimated in some cases by up to an order of magnitude [15, 19, 37, 40][figure 12(b)]. The emission profile shape is found to be in good agreement inhigher-power cases with D0 >0.5 m2/s [figure 12(b)], whereas in the lower-power,centrally heated case of figure 12(a), the low diffusivity (D0=0.1 m2/s) suggestedby the modeling leads to an emission profile that is considerably more peakedthan its experimental counterpart. Preliminary results indicate that the matchcan be improved in this case by adjusting the dependence of the diffusivity on theparallel electron velocity. These comparisons could thus ultimately provide strongerconstraints for the transport modeling.
In the higher-power scenarios, without radial transport not only is the predictedcurrent much too large, the predicted HXR signal is also far narrower spatially thanthe measured one, as shown in figure 13(a). In particular, these results provide strongevidence that the spatial uniformity of the spectral shape is a consequence of spatialtransport. The shape is parametrized in figure 13(b) by a photon temperature,which is seen to be a strong function of minor radius in the case D0=0, whereaswith D0=3 m2/s a uniform temperature is recovered, which is moreover in excellentquantitative agreement with the experimental values. Note that in the diffusionlesscase the calculated photon temperature appears to decrease with radius, whereas theopposite behavior is observed experimentally immediately after power switch-on (seefigure 5). This disagreement is not significant per se, since the CQL3D calculationsrefer to steady-state conditions and cannot reproduce a dynamical evolution in whichstrong self-inductive transient electric fields are present. In addition, the calculatedspectra are only approximately exponential; in particular, at higher energy the slopebecomes less steep (higher temperature) at larger radii. The key observation in boththe experiment (initial spectrum before diffusion has occurred) and the simulation(steady-state scenario without diffusion) is that the shape of the spectrum is notuniform in space, since all the physical quantities that determine it are indeed notuniform.
4. Conclusions and outlook
ECCD is being used on TCV as a powerful tool for current and pressure profileshaping, especially with the high degree of control afforded by fully non-inductiveoperation, thus in the absence of an electric field, in steady state. At the sametime, TCV is one of the premier test beds for fundamental inquiries into the physicsof ECCD and the associated suprathermal electron dynamics, owing to a uniquelypowerful and flexible ECRH system and dedicated diagnostics, complemented byan advanced and comprehensive Fokker-Planck quasilinear code. The fundamentalrelaxation processes governing the suprathermal dynamics are being investigatedthrough multiple experimental approaches and comparisons with modeling.
Strong evidence supports the conclusion that the suprathermal electrons excited

ECCD and Suprathermal Electron Dynamics in TCV 17
100
102
104
HX
R e
mis
sion
(ke
V/s
/keV
) (a) Shot 19285
0 0.5 110
2
103
104
105
(b) Shot 21982
HX
R e
mis
sion
(ke
V/s
/keV
)
ρ
Figure 12. (a) TCV shot 19285 (0.45 MW central co-ECCD, Φ=+13◦; limiterconfiguration, Ip=205 kA, ne=1.8–1.9×1019 cm−3, Te,max=3 keV, κedge=1.3):measured HXR emission averaged from 0.3 to 0.5 s (circles) vs. that predictedby CQL3D at 0.45 s (curves), as a function of chordal spatial location (minimumnormalized radius) for 5 energy channels of 8 keV width in the 16–56 keV range(descending amplitude for increasing energy); the value of D0 is adjusted inCQL3D to reproduce the experimental current and is equal to 0.1 m2/s; D isassumed to be independent of velocity; (b) TCV shot 21982 (1.18 MW centralco-ECCD, Φ=+25◦; limiter configuration, Ip =240 kA, ne=1.5×1019 cm−3,Te,max=3.5 keV, κedge=1.5; cf. figure 10): experimental average from 0.65 to1.35 s, modeling for 1.0 s, energy channels 30–40, 40–50, 50–60, 60–70 and 70–90 keV; D0=3 m2/s.

ECCD and Suprathermal Electron Dynamics in TCV 18
40 60 80 100 1201e0
1e2
1e4
1e6 (a) HXR emission (keV/s/keV)
Energy (keV)
0 0.2 0.4 0.6 0.80
20
40
60(b) Photon temperature (keV)
ρ
Figure 13. TCV shot 21982 (cf. figure 10): (a) HXR emission spectrum for acentral chord (red) and a chord with a minimum ρ ∼0.37 (blue): experimentaldata averaged from 0.65 to 1.35 s (horizontal bars), CQL3D calculations at 1.0 swith diffusivity D0=3 m2/s (solid curve) and D0=0 (dashed curves); (b) photontemperature calculated from an exponential fit to the spectra in the interval 30-120 keV, as a function of radial position ρ (minimum normalized radius for eachchord): experimental data (green circles), CQL3D data with D0=3 m2/s (solidblack curve) and D0=0 (dashed black curve).
by ECCD undergo cross-field transport at a rate comparable to that of thermaltransport, resulting in a reduction of the nonlinear effects expected at the TCV powerdensities, and particularly of the attendant nonlinear enhancement of the current driveefficiency. However, in spite of this radial transport the efficiency still exceeds thatpredicted by linear theory, which has been shown to be fairly accurate at lower powerlevels [41]. A gain in efficiency is therefore still obtained by operating at higher powerlevels.
It should also be stressed that the observed broadening of the suprathermalcurrent carrier distribution does not affect the applicability of ECRH as a tool forpressure profile shaping and, through modification of the conductivity, for currentprofile shaping, since the power deposition remains very localized. In applicationswith characteristic time scales exceeding the energy confinement time the shape ofthe pressure profile is primarily controlled by thermal energy transport rather than bythe breadth of the power deposition profile. Transport of suprathermals, when theyare present (i.e. in an ECCD configuration), occurs at a rate close to that of thermal

ECCD and Suprathermal Electron Dynamics in TCV 19
energy and thus does not alter this picture.By contrast, the localization of current drive is, of course, significantly diminished
in the high power density scenario of TCV. However, even under these conditions theglobal current profile can be controlled to a considerable extent by moving the centroidof each EC source’s deposition profile, with dramatic effects on the energy confinementand on the bootstrap current fraction [5, 20, 21]. In addition, the broadening of theECCD profile at the very small parallel wave numbers used, e.g., in sawtooth controlexperiments [42] is expected to be modest as a result of the lower electron energiesinvolved [36] (through the aforementioned ∆w ∝ v3/2 dependence).
Much remains to be known about the underlying transport mechanism. Fokker-Planck simulations using different transport models, based on both electrostatic andelectromagnetic turbulence, have thus far been inconclusive. Stronger constraints arehowever expected to be provided by further comparisons between the calculated andmeasured HXR emission. A crucial question that must be addressed is the dependenceof this transport on the ECRH power density itself; it is plausible for instance tosuppose a power degradation mechanism to be at play as in thermal transport, assuggested also by the modeling results discussed in this paper, but this hypothesis hasnot yet been tested systematically.
Acknowledgments
The authors are grateful to the entire TCV team for the operation of the tokamak andof the auxiliary heating systems, and to CEA-Cadarache for the loan of the hard X-ray camera and associated equipment. It is a pleasure to acknowledge the continuingassistance of R.W. Harvey in the operation of the CQL3D code. This work wassupported in part by the Swiss National Science Foundation.
References
[1] Erckmann V and Gasparino V 1994 Plasma Phys. Control. Fusion 36 1869[2] Lloyd B 1998 Plasma Phys. Control. Fusion 40 A119[3] Alberti S et al 2001 Fusion Eng. Design 53 387[4] Piosczyk B et al Fusion Energy 2002 (Proc. 19th Int. Conf.
Lyon, 2002) (Vienna: IAEA) CD-ROM file CT-7Rb andhttp://www.iaea.org/programmes/ripc/physics/fec2002/html/fec2002.htm
[5] Goodman T.P. et al 2003 “An Overview of Recent Results From the TCV Tokamak” submittedto Nucl. Fusion
[6] Sauter O. et al 2000 Phys. Rev. Lett. 84 3322[7] Coda S. et al 2000 Plasma Phys. Control. Fusion 42 B311[8] Sauter O. et al 2001 Phys. Plasmas 8 2199[9] Peysson Y. and Imbeaux F. 1999 Rev. Sci. Instrum. 70 3987
[10] Peysson Y., Coda S. and Imbeaux F. 2001 Nucl. Instrum. and Methods in Phys. Res. A 458269
[11] Blanchard P., Alberti S., Coda S., Weisen H. and Klimanov I. 2002 Plasma Phys. Control.Fusion 44 2231
[12] TFR Group and Fidone I 1981 Phys. Rev. A 24 2861[13] Harvey R.W. and McCoy M.G. 1993 Proc. IAEA Technical Committee Meeting on Advances
in Simulation and Modeling in Thermonuclear Plasmas (Montreal, 1992) (Vienna: IAEA) p498
[14] Matsuda K. 1989 IEEE Trans. Plasma Sci. 17 6[15] Harvey R.W., Sauter O., Prater R. and Nikkola P. 2002 Phys. Rev. Lett. 88 205001[16] Fisch N.J. and Boozer A.H. 1980 Phys. Rev. Lett. 45 720[17] Harvey R.W., McCoy M.G. and Kerbel G.D. 1989 Phys. Rev. Lett. 62 426
ECCD and Suprathermal Electron Dynamics in TCV 20
[18] Coda S. et al 1999 Proc. 26th Eur. Conf. on Controlled Fusion and Plasma Physics (Maastricht1999) (European Physical Society) Europhys. Conf. Abstr. 23J 1097
[19] Coda S. et al 2002 Proc. 29th Eur. Conf. on Controlled Fusion and Plasma Physics (Montreux2002) (European Physical Society) Europhys. Conf. Abstr. 26B (O-4.03)
[20] Sauter O. et al 2002 Proc. 29th Eur. Conf. on Controlled Fusion and Plasma Physics (Montreux2002) (European Physical Society) Europhys. Conf. Abstr. 26B (P-2.087)
[21] Sauter O. et al Fusion Energy 2002 (Proc. 19th Int. Conf.Lyon, 2002) (Vienna: IAEA) CD-ROM file EX/P5-06 andhttp://www.iaea.org/programmes/ripc/physics/fec2002/html/fec2002.htm
[22] Pochelon A. et al Fusion Energy 2002 (Proc. 19th Int. Conf.Lyon, 2002) (Vienna: IAEA) CD-ROM file EX/P5-14 andhttp://www.iaea.org/programmes/ripc/physics/fec2002/html/fec2002.htm
[23] Alberti S. et al 2002 Nucl. Fusion 42 42[24] Goodman T.P. et al 1998, Proc. 2nd Europhysics Topical Conf. on Radio Frequency Heating
and Current Drive of Fusion Devices (Brussels, 1998) p 245[25] Petty C.C. et al 2000 Proc. 4th Int. Conf. on Strong Microwaves in Plasmas (Nizhny Novgorod,
1999) (Nizhny Novgorod: Russian Academy of Sciences) 1 41[26] Petty C.C. et al 2001 Nucl. Fusion 41 551[27] Nikkola P. and Sauter O. 2000 Proc. Joint Varenna-Lausanne Int. Workshop (Varenna, 2000)
(Bologna: Editrice Compositori) Theory of Fusion Plasmas p 345[28] Cohen R.H. 1987 Phys. Fluids 30 2442[29] Luce T.C. 2002 IEEE Trans. Plasma Sci. 30 734[30] Peysson Y. 1993 Plasma Phys. Control. Fusion 35 B253[31] Kirkwood R. et al 1990 Phys. Fluids B 2 1421[32] Giruzzi G. et al 1995 Phys. Rev. Lett. 74 550[33] Jones S.E. et al 1995 Phys. Plasmas 2 1548[34] Lopes Cardozo N.J. et al in Plasma Physics and Controlled Nuclear Fusion Research 1992 (Proc.
14th Int. Conf. Wurzburg, 1992), Vol. 1, IAEA, Vienna (1993) 271[35] Esipchuk Yu.V., Kirneva N.A., Martynov A.A. and Trukhin V.M. 1995 Fizika Plazmy 21 577
[1995 Plasma Phys. Reports 21 577][36] Coda S. et al 2001 Proc. 28th Eur. Conf. on Controlled Fusion and Plasma Physics (Madeira
2001) (European Physical Society) Europhys. Conf. Abstr. 25A 301[37] Nikkola P., Coda S., Harvey R.W. and Sauter O. 2002 Proc. Joint Varenna-Lausanne Int.
Workshop (Varenna, 2002) (Bologna: Societa Italiana di Fisica) Theory of Fusion Plasmasp 315
[38] Luckhardt S.C. 1987 Nucl. Fusion 27 1914[39] O’Brien M.R., Cox M. and McKenzie J.S. 1991 Nucl. Fusion 31 583[40] Nikkola P. et al 2003 “Modeling of the electron cyclotron current drive experiments in the TCV
tokamak” submitted to Nucl. Fusion[41] Petty C.C. et al 2003 Nucl. Fusion 43 700[42] Angioni C. et al 2003 Nucl. Fusion 43 455
1Present and permanent address: Departement de Recherches sur la Fusion Controlee,Association EURATOM-CEA, CEA/Cadarache, 13108 Saint Paul-lez-Durance Cedex, France
Copyright © 2022 FDOKUMEN