A beam profile measurement in the ACCEL 250 MeV medical proton cyclotron
7
Nuclear Instruments and Methods in Physics Research A 569 (2006) 706–712 A beam profile measurement in the ACCEL 250 MeV medical proton cyclotron C. Baumgarten , A. Geisler, U. Klein, D. Krischel, H. Ro¨cken, M. Schillo, T. Stephani, J.H. Timmer ACCEL Instruments GmbH, Friedrich-Ebert-Str. 1, 51429 Bergisch Gladbach, Germany Received 4 July 2006; received in revised form 19 September 2006; accepted 20 September 2006 Available online 16 October 2006 Abstract The result of a beam profile measurement in the first turn after the internal ion source of the 250 MeV ACCEL compact medical proton cyclotron is presented and compared to beam profiles obtained by orbit tracking computations. The comparison allows to determine parameters like puller voltage, average start energy of the protons and shape of the plasma boundary by fitting the computed beam contour to the measured profile. r 2006 Elsevier B.V. All rights reserved. PACS: 29.20.Hm; 45.50.Pk; 29.27.Ac; 29.27.a Keywords: Cyclotron; Particle tracking; Beam injection 1. Introduction Based on a proposal from and in collaboration with the National Superconducting Cyclotron Laboratory (NSCL), ACCEL Instruments GmbH has designed a superconduct- ing proton cyclotron for radiation therapy [1,2]. It is a four sector AVF isochronous compact proton machine operat- ing in second harmonic mode with an RF frequency of 72 MHz. The central magnetic field strength is about 2:4T and the extraction radius is 815 mm. More key parameters are given by Geisler et al. [3] and Klein et al. [4]. Two cyclotrons of this type were built and commissioned in 2005. The first was delivered to the Paul Scherrer Institute (PSI) in Switzerland, the second is part of the proton therapy facility of the Rinecker Proton Therapy Center (RPTC) in Munich, Germany. The ACCEL cyclotron is the first compact cyclotron that has been extensively simulated in computer models in all key aspects—magnetic and electric fields, RF cavities, neutron heating and many more. Especially the central region has attracted a lot of attention during development. There are several reasons for this special attention. First, the strength of the electric fields in the central region, which is a critical parameter with respect to sparking, feasibility and reliability. Second, the use of an internal ion source implicates the presence of low energy protons in the first turn. At low energy the beam is more sensitive to the electric RF field than at high energy. It requires numerical models of high accuracy and reasonable assumptions about the starting conditions of the protons to achieve agreement between experiment and computer simulation. The ACCEL tracking software is an ACCEL develop- ment, derived in parts from the NSCL tracking programs Z3CYCLONE and SPRGAP [5]. 2. Central region One of the early studies of the central region has been presented by Snyder and Marti [6], who used RELAX3D to obtain an electrostatic model of the central region. The maximum field strength had been determined to be about 100 kV=cm. Nearly twice of this maximum field strength was found by high resolution studies with the software ARTICLE IN PRESS www.elsevier.com/locate/nima 0168-9002/$ - see front matter r 2006 Elsevier B.V. All rights reserved. doi:10.1016/j.nima.2006.09.077 Corresponding author. E-mail address: [email protected] (C. Baumgarten).
-
Upload
independent -
Category
Documents
-
view
1 -
download
0
Transcript of A beam profile measurement in the ACCEL 250 MeV medical proton cyclotron
ARTICLE IN PRESS
0168-9002/$ - se
doi:10.1016/j.ni
�CorrespondE-mail addr
Nuclear Instruments and Methods in Physics Research A 569 (2006) 706–712
www.elsevier.com/locate/nima
A beam profile measurement in the ACCEL 250MeV medicalproton cyclotron
C. Baumgarten�, A. Geisler, U. Klein, D. Krischel, H. Rocken, M. Schillo,T. Stephani, J.H. Timmer
ACCEL Instruments GmbH, Friedrich-Ebert-Str. 1, 51429 Bergisch Gladbach, Germany
Received 4 July 2006; received in revised form 19 September 2006; accepted 20 September 2006
Available online 16 October 2006
Abstract
The result of a beam profile measurement in the first turn after the internal ion source of the 250MeV ACCEL compact medical
proton cyclotron is presented and compared to beam profiles obtained by orbit tracking computations. The comparison allows to
determine parameters like puller voltage, average start energy of the protons and shape of the plasma boundary by fitting the computed
beam contour to the measured profile.
r 2006 Elsevier B.V. All rights reserved.
PACS: 29.20.Hm; 45.50.Pk; 29.27.Ac; 29.27.�a
Keywords: Cyclotron; Particle tracking; Beam injection
1. Introduction
Based on a proposal from and in collaboration with theNational Superconducting Cyclotron Laboratory (NSCL),ACCEL Instruments GmbH has designed a superconduct-ing proton cyclotron for radiation therapy [1,2]. It is a foursector AVF isochronous compact proton machine operat-ing in second harmonic mode with an RF frequency of72MHz. The central magnetic field strength is about 2:4Tand the extraction radius is 815mm. More key parametersare given by Geisler et al. [3] and Klein et al. [4].
Two cyclotrons of this type were built and commissionedin 2005. The first was delivered to the Paul ScherrerInstitute (PSI) in Switzerland, the second is part of theproton therapy facility of the Rinecker Proton TherapyCenter (RPTC) in Munich, Germany.
The ACCEL cyclotron is the first compact cyclotron thathas been extensively simulated in computer models in allkey aspects—magnetic and electric fields, RF cavities,neutron heating and many more. Especially the central
e front matter r 2006 Elsevier B.V. All rights reserved.
ma.2006.09.077
ing author.
ess: [email protected] (C. Baumgarten).
region has attracted a lot of attention during development.There are several reasons for this special attention. First,the strength of the electric fields in the central region, whichis a critical parameter with respect to sparking, feasibilityand reliability. Second, the use of an internal ion sourceimplicates the presence of low energy protons in the firstturn. At low energy the beam is more sensitive to theelectric RF field than at high energy. It requires numericalmodels of high accuracy and reasonable assumptions aboutthe starting conditions of the protons to achieve agreementbetween experiment and computer simulation.The ACCEL tracking software is an ACCEL develop-
ment, derived in parts from the NSCL tracking programsZ3CYCLONE and SPRGAP [5].
2. Central region
One of the early studies of the central region has beenpresented by Snyder and Marti [6], who used RELAX3Dto obtain an electrostatic model of the central region. Themaximum field strength had been determined to be about100 kV=cm. Nearly twice of this maximum field strengthwas found by high resolution studies with the software
ARTICLE IN PRESSC. Baumgarten et al. / Nuclear Instruments and Methods in Physics Research A 569 (2006) 706–712 707
program Opera (Vector Fields) using the accurate 3Dgeometry of the central region structures at ACCEL [7]. Inconsequence the 3D shapes of the central region structureswere optimized in an iterative process in order to minimizethe sparking probability while keeping an eye on beamphase, energy gain, axial focusing and centering of thebeam.
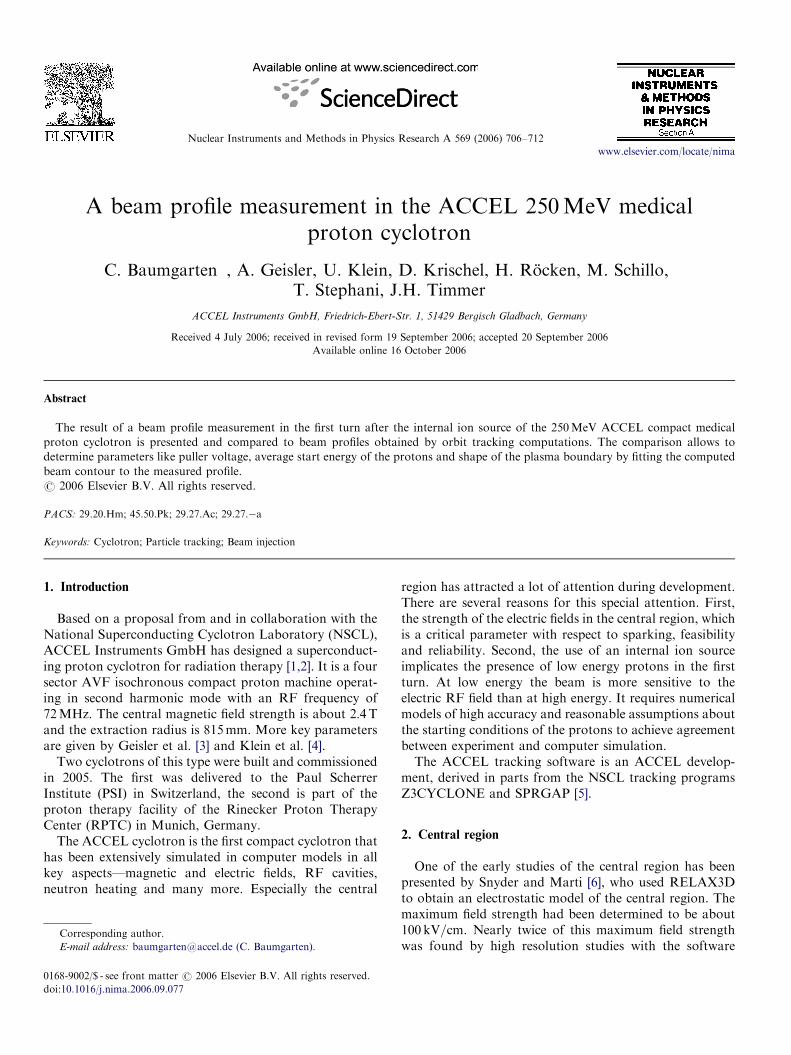
Fig. 1 shows a median plane cut of the first half-turn inthe central region. The hydrogen plasma is axially confinedby the strong magnetic field within a thin-walled tube, theso-called chimney of the internal cold cathode ion source.A small lengthy slit in the chimney at the height of themedian plane allows protons to be pulled-off andaccelerated by the negative potential of the so-called puller,that is the nose of the first dee. After transit throughthe puller, the beam has to pass the first fixed phase slit indee 2. Only protons starting within a specific time intervalwith respect to the RF phase are able to pass puller andfixed slit (shown in Fig. 5). The fixed slit also limits themaximum beam current at an energy below the activationthreshold.
3. Measurement
The fixed phase slit is a metal plate with a rectangularclearance for the beam. The plate is slipped into a lengthyslit machined into the post of dee 2 and fixed there by twosmall screws. For the measurement presented in this article,the metal plate of the fixed slit was dismounted, a thinradiation-sensitive polymer film (dosimetric film) was tapedonto it and it was slipped back into position in reversedorientation, so that the physical slit was hidden in the post
Fig. 1. Top view of a median plane cut of the first half turn. The
calculated beam trajectory is shown in dark gray, starting in the upper
right corner at the ion source chimney, then passing the puller dee (lower
right) and reaching the fixed slit in the second dee a quarter turn later. The
arrow indicates the line of sight of the camera in Fig. 2.
as not to distort the measurement. Then the cyclotron wasclosed, evacuated and started. The duration of beamexposure required to obtain a beam trace on this type offilm is typically in the order of a few seconds.Hþ2 ions are according to tracking computations not able
to pass the puller dee and can therefore not affect themeasurement. H� ions carry the opposite charge, are bentin the opposite direction and cannot hit the dosimetric film.Distortion by other ions can therefore be excluded.The time required to open the cyclotron, put in or take
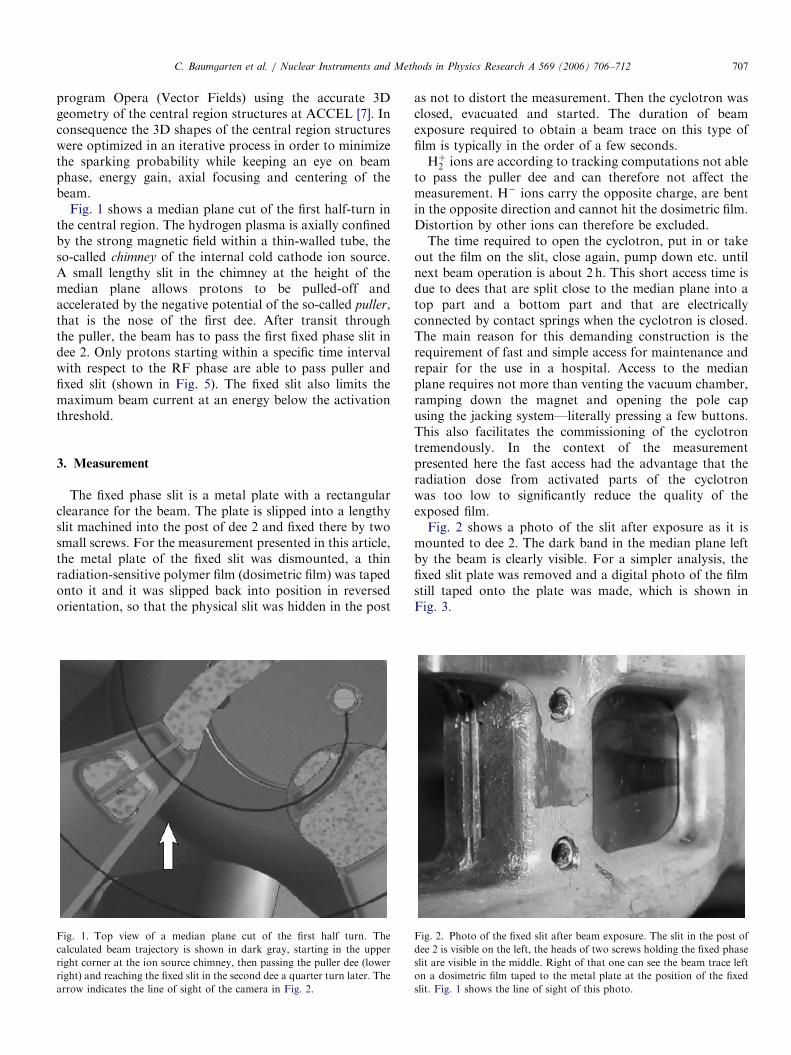
out the film on the slit, close again, pump down etc. untilnext beam operation is about 2 h. This short access time isdue to dees that are split close to the median plane into atop part and a bottom part and that are electricallyconnected by contact springs when the cyclotron is closed.The main reason for this demanding construction is therequirement of fast and simple access for maintenance andrepair for the use in a hospital. Access to the medianplane requires not more than venting the vacuum chamber,ramping down the magnet and opening the pole capusing the jacking system—literally pressing a few buttons.This also facilitates the commissioning of the cyclotrontremendously. In the context of the measurementpresented here the fast access had the advantage that theradiation dose from activated parts of the cyclotronwas too low to significantly reduce the quality of theexposed film.Fig. 2 shows a photo of the slit after exposure as it is
mounted to dee 2. The dark band in the median plane leftby the beam is clearly visible. For a simpler analysis, thefixed slit plate was removed and a digital photo of the filmstill taped onto the plate was made, which is shown inFig. 3.
Fig. 2. Photo of the fixed slit after beam exposure. The slit in the post of
dee 2 is visible on the left, the heads of two screws holding the fixed phase
slit are visible in the middle. Right of that one can see the beam trace left
on a dosimetric film taped to the metal plate at the position of the fixed
slit. Fig. 1 shows the line of sight of this photo.

ARTICLE IN PRESS
Fig. 3. The dosimetric film after beam exposure. The (dashed) lines are
added for analysis purposes. For this special measurement the plate had
been mounted the opposite way compared to normal beam operation. The
beam trace would usually appear on the right side where the real slit is
located on the photo. In the present case it was favorable to have a
uniform background behind the dosimetric film. Note that the photo is
shown in opposite orientation compared to the photo in Fig. 2 in order to
have the geometric cyclotron center on the left and increasing radius to the
right. The upper and lower contour of the beam trace fade out and the
transition boundaries are marked by solid lines.
Flat Plasma Boundary Concave Plasma Boundary Convex Plasma Boundary
Weight = 0.8Weight = 0.1Weight = 0.4
Fig. 4. Top: mid plane cuts of the ion source slit with equipotential lines
(gray) and resulting proton orbits (dark gray) for different weight factors
of the image electrode potential. Bottom: vertical cut through the upper
half of the ion source chimney with equipotential lines (gray) and axial
behavior of proton orbits (dark gray) close to the source slit. The black
solid line is the zero potential contour, i.e. the plasma boundary. The
chimney slit has tapered edges.
C. Baumgarten et al. / Nuclear Instruments and Methods in Physics Research A 569 (2006) 706–712708
4. Comparison with results of orbit tracking
4.1. General method
Proton orbits have been tracked for different sets ofparameters that are used to describe the beam properties inthe first half turn. These are amplitude of dee voltage,average initial proton energy, and plasma boundary shape.For each set of parameters, individual orbit startingconditions, as for instance horizontal and vertical startingposition (X 0 and Z0) at the source chimney slit, horizontaland vertical starting angles (a and b) and the starting timet0, have been iterated and the orbits have been tracked upto the position of the dosimetric film. Each iteration yieldsa few thousand tracks that are used to obtain a beamprofile for comparison with the film.
A quantitative 2D analysis of the beam profiles howeveris not presented—instead it will be discussed qualitatively
what can be learned by comparing measured and computedbeam profile.
4.2. Model assumptions
Neglecting (small) magnetic effects of RF currents, theelectric field in the central region can be derived from ascalar potential V ðx; tÞ, the amplitude of which is called dee
voltage V0 at position x
V ðx; tÞ ¼ V 0 f ðxÞ sin t (1)
where t ¼ ot is the so-called RF time and f ðxÞ 2 ½0 . . . 1�the normalized potential.The starting positions of the individual tracks are
supposed to be located on a surface called the plasma
boundary. The plasma boundary is defined as the zero
potential surface. Without a plasma the surfaces of thegrounded conducting obstacles like the chimney wouldform the zero potential surface. However, the chargedistribution of the so-called plasma sheath influences thefield in such a way that a zero potential surface between thechimney and the (negative) puller exists. Since theelectrostatic model does not include the plasma directly,a fictitious cylindrical ‘‘image electrode’’ [8] along thechimney axis is introduced with a potentialgðxÞ 2 ½�1 . . . 0�. The total potential is then given in aflexible way by the superposition
V ðx; tÞ ¼ V 0ðf ðxÞ þWgðxÞÞ sin t. (2)
ARTICLE IN PRESSC. Baumgarten et al. / Nuclear Instruments and Methods in Physics Research A 569 (2006) 706–712 709
Different weight factors W result a zero potential surface—given by the condition f ðxÞ þW gðxÞ ¼ 0—of either con-vex, flat or concave shape as shown in Fig. 4. The startingposition of a proton is characterized by three parameters,two of them are X 0 and Z0, the horizontal and verticalcoordinates at the source slit. Because the plasmaboundary may have different and complex shapes depend-ing on the chosen value for W, an iterative searchprocedure determines the third coordinate to make surethat the condition f ðxÞ þWgðxÞ ¼ 0 is fulfilled for eachtrack.
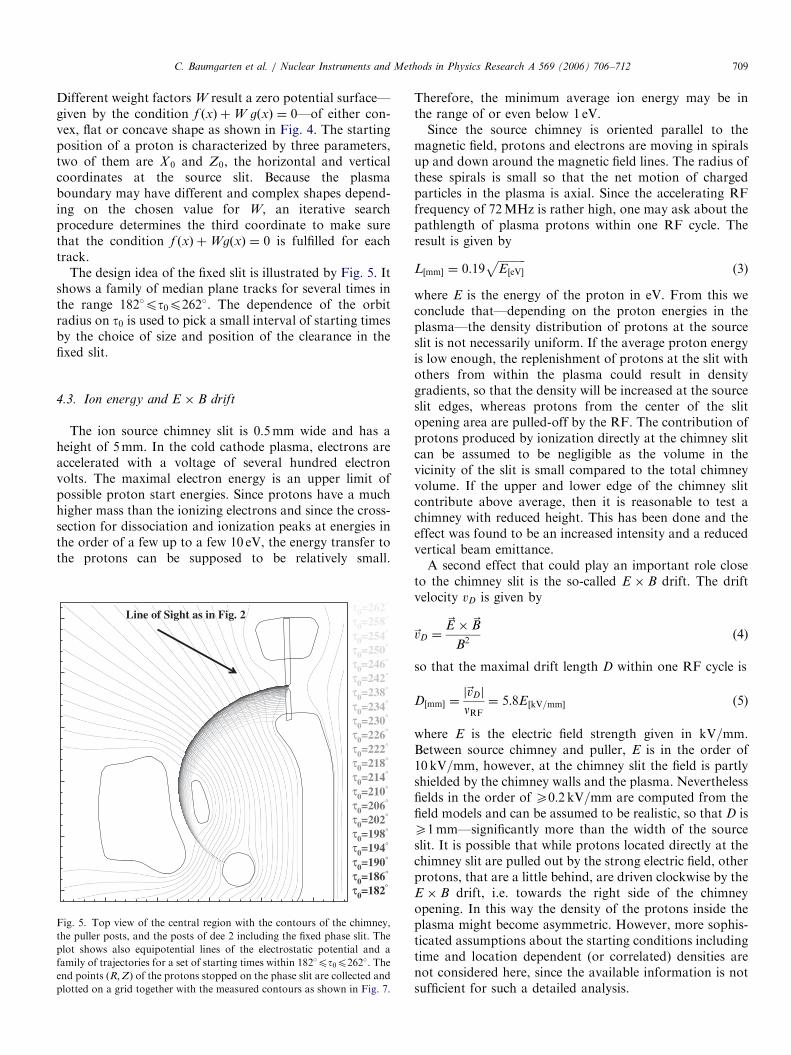
The design idea of the fixed slit is illustrated by Fig. 5. Itshows a family of median plane tracks for several times inthe range 182�pt0p262�. The dependence of the orbitradius on t0 is used to pick a small interval of starting timesby the choice of size and position of the clearance in thefixed slit.
4.3. Ion energy and E � B drift
The ion source chimney slit is 0:5mm wide and has aheight of 5mm. In the cold cathode plasma, electrons areaccelerated with a voltage of several hundred electronvolts. The maximal electron energy is an upper limit ofpossible proton start energies. Since protons have a muchhigher mass than the ionizing electrons and since the cross-section for dissociation and ionization peaks at energies inthe order of a few up to a few 10 eV, the energy transfer tothe protons can be supposed to be relatively small.
τ0=182°τ0=186°τ0=190°τ0=194°τ0=198°τ0=202°τ0=206°τ0=210°τ0=214°τ0=218°τ0=222°τ0=226°τ0=230°τ0=234°τ0=238°τ0=242°τ0=246°τ0=250°τ0=254°τ0=258°τ0=262°
Line of Sight as in Fig. 2
Fig. 5. Top view of the central region with the contours of the chimney,
the puller posts, and the posts of dee 2 including the fixed phase slit. The
plot shows also equipotential lines of the electrostatic potential and a
family of trajectories for a set of starting times within 182�pt0p262�. The
end points ðR;ZÞ of the protons stopped on the phase slit are collected and
plotted on a grid together with the measured contours as shown in Fig. 7.
Therefore, the minimum average ion energy may be inthe range of or even below 1 eV.Since the source chimney is oriented parallel to the
magnetic field, protons and electrons are moving in spiralsup and down around the magnetic field lines. The radius ofthese spirals is small so that the net motion of chargedparticles in the plasma is axial. Since the accelerating RFfrequency of 72MHz is rather high, one may ask about thepathlength of plasma protons within one RF cycle. Theresult is given by
L½mm� ¼ 0:19ffiffiffiffiffiffiffiffiffiffiE½eV�
p(3)
where E is the energy of the proton in eV. From this weconclude that—depending on the proton energies in theplasma—the density distribution of protons at the sourceslit is not necessarily uniform. If the average proton energyis low enough, the replenishment of protons at the slit withothers from within the plasma could result in densitygradients, so that the density will be increased at the sourceslit edges, whereas protons from the center of the slitopening area are pulled-off by the RF. The contribution ofprotons produced by ionization directly at the chimney slitcan be assumed to be negligible as the volume in thevicinity of the slit is small compared to the total chimneyvolume. If the upper and lower edge of the chimney slitcontribute above average, then it is reasonable to test achimney with reduced height. This has been done and theeffect was found to be an increased intensity and a reducedvertical beam emittance.A second effect that could play an important role close
to the chimney slit is the so-called E � B drift. The driftvelocity vD is given by
~vD ¼~E � ~B
B2(4)
so that the maximal drift length D within one RF cycle is
D½mm� ¼j~vDj
nRF¼ 5:8E½kV=mm� (5)
where E is the electric field strength given in kV=mm.Between source chimney and puller, E is in the order of10 kV=mm, however, at the chimney slit the field is partlyshielded by the chimney walls and the plasma. Neverthelessfields in the order of X0:2 kV=mm are computed from thefield models and can be assumed to be realistic, so that D isX1mm—significantly more than the width of the sourceslit. It is possible that while protons located directly at thechimney slit are pulled out by the strong electric field, otherprotons, that are a little behind, are driven clockwise by theE � B drift, i.e. towards the right side of the chimneyopening. In this way the density of the protons inside theplasma might become asymmetric. However, more sophis-ticated assumptions about the starting conditions includingtime and location dependent (or correlated) densities arenot considered here, since the available information is notsufficient for such a detailed analysis.
ARTICLE IN PRESS
-3
-2
-1
0
1
2
3
22 23 24 25 26 27 28 29 30 31R /mm
Z/m
m
Proton energyWeight factorRF voltage
: 0.2: 0.3: 79.0
eV
kV
X0=-0.2 mmX0=-0.1 mmX0=0 mmX0=0.1 mmX0=0.2 mm
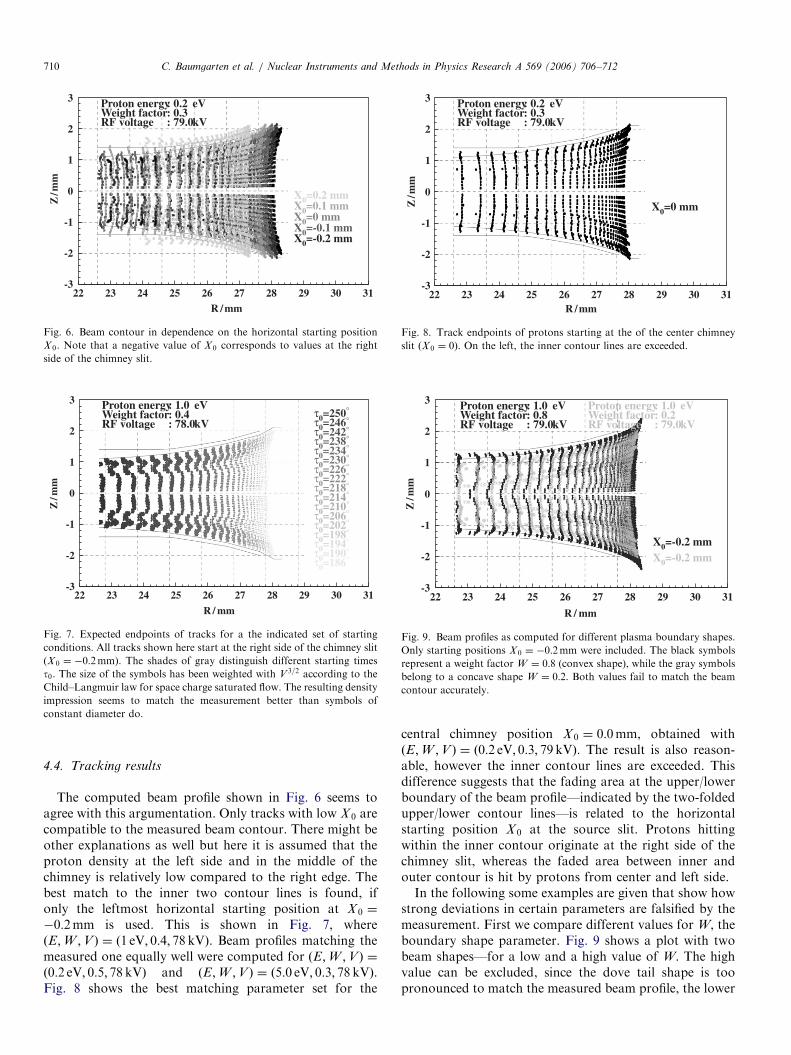
Fig. 6. Beam contour in dependence on the horizontal starting position
X 0. Note that a negative value of X 0 corresponds to values at the right
side of the chimney slit.
-3
-2
-1
0
1
2
3
22 23 24 25 26 27 28 29 30 31
R / mm
Z/m
m
τ0=182οτ0=186°τ0=190°τ0=194°τ0=198°τ0=202°τ0=206°τ0=210°τ0=214°τ0=218°τ0=222°τ0=226°τ0=230°τ0=234°τ0=238°τ0=242°τ0=246°τ0=250°Proton energy
Weight factorRF voltage
: 1.0: 0.4: 78.0
eV
kV
Fig. 7. Expected endpoints of tracks for a the indicated set of starting
conditions. All tracks shown here start at the right side of the chimney slit
(X 0 ¼ �0:2mm). The shades of gray distinguish different starting times
t0. The size of the symbols has been weighted with V 3=2 according to the
Child–Langmuir law for space charge saturated flow. The resulting density
impression seems to match the measurement better than symbols of
constant diameter do.
-3
-2
-1
0
1
2
3
22 23 24 25 26 27 28 29 30 31R /mm
Z/m
m
X0=0 mm
Proton energyWeight factorRF voltage
: 0.2: 0.3: 79.0
eV
kV
Fig. 8. Track endpoints of protons starting at the of the center chimney
slit ðX 0 ¼ 0Þ. On the left, the inner contour lines are exceeded.
-3
-2
-1
0
1
2
3
22 23 24 25 26 27 28 29 30 31
R / mm
Z/m
m
X0=-0.2 mm
Proton energyWeight factorRF voltage
: 1.0: 0.2: 79.0
eV
kV
X0=-0.2 mm
Proton energyWeight factorRF voltage
: 1.0: 0.8: 79.0
eV
kV
Fig. 9. Beam profiles as computed for different plasma boundary shapes.
Only starting positions X 0 ¼ �0:2mm were included. The black symbols
represent a weight factor W ¼ 0:8 (convex shape), while the gray symbols
belong to a concave shape W ¼ 0:2. Both values fail to match the beam
contour accurately.
C. Baumgarten et al. / Nuclear Instruments and Methods in Physics Research A 569 (2006) 706–712710
4.4. Tracking results
The computed beam profile shown in Fig. 6 seems toagree with this argumentation. Only tracks with low X 0 arecompatible to the measured beam contour. There might beother explanations as well but here it is assumed that theproton density at the left side and in the middle of thechimney is relatively low compared to the right edge. Thebest match to the inner two contour lines is found, ifonly the leftmost horizontal starting position at X 0 ¼
�0:2mm is used. This is shown in Fig. 7, whereðE;W ;V Þ ¼ ð1 eV; 0:4; 78 kVÞ. Beam profiles matching themeasured one equally well were computed for ðE;W ;V Þ ¼ð0:2 eV; 0:5; 78 kVÞ and ðE;W ;V Þ ¼ ð5:0 eV; 0:3; 78 kVÞ.Fig. 8 shows the best matching parameter set for the
central chimney position X 0 ¼ 0:0mm, obtained withðE;W ;V Þ ¼ ð0:2 eV; 0:3; 79 kVÞ. The result is also reason-able, however the inner contour lines are exceeded. Thisdifference suggests that the fading area at the upper/lowerboundary of the beam profile—indicated by the two-foldedupper/lower contour lines—is related to the horizontalstarting position X 0 at the source slit. Protons hittingwithin the inner contour originate at the right side of thechimney slit, whereas the faded area between inner andouter contour is hit by protons from center and left side.In the following some examples are given that show how
strong deviations in certain parameters are falsified by themeasurement. First we compare different values for W, theboundary shape parameter. Fig. 9 shows a plot with twobeam shapes—for a low and a high value of W. The highvalue can be excluded, since the dove tail shape is toopronounced to match the measured beam profile, the lower
ARTICLE IN PRESS
-3
-2
-1
0
1
2
3
22 23 24 25 26 27 28 29 30 31
R / mm
Z/m
m
Proton energyWeight factorRF voltage
: 1.0: 0.2: 83.0
eV
kV
Proton energyWeight factorRF voltage
: 1.0: 0.2: 76.0
eV
kV
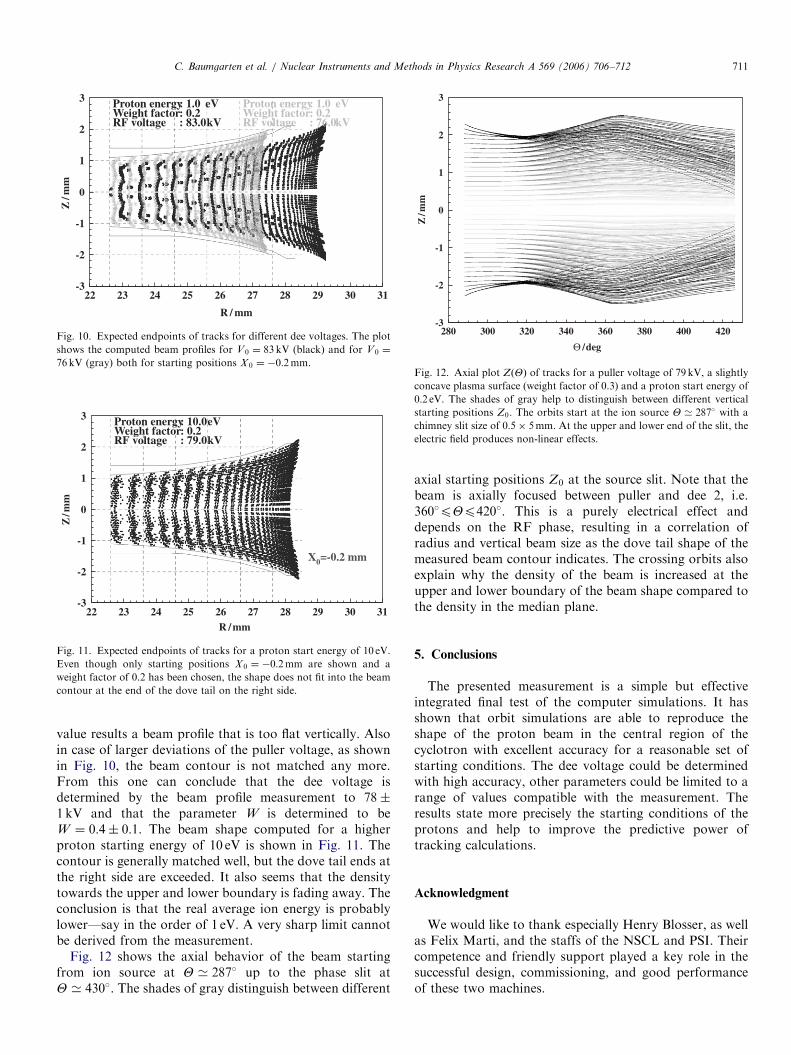
Fig. 10. Expected endpoints of tracks for different dee voltages. The plot
shows the computed beam profiles for V0 ¼ 83 kV (black) and for V0 ¼
76 kV (gray) both for starting positions X 0 ¼ �0:2mm.
-3
-2
-1
0
1
2
3
22 23 24 25 26 27 28 29 30 31R /mm
Z/m
m
Proton energyWeight factorRF voltage
: 10.0: 0.2: 79.0
eV
kV
X0=-0.2 mm
Fig. 11. Expected endpoints of tracks for a proton start energy of 10 eV.
Even though only starting positions X 0 ¼ �0:2mm are shown and a
weight factor of 0.2 has been chosen, the shape does not fit into the beam
contour at the end of the dove tail on the right side.
-3
-2
-1
0
1
2
3
280 300 320 340 360 380 400 420
Θ /deg
Z/m
m
Fig. 12. Axial plot ZðYÞ of tracks for a puller voltage of 79kV, a slightly
concave plasma surface (weight factor of 0.3) and a proton start energy of
0:2 eV. The shades of gray help to distinguish between different vertical
starting positions Z0. The orbits start at the ion source Y ’ 287� with a
chimney slit size of 0:5� 5mm. At the upper and lower end of the slit, the
electric field produces non-linear effects.
C. Baumgarten et al. / Nuclear Instruments and Methods in Physics Research A 569 (2006) 706–712 711
value results a beam profile that is too flat vertically. Alsoin case of larger deviations of the puller voltage, as shownin Fig. 10, the beam contour is not matched any more.From this one can conclude that the dee voltage isdetermined by the beam profile measurement to 78�1 kV and that the parameter W is determined to beW ¼ 0:4� 0:1. The beam shape computed for a higherproton starting energy of 10 eV is shown in Fig. 11. Thecontour is generally matched well, but the dove tail ends atthe right side are exceeded. It also seems that the densitytowards the upper and lower boundary is fading away. Theconclusion is that the real average ion energy is probablylower—say in the order of 1 eV. A very sharp limit cannotbe derived from the measurement.
Fig. 12 shows the axial behavior of the beam startingfrom ion source at Y ’ 287� up to the phase slit atY ’ 430�. The shades of gray distinguish between different
axial starting positions Z0 at the source slit. Note that thebeam is axially focused between puller and dee 2, i.e.360�pYp420�. This is a purely electrical effect anddepends on the RF phase, resulting in a correlation ofradius and vertical beam size as the dove tail shape of themeasured beam contour indicates. The crossing orbits alsoexplain why the density of the beam is increased at theupper and lower boundary of the beam shape compared tothe density in the median plane.
5. Conclusions
The presented measurement is a simple but effectiveintegrated final test of the computer simulations. It hasshown that orbit simulations are able to reproduce theshape of the proton beam in the central region of thecyclotron with excellent accuracy for a reasonable set ofstarting conditions. The dee voltage could be determinedwith high accuracy, other parameters could be limited to arange of values compatible with the measurement. Theresults state more precisely the starting conditions of theprotons and help to improve the predictive power oftracking calculations.
Acknowledgment
We would like to thank especially Henry Blosser, as wellas Felix Marti, and the staffs of the NSCL and PSI. Theircompetence and friendly support played a key role in thesuccessful design, commissioning, and good performanceof these two machines.

ARTICLE IN PRESSC. Baumgarten et al. / Nuclear Instruments and Methods in Physics Research A 569 (2006) 706–712712
References
[1] H. Blosser, et al., Proposal for a Manufacturing Prototype Super-
conducting Cyclotron for Advanced Cancer Therapy, MSUCL-874,
1993.
[2] M. Schillo, et al., Compact Superconducting 250MeV Proton
Cyclotron for the PSI PROSCAN Therapy Project, Proceedings of
the 16th International Conference on Cyclotron and their Applica-
tions, East Lansing, 2001, pp. 37–39.
[3] A. Geisler, et al., Status Report of the ACCEL 250MeV medical
cyclotron, Proceedings of the 17th International Conference on
Cyclotron and their Applications, Tokyo, 2004.
[4] H.-U. Klein, et al., Nucl. Instr. and Meth. B 241 (2005) 721.
[5] MSU NSCL Accelerator Group: Z3CYCLONE Instruction Manual
Version 4.0; Michigan State University, East Lansing, March
2, 1993.
[6] S.L. Snyder, F. Marti, Nucl. Instr. and Meth. A 355 (1995) 618.
[7] J. Timmer, ACCEL Internal Report 1200-BP1260-0, ACCEL Instru-
ments, Bergisch Gladbach, December 2002.
[8] E. Forringer, H. Blosser, Proc. of Part. Acc. Conf. (PAC) Knoxville,
2005, pp. 1297–1299.