Electric Field Enhancement in an Auroral Arc according to the Simultaneous Radar (EISCAT) and...
15
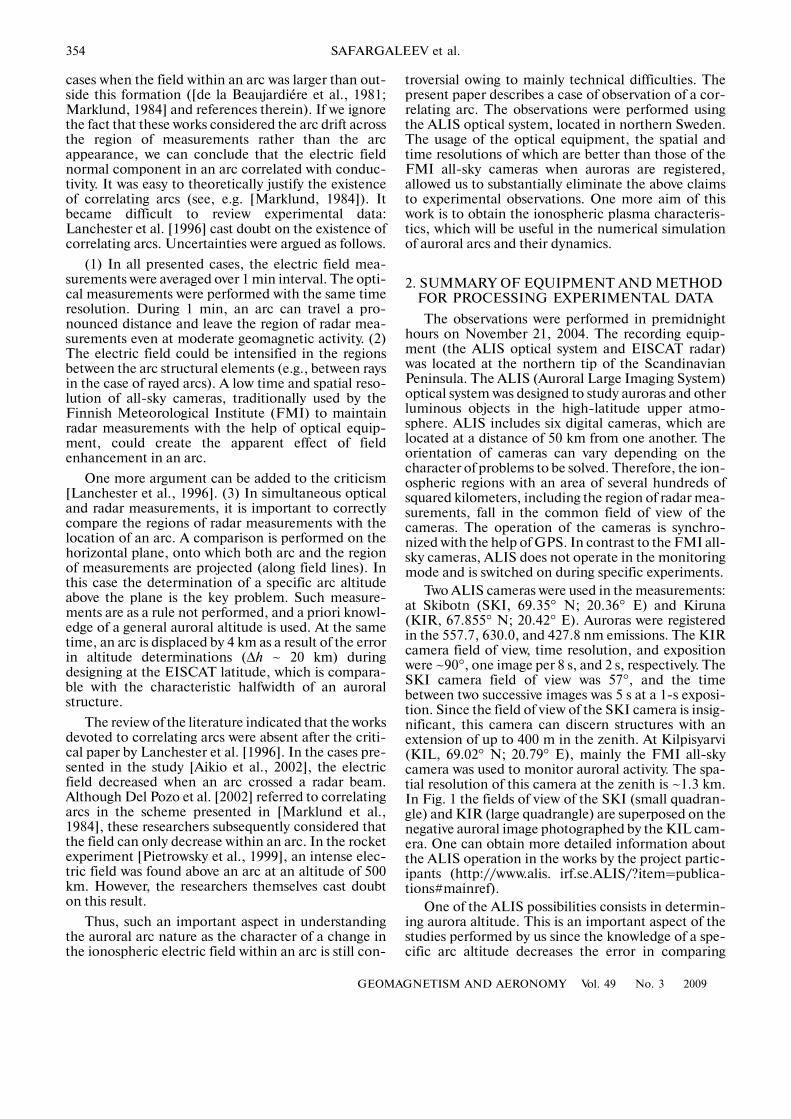
ISSN 00167932, Geomagnetism and Aeronomy, 2009, Vol. 49, No. 3, pp. 353–367. © Pleiades Publishing, Ltd., 2009. Original Russian Text © V.V. Safargaleev, T.I. Sergienko, A.E. Kozlovsky, I. Sandal, U. Brandstrem, D.N. Shibaeva, 2009, published in Geomagnetizm i Aeronomiya, 2009, Vol. 49, No. 3, pp. 371–386. 353 1. INTRODUCTION Auroral arc is the most abundant form of auroras and is observed by a naked eye from the Earth as a luminous band with a width of about 10 km, which is oriented approximately along geomagnetic latitude. When using special optical equipment, it is possible to distinguish smaller elements with a width up to several tens of meters within a band. The entire band and its elements move. We considered only the structures with lateral dimensions of several kilometers and character istic times not less than several seconds. The first theoretical arcs were based on the arc morphological properties obtained during only optical measurements. Further progress was made because it became possible to directly measure convection veloc ity, conductivity, density, and temperature of iono spheric plasma in an arc and its neighborhood. These characteristics, obtained by using ionospheric radars, are evidently more physical than the above morpho logical characteristics. Two schemes of auroral arc classification [de la Beaujardiére et al., 1981; Mark lund, 1984] and the arc generation criterion [Haeren del et al., 1993] can be considered among the results of the coordinated optical and radar studies. Neverthe less, the mechanism by which arcs are generated is still disputable. For example, the behavior of the electric field within an arc is unclear. By the present, it has been established that the ion ospheric plasma conductivity in the region occupied by luminosity is higher than the background conduc tivity due to electrons precipitating from the magneto sphere. The electric field component perpendicular to an arc is also increased immediately behind a lumi nous region at the edge of the inflowing fieldaligned current band. According to Opgenoorth et al. [1990], such an enhanced field is observed equatorward of an arc in the eastward electrojet region (premidnight sec tor) or poleward of an arc if this arc is located in the westward electrojet region (postmidnight sector). In the majority of the cases described in the literature, the region of enhanced electric field moved together with an arc as its integral part [Aikio et al. 1993]. It is logical to assume that the ionospheric electric field should decrease in the region where an arc appeared because plasma conductivity increased here. The field tangential component remains theoretically continuous when the arc boundary is crossed [Mark lund, 1984]. Therefore, the literature presents several Electric Field Enhancement in an Auroral Arc according to the Simultaneous Radar (EISCAT) and Optical (ALIS) Observations V. V. Safargaleev a , T. I. Sergienko b , A. E. Kozlovsky c , I. Sandal b , U. Brandstrem b , and D. N. Shibaeva d a Polar Geophysical Institute, Apatity Division, Kola Scientific Center, Russian Academy of Sciences, ul. Fersmana 14, Apatity, Murmansk oblast, 184209 Russia b Swedish Institute of Space Physics, Kiruna, Sweden c Sodankyla Geophysical Observatory, Tähteläntie 62, 99600 Sodankyla, Finland d Kola Branch, Petrozavodsk State University, ul. Kosmonavtov 3, Apatity, Murmansk oblast, 184200 Russia email: [email protected] Received April 10, 2008; in final form, September 30, 2008 Abstract—The character of a change in the ionospheric electric field when several auroral arcs crossed the region of radar measurements has been analyzed. In one case the plasma conductivity and electric field nor mal component in an arc increased as compared to their undisturbed values. In another case the field and conductivity changed traditionally (in antiphase). Arcs with an increased field were previously classified as correlating arcs, but their existence was subsequently open to question during optical observations. The usage of the ALIS system of digital cameras made it possible to decrease the errors introduced by optical equipment. The measurements in the vicinity of correlating arcs were performed when these arcs were generated, and a traditional arc was a completed formation. In an originating arc, the field value can depend not only on the ionospheric plasma conductivity but also on the processes in the magnetospheric–ionospheric system result ing in the field enhancement. PACS numbers: DOI: 10.1134/S0016793209030098
-
Upload
independent -
Category
Documents
-
view
0 -
download
0
Transcript of Electric Field Enhancement in an Auroral Arc according to the Simultaneous Radar (EISCAT) and...
ISSN 0016�7932, Geomagnetism and Aeronomy, 2009, Vol. 49, No. 3, pp. 353–367. © Pleiades Publishing, Ltd., 2009.Original Russian Text © V.V. Safargaleev, T.I. Sergienko, A.E. Kozlovsky, I. Sandal, U. Brandstrem, D.N. Shibaeva, 2009, published in Geomagnetizm i Aeronomiya, 2009, Vol. 49,No. 3, pp. 371–386.
353
1. INTRODUCTION
Auroral arc is the most abundant form of aurorasand is observed by a naked eye from the Earth as aluminous band with a width of about 10 km, which isoriented approximately along geomagnetic latitude.When using special optical equipment, it is possible todistinguish smaller elements with a width up to severaltens of meters within a band. The entire band and itselements move. We considered only the structures withlateral dimensions of several kilometers and character�istic times not less than several seconds.
The first theoretical arcs were based on the arcmorphological properties obtained during only opticalmeasurements. Further progress was made because itbecame possible to directly measure convection veloc�ity, conductivity, density, and temperature of iono�spheric plasma in an arc and its neighborhood. Thesecharacteristics, obtained by using ionospheric radars,are evidently more physical than the above morpho�logical characteristics. Two schemes of auroral arcclassification [de la Beaujardiére et al., 1981; Mark�lund, 1984] and the arc generation criterion [Haeren�del et al., 1993] can be considered among the results ofthe coordinated optical and radar studies. Neverthe�
less, the mechanism by which arcs are generated is stilldisputable. For example, the behavior of the electricfield within an arc is unclear.
By the present, it has been established that the ion�ospheric plasma conductivity in the region occupiedby luminosity is higher than the background conduc�tivity due to electrons precipitating from the magneto�sphere. The electric field component perpendicular toan arc is also increased immediately behind a lumi�nous region at the edge of the inflowing field�alignedcurrent band. According to Opgenoorth et al. [1990],such an enhanced field is observed equatorward of anarc in the eastward electrojet region (premidnight sec�tor) or poleward of an arc if this arc is located in thewestward electrojet region (postmidnight sector). Inthe majority of the cases described in the literature, theregion of enhanced electric field moved together withan arc as its integral part [Aikio et al. 1993].
It is logical to assume that the ionospheric electricfield should decrease in the region where an arcappeared because plasma conductivity increased here.The field tangential component remains theoreticallycontinuous when the arc boundary is crossed [Mark�lund, 1984]. Therefore, the literature presents several
Electric Field Enhancement in an Auroral Arc according to the Simultaneous Radar (EISCAT)
and Optical (ALIS) ObservationsV. V. Safargaleeva, T. I. Sergienkob, A. E. Kozlovskyc, I. Sandalb,
U. Brandstremb, and D. N. Shibaevad
a Polar Geophysical Institute, Apatity Division, Kola Scientific Center, Russian Academy of Sciences,ul. Fersmana 14, Apatity, Murmansk oblast, 184209 Russia
b Swedish Institute of Space Physics, Kiruna, Swedenc Sodankyla Geophysical Observatory, Tähteläntie 62, 99600 Sodankyla, Finland
d Kola Branch, Petrozavodsk State University, ul. Kosmonavtov 3, Apatity, Murmansk oblast, 184200 Russiae�mail: [email protected]
Received April 10, 2008; in final form, September 30, 2008
Abstract—The character of a change in the ionospheric electric field when several auroral arcs crossed theregion of radar measurements has been analyzed. In one case the plasma conductivity and electric field nor�mal component in an arc increased as compared to their undisturbed values. In another case the field andconductivity changed traditionally (in antiphase). Arcs with an increased field were previously classified ascorrelating arcs, but their existence was subsequently open to question during optical observations. The usageof the ALIS system of digital cameras made it possible to decrease the errors introduced by optical equipment.The measurements in the vicinity of correlating arcs were performed when these arcs were generated, and atraditional arc was a completed formation. In an originating arc, the field value can depend not only on theionospheric plasma conductivity but also on the processes in the magnetospheric–ionospheric system result�ing in the field enhancement.
PACS numbers:
DOI: 10.1134/S0016793209030098
354
GEOMAGNETISM AND AERONOMY Vol. 49 No. 3 2009
SAFARGALEEV et al.
cases when the field within an arc was larger than out�side this formation ([de la Beaujardiére et al., 1981;Marklund, 1984] and references therein). If we ignorethe fact that these works considered the arc drift acrossthe region of measurements rather than the arcappearance, we can conclude that the electric fieldnormal component in an arc correlated with conduc�tivity. It was easy to theoretically justify the existenceof correlating arcs (see, e.g. [Marklund, 1984]). Itbecame difficult to review experimental data:Lanchester et al. [1996] cast doubt on the existence ofcorrelating arcs. Uncertainties were argued as follows.
(1) In all presented cases, the electric field mea�surements were averaged over 1 min interval. The opti�cal measurements were performed with the same timeresolution. During 1 min, an arc can travel a pro�nounced distance and leave the region of radar mea�surements even at moderate geomagnetic activity. (2)The electric field could be intensified in the regionsbetween the arc structural elements (e.g., between raysin the case of rayed arcs). A low time and spatial reso�lution of all�sky cameras, traditionally used by theFinnish Meteorological Institute (FMI) to maintainradar measurements with the help of optical equip�ment, could create the apparent effect of fieldenhancement in an arc.
One more argument can be added to the criticism[Lanchester et al., 1996]. (3) In simultaneous opticaland radar measurements, it is important to correctlycompare the regions of radar measurements with thelocation of an arc. A comparison is performed on thehorizontal plane, onto which both arc and the regionof measurements are projected (along field lines). Inthis case the determination of a specific arc altitudeabove the plane is the key problem. Such measure�ments are as a rule not performed, and a priori knowl�edge of a general auroral altitude is used. At the sametime, an arc is displaced by 4 km as a result of the errorin altitude determinations (Δh ~ 20 km) duringdesigning at the EISCAT latitude, which is compara�ble with the characteristic halfwidth of an auroralstructure.
The review of the literature indicated that the worksdevoted to correlating arcs were absent after the criti�cal paper by Lanchester et al. [1996]. In the cases pre�sented in the study [Aikio et al., 2002], the electricfield decreased when an arc crossed a radar beam.Although Del Pozo et al. [2002] referred to correlatingarcs in the scheme presented in [Marklund et al.,1984], these researchers subsequently considered thatthe field can only decrease within an arc. In the rocketexperiment [Pietrowsky et al., 1999], an intense elec�tric field was found above an arc at an altitude of 500km. However, the researchers themselves cast doubton this result.
Thus, such an important aspect in understandingthe auroral arc nature as the character of a change inthe ionospheric electric field within an arc is still con�
troversial owing to mainly technical difficulties. Thepresent paper describes a case of observation of a cor�relating arc. The observations were performed usingthe ALIS optical system, located in northern Sweden.The usage of the optical equipment, the spatial andtime resolutions of which are better than those of theFMI all�sky cameras when auroras are registered,allowed us to substantially eliminate the above claimsto experimental observations. One more aim of thiswork is to obtain the ionospheric plasma characteris�tics, which will be useful in the numerical simulationof auroral arcs and their dynamics.
2. SUMMARY OF EQUIPMENT AND METHOD FOR PROCESSING EXPERIMENTAL DATA
The observations were performed in premidnighthours on November 21, 2004. The recording equip�ment (the ALIS optical system and EISCAT radar)was located at the northern tip of the ScandinavianPeninsula. The ALIS (Auroral Large Imaging System)optical system was designed to study auroras and otherluminous objects in the high�latitude upper atmo�sphere. ALIS includes six digital cameras, which arelocated at a distance of 50 km from one another. Theorientation of cameras can vary depending on thecharacter of problems to be solved. Therefore, the ion�ospheric regions with an area of several hundreds ofsquared kilometers, including the region of radar mea�surements, fall in the common field of view of thecameras. The operation of the cameras is synchro�nized with the help of GPS. In contrast to the FMI all�sky cameras, ALIS does not operate in the monitoringmode and is switched on during specific experiments.
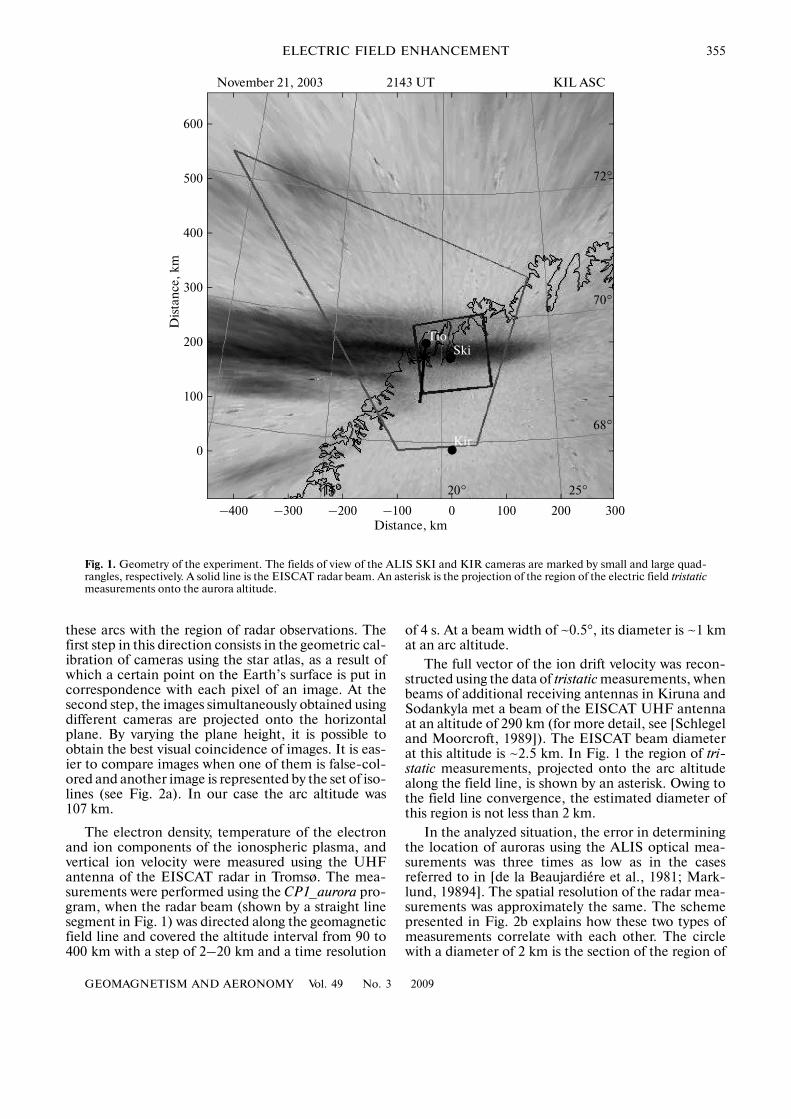
Two ALIS cameras were used in the measurements:at Skibotn (SKI, 69.35° N; 20.36° E) and Kiruna(KIR, 67.855° N; 20.42° E). Auroras were registeredin the 557.7, 630.0, and 427.8 nm emissions. The KIRcamera field of view, time resolution, and expositionwere ~90°, one image per 8 s, and 2 s, respectively. TheSKI camera field of view was 57°, and the timebetween two successive images was 5 s at a 1�s exposi�tion. Since the field of view of the SKI camera is insig�nificant, this camera can discern structures with anextension of up to 400 m in the zenith. At Kilpisyarvi(KIL, 69.02° N; 20.79° E), mainly the FMI all�skycamera was used to monitor auroral activity. The spa�tial resolution of this camera at the zenith is ~1.3 km.In Fig. 1 the fields of view of the SKI (small quadran�gle) and KIR (large quadrangle) are superposed on thenegative auroral image photographed by the KIL cam�era. One can obtain more detailed information aboutthe ALIS operation in the works by the project partic�ipants (http://www.alis. irf.se.ALIS/?item=publica�tions#mainref).
One of the ALIS possibilities consists in determin�ing aurora altitude. This is an important aspect of thestudies performed by us since the knowledge of a spe�cific arc altitude decreases the error in comparing
GEOMAGNETISM AND AERONOMY Vol. 49 No. 3 2009
ELECTRIC FIELD ENHANCEMENT 355
these arcs with the region of radar observations. Thefirst step in this direction consists in the geometric cal�ibration of cameras using the star atlas, as a result ofwhich a certain point on the Earth’s surface is put incorrespondence with each pixel of an image. At thesecond step, the images simultaneously obtained usingdifferent cameras are projected onto the horizontalplane. By varying the plane height, it is possible toobtain the best visual coincidence of images. It is eas�ier to compare images when one of them is false�col�ored and another image is represented by the set of iso�lines (see Fig. 2a). In our case the arc altitude was107 km.
The electron density, temperature of the electronand ion components of the ionospheric plasma, andvertical ion velocity were measured using the UHFantenna of the EISCAT radar in Tromsø. The mea�surements were performed using the CP1_aurora pro�gram, when the radar beam (shown by a straight linesegment in Fig. 1) was directed along the geomagneticfield line and covered the altitude interval from 90 to400 km with a step of 2–20 km and a time resolution
of 4 s. At a beam width of ~0.5°, its diameter is ~1 kmat an arc altitude.
The full vector of the ion drift velocity was recon�structed using the data of tristatic measurements, whenbeams of additional receiving antennas in Kiruna andSodankyla met a beam of the EISCAT UHF antennaat an altitude of 290 km (for more detail, see [Schlegeland Moorcroft, 1989]). The EISCAT beam diameterat this altitude is ~2.5 km. In Fig. 1 the region of tri�static measurements, projected onto the arc altitudealong the field line, is shown by an asterisk. Owing tothe field line convergence, the estimated diameter ofthis region is not less than 2 km.
In the analyzed situation, the error in determiningthe location of auroras using the ALIS optical mea�surements was three times as low as in the casesreferred to in [de la Beaujardiére et al., 1981; Mark�lund, 19894]. The spatial resolution of the radar mea�surements was approximately the same. The schemepresented in Fig. 2b explains how these two types ofmeasurements correlate with each other. The circlewith a diameter of 2 km is the section of the region of
–400
0
100
200
300
400
500
600
–300 –200 –100 0 100 200
TioSki
Kir68°
70°
72°
25°20°15°
300Distance, km
Dis
tan
ce, k
m
November 21, 2003 2143 UT KIL ASC
Fig. 1. Geometry of the experiment. The fields of view of the ALIS SKI and KIR cameras are marked by small and large quad�rangles, respectively. A solid line is the EISCAT radar beam. An asterisk is the projection of the region of the electric field tristaticmeasurements onto the aurora altitude.

356
GEOMAGNETISM AND AERONOMY Vol. 49 No. 3 2009
SAFARGALEEV et al.
tristatic measurements projected on the arc altitude.The 400 × 400 m triangles are pixels of an imageobtained by the ALIS SKI camera. We also note thatthe time resolution during all types of measurementswas higher in our case.
To monitor geomagnetic activity in the observationregion, we used the data from two intersecting chainsof the Scandinavian network of magnetometers, whichmade it possible to trace the development of distur�bances in the meridional and azimuthal directions.The IMAGE network data were generally used todetermine the location of the eastward electrojet.
3. OBSERVATION RESULTS
3.1. Summary of Auroral and Geomagnetic Conditions
Magnetic activity before the studied intervals ischaracterized by three successive negative bay�likedisturbances in the geomagnetic field horizontal com�ponent (see Fig. 3a). The first disturbance started at2040 UT and had a maximum at Ivalo observatory at adistance of 150 km east of the observation region. Thesecond disturbance started ~20 min later and, judgingby the magnetograms, was more local than the firstdisturbance since it was observed only at one observa�tory (Soroya) near the EISCAT facility. The third dis�turbance was registered half an hour later. The distur�bance was observed at several stations, which meansthat it was caused by a more extensive source than dur�ing the first intensification. Judging by magnetograms,this source was located closer to Jan Mayen observa�tory (500 km west of ALIS) since the bay�like distur�
bance is more pronounced here. Note that the sub�storm expansion phase started at ~2128 UT and hadtwo stages according to the data of this station. Corre�lating arcs were observed during the second stage thatstarted at about 2140 UT.
The auroral situation in the observation region ispresented by the keogram obtained from the data ofthe all�sky camera in Kilpisyarvi (see Fig. 3b). The firstand third substorms did not manifest themselves inauroras. This confirms our assumption that the sourceof these substorms was projected into the ionospherefar from the region of optical observations. During thesecond intensification, auroras abruptly expandednorthward, which is typical of an auroral substorm.Such a form of auroral activity usually corresponds tothe formation of an auroral bulge with the following itsmotion westward (westward traveling surge, WTS).
Correlating arcs appeared at about 2140 UT, whenWTS crossed the field of view of the KIL all�sky cam�era (ASC). In Fig. 3b this time interval is colored gray.The optical and radar measurements during thisperiod are described in detail in Section 3.3. Figure 3bshows one more interval, when an arc with a weakenedelectric field crossed a radar beam. The measurementsperformed during this period will be presented in Sec�tion 4.
Figure 3c characterizes the dynamics of the iono�spheric equivalent currents (eastward electrojet) dur�ing the measurements. The electrojet location wasautomatically determined from the data of theIMAGE magnetometers, using the procedurethat can be available on the FMI site
–60
120
140
160
180
200
220
240
–40 –20 0 20 40 60
2000 m
400 m
November 21, 2003 h = 107 km 2142:25 UT November 21, 2003 EISCAT�ALIS SKI
(а) (b)
Fig. 2. (a) The estimation of the arc altitude. The system of isolines shows the image of the ALIS KIR camera, and the ALIS SKIcamera image is false�colored. Light tints correspond to more intense auroras. (b) The spatial resolution of the optical and radarmeasurements. A circle is the section of the region of tristatic measurements reduced to the aurora altitude; gray rectangles arepixels of the ALIS SKI camera image.

GEOMAGNETISM AND AERONOMY Vol. 49 No. 3 2009
ELECTRIC FIELD ENHANCEMENT 357
2120 22 2120 22
200 nT200 nT
BJN
SOR
KIL
PEL
JAN
SOR
IVA
LOZ
Nov. 21, 2003 N�S chain Nov. 21, 2003 E�W chain
Nov. 21, 2003
71.7770.869.9
69.0
68.1
67.266.4
KIL ASC
Geo
grap
hic
lati
tude
, de
g
200 nTX�c
ompo
nen
t
2000 2015 2030 2045 2100 2115 2130 2145 2200
70
68
64
62
2100 2110 2120 2130 2140 2150 2200
987654321
UT
Geo
grap
hic
lati
tude
, de
g Nov. 21, 2003
UT
Eastward electrojet IMAGE, arb. units
(а)
(b)
(c)
X�c
ompo
nen
t
SOR
Fig. 3. (a) Geomagnetic activity in the region of measurements. (b) The keogram characterizing auroral activity; the analyzedintervals are colored gray. (c) The location and dynamics of the eastward electrojet.
(http://www.ava.fmi.fi/MIRACLE) in the on�linemode. Vertical dashed lines mark the intervals whenanticorrelating and correlating arcs were observed. A
solid horizontal line shows the position of the ALISSKI camera zenith. Auroras in the SKI camera field ofview are observed at the poleward boundary of the

358
GEOMAGNETISM AND AERONOMY Vol. 49 No. 3 2009
SAFARGALEEV et al.
eastward electrojet, and correlating arcs are observedafter an electrojet enhancement, which can be relatedto the second stage of the substorm expansion phaseover Jan Mayen.
Information about the character of geomagneticand auroral activity in the observation region is of
importance when results are interpreted. Therefore,we also pay special attention to the dynamics of ananalyzed correlating arc.
3.2. The Dynamics of Correlating Arcs
Correlating arcs were observed immediately afteran abrupt decrease in auroral activity in the studiedionospheric region (see the keogram in Fig. 3b), whichis related by us to the westward shift of the WTS frontduring the substorm development. The arc dynamics isbest of all represented by the KIL camera data, whichcovers a wider region of the sky than the ALIS cam�eras. The characteristic features of the arc dynamicsare shown in the series of images in Fig. 4.
We can distinguish three stages in the developmentof the auroral situation. During the first stage (two firstimages), an arc appears from the west (i.e., from theregion occupied by active auroras) and moves eastwardat an average velocity of ~3000 m/s. An arc is orientedalmost along the geographic latitude and is locatedbetween a stable arc on the northern horizon and theregion of radar measurements. The electric field mea�sured during this period will subsequently be consid�ered as a background field.
The second stage (the next two images in Fig. 4) ischaracterized by the appearance of a new arc and bythe beginning of a pronounced meridional (south�ward) drift of an old arc. This drift is a rapid motionalong the arc extension and a simultaneous slowermotion toward the south. The average drift velocity is800 m/s. A new arc is observed north of an old arc andalso appears from the west (i.e., from the region occu�pied by active auroras) and propagates eastward alongits extension. At this stage, arcs crossed an EISCATbeam; therefore, it became possible to measure theionospheric plasma parameters and (electric field)convection velocity immediately in the luminosityregion.
At the third stage (the last image in Fig. 4), threearc are discernible in the camera field of view, theirlongitudinal motion stops, and the intensity substan�tially decreases.
3.3. Radar Measurements in the Region of Correlating Arcs
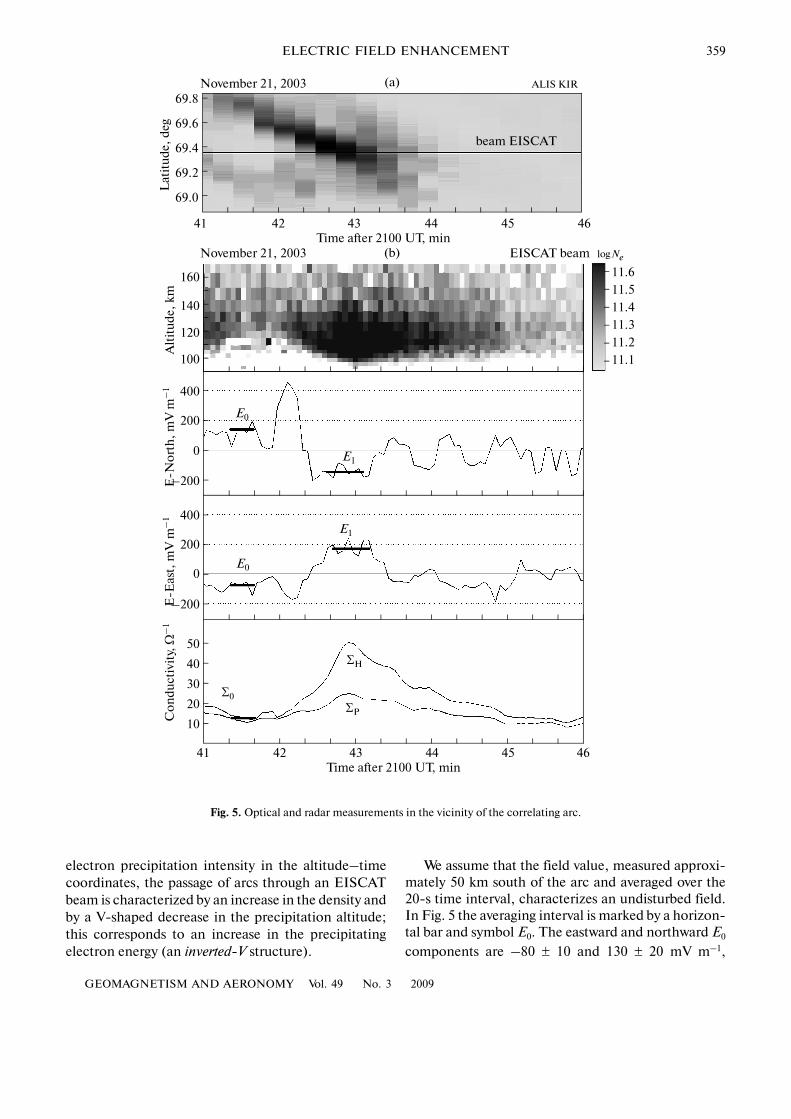
Figure 5 presents the aurora dynamics according tothe data of the ALIS SKI camera and the time varia�tion in the electron density vertical profile, horizontalcomponents of the ionospheric electric field, and ion�ospheric plasma integral conductivity during theperiod including the time interval when arcs crossedthe region of radar measurements. This is an approxi�mately 80�s interval, when the traces of arcs driftingsouthward met the trace of an EISCAT radar beam,marked by a horizontal line at a distance of 2 km southof the SKI camera zenith (see the keogram in Fig. 5a).In Fig. 5, which demonstrates the variations in the
November 21, 2003 KIL ASC
2140:20 UT
2141:40 UT
2142:00 UT
2142:40 UT
2143:40 UT
Fig. 4. Correlating arc dynamics.
GEOMAGNETISM AND AERONOMY Vol. 49 No. 3 2009
ELECTRIC FIELD ENHANCEMENT 359
electron precipitation intensity in the altitude–timecoordinates, the passage of arcs through an EISCATbeam is characterized by an increase in the density andby a V�shaped decrease in the precipitation altitude;this corresponds to an increase in the precipitatingelectron energy (an inverted�V structure).
We assume that the field value, measured approxi�mately 50 km south of the arc and averaged over the20�s time interval, characterizes an undisturbed field.In Fig. 5 the averaging interval is marked by a horizon�tal bar and symbol Е0. The eastward and northward Е0
components are –80 ± 10 and 130 ± 20 mV m–1,
42
10
41
20
30
40
50
43 44 45 46
beam EISCAT
November 21, 2003 ALIS KIR
69.8
69.6
69.4
69.2
69.0
41 42 43 44 45 46Time after 2100 UT, min
E0
E1
E1
E0
Σ0
ΣH
ΣP
–200
0
200
400
–200
0
200
400
160
140
120
100
11.6
11.5
11.4
11.3
11.2
11.1
November 21, 2003 EISCAT beam logNe
Lat
itud
e, d
egA
ltit
ude,
km
E�N
ort
h,
mV
m–
1E
�Eas
t, m
V m
–1
Con
duct
ivit
y, Ω
–1
Time after 2100 UT, min
(а)
(b)
Fig. 5. Optical and radar measurements in the vicinity of the correlating arc.

360
GEOMAGNETISM AND AERONOMY Vol. 49 No. 3 2009
SAFARGALEEV et al.
respectively. The Hall and Pedersen height�integratedconductivities are Σ0Н ≈ Σ0Р ≈ 12 Ω–1. Near the arcequatorward boundary (before an inverted�V struc�ture), the northward electric field component is con�siderably increased as compared to Е0 (is higher than400 mV m–1), whereas an increase in the eastwardcomponent is not so substantial. Since an arc is ori�ented along the geographic latitude, the field north�ward component is normal to the arc. An increase inthis component at the arc equatorward boundaryagrees with the data obtained in [Opgenoorth et al.,1990] for arcs in the eastward electrojet region (seeFig. 3c).
The passage of the inverted�V structure through theradar beam, to which three arcs are related in the opti�cal data, is accompanied by a change of the sign of thenormal and tangential electric field components. Inthe luminous region (within the inverted�V structure),the normal component is southward, and the tangen�tial component is westward, which agrees with the dataobtained in [de la Beaujardiére et al., 1977]. Duringthe period marked in Fig. 5 by a horizontal bar withsymbol E1, the average field value is –160 ± 10 and190 ± 20 mV m–1 for the northward and eastward com�ponents, respectively. The shape of the variation in thenorthward field component from 2141:50 to 2143:30UT corresponds to a double�reversal arc [Marklund,1984]. An increase in the normal component in theregion occupied by luminosity resulted in that the totalfield in this region (E1) not only reversed its sign butalso exceeded E0 in magnitude. According to Mark�lund [1984], both these indicators make it possible toconsider these arcs among correlating ones. A com�parison of the value and direction of the tangential(eastward) field component before and within theluminous region indicates that this component is nothomogeneous, which disagrees with the majority ofthe theoretical works. An inhomogeneity of the tan�gential component was also referred to in [de la Beau�jardiére et al., 1977]. We will consider this problemagain in Section 4. The integral conductivity of theionosphere within the inverted�V structure increasedand was Σ0Н ≈ 50 and Σ0Р ≈ 20 Ω–1 at a maximum.
Figure 6 demonstrates a change in the ionosphericconvection character as the arc approaches the regionwhere the tristatic measurements of the plasma driftvelocity full vector were performed. The intervalbelongs to the second stage of development of theauroral situation (se the previous section and Fig. 4),which is characterized by an increase in the arc merid�ional drift. To more accurately compare the region ofmeasurements with the location of auroras, we usedthe data of the ALIS SKI camera oriented toward thezenith. At 2141:41 UT, the region of measurementswas at a distance of 50 km south of an arc. The valuesof the meridional and azimuthal components of theconvection velocity were ~1 and ~2 km/s, respectively.Immediately before an arc, the velocity of the azi�
–40
–40
–60
–20
0
20
40
60
–20 0 20 40 60
N
E
–40
–20
0
20
40
60
–40
–20
0
20
40
602141:41 UT
2142:09 UT
2143:09 UT
Distance from SKI, km
Dis
tan
ce fr
om S
KI,
km
November 21, 2003 ALIS SKI
Fig. 6. The character of convection in the vicinity of thecorrelating arc. The black circle is the projection of theregion of tristatic measurements onto the aurora altitude,and the straight line segment is the horizontal componentof the convection velocity. Light tints correspond tointense auroras.
GEOMAGNETISM AND AERONOMY Vol. 49 No. 3 2009
ELECTRIC FIELD ENHANCEMENT 361
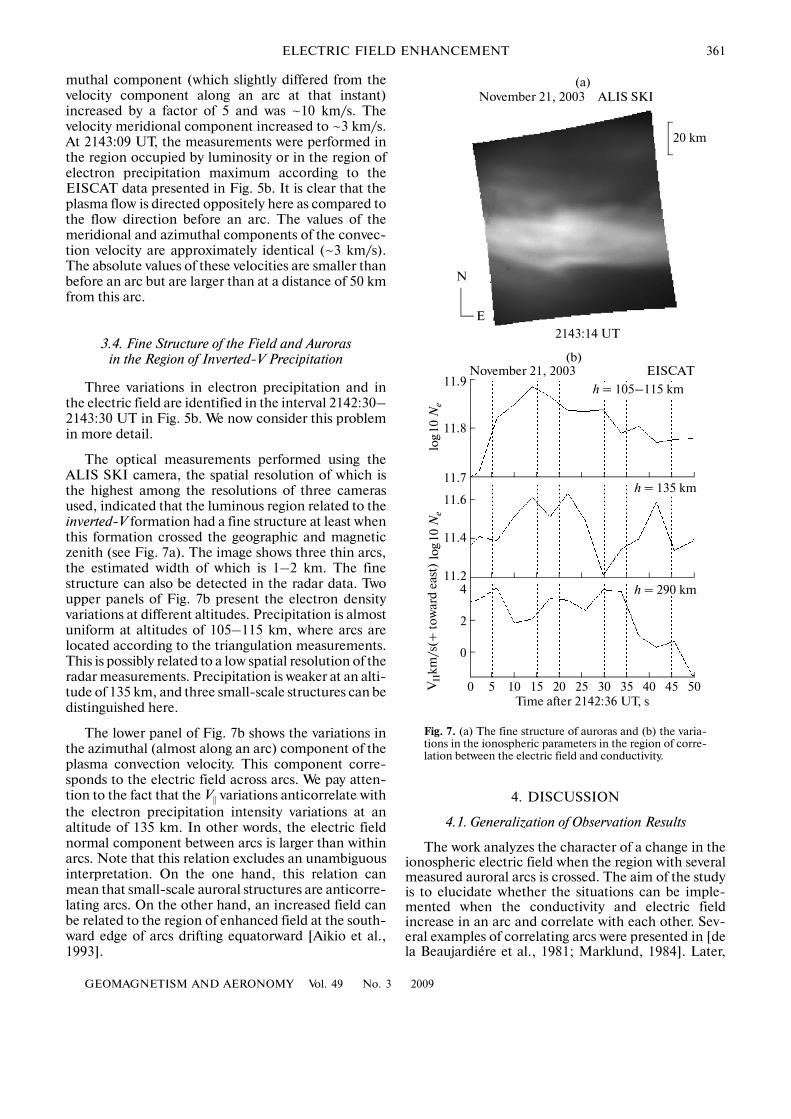
muthal component (which slightly differed from thevelocity component along an arc at that instant)increased by a factor of 5 and was ~10 km/s. Thevelocity meridional component increased to ~3 km/s.At 2143:09 UT, the measurements were performed inthe region occupied by luminosity or in the region ofelectron precipitation maximum according to theEISCAT data presented in Fig. 5b. It is clear that theplasma flow is directed oppositely here as compared tothe flow direction before an arc. The values of themeridional and azimuthal components of the convec�tion velocity are approximately identical (~3 km/s).The absolute values of these velocities are smaller thanbefore an arc but are larger than at a distance of 50 kmfrom this arc.
3.4. Fine Structure of the Field and Auroras in the Region of Inverted�V Precipitation
Three variations in electron precipitation and inthe electric field are identified in the interval 2142:30–2143:30 UT in Fig. 5b. We now consider this problemin more detail.
The optical measurements performed using theALIS SKI camera, the spatial resolution of which isthe highest among the resolutions of three camerasused, indicated that the luminous region related to theinverted�V formation had a fine structure at least whenthis formation crossed the geographic and magneticzenith (see Fig. 7a). The image shows three thin arcs,the estimated width of which is 1–2 km. The finestructure can also be detected in the radar data. Twoupper panels of Fig. 7b present the electron densityvariations at different altitudes. Precipitation is almostuniform at altitudes of 105–115 km, where arcs arelocated according to the triangulation measurements.This is possibly related to a low spatial resolution of theradar measurements. Precipitation is weaker at an alti�tude of 135 km, and three small�scale structures can bedistinguished here.
The lower panel of Fig. 7b shows the variations inthe azimuthal (almost along an arc) component of theplasma convection velocity. This component corre�sponds to the electric field across arcs. We pay atten�tion to the fact that the V|| variations anticorrelate withthe electron precipitation intensity variations at analtitude of 135 km. In other words, the electric fieldnormal component between arcs is larger than withinarcs. Note that this relation excludes an unambiguousinterpretation. On the one hand, this relation canmean that small�scale auroral structures are anticorre�lating arcs. On the other hand, an increased field canbe related to the region of enhanced field at the south�ward edge of arcs drifting equatorward [Aikio et al.,1993].
4. DISCUSSION
4.1. Generalization of Observation Results
The work analyzes the character of a change in theionospheric electric field when the region with severalmeasured auroral arcs is crossed. The aim of the studyis to elucidate whether the situations can be imple�mented when the conductivity and electric fieldincrease in an arc and correlate with each other. Sev�eral examples of correlating arcs were presented in [dela Beaujardiére et al., 1981; Marklund, 1984]. Later,
5
0
0
20 km
November 21, 2003 ALIS SKI
N
E
2143:14 UT
2
4
10 15 20 25 30 35 40 45 50
h = 105–115 km
h = 135 km
h = 290 km
11.6
11.4
11.2
11.9
11.8
11.7
November 21, 2003 EISCAT
log
10 N
elo
g10
Ne
VII
km/s
(+ t
owar
d ea
st)
Time after 2142:36 UT, s
(а)
(b)
Fig. 7. (a) The fine structure of auroras and (b) the varia�tions in the ionospheric parameters in the region of corre�lation between the electric field and conductivity.
362
GEOMAGNETISM AND AERONOMY Vol. 49 No. 3 2009
SAFARGALEEV et al.
the fact of existence of these arcs was in reasonabledoubt [Lanchester et al., 1996]. It is important toknow the response of the ionospheric field to theappearance of the band of increased conductivity inorder to understand the mechanism by which auroralarcs are generated.
It would be ideal to perform measurements pre�cisely in the ionospheric region where an arc appearsand precisely at the time of this appearance. The prob�ability of such a coincidence is evidently extremelylow. Therefore, one usually considers drift of a formedarc through a radar beam and compares fields withinand outside an arc [de la Beaujardiére et al., 1981]. Inour case the measurements were performed accordingto the same scheme. However, the situation consid�ered by us slightly differs from a simple arc driftthrough a radar beam. We deal with a just formed arcrather than with an existent one. Therefore, it is morereasonable to relate our results to the process ofauroral arc generation than the results presented in theworks cited above.
We used the data of the ALIS digital cameras withregard to the critical remarks [Lanchester et al., 1996].
However, having improved the spatial and time resolu�tions of the optical observations, we simultaneouslypronouncedly limited the range of intervals suitablefor an analysis since ALIS does not operate in a mon�itoring mode. In essence, this work analyzes an indi�vidual event.
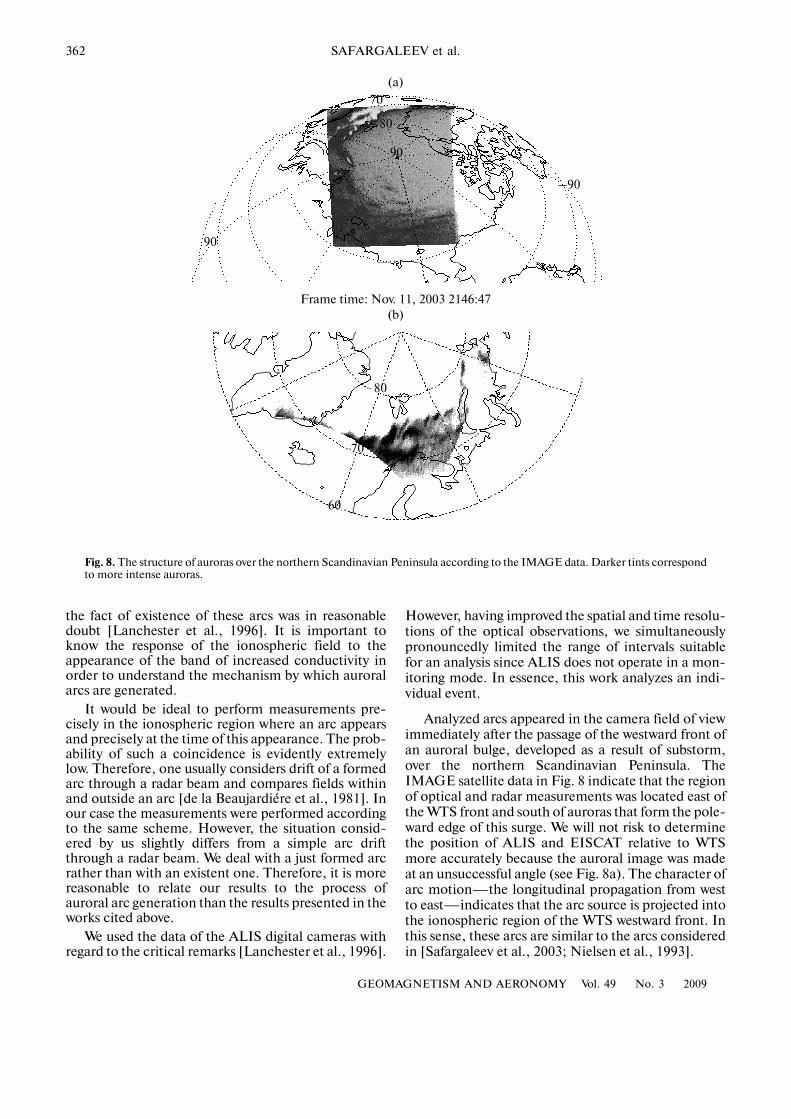
Analyzed arcs appeared in the camera field of viewimmediately after the passage of the westward front ofan auroral bulge, developed as a result of substorm,over the northern Scandinavian Peninsula. TheIMAGE satellite data in Fig. 8 indicate that the regionof optical and radar measurements was located east ofthe WTS front and south of auroras that form the pole�ward edge of this surge. We will not risk to determinethe position of ALIS and EISCAT relative to WTSmore accurately because the auroral image was madeat an unsuccessful angle (see Fig. 8a). The character ofarc motion—the longitudinal propagation from westto east—indicates that the arc source is projected intothe ionospheric region of the WTS westward front. Inthis sense, these arcs are similar to the arcs consideredin [Safargaleev et al., 2003; Nielsen et al., 1993].
90
90
80
70
–90
Frame time: Nov. 11, 2003 2146:47
80
70
60
(а)
(b)
Fig. 8. The structure of auroras over the northern Scandinavian Peninsula according to the IMAGE data. Darker tints correspondto more intense auroras.

GEOMAGNETISM AND AERONOMY Vol. 49 No. 3 2009
ELECTRIC FIELD ENHANCEMENT 363
When the arcs moved southward, they crossed theradar beam. The radar measurements indicated thatthe electron density increased during that period. Theconfiguration of the region of intensified precipitationon the time–altitude diagram (see Fig. 5b) could becaused by the fact that the radar beam was crossed bythe structure with the spatial energy distribution ofprecipitating particles in the form of inverted�V, typi�cal of the auroral zone. The field measured at a dis�tance of 50 km south of the arc is considered by us asan undisturbed field E0. In front of the structure, bothfield components are pronouncedly increased, whichagrees with the data obtained by other researchers forthe arcs in the eastward electrojet region. Within thestructure, both components changed the sign, remain�ing larger than E0 in magnitude. The integral conduc�tivity also increased within the structure. According toMarklund [1984], these signatures allow us to considerthe arc (more exactly, the luminous region corre�sponding to the inverted�V structure) among correlat�ing structures. The azimuthal component of the con�vection velocity in this region is directed along the arcpropagation several minutes earlier (See Fig. 4). Thisdirection corresponds to the plasma drift from theWTS front, which was located behind the westwardedge of the field of view for all cameras used in thestudy (see also Fig. 8b). The azimuthal component ofthe convection velocity ahead of the region southwardedge is directed oppositely.
Three thin arcs are identified when the luminousband crosses the zenith of the SKI camera (with thehighest spatial resolution) on the images in the regionof radar measurements (gray asterisk in Fig. 7a). Wecan put three regions of increased density in the radardata in correspondence with these arcs. Density (and,consequently, plasma conductivity) increases withdecreasing tangential component of plasma convec�tion velocity, which can easily be converted into theelectric field normal component (mV m–1) by dividingvelocity (in meters per second) into 20. The antiphasevariation in the conductivity and field can mean thatsmall�scale auroral structures are anticorrelating arcs.On the other hand, an increased field can be related tothe region of enhanced field at the southward edge ofarcs drifting equatorward. A more evident anticorrela�tion of the field and conductivity was detected by us inthe event considered below.
4.2. Radar Measurements in the Regionof Anticorrelating Arc
The observations were performed during the periodof increased auroral activity in the ionosphere aboveALIS and EISCAT, related to the formation of auroralbulge and the following poleward and westward expan�sion of this bulge. The spatial distribution of auroras inthe observation regions resembled a double oval struc�ture. Arcs forming the poleward part of this structureare observed on the northern horizon of the keogram
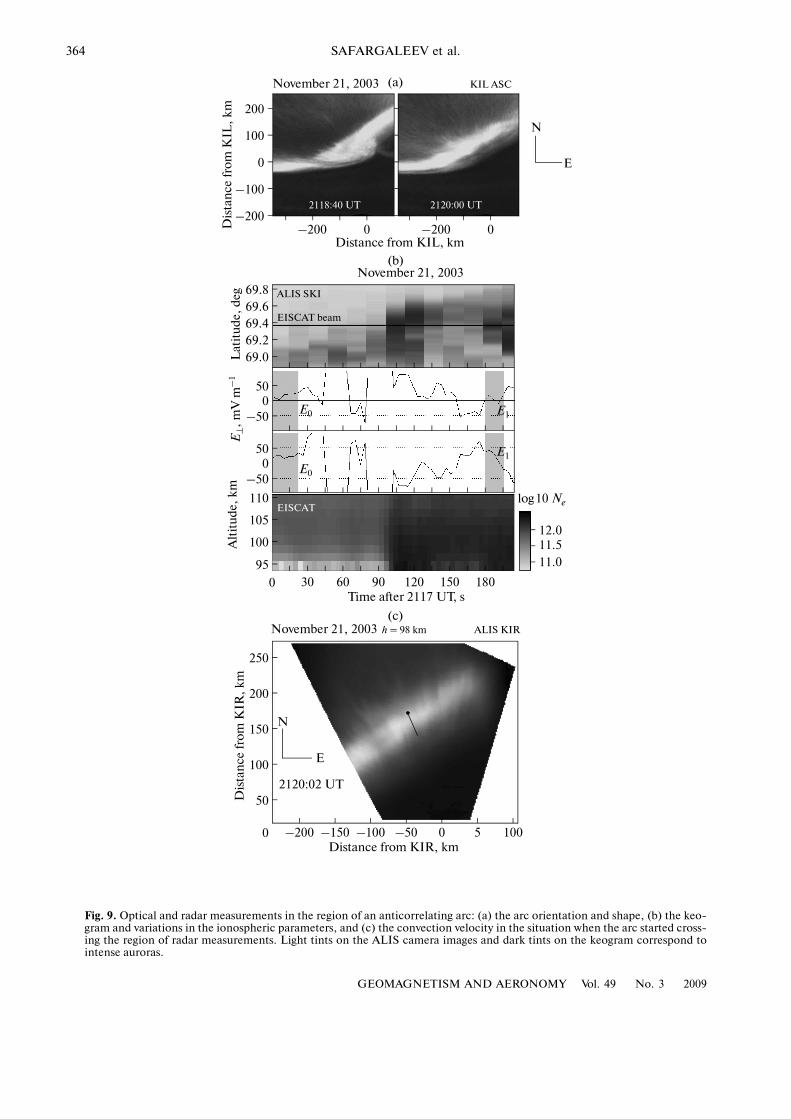
and in the northern part of the KIL all�sky camerafield of view (Fig. 4). The arc that forms the equator�ward edge is studied in this section. The dynamics ofauroras and the electric field variations in the situationwhen this arc crosses the radar beam are presented inFig. 9.
The arc originated long before the studied instant.Two minutes before radar beam crossing, the luminos�ity wave propagated over the arc (Fig. 9a, left�handimage) and left a trace in a wide range of latitudes onthe keogram. In the radar data, the passage of anextensive luminous formation is accompanied by aconsiderable increase in electron density. The secondintensification on the keogram and in the radar datastarted at about 2120 UT, when the arc crossed theEISCAT beam. The arc shape and orientation at thatinstant are shown on the right�hand image in Fig. 9a.Precipitation first intensified at an altitude of about100 km and then descended to almost 90 km altitude.The velocity vector, projected onto an altitude of 98km, is shown by an arrow on the ALIS KIR cameraimage (Fig. 9c). We used the data of the ALIS KIRcamera because the field of view of the ALIS SKI cam�era is smaller and the region of measurementsbecomes outside the image when the projection is per�formed onto the altitude lower than 100 km.
The interval, during which the electric field in thearc was averaged, is colored gray and marked by sym�bol E1 in Fig. 9b. The field components have been con�verted to the arc coordinate system, so that E⊥ and E||
are the total components across and along the arc,respectively. The period at the very beginning of theinterval is characterized by weak auroral activity in theregion of tristatic measurements and by moderate pre�cipitation. We used this period to calculate the E0 field.Our estimations indicate that the normal and tangen�tial E0 components are approximately identical (20 ±5 mV m–1). The normal and tangential field compo�nents in an arc (E1) are 0 ± 5 and 25 ± 5 mV m–1,respectively. It is clear that the normal field compo�nent in an arc decreased, and the tangential compo�nent remained continuous (within the error of averag�ing). The integral Pedersen conductivity in an arcincreased from 15 to 30 Ω–1, and the integral Hall con�ductivity also increased almost twice and was 80 Ω–1.
Thus, the studied arc is a typical example of thearcs that were studied in the majority of the works citedabove. This arc was formed before the measurements;therefore, when the arc crossed the beam, it can beconsidered as a quasistationary structure that slowlydrifted along the meridian and showed short�termlocal intensity variations of the type of the luminositywave mentioned above. The arc is oriented almostalong the geomagnetic latitude. The field normalcomponent in the arc is smaller than outside the arc;i.e., this is an anticorrelating arc. The condition ofcontinuity of the electric field tangential component issatisfied.
364
GEOMAGNETISM AND AERONOMY Vol. 49 No. 3 2009
SAFARGALEEV et al.
–200
50
0
95
0
–200–200 0
–100
0
100
200
–200 0
E
N
Distance from KIL, kmD
ista
nce
from
KIL
, km
November 21, 2003 KIL ASC
2118:40 UT 2120:00 UT
100
105
110
30 60 90 120 150 180
–50
50
–50
50
69.069.269.469.669.8
E0 E1
E1
E0
0
0
November 21, 2003
ALIS SKI
EISCAT beam
EISCAT
12.011.511.0
Time after 2117 UT, s
100
150
200
250
–150 –100 –50 0 5 100Distance from KIR, km
N
E
2120:02 UT
November 21, 2003 h = 98 km ALIS KIR
(а)
(b)
(c)
Lat
itud
e, d
egE⊥
, m
V m
–1
Alt
itud
e, k
m
log10 Ne
Dis
tan
ce fr
om K
IR,
km
Fig. 9. Optical and radar measurements in the region of an anticorrelating arc: (a) the arc orientation and shape, (b) the keo�gram and variations in the ionospheric parameters, and (c) the convection velocity in the situation when the arc started cross�ing the region of radar measurements. Light tints on the ALIS camera images and dark tints on the keogram correspond tointense auroras.

GEOMAGNETISM AND AERONOMY Vol. 49 No. 3 2009
ELECTRIC FIELD ENHANCEMENT 365
4.3. Possible Interpretation
The mechanism by which the arc is generatedshould theoretically be considered, first of all, takinginto account the data obtained during the appearanceof the arc on the horizon, lasting several tens of min�utes. The pioneer studies, which formed the basis fornumerous arc theories (see, e.g. the review [Borovsky,1993]), were performed with a low time resolution (asa rule, about 1 min). As a result, detailed measure�ments could not be performed, and it was often impos�sible to unambiguously determine whether the samearc was presented on two successive images. The up�to�date ground�based equipment makes it possible toidentify and trace the process of arc origination, butthe complex observations were rarely performed (see,e.g. [Safargaleev et al., 2003] and references therein).Since the spatial and time resolutions are low, the sat�ellite observations of arc formation are also rare[Nielsen et al., 1993]. The practical value of the per�formed study consists in that we managed to performthe coordinated optical and radar measurements nearthe instant of generation of auroral arc (referred to asa “correlating” arc in the text).
The interpretation of an anticorrelating arc is of nointerest because this arc is an isolated completed for�mation described in many works. Preference can begiven to any generation procedure (see the review[Borovsky, 1993]) based on, e.g., the numerical esti�mates of the conductivity and electric field outside andwithin the luminous region obtained by us.
It is more difficult to interpret a correlating arc.First, this arc is part of the arc system. Second, the arcpropagation along its extension is evidently related toits generation. Third, concomitant measurements arescanty. Nighttime multiplet auroral structures aremore widespread phenomena than single arcs; never�theless, rather few works are devoted to the mecha�nism by which these arcs are generated. The field�lineresonance theory [Samson et al., 1991] and the fol�lowing its modifications (see, e.g. [Kozlovsky andKangas, 2002] and references therein) are the mostpopular studies. Splitting of the eastward electrojet byinjecting an oppositely directed plasma bunch into thiselectrojet [Frey et al., 1996] and multiplet precipita�tion caused by wave propagation through certain zonesof the magnetosphere [Knudsen, 2001; Safargaleev etal., 2000] are among the less frequently cited interpre�tations. None of the above studies considered azi�muthal propagation of an arc during its generation.The character of convection in the vicinity of a corre�lating arc (specifically, the indications of oppositelydirected flows) resembles the character of this processdescribed [Frey et al., 1996]. However, in our case themeasurements were performed at the eastward elec�trojet boundary (see Fig. 3c) rather than within thiselectrojet as is assumed in the interpretation [Frey etal., 1996].
Safargaleev et al. [2003] assumed that the mecha�nism by which an arc appears in the field of view ofoptical equipment is of importance when any genera�tion procedure is selected during the interpretation ofobservations. An auroral phenomenon, which is thesystem of several arcs, was revealed. In the process offormation, these arcs propagated in the azimuthaldirection (drifted along their extension) from theregion occupied by intense luminosity. The system ofarcs, described in [Nielsen et al., 1993] and in Section3.3 of the present work, developed according to thesimilar scenario. The character of ionospheric plasmaconvection in the observation region [Haerendel et al.,1993] can be the other important aspect of interpreta�tion. Safargaleev et al. [2003] noted that plasmadrifted in the direction of motion of the arc end nearthe arc and in the opposite direction at a certain dis�tance from the arc.
Based on the data presented in [Kozlovsky andLyatsky, 1994], we related the generation of such arcsto the development of the interchange�type instability,the theoretical backgrounds of which were previouslypresented in [Volkov and Maltsev, 1986]. The numeri�cal model of development of the interchange instabil�ity was also developed [Golovchanskaya et al., 2003].The character of motion of a correlating arc andplasma within and outside the luminous region as wellas the multiplet character of the phenomenon allow usto interpret a correlating arc in the scope of the inter�change instability. In this case the azimuthal compo�nent of the plasma velocity in the arc, which is relatedby us to the developing plasma flute, is the sum of thestationary convection and disturbed velocities (inessence, the velocity of flute motion from west to east).Therefore, the corresponding normal field componentin the arc (E1) can be larger than the corresponding E0
field component. In immediate proximity to the arc,the azimuthal component of the plasma velocityshould be directed oppositely, which is actuallyobserved in Fig. 6. The absolute value of this velocity islarger than in the arc because, e.g., the undisturbedvelocity has the same direction as the plasma velocitynear the arc.
The instability is caused by the noncoincidence ofthe contours of equal plasma pressure and magneticfield value in the magnetosphere. This noncoinci�dence can be considered as the presence of the azi�muthal (along the line B = const) plasma pressure gra�dient. Stepanova et al. [2002] noted that the pressureazimuthal gradient can promote the development ofmagnetospheric substorm. Thus, the formation of theauroral bulge and the system of correlating arcs canhave the common cause.
The fact that the electric field tangential compo�nent is not continuous at the arc boundary was referredto in [de la Beaujardiére et al., 1977]. The explanationis not presented, but it is assumed that the behavior ofthe tangential component is regulated by atmospheric
366
GEOMAGNETISM AND AERONOMY Vol. 49 No. 3 2009
SAFARGALEEV et al.
processes rather than by changes in ionospheric con�ductivity. We also did not try to explain a change of thesign of the field tangential component in a correlatingarc but indicate (as discussion) that this phenomenoncan be caused by, e.g., a nonuniform distribution ofconductivity within the arc or by the character of thearc spatial extension. An anticorrelating arc (Fig. 9a),for which the condition of E|| continuity is satisfied,more closely resembles an infinite band than a corre�lating arc, which is evidently limited in the azimuthaldirection (Fig. 1).
Having analyzed an isolated event, we cannot pre�tend to formulate a complete theory of correlating arcgeneration: for this purpose, it is necessary to analyzea more extensive series of similar phenomena and touse corresponding measurements. Possibly, low�orbit�ing satellite data on particles and more reliable data onthe development of auroral situation on the planetaryscale will allow one to adjust ionospheric phenomenato certain zones of the magnetosphere and to answerthe remaining questions: the role of substorm in theproposed scheme and the stoppage of the arc azi�muthal motion (flute extension).
5. CONCLUSIONS
We studied the character of a change in the iono�spheric electric field and in a number of other iono�spheric plasma parameters, measured by the EISCATradar according to the tristatic measurement program,when the region of measurement of several auroralarcs is crossed. In the first case, the plasma conductiv�ity and electric field normal component in the arcincreased as compared to their undisturbed valuesmeasured at a certain distance from the region occu�pied by luminosity. In the second case, the electricfield in the arc decreased, which is more traditional forauroral arcs than the apparent correlation between thefield and conductivity found in the first case.
More than 20 years ago, correlating arcs were com�bined in an independent type; however, their existencewas subsequently open to question, mainly, due to theimperfection of the optical equipment. The usage ofthe ALIS digital cameras with a high spatial and timeresolution allowed us to avoid the uncertainties thatwere introduced by previous optical observations. Inthis case rather than optical measurements mainlycontributed to the error when optical and radar datawere compared because the EISCAT antenna patternis insufficiently narrow.
Correlating arcs were observed almost at the instantof their generation, whereas an anticorrelating (tradi�tional) arc was a completed formation. We considerthat this was the cause of different electric field behav�ior within arcs. The field value in an originating arc isregulated not only by a change in the ionosphericplasma conductivity but also by the processes in themagnetospheric–ionospheric system, resulting in the
appearance of this arc. In particular, we consider thatthe specific mechanism by which an arc is formed—the interchange instability—is the possible cause of anincrease in the electric field normal component withinan arc (or, what is the same, in the plasma convectionvelocity along an arc).
The obtained values of the ionospheric plasmaparameters can be useful in the numerical studies ofdisturbances in the magnetospheric–ionospheric sys�tem.
ACKNOWLEDGMENTS
V. V. Safargaleev was supported by the Swedish andFinnish Academies if Sciences; D. N. Shibaeva, by theCouncil of Ministers of the northern states. We aregrateful to a Director and the staff of the EISCATassociation for the possibility of using the data of radarobservations. The programs for processing the ALISdata were developed by B. Gustavsson (University ofTromsø). The IMAGE satellite data were taken fromthe SDAWev base and the web�resource of the Berke�ley University (S. Mende, a provider). The data fromthe IMAGE network of magnetometers can be used byresearchers owing to the efforts of the European Sci�entific Society. We are grateful to K. Kauristie (FMI)for the data of the KIL all�sky camera, B. Holmeset(University of Tromsø) for the magnetic data fromJAN observatory, and I. Golovchanskaya (Polar Geo�physical Institute) for useful remarks.
REFERENCES
1. A. T. Aikio, H. J. Opgenoorth, M. A. L. Persson, and K.Kaila, “Ground Based Measurements of an Arc�Asso�ciated Electric Field,” J. Atmos. Terr. Phys. 55 (4/5),797–807 (1993).
2. A. T. Aikio, T. Lakkala, A. Kozlovsky, and P. J. Williams,“Electric Fields and Currents of Stable DriftingAuroral Arcs in the Evening Sector,” J. Geophys. Res.107, JA009172 (2002).
3. J. E. Borovsky, “Auroral Arc Thicknesses as Predictedby Various Theories,” J. Geophys. Res. 98, 6101–6138(1993).
4. H. U. Frey, G. Haerendel, S. Buchert, and B. S.Lanchester, “Auroral�Arc Splitting by Intrusion of aNew Convection Channel,” Ann.Geophys. 14 (12),1257–1264 (1996).
5. I. V. Golovchanskaya and Y. P. Maltsev, “InterchangeInstability in the Presence of the Field�Aligned Cur�rent: Application to the Auroral Arc Formation,” J.Geophys. Res. 108, JA009505 (2003).
6. G. Haerendel, S. Buchert, C. La Hoz, et al., “On theProper Motion of Auroral Arcs,” J. Geophys. Res. 98(4), 6087–6099 (1993).
7. D. Knudsen, “Structure, Acceleration, and Energy inAuroral Arcs and the Role of Alfvén Waves,” Space Sci.Rev. 95 (1/2), 501–511 (2001).
8. A. Kozlovsky and J. Kangas, “Motion and Origin ofNoon High�Latitude Poleward Moving Auroral Arcs
GEOMAGNETISM AND AERONOMY Vol. 49 No. 3 2009
ELECTRIC FIELD ENHANCEMENT 367
on Closed Magnetic Field Lines,” J. Geophys. Res.107, JA900145 (2002).
9. A. E. Kozlovsky and W. B. Lyatsky, “Instability of Mag�netosphere�Ionosphere Convection and Formation ofAuroral Arcs,” Ann. Geophys. 12 (7), 636–641 (1994).
10. B. S. Lanchester, K. Kaila, and I. W. McCrea, “Rela�tionship between Large Horizontal Electric Fields andAuroral Arc Elements,” J. Geophys. Res. 101, 5076–5084 (1996).
11. G. T. Marklund, “Auroral Arc Classification SchemeBased on the Observed Arc�Associated Electric FieldPattern,” Planet. Space Sci. 32 (2), 193–211 (1984).
12. E. Nielsen, R. Elphinstone, D. Hearn, et al., “OvalIntensification Event Observed by STARE and Viking,”J. Geophys. Res. 98, 6163–6171 (1993).
13. H. J. Opgenoorth, I. Haggstrom, P. J. Williams, and G.O. Jones, “Regions of Strongly Enhanced Perpendicu�lar Electric Fields Adjacent to Auroral Arcs,” J. Atmos.Terr. Phys. 52 (6), 449– 458 (1990).
14. D. Pietrovsky, K. A. Lynch, R. B. Torbert, et al., “Mul�tipoint Measurements of Large DC Electric Fields andShears in the Auroral Zone,” Geophys. Res. Lett. 26(22), 3369–3372 (1999).
15. V. V. Safargaleev, A. E. Kozlovsky, S. V. Osipenko, andV. R. Tagirov, “Azimuthal Expansion of High LatitudeAuroral Arcs,” Ann. Geophys. 21 (7), 1793–1805(2003).
16. V. V. Safargaleev, S. V. Osipenko, and A. N. Vasil’ev,“Special Periodic Arclike Forms in the Region of Pul�
sating Auroras,” Geomagn. Aeron. 40 (6), 38–43(2000) [Geomagn. Aeron. 40, 716–723 (2000)].
17. J. C. Samson, T. J. Hughes, F. Creutzberg, et al.,“Observations of a Detached, Discrete Arc in Associa�tion with Field Line Resonances,” J. Geophys. Res. 96(9), 15 683–15 695 (1991).
18. K. Schlegel and D. R. Moorcroft, “EISCAT as a Tri�static Auroral Radar,” J. Geophys. Res. 94, 1430–1438(1989).
19. M. V. Stepanova, E. E. Antonova, J. M. Bosqued,R. A. Kovrazhkin, and K. R. Aubel, “Asymmetry ofAuroral Electron Precipitations and Its Relationship tothe Substorm Expansion Phase Onset,” J. Geophys.Res. 107, JA003503 (2002.
20. M. A. Volkov and Yu. P. Maltsev, “Flute Instability ofthe Plasma Sheet Inner Boundary,” Geomagn. Aeron.26 (5), 798–801 (1986).
21. O. de la Beaujardiere, R. Vondrak, R. Heelis, et al.,“Auroral Arc Electrodynamics Parameter Measured byAE�C and Chatanika Radar,” J. Geophys. Res. 86,4671–4685 (1981).
22. O. de la Beaujardiere, R. Vondrak, and M. Baron,“Radar Observations of Electric Fields and CurrentsAssociated with Auroral Arcs,” J. Geophys. Res. 82,5051–5062 (1977).
23. C. F. del Pozo, P. J. S. Williams, N. J. Gazey, et al.,“Multi�Instrument Observations of the Dynamics ofAuroral Arcs: A Case Study,” J. Atmos. Terr. Phys. 64(15), 1601–1616 (2002).
SPELL: OK