Comprehensive characterization of marine dissolved organic matter by Fourier transform ion cyclotron...
8
Comprehensive characterization of marine dissolved organic matter by Fourier transform ion cyclotron resonance mass spectrometry with electrospray and atmospheric pressure photoionization Juliana D’Andrilli 1 , Thorsten Dittmar 2 , Boris P. Koch 3 , Jeremiah M. Purcell 4y , Alan G. Marshall 1,4 and William T. Cooper 1 * 1 Department of Chemistry & Biochemistry, Florida State University, Tallahassee, FL 32306-4390, USA 2 Carl Von Ossietzky University, Oldenburg and Max Planck Research Group Marine Geochemistry, D-26111 Oldenburg, Germany 3 Alfred Wegener Institute for Polar and Marine Research, D-27570 Bremerhaven, Germany 4 Ion Cyclotron Resonance Program, National High Magnetic Field Laboratory, 1800 East Paul Dirac Drive, Tallahassee, FL 32310-4005, USA Received 25 August 2009; Revised 10 December 2009; Accepted 11 December 2009 We compare the ultrahigh resolution 9.4 T Fourier transform ion cyclotron resonance (FT-ICR) mass spectra of marine dissolved organic matter (DOM) isolated from two sites in the Weddell Sea (Antarctica) obtained by complementary electrospray ionization (ESI) and atmospheric pressure photoionization (APPI). Ions produced by APPI extend to higher carbon unsaturation than those produced by ESI, indicated by higher double-bond equivalents (rings plus double bonds) minus oxygen (DBE-O) values, whereas ESI-generated ions are more oxygenated. Moreover, many sulfur-containing compounds were efficiently ionized by ESI but not detected by APPI. Because the mass spectra obtained by ESI and APPI are significantly different, both are necessary to obtain a more complete description of the molecular composition of marine DOM. Copyright # 2010 John Wiley & Sons, Ltd. Dissolved organic matter (DOM) accounts for most of the organic carbon stored in the oceans, and it is roughly equal to the carbon present in the atmosphere as carbon dioxide (750 Pg C). 1 Marine DOM is a complex, polydisperse mixture of organic compounds, and previous high-resolution mass spectrometry studies have detected molecules with masses ranging from 300 to 700 Da. 2 Marine DOM plays a prominent role in global carbon cycling 1,3 and understanding its molecular composition is a critical aspect of better describing many biogeochemical processes in the ocean. 1 The predominant source of DOM in the oceans is thought to be marine primary and bacterial secondary production, with only minor contributions from land. 2,4 Due to the extensive formation of Antarctic bottom water there, the Weddell Sea (Antarctica) has been the subject of numerous circulatory and hydrographic investigations. 5–10 This Antarctic bottom water influences all major oceanic basins on earth. 11,12 The Antarctic Circumpolar Current isolates the Weddell Sea from terrestrial and aeolian influences, making it an excellent target for studies of DOM produced from purely marine sources. 2,3 Marine DOM is a complex mixture of several thousand compounds consisting of intact or transformed biomolecules released from living and decaying biota. 13 The complexity of DOM from any source, including the ocean, makes comprehensive molecular characterization problematic, as the common components of marine biomass (carbohydrates, amino acids, and lipids) represent less than 10% of deep sea DOM. 14–18 Fourier transform ion cyclotron resonance mass spectrometry (FT-ICR MS) at high magnetic field (>9.4 Tesla) is a powerful method for the advanced characterization of DOM. 2,13,19–21 High field strength is the key to the ultrahigh mass resolving power(m/Dm 50% >200 000), and mass accuracy (error <0.5 ppm) required for complete compo- sitional representation of complex DOM samples without prior chromatographic separation. 2 Electrospray ionization (ESI) and atmospheric pressure photoionization (APPI) are the soft ionization techniques most suitable for FT-ICR MS characterization of DOM. 13 ESI has to date been the ionization method of choice for studies of both terrestrial and marine DOM. 2,20–28 ESI creates positively or negatively charged ions over a wide mass range (10< m/z <3000) 29 and can be easily coupled with ultrahigh-resolution mass spectrometry. 30 However, ESI generates ions only from polar molecules, ionization efficiency increases with ion polarity, and salt adducts from sodium and/or potassium present in a sample are often produced. 31 The impact of such selective ionization on DOM characterization by ESI-FT-ICR MS has been discussed in a recent review article. 13 Unlike ESI, APPI can ionize non-polar molecules through electron detachment or charge transfer between a photo- ionized dopant (e.g., toluene) or other analyte and a DOM RAPID COMMUNICATIONS IN MASS SPECTROMETRY Rapid Commun. Mass Spectrom. 2010; 24: 643–650 Published online in Wiley InterScience (www.interscience.wiley.com) DOI: 10.1002/rcm.4421 *Correspondence to: W. T. Cooper, Department of Chemistry & Biochemistry, Florida State University, Tallahassee, FL 32306- 4390, USA. E-mail: [email protected] y Present address: Shell Global Solutions (US) Inc., Westhollow Technology Center, M-1260, 3333 Highway 6, South Houston, TX 77210, USA. Copyright # 2010 John Wiley & Sons, Ltd.
-
Upload
independent -
Category
Documents
-
view
1 -
download
0
Transcript of Comprehensive characterization of marine dissolved organic matter by Fourier transform ion cyclotron...

RAPID COMMUNICATIONS IN MASS SPECTROMETRY
Rapid Commun. Mass Spectrom. 2010; 24: 643–650
) DOI: 10.1002/rcm.4421
Published online in Wiley InterScience (www.interscience.wiley.comComprehensive characterization of marine dissolved
organic matter by Fourier transform ion cyclotron
resonance mass spectrometry with electrospray and
atmospheric pressure photoionization
Juliana D’Andrilli1, Thorsten Dittmar2, Boris P. Koch3, Jeremiah M. Purcell4y,
Alan G. Marshall1,4 and William T. Cooper1*1Department of Chemistry & Biochemistry, Florida State University, Tallahassee, FL 32306-4390, USA2Carl Von Ossietzky University, Oldenburg and Max Planck Research Group Marine Geochemistry, D-26111 Oldenburg, Germany3Alfred Wegener Institute for Polar and Marine Research, D-27570 Bremerhaven, Germany4Ion Cyclotron Resonance Program, National High Magnetic Field Laboratory, 1800 East Paul Dirac Drive, Tallahassee, FL 32310-4005, USA
Received 25 August 2009; Revised 10 December 2009; Accepted 11 December 2009
*CorrespoBiochemi4390, USAE-mail: cy PresentTechnoloTX 77210
We compare the ultrahigh resolution 9.4T Fourier transform ion cyclotron resonance (FT-ICR) mass
spectra of marine dissolved organic matter (DOM) isolated from two sites in the Weddell Sea
(Antarctica) obtained by complementary electrospray ionization (ESI) and atmospheric pressure
photoionization (APPI). Ions produced by APPI extend to higher carbon unsaturation than those
producedbyESI, indicatedbyhigherdouble-bondequivalents (ringsplusdoublebonds)minusoxygen
(DBE-O) values, whereas ESI-generated ions are more oxygenated. Moreover, many sulfur-containing
compoundswereefficiently ionizedbyESIbutnotdetectedbyAPPI.Because themassspectraobtained
byESI andAPPI are significantly different, both are necessary to obtain amore complete description of
the molecular composition of marine DOM. Copyright # 2010 John Wiley & Sons, Ltd.
Dissolved organic matter (DOM) accounts for most of the
organic carbon stored in the oceans, and it is roughly equal to
the carbon present in the atmosphere as carbon dioxide
(�750 Pg C).1 Marine DOM is a complex, polydisperse mixture
of organic compounds, and previous high-resolution mass
spectrometry studies have detected molecules with masses
ranging from 300 to 700 Da.2 Marine DOM plays a prominent
role in global carbon cycling1,3 and understanding its
molecular composition is a critical aspect of better describing
many biogeochemical processes in the ocean.1
The predominant source of DOM in the oceans is thought to
be marine primary and bacterial secondary production, with
only minor contributions from land.2,4 Due to the extensive
formation of Antarctic bottom water there, the Weddell Sea
(Antarctica) has been the subject of numerous circulatory and
hydrographic investigations.5–10 This Antarctic bottom water
influences all major oceanic basins on earth.11,12 The Antarctic
Circumpolar Current isolates the Weddell Sea from terrestrial
and aeolian influences, making it an excellent target for studies
of DOM produced from purely marine sources.2,3
Marine DOM is a complex mixture of several thousand
compounds consisting of intact or transformed biomolecules
ndence to: W. T. Cooper, Department of Chemistry &stry, Florida State University, Tallahassee, FL 32306-
[email protected]: Shell Global Solutions (US) Inc., Westhollowgy Center, M-1260, 3333 Highway 6, South Houston,, USA.
released from living and decaying biota.13 The complexity of
DOM from any source, including the ocean, makes
comprehensive molecular characterization problematic, as
the common components of marine biomass (carbohydrates,
amino acids, and lipids) represent less than 10% of deep sea
DOM.14–18 Fourier transform ion cyclotron resonance mass
spectrometry (FT-ICR MS) at high magnetic field (>9.4 Tesla)
is a powerful method for the advanced characterization of
DOM.2,13,19–21 High field strength is the key to the ultrahigh
mass resolving power(m/Dm50% >200 000), and mass
accuracy (error <0.5 ppm) required for complete compo-
sitional representation of complex DOM samples without
prior chromatographic separation.2
Electrospray ionization (ESI) and atmospheric pressure
photoionization (APPI) are the soft ionization techniques
most suitable for FT-ICR MS characterization of DOM.13 ESI
has to date been the ionization method of choice for studies of
both terrestrial and marine DOM.2,20–28 ESI creates positively
or negatively charged ions over a wide mass range (10< m/z
<3000)29 and can be easily coupled with ultrahigh-resolution
mass spectrometry.30 However, ESI generates ions only from
polar molecules, ionization efficiency increases with ion
polarity, and salt adducts from sodium and/or potassium
present in a sample are often produced.31 The impact of such
selective ionization on DOM characterization by ESI-FT-ICR
MS has been discussed in a recent review article.13
Unlike ESI, APPI can ionize non-polar molecules through
electron detachment or charge transfer between a photo-
ionized dopant (e.g., toluene) or other analyte and a DOM
Copyright # 2010 John Wiley & Sons, Ltd.

644 J. D’Andrilli et al.
analyte of interest.13,32 APPI is also capable of ionizing polar
species, is more resistant than ESI to chemical noise from
solvents and salts (particularly beneficial for DOM charac-
terization), and exhibits less ion suppression from matrix
effects.33,34 Generally considered to be a soft ionization
technique, APPI may induce more fragmentation than ESI
due to the heated nebulizer source that usually operates at
�3008C, although fragmentation of DOM by either ionization
mode has not been addressed to any significant extent.35
Dopant-assisted APPI can also produce radical cations that
may participate in further gas-phase reactions. An earlier
review suggested some advantages and disadvantages of
both ionization techniques for comprehensive DOM
analysis.13 Two recent reports compared mass spectra of
terrestrial DOM obtained by ESI and APPI.36,37 Marine DOM,
which comprises by far the largest DOM pool on earth, may
be different from terrestrial DOM at the molecular level, in
particular in functional group distribution and aromaticity.38
Therefore, molecular differences between marine and
terrestrial DOM may lead to different ionization profiles.
The objective of this work is thus to critically evaluate ESI
and APPI for use in a comprehensive approach to ultrahigh-
resolution mass analysis for the characterization of marine
DOM.
EXPERIMENTAL
SamplingWeddell Sea samples were collected during the ANT XXII/2
expedition of the research vessel Polarstern in the western
Weddell Sea (6 November 2004 to 19 January 2005).39 The two
sampleschosenfor thisstudywerea highlysalinebrinesample
formed within ice channels of the sea ice at the surface (Brine)
and a Weddell Deep Water (WDW) sample from 700 m water
depth. Sea ice brine accumulates in small niches or pockets in
the floating sea ice and may be in contact with underlying
water. Organisms thrive in these brines, especially during
warmer seasons and with increased light exposure,
resulting in the production of large amounts of DOM that is
probably much younger than the DOM in adjacent bottom
waters.40 WDW is mainly composed of old water masses from
the North Atlantic and Pacific and it is a precursor of Antarctic
Bottom Water.11,12 In the Weddell Sea, it is carried to the sea
surface and modified by the air/surface interface depending
on the amount of sea ice formation and melting.41–43
DOM extraction and sample preparationDOM was isolated from the salty seawater matrix via a new
solid-phase extraction (SPE) method.44 To date, this
improved SPE method is the most efficient technique for
obtaining salt-free DOM samples from seawater. Prior to
extraction each sample was prefiltered through a sequence of
3.0 and 0.2mm Nuclepore filter cartridges. A volume of 20 L
of Weddell Sea water was then acidified with hydrochloric
acid (p.a.) to pH 2 and pumped through a 5 g SPE cartridge
(PPL, Varian Mega Bond Elut, Varian Inc., Palo Alto, CA,
USA) at a flow rate of <50 mL/min.44 The cartridges were
then rinsed with 100 mL of Milli-Q water (water purified
with a Millipore Milli-Q to a purity greater than 18 MV/cm),
acidified to pH 2 to remove any remaining salts, dried with a
Copyright # 2010 John Wiley & Sons, Ltd.
stream of N2 and eluted with 30 mL of methanol (Merck
Lichrosolv) at a flow rate of <10 mL/min. Eluted DOM
samples were stored in the dark at �188C. For a complete
description of the SPE method, see Dittmar et al.44
Prior to ESI and APPI FT-ICR-MS analysis, the samples
were divided in half and diluted to 50:50 methanol/water
(HPLC grade) by volume. The samples prepared for APPI
were subsequently spiked with additional methanol and
toluene (100mL sample, 2 mL methanol, 200mL toluene).
Each sample was vigorously shaken for 1 min prior to
injection. Blank samples consisted of 100mL of 50:50 metha-
nol/water for ESI, and 100mL of 89.1% methanol, 8.7%
toluene, and 2.2% water for APPI-FT-ICR MS. These blanks
were injected before each sample to prevent sample carry-
over. Each sample was analyzed in duplicate and the mass
spectral data processed independently for each.
FT-ICR MSA custom-built 9.4 T FT-ICR mass spectrometer located at the
National High Magnetic Field Laboratory (NHMFL) in
Tallahassee, Florida, USA45,46 was used for all mass spectral
measurements. The 9.4 T instrument routinely produces
mass accuracy of approximately �0.2 ppm up to m/z �800.22
Multiple (150–200) time domain acquisitions were summed
for each sample, Hanning apodized, and zero-filled once,
before Fourier transform and magnitude calculation.47 The
external ion trap and ion guide octopole frequencies were
maintained at 1.5 MHz for all experiments. Each mass
spectrum was internally calibrated with a series of ions
observed and identified in previous studies.48 The mass
accuracy for these internal standards was calculated as
<1 ppm for all singly charged ions. The mass spectra of these
samples produced ions between m/z 300 and 700 for which
elemental compositions could be assigned. All observed ions
were singly charged, based on a separation of m/z 1.0034
between the 12Cn and 12Cn-113C1 isotopic forms of the same
ion.49,50
Electrospray ionizationNegative ions were produced with a custom-built ESI
source51,52 and a 50mm i.d. fused-silica tube. A syringe
pump delivered the analyte solution at a flow rate of 0.5mL/
min. Electrospray conditions were as follows: needle voltage,
�2.5 kV; tube lens, �340 V; and heated metal capillary
operated at �8 W. These conditions were based on previous
humic acid studies23 and optimized for DOM characteriz-
ation by ESI. We focused on negative ionization because it
produces more ions from marine DOM samples than positive
ionization; this is reasonable because of the high content of
carboxyl functional groups in marine DOM.
Atmospheric pressure photoionizationThe APPI source was manufactured by Thermo Scientific
(Waltham, MA, USA) and operates by pumping the
vaporized analyte gas stream in a direction orthogonal to
both the mass spectrometer inlet and a krypton vacuum UV
lamp.53 The ion source is coupled to the first differentially
pumped stage of the 9.4 T FT-ICR mass spectrometer through
a heated metal capillary (stainless steel, 750mm i.d.).53 The
analyte solution was delivered to the heated nebulizer in the
Rapid Commun. Mass Spectrom. 2010; 24: 643–650
DOI: 10.1002/rcm

Figure 1. FT-ICR mass spectra of Weddell Sea Brine DOM.
Top: APPI; Bottom: ESI. Insets are 0.40 m/z units segments
for nominal m/z 503. Peaks labeled with (þ) appear only by
APPI; those labeled with (�) appear only by ESI. Unlabeled
peaks are seen by both APPI and ESI.
Characterization of marine dissolved organic matter 645
APPI source by a stainless steel syringe (8 mL) and syringe
pump (Harvard Apparatus, Holliston, MA, USA).32 The
APPI conditions to produce negative ions were as follows:
solvent flow rate, 50–100mL/min; nebulizer heater tempera-
ture, 280–3008C; sheath gas (CO2) pressure, 550 kPa; and the
auxiliary gas port was sealed.32
Molecular formula assignmentFormula assignment begins by first analyzing ionm/zvalues as
described by Stenson et al.23 Briefly, the data are sorted first
according to odd/even mass, then by Z� (an independent
parameter used to further sort homologous �CH2 groups
based ondegreeofunsaturation),and finallybyKendrick mass
defect (KMD) to enable unambiguous elemental composition
assignment of neutrals.23,54 NHMFL MS software then
calculated all possible elemental compositions within
�1 ppm in mass. The allowed elements and the range of
atoms of that element were: 12C (0-100), 1H (0-200), 14N (0-3),16O (0-30), 32S (0-2), and 13C (0-1). These constraints are similar
to those established by Stenson et al.23 for chemical formula
determination of Suwannee River fulvic acids. A formula was
assigned to each ion peak with a magnitudeat least 10 times the
baseline root-mean-square (rms) noise. This conservative
threshold ensures a high level of confidence in our formula
assignments. For each negative ion observed, the elemental
composition reported is the corresponding neutral whose
mass is the massof the negative ionplusa proton(1.007276 Da).
Molecular formulae were assigned based on mass
accuracy (< �1 ppm), homologous Kendrick series, and13C isotope peak confirmation, which is especially important
at higher masses because mass resolving power and thus
mass accuracy decrease with increasing m/z. Once formulae
had been assigned, the data were then divided into different
categories for interpretation, including: carbon number,
heteroatom class, double-bond equivalents (DBE; number of
rings plus double bonds to carbon),55 and DBE minus oxygen
(DBE-O). Data sorted by class refers to heteroatom content
(numbers of N and S atoms). We do not include the number
of O atoms in the heteroatom count because O is found in all
DOM formulae. DBE is a measure of unsaturation (e.g., a
fully saturated hydrocarbon has a DBE equal to zero), where
c, h, and n are the number of carbon, hydrogen, and nitrogen
atoms in the chemical formula, CcHhNnOoSs.
DBE ¼ c � h=2 þ n=2 þ 1 (1)
Each additional ring or double bond results in a loss of two
hydrogen atoms.32 Here we have ignored the contribution of
S to unsaturation since the valency of S is not known.35
Previous work23 has identified an abundance of carboxyl
groups in DOM and thus the DBE-O parameter, even after
approximating the O valency and ignoring unsaturation due
to S, is nevertheless a useful measure of the hydrocarbon
unsaturation in DOM molecules.
RESULTS
ESI and APPI FT-ICR-MS of Brine DOMAPPI and ESI 9.4 T FT-ICR mass spectra of the Weddell Sea
Brine DOM extract are shown in Fig. 1. Both spectra exhibit a
roughly Gaussian distribution with m/z values ranging from
Copyright # 2010 John Wiley & Sons, Ltd.
300 to 800 that are characteristic of marine DOM spectra.2,28,56
The prominent peak at m/z 557.261 in the ESI spectrum is
from an impurity. The mass difference between the
measured mass and that calculated from the assigned
elemental composition was typically <0.5 ppm and the
resolving power was >500 000 at m/z 500. A 0.4m/z scale-
expanded segment at nominal m/z 503 in each spectrum is
depicted as an inset. Between m/z 503.000 and 503.400, 20
assignable molecular formulae are observed by ESI but only
15 with APPI (Table 1). The insets in Fig. 1 are annotated to
identify the ions observed in only one of the ionization
modes, referred to here as unique peaks. ESI yielded CHO
compounds ranging from O7 to O13 whereas for APPI the
oxygen content varied from O6 to O12. The major difference
between the two spectra is the six unique ion formulae
observed by ESI, five of which contain one sulfur atom.
Within this m/z 0.4 window at m/z 503, no sulfur-containing
ions were detected by APPI. This trend suggests that the
sulfur compounds in marine DOM exist either as a polar
group, i.e., sulfite or sulfate, or are not aromatic and therefore
are not ionized efficiently by APPI.
Rapid Commun. Mass Spectrom. 2010; 24: 643–650
DOI: 10.1002/rcm
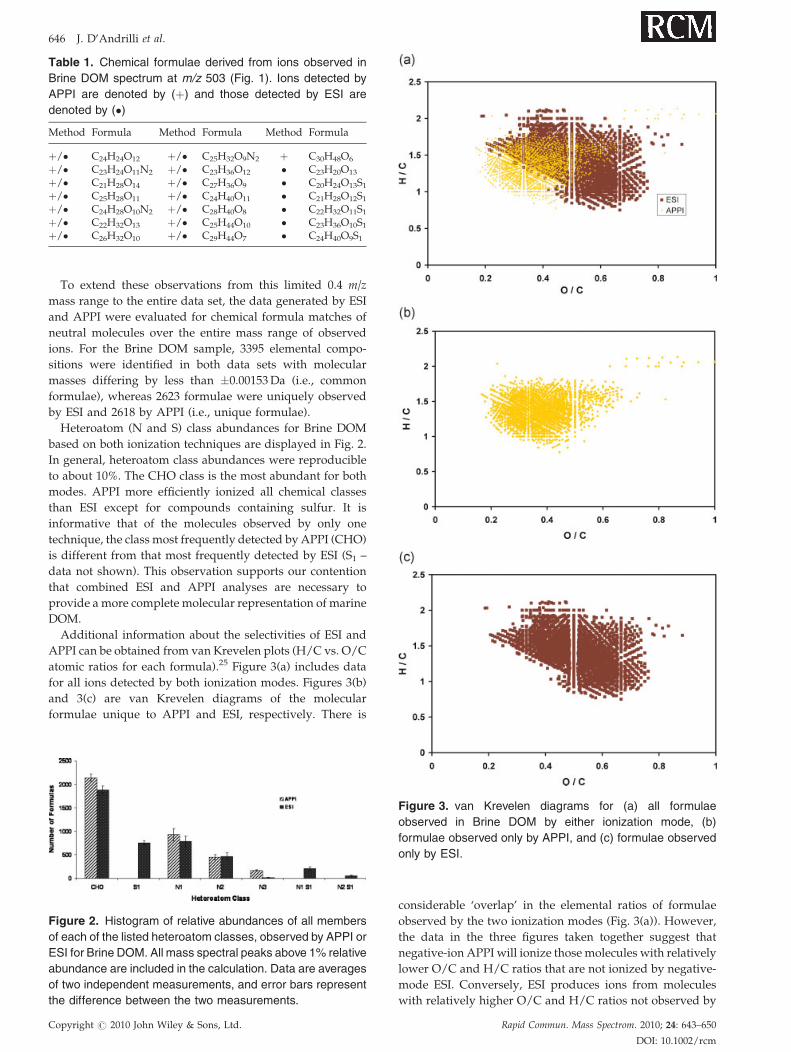
Table 1. Chemical formulae derived from ions observed in
Brine DOM spectrum at m/z 503 (Fig. 1). Ions detected by
APPI are denoted by (þ) and those detected by ESI are
denoted by (�)
Method Formula Method Formula Method Formula
þ/� C24H24O12 þ/� C25H32O9N2 þ C30H48O6
þ/� C23H24O11N2 þ/� C23H36O12 � C23H20O13
þ/� C21H28O14 þ/� C27H36O9 � C20H24O13S1
þ/� C25H28O11 þ/� C24H40O11 � C21H28O12S1
þ/� C24H28O10N2 þ/� C28H40O8 � C22H32O11S1
þ/� C22H32O13 þ/� C25H44O10 � C23H36O10S1
þ/� C26H32O10 þ/� C29H44O7 � C24H40O9S1
646 J. D’Andrilli et al.
To extend these observations from this limited 0.4 m/z
mass range to the entire data set, the data generated by ESI
and APPI were evaluated for chemical formula matches of
neutral molecules over the entire mass range of observed
ions. For the Brine DOM sample, 3395 elemental compo-
sitions were identified in both data sets with molecular
masses differing by less than �0.00153 Da (i.e., common
formulae), whereas 2623 formulae were uniquely observed
by ESI and 2618 by APPI (i.e., unique formulae).
Heteroatom (N and S) class abundances for Brine DOM
based on both ionization techniques are displayed in Fig. 2.
In general, heteroatom class abundances were reproducible
to about 10%. The CHO class is the most abundant for both
modes. APPI more efficiently ionized all chemical classes
than ESI except for compounds containing sulfur. It is
informative that of the molecules observed by only one
technique, the class most frequently detected by APPI (CHO)
is different from that most frequently detected by ESI (S1 –
data not shown). This observation supports our contention
that combined ESI and APPI analyses are necessary to
provide a more complete molecular representation of marine
DOM.
Additional information about the selectivities of ESI and
APPI can be obtained from van Krevelen plots (H/C vs. O/C
atomic ratios for each formula).25 Figure 3(a) includes data
for all ions detected by both ionization modes. Figures 3(b)
and 3(c) are van Krevelen diagrams of the molecular
formulae unique to APPI and ESI, respectively. There is
Figure 2. Histogram of relative abundances of all members
of each of the listed heteroatom classes, observed by APPI or
ESI for Brine DOM. All mass spectral peaks above 1% relative
abundance are included in the calculation. Data are averages
of two independent measurements, and error bars represent
the difference between the two measurements.
Figure 3. van Krevelen diagrams for (a) all formulae
observed in Brine DOM by either ionization mode, (b)
formulae observed only by APPI, and (c) formulae observed
only by ESI.
Copyright # 2010 John Wiley & Sons, Ltd.
considerable ‘overlap’ in the elemental ratios of formulae
observed by the two ionization modes (Fig. 3(a)). However,
the data in the three figures taken together suggest that
negative-ion APPI will ionize those molecules with relatively
lower O/C and H/C ratios that are not ionized by negative-
mode ESI. Conversely, ESI produces ions from molecules
with relatively higher O/C and H/C ratios not observed by
Rapid Commun. Mass Spectrom. 2010; 24: 643–650
DOI: 10.1002/rcm

Figure 4. Numbers of formulae as a function of DBE-O value
for Brine DOM, sorted by ionization mode.
Characterization of marine dissolved organic matter 647
APPI. The highest abundance observed by APPI corresponds
to O/C¼ 0.38 and H/C¼ 1.37, whereas in ESI it is shifted to
O/C¼ 0.51 and H/C¼ 1.45, i.e., ionizable compounds
having more oxygen and more hydrogen than for APPI.
These results are in general qualitative agreement with those
of Hertkorn et al.36 Figures 3(b) and 3(c) further emphasize
that there are significant numbers of ions produced by one
ionization mode but not the other. It should be noted that
these van Krevelen diagrams do not have the resolution to
unequivocally identify every peak observed in the FT MS
spectra. While it may seem that formulae with the same O/C
and H/C ratios are being observed in both modes, the data in
Figs. 3(b) and 3(c) do indeed represent formulae unique to
each.
Once molecular formula information is available, each
homologous series can be sorted by class, carbon number,
oxygen number, DBE, and DBE-O. Table 2 reports the
characteristics of the homologous series observed by each
ionization method in both Brine and WDW DOM. A
traditional Kendrick homologous series is defined as organic
compounds that differ by integer multiples of �CH2. We
identify members of homologous series based on the unique
neutral molecular mass, Z�, DBE, and DBE-O using an
original program developed in the PYTHON programming
language (Python Software Foundation). APPI and ESI for
Brine produced 399 and 472 �CH2 homologous series,
respectively. The data in Table 2 reflect a remarkable
similarity in the broad characteristics of molecules observed
by these two ionization methods.
However, further analysis reveals significant differences.
DBE-O distributions from APPI and ESI data are included in
Fig. 4. For APPI, the DBE-O distribution peaks at 0, whereas
�2 is the maximum for the ESI data. The DBE-O distribution
shift to more positive values for APPI suggests that more
highly unsaturated and possibly less polar compounds are
preferentially ionized by APPI relative to ESI.
Although the abundances of sulfur-containing compounds
in the Brine DOM observed by APPI are quite low (i.e., the S1
series in Fig. 2), enough are detected to further probe the
composition of this class. It should be noted that here we
define the S1 series as all compounds with one sulfur atom,
Table 2. Characteristics of �CH2 homologous series ident-
ified in Brine and WDW DOM by APPI and ESI. Note that S1
denotes a compound that contains one sulfur atom; the
remaining constituents are carbon, hydrogen, and oxygen
VariableAPPIBrine
ESIBrine
APPIWDW
ESIWDW
Number of �CH2
homologous series399 472 386 484
Carbon # range 13–44 13–41 13–48 13–43Oxygen # range 4–20 5–19 4–21 6–21DBE range 0–18 2–18 0–19 1–18DBE-O range �15–7 �11–7 �16–7 �10–6Number ofS1-containingcompounds
11 1224 2 855
S1 seriescarbon # range
16–24 13–34 14, 16 15–37
S1 series DBE range 0–1 0–13 1 2–14
Copyright # 2010 John Wiley & Sons, Ltd.
without regard to the presence of oxygen. This designation is
different from that commonly used to describe the
heteroatom content of crude oils, for which S1 refers to
hydrocarbons with one sulfur and no oxygen.32 The data in
Table 2 indicate that ESI ionizes S1 molecules with more
carbon atoms and higher DBE values (0–13) compared with
APPI. An increase in carbon number with a corresponding
increase in DBE is associated with the addition of aromatic
rings rather than additional alkylation. Lower DBE values
(0–1) for the APPI Brine S1 series suggest the presence of
alkylated compounds, not highly aromatic. We speculate
that these sulfur-containing compounds are part of less polar
species that are uniquely ionized by APPI. No S1 series
molecular formulae were observed by both ESI and APPI.
ESI and APPI FT-ICR-MS of WDW DOMMolecular formula analyses of ESI and APPI FT-ICR-MS data
for WDW DOM were carried out in exactly the same fashion
as for the Brine DOM. The results from the deep sea sample
largely confirm our findings obtained on the sea-ice brine.
For WDW DOM, 3248 molecular formulae were common to
both data sets, corresponding to mass differences less than
�0.00118 Da. Of the 4385 formulae not observed by both
methods, 2647 were unique to ESI and 1738 were unique to
APPI. The numbers of formulae sorted by ionization
technique and heteroatom class are summarized in Fig. 5.
Just as for the Brine DOM, CHO is the most abundant class
for both ESI and APPI. All sulfur-containing compounds
were ionized only by ESI, suggesting that sulfur in WDW
Figure 5. Heteroatom class distribution for WDW DOM
observed by APPI or ESI. All mass spectral peaks above 1%
relative abundance are included in the calculation. Data are
averages of two independent measurements, and error bars
represent the difference between the two measurements.
Rapid Commun. Mass Spectrom. 2010; 24: 643–650
DOI: 10.1002/rcm

648 J. D’Andrilli et al.
DOM also exists as polar species or as a part of a largely polar
molecule.
Figure 6 includes van Krevelen diagrams for all observed
ions (Fig. 6(a)) (i.e., those detected by both ionization modes),
ions observed only by APPI (Fig. 6(b)), and ions observed
only by ESI (Fig. 6(c)). The most common formulae unique to
APPI occur at lower O/C elemental ratios and higher H/C
Figure 6. van Krevelen diagrams for (a) all formulae
observed in WDW DOM by either ionization mode, (b)
formulae observed only by APPI, and (c) formulae observed
only by ESI.
Copyright # 2010 John Wiley & Sons, Ltd.
ratios, as for the Brine DOM. The ESI spectrum of WDW
DOM produced 484 homologous alkylation series, whereas
the APPI spectrum produced 386. The gross molecular
features of these series are summarized in Table 2. Figure 7
shows DBE-O distributions for elemental compositions
assigned by APPI and ESI. The trends in that data are
generally similar to those observed for Brine DOM, although
the ESI data does suggest higher relative abundances of
molecules with more negative DBE-O values in the Brine
DOM the than in the WDW DOM. Based on a comparison of
elemental ratios using the data in Figs. 3(c) and 6(c), this
feature appears to be due to the presence of more molecules
with ‘lipid-like’ or ‘protein-like’’’ character; i.e., higher H/C
and moderate O/C ratios.25 These data are consistent with
Brine DOM being somewhat fresher and less degraded than
the WDW DOM.
DISCUSSION
Ultrahigh mass resolution and mass accuracy 9.4 T FT-ICR
MS is an important tool for the advanced characterization of
marine DOM. Previous studies have compared ESI and APPI
coupled to FT-ICR MS in an effort to identify the
characteristics of each ionization method for the analysis
of terrestrial DOM.36,37 Hockaday et al.37 studied DOM
isolated from a lake by use of C18 SPE, and primarily
compared positive-ion ESI and APPI mass spectra. Fewer
than 1000 common ions were observed by positive-ion ESI
and APPI, far less than the number of common ions that we
observed by negative-ion ESI and APPI. Hertkorn et al.36
used ESI, APPI and atmospheric pressure chemical ioniz-
ation (APCI) to generate ultrahigh-resolution mass spectra of
Suwannee River fulvic acids. In that work, more assignable
formulae were identified by ESI than by APPI or APCI, in
general agreement with our results for marine DOM. These
authors also suggested that APPI tended to ionize smaller
and less polar molecules, but both ionization methods
generated ions with high levels of oxygenation. Our results
indicate that ESI produces ions that in general contain more
oxygen atoms.
The selective ionization of heteroatom DOM species
containing S and N is one very interesting result of this
work. Organic S-containing compounds are efficiently
ionized by ESI but almost unobservable by APPI, while N-
containing compounds are preferentially ionized by APPI. It
is important to note that here we define heteroatom classes
Figure 7. Numbers of formulae as a function of DBE-O value
for WDW DOM, sorted by ionization mode.
Rapid Commun. Mass Spectrom. 2010; 24: 643–650
DOI: 10.1002/rcm

Characterization of marine dissolved organic matter 649
(e.g. S1, N1) without regard to the number of oxygen atoms in
a molecule, since all DOM molecules contain oxygen. This
approach is different than that used by Purcell et al.53 who
were looking at heteroatom distributions in crude oils where
many species are not oxygenated. In that work, S1 refers to
the heteroatom class that contains one sulfur atom and no
oxygen. While Purcell et al. did not see any S1 compounds in
those crude oils by ESI, they did observe some S1O1 species,
results which are consistent with our data.
At this point we can only speculate as to the origins of these
observations, since there has been almost no discussion of the
mechanisms of ionization of DOM heteroatom species by
these techniques. However, we can suggest that, based on the
known ionization mechanisms of the two techniques, organic
sulfur compounds exist as polar molecules, probably
sulfates, and the sulfate groups are attached to aliphatic
and not aromatic core structures. Conversely, a substantial
fraction of organic nitrogen compounds appears to be non-
polar and probably a part of core aromatic structures.53
Taken together, the data in Figs. 3(a) and 6(a), as well as in
Figs. 4 and 7, suggest that the DOM in these samples is more
saturated, less aromatic and more oxygenated than in the
terrestrial DOM studied in previous comparisons of APPI
and ESI.36,37 This is not a surprising result, given the large
amounts of lignin, tannins and other highly chromophoric
molecules typically found in terrestrial DOM. Indeed, the
van Krevelen diagrams observed here are quite similar to
those of the refractory, carboxyl-rich alicyclic compounds
observed by Hertkorn et al. in Pacific Ocean marine DOM.28
Furthermore, we have more confidence in our observations
of a lack of highly unsaturated and aromatic compounds in
these samples because of the additional APPI data that we
collected, since APPI would preferentially ionize these types
of compounds.
CONCLUSIONS
We have demonstrated that neither ionization method, ESI or
APPI, can sufficiently ionize all heteroatom classes present
within marine DOM. Nearly all sulfur species were uniquely
detected by ESI, thus supporting the hypothesis that the
majority of sulfur-containing compounds in Brine and WDW
exist as polar species. Purcell et al.32 reported efficient
ionization of non-polar sulfur species in petroleum by APPI,
and we therefore conclude that the sulfur-containing
compounds present in Brine and WDW DOM must be polar
if less than 1% are detected by APPI. Less polar species were
more efficiently ionized by APPI, as reflected in the higher
H/C and lower O/C elemental ratios of the observed
formulae. In summary, these data emphasize the need to
combine as many ionization techniques as possible for a
more accurate representation of marine DOM.
AcknowledgementsThis work was supported by the US National Oceanic and
Atmospheric Administration through Grant No.
NA05OAR4311162, the NSF Division of Materials Research
through DMR-06-54118, and the State of Florida. We
thank Brad Vanmiddlesworth for his contributions to the
Copyright # 2010 John Wiley & Sons, Ltd.
development of data analysis programs written for both
PYTHON and MATLAB.
REFERENCES
1. Hedges JI. Why dissolved organics matter? In Biogeochem-istry of Marine Dissolved Organic Matter, Hansell DA, CarslonCA (eds). Academic Press: Boston, 2002; 1.
2. Koch BP, Witt MR, Engbrodt R, Dittmar T, Kattner G.Geochim. Cosmochim. Acta 2005; 69: 3299.
3. Muhlebach A, Weber K. Org. Geochem. 1998; 29: 1595.4. Ogawa H, Amagai Y, Koike I, Kaiser K, Benner R. Science
2001; 292: 917.5. Brenneck W.Aus demArchiv derDeutschen Seewarte 1921; 39: 216.6. Mosby H. Scientific Results of the Norwegian Antarctic Expeditions
1927–1928. Det Norske Videnskaps-Academi I: Oslo, 1934.7. Foster TD, Carmack EC. Deep-Sea Res. 1976; 23: 301.8. Deacon GER. Deep-Sea Res. Part a-Oceanographic Res. Papers
1979; 26: 981.9. Orsi AH, Nowlin WD, Whitworth T. Deep-Sea Res. Part I-
Oceanogr. Res. Papers 1993; 40: 169.10. Fahrbach E, Rohardt G, Schroder M, Strass V. Ann. Geophys. -
Atmos. Hydrospheres Space Sci. 1994; 12: 840.11. Wust G. Beitrage zur Geophysik 1939; 54: 1.12. Carmack EC. Water characteristics of the southern ocean
south of the polar front. In A Voyage of Discovery, Angel M(ed). Pergamon Press: Oxford, 1977.
13. Mopper K, Stubbins A, Ritchie JD, Bialk HM, Hatcher PG.Chem. Rev. 2007; 107: 419.
14. Hedges JI, Eglinton G, et al. Org. Geochem. 2000; 31: 945.15. Benner R, Pakulski JD, McCarthy M, Hedges JI, Hatcher PG.
Science 1992; 255: 1561.16. Benner R, Benitez-Nelson B, Kaiser K, Amon RMW. Geophys.
Res. Lett. 2004; 31.17. Lara RJ, Thomas DN. Mar. Chem. 1994; 47: 93.18. Minor EC, Simjouw JP, Boon JJ, Kerkhoff AE, van der Horst J.
Mar. Chem. 2002; 78: 75.19. Marshall AG, Hendrickson CL, Jackson GS. Mass Spectrom.
Rev. 1998; 17: 1.20. Kujawinski EB, Farrington JW, Moffett JW. Mar. Chem. 2002;
77: 133.21. Stenson AC, Landing WM, Marshall AG, Cooper WT. Anal.
Chem. 2002; 74: 4397.22. Kim S, Rodgers RP, Marshall AG. Int. J. Mass Spectrom. 2006;
251: 260.23. Stenson AC, Marshall AG, Cooper WT. Anal. Chem. 2003; 75:
1275.24. Kujawinski EB, Freitas MA, Zang X, Hatcher PG, Green-
Church KB, Jones RB. Org. Geochem. 2002; 33: 171.25. Kim S, Kramer RW, Hatcher PG. Anal. Chem. 2003; 75: 5336.26. Kim S, Simpson AJ, Kujawinski EB, Freitas MA, Hatcher PG.
Org. Geochem. 2003; 34: 1325.27. Kim SW, Kaplan LA, Benner R, Hatcher PG. Mar. Chem. 2004;
92: 225.28. Hertkorn N, Benner R, Schmitt-Koplin P, Witt M, Kaiser K,
Frommberger M, Kettrup A, Hedges JI. Geochim. Cosmochim.Acta 2006; 70: 2990.
29. Cole RB. J. Mass Spectrom. 2000; 35: 763.30. Kujawinski EB, Del Vecchio R, Blough NV, Klein GC,
Marshall AG. Mar. Chem. 2004; 92: 23.31. Cech NB, Enke CG. Anal. Chem. 2000; 72: 2717.32. Purcell JM, Juyal P, Kim DG, Rodgers RP, Hendrickson CL,
Marshall AG. Energy Fuels 2007; 21: 2869.33. Robb DB, Covey TR, Bruins AP. Anal. Chem. 2000; 72: 3653.34. Hanold KA, Fischer SM, Cormia PH, Miller CE, Syage JA.
Anal. Chem. 2004; 76: 2842.35. Reemtsma T. J. Chromatogr. A 2009; 1216: 3687.36. Hertkorn N, Frommberger M, Witt M, Koch BP, Schmitt-
Kopplin P, Perdue EM. Anal. Chem. 2008; 80: 8908.37. Hockaday WC, Purcell JM, Marshall AG, Baldock JA,
Hatcher PG. Limnol. Oceanogr. Methods 2009; 7: 81.38. Koch BP, Dittmar T, Passow U, Kattner G. Geophys. Res.
Abstracts 2006; 8: 00874.39. Koch BP, Ludwichowski KU, Kattner G, Dittmar T, Witt M.
Mar. Chem. 2008; 111: 233.40. Dieckmann GS, Lange MA, Ackley SF, Jennings JC. Polar
Biol. 1991; 11: 449.41. Deacon GER. Discovery Reports 1933; 7: 171.
Rapid Commun. Mass Spectrom. 2010; 24: 643–650
DOI: 10.1002/rcm

650 J. D’Andrilli et al.
42. Carmack EC, Foster TD. Deep-Sea Res. 1975; 22: 711.43. Gill AE. Deep-Sea Res. 1973; 20: 111.44. Dittmar T, Koch B, Hertkorn N, Kattner G. Limnol. Oceanogr.
Methods 2008; 6: 230.45. Hakansson K, Chalmers MJ, Quinn JP, McFarland MA,
Hendrickson CL, Marshall AG. Anal. Chem. 2003; 75: 3256.46. Senko MW, Canterbury JD, Guan SH, Marshall AG. Rapid
Commun. Mass Spectrom. 1996; 10: 1839.47. Marshall AG, Verdun FR. Fourier Transforms in NMR,
Optical, and Mass Spectrometry: A User’s Handbook. Elsevier:Amsterdam, 1990.
48. Gonsior M, Peake BM, Cooper WT, Podgorski D, D’AndrilliJ, Cooper WJ. Environ. Sci. Technol. 2009; 43: 698.
49. Brown TL, Rice JA. Anal. Chem. 2000; 72: 384.
Copyright # 2010 John Wiley & Sons, Ltd.
50. Kujawinski EB, Hatcher PG, Freitas MA. Anal. Chem. 2002;74: 413.
51. Senko MW, Hendrickson CL, Pasa-Tolic L, Marto JA, WhiteFM, Guan S, Marshall AG. Rapid Commun. Mass Spectrom.1996; 10: 1824.
52. Chowdhury SK, Katta V, Chait BT. Rapid Commun. MassSpectrom. 1990; 4: 81.
53. Purcell JM, Hendrickson CL, Rodgers RP, Marshall AG.Anal. Chem. 2006; 78: 5906.
54. Kendrick E. Anal. Chem. 1963; 35: 2146.55. McLafferty FW, Turececk F. Interpretation of Mass Spectra,
(4th edn). University Science Books: Mill Valley, 1993.56. Tremblay LB, Dittmar T, Marshall AG, Cooper WJ, Cooper
WT. Mar. Chem. 2007; 105: 15.
Rapid Commun. Mass Spectrom. 2010; 24: 643–650
DOI: 10.1002/rcm
![CYCLOTRON PRODUCED RADIONUCLIDES:GUIDANCE ON FACILITY DESIGN AND PRODUCTION OF [18F]FLUORODEOXYGLUCOSE (FDG)](https://static.fdokumen.com/doc/165x107/631647d8c32ab5e46f0db468/cyclotron-produced-radionuclidesguidance-on-facility-design-and-production-of-18ffluorodeoxyglucose.jpg)