Plasma Potential Enhancement by RF Heating Near the Ion Cyclotron Frequency
1
CONSIGLIO NAZIONALE DELLE RICERCHE
1IFP CNR, Assoc. EURATOM-ENEA-CNR per la Fusione, Via R.Cozzi 53, Milan, Italy
2 Politecnico di Milano, P.za L. Da Vinci 32, Milan Italy
Submitted for publication
ISTITUTO DI FISICA DEL PLASMA“Piero Caldirola”
Associazione EURATOM-ENEA-CNR
Via R. Cozzi 53 - 20125 Milano (Italy)
Questo rapporto esprime solo l’opinione degli autori al momento della redazione
Electron Cyclotron Emission temperaturefluctuations associated with magnetic islands and
real-time identification and control system
J. Berrino1, E.Lazzaro1, S.Cirant, 1 G.D’Antona2,F.Gandini1, E. Minardi1, G. Granucci1
FP 04/03 June 2004
2
Electron Cyclotron Emission temperature fluctuations associated with magnetic
islands and real-time identification and control system
J. Berrino1, E.Lazzaro1, S.Cirant, 1 G.D’Antona2, F.Gandini1, E. Minardi1, G.
Granucci1
1IFP CNR, Assoc. EURATOM-ENEA-CNR per la Fusione, Via R.Cozzi 53, Milan, Italy
2 Politecnico di Milano, P.za L. Da Vinci 32, Milan Italy
Abstract
An important focus of present research on thermonuclear fusion based on magnetic
confinement is the control of rotating magnetic islands of low helical mode numbers m,n
that are the nonlinear stage of resistive instabilities developing at magnetic surfaces
where q=m/n. These perturbations are often driven by external resonant “error fields“ or
mode coupling effects and maintained by local distortions of the current profile. Theislands can be reduced in width or completely suppressed by a current driven by electroncyclotron waves (ECCD) accurately located within the island. A requisite for an effectivecontrol action is the ability of identifying the relevant state variables (radial location,island amplitude, frequency and phase) in “real time” and vary accordingly the controlvariables (wave beam power modulation and direction). TraditionallyMagnetohtydrodynamic (MHD) instabilities are monitored by external magnetic signals,that however give no information about the radial location of the perturbation within theplasma. Here we describe the design of a real time diagnostics/control device using anoriginal algorithm for processing Electron Cyclotron Emission signals to monitortemperature fluctuations and EC wave power deposition.
3
I. IntroductionThe control of sawteeth and classical or neoclassical tearing modes of low m,n order is akey issue to reach the goals of controlled thermonuclear performance with tokamaks.
The advance in the theory and technique of rf non inductive current drive by high power
sources in the electron cyclotron frequency range has made possible a control strategybased on the focussing of the rf beams of Electron Cyclotron Waves (ECW) at the
location of the rotating magnetic islands [1-7]. Important results of suppression of these
instabilities have been obtained on ASDEX-U, FTU, and D-IIID tokamaks [4-7].The development of a robust technique of control, depends however on solving some
key problem of diagnostics in real-time of both the island location (“across “a certain qrational surface) and of the actual synchronous location of deposition of the ECW power.
One of the most appropriate input signals that can be used to monitor the onset and
evolution of the perturbation to be controlled, is provided by the coherent fluctuations ofradiative temperature of the Electron Cyclotron wave emission (ECE) from the hot
tokamak plasma. The well developed theory of ECE at the 2-nd harmonic, that is astandard diagnostics for temperature profiles, can be applied to describe the fluctuations
induced by the leading order effect of temperature flattening across an (m.n) magnetic
island located at a q=m/n surface [8], that unfortunately so far have not been reliablydetected independently [5] in real-time. Of similar importance is the instantaneous
identification of the location of the peak of EC wave power deposition at the 1-st or 2-ndharmonic, depending on the tokamak magnetic field configuration, expected to be close
to a major radius Rdep, where the gyrotron and electron cyclotron
†
wgyr,wce pulsations are
equal. At present the development of this subject is still in its development phase and
here we present physical basis (in Section II and III) and the test (in Section IV and V) ofa new simple algorithm and its implementation on a electronic control device based on
Digital Signal Processors, for application to the Frascati Tokamak Upgrade (FTU) [5].
There is mounting evidence [9] that modes are often coupled and therefore it is necessaryto foresee a control method suitable for a multimode feedback in the form of a ‘‘state’’
feedback scheme that can, in principle, monitor and possibly stabilize an arbitrarynumber of modes. The problem of control involves the basic resistive
4
Magnetohydrodynamic (MHD) physics and necessarily implies: a) development of the
simplest control procedure, b) definition (selection) of appropriate state variables {xk}(k=1,…M) and admissible control variables {ui} (i=1,…N), measurable and controllable
with definite acceptable errors, c) selection of the control policy, defined as a subset ofthe control variables, d) implementation of the decisional algorithms, into a detection/
control device, e) construction of a suitable actuator [10]. Finally we conclude in SectionVI remarking that a by-product of the algorithm proposed to analyze the ECE fluctuation
signals is real-time information on the profile of the safety factor q .
II. Temperature fluctuations associated with magnetic islands.
The physics of linear and nonlinear tearing modes is well developed [9-15] and for the
purposes of the present work we rely on established models and customary formalism for
large aspect ratio tokamaks, described for instance in Ref [15]. The equilibrium magnetic
field has components
†
B ≡ 0,Bq,Bf{ }and the physical transverse perturbed field is
represented in terms of a helical flux function as real part of
†
dB(r)eix ≡ — Ÿ yeixef( )where
†
x(t) = mq - nf - w(t)dtt
Ú (1)
is the angular variable of a perturbation rotating with frequency w.
In the nonlinear stage a magnetic island developing at the radius where q=m/n surfaceis a surface of constant helical flux:
†
y*(r,x) = 1-nqm
Ê
Ë Á
ˆ
¯ ˜ Bq
rs
r
Ú d ¢ r + ˜ y (r,t)cosx (2)
such that
†
B + dB( ) ⋅ —y* = 0 .
5
Close to the rational surface
†
y*(x,x) = -x2
2Ls
B0 + ˜ y cosx, where
†
Ls = qR /S is the shear
length and
†
r - rs = x = sW
2 2[cosx + W]1/ 2 with the flux label
†
W ≡ -y* ˜ y ( ) =8x2
W2 - cosx
and
†
s ≡ sign(x); W = 2 4Ls ˜ y B0
Ê
Ë Á
ˆ
¯ ˜
1/ 2
.
The profile of electron temperature is locally modified by the magnetic perturbation,
under the constraint of the heat transport equation [15,17]. In general toroidal or shearflow effects, not included in the conventional Reduced Magnetohydrodynamic (RMHD)
description used here, introduce asymmetric distortions of the shape of the island in thecon f igu ra t i on space , t ha t c an be r ep re sen t ed [19 ] by
†
y*(x,x) = - B0 2Ls( )x2 + ˜ y s 1+ 12 ae x( )cos(x - 1
2 ao x ) in terms of two parameters
†
ae,ao
<<1 weighing the even and odd (in
†
x) distortions. For the purposes of the present paper
these distortions can be neglected.We purport to extend here the customary treatment [15] by considering in the frame of a
rotating island, the steady (single fluid) heat transport equation in presence of a localizedpower source of density
†
PRF
†
-—^ ⋅ k^—^T - — // ⋅ k//— //T = PRF (3)
that should be associated with boundary conditions on the island separatrix. Strictly, the
growth of the island width W entails a time dependence in x; still the typical Sweet-Parker reconnection time-scale
†
tSP is much longer than the parallel heat conduction
time scale and the rotation period, and a quasi-static description is acceptable, having
the objective of studying the space structure of the temperature fluctuations.Considering a single mode located at a q=m/n surface it is convenient to write the heat
equation in magnetic island coordinates
†
W,x( ) with which the (nonlinear) parallel
gradient operator has the form
†
— // =1B
r B ⋅ — =
kqW2
16Ls
∂W∂x
∂∂x
W
=kq
Ls
x ∂∂x
W
and the
perpendicular gradient operator is
†
—^ ª∂
∂x.
For large parallel conductivity and rotation frequency,
†
k^
k //
Ê
Ë Á
ˆ
¯ ˜ is a small parameter and
6
†
Wc
23 / 2 =k^
k//
Ê
Ë Á
ˆ
¯ ˜
1/ 4Ls
kq
Ê
Ë Á
ˆ
¯ ˜
1/ 2
(4)
defines a characteristic island width associated with the competition between
perpendicular and parallel transport. Then it is convenient to write the steady state heattransport equation using the rescaled dimensionless variable
†
X = 4x Wc
†
∂2T(X,x)∂X2 +
X4
∂∂x
X ∂T(X,x)∂x
= 0 (5)
This procedure [15,17] leads to a transport equation valid inside (
†
W £1) and outside
(
†
W >1) the island.
Changing the variables
†
x,x( ) to
†
W,x( ) , since
†
∂W∂x
=4 2W
s W + cosx( )1/ 2 the governing
equation (5) can be cast in the equivalent form [15,17]
†
∂∂W
[cosx + W]1/ 2 ∂∂W
Ê
Ë Á
ˆ
¯ ˜
x
T +W4
4Wc4
∂∂x
[cosx + W]1/ 2 ∂∂x
Ê
Ë Á
ˆ
¯ ˜
W
T = 0 (6)
It is apparent that for a finite island and large parallel conductivity the unperturbed
equilibrium temperature profile is a flux function
†
T0 = T0(W) with
†
dT0
dW=
2pC∂W ∂x( )Ú dx
and C to be determined by boundary conditions far from the island. A finite parallel heat
conductivity prevents complete temperature flattening and therefore in the thin island
regime defined by the expansion parameter
†
eW = W2 Wc2 <1 the temperature is no longer
a function of the island flux surfaces. Let
†
T0(r) be in the (r, q, f) coordinates. A single
harmonic tearing mode of instantaneous phase x(t) can be expected to deform the
temperature profile in the neighborhood of the q=m/n surface as
†
T(X,x) = T0(rs) + X ¢ T 0(rs) + T(1)(X,x) +L (7)
where primes indicate derivative with respect to X. The leading harmonic term of the
temperature fluctuation observable, at time t, by an ECE diagnostic focused on a point ( r,J, z) can be written as
†
dT(r,x) ≡ T(1)(X,x) = T1(X)cosx (8)
7
retaining just the leading harmonic in x . In the notation, used in Ref [15], the amplitude
of the fluctuation has an instantaneous radial profile in x at a constant x.
Expressions (7) and (8) are inserted in (5) using the intermediate step
†
X ∂∂x
X ∂∂x
T0(rs) + X ¢ T 0(rs) + T1(X)cosx( ) = ¢ T 0(rs)X∂
∂xX ∂X
∂x
Ê
Ë Á
ˆ
¯ ˜ + X ∂
∂xX ∂T1(X)cosx
∂x
Ê
Ë Á
ˆ
¯ ˜
= - X W2 ¢ T 0(rs)Wc
2 + X2T1(X)Ê
Ë Á
ˆ
¯ ˜ ⋅ cosx + o(W3
Wc3 ⋅ sin(3x))
(8)
Then taking the cosx moment
†
12p L( )
-p
p
Ú cosxdx the equation for the profile of the
temperature fluctuation is obtained
†
∂2T1
∂X2 -X2
4T1 = -
W2 ¢ T 04Wc
2 X
in agreement with the existing literature [15]. Assuming as energy unit
†
T0(0)and equation
s is conveniently rewritten in dimensionless form as
†
d2 ˆ T 1(X)dX2 -
X2
4ˆ T 1(X) = -bX (9)
with the parameter
†
b =W2 ¢ T 0
4Wc2T0(0)
This inhomogeneous parabolic cylinder equation has a bounded solution with asymptotic
behavior
†
ˆ T 1(X) µx >>1
1X
, that is
†
ˆ T 1(X) = - ˆ T 1(-X) antisymmetric with respect to the rational
surface x=0. It is remarkable that so far only approximate treatments of eq. (9) have beenproduced in the literature [15-18]. Here we present a rather simple construction of an
exact solution of the equation that lends itself to rigorous discussion and further
extensions, with important consequences, as shown below,
Through the transformation
†
ˆ T = e-aX 2y the equation can be reduced by one order and
integrated directly:
†
¢ y = u; ¢ u - 4aXu = -bXeaX 2 (10)
The integration constants must be chosen requiring bounded behavior at infinity and atX = 0. The exact solution obtained is:
8
†
ˆ T b = 2 pbe- X24 ⋅ [erf( X
2) - erf( X
2 )] (11)
and its behavior for small and large X is
†
ˆ T b ªX Æ0
- 0.34802 ⋅ p 2 -1( )bX and
†
ˆ T b ~X Æ•
2b 2 -1( )e-X 2 4
X, as expected from the inspection of the equation.
An approximate particular solution that matches the asymptotic behavior at large and
small can be found:
†
T1(X)¢ T 0
=AXe- X2
4
X2 + B2 Æ
AB2 Xe- X2
4 X2 << B2
Ae- X24
XX2 >> B2
Ï
Ì Ô Ô
Ó Ô Ô
(12)
By least square fitting of the exact solution (11) of eq. (9) for b=0.25 we find A~.0308,
B~1.135. The exact solution and the fit are shown in Fig (1). It should be noted that
restoring dimensional variables (
†
X Æ x) in eq. (12) the corresponding coefficients can be
identified as
†
A @ W2 4 and
†
B @ 2Wd . From a best fit of the experimental fluctuation
measurements gives an estimate of the critical island width
†
Wd that is especially
important in neoclassical tearing modes theory [15,18].
The exact and the best fitting solutions (11) and (12) make it possible also to generalize
the technique proposed in of Ref (16) to reconstruct from ECE data the linear tearinginstability index D’. It is sufficient to replace the estimate eq.14 of Ref (16) of
temperature gradient with the exact solutions, restored to dimensional form
†
dTdx
=4
Wc
dln ydX
-X2
Ê
Ë Á
ˆ
¯ ˜ T(X) in their fitting formula
†
T(x,W,e1,1/a+,1/a-) and in (4),
†
¢ D =1/a+ -1/a- with the parameters defined in Ref. (16). A discussion of this problem
is left for future work.
The antisymmetric behavior of the temperature fluctuation across a rational surface isconsistent with the structure of the tearing mode displacement that in the ideal MHD[15] region, is related to the helical flux function
†
y(r)by
†
dx(r,x) = y(r) /Bq[1- nq /m], by
†
dT(r,t)—T0
= dx(r,x) =W4
Ê
Ë Á
ˆ
¯ ˜
2 Srs
nq /m1- nq /m
y (r)cosx (13)
where
†
y (r) is a dimensionless form of the cylindrical tearing flux function normalized
9
to one on the rational surface
†
r = rs. This expression is often considered to provide
adequate information on the island width and on the tearing stability index D’ [16]. As a
consequence of the perturbation the corresponding total local T profile is predicted[15,16], and observed [5,6], to be (partially) flattened.
III. Principle of identification of rational q surfacesA detection algorithm can then be designed and is described in the following, on the basis
of monitoring the “phase contrast” between pairs of oscillation signals
†
oj = dTe(rj)cosx j(t), j =1,2 from neighboring ECE channels
†
r1, r2.
The (unnormalized) expectation value of the correlation of two nearby ECE signals overa time interval t long compared with the oscillation period is
†
P(r1,r2) ≡ dTe(r1.)dTe(r2.)cosx(t)cos x(t) + df12( )t
= 12 dTe(r1.)dTe(r2.)cos df12( ) (14)
where the phase difference
†
df12 between two channels bracing the resonance is p if the
perturbation is antisymmetric with respect to the rational surface.
In particular considering a point on the left and one on the right of the rational surface,
†
r1 = rs - x, r2 ª rs + x the Taylor expansion of the correlation function around
†
r = rs gives
a continuous function of x
†
PN(x) = N[dTe(rs.)2) - x2 d ¢ T e(rs.)( )2]cos df12( )
where N is a normalization factor arranged to make
†
PN(x) @1 for
†
df12 ª 0 and
†
PN(x) @ -1
for
†
df12 ª p . Therefore in the antisymmetric case
†
PN(x) = N ddTe
drÊ
Ë Á
ˆ
¯ ˜
rs
2
x2 cosdf12 has a
concavity that is extremal at the rational surface x= 0 and can be monitored on a sequenceof ECE channels.
However in presence of a localized power source, for instance on the “O” point, as is the
case of ECRH/ECCD experiments aimed at stabilization of tearing modes, theantisymmetry is spoiled as the governing equation in steady state conditions is of the
type:
†
∂∂W
[cosx + W]1/ 2 ∂T∂W
+WWc
Ê
Ë Á
ˆ
¯ ˜
4∂
∂x[cosx + W]1/ 2 ∂T
∂x= P rfg W( ) (15)
10
where
†
P rfg(W) ªPrf
tot
4p2rsR0drf
Wc2
2k^
represents the rf power density localized within an
absorption line
†
drf ª W , that for simplicity from now on is taken uniform within the
island. In the notation of equation (5) now one has
†
d2 ˆ T 1(X)dX2 -
X2
4ˆ T 1(X) = -bX + g (16)
with
†
g = -Prf
tot
8p2rsR0drf T0(0)Ê
Ë Á
ˆ
¯ ˜
Wc2
2k^
, a parameter of order
†
Wc2 Wrs . The equation is still of
the class of inhomogeneous parabolic cylinder but it is apparent that the heat source term
destroys the antisymmetry of the solution at X=0. A particular solution of eq. (16) can beobtained with the method presented above that yields again an exact form:
†
ˆ T (X) = 2 pbe- X24 ⋅ [erf( X
2) - erf( X
2 )]
- ge- X24 { p
23/4 [1+ 12]Xe- X2
2 -p
27 / 4 [erf( X2) -1]+
p2 0
X
Ú e- t 22 t1/ 2erf( t
2)dt} (17)
fulfilling the boundedness requirement at infinity and at x=0. The shape of thetemperature fluctuation distribution in the “natural” and “heated” case are shown in
Fig.(2).
It is apparent that in presence of localized rf heating power the fluctuation amplitude is
no longer antisymmetric and
†
ˆ T 1(0) = gp
27 / 4 and
†
ˆ T 1(X) may not have detectable phase
variations that can be used to track the x=0 rational surface, but it has a positive
concavity at the rational surface. Also in this case an acceptable interpolating form maybe found by Least Squares fitting of the exact solution :
†
T1(X)¢ T 0
=AX + C( )e- X2
4
X2 + B2 Æ
AX + C( )e- X24
B2 X2 << B2
AX + C( )e- X24
X2 X2 >> B2
Ï
Ì Ô Ô
Ó Ô Ô
(18)
11
The best fit to the numerical solution for b=0.25, g=-0.15 gives A~0.507; B~0.34; C~
1.816. Also in presence of localized heating power the expression (14) for the correlationfunction
†
PN(x) of two channels that are on either side of the rational surface is concave at
x=0.
Consequently a fast robust decisional algorithm aiming at detecting an island (or a
rational surface) during an experiment where the rf power should be deposited within anisland can be designed to detect the changes of concavity as well as the the phase jumps
in the correlation indicator
†
Pij @ PN(x) of the radiative (temperature) fluctuations from
nearby channels (i, j).
This poses in practice some more stringent requirements on the space resolution of theECE diagnostics.
Further complications arise in principle due to effects of island deformations in presenceof a sheared background flow or strong rotation effects [17] but these do not influence
substantially the requirements on the ECE diagnostics.
The details of a working algorithm to detect the island localizationare presented in thenext section. An important consequence of these results is that in presence of external
heating power the temperature fluctuation distribution is no longer solely a footprint ofthe magnetic island width, but it is linearly related to the injected power. So dTe itself is
not a “good” state variable to be used in a feedback loop, as it would lead to a positivefeedback of the applied power to itself! In a similar way, the rather stringent requirement
on the localization of EC wave power deposition within an island width and synchronismwith its motion, for efficient balancing of TM and NTM driving mechanisms [1-3]
becomes somewhat less relevant, as the unperturbed “magnetic“ island is undetectable
while large power is applied, which is the realistic operation scheme of a feedbacksystem. Still the detection of the q rational surface as point of maximum concavity of the
ECE channels correlation remains a robust detectable variable and its identificationbenefits from the long evolution time scale of the equilibrium. Then a control strategy
could be based not only on conventional PID (proportional-integral-derivative) feedback
schemes tracking a single mode but could also include monitoring as many rationalsurfaces as possible at a given time and adopting an optimal control strategy of applying
power in discontinuous manner to the largest fluctuation observed [19,20]. The subject
12
requires an in depth investigation outside the scope of the present work.
IV. Implementation of the diagnostics principle and definition of decisionalalgorithm.The usual arrangement of the ECE diagnostics in tokamaks is shown schematically in
Fig. 3. For definiteness we refer to the FTU tokamak [5] where there are 12 ECEchannels allowing a space resolution of ~2.5 cm.
As argued in the previous section the relative phase of two neighbouring ECE channelschanges smoothly except when a rational surface q=m/n with an island is located between
them: here a phase jump close to p occurs, if the temperature fluctuation is antisymmetric
. A procedure applicable to a real time processing of the signals, looking at these features
has been conceived. The ECE fluctuation signal of the i-th channel is constructed as
†
oi = ECEi - ECE i t1 where t1 is a suitable time interval over which the signal is
averaged. Then another time average over t2 > t 1 is performed to get a !normalization
amplitude
†
Ai = oi2
t2,
†
oinorm =
oi
Ai
and finally the (normalized) correlation indicator
between pairs of neighbouring channels
†
Pij = oinormoj
normt3
is constructed with an average
over t3 > t2 > t1. Usually j=i+1, but larger steps can be used. As explained in the previous
section a positive value
†
Pij ª1 means that a coherent oscillation is present, and a negative
value
†
Pij ª -1 that a phase jump
†
dj ij = poccurs. Since across the island position the
sequence of values
†
Pij ª1, -1,1 should occur, the localization algorithm looks for a
minimum-well, or positive concavity, in the
†
Pij sequence.
The different averaging time scales are adjustable parameters to cope with the highfrequency noise on one hand, and with thermal transport time constants on the other. The
constant t1 has to be chosen short enough in order to follow the average temperature Te
during the heating phase. The averages are performed with a digital first order filter
obtained as an approximation of a low pass filter with a pole in t0, the integration time
scale. The resulting difference equation of the filter is
†
I(1) = K1 ⋅ s(1); I(k) = K2 ⋅ I(k -1) + K1 ⋅ s(k)

13
where the f i l t e r cons tan t s
†
K1 a n d
†
K2 a re de f ined as
†
K1 = tsample tsample + tc( ); K2 = tc tsample + tc( ) with Ts the sampling period, s(k) the
input signal at the time k⋅ tsample. This Phase Contrast principle between neighbouring
ECE signals finds an obvious application in the automatic recognition of the sawteeth
inversion radius. Differently from a tearing mode, that is nearly monochromatic, thesawtooth instability is characterized by a rich series of harmonic components, which can
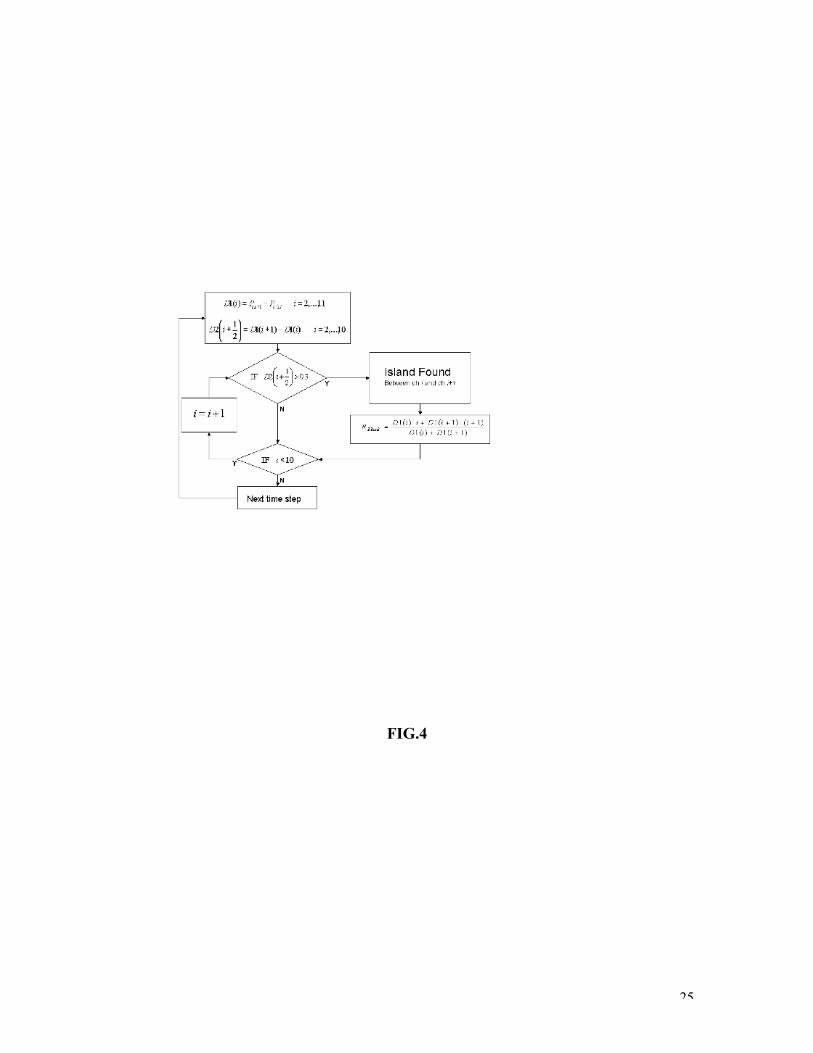
be used to improve reliability of the detection scheme. In Fig. 4 the flow chart is shownof the decisional algorithm performing the identification of the radial location of the
island (i.e. the rational q surface).
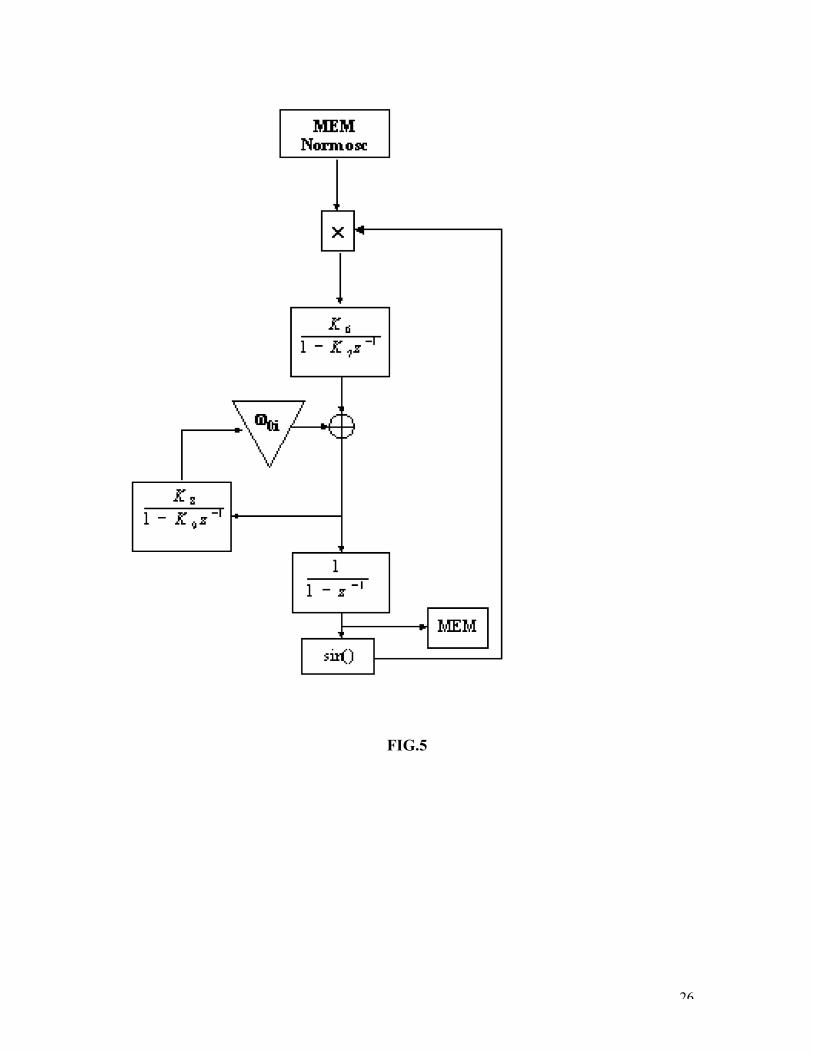
Magnetic islands are rotating perturbations and a fast tracking procedure of their phase
and frequency has been developed, as an efficient Digital Phase–Locked Loop (DPLL)
algorithm operating with a sampling frequency up to 50 kHz implemented on Digital
Signal Processor (DSP) , illustrated in the flow chart of Fig. 5a. To cover all the
frequency range 5 DPLL with different w0i are implemented.
In Fig.5b the phase–frequency tracking performance of the DPLL algorithm is
demonstrated on a case of initially coupled (2,1) and (1,1) modes that subsequently
decouple due to wall braking effects.
V. Results of off-line data analysisThe feasibility of this method has first been tested off-line on a series of representative
cases, from experiments carried out on the FTU tokamak in which ECRH was used to
interact with MHD instabilities[5]. The ECRH system on FTU [5a] consists of four units,
launching a 0.4 MW gaussian beam each, in the O-mode from the low-field-side. Off-
axis deposition is achieved both by tuning the toroidal field and by steering the beam
axes, in which case all the beams can be absorbed at different radii. Toroidal launch can
also be performed for ECCD application. The electron temperature Te is taken at twelve
radial positions by a multichannel ECE polychromator at a (40 kHz) sampling rate.
Two cases are described here, in which two of the four beams were coupled to high-q
discharges (qedge≈6) at Ip=200 kA for MHD control and TM stabilization studies. ECW
injection is purely perpendicular to the toroidal field lines, and only a negligible amount
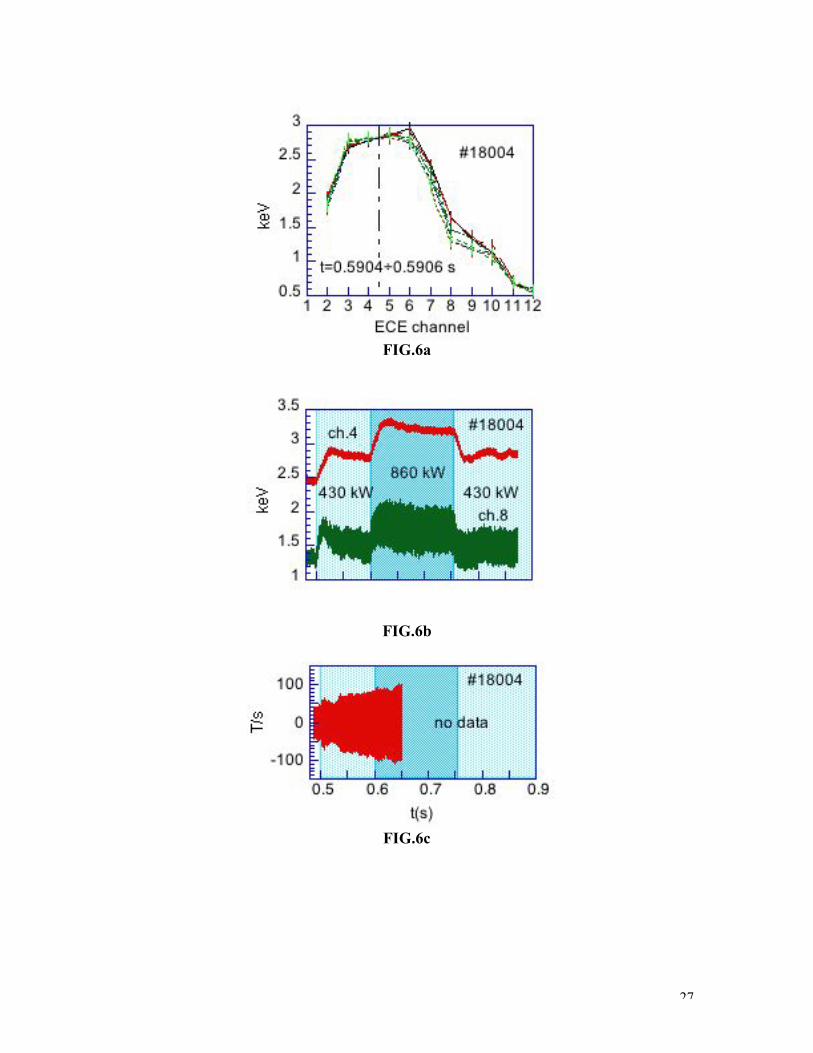
of n|| and ECCD due to poloidal field effect is expected. In the first experiment (Fig. 6)
14
the application of ECW power near, but within, the q =2 surface further enhances the
amplitude of coupled modes (2,1)+(1,1), as visible from (Fig.6a,b,c,d). In the first frame
of Fig. 6 (6a) the profile of ECE Trad(chan,t) of FTU shot 18004 is sampled at different
times between t=0.5904 and 0.5906s (one half cycle), showing how the Te profile
changes as the two modes rotate tightly coupled (same frequency). A significant
temperature flattening appears between chan.8 and chan.10, which is due to a m=2,n=1
rotating magnetic island. The presence of a (1.1) mode is clearly shown by the odd-like
profile distortion in the core Te waveforms from ECE chan. 8 close to (2,1) resonant
surface, and central chan.4 (Fig.6b) show the modes enhancement during a stepped ECW
power pulse (430kW, 860 kW and 430 kW). The time trace of the magnetic signal
†
˜ ˙ b q (T/s) from a Mirnov coil, (Fig. 6c) confirms that the (2,1) mode has been further
destabilized by the ECW power.
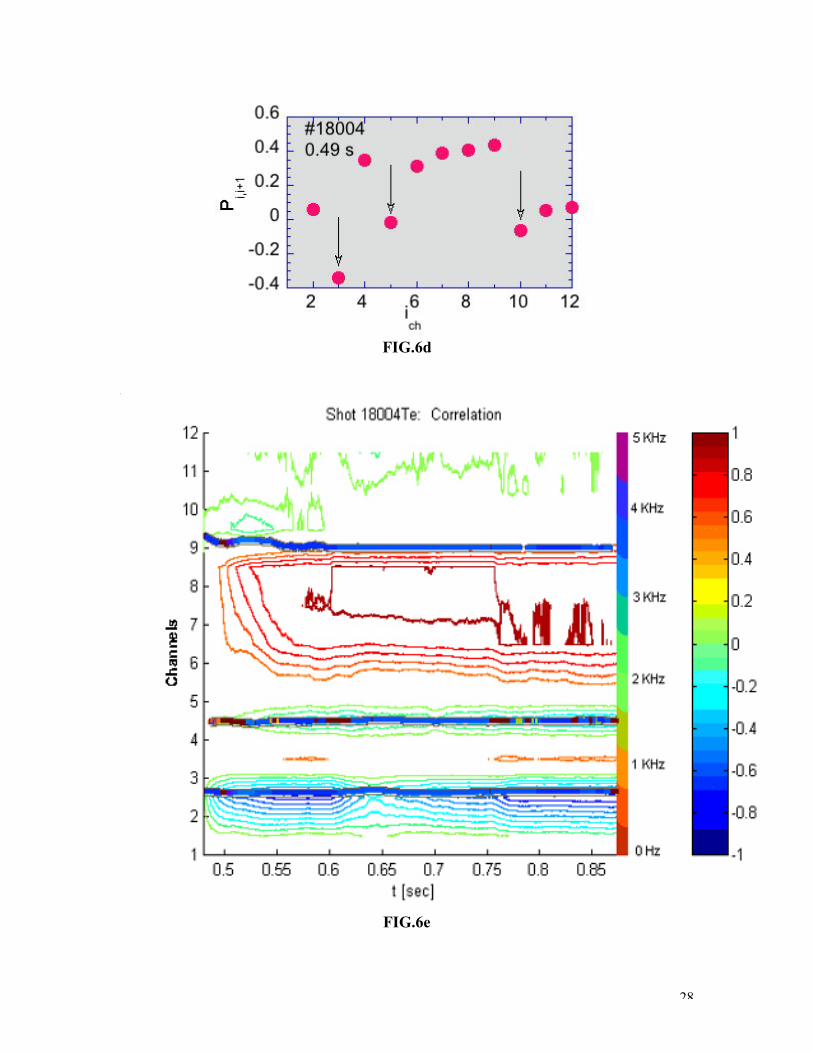
The result of the correlation analysis and of the decisional algorithm applied to this shot
is shown in Figs. 6d and 6e. The Frame 6d shows
†
Pi,i+1 plotted vs channel number i at a
fixed time t=0.49 s suggesting how the concavity criterion discussed in sections 2 and
3 works. In order to interpret the three dips in the correlation profiles at ch.2, ch.4 and ch.
9 (Fig.6d) one has to take into account the co-existence of two modes, one odd (1,1) and
one even (2,1). Although the islands are localized at different radii, their effects extend
over a large portion of the plasma column and partially overlap. Because of their different
parity (odd and even), on one side (poloidal angle) the two Te distortion will add but on
the opposite they will subtract. Depending on their relative amplitude, it might happen
that the resultant Te oscillations disappear on one side and are strengthened on the
opposite. Odd and even oscillations can be separated out provided that ECE channels are
symmetrically placed across the plasma axis both on the low and the high field side
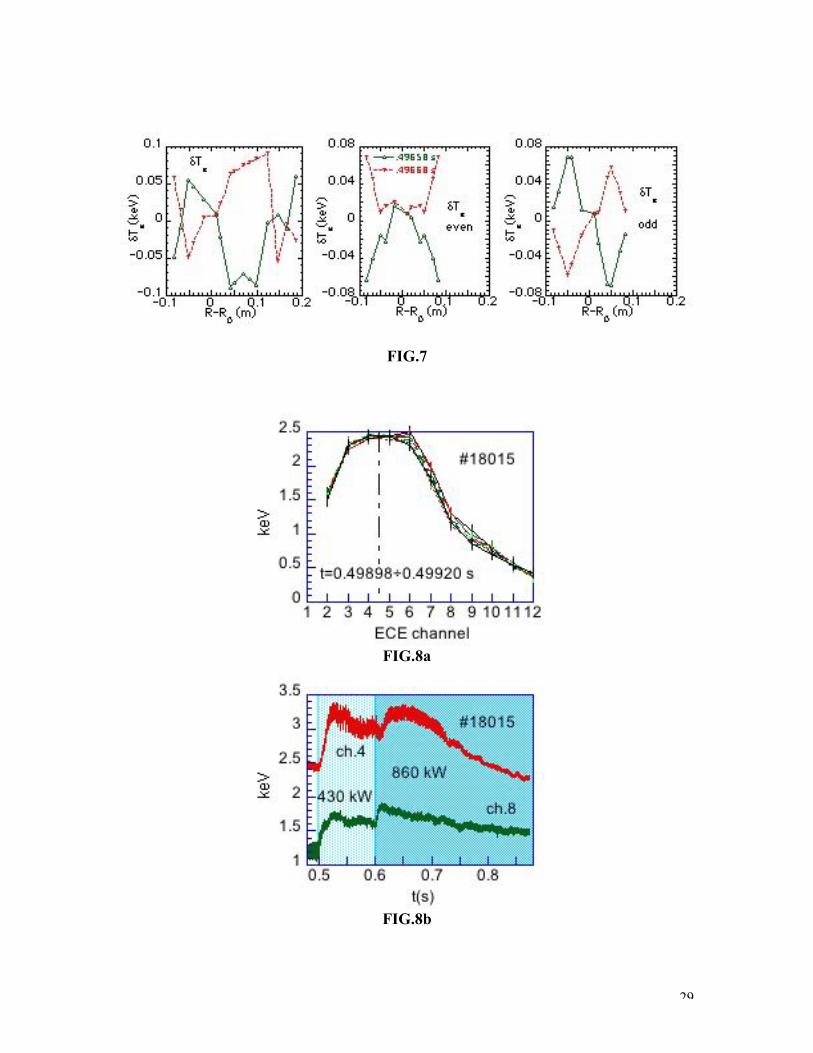
(Fig.7), by half-difference and half-sum of ECE channels opposite to the axis.
The three dips in Fig,6d are therefore interpreted as follows: at ch.4 the dip marks the
plasma axis, and it is due to the Te odd perturbation. At ch.2 the dip is due to (1,1) island
rotation, strengthened by (2,1) contribution (no dip is found at the symmetric ch.6-7 on
the same flux surface since odd and even oscillations compensate). The dip at ch.9 marks
(2,1) island position (no ECE channels are available for an high-field-side measurement
on the same flux surface).
15
Fig. 6e shows the contours of the channel pairs correlation function
†
Pi,i+1(chan,t) with
tracks of the “most negative” values of
†
Pi,i+1(chan,t) identifying the time evolution of the
q rational surfaces location within the ECE-channel frame..
More complex is the MHD history in the second case, shown in Fig.8a,b,c,d,e. when 400
kW of applied ECRH first stabilize the (2,1) mode. However, the electron temperature
and current density profiles evolve after (2,1) mode suppression in a way to de-stabilize
(1,1) periodical reconnections (sawteeth). A further increase of ECRH power to ≈800 kW
finally stabilizes sawteeth, although with some time delay consistent with the current
diffusion time from rdep to rinv [5b].
As in the previous case, Fig.8a and b show respectively the Te profiles at different times
within half-cycle and the Te time dependence at center and at (2,1) mode location. Mode
suppression, sawteeth appearance and suppression are clearly seen in the time traces.
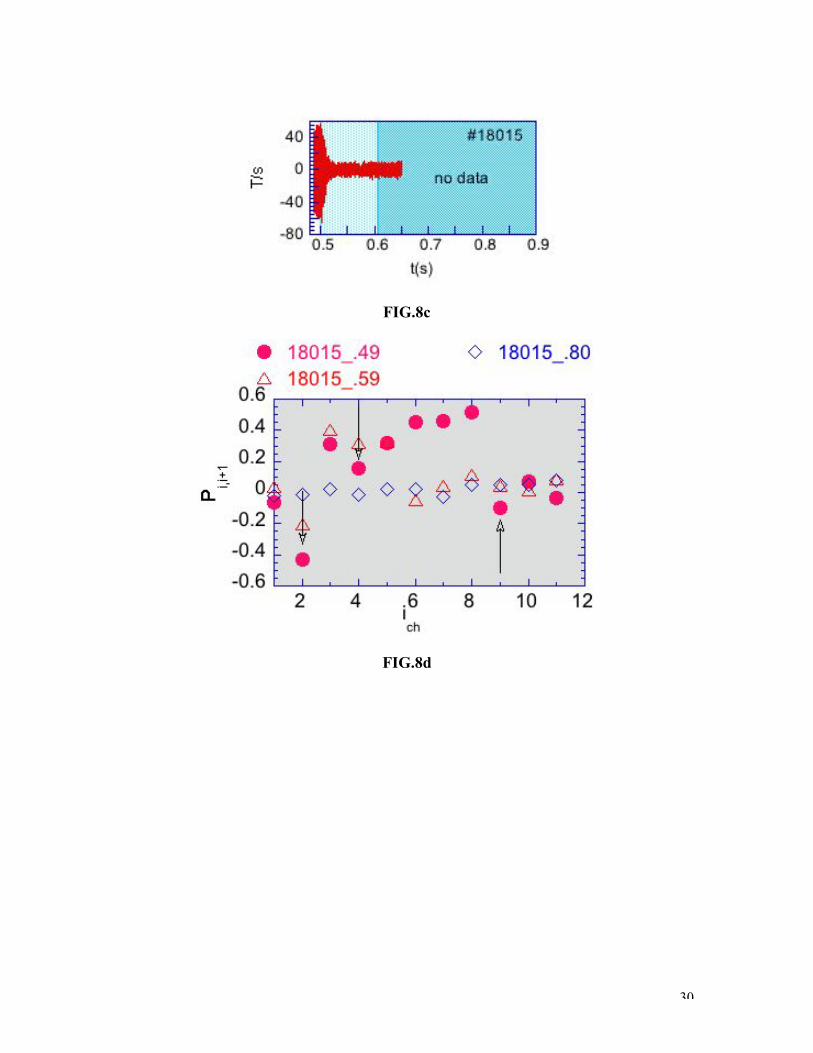
Fig. 8c shows Mirnov oscillations disappearing at (2,1) mode suppression. Fig.8d shows
†
Pi,i+1(chan,t) at three different times, first during (2,1) and (1,1) coupled co-existence
(full circles), second after (2,1) suppression but with sawteeth (open triangles), third with
all MHD suppressed (open diamonds). The interpretation in this case, is the following:
during (2,1)and (1,1) coupled activity three dips mark respectively the plasma axis (at
ch.4), (1,1) location at ch.2 and (2,1) location at ch.9, exactly as in the previous case.
During sawteeth oscillations the dip at ch.2 persists because the internal reconnection
now occurs there. The dip on axis has disappeared because reconnection (even parity) has
replaced (1,1) mode rotation (odd parity). When all MHD oscillations are suppressed,
also dips in
†
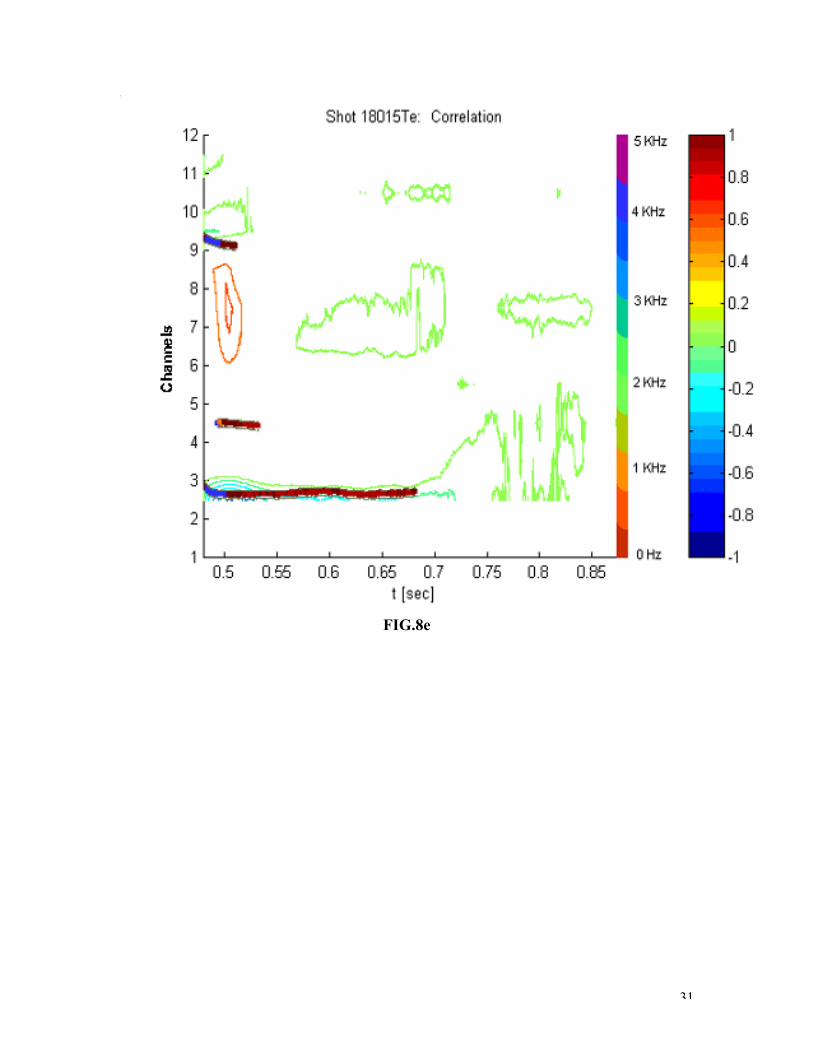
Pi,i+1 disappear. The time evolution of all these features is shown in Fig.8e.
This analysis shows that the phase-constrast algorithm can identify the (ECE channel)
location of all the active (m,n) unstable modes. Because of the presence of an odd mode
the axis is a point of phase inversion, and this has to be recognized. The existence of a
tearing mode is characterized by an area of strong positive correlation, quickly becoming
negative as the edge of the island is approached. These two features are to be used in
position tracking. The inversion radius is also identified by the same algorithm. Fig.8e
shows, in particular, how the inversion radius shrinks during sawteeth stabilization.
16
VI. ConclusionsNew theoretical results have been obtained exactly on the temperature fluctuationsassociated with a magnetic island, subject to localized ECW power injection meant to
stabilize it. Important consequences on the choices of feedback strategy are discussed. Anew diagnostic principle has been based on the detection of the properties of the cross
correlation between contiguous channels of a multichannel ECE diagnostic and a
numerical algorithm has been developed, appropriate for real-time applications. Thepreliminary tests show promising capability of island localization, even in presence of
several islands and mode coupling effects. The algorithm is programmable on DSP units,to allow for real-time detection of MHD rotating islands position, sawteeth inversion
radius and modulated EC waves absorption radius. It should also be remarked that the
delicate task of steering accurately ECW launcher antennae to focus precisely on islandscannot be reliably solved without a feedback system based on robust radial position
identification. A related result is a real-time diagnostics information for the
reconstruction of the q profile, that can be used as a constraint in MHD equilibriumreconstruction codes [21].
APPENDIX
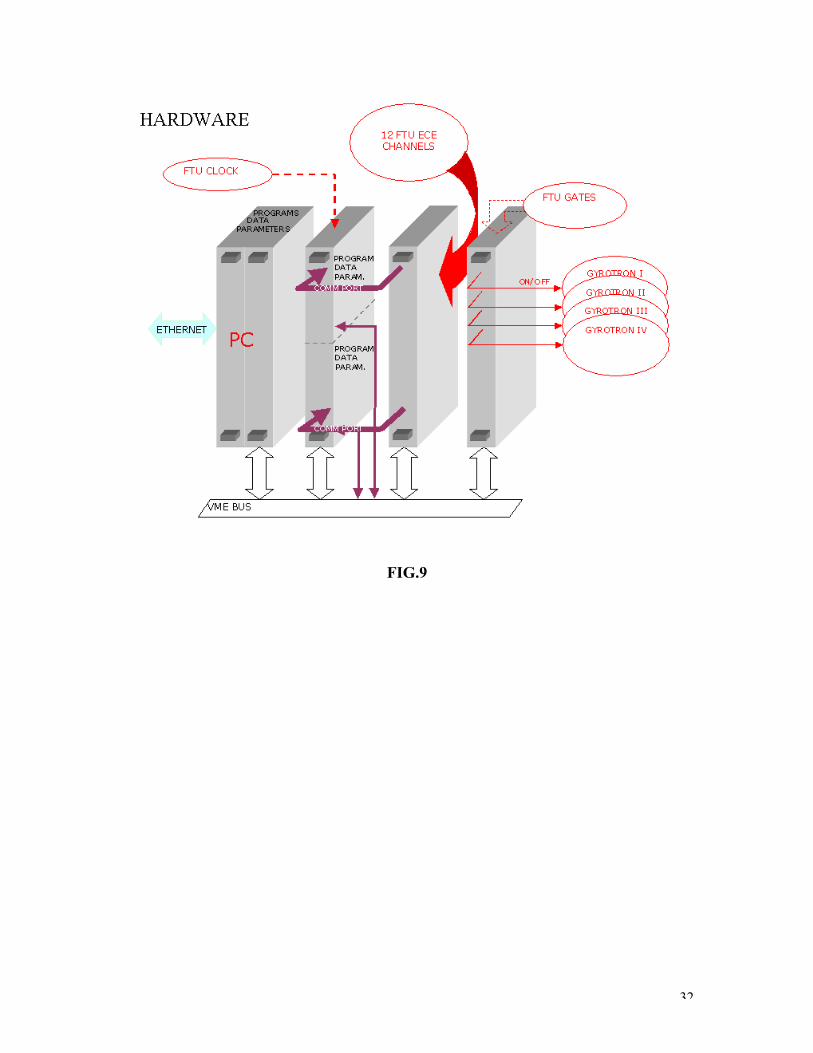
A1. System Architecture for on-line signal processing
The diagnostic and control device is implemented in a VME system and its architecture is
described in Fig. 9. The system consists essentially of five units: a Personal Computer
(PC), two Digital Signal Processors (DSP_A, DSP_B), 12 channels ADC (Analogue-
Digital Converter) and digital Input/output (I/O) board. The data acquisition and control
algorithms have been programmed on the two parallel DSP units, that can process FTU
ECE signals in real time. The 12 ECE signals are acquired by a VME ADC board (12
Analog input channels, 16 bit resolution) with a sampling frequency of 50 kHz. The real
time data transfer is done through the DSP high speed communication ports. A digital
input-output (IO) board on the VME bus is used to generate a gate signals for the
gyrotron’s Digital Waveform Reference [6]. A (PC) on the VME crate provides the
complete remote control of the system from the tokamak control room. Through the PC
17
Ethernet interface it is possible to set parameters, to feed the input command to the
system from the control room, to monitor system status and to get measurements at the
end of the discharge.
The communication between the two DSPs and the PC is achieved through a system of
messages that are written and read in shared memory areas. Also the parameters and
measurements are exchanged through shared memory areas.
Through the digital board the signal for the discharge preparation PRERUN GATE is got.
It is the signal that cause the parameter loading and boards initialisation.
The FTU clock is connected to the DSP_A’s timer after a logic stadium where a logic
AND is done with the synchronism signal FSC GATE (-10 sec). The signals of the 12
polychromator channels are acquired by the ADC and sent at the same time to the two
DSPs. While the DSP_A processor looks for the radial position of the island the DSP_B
saves the data and get the rotation phase and frequency. The DSP_B processor gives also
the on/off command to the gyrotrons through the digital I/O board.
18
References
[1] E.Lazzaro,G.Ramponi, Phys.of Plasmas 3, 978 (1996)
[2] S.Cirant,G.D'Antona,E.Lazzaro,G.Ramponi, Fusion Technology 31, 338 (1997)[3] H. Zohm, Plas. Plasmas 4, 3433 (1997).[4] G.Gantenbein, H. Zohm, G. Giruzzi, S. Günter F. Leuterer, M. Maraschek,
J. Meskat, W. Suttrop, and M. Zabiego, Phys. Rev. Lett. 85, 1242 (2000)
[5]S.Cirant E.Lazzaro , A.Bruschi et al., in Proceedings of 18th IAEA Fusion Energy
Conference, paper EX3/3,Sorrento, Italy 4-10 October 2000 (IAEA,Vienna, 2001)
[6] R. J. La Haye, S. Günter, D. A. Humphreys, J. Lohr, T. C. Luce, M. E. Maraschek, C.
C. Petty, R. Prater, J. T. Scoville, and E. J. Strait, Phys. Plasmas, 9, 2051, (2002)
[7] S.Cirant, A.Bruschi , M.De Benedetti , et al. In Proceedings of the 19th IAEA Fusion
Energy Conference, Lyon, France, October 14-19, 2002, paper EX/C4-2Rb
(IAEA,Vienna 2002)
[8]E.Lazzaro,M.F.Nave,A.Edwards,K.Hirsch,M.Hugon,A.Jacchia,H.Salzmann,P.Smeulders, Nucl.Fusion 32 , 825 (1992)
[9] M.F.F. Nave, E. Lazzaro, R. Coelho, P. Belo, D. Borba, R.J. Buttery, S. Nowak, F.
Serra, Nucl. Fusion 43 (2003) 1–9
[10]A.Bertocchi, et al., New Digital Waveform Reference for ECRH on FTU, Fusion
Engineering and Design 60 389-395,(2002)
[11] H. P. Furth, J. Killeen, and M. N. Rosenbluth, Phys. Fluids 6, 459 (1963).
[12] M.Kotschenreuther,R.D. Hazeltine, P.J.Morrison, Phys. Of Fluids 15,116 (1985)
[13] C. C. Hegna and J. D. Callen, Phys. Plasmas 1, 2308 (1994)
[14 ] E.Lazzaro, G.Lampis, G.Re, A.Hirose, A.Smolyakov, J.Callen, in Proceedings of
15th Conference on Controlled Fusion and Plasma Physics, 1994, CN-60/D-P20,Vol.3,
p.589 (IAEA,Vienna, 1996)
[15] R. Fitzpatrick Phys. Plasmas, 2, 825 (1995)
[16] C. Ren, J. D. Callen, T. A. Gianakon, and C. C. Hegna, Phys. Plasmas, 5,450 (1998)[17] S. V. Konovalov, A. B. Mikhailovskii, M. S. Shirokov and V. S.Tsypin, Plasma
Phys. Control. Fusion 44, 579–595 (2002)

19
[18] A I Smolyakov, E Lazzaro, M Azumi, Y Kishimoto, Plasma Phys. Control. Fusion
43 1661–1669 (2001)
[19]A. K. Sen, M. Nagashima, and R. W. Longman Phys. Plasmas, 10, 4350, (2003)
[20]L.S. Pontryagin, V.G. Boltyanskii, R.V.Gamkrelidze, E.F. Mishchenko,
“Mathematical Theory of Optimal Processes” Moscow:1961. (English translation,
N. York:John Wiley & Sons 1962)
[21]J. Blum, E. Lazzaro et al Nucl. Fus. 30,1475 (1990)
20
Figures
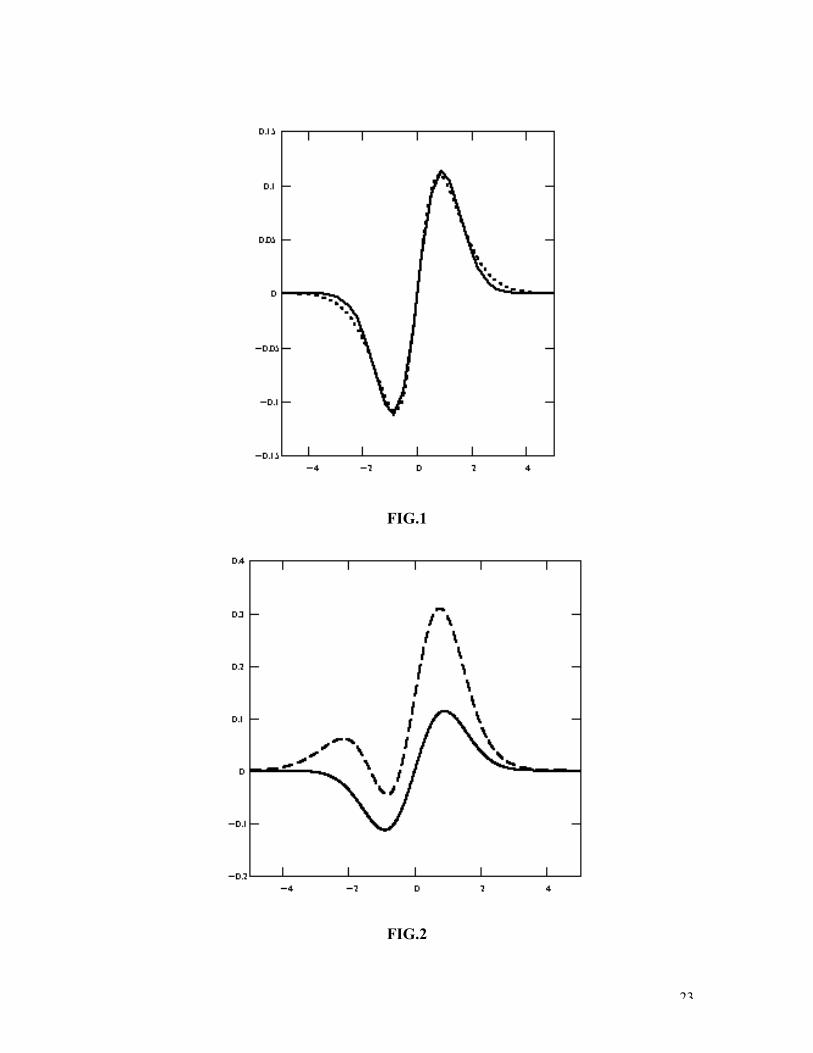
Fig.1- Temperature fluctuation across a rational surface in absence of localized rf power
deposition: solid line is the exact antisymmetric solution (11) for b= 0.25. Dotted line is
Lsq fitting function (12) with A~0.3, B ~ 1.14
Fig.2- Temperature fluctuation across a rational surface in absence and in presence of a
locally constant rf power deposition: solid line is the exact antisymmetric solution (11)
for b= 0.25. Dotted line is the exact solution (17) of equation (16) for b= 0.25. g= -0.15:
antisymmetry is destroyed.
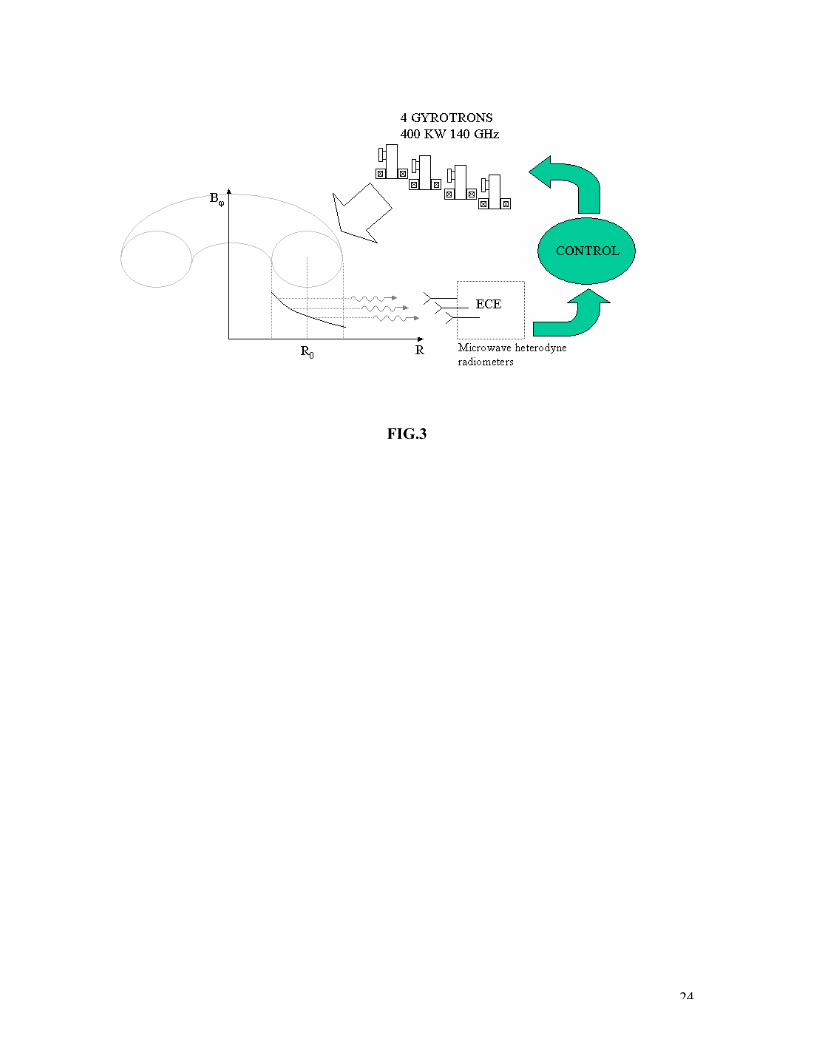
Fig.3- Schematic set-up of diagnostic-control system for MHD resistive instabilities
based on ECE signals and Electron Cyclotron Radiofrequency Heating (ECRH) power
delivered by four gyrotrons on the FTU tokamak.
Fig.4-Block diagram of algorithm based on the real-time estimate of the second
derivative of the correlation function to identify the ECE channels bracketing the rational
surface
Fig.5- a) Block diagram pf the Digital Phase Locked Loop algorithm for the tracking of
the rotating mode (island) frequency and phase; b) example of the performance of the
algorithm in tracking the oscillations of a coupled pair of modes m=1,n=1 and m=2, n=1
in FTU shot . 14979
Fig.6a – Electron temperature from fast ECE polychromator (40 kHz sampling rate), as a
function of the channel number, of FTU shot 18004 sampled between t=0.5904 and
0.5906s. Each channel is separated by ≈ 2.5 cm (dr/a=0.1). The vertical dashed line
marks the plasma axis. The profiles are sampled at intermediate times between a
minimum and a maximum of the temperature oscillations. Between chan.8 and chan.10 a
significant temperature flattening perturbation is active.

21
Fig.6b (top) and c (bottom) – Time traces of the electron temperature from two channels
of the ECE polychromator, one (ch.4) close to the axis and one (ch.8) close to the innermargin of a (2,1) rotating island. ECRH, stepped from 0 to 430 kW to 860 kW and back,
further de-stabilizes the (2,1) mode. EC deposition is peaked in this case at ch.8. Modede-stabilization is confirmed by the measurement of poloidal field fluctuations by Mirnov
coils (bottom figure).
Fig.6d – Plot of the correlation function Pi,i+1 versus the ECE channel. Minima are found
at ch.2 [(1,1) island between ch.2 and 3], at ch.4 (plasma axis between ch.4 and 5), and atch. 9 [(2,1) island O-point between ch.9 and 10].
Fig.6e - In this figure the correlation function Pi i+1(t) between neighbour channels fordifferent times is shown. Channels that correspond to different radial positions are
reported on vertical axis whereas discharge times are reported on horizontal axis. The
function Pi i+1(t) is plotted with coloured level curves: green correspond to near zerosvalues, red to positive values and blue to negative values. Island are identified where the
correlation is negative (blue areas) or more generally where Pi i+1’ s has a positiveconcavity (valley). In the figure island positions are marked with thick lines whose edges
are black and the interior filled with different colours that correspond to different mode’s
frequencies (red identifies low frequencies and blue high frequencies).
Fig.7 – Plot of dTe,ECE oscillation profile at maximum (dashed red) and minimum
(continuous green) Te,0. The total oscillation (left) is obtained by the superposition of anodd [(1,1) mode, at right] and an even [(2,1) mode, center] component. Odd and even
components are respectively extracted from the total measured oscillation by half-
difference and half-sum of symmetric channels.
Fig.8a – Electron temperature from fast ECE polychromator (40 kHz sampling rate, FTUshot 18015), as a function of the channel number, similar to 6a. In this case ECRH,
absorbed at ch.9, stabilizes (2,1) mode.

22
Fig.8b– Time traces of the electron temperature from two channels of the ECE
polychromator, in Fig.6b. A first ECRH step at 430 kW at 0.5 s stabilizes a pre-existing(2,1) mode, but then saw-teeth are de-stabilized. After an increase to 860 kW (a second
gyrotron is switched ON at 0.6 s), sawteeth are fully suppressed from 0,73 s on.
Fig.8c – (2,1) mode stabilization is detected also by the disappearance of poloidal field
fluctuations in Mirnov’s coil signal. Sawteeth cannot be detected by this diagnostic.
Fig 8d - Pi,i+1 versus the ECE channel at different times in the discharge. Red circles,taken during the ohmic phase, show the same features as in Fig.6d. Triangles are taken
during the sawtoothing phase: no dip at (2,1) position (mode is stabilized), no dip on axis
(sawteeth are a m=0 perturbation), clear dip at the inversion radius. Open diamonds,taken during the MHD-stable phase, are flat to zero showing that no mode is present.
Fig.8e – As in Fig.6e, the time dependence of the correlation function Pi i+1(t) betweenneighbour channels fully describes the mode evolution under the effect of powerful
ECRH.
Fig.9-Architecture of the identification-control apparatus:the blocks represent the PC
unit, the DSP-A and DSP-B units the analog-digital signal converter and the I/O units,interconnected via a VME bus and common ports. Shown are also the connections to the
FTU clock, ECE channels and pilot signals for the gyrotron battery.
23
FIG.1
FIG.2
24
FIG.3
25
FIG.4
26
FIG.5
27
FIG.6a
FIG.6b
FIG.6c
28
FIG.6d
FIG.6e
29
FIG.7
FIG.8a
FIG.8b
30
FIG.8c
FIG.8d
31
FIG.8e
32
FIG.9
Copyright © 2022 FDOKUMEN