Is the plasmapause a preferred source region of electromagnetic ion cyclotron waves in the...
23
Journal of Atmospheric and Solar-Terrestrial Physics 63 (2001) 1225–1247 www.elsevier.nl/locate/jastp Is the plasmapause a preferred source region of electromagnetic ion cyclotron waves in the magnetosphere? B.J. Fraser ∗ , T.S. Nguyen Cooperative Research Centre for Satellite Systems, Department of Physics, University of Newcastle, NSW 2308, Australia Received 7 June 2000; accepted 18 July 2000 Abstract It has generally been assumed in the past that the plasmapause is a preferred region for the generation and propagation of electromagnetic ion cyclotron (EMIC) waves in the Earth’s magnetosphere. One assumption invoked the overlap of the expanding cold plasmapause with the inner edge of the hot ring current during storm recovery to provide favourable conditions for EMIC instability. The plasmapause was also expected to provide a convenient gradient for guiding the waves from equatorial sources to higher latitudes. The paper commences from a historic perspective and reviews the development of the ideas from the 1960s that relate the source of EMIC waves to the plasmapause. CRRES spacecraft observations of EMIC wave events over L =3:5–8 and associated plasmapause locations indicate that the plasmapause is a region of wave generation and propagation, with signicant wave power seen in the plasmatrough, but is not necessarily the preferred region. Other results show that wave occurrence predominates in the afternoon and increases with radial distance and a He + slot is seen in the data. These agree with earlier AMPTE-CCE results from Anderson et al. (J. Geophys. Res. 97 (1992) 3075, 3089). New results from CRRES show all wave polarisations (left-hand, linear, and right-hand) are seen within 8 ◦ of the equator whereas linear predominates over 20–30 ◦ latitude. Waves are observed in background plasma densities of 4–300 cm −3 . Wave frequencies above the He + cyclotron frequency are concentrated outside the plasmapause in lower density regions of 2–30 cm −3 .c 2001 Elsevier Science Ltd. All rights reserved. Keywords: Plasmapause; EMIC waves; Magnetosphere 1. Introduction It has long been recognised that geomagnetic pulsations observed on the ground in the Pc1-2 band (0.1–5 Hz) at mid- dle and high latitudes are generated in the magnetosphere by a wave particle interaction involving energetic protons and possibly heavy ions (Mauk and McPherron, 1980; Roux et al., 1982; Inhester et al., 1984). The major source of free en- ergy driving this instability was considered to be provided by energetic (10 –100 keV) and anisotropic ring current protons (Cornwall, 1965). Satellite observations in the mag- netosphere have shown these waves to be predominantly ∗ Corresponding author. Tel.: +61-2-4921-5445; fax: +61-2- 4921-6907. E-mail address: [email protected] (B.J. Fraser). transverse and left-hand (LH)-polarised and identied them to be electromagnetic ion cyclotron (EMIC) waves (Mauk and McPherron, 1980). The dispersion relation for EMIC waves propagating parallel to the ambient magnetic eld in a cold proton–electron plasma shows that the parallel energy of the interacting protons has a minimum at the geomag- netic equator, suggesting the equatorial region is favoured for EMIC wave generation (Mauk, 1982; Hu et al., 1990). Although the convective growth rate (=V g , where V g is group velocity) will indicate the presence of growing waves, a more important parameter is the net amplication along the wave path (Liemohn, 1967; Hu and Fraser, 1994). Since this will maximise where the Alfven velocity (V A = B= (0p) 1=2 ) is lowest (Fraser et al., 1989), the favoured region again will be the equatorial region. Indeed, this has been illustrated with CRRES data where Poynting ux energy was always directed away from that region (Fraser et al., 1996). 1364-6826/01/$ - see front matter c 2001 Elsevier Science Ltd. All rights reserved. PII:S1364-6826(00)00225-X
-
Upload
independent -
Category
Documents
-
view
0 -
download
0
Transcript of Is the plasmapause a preferred source region of electromagnetic ion cyclotron waves in the...

Journal of Atmospheric and Solar-Terrestrial Physics 63 (2001) 1225–1247www.elsevier.nl/locate/jastp
Is the plasmapause a preferred source region ofelectromagnetic ion cyclotron waves in the magnetosphere?
B.J. Fraser ∗, T.S. NguyenCooperative Research Centre for Satellite Systems, Department of Physics, University of Newcastle, NSW 2308, Australia
Received 7 June 2000; accepted 18 July 2000
Abstract
It has generally been assumed in the past that the plasmapause is a preferred region for the generation and propagationof electromagnetic ion cyclotron (EMIC) waves in the Earth’s magnetosphere. One assumption invoked the overlap of theexpanding cold plasmapause with the inner edge of the hot ring current during storm recovery to provide favourable conditionsfor EMIC instability. The plasmapause was also expected to provide a convenient gradient for guiding the waves fromequatorial sources to higher latitudes. The paper commences from a historic perspective and reviews the development of theideas from the 1960s that relate the source of EMIC waves to the plasmapause. CRRES spacecraft observations of EMIC waveevents over L = 3:5–8 and associated plasmapause locations indicate that the plasmapause is a region of wave generation andpropagation, with signi=cant wave power seen in the plasmatrough, but is not necessarily the preferred region. Other resultsshow that wave occurrence predominates in the afternoon and increases with radial distance and a He+ slot is seen in the data.These agree with earlier AMPTE-CCE results from Anderson et al. (J. Geophys. Res. 97 (1992) 3075, 3089). New resultsfrom CRRES show all wave polarisations (left-hand, linear, and right-hand) are seen within 8◦ of the equator whereas linearpredominates over 20–30◦ latitude. Waves are observed in background plasma densities of 4–300 cm−3. Wave frequenciesabove the He+ cyclotron frequency are concentrated outside the plasmapause in lower density regions of 2–30 cm−3. c© 2001Elsevier Science Ltd. All rights reserved.
Keywords: Plasmapause; EMIC waves; Magnetosphere
1. Introduction
It has long been recognised that geomagnetic pulsationsobserved on the ground in the Pc1-2 band (0.1–5 Hz) at mid-dle and high latitudes are generated in the magnetosphere bya wave particle interaction involving energetic protons andpossibly heavy ions (Mauk and McPherron, 1980; Roux etal., 1982; Inhester et al., 1984). The major source of free en-ergy driving this instability was considered to be providedby energetic (10–100 keV) and anisotropic ring currentprotons (Cornwall, 1965). Satellite observations in the mag-netosphere have shown these waves to be predominantly
∗ Corresponding author. Tel.: +61-2-4921-5445; fax: +61-2-4921-6907.
E-mail address: [email protected] (B.J. Fraser).
transverse and left-hand (LH)-polarised and identi=ed themto be electromagnetic ion cyclotron (EMIC) waves (Maukand McPherron, 1980). The dispersion relation for EMICwaves propagating parallel to the ambient magnetic =eld ina cold proton–electron plasma shows that the parallel energyof the interacting protons has a minimum at the geomag-netic equator, suggesting the equatorial region is favouredfor EMIC wave generation (Mauk, 1982; Hu et al., 1990).Although the convective growth rate (�=Vg, where Vg is groupvelocity) will indicate the presence of growing waves, amore important parameter is the net ampli=cation along thewave path (Liemohn, 1967; Hu and Fraser, 1994). Since thiswill maximise where the Alfven velocity (VA = B=(�0p)1=2)is lowest (Fraser et al., 1989), the favoured region again willbe the equatorial region. Indeed, this has been illustratedwith CRRES data where Poynting Gux energy was alwaysdirected away from that region (Fraser et al., 1996).
1364-6826/01/$ - see front matter c© 2001 Elsevier Science Ltd. All rights reserved.PII: S1364 -6826(00)00225 -X

1226 B.J. Fraser, T.S. Nguyen / Journal of Atmospheric and Solar-Terrestrial Physics 63 (2001) 1225–1247
Fig. 1. Upper panel: A superimposed dynamic spectrum of Pc1 EMIC waves observed at the near-conjugate stations of Great Whale Riverand Byrd. The solid and dotted arrows represent signals observed at these two stations, respectively. Lower panel: Amplitude records of thewave structure illustrating the 180◦ phase shift between hemispheres (after Saito, 1969).
With an equatorial source of EMIC waves the nextquestion relates to the transmission of wave energy to theground. Amplitude-time records of EMIC waves observedon the ground show a series of wave packets which alter-nate between hemispheres (Saito, 1969). On frequency–time dynamic spectra the signatures were seen as a seriesof band-limited rising tones, which were approximately180◦ out of phase between hemispheres (Tepley, 1964;Glangeaud et al., 1980). An example is shown in Fig. 1.This suggested a mechanism where discrete wave packetsbounced between hemispheres, in a manner similar to VLFwhistlers. This has been the accepted propagation mecha-nism since the 1960s until recently when in situ satelliteobservations of EMIC waves showed only propagationaway from the equator, with no return of energy follow-ing ionospheric reGection (Erlandson et al., 1990, 1992;Fraser et al., 1996). More recent ground observations havealso questioned the bouncing wave packet concept as anexplanation of the frequency–time spectral =ne structure.For example, Mursula et al. (1997) found that the ob-served spectral =ne structure on the ground did not agreewith calculated double-hop magnetosphere travel timesfor that latitude. Instead, the EMIC wave packet struc-ture seemed more related to the properties of Pc3-4 wavepackets, upstream in the solar wind (Mursula et al., 1997;Plyasova-Bakounina et al., 1996; Rasinkangas and Mursula,1998). Currently, the question of the bouncing wave packetremains unanswered and further comparisons of satelliteand ground EMIC wave data are needed.
The association between EMIC wave signatures on theground and in the magnetosphere is diKcult to interpretdue to two primary complications. The =rst complicatingfactor relates to the profound eLect of heavy ions on EMICwave propagation in the magnetosphere. The presence ofheavy ions such as He+ and O+ modi=es the EMIC wave
dispersion relation through the addition of a new set ofcharacteristic frequencies. In a two ion (H+;He+) plasmathese include cutoL (fco), resonance (fHe+), crossover (fxo)and bi-ion (fbi) frequencies (Young et al., 1981; Fraser andMcPherron, 1982; Kozyra et al., 1984). One consequenceof the addition of He+ ions is equatorial trapping wherebywaves with f¿fHe+ propagating away from the equatorialsource region develop large wave-normal angles and arereGected back towards the equator at a latitude (∼ ± 20◦)where the wave frequency becomes less than fbi (Rauch andRoux, 1982). The only energy reaching the ground wouldbe due to tunnelling and mode coupling in the bi-ion region(Perraut et al., 1984). In contrast, the ground-satellite studyby Perraut et al. using GEOS-1 at synchronous orbit foundan unexpected∼50% of the waves with f¿fHe+ were seenon the ground. Furthermore, Anderson et al. (1996b) founda very good correlation between waves in space (f¿fHe+)and on the ground at the conjugate location. Evidence isalso provided in the ground-satellite event studies ofLudlow et al. (1991) and Erlandson et al. (1996). Fullwave theory recently developed by Johnson and Cheng(1999) shows that strong mode coupling in the presenceof He+ and O+ ions will allow wave energy to propagatethrough the bi-ion region. The presence of a heavy ionalso introduces a non-propagation stop band between fHe+and fco, giving a slot in the spectrum (Young et al., 1981;Mauk et al., 1981; Fraser and McPherron, 1982) and apolarisation reversal from LH to RH at fxo (Young et al.,1981; Fraser, 1982; LaBelle and Treumann, 1992).
A second complicating factor in identifying the location ofEMIC wave source regions in the magnetosphere is the phe-nomenon of ionospheric ducting. Some of the parallel propa-gating wave energy transmitted from the magnetosphere intothe ionosphere is converted from the LH-polarised mode tothe RH mode and becomes trapped in an ionospheric wave-
B.J. Fraser, T.S. Nguyen / Journal of Atmospheric and Solar-Terrestrial Physics 63 (2001) 1225–1247 1227
guide centred on the F2 region electron density maximum ataround 350 km (Manchester, 1966, 1968; Tepley and Land-shoL, 1966; Grei=nger and Grei=nger, 1968; Fujita, 1987;Fujita and Tamao, 1988a, b). This is a diLerent waveguideto the Alfven-ionosphere resonator identi=ed by Polyakovand Rapoport (1981). The F2 region waveguide propagatesEMIC wave energy horizontally across the ionosphere atdistances over 1000 km and frequencies &0:3 Hz, withgroup velocities in the range 300–800 km s−1 (Manchester,1966, 1968; Grei=nger and Grei=nger, 1973; Neudegg et al.,1995). Typical waveguide attenuation is¡10 dB=1000 kmwhich is most severe during the daylight hours at middle lat-itudes thereby restricting the area over which wave energy isdistributed during the daytime (Althouse and Davis, 1978;Hayashi et al., 1981; Neudegg et al., 2000). High-latitudeobservations suggest that the ionospheric waveguide doesnot support the horizontal ducting of EMIC waves with fre-quencies ¡0:3 Hz, probably due to the low-frequency cut-oL characteristics of the waveguide (Neudegg et al., 1995;Plyasova-Bakounina et al., 1996).
2. Source location
In the 1960s the bouncing ion cyclotron wave packet con-cept was postulated to explain the conjugate observationsillustrated in Fig. 1 (Jacobs and Watanabe, 1964; Obayashi,1965). Wave energy was produced by ion cyclotron reso-nance through convective instability which involved waveampli=cation (Gendrin et al., 1971). At this time, prior to thesatellite era, a primary objective was to use ground-baseddata to locate the source latitude of EMIC waves and re-late it to regions in the magnetosphere including the plas-masphere, plasmapause and plasmatrough. Techniques weredeveloped using single stations, and regional and world-wide multi-station networks (e.g. Fraser, 1968; Campbelland Stiltner, 1965; Althouse and Davis, 1978). Four tech-niques were used and these are now brieGy described.
2.1. Dispersion studies
Much of the work in the 1960s on EMIC waves wasbased on the ion–electron analogy with VLF whistlers andemissions propagating as electron cyclotron waves. At thistime, ground-based electron whistler dispersion propertieswere being used to determine the latitude of the propaga-tion path of the wave packet and the electron density in theequatorial region of the plasmasphere (e.g. Carpenter andSmith, 1964). It was these studies that led to the discoveryof the plasmapause (Carpenter, 1963). It was relatively easyto convert these techniques to the ion cyclotron regime, andpropagation path L values and proton densities were deter-mined from EMIC wave packet dispersion (Obayashi, 1965;Dowden, 1965; Watanabe, 1965). The techniques were soonextended to include heavy ions, primarily He+ (Dowden,1966; Fraser, 1972). This analysis process identi=ed bounc-
ing wave packets propagating along =eld lines roughly be-tween L = 4 and 8. The relationship of source latitude tothe plasmapause could not be determined at this time due tothe absence of precise plasmapause location measurementsand was based on a simple statistical formula developed byRoth and Orr (1975) where the plasmapause position de-pended on Kp and local time. These authors and Websterand Fraser (1985) concluded that EMIC waves propagatedclose to the plasmapause. A more precise determination wasnot made until the 1990s when coincident EMIC wave eventand spacecraft plasmapause observations became available.
The dispersion technique was not pursued beyond the1970s when it was pointed out that if the generation mech-anism was time-dependent with frequency, that is, not allfrequencies in the emission band were produced simulta-neously, then this would contribute to the observed appar-ent dispersion and produce erroneous results. For example,Gendrin et al. (1971) noted that many of the successive wavepacket frequency–time structural elements did not show dis-persion and pointed out the importance of considering thegeneration mechanism. They also noted that the clearest dis-persion was seen towards the end of emission events, whenthe generation and ampli=cation mechanisms had switchedoL and dispersion dominated.
2.2. Amplitude distribution
Widespread regional and global observations allowedthe study of ground EMIC wave amplitudes with latitude(Campbell and Stiltner, 1965). These observations showeda diurnal variation in maximum amplitude with early localmorning sources at middle latitudes (L= 2:4) and local af-ternoon sources at higher latitudes (L = 7:5). These resultspreceded the discovery of the F2 region ionospheric waveg-uide which distributes wave energy over a wide region(Manchester, 1966; Tepley and LandshoL, 1966) and con-sequently cannot be considered to necessarily represent theamplitude at the source latitude assumed to be that of therecording station. As the EMIC wave propagates isotropi-cally as a RH-polarised wave in the waveguide it experi-ences propagation attenuation in the guide and transmissionattenuation through the leaky E-region lower boundary(Manchester, 1966, 1968). Since the E-region density mayshow spatial variation in density and therefore attenuation,the distribution of signal amplitude with latitude observedon the ground may not fall monotonically with distance andis therefore an unreliable indicator of source location. IPDPwaves at high latitudes may not be ducted and Hayashi et al.(1989) have used amplitude contouring to locate sources.
2.3. Direction of arrival studies
The large-scale propagation of RH-polarised EMIC wavepackets parallel to the surface of the Earth in the F2 regionionospheric waveguide provided the possibility of using thesimple time-delay technique of triangulation for determining

1228 B.J. Fraser, T.S. Nguyen / Journal of Atmospheric and Solar-Terrestrial Physics 63 (2001) 1225–1247
Fig. 2. Left panel: Polarisation ellipse major axis projections from three stations (continuous lines) and source position from the time delaymethod on 10 October, 1978, 1545–1710 UT. The dotted lines are contours of constant f0F2 in MHz. Right panel: Measured source positionsplotted as a function of the statistical plasmapause position (Lpp). The dashed line represents a source on the plasmapause (after Fraseret al., 1984).
the direction of arrival of the EMIC wavefront as it passesover a network of ground stations. This technique will workbest if the three stations are located at a large distance fromthe source so that the wavefronts can be assumed plane orhave small curvature. Since the triangulation technique onlyprovides direction it is necessary to use two sets of sta-tions to provide two projected directions and their intersec-tion then de=nes a source location representing the exit re-gion of EMIC wave energy from the magnetosphere to theionosphere (Campbell and Thornberry, 1972; Fraser, 1975).The success of this technique requires a localised and rea-sonably stable ionospheric source region. Recent observa-tions indicate relatively small source region with latitudinalwidths of 60–100 km (Erlandson et al., 1996; Mursula etal., 1997). Source determinations for individual EMIC waveevents on the ground using this technique with a low-latitudenetwork distant from the source have been reported by Al-thouse and Davis (1978) and Fraser (1979, 1985). Takinginto account the wavefront geometry in conjunction with in-terstation diLerence in EMIC wave arrival times calculatedby correlation and cross-spectral techniques (typically 0–3s), allows a unique source location to be determined by it-eration methods (Kemp, 1984). An example is seen in theleft panel in Fig. 2. Here the crossed error bars indicatethe source identi=ed using an elliptical wavefront model.The reliability of this technique is enhanced by the inclu-sion of sources determined by the polarisation techniquedescribed below. Similar techniques have been used witha high-latitude network in cusp studies by Neudegg et al.(1995).
2.4. Polarisation studies
This technique utilizes the properties of the EMIC wavepolarisation ellipse in the horizontal plane observed by
two or more stations distant from the ionospheric source(Summers and Fraser, 1972; Fraser et al., 1984; Websterand Fraser, 1985). In this method the projection of themajor axis of linearly polarized waves in the plane of theEarth’s surface indicates the direction of arrival of the sig-nal in the ionospheric waveguide (Summers and Fraser,1972). Ray paths are projected back to the source takinginto account the statistical spread in polarisation ellipse ma-jor axis azimuth angles and refraction from f0F2 gradientsas shown in the LH panel in Fig. 2. The overlapping regionof the three wedge-shaped projections from two Australianstations (WM, NC) and one New Zealand station (outsidethe panel) de=nes a small source region. It can be seen thatthe small source region determined by polarisation projec-tions overlaps the error range of the time-delay determinedsource. Althouse and Davis (1978) have suggested that thepolarisation method may not always be reliable, howeverthey did not take ionospheric refraction into consideration.The possible plasmapause position determined by the statis-tical method of Roth and Orr (1975) is Lpp = 3:6± 0:4 andis plotted in Fig. 2. The source location of 13 EMIC waveevents determined using a combination of the direction ofarrival and polarisation techniques is plotted on the RHpanel in Fig. 2, against the corresponding statistical plasma-pause position. Eight of the measured sources overlap theplasmapause position with only one event being signi=-cantly outside, by 0:5Re. The remaining =ve are inside byup to 2Re. In general, sources close to the plasmapause areidenti=ed.
3. Early theoretical ideas
It was realised in the 1970s that EMIC waves play animportant role in overall magnetospheric dynamics. If of

B.J. Fraser, T.S. Nguyen / Journal of Atmospheric and Solar-Terrestrial Physics 63 (2001) 1225–1247 1229
suKcient amplitude they can cause pitch angle scatteringand precipitation leading to the loss of ring current ions(Kennel and Petschek, 1966; Cornwall et al., 1970). Thewaves can transfer energy to thermal electrons leading tothe generation of stable auroral red arcs (Thorne and Horne,1992). They also contribute to particle–wave–particle in-teractions via cyclotron resonance resulting in the heatingof H+, He+ and O+ ions (e.g. Gendrin et al., 1984; Mauk,1982, 1983). Anisotropic distributions (T⊥=T‖¿ 1) of ringcurrent ions with energies of 10–100 keV can destabiliseEMIC waves resulting in the emission of frequencies withX¡Ai=(1 + Ai) where Ai = T⊥=T‖ − 1 is the anisotropy,X = f=fi is the normalized frequency and fi is the ioncyclotron frequency (Kennel and Petschek, 1966). In asimple proton–electron plasma the resonant ion velocityscales as the Alfven velocity (VA). This suggested thatduring the recovery phase of a geomagnetic storm whenthe ring current overlaps the plasmapause, strongest wavegrowth should be observed just inside the plasmapause(Cornwall et al., 1970). Here the high cold plasma den-sity will reduce the phase velocity (VA) and thus allowthe waves to resonate with the bulk of the ion distribu-tion. This is well illustrated in Fig. 3 (Kawamura et al.,1982) and reGected the thinking of the era (Criswell, 1969;Cornwall et al., 1970). Gendrin (1975) showed that wave–particle interaction in a single ion cold plasma (H+) withhot H+ during the injection process would occur insidethe plasmapause for low anisotropy and outside for highanisotropy.
Positive temperature anisotropies can also be producedby substorm injections (Ishida et al., 1987), impulsivemagnetospheric compressions (Troitskaya et al., 1968; Ol-son and Lee, 1983; Kangas et al., 1986; Arnoldy et al.,1988; Anderson and Hamilton, 1993) and polar cusp in-jections (Bolshakova et al., 1980; Morris and Cole, 1991).This evidence suggests that there are regions other thanthe plasmapause that can support the generation of EMICwaves. This conclusion was borne out by in situ satelliteobservations of EMIC waves and accompanying energeticparticle and plasma properties involving heavy ion eLectswhich eclipsed ground-based observations in the 1980s and1990s.
Many of the ideas above and noted from early lineartheory have been superceded by more comprehensive andnon-linear theory (e.g. Gary, 1993). However, the importantrole of the plasmapause has been noted and the generationprocesses of EMIC waves will not be further considered inthis paper.
4. The satellite era
Most of the interpretation of ground-based observationsof EMIC waves discussed so far has been based on emis-sions comprising packets of energy within a wave train.
Fig. 3. A schematic plot of the distribution of thermal plasmarepresented by the plasmasphere and the ring current (hatched). Theoverlap region is considered to support ion cyclotron instability andthis moves outwards during the recovery phase (after Kawamuraet al., 1982).
These are the regularly structured waves of the type seen inFig. 1 and often referred to as “pearls” or hydromagneticemissions. The concept of a bouncing wave packet propa-gation model was based on these observations and it is nowgenerally agreed that structured emissions probably occurwithin the plasmasphere or just inside the plasmapause(Lewis et al., 1977; Hayashi et al., 1981; Fraser et al., 1989;Erlandson et al., 1992, 1996; Horne and Thorne, 1993; Mur-sula et al., 1997). Because satellites generally move very fastthrough the plasmasphere it is not possible to observe thebouncing wave packet phenomenon and prove the paradigm.However, it has been possible to measure satellite to groundtransit times within the plasmasphere using GEOS-1,DE-1 and Viking data (Gendrin et al., 1978; Ludlow et al.,1991; Erlandson et al., 1996; Mursula et al., 1997) and wavedispersion using Freja data (Mursula et al., 1994). These
1230 B.J. Fraser, T.S. Nguyen / Journal of Atmospheric and Solar-Terrestrial Physics 63 (2001) 1225–1247
times probably relate to the local Alfven speed although thiswas diKcult to estimate due to the absence of concurrentionospheric=exospheric density pro=le measurements.
At high latitudes there are a variety of unstructured EMICwaves seen on the ground and these have been variouslycategorised (Fukunishi et al., 1981; Menk et al., 1993). Out-side the plasmapause (L¿ 5) and at synchronous orbit, datafrom GEOS-1 and 2 and ATS-6 showed an increased oc-currence of EMIC waves and the =rst indication of the roleplayed by heavy ions (He+ and O+) in determining thepropagation properties and spectral characteristics of EMICwaves (Young et al., 1981; Mauk et al., 1981; Fraser andMcPherron, 1982; Roux et al., 1982). These eLects havebeen discussed in Section 2.
The most comprehensive study of EMIC wave proper-ties in the equatorial magnetosphere has been made by An-derson et al. (1992a, b) using AMPTE-CCE magnetometerdata over L = 3:5–9 and all local times. EMIC waves witha 10–70% occurrence probability were found on the day-side between 11–18 MLT (magnetic local time) at high Lshells (L¿7) while occurrence at L∼5, near the nominallocation of the plasmapause, is considerably less frequentat 6 1% and is spread relatively evenly over the day. Thisgreater occurrence at high latitudes agrees with the latitudedistributions observed in ground-based data by Campbelland Stiltner (1965) and Fraser (1968). The disadvantage ofthe AMPTE-CCE study was the absence of instrumentationcapable of continuously measuring cold plasma and locat-ing the plasmapause. This has been overcome by a recentstudy using CRRES data.
5. CRRES observations near the plasmapause
The combined release and radiation eLects satellite (CR-RES) was launched on 25 July, 1990 into an elliptical orbitof period 9 h 52 min, with apogee 6:3Re, perigee 350 kmand inclination 18:2◦. The initial local time at apogee was08 MLT and this decreased at a rate of ∼1:3 h per month.CRRES ceased to function on 11 October 1991 when itsapogee was about 14 MLT.
The aims of the observational study presented here are toprovide new results on the role played by the plasmapausein determining EMIC wave properties and a measure ofwave parameters and properties that will be useful input towave simulation and propagation studies in the future. Theresults take advantage of the CRRES spacecraft orbit andconcentrate on waves seen in the vicinity of the plasmapauseover a radial range of L ≈ 3–8 and oL the equator up to30◦ in magnetic latitude. Instrumentation onboard CRRESand of interest includes the AFGL magnetometer providingthree-component EMIC wave and main =eld data (Singeret al., 1992) and the University of Iowa=AFGL plasma waveinstrument providing cold electron density data (Andersonet al., 1992c).
5.1. Data analysis
Although the CRRES magnetometer covered a bandwidthof 0–8 Hz the necessity to process the large CRRES missiondataset comprising 1044 orbits of approximately 10 h dura-tion in a reasonable time on a PC computer was achieved byreducing the data analysis bandwidth to 0–2 Hz. A checkon 700 CRRES orbits showed that less than 5% of the to-tal number of EMIC wave events observed had frequenciesf¿ 2 Hz and no EMIC waves were observed at f&4 Hz.The primary data presentation used in this study was the dy-namic frequency–time representation of wave power, ellip-ticity and degree or percentage of polarisation. These datadisplays have been used in previous EMIC wave studies(e.g. Fraser et al., 1996).
The three-component Guxgate data sampled at 16 Hz−1
were analysed orbit by orbit. Only 8 h of data from each or-bit centred on apogee were used. Over the remainder of theorbit time, near perigee, the proton cyclotron frequency waswell above 8 Hz and often the magnetometer switched intothe low-sensitivity mode (Singer et al., 1992). The 16 Hz−1
data were =rstly detrended using polynomial curve =ttingand data gaps and spikes removed. The data were low-pass=ltered and then resampled at 0.25 s to prevent aliasing.A coordinate transformation from MGSE to a =eld-alignedsystem was then undertaken (Fraser et al., 1996). A Ham-ming window was applied to the time series and the mean re-moved prior to fast Fourier transformation (FFT) and spec-tral smoothing. To perform dynamic spectral analysis the8 h orbit segments were broken into 60 s or 240 point over-lapping segments giving a spectral resolution of 0.017 Hz.With a two-thirds overlap equivalent to a step of 20 s or 80points this provided 1437 FFT’s per 8 h orbit. Spectral av-eraging over 5 adjacent 20 s spectra produced 4.7 degrees
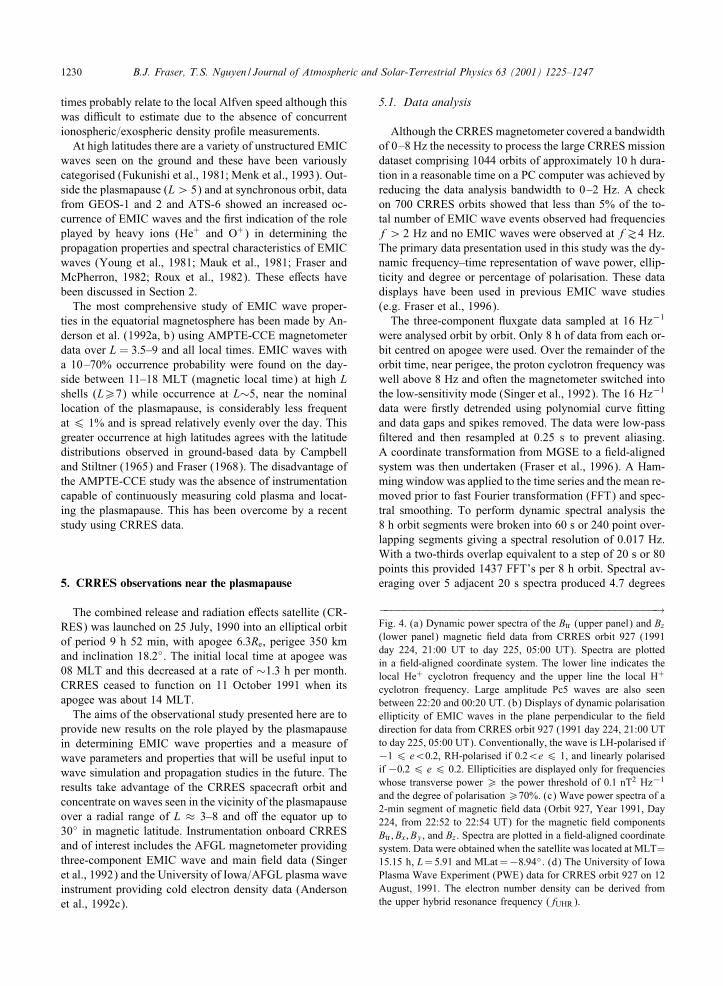
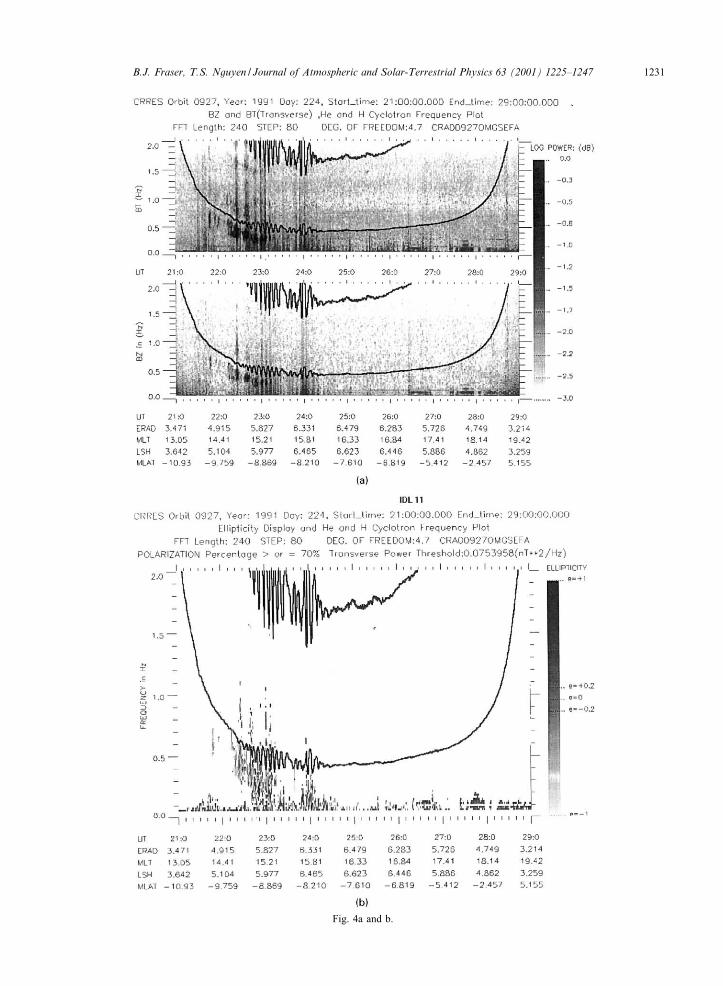
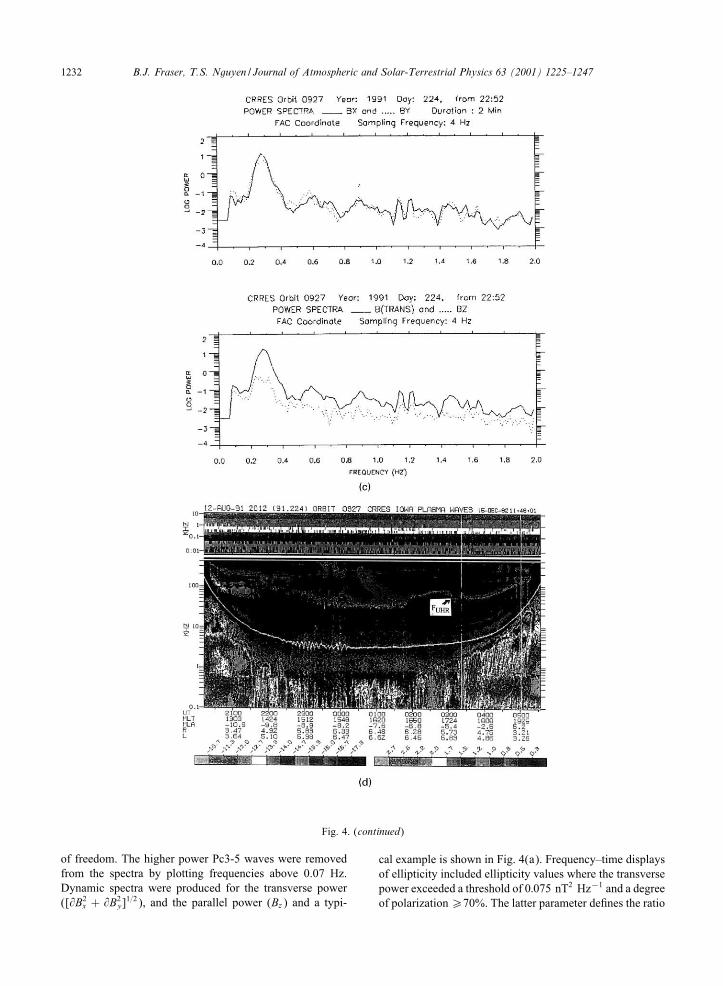
−−−−−−−−−−−−−−−−−−−−−−−−−−−−−−−−−−−−−−−−−→Fig. 4. (a) Dynamic power spectra of the Btr (upper panel) and Bz(lower panel) magnetic =eld data from CRRES orbit 927 (1991day 224, 21:00 UT to day 225, 05:00 UT). Spectra are plottedin a =eld-aligned coordinate system. The lower line indicates thelocal He+ cyclotron frequency and the upper line the local H+
cyclotron frequency. Large amplitude Pc5 waves are also seenbetween 22:20 and 00:20 UT. (b) Displays of dynamic polarisationellipticity of EMIC waves in the plane perpendicular to the =elddirection for data from CRRES orbit 927 (1991 day 224, 21:00 UTto day 225, 05:00 UT). Conventionally, the wave is LH-polarised if−16 e¡0:2, RH-polarised if 0:2¡e 6 1, and linearly polarisedif −0:26 e 6 0:2. Ellipticities are displayed only for frequencieswhose transverse power ¿ the power threshold of 0:1 nT2 Hz−1
and the degree of polarisation¿70%. (c) Wave power spectra of a2-min segment of magnetic =eld data (Orbit 927, Year 1991, Day224, from 22:52 to 22:54 UT) for the magnetic =eld componentsBtr ; Bx; By , and Bz . Spectra are plotted in a =eld-aligned coordinatesystem. Data were obtained when the satellite was located at MLT=15:15 h, L=5:91 and MLat =−8:94◦. (d) The University of IowaPlasma Wave Experiment (PWE) data for CRRES orbit 927 on 12August, 1991. The electron number density can be derived fromthe upper hybrid resonance frequency (fUHR).
B.J. Fraser, T.S. Nguyen / Journal of Atmospheric and Solar-Terrestrial Physics 63 (2001) 1225–1247 1231
Fig. 4a and b.
1232 B.J. Fraser, T.S. Nguyen / Journal of Atmospheric and Solar-Terrestrial Physics 63 (2001) 1225–1247
Fig. 4. (continued)
of freedom. The higher power Pc3-5 waves were removedfrom the spectra by plotting frequencies above 0.07 Hz.Dynamic spectra were produced for the transverse power([@B2
x + @B2y]
1=2), and the parallel power (Bz) and a typi-
cal example is shown in Fig. 4(a). Frequency–time displaysof ellipticity included ellipticity values where the transversepower exceeded a threshold of 0:075 nT2 Hz−1 and a degreeof polarization¿70%. The latter parameter de=nes the ratio

B.J. Fraser, T.S. Nguyen / Journal of Atmospheric and Solar-Terrestrial Physics 63 (2001) 1225–1247 1233
of polarized power as a percentage of total power (Fowleret al., 1967). A greyscale plot is shown in Fig. 4(b). Ellip-ticity is best plotted in colour and examples can be seen onthe web at www.plasma.newcastle.edu.au=spwg=index.htm.The dynamic spectral displays of power and ellipticity foreach orbit were used for preliminary identi=cation of EMICwave event occurrence, wave frequency and ellipticity. Tak-ing into account instrument oL times and data problems atotal of 906 orbits were analysed and 169 of these observedEMIC waves. Power spectra and ellipticity and degree ofpolarisation plots were also produced over 2 min (480 point)intervals over all wave events. These plots provided a quanti-tative measure of power spectral density of Bx; By; Bz; B⊥,and B‖, wave ellipticity and degree of polarisation. Fig. 4(c)shows typical spectral plots.
An important aspect of the current study is the locationof individual EMIC wave events in relation to the plasma-pause. This requires a plasmapause density pro=le which isprovided by the University of Iowa PWE instrument usingelectric =eld measurements in the 0.1–400 kHz band. Anexample is shown in Fig. 4(d), where the plasmapause islocated around 21:50 UT, L = 4:8. The electron density iscalculated from the measured upper hybrid resonance fre-quency using fUHR = (f2
ce + f2pe)
1=2 where fce is the elec-tron cyclotron frequency and fpe the plasma frequency. Iffpe�fce, which is generally the situation, then fUHR ≈ fpeand provides a simple calculation to obtain the electron den-sity using Ne =f2
pe=81 where Ne has the units cm−3 and fpeis in kHz (Gurnett and Inan, 1988).
An extensive statistical study of the morphology ofplasmapause ion density pro=les by Horwitz et al. (1990)using DE-1 light ion retarding mass spectrometer data hasshown a wide variety of plasmapause structures. This iswell illustrated in Fig. 4(d) which is a moderately dis-tributed day. Smooth featureless pro=les were generallyobserved by Horwitz et al. in the midnight through morn-ing sectors while density troughs, multiple plateaus andplasmapauses were often seen in the afternoon and eveningsectors. This same wide variety of plasmapause signatureswere observed in the CRRES PWE data and a distinctplasmapause was identi=ed if a change in Ne of¿ 10 cm−3
occurred over a radial distance of¡0:5Re. DiKculties wereoccasionally experienced where multiple plasmapauses ordensity “bite-outs” were present. In confusing situations aplasmapause was not identi=ed and the data abandoned.In the past EMIC wave events have been seen to occurin association with plasma density gradients and densitybite-outs (Fraser et al., 1994). In order to undertake themost complete statistical study on EMIC wave propertiesusing CRRES data all measurable parameters were enteredinto a database on an event basis. This covered 830 eventtime intervals over 96 h of the analysed 7248 h or 1.33% ofthe total observation time. Parameters documented includedevent start and stop times in UT and MLT, and spectralproperties over 2 min spectral analysis intervals includingtransverse power density (Ptr), ellipticity (e), local geomag-
netic =eld magnitude (B) and spectral peak frequency (f).The local normalised frequency (X =f=fH+) and equatorialnormalised frequency (Xeq =f=fH+eq) were calculated usinga dipole =eld model. Radial distance in Earth radii (R); Lvalue and magnetic latitude (MLat) were also noted. Thecold electron density (Ne) and the parallel resonant energy(ER) corresponding to the spectral peak, and the locationof the plasmapause (Lpp) observed closest to the event ob-servation, were also included. The parallel resonant energyof the particles providing energy to the EMIC waves at theequator was calculated using the relationship from Kenneland Petschek (1966), namely
ER =12mn2R =
B2
2m0N1X 2
(1− X )3:
For a dipole magnetic =eld and a N =N0R−3 plasma densitymodel
EReq =12m0
(Bs
Ns
)(Beq
X 2eq
)(1− Xeq)
3; (1)
where Bs and Ns are the local =eld and plasma density at thesatellite and Beq and Neq the corresponding values projectedback to the equator. This assumes Bs=Ns = Beq=Neq.
6. Individual event examples
The statistical properties of the EMIC wave events de-scribed later in Section 7 show important properties thathave implications with respect to wave generation andpropagation mechanisms. By way of introduction to thewave properties individual event examples are describedbelow. The wave characteristics are ordered by the heavyion (He+;O+) characteristic frequencies. Since the He+
cyclotron frequency fHe+ often falls in the EMIC spectralband, two examples of wave events are included, one withf¡fHe+ and the other with f¿fHe+ .
6.1. 12 August, 1991
The =rst example shown here was observed on orbit927 and is shown in Fig. 4. From Figs. 4(a) and (b) theEMIC waves occurred intermittently from 21:40 to 23:15UT (14:07–15:36 MLT) at locations ranging over L =4:76–6.33 at MLat = −10:07◦ to −8:42◦ (in the southernhemisphere). The EMIC wave structure is well indicatedby the enhanced transverse power seen in the top panel ofFig. 4(a), and exceeds the compressional power shown inthe bottom panel. The waves are quasi-monochromatic withthe greatest power in the frequency range 0.2–0.65 Hz andwith X =0:1–0.2, well below fHe+ but above fO+ . Mappingback to the equator provides Xeq =0:11–0.23. Poynting Guxmeasurements undertaken on this event over the 22:24–22:33 UT interval indicate wave energy is propagating past
1234 B.J. Fraser, T.S. Nguyen / Journal of Atmospheric and Solar-Terrestrial Physics 63 (2001) 1225–1247
CRRES along a =eld-aligned path down into the southernhemisphere (Fraser et al., 1996). Fig. 4(b) shows that thewaves are mainly LH-polarised with ellipticity 0:9¡e¡0.The 2 min power spectra (22:52–22:54 UT) in Fig. 4(c)shows component power (Bx; By; Bz) and transverse power(Btrans) plotted in =eld-aligned coordinates. From Fig. 4(c)a spectral peak at f = 0:28 Hz of 20 nT2 Hz−1 is seen inthe transverse power, which is much greater than the com-pressional power of 0:5 nT2 Hz−1. There are also indica-tions of second and third harmonics at 0.6 and 0.9 Hz.Corresponding values of wave ellipticity and the degreeof polarisation are −0:6 and 90%, respectively. This wasa magnetically disturbed day with Kp = 6− and 5− overthe 21–03 UT interval. Also present over 22:30–00:20 UTare large amplitude long period Pc5 waves with both trans-verse and compressional power. These may be similar tothe waves seen at a similar location by ISEE-1 (Greenstadtet al., 1986). The waves appear to modulate the occur-rence of the EMIC wave packets (Plyasova-Bakounina etal., 1996) and it has been shown by Fraser et al. (1996a)that EMIC wave activity occurs on the falling amplitude ofthe Pc5 wave cycle. Some wave power occurs above fHe+and this may be associated with the modulation eLect ormay be just a consequence of the He+ absorption slot in thewave spectrum.
The upper hybrid resonance frequency in the PWE spec-trogram in Fig. 4(d) shows a broad band over the EMICwave event interval and auroral kilometric radiation (AKR)above 70 kHz is also present. Electron densities deducedover the event interval are estimated in the 15–30 cm−3
range. There is an indication of a plasmapause at 21:50 UT(L = 4:85) where a change of fUHR from 200 to 100 kHz,corresponding to a density change of 350 cm−3, is seen. Theparallel energies of the protons contributing energy to theinstability at the equator were calculated from Eq. (1) in therange 21–55 keV. Therefore, this event is propagating justoutside the plasmapause in the trough.
6.2. 11 August, 1991
The second example, an EMIC wave event with f¿fHe+is shown in Fig. 5. Figs. 5(a) and (b) show quasi-monochromatic waves occurring over 04:50–07:45 UT(14:18–16:70 MLT) at L=6:17–7.49 and MLat =−26:25◦
to −22:78◦. Greatest power is seen in the transverse com-ponents (Fig. 5(a)) over a frequency range of 0.6–1.7 Hz,corresponding to X =0:36–0.45 and Xeq =0:34–0.99. How-ever, there are intervals during which wave frequenciesf¡fHe+ are seen. Polarisation is a mixture of LH and RHover the range −0:7¡e¡0:8 (Fig. 5(b)). The broadbandnature of the spectra are seen in Fig. 5(c) where a peaktransverse power of 3 nT2=Hz−1 occurs at 1.46 Hz over05:44–05:46 UT when CRRES was located at L=7:05 andMLat = −25:4◦. The corresponding wave ellipticity anddegree of polarisation were 0.14 and 73%, respectively.
This section has described two individual events whichalong with events studied by Fraser et al. (1996) char-acterise individual EMIC wave events seen by CRRESand provide the context under which statistical results willbe compiled from the complete CRRES magnetometerdata set.
7. Statistical results
7.1. Wave occurrence
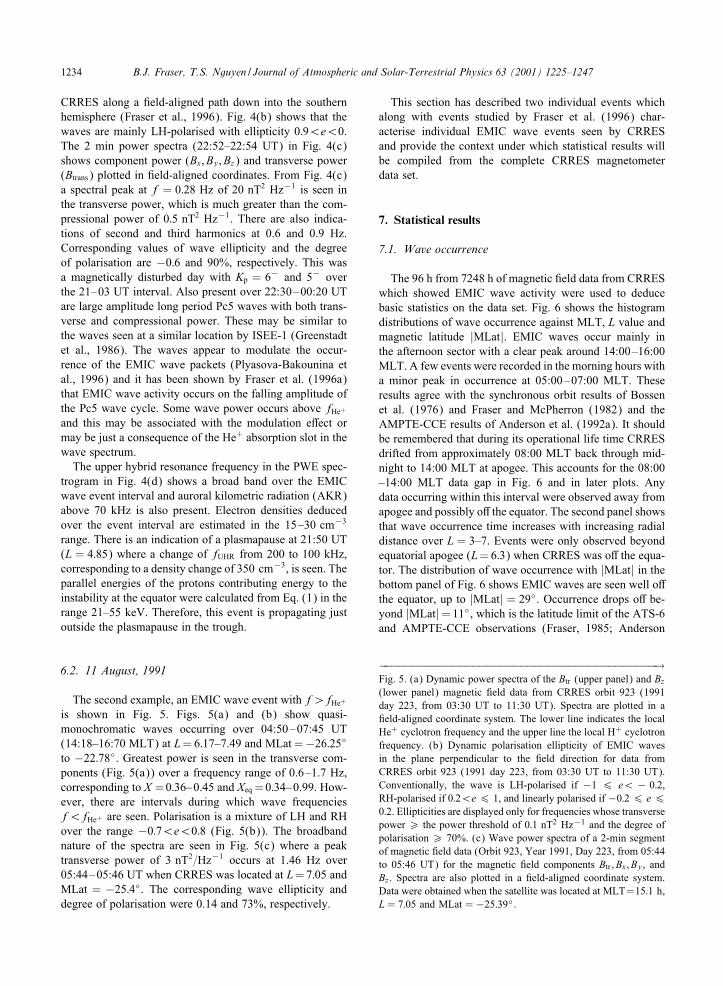
The 96 h from 7248 h of magnetic =eld data from CRRESwhich showed EMIC wave activity were used to deducebasic statistics on the data set. Fig. 6 shows the histogramdistributions of wave occurrence against MLT, L value andmagnetic latitude |MLat|. EMIC waves occur mainly inthe afternoon sector with a clear peak around 14:00–16:00MLT. A few events were recorded in the morning hours witha minor peak in occurrence at 05:00–07:00 MLT. Theseresults agree with the synchronous orbit results of Bossenet al. (1976) and Fraser and McPherron (1982) and theAMPTE-CCE results of Anderson et al. (1992a). It shouldbe remembered that during its operational life time CRRESdrifted from approximately 08:00 MLT back through mid-night to 14:00 MLT at apogee. This accounts for the 08:00–14:00 MLT data gap in Fig. 6 and in later plots. Anydata occurring within this interval were observed away fromapogee and possibly oL the equator. The second panel showsthat wave occurrence time increases with increasing radialdistance over L = 3–7. Events were only observed beyondequatorial apogee (L=6:3) when CRRES was oL the equa-tor. The distribution of wave occurrence with |MLat| in thebottom panel of Fig. 6 shows EMIC waves are seen well oLthe equator, up to |MLat| = 29◦. Occurrence drops oL be-yond |MLat|=11◦, which is the latitude limit of the ATS-6and AMPTE-CCE observations (Fraser, 1985; Anderson
−−−−−−−−−−−−−−−−−−−−−−−−−−−−−−−−−−−−−−−−−→Fig. 5. (a) Dynamic power spectra of the Btr (upper panel) and Bz(lower panel) magnetic =eld data from CRRES orbit 923 (1991day 223, from 03:30 UT to 11:30 UT). Spectra are plotted in a=eld-aligned coordinate system. The lower line indicates the localHe+ cyclotron frequency and the upper line the local H+ cyclotronfrequency. (b) Dynamic polarisation ellipticity of EMIC wavesin the plane perpendicular to the =eld direction for data fromCRRES orbit 923 (1991 day 223, from 03:30 UT to 11:30 UT).Conventionally, the wave is LH-polarised if −1 6 e¡ − 0:2,RH-polarised if 0:2¡e 6 1, and linearly polarised if −0:26 e 60:2. Ellipticities are displayed only for frequencies whose transversepower ¿ the power threshold of 0:1 nT2 Hz−1 and the degree ofpolarisation ¿ 70%. (c) Wave power spectra of a 2-min segmentof magnetic =eld data (Orbit 923, Year 1991, Day 223, from 05:44to 05:46 UT) for the magnetic =eld components Btr ; Bx; By , andBz . Spectra are also plotted in a =eld-aligned coordinate system.Data were obtained when the satellite was located at MLT=15:1 h,L = 7:05 and MLat =−25:39◦.

B.J. Fraser, T.S. Nguyen / Journal of Atmospheric and Solar-Terrestrial Physics 63 (2001) 1225–1247 1235
Fig. 5a and b.

1236 B.J. Fraser, T.S. Nguyen / Journal of Atmospheric and Solar-Terrestrial Physics 63 (2001) 1225–1247
Fig. 5. (Continued)
et al., 1992a). It is important to note that the three plots inFig. 6 show raw occurrence data and have not been nor-malised to the total time CRRES spent in range of MLT, Lvalue and |MLat| bins plotted. They are used here to showthe distribution of data available for the scatter plot statisticsthat follow and, although showing the same trend, shouldnot be compared directly with the normalised results of An-derson et al. (1992a) which show EMIC wave occurrenceincreasing with radial distance out to L=9. The scatter plotin Fig. 7 shows that enhanced occurrence is seen over 13:00–18:00 MLT and L=5–7 and is useful for comparison withlater scatter plots.
7.2. Wave parameters
In the extensive statistical study reported on EMIC waveproperties, Anderson et al. (1992a, b) have documented theproperties of equatorial occurrence and wave properties in-cluding frequency, ellipticity and power over the L = 3:5–9 range, |MLat| = 0–16◦ at all MLT. CRRES results con-=rm the following EMIC wave properties using data over
the 00:00–08:00 and 12:00–00:00 MLT intervals, (i) anarch-shape occurrence distribution which maximises to 1 Hzaround noon; (ii) highest wave occurrence is seen at apogeeat L=6–7 for CRRES compared with L=8–9 for AMPTE.A similar He+ slot is seen in the spectra out to L∼7; (iii)power spectral densities in the range 10−1–102 nT2 Hz−1,with greatest power at L = 5–6. Ellipticity properties over00:00–09:00 MLT are a little diLerent with CRRES show-ing an even distribution of LH, linear and RH polarisationcompared with the mainly linear state at AMPTE.
The results presented here are included in the moredetailed CRRES statistical study undertaken by Nguyen(1997). These studies, take advantage of the availability ofPWE data and the wider latitude range of CRRES and haveprovided new results. They extend the study of Andersonet al. (1992a, b) and relate to the variation in wave parame-ters with |MLat| up to 30◦ oL the equator, wave power, coldplasma density and the role played by the plasmapause.
Fig. 8 shows a scatter plot of locally measured normalisedfrequency (X ) with L value. A distinct slot in the frequencyband around X =0:25 is seen which is the well-known He+
B.J. Fraser, T.S. Nguyen / Journal of Atmospheric and Solar-Terrestrial Physics 63 (2001) 1225–1247 1237
Fig. 6. Upper panel: Histogram of wave occurrence time versus magnetic local time. Middle panel: Histogram of wave occurrence timeversus L value. Lower panel: Histogram of wave occurrence time versus absolute magnetic latitude. Note: No CRRES data are availableover 08:00–14:00 UT unless observed oL the equator.
Fig. 7. Scatter plot of the dependence of wave occurrence on magnetic local time and L value.

1238 B.J. Fraser, T.S. Nguyen / Journal of Atmospheric and Solar-Terrestrial Physics 63 (2001) 1225–1247
Fig. 8. Scatter plot of the locally normalised wave frequency versus L value.
absorption slot (Mauk, 1982). The interesting point here isthe predominance of events with X ¿ 0:25 at L&5:5 andthe absence of these high-frequency emissions at radial dis-tances that may be presumed to be near the plasmapauseand in the plasmasphere. At L&6:5, where CRRES is lo-cated oL the equator, X shows a decrease with L. This is ex-pected for waves generated at the equator and propagatingaway from the equator into higher B-=eld regions (Fraser,1985). The variation in X with magnetic latitude plotted inFig. 9 shows this trend is consistent for all latitudes out tothe limit of CRRES observations at |MLat|=29◦. The trendis removed and a uniform cutoL at X = 0:25 is seen if theequatorial normalised frequency (Xeq) is plotted against lat-itude (not shown), con=rming an equatorial source regionand supporting the Poynting Gux measurements of Fraser etal. (1996). As waves propagate away from the equator, it isexpected that they will become more linearly polarised dueto the increase in wave normal angle until they are eventuallyreGected (Rauch and Roux, 1982; Hu and Fraser, 1992). Inthe scatter plot in Fig. 10 ellipticities are evenly distributedbetween e=0:5 and−1 at latitudes below about 8◦, showinga preference for LH and linear polarisation with some RH.The observation of signi=cant linear events near the equa-tor has also been seen in the AMPTE data (Anderson et al.,1992b) and cannot be explained by the polarisation reversalfrom LH to RH through linear at the cross-over frequencyas suggested by Young et al. (1981). However, ellipticitycan be highly variable over short intervals of time and theaveraging process used to analyse the AMPTE and CRRESdata may result in enhanced occurrence of linear polarisation(Anderson et al., 1996a). There is however a trend towardsdecreasing LH polarisation towards linear over latitudes of10–29◦. This is emphasized by the straight line drawn inFig. 10.
7.3. Plasma density and the plasmapause
An important parameter not previously measured forEMIC waves is the associated cold plasma density. It hasbeen shown that convective growth rate can be enhancedby increasing the cold background plasma density (Corn-wall et al., 1970; Kozyra et al., 1984) although it may alsobe quenched (Gendrin, 1975). It is therefore of interestto investigate the cold plasma conditions under which theCRRES EMIC waves were observed. These results usethe electron density derived from the upper hybrid reso-nance frequency, as described in Section 5. If heavy ions(He+;O+) are present in the ambient plasma then massloading will inGuence the ion density which is generally as-sumed to be due to protons alone. No consideration is takenof heavy ion density contributions in the present study al-though the presence of He and O+ ions has been identi=ed.Fig. 11 shows the local time scatter plot of cold plasmadensities observed in conjunction with EMIC wave events.The dominant afternoon events occurred over a plasma den-sity range from 4 to 300 cm−3, typical of the plasmasphere,the plasmapause bulge or detached plasma regions in thetrough. Densities associated with waves seen in the earlyafternoon are lower (¡10 cm−3) than in the evening (10–400 cm−3). Morning events may occur at lower plasmadensities but the data are sparse. It is seen in Fig. 12 thatwaves with frequencies above fHe+ (X ¿ 0:25) tend tooccur when plasma densities are low (Ne = 2–30 cm−3),whereas the lower-frequency emissions (X¡0:25) are seenwith densities up to 400 cm−3 as noted earlier. There is noobvious relationship between ellipticity and plasma densityother than the fact that events occurring under conditionsof very low plasma density (Ne¡5 cm−3) may be morelinearly polarised than the events seen at higher densities. If

B.J. Fraser, T.S. Nguyen / Journal of Atmospheric and Solar-Terrestrial Physics 63 (2001) 1225–1247 1239
Fig. 9. Scatter plot of the locally normalised wave frequency versus absolute magnetic latitude.
Fig. 10. Scatter plot of the wave polarisation ellipticity versus absolute magnetic latitude.
the instability growth is dependent on cold plasma densityas theory suggests then a relationship with transverse powermay be expected. However, no signi=cant relationship wasfound.
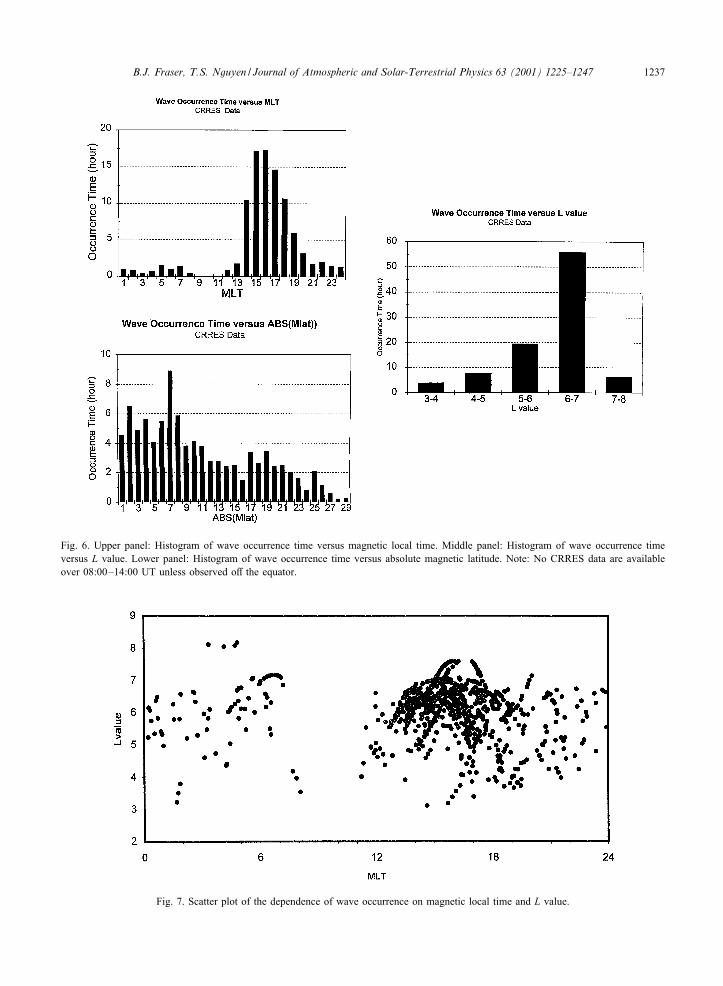
One of the most important outstanding questions in EMICwave studies is the relationship between the location of thesource region and that of the plasmapause. Fig. 13 showsa scatter plot of the normalised wave frequency againstthe diLerence (VL) between the equatorial radial distanceto the =eld line on which an event is located (Le) andthe position of the plasmapause on the same inbound oroutbound CRRES pass (Lpp). For VL¡0 waves are lo-cated in the plasmasphere, and VL¿ 0 outside the plasma-pause in the plasmatrough. It can be seen that waves withX¡0:25 occur both inside and outside the plasmasphere
over the range−1¡VL¡4 but mainly outside, whereas theX ¿ 0:25 waves occur only outside. The spread of X¡0:25waves over VL is reasonably uniform with perhaps a minorconcentration at VL= 2–3 and 0, the plasmapause. In fact,the wave events found in the region adjacent to and includingthe plasmapause (−1¡VL¡1), account for less than halfthe total data segments, indicating that the plasmapause isnot necessarily the preferred region for EMIC wave genera-tion and propagation. It is also of interest to see if there is anyenhancement of wave power in the vicinity of the plasma-pause. From Fig. 14 there is a suggestion that the high-est power may be seen near the plasmapause (|VL|¡0:5).Here the plotted points on the solid line represent the me-dian power in VL = 1 bins centred on integer values of(Le–Lpp) and the error bars indicate the power range of 50%

1240 B.J. Fraser, T.S. Nguyen / Journal of Atmospheric and Solar-Terrestrial Physics 63 (2001) 1225–1247
Fig. 11. Scatter plot of the cold plasma density versus magnetic local time. Note: No CRRES data are available over 08:00–14:00 UTunless observed oL the equator.
Fig. 12. Scatter plot of the locally normalised wave frequency versus cold plasma density.
of the data points in each bin. Outside the plasmapause,power may again increase slightly (VL∼2). However, 50%of wave powers observed are in the 0:2–3 nT2 Hz−1 rangeand reasonably uniform over −1¡VL¡4.
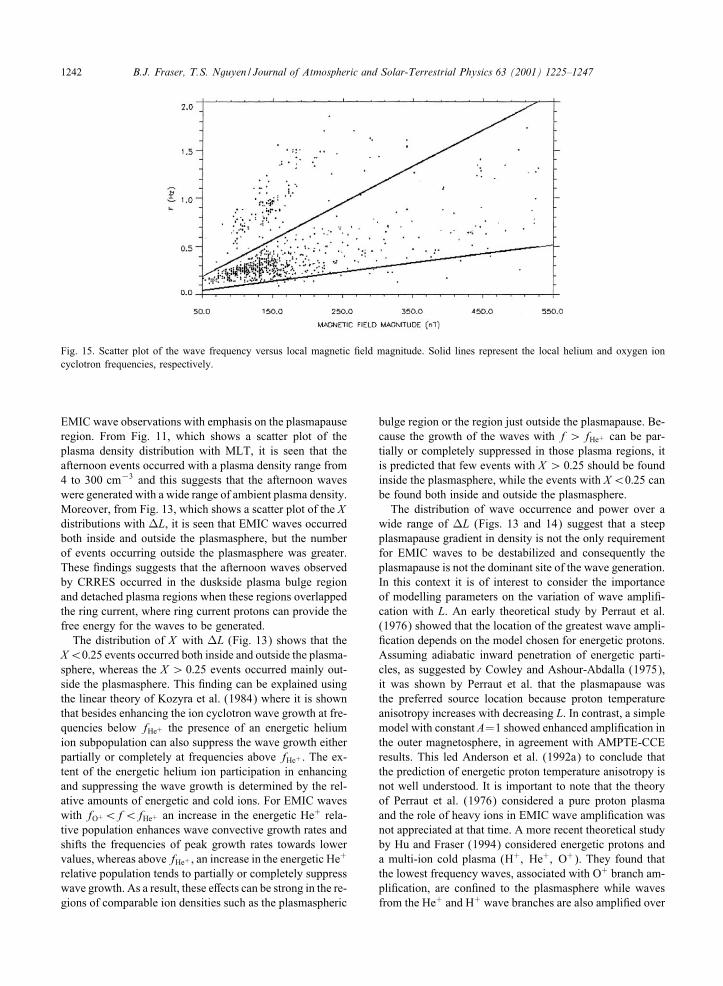
Another parameter of importance in EMIC wave occur-rence is the magnitude of the background ambient geo-magnetic =eld under which waves are generated and=orpropagate. A scatter plot of the wave frequency against thetotal magnetic =eld magnitude observed at CRRES is shownin Fig. 15 where the upper and lower solid lines repre-sent the fHe+ and fO+ cyclotron frequencies, respectively.The fHe+ slot is apparent and very few waves appear tobe generated below fO+ , although this may be masked bythe low-frequency data analysis limit of 0.07 Hz. Waves at
f¿fHe+ occur in lower =elds and this is consistent withthe results in Fig. 13 which show these frequencies are mostprevalent outside the plasmapause.
8. Discussion
The plasmapause is the plasma density boundary wherethe co-rotating plasmasphere interacts with the stationaryplasma trough plasma region (Nishida, 1966). The fact thatthe plasmapause contains a bulge on the duskside sectorhas long been known experimentally (e.g. Carpenter, 1963;Carpenter and Anderson, 1992) and the outer region of theplasmasphere is sometimes irregular and decoupled from
B.J. Fraser, T.S. Nguyen / Journal of Atmospheric and Solar-Terrestrial Physics 63 (2001) 1225–1247 1241
Fig. 13. Scatter plot of the locally normalised wave frequency, X , versus VL= Le − Lpp where Le and Lpp are the L values correspondingto the position of the wave occurrence and that of the plasmapause, respectively. VL¡0 indicates that waves occur in the plasmasphereand VL¿ 0 outside the plasmasphere, in the plasma trough.
Fig. 14. Scatter plot of the wave transverse spectral power densityversus VL = Le − Lpp where Le and Lpp are the L values corre-sponding to the position of the wave occurrence and that of theplasmapause, respectively. The data points linked by the solid linerepresent median power binned with VL=1 and the error bars de-note the 50% range of power density. The median power densityvalues are included in the bottom of the plot.
the inner plasmasphere in this local time sector, formingdetached regions of enhanced plasma density (Chappell,1974).
Although comprehensive ground-based observations ofPc1-2 (0.1–5 Hz) geomagnetic pulsations resulting fromEMIC waves propagating along the =eld-aligned paths in themagnetosphere and down through the ionosphere have beenundertaken over the last 30 years, it has generally proven im-possible to unambiguously identify the precise L shell of thepropagation path which identi=es the source region. The ex-ception was the use of triangulation direction of arrival and
linear polarisation techniques in combination as described inSection 2. These placed the source of discrete =ne-structuredPc1 waves packets of the type which bounce between hemi-sphere either on or just inside the plasmapause as seen inFig. 2 (Fraser, 1985; Webster and Fraser, 1985). The weak-ness in this and other studies such as the statistical analysisof Roth and Orr (1975) is that they used plasmapause loca-tions based on empirical formulae relating the dynamics ofthe plasmasphere to geomagnetic activity determined fromVLF whistler and satellite data (Carpenter and Smith, 1964;Carpenter and Anderson, 1992). These formulae related thedynamics of the plasmapause to the immediate past historyof geomagnetic activity using a
∑Kp index. The use of
empirical formulae to forecast the location of the plasma-pause in conjunction with individual EMIC wave eventsmay be questioned when taking into consideration plasma-sphere re=lling and the day-to-day and local time variabil-ity of the plasmapause morphology and location (Horwitzet al., 1990; Singh and Horwitz, 1992). Most early satel-lite missions did not carry instrumentation to measure thecold=cool magnetospheric plasma density and it was not un-til light ion measurements by spectrometers on OGO-5 andDE-1 (Chappell et al., 1970; Horwitz et al., 1984), indirectelectron density measurements through the upper hybrid res-onance by ISEE-1 (Carpenter and Anderson, 1992) and therelaxation sounder on GEOS-2 (Higel and Wu, 1984), thatreliable in situ measurements of plasma densities relatingto the plasmapause became available. CRRES was the =rstlow-latitude spacecraft orbiting the middle magnetospherewhich took advantage of the comprehensive plasma densitymeasurements of the plasmasphere=plasmapause region inassociation with EMIC wave measurements (Fraser et al.,1994).
Results from the CRRES mission have concentrated onmeasuring all possible parameters which are associated with
1242 B.J. Fraser, T.S. Nguyen / Journal of Atmospheric and Solar-Terrestrial Physics 63 (2001) 1225–1247
Fig. 15. Scatter plot of the wave frequency versus local magnetic =eld magnitude. Solid lines represent the local helium and oxygen ioncyclotron frequencies, respectively.
EMIC wave observations with emphasis on the plasmapauseregion. From Fig. 11, which shows a scatter plot of theplasma density distribution with MLT, it is seen that theafternoon events occurred with a plasma density range from4 to 300 cm−3 and this suggests that the afternoon waveswere generated with a wide range of ambient plasma density.Moreover, from Fig. 13, which shows a scatter plot of the Xdistributions with VL, it is seen that EMIC waves occurredboth inside and outside the plasmasphere, but the numberof events occurring outside the plasmasphere was greater.These =ndings suggests that the afternoon waves observedby CRRES occurred in the duskside plasma bulge regionand detached plasma regions when these regions overlappedthe ring current, where ring current protons can provide thefree energy for the waves to be generated.
The distribution of X with VL (Fig. 13) shows that theX¡0:25 events occurred both inside and outside the plasma-sphere, whereas the X ¿ 0:25 events occurred mainly out-side the plasmasphere. This =nding can be explained usingthe linear theory of Kozyra et al. (1984) where it is shownthat besides enhancing the ion cyclotron wave growth at fre-quencies below fHe+ the presence of an energetic heliumion subpopulation can also suppress the wave growth eitherpartially or completely at frequencies above fHe+ . The ex-tent of the energetic helium ion participation in enhancingand suppressing the wave growth is determined by the rel-ative amounts of energetic and cold ions. For EMIC waveswith fO+¡f¡fHe+ an increase in the energetic He+ rela-tive population enhances wave convective growth rates andshifts the frequencies of peak growth rates towards lowervalues, whereas abovefHe+ , an increase in the energetic He
+
relative population tends to partially or completely suppresswave growth. As a result, these eLects can be strong in the re-gions of comparable ion densities such as the plasmaspheric
bulge region or the region just outside the plasmapause. Be-cause the growth of the waves with f¿fHe+ can be par-tially or completely suppressed in those plasma regions, itis predicted that few events with X ¿ 0:25 should be foundinside the plasmasphere, while the events with X¡0:25 canbe found both inside and outside the plasmasphere.
The distribution of wave occurrence and power over awide range of VL (Figs. 13 and 14) suggest that a steepplasmapause gradient in density is not the only requirementfor EMIC waves to be destabilized and consequently theplasmapause is not the dominant site of the wave generation.In this context it is of interest to consider the importanceof modelling parameters on the variation of wave ampli=-cation with L. An early theoretical study by Perraut et al.(1976) showed that the location of the greatest wave ampli-=cation depends on the model chosen for energetic protons.Assuming adiabatic inward penetration of energetic parti-cles, as suggested by Cowley and Ashour-Abdalla (1975),it was shown by Perraut et al. that the plasmapause wasthe preferred source location because proton temperatureanisotropy increases with decreasing L. In contrast, a simplemodel with constant A=1 showed enhanced ampli=cation inthe outer magnetosphere, in agreement with AMPTE-CCEresults. This led Anderson et al. (1992a) to conclude thatthe prediction of energetic proton temperature anisotropy isnot well understood. It is important to note that the theoryof Perraut et al. (1976) considered a pure proton plasmaand the role of heavy ions in EMIC wave ampli=cation wasnot appreciated at that time. A more recent theoretical studyby Hu and Fraser (1994) considered energetic protons anda multi-ion cold plasma (H+; He+; O+). They found thatthe lowest frequency waves, associated with O+ branch am-pli=cation, are con=ned to the plasmasphere while wavesfrom the He+ and H+ wave branches are also ampli=ed over

B.J. Fraser, T.S. Nguyen / Journal of Atmospheric and Solar-Terrestrial Physics 63 (2001) 1225–1247 1243
Fig. 16. Scatter plot of the CRRES EMIC wave event local mag-netic =eld magnitude against plasma density, which is overlaid onthe contour plot of the maximum convective growth rate for a pureproton plasma in the N–B plane generated by Anderson et al. [Fig.13, 1992a].
the outer magnetosphere. The Cowley and Ashour-Abdalla(1975) adiabatic energetic particle model was used and theresults showed agreement with the AMPTE-CCE and cur-rent CRRES results. These results support the existence ofa proton temperature anisotropy in the outer magnetosphereand illustrate the importance of the inclusion of heavy ioneLects in wave growth computations.
Kozyra et al. (1984) also showed that contrary to theresults of previous theoretical studies of the wave growthrate in the plasmapause region, wave onset is not correlatedwith the plasmapause density gradient. The eLects of heavyions on the propagation characteristics of the waves allowedthe wave growth to occur with reasonable rates over L=3:0–6.6. They argued that the presence of heavy ions reducesthe phase velocity allowing the waves to resonate with thering current ions in the vicinity of the heavy ion cyclotronfrequencies even in the regions of very low cold plasmadensity outside the plasmasphere. In support of this ideaFraser et al. (1992) using ISEE data showed that EMICwaves occurred in association with a minimum in the Alfvenvelocity.
According to linear theory, favourable regions for EMICwave generation are not determined by the plasma densityN alone, but by the combined inGuences of N and the am-bient magnetic =eld magnitude. In fact, EMIC wave gen-eration locations are determined by the cold plasma den-sity and magnetic =eld magnitude pro=les which give max-imum wave convective growth rates, as shown for examplein Fig. 16 for a pure proton plasma (Anderson et al., 1992a).
Tracking the model plasma density pro=les and comparingwith the maximum convective growth rate contours showthat growth maximises with radial distance and minimises atthe steep plasmapause gradient. This provides two regionsof maximum growth, one inside the plasmapause and oneoutside. This is similar to the results obtained by Gendrin(1975). A new result included in Fig. 16 is the scatter plotof the local magnetic =eld magnitude versus plasma density,which is overlaid on the contour plot of the maximum con-vective growth rate for the proton plasma in the N–B plane.Although the radial plasma density pro=les were arbitrarilychosen by Anderson et al. (1992a) with a plasmapause nearL=5 it is seen that the CRRES data show a good =t. For themain body of data convective growth rates (in log10 scale)were near −1:0 but range over 0 to −2:0 for high N = Nc
(cold plasma density) and −1:0 to −5:0 for low Nc. Therewere no waves observed where the growth rate was below−7:0. Thus, the data support the absence of waves underhigh B =elds at low densities as indicated by the theory.
The scatter plot distribution of the wave transverse powerwith VL (Fig. 14) shows that the upper limit of Ptr maxi-mizes at the plasmapause and minimizes at VL= 1–2. Thedata points on the line plot in Fig. 14 are the median val-ues of Ptr in VL = 1 bins on a log scale. The maximum ofPtr = 0:8 nT2 Hz−1 is seen just on the plasmapause (withVL = ±0:5) with another maximum of 0:7 nT2 Hz−1 out-side at VL=2. Although the 50% deviations are large, these=ndings are consistent with the previously discussed the-ory. More recently Horne and Thorne (1993) showed thatthe plasma density gradient at the plasmapause enables thewaves to be guided and grow during several equatorial cross-ings. Consequently the net path-integrated gain, calculatedusing ray tracing methods, is large at the plasmapause, whilejust outside the plasmapause and in the absence of guidingwaves grow only during a single equatorial crossing and thegain is therefore smaller.
In brief, theory suggests that the role of the plasmapausewith a steep density gradient is to provide special conditionswhich cause a local enhancement in the path-integrated wavegain (e.g. Horne and Thorne, 1993), but not wave onset (e.g.Kozyra et al., 1984). This argument may explain the =ndingin the current study that the waves seen in the region of theplasmapause appeared to have marginally higher power thanwaves seen in the other regions, but that the plamapause wasnot the dominant site of EMIC wave generation.
The plasmapause may also provide a region of low growthwith potential EMIC wave sources just inside and outsidea steep gradient (Gendrin, 1975; Anderson et al., 1992a).However, AMPTE-CCE and CRRES data show wave oc-currence over a wide range of L and primarily near the duskplasmapause bulge region where well-de=ned steep plasma-pause gradients are not always seen (Carpenter and Ander-son, 1992). It may therefore be necessary to look at thesmaller plasma density irregularities such as small gradi-ents, ledges and bite-outs or cavities in order to explain thewide distribution of EMIC waves with L. An enhancement
1244 B.J. Fraser, T.S. Nguyen / Journal of Atmospheric and Solar-Terrestrial Physics 63 (2001) 1225–1247
of EMIC wave power associated with a plasma density cav-ity has been observed in CRRES data (Fraser et al., 1994)but more extensive studies are needed.
A simple classi=cation of EMIC waves observed onthe ground identify two types, structured and unstructured(Hayashi et al., 1981). In space very few structured emis-sions have been observed, and these are generally nearthe plasmapause (L = 3–5) (Erlandson et al., 1992, 1996)whereas the more prevalent unstructured emissions occurat larger radial distances (Anderson et al., 1996b). In futurework it will be important to associate the EMIC wavesseen in space with the understood wave types seen on theground, such as those de=ned at middle and high latitudesby Fukunishi et al. (1981). This will help relate wave typesto wave packet structure and contribute to identifying theinterhemisphere bounce mechanism which has recentlybeen questioned (Erlandson et al., 1992; Fraser et al., 1996;Mursula et al., 1997; Rasinkangas and Mursula, 1998).
9. Conclusions
The purpose of this study has been two-fold, =rstly to re-view the various techniques used in the past to locate thesource region of EMIC waves seen on the ground as Pc1-2ULF waves, and secondly to present results of a recentCRRES analysis of EMIC waves observed in the equatorialmiddle magnetosphere. The CRRES study provided infor-mation on wave and plasma parameters which can be usedin future theoretical modelling, and showed the =rst directexperimental evidence on the association of source regionsto the plasmapause.Particular results include:
1. EMIC waves occurred mainly in the afternoon, peakingaround 14–16MLT. There were a few events occurring inthe morning sector. CRRES did not cover the 09–11MLTinterval. The occurrence data have not been normalized.
2. Wave occurrence increases with L, a result consistent withthe statistical studies of Anderson et al. (1992a).
3. In the equatorial region |MLat| = 0–12◦ waves weremainly LH and linearly polarised. Over |MLat|=12–29◦
linear polarisation dominated. This is consistent withequatorial proton cyclotron instability generation andpropagation away from the equator with increasing wavenormal angle.
4. The downward frequency shift of X with |MLat| and theindependence of Xeq with |MLat| up to 30◦ supports anequatorial source.
5. Afternoon wave events were seen in a background plasmadensity of 4–300 cm−3. These densities suggest an asso-ciation with the plasmapause bulge and possibly detachedplasma regions.
6. Waves seen above the He+ cyclotron frequency(X ¿ 0:25) occurred outside the plasmapause in lowplasma density (2–30 cm−3).
7. Waves were seen both inside and outside the plasmapausewith a slight enhancement in wave power at the plasma-pause. This suggests that a steep gradient and an orderof magnitude or more drop in plasma density may not bethe only requirement to destabilise EMIC waves. Conse-quently the plasmapause is not the preferred site for wavegeneration and propagation.
Acknowledgements
This research was supported by grants from the AustralianResearch Council and the University of Newcastle. Partialsupport for BJF was provided by the Cooperative ResearchCentre for Satellite Systems with funding provided fromthe Commonwealth of Australia through the CRC program.TSN was supported by an AIDAB scholarship provided bythe Commonwealth of Australia. We thank H.J. Singer, W.J.Hughes, J.R. Wygant and R.R. Anderson for helpful discus-sions and providing CRRES data, and P. Ponomarenko andP. Manusiu for help with data analysis.
References
Althouse, E.L., Davis, J.R., 1978. Five-station observations of Pc1micropulsation propagation. Journal of Geophysical Research83, 132.
Anderson, B.J., Denton, R.E., Fuselier, S.A., 1996a. Ondetermining polarization characteristics of ion-cyclotron wavemagnetic =eld Guctuations. Journal of Geophysical Research101, 13,195.
Anderson, B.J., Erlandson, R.E., Engebretson, M.J., Alford, J.,Arnoldy, R.L., 1996b. Source region of 0.2 to 1.0 Hz geo-magnetic pulsation bursts. Geophysical Research Letters 23, 769.
Anderson, B.J., Erlandson, R.E., Zanetti, L.J., 1992a. Astatistical study of Pc1-2 magnetic pulsations in the equatorialmagnetosphere 1. Equatorial occurrence distributions. Journal ofGeophysical Research 97, 3075.
Anderson, B.J., Erlandson, R.E., Zanetti, L.J., 1992b. Astatistical study of Pc1-2 magnetic pulsations in the equatorialmagnetosphere 2. Wave properties. Journal of GeophysicalResearch 97, 3089.
Anderson, R.R., Gurnett, D.A., Odem, D.L., 1992c. CRRES plasmawave experiment. Journal of Spacecraft and Rockets 29, 570.
Anderson, B.J., Hamilton, D.C., 1993. Electromagnetic ioncyclotron waves stimulated by modest magnetosphericcompressions. Journal of Geophysical Research 98, 11,369.
Arnoldy, R.L., Cahill Jr., L.J., Engebretson, M.J., Lanzerotti, L.J.,Wolfe, A., 1988. Review of hydromagnetic wave studies in theAntarctic. Reviews of Geophysics 26, 181.
Bolshakova, O.V., Troitskaya, V.A., Ivanov, K.G., 1980. Highlatitude Pc1-2 geomagnetic pulsations and their connectionwith the location of dayside polar cusp. Planetary SpaceScience 28, 1.
Bossen, M., McPherron, R.L., Russell, C.T., 1976. A statisticalstudy of Pc1 magnetic pulsations at synchronous orbit. Journalof Geophysical Research 81, 6083.

B.J. Fraser, T.S. Nguyen / Journal of Atmospheric and Solar-Terrestrial Physics 63 (2001) 1225–1247 1245
Campbell, W.H., Stiltner, E.C., 1965. Some characteristics ofgeomagnetic pulsations at frequencies near 1 c=s. Radio Science69D, 1117.
Campbell, W.H., Thornberry, T.C., 1972. Propagation of Pc1hydromagnetic waves across North America. Journal ofGeophysical Research 77, 1941.
Carpenter, D.L., 1963. Whistler evidence of a “knee” inthe magnetospheric ionisation density pro=le. Journal ofGeophysical Research 68, 1675.
Carpenter, D.L., Anderson, R.R., 1992. An ISEE 1 whistler modelof equatorial electron density in the magnetosphere. Journal ofGeophysical Research 97, 1097.
Carpenter, D.L., Smith, R.L., 1964. Whistler measurements ofelectron density in the magnetosphere. Reviews of Geophysics2, 415.
Chappell, C.R., 1974. Detached plasma regions in themagnetosphere. Journal of Geophysical Research 79, 1861.
Chappell, C.R., Harris, K.K., Sharp, G.W., 1970. A study of theinGuence of magnetic activity on the location of the plasmapauseas measured by OGO 5. Journal of Geophysical Research75, 50.
Cornwall, J.M., 1965. Cyclotron instabilities and electromagneticemission in the ultra low frequency and very low frequencyranges. Journal of Geophysical Research 70, 61.
Cornwall, J.M., Coroniti, F.V., Thorne, R.M., 1970. Turbulent lossof ring current protons. Journal of Geophysical Research 75,4699.
Cowley, S.W.H., Ashour-Abdalla, M., 1975. Adiabatic plasmaconvection in a dipole =eld: variation of bulk plasma parameterswith L. Planetary Space Science 23, 1527.
Criswell, D.R., 1969. Pc1 micropulsation activity andmagnetospheric ampli=cation of 0.2–5.0 Hz hydromagneticwaves. Journal of Geophysical Research 74, 205.
Dowden, R.L., 1965. “Micropulsation mode” propagation in themagnetosphere. Planetary Space Science 13, 761.
Dowden, R.L., 1966. Micropulsation nose whistlers. PlanetarySpace Science 14, 1273.
Erlandson, R.E., Anderson, B.J., Zanetti, L.J., 1992. Vikingmagnetic and electric =eld observations of periodic Pc1 waves:pearl pulsations. Journal of Geophysical Research 97, 14,823.
Erlandson, R.E., Mursula, K., Bosinger, T., 1996. Simultaneousground-satellite observations of structured Pc1 pulsations.Journal of Geophysical Research 101, 27,149.
Erlandson, R.E., Zanetti, L.J., Potemra, T.A., Block, L.P.,Holmgren, G., 1990. Viking magnetic and electric =eldobservations of Pc1 waves at high latitudes. Journal ofGeophysical Research 95, 5941.
Fowler, R.A., Kotick, B.J., Elliot, R.D., 1967. Polarisation analysisof natural and arti=cially induced geomagnetic pulsations.Journal of Geophysical Research 72, 2871.
Fraser, B.J., 1968. Temporal variations in Pc1 geomagneticmicropulsations. Planetary Space Science 16, 111.
Fraser, B.J., 1972. Propagation of micropulsation noise emissionsin the magnetosphere. Planetary Space Science 20, 1883.
Fraser, B.J., 1975. Ionospheric duct propagation and Pc1 pulsationsources. Journal of Geophysical Research 80, 2790.
Fraser, B.J., 1979. The use of multistation networks in geomagneticpulsation studies. Annals of Telecommunications 35, 220.
Fraser, B.J., 1982. Pc1-2 observations of heavy ion eLects bysynchronous satellite ATS-6. Planetary Space Science 30, 1229.
Fraser, B.J., 1985. Observations of ion cyclotron waves nearsynchronous orbit and on the ground. Space Science Reviews42, 357.
Fraser, B.J., Hu, Y.D., Singer, H.J., Hughes, W.J., Hardy, D.A.,Anderson, R.R., 1996a. Pc5 Hydromagnetic wave modulationof Pc1 ion cyclotron waves. EOS 77 (46), F600.
Fraser, B.J., Kemp, W.J., Webster, D.J., 1984. Pc1 pulsation sourceregions and their relationship to the plasmapause. Proceedings ofConference on Achievements of the IMS, ESA-SP217, p. 609.
Fraser, B.J., Kemp, W.J., Webster, D.J., 1989. Ground-satellitestudy of a Pc1 ion cyclotron wave event. Journal of GeophysicalResearch 94, 11,855.
Fraser, B.J., McPherron, R.L., 1982. Pc1-2 magnetic pulsationspectra and heavy ion eLects at synchronous orbit: ATS 6 results.Journal of Geophysical Research 87, 4560.
Fraser, B.J., Samson, J.C., McPherron, R.L., Russell, C.T., 1992.Electromagnetic ion cyclotron waves observed near the oxygencyclotron frequency by ISEE-1 and 2. Journal of GeophysicalResearch 97, 3063.
Fraser, B.J., Singer, H.J., Hughes, W.J., Anderson, R.R., Wygant,J.R., 1994. Electromagnetic ion cyclotron harmonic waves nearthe plasmapause. Advances in Space Research 5, 255.
Fraser, B.J., Singer, H.J., Hughes, W.J., Wygant, J.R., Anderson,R.R., Hu, Y.D., 1996. CRRES Poynting vector observationsof electromagnetic ion-cyclotron waves near the plasmapause.Journal of Geophysical Research 101, 15,331.
Fujita, S., 1987. Duct propagation of a short period hydromagneticwave based on the international reference ionosphere model.Planetary Space Science 35, 91.
Fujita, S., Tamao, T., 1988a. Duct propagation of hydromagneticwaves in the upper ionosphere. 1. Electromagnetic =elddistributions in high latitudes associated with localized incidenceof a shear Alfven wave. Journal of Geophysical Research 93,14,665.
Fujita, S., Tamao, T., 1988b. Duct propagation of hydromagneticwaves in the upper ionosphere. 2. Dispersion characteristics andloss mechanisms. Journal of Geophysical Research 93, 14,674.
Fukunishi, H., Toya, T., Koike, K., Kuwashima, M., Kawamura,M., 1981. Classi=cation of hydromagnetic emissions basedon frequency-time spectra. Journal of Geophysical Research86, 9029.
Gary, S.P., 1993. Theory of Space Plasma Microinstabilities.Cambridge University Press, Cambridge, UK, 181.
Gendrin, R., 1975. Is the plasmapause a preferential region forproton precipitation?. Annals of Geophysics 31, 127.
Gendrin, R., Ashour-Abdalla, M., Omura, Y., Quest, K., 1984.Linear analysis of ion cyclotron interaction in a multicomponentplasma. Journal of Geophysical Research 89, 9119.
Gendrin, R., Lacoury, S., Roux, A., Solomon, J., Fegin, F.Z.,Gokhberg, M.V., Troitskaya, V.A., 1971. Wave propagation inthe amplifying medium and its application to the dispersioncharacteristics and to the generation mechanism of Pc1 events.Planetary Space Science 19, 165.
Gendrin, R., Perraut, S., Fargetton, H., Glangeaud, F., Lacoume,J., 1978. ULF waves: conjugated ground-satellite relationships.Space Science Reviews 22, 433.
Glangeaud, F., Lacoume, J.-L., Fargetton, H., 1980. Cross spectralanalysis of Pc1 emissions recorded at diLerent stations. Journalof Geophysical Research 85, 4115.
Greenstadt, E.W., McPherron, R.L., Anderson, R.R., Scarf,F.L., 1986. A storm time Pc5 event observed in the outer

1246 B.J. Fraser, T.S. Nguyen / Journal of Atmospheric and Solar-Terrestrial Physics 63 (2001) 1225–1247
magnetosphere by ISEE 1 and 2: Wave properties. Journal ofGeophysical Research 91, 13,398.
Grei=nger, C., Grei=nger, P., 1968. Theory of hydromagneticpropagation in the ionospheric waveguide. Journal ofGeophysical Research 73, 7473.
Grei=nger, C., Grei=nger, P., 1973. Waveguide propagation ofmicropulsations out of the plane of the geomagnetic meridian.Journal of Geophysical Research 78, 4611.
Gurnett, D.A., Inan, U.S., 1988. Plasma observations withDynamics Explorer 1 spacecraft. Reviews of Geophysics 26,285.
Hayashi, K., Kokubun, S., Oguti, T., Tsuruda, K., Machida, S.,Kitamura, T., Saka, O., Watanabe, T., 1981. The extent of Pc1source region in high latitudes. Canadian Journal of Physics 59,1097.
Hayashi, K., Yamamoto, T., Kokubun, S., Oguti, T., Ogawa, T.,et al., 1989. Multistation observation of IPDP micropulsations— two dimensional distribution and evolution of the sourceregions. Journal of Geomagnetism and Geoelectricity 40, 583.
Higel, B., Wu, L., 1984. Electron density and plasmapausecharacteristics at 6.6Re: a statistical study of the GEOS-2relaxation sounder data. Journal of Geophysical Research 89,1583.
Horne, R.B., Thorne, R.M., 1993. On the preferred source locationfor the convective ampli=cation of ion cyclotron waves. Journalof Geophysical Research 98, 9233.
Horwitz, J.L., Comfort, R.H., Chappell, C.R., 1984. Thermal ioncomposition measurements of the formation of the new outerplasmasphere and double plasmapause during storm recoveryphase. Geophysical Research Letters 11, 701.
Horwitz, J.L., Comfort, R.H., Chappell, C.R., 1990. A statisticalcharacterization of plasmasphere density structure and boundarylocations. Journal of Geophysical Research 95, 7937.
Hu, Y.D., Fraser, B.J., 1992. Bounce period of electromagnetic ioncyclotron waves in a two ion magnetosphere. Australian Journalof Physics 45, 695.
Hu, Y.D., Fraser, B.J., 1994. Electromagnetic ion cyclotron waveampli=cation and source regions in the magnetosphere. Journalof Geophysical Research 99, 263.
Hu, Y.D., Fraser, B.J., Olson, J.V., 1990. Ampli=cation ofelectromagnetic ion cyclotron waves along a wave path in theEarth’s multicomponent magnetosphere. Geophysical ResearchLetters 17, 1053.
Inhester, B., Wedeken, U., Korth, A., Perraut, S., Stukholm,M., 1984. Ground-satellite coordinated study of the April 5,1979 events: observation of O+ cyclotron waves. Journal ofGeophysical Research 55, 134.
Ishida, J., Kokubun, S., McPherron, R.L., 1987. Substorm eLects onspectral structures of Pc1-2 waves at synchronous orbit. Journalof Geophysical Research 92, 143.
Jacobs, J.A., Watanabe, T., 1964. Micropulsation whistlers. Journalof Atmospheric and Terrestrial Physics 26, 825.
Johnson, J.R., Cheng, C.Z., 1999. Can ion cyclotron wavespropagate to the ground?. Geophysical Research Letters 26, 671.
Kangas, J., Aiko, A., Olson, J.V., 1986. Multistation correlationof ULF pulsation spectra associated with sudden impulses.Planetary Space Science 34, 543.
Kawamura, M., Kuwashima, M., Toya, T., 1982. Comparativestudy of magnetic Pc1 pulsations observed at low and highlatitudes: Source region and generation mechanism of periodichydromagnetic emissions. Memories of the National Institute ofPolar Research Special Issue Japan 22, 3.
Kemp, W., 1984. Multi station observations of Pc1 pulsations atmiddle and low latitudes. Ph.D. Thesis, University of Newcastle,NSW.
Kennel, C.F., Petschek, H.C., 1966. Limit on stably trapped particleGuxes. Journal of Geophysical Research 71, 1.
Kozyra, J.U., Cravens, T.E., Nagy, A.F., Fontheim, E.G.,1984. ELects of energetic heavy ions on electromagnetic ioncyclotron wave generation in the plasmapause region. Journalof Geophysical Research 89, 2217.
LaBelle, J., Treumann, R.A., 1992. Poynting vector measurementsof electromagnetic ion cyclotron waves in the plasmasphere.Journal of Geophysical Research 97, 13,789.
Lewis Jr., P.B., Arnoldy, R.L., Cahill Jr., L.J., 1977. The relationof Pc1 micropulsations measured at Siple, Antarctica, to theplasmapause. Journal of Geophysical Research 82, 3261.
Liemohn, H.B., 1967. Cyclotron-resonance ampli=cation of VLFand ULF whistlers. Journal of Geophysical Research 72, 39.
Ludlow, G.R., Hughes, W.J., Engebretson, M.J., Slavin, J.A.,Sugiura, M., Singer, H.J., 1991. Ion cyclotron waves near L =4:6: a ground-satellite correlation study. Journal of GeophysicalResearch 96, 1451.
Manchester, R.N., 1966. Propagation of Pc1 micropulsations fromhigh to low latitudes. Journal of Geophysical Research 71, 3749.
Manchester, R.N., 1968. Correlation of Pc1 micropulsations atspaced stations. Journal of Geophysical Research 73, 3549.
Mauk, B.H., 1982. Helium resonance and dispersion eLectson geostationary Alfven=ion cyclotron waves. Journal ofGeophysical Research 87, 9107.
Mauk, B.H., 1983. Frequency gap formation in electromagneticcyclotron wave distributions. Geophysical Research Letters10, 635.
Mauk, B.H., McIlwain, C.E., McPherron, R.L., 1981. Heliumcyclotron resonance within the Earth’s magnetosphere.Geophysical Research Letters 8, 103.
Mauk, B.H., McPherron, R.L., 1980. An experimental test ofthe electromagnetic ion cyclotron instability within the Earth’smagnetosphere. Physics of Fluids 23, 2111.
Menk, F.W., Fraser, B.J., Hansen, H.J., Newell, P.T., Meng,C.-I., Morris, R.J., 1993. Multistation observations of Pc1-2ULF pulsations in the vicinity of the polar cusp. Journal ofGeomagnetism and Geoelectricity 45, 1159.
Morris, R.J., Cole, K.D., 1991. High latitude day-time Pc1-2continuous magnetic pulsations: a ground signature of the polarcusp and cleft projection. Planetary Space Science 39, 1473.
Mursula, K., Blomberg, L.G., Lindqvist, P.A., Marklund, G.T.,BrYaysy, T., Rasinkangas, R., Tanskanen, P., 1994. DispersivePc1 bursts observed by Freja. Geophysical Research Letters 21,1851.
Mursula, K., Rasinkangas, R., BYosinger, T., Erlandson, R.E.,Lindqvist, P.A., 1997. Non-bouncing Pc1 wave bursts. Journalof Geophysical Research 102, 17,611.
Neudegg, D.A., Fraser, B.J., Menk, F.W., Hansen, H.J., Burns,G.B., Morris, R.J., Underwood, M.J., 1995. Sources andvelocities of Pc1-2 ULF waves at high latitudes. GeophysicalResearch Letters 22, 2965.
Neudegg, D.A., Fraser, B.J., Menk, F.W., Waters, C.L., Burns,G.B., Morris, R.J., 2000. ULF wave attenuation in the highlatitude ionospheric waveguide. Advances in Space Research 25(7–8), 1559.
Nguyen, T.S., 1997. A statistical study of electromagnetic ioncyclotron wave properties in the middle magnetosphere. M.Sc.Thesis, University of Newcastle, NSW.
B.J. Fraser, T.S. Nguyen / Journal of Atmospheric and Solar-Terrestrial Physics 63 (2001) 1225–1247 1247
Nishida, A., 1966. Formations of plasmapause or magnetosphericplasma knee, by the combined action of magnetosphericconvection and plasma escape from the tail. Journal ofGeophysical Research 71, 5669.
Obayashi, T., 1965. Hydromagnetic whistlers. Journal ofGeophysical Research 70, 1069.
Olson, J.V., Lee, L.C., 1983. Pc1 wave generation by suddenimpluses. Planetary Space Science 31, 295.
Perraut, S., Gendrin, R., Roux, A., 1976. Ampli=cation of ioncyclotron waves for various typical pro=les of magnetosphericparameters. Journal of Atmospheric and Terrestrial Physics 38,1191.
Perraut, S., Gendrin, R., Roux, A., de Villedary, C., 1984.Ion cyclotron waves: direct comparison between ground-basedmeasurements and observations in the source region. Journal ofGeophysical Research 89, 195.
Plyasova-Bakounina, T.A., Kangas, J., Mursula, K., Molchanov,O.A., Green, A.W., 1996. Pc1-2 and Pc4-5 pulsations observedat a network of high latitude stations. Journal of GeophysicalResearch 101, 10,965.
Polyakov, S.V., Rapoport, V.O., 1981. Ionospheric Alfvenresonator. Geomagnetism and Aeronomy 21, 816.
Rasinkangas, R., Mursula, K., 1998. Modulation of magnetosphericEMIC waves by Pc3 pulsations of upstream origin. GeophysicalResearch Letters 25, 869.
Rauch, J.L., Roux, A., 1982. Ray tracing of ULF waves ina multi-component magnetospheric plasma: consequences forthe generation mechanism of ion cyclotron waves. Journal ofGeophysical Research 87, 8191.
Roth, B., Orr, D., 1975. Locating the Pc1 generation region bya statistical analysis of ground-based observations. PlanetarySpace Science 23, 993.
Roux, A., Perraut, S., Rauch, J.L., de Villedary, C., Kremser, G.,Korth, A., Young, D.T., 1982. Wave-particle interactions nearZHe+ observed on board GEOS 1 and 2, 2, Generation of ioncyclotron waves and heating of He+ ions. Journal of GeophysicalResearch 87, 8174.
Saito, T., 1969. Geomagnetic pulsations. Space Science Reviews10, 319.
Singer, H.J., Sullivan, W.P., Anderson, P., Mozer, F., Harvey,P., Wygant, J., McNeill, W., 1992. Fluxgate magnetometerinstrument on CRRES. Journal of Spacecraft and Rockets29, 599.
Singh, N., Horwitz, J.L., 1992. Plasmasphere re=lling: recentobservations and modelling. Journal of Geophysical Research97, 1049.
Summers, W.R., Fraser, B.J., 1972. Simultaneous observation ofPc1 micropulsation polarisation at four low latitude sites. Annalsof Geophysics 29, 697.
Tepley, L., 1964. Low-latitude observations of =ne-structuredhydromagnetic emissions. Journal of Geophysical Research69, 2273.
Tepley, L., LandshoL, R.K., 1966. Waveguide theory forionospheric propagation of hydromagnetic emissions. Journal ofGeophysical Research 71, 1499.
Thorne, R.M., Horne, R.B., 1992. The contribution of ioncyclotron waves to electron heating and SAR-arc excitationnear the storm-time plasmapause. Geophysical Research Letters19, 417.
Troitskaya, V.A., Matveeva, E.T., Ivanov, K.G., Gul[elmi,A.V., 1968. Change in the frequency of Pc1 geomagneticmicropulsations during the sudden deformation of themagnetosphere. Geomagnetism and Aeronomy 8, 784.
Watanabe, T., 1965. Determination of the electron densitydistribution in the magnetosphere using hydromagneticwhistlers. Journal of Geophysical Research 70, 5839.
Webster, D.J., Fraser, B.J., 1985. Source regions of low latitude Pc1pulsation and their relationship to the plasmapause. PlanetarySpace Science 33, 777.
Young, D.T., Perraut, S., Roux, A., de Villedary, C., Gendrin,R., Korth, A., Kremser, G., Jones, D., 1981. Wave-particleinteractions near ZHe+ observed on GEOS 1 and 2, 1,Propagation of ion cyclotron waves in He+ – rich plasma.Journal of Geophysical Research 86, 6755.