The Effect of Answering in a Preferred Versus a Non-Preferred Survey Mode on Measurement
16
Survey Research Methods (2014) Vol. 8, No. 3, pp. 137-152 c European Survey Research Association ISSN 1864-3361 http://www.surveymethods.org The Effect of Answering in a Preferred Versus a Non-Preferred Survey Mode on Measurement Jolene D. Smyth University of Nebraska-Lincoln Kristen Olson University of Nebraska-Lincoln Alian Kasabian University of Nebraska-Lincoln Previous research has shown that offering respondents their preferred mode can increase re- sponse rates, but the effect of doing so on how respondents process and answer survey ques- tions (i.e., measurement) is unclear. In this paper, we evaluate whether changes in question format have different effects on data quality for those responding in their preferred mode than for those responding in a non-preferred mode for three question types (multiple answer, open- ended, and grid). Respondents were asked about their preferred mode in a 2008 survey and were recontacted in 2009. In the recontact survey, respondents were randomly assigned to one of two modes such that some responded in their preferred mode and others did not. They were also randomly assigned to one of two questionnaire forms in which the format of individual questions was varied. On the multiple answer and open-ended items, those who answered in a non-preferred mode seemed to take advantage of opportunities to satisfice when the question format allowed or encouraged it (e.g., selecting fewer items in the check-all than the forced- choice format and being more likely to skip the open-ended item when it had a larger answer box), while those who answered in a preferred mode did not. There was no difference on a grid formatted item across those who did and did not respond by their preferred mode, but results indicate that a fully labeled grid reduced item missing rates vis-á-vis a grid with only column heading labels. Results provide insight into the effect of tailoring to mode preference on commonly used questionnaire design features. Keywords: mode preference; data quality; mail survey; web survey; open-ends; check-all; forced-choice; grid questions 1 Introduction Advances in technology, the deterioration of the frame tra- ditionally used for telephone surveys (Kalsbeek & Agans, 2008) and the introduction of a household-based frame with adequate coverage of the general population (the U.S. Postal Service’s Delivery Sequence File; Iannacchione, 2011) have made mixed mode surveys more tenable and popular in re- cent years (de Leeuw, 2005; Smyth, Dillman, Christian, & O’Neill, 2010). When surveyors use multiple modes to in- crease response rates, they are assuming that sample mem- bers have a pre-existing preference for one mode over an- other (Groves & Kahn, 1979). Most research on mode pref- erence has focused on how providing someone with their preferred mode will affect unit nonresponse (Olson, Smyth, & Wood, 2012; Shih, 2002). The effect on data quality is Contact information: Jolene D. Smyth, University of Nebraska- Lincoln, Department of Sociology, 724 Oldfather Hall, Lincoln, NE 68588-0324 ([email protected]) still unknown. In this paper we examine the relationship be- tween responding in one’s preferred mode, question format, and data quality. In particular, we examine whether changes in question format have different effects on data quality for those responding in their preferred mode compared to those responding in a mode they did not prefer. If so, this suggests that answering a survey in a preferred mode may affect how respondents process the content and design of a question- naire. We first have to clarify what we mean by “mode prefer- ence”. Previous research generally operationalizes a “pre- ferred mode” as the mode selected when given a choice be- tween two or more modes (e.g., Dillman, Smyth, & Chris- tian, 2009; Shih, 2002). Alternatively, mode preference can be thought of as a pre-existing attitude about survey modes (Olson et al., 2012). These two approaches are re- lated conceptually—a pre-existing attitude certainly should affect which mode one chooses when given a choice. But in practice they are distinct in that mode choice studies often offer a limited set of modes from which the respondent can choose (e.g., web and mail); we cannot tell from these studies 137 https://ojs.ub.uni-konstanz.de/srm/article/view/5750/5587
-
Upload
un-lincoln -
Category
Documents
-
view
1 -
download
0
Transcript of The Effect of Answering in a Preferred Versus a Non-Preferred Survey Mode on Measurement
Survey Research Methods (2014)Vol. 8, No. 3, pp. 137-152
c© European Survey Research AssociationISSN 1864-3361
http://www.surveymethods.org
The Effect of Answering in a Preferred Versus a Non-Preferred SurveyMode on Measurement
Jolene D. SmythUniversity of Nebraska-Lincoln
Kristen OlsonUniversity of Nebraska-Lincoln
Alian KasabianUniversity of Nebraska-Lincoln
Previous research has shown that offering respondents their preferred mode can increase re-sponse rates, but the effect of doing so on how respondents process and answer survey ques-tions (i.e., measurement) is unclear. In this paper, we evaluate whether changes in questionformat have different effects on data quality for those responding in their preferred mode thanfor those responding in a non-preferred mode for three question types (multiple answer, open-ended, and grid). Respondents were asked about their preferred mode in a 2008 survey andwere recontacted in 2009. In the recontact survey, respondents were randomly assigned to oneof two modes such that some responded in their preferred mode and others did not. They werealso randomly assigned to one of two questionnaire forms in which the format of individualquestions was varied. On the multiple answer and open-ended items, those who answered in anon-preferred mode seemed to take advantage of opportunities to satisfice when the questionformat allowed or encouraged it (e.g., selecting fewer items in the check-all than the forced-choice format and being more likely to skip the open-ended item when it had a larger answerbox), while those who answered in a preferred mode did not. There was no difference on agrid formatted item across those who did and did not respond by their preferred mode, butresults indicate that a fully labeled grid reduced item missing rates vis-á-vis a grid with onlycolumn heading labels. Results provide insight into the effect of tailoring to mode preferenceon commonly used questionnaire design features.
Keywords: mode preference; data quality; mail survey; web survey; open-ends; check-all;forced-choice; grid questions
1 Introduction
Advances in technology, the deterioration of the frame tra-ditionally used for telephone surveys (Kalsbeek & Agans,2008) and the introduction of a household-based frame withadequate coverage of the general population (the U.S. PostalService’s Delivery Sequence File; Iannacchione, 2011) havemade mixed mode surveys more tenable and popular in re-cent years (de Leeuw, 2005; Smyth, Dillman, Christian, &O’Neill, 2010). When surveyors use multiple modes to in-crease response rates, they are assuming that sample mem-bers have a pre-existing preference for one mode over an-other (Groves & Kahn, 1979). Most research on mode pref-erence has focused on how providing someone with theirpreferred mode will affect unit nonresponse (Olson, Smyth,& Wood, 2012; Shih, 2002). The effect on data quality is
Contact information: Jolene D. Smyth, University of Nebraska-Lincoln, Department of Sociology, 724 Oldfather Hall, Lincoln, NE68588-0324 ([email protected])
still unknown. In this paper we examine the relationship be-tween responding in one’s preferred mode, question format,and data quality. In particular, we examine whether changesin question format have different effects on data quality forthose responding in their preferred mode compared to thoseresponding in a mode they did not prefer. If so, this suggeststhat answering a survey in a preferred mode may affect howrespondents process the content and design of a question-naire.
We first have to clarify what we mean by “mode prefer-ence”. Previous research generally operationalizes a “pre-ferred mode” as the mode selected when given a choice be-tween two or more modes (e.g., Dillman, Smyth, & Chris-tian, 2009; Shih, 2002). Alternatively, mode preferencecan be thought of as a pre-existing attitude about surveymodes (Olson et al., 2012). These two approaches are re-lated conceptually—a pre-existing attitude certainly shouldaffect which mode one chooses when given a choice. But inpractice they are distinct in that mode choice studies oftenoffer a limited set of modes from which the respondent canchoose (e.g., web and mail); we cannot tell from these studies
137
https://ojs.ub.uni-konstanz.de/srm/article/view/5750/5587
138 JOLENE D. SMYTH, KRISTEN OLSON, AND ALIAN KASABIAN
whether respondents would have preferred a different modealtogether (e.g., telephone). As a practical matter, measuringmode preference as an attitude prior to administering a sur-vey with multiple modes helps to ensure that mode prefer-ence is exogenous to the measurement process in which dataquality is evaluated. That is, in this study mode preferenceis measured separately from the survey we are using to as-sess data quality, thus minimizing shared method variance asmuch as possible.
That said, one challenge of conducting research relying onself-reports of mode preference is that those reports them-selves are influenced by the mode in which the question isasked (Groves & Kahn, 1979; Millar, O’Neill, & Dillman,2009; Smyth, Olson, & Richards, 2009). People who are sur-veyed in a particular mode are more likely to report a pref-erence for that mode. However, they are not guaranteed toreport such a preference. As just one example, when Grovesand Kahn (1979) asked for mode preference in an in-personsurvey, about 22% of respondents reported preferring a modeother than in-person. When they asked the same question ina telephone survey, about 60% reported preferring a modeother than telephone. Thus, while this paper is focused on theeffects of catering to self-reported mode preference on dataquality, a larger question motivating our efforts in this areais whether those self-reports have predictive or explanatoryvalue even though they are influenced by the survey mode inwhich the questions are asked.
The quality of survey responses is affected by a respon-dent’s motivation, ability, and the burden of the task (Kros-nick, 1991). In responding to questionnaires, sample mem-bers must expend energy and cognitive effort both interact-ing with the survey technology (i.e., paper and pencil orcomputer) and answering the actual questions (Krosnick,Narayan, & Smith, 1996; Tourangeau, Rips, & Rasinski,2000). Ideal respondents are those who are fully engagedwith the survey. Their motivation is high, their ability isequal to the task, and they are not unduly burdened by thesurvey process. In real life, motivation flags, ability maybe low or absent, and surveys are often highly burdensome,making respondents more likely to seek relief by skipping oronly minimally engaging in the response process (i.e., sat-isficing, Krosnick, 1991; Krosnick & Alwin, 1987), result-ing in poor data quality. We suspect that respondents pre-fer modes that they find the least burdensome and the mostmotivating. In fact, previous research has shown that re-spondents are highly likely to report preferring modes thatthey find most convenient, comfortable, and enjoyable, withconvenience being the most important factor (Smyth, Olson,& Richards, 2009). In lower burden and more motivatingmodes, the energy and cognitive effort needed to interactwith the survey technology is minimized and more energyand effort can be focused on the questions being asked.
Previous research has not examined the link between re-
ceiving one’s preferred mode and data quality. To examinethis link, we experimentally assign respondents to one of twoversions of each of three question types (multiple answer,open-ended, and grid). The versions differ in how easy theymake it for respondents to satisfice (i.e., it is easier to satisficein a check-all than a forced choice format and when given asmall rather than a large open-ended answer box) and/or howdifficult they make the response task (i.e., a grid with labelslocated apart from answer spaces is more difficult than onewith labels grouped with answer spaces). In general, we ex-pect respondents who answer in a non-preferred mode to bemore likely to take advantage of opportunities to satisfice orto make mistakes in difficult formats, resulting in lower dataquality. Because their overall burden is higher due to not re-ceiving their preferred mode, these respondents will look tothe question format to identify ways to shortcut the responseprocess resulting in the design of the question playing a sig-nificant role in their answer.
If respondents are given a survey in their preferred mode(i.e., an easier mode for them), we hypothesize they are lesslikely to shortcut the response process through satisficing be-haviors. There are two competing hypotheses about how thisprocess might work. The first is that respondents who par-ticipate in their preferred mode will focus primarily on thecontent of items and thus will provide high quality responsesregardless of design features, resulting in smaller questionformat effects. An alternative hypothesis is that these lessburdened respondents will be able to be more attentive to allparts of a question, including the design features. Whereasin the first hypothesis, the decreased burden and increasedmotivation resulting from receiving one’s preferred mode ismanifest as a focus on content, in this competing hypothe-sis, it is manifest as an ability and dedication to attend to allthe details. In this case, we would expect question formatto have an effect. However, inasmuch as those answeringin their preferred mode are not expected to seek out oppor-tunities to satisfice, the effect may be different from the ef-fect for those answering in a non-preferred mode. The ex-isting literature on differences in visual design effects acrossdemographic groups shows mixed results, with some typesof design features having smaller effects among those withhigher cognitive abilities as measured by age and education,some features having larger effects, and still others having noeffects at all (Stern, Dillman, & Smyth, 2007).
2 Data and Methods
The data come from two surveys. The first, the 2008 Ne-braska Annual Social Indicators Survey (NASIS), used anRDD sample of listed landline telephone numbers in Ne-braska. In this telephone survey, 1,811 respondents aged 19and older (AAPOR RR2 = 31%; see American Associationfor Public Opinion Research, 2011) indicated their preferredsurvey mode (see Appendix for question wording). A quarter
https://ojs.ub.uni-konstanz.de/srm/article/view/5750/5587
THE EFFECT OF ANSWERING IN A PREFERRED VERSUS A NON-PREFERRED SURVEY MODE ON MEASUREMENT 139
of the respondents stated a preference for mail (24.6%), al-most one-fifth (19.7%) preferred an internet survey, over half(51.3%) preferred an interviewer-administered mode (1.7%in-person, 0.4% cell phone, and 49.2% home phone pref-erence), and 4.5% abstained from giving a preference. Atthe end of the survey, 1,370 (75.6%) respondents stated theirwillingness to participate in future social science research(see Appendix for question wording).
The following year, 1,229 NASIS respondents who werewilling to participate in future research and had completemailing addresses on the frame were contacted for a follow-up survey, the Quality of Life in a Changing Nebraska(QLCN) survey. Sample members were randomly assignedwith equal allocation to one of four mode treatments (mailonly, web only, mail then web, or web then mail) so that somereceived their preferred mode and others did not, and to oneof two survey forms that were identical in content (45 ques-tions) but varied in format and design characteristics. All re-cruitment contacts were made by postal mail. The QLCN hadan overall response rate of 46.0% (AAPOR RR2, n=565).1
Six QLCN respondents did not report a mode preference inthe NASIS and are removed from these analyses, leaving afinal analytic sample size of 559. The web only group hada 25.4% response rate and differed significantly from theother three mode conditions, all of which had response ratesof around 50% that did not significantly vary (Olson et al.,2012). Table 1 shows the mode in which respondents com-pleted the QLCN by their reported mode preference from theNASIS. Most of the sample participated via mail (78%). Thedifference in the distribution of mode of completion acrossmode preferences is due to differential nonresponse relatedto mode preference. That is, people’s willingness to respondby each mode was related to their mode preference, which isalso related to demographic characteristics such as age (Ol-son et al., 2012).
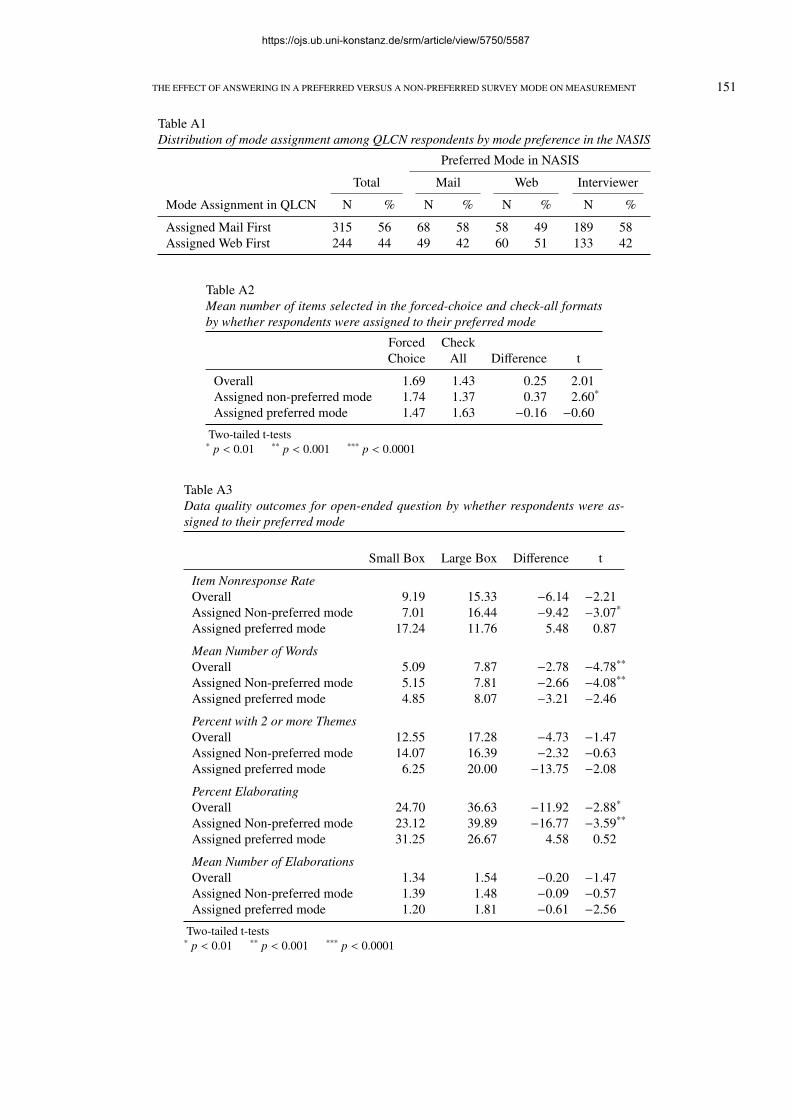
We operationalized respondents having received their“preferred mode” in two ways. In the first, respondents whoreceived their preferred mode are defined as those who stateda preference for a mode in the NASIS and received it as thefirst mode assigned in the QLCN, whether or not they ac-tually participated in that mode (See Table A1). Using thismeasure, which we refer to as the “assigned preferred mode”approach, 23% of the respondents (n = 126) received theirpreferred mode. In the second, respondents who receivedtheir preferred mode are defined as those who participated inthe QLCN in the mode they previously reported preferringin the NASIS, regardless of the order in which the modeswere offered. Using this measure, which we refer to as the“responded in preferred mode” approach, 24% (n = 136) ofthe respondents participated in their preferred mode. Over-all, 86.5% of those who were assigned their preferred modefirst and 6.2% of those who were not assigned their preferredmode first participated in their preferred mode.
We conducted all analyses with both measures of havingreceived their preferred mode—the assigned and respondedmeasures. In every instance, the results using the assignedmode were in the same direction, but attenuated relative tothose using the responded in preferred mode approach. Weexpect an effect when respondents participate in their pre-ferred mode, regardless of whether it was the first mode towhich they were assigned. For this reason and for parsimony,we will report the findings for analyses using the respondedin preferred mode approach only; findings based on the as-signed approach are available in Appendix tables A1-A4.
We evaluate whether the effect of each experimental factorvaries across mode preference groups in multivariate mod-els with main effects for the experimental form and modepreference and an interaction effect between form and modepreference. Because responding in one’s preferred mode isnot an experimentally assigned factor, respondents who par-ticipate in their preferred mode may differ on other charac-teristics that are also related to data quality from those whodid not participate in their preferred mode. To address this,we include the respondent characteristics of sex, age, educa-tion, employment status, income, an indicator variable formissing data on the income variable, number of children,and urbanicity. These are variables that have previously beenidentified as predictors of mode preference or of nonresponse(e.g., Millar et al., 2009; Olson et al., 2012; Smyth, Olson, &Richards, 2009). We also include the mode of completion ineach model to identify whether the differences across modepreference groups can be accounted for by differential partic-ipation in each mode. We tested an interaction term betweencompletion mode and mode preference to see if the effects ofanswering in a preferred mode versus a non-preferred modediffered for those answering in mail than for those answer-ing in web and found no significant differences in any ofthe models. We present t-values in the bivariate tables andstandard errors in the multivariate tables. Because we areconducting multiple comparisons, we use a stricter p < 0.01value for identifying statistically significant results.
3 Question Design Experiments
Because respondents may be particularly likely to engagein satisficing behaviors when faced with difficult questions(Krosnick, 1991), we choose three high burden questiontypes to examine: multiple answer (i.e., check-all-that-apply)questions (Rasinski, Mingay, & Bradburn, 1994; Smyth,Dillman, Christian, & Stern, 2006), open-ended questions(Smyth, Dillman, Christian, & McBride, 2009), and ques-tions formatted in a grid (Couper, 2008; Kaczmirek, 2011).We then present these questions in formats that make it easier
1 The cumulative response rate, calculated as the product of theNASIS and QLCN response rates, is 31% × 46% = 14.26%.
https://ojs.ub.uni-konstanz.de/srm/article/view/5750/5587
140 JOLENE D. SMYTH, KRISTEN OLSON, AND ALIAN KASABIAN
Table 1Distribution of mode completion among QLCN respondents by mode preference in the NASIS
Preferred Mode in NASIS
Total Mail Web Interviewer
Mode Completion in QLCN N % N % N % N %
Completed Mail 435 78 93 79 73 62 269 83Completed Web 124 22 24 21 45 38 55 17
Total 559 100 117 100 118 100 324 100
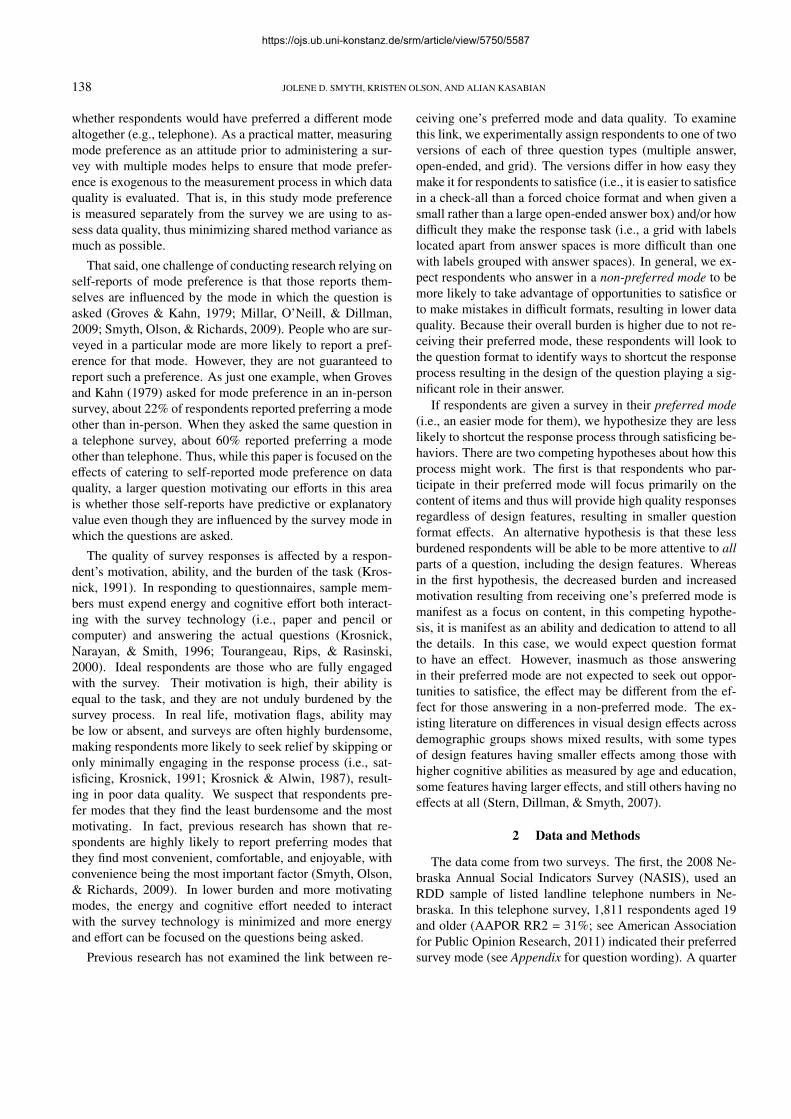
or more difficult to provide an optimal answer.2 We note thatsatisficing behaviors related to mode preference may occuron other question types and throughout entire questionnaires,but we focus on these three high burden question types as astarting point.
3.1 Experiment 1: Forced-Choice vs. Check-All-That-Apply
Respondents are often asked to report which items withina long list apply to them using either a check-all-that-applyor a forced-choice format (Rasinski et al., 1994; Smyth et al.,2006). Previous research has shown that respondents endorsefewer items and responses exhibit more primacy patterns inthe check-all format as this format makes it easier for respon-dents to satisfice (i.e., it does not encourage deep processingof all of the items in the list Krosnick, 1991; Rasinski et al.,1994; Smyth et al., 2006; Sudman, Bradburn, & Schwarz,1996; Thomas & Klein, 2006). In contrast, the forced-choiceformat explicitly requires a response for every item, encour-aging deeper processing of the list and leading to more affir-mative responses.
We compare responses across the check-all and forced-choice formats for those who did and did not participate intheir preferred mode. We focus on a seven-item questionthat appears as question 29 of 45 (Figure 1) and examine themean number of items endorsed.3
Consistent with previous literature, fewer items are se-lected in the check-all than in the forced-choice format for allrespondents, although this is not significant at the p < 0.01level (Table 2: t = 2.01, p = 0.04). We find the same pattern,with a strong statistically significant effect, when we subsetthe respondents to only those who did not respond in theirpreferred mode (t = 3.39, p = 0.0008), suggesting that thesepeople took advantage of the opportunity to satisfice that wasafforded by the check-all format.
There is no significant difference between the two for-mats among those who participated in their preferred mode(t = −1.80, p = 0.07). We note that the magnitude of the dif-ference for those in their preferred mode is virtually the sameas those in their non-preferred mode, but that the direction isopposite existing research on this topic. That is, persons who
24. Please indicate whether or not you have had each of the following types of training over the past 12 months.
Yes No Job skills training
English skills training
Computer skills training
25. With regard to the English language, how well do
you understand it when it is spoken to you?
Very well Well Not well Not at all
26. With regard to the English language, how well do
you read it?
Very well Well Not well Not at all
27. With regard to the English language, how well do
you write it?
Very well Well Not well Not at all
28. How would you rate your own personal financial
situation? Would you say you are in…
Excellent shape Very good shape Good shape Fair shape Poor shape
29. Thinking about your personal finances, please
indicate whether or not you have done each of the following in the past 12 months.
Yes No Delayed/canceled purchasing a home
Delayed/canceled plans to buy a car
Delayed/canceled plans to make a major household purchase
Cut back on vacation spending
Cut back on eating out
Cut back on home internet access
Cut back on home landline telephone services
30. Do you have each of the following types of telephone service?
Yes No Home landline telephone service
Cellular telephone service
Voice Over Internet Protocol (VOIP)
No telephone service
31. Please indicate whether or not you use the
internet at each of the following locations. Yes No Home
Work
Library
School
32. All things considered, during the next year, what
do you think will be your biggest challenges?
33. If you received a request to do another survey
like this one, would you prefer to participate in…
An in-person interview at your home An interview on your home phone An interview on your cell phone A paper survey sent by mail A survey on the internet
34. If you received a request to do another survey
like this one, would you find it most convenient to participate in…
An in-person interview at your home An interview on your home phone An interview on your cell phone A paper survey sent by mail A survey on the internet
35. If you received a request to do another survey
like this one, would you be most comfortable answering questions in…
An in-person interview at your home An interview on your home phone An interview on your cell phone A paper survey sent by mail A survey on the internet
Survey Participation
3
24. Which of the following types of training have you had over the past 12 months? Check all that apply.
Job skills training English skills training Computer skills training
25. With regard to the English language, how well do
you understand it when it is spoken to you?
Very well Well Not well Not at all
26. With regard to the English language, how well do
you read it?
Very well Well Not well Not at all
27. With regard to the English language, how well do
you write it?
Very well Well Not well Not at all
28. How would you rate your own personal financial
situation? Would you say you are in…
Poor shape Fair shape Good shape Very good shape Excellent shape
29. Thinking about your personal finances, which of
the following have you done in the past 12 months? Check all that apply.
Delayed/canceled purchasing a home Delayed/canceled plans to buy a car Delayed/canceled plans to make a major household purchase
Cut back on vacation spending Cut back on eating out Cut back on home internet access Cut back on home landline telephone services
30. Which of the following types of telephone service do you have? Check all that apply.
Home landline telephone service Cellular telephone service Voice Over Internet Protocol (VOIP) No telephone service
31. At which of the following locations do you use the
internet? Check all that apply.
Home Work Library School
32. All things considered, during the next year, what
do you think will be your biggest challenges?
33. If you received a request to do another survey
like this one, would you prefer to participate in…
An in-person interview at your home An interview on your home phone An interview on your cell phone A paper survey sent by mail A survey on the internet No preference
34. If you received a request to do another survey
like this one, would you find it most convenient to participate in…
An in-person interview at your home An interview on your home phone An interview on your cell phone A paper survey sent by mail A survey on the internet No preference
35. If you received a request to do another survey
like this one, would you be most comfortable answering questions in…
An in-person interview at your home An interview on your home phone An interview on your cell phone A paper survey sent by mail A survey on the internet No preference
3
Survey Participation
Figure 1. Experimental versions of multiple-answer question
participated in their preferred mode endorsed more items inthe check-all format than in the forced-choice format. Giventhe small sample size of those who participated in their pre-ferred mode, we cannot easily isolate why this is happening
2 Unified mode design (Dillman et al., 2009) was used acrossthe web and mail modes to eliminate unnecessary mode differences.The question wording and layout were the same across the modesand certain web features such as pop-up reminders were not usedbecause they could not also be used in the mail mode.
3 We did not randomly vary response option order, and thus can-not test primacy effects.
https://ojs.ub.uni-konstanz.de/srm/article/view/5750/5587
THE EFFECT OF ANSWERING IN A PREFERRED VERSUS A NON-PREFERRED SURVEY MODE ON MEASUREMENT 141
statistically. Regardless, we have evidence that respondentsparticipating in their preferred mode are not satisficing in thecheck-all format relative to the forced choice format. Thereis also no significant bivariate difference in the number of en-dorsed items between those who responded in their preferredmode and those who did not respond in their preferred modewithin each of the formats.
In a negative binomial regression model predicting thenumber of “yes” answers, there is a significant interactioneffect of format and responding in a preferred mode withmultivariate controls (Table 3), indicating that the effect ofthe forced choice versus check-all that apply format differsfor those who are answering in their preferred mode versusnon-preferred mode. Predicted values from the final model inTable 3 indicate that the difference in the number of endorseditems between the two formats shrinks with multivariate con-trols for those who responded in their preferred mode (0.33items), but is still roughly the same magnitude for those whodid not respond in their preferred mode (0.53 items). Further-more, when we separate the data into those who participatedin their preferred mode and those who did not and rerun thenegative binomial regression models, the effect of format isstrong and significant (b = −0.335, p < 0.0001) for thosewho did not participate in their preferred mode, but is notsignificant for those who did respond in their preferred mode(b = 0.193, p = 0.29). That is, the differential effect of modepreference on the selection of “yes” answers cannot be ex-plained by respondent characteristics (i.e., differential nonre-sponse or differential characteristics related to mode prefer-ence) alone, and the effect of format is concentrated amongthose respondents who did not participate in their preferredmode.
The finding that those answering in a non-preferred modeselected fewer items in the check-all than the forced-choiceformat is consistent with our hypothesis that this groupwould take advantage of opportunities to satisfice. The find-ing of no difference across the forms for those responding intheir preferred mode is well explained by the hypothesis thatthe reduced burden and increased motivation stemming fromresponding in a preferred mode results in a focus on contentand not form (and thus diminished form effects). Thus, it ap-pears that satisficing behaviors are concentrated among thosewho did not participate in their preferred mode for forcedchoice versus check-all-that-apply questions.
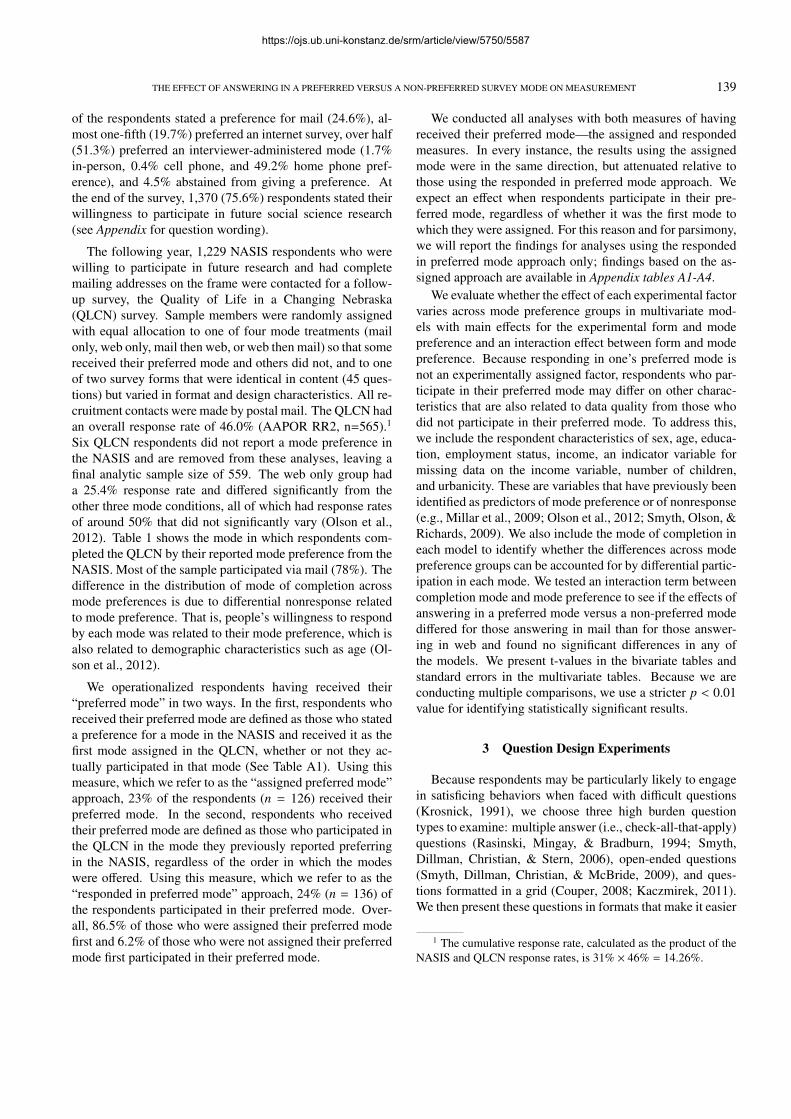
3.2 Experiment 2: Open-ended Questions
Open-ended questions require respondents to communi-cate their answer in detail in writing with no preexisting cat-egories to help, making this question type highly burden-some (Bradburn, Sudman, & Wansink, 2004). Since skip-ping open-ended questions or providing only short answerscan ease this burden, open-ended questions are known to pro-duce high item nonresponse rates and low quality answers,
24. Please indicate whether or not you have had each of the following types of training over the past 12 months.
Yes No Job skills training
English skills training
Computer skills training
25. With regard to the English language, how well do
you understand it when it is spoken to you?
Very well Well Not well Not at all
26. With regard to the English language, how well do
you read it?
Very well Well Not well Not at all
27. With regard to the English language, how well do
you write it?
Very well Well Not well Not at all
28. How would you rate your own personal financial
situation? Would you say you are in…
Excellent shape Very good shape Good shape Fair shape Poor shape
29. Thinking about your personal finances, please
indicate whether or not you have done each of the following in the past 12 months.
Yes No Delayed/canceled purchasing a home
Delayed/canceled plans to buy a car
Delayed/canceled plans to make a major household purchase
Cut back on vacation spending
Cut back on eating out
Cut back on home internet access
Cut back on home landline telephone services
30. Do you have each of the following types of telephone service?
Yes No Home landline telephone service
Cellular telephone service
Voice Over Internet Protocol (VOIP)
No telephone service
31. Please indicate whether or not you use the
internet at each of the following locations. Yes No Home
Work
Library
School
32. All things considered, during the next year, what
do you think will be your biggest challenges?
33. If you received a request to do another survey
like this one, would you prefer to participate in…
An in-person interview at your home An interview on your home phone An interview on your cell phone A paper survey sent by mail A survey on the internet
34. If you received a request to do another survey
like this one, would you find it most convenient to participate in…
An in-person interview at your home An interview on your home phone An interview on your cell phone A paper survey sent by mail A survey on the internet
35. If you received a request to do another survey
like this one, would you be most comfortable answering questions in…
An in-person interview at your home An interview on your home phone An interview on your cell phone A paper survey sent by mail A survey on the internet
Survey Participation
3
24. Which of the following types of training have you had over the past 12 months? Check all that apply.
Job skills training English skills training Computer skills training
25. With regard to the English language, how well do
you understand it when it is spoken to you?
Very well Well Not well Not at all
26. With regard to the English language, how well do
you read it?
Very well Well Not well Not at all
27. With regard to the English language, how well do
you write it?
Very well Well Not well Not at all
28. How would you rate your own personal financial
situation? Would you say you are in…
Poor shape Fair shape Good shape Very good shape Excellent shape
29. Thinking about your personal finances, which of
the following have you done in the past 12 months? Check all that apply.
Delayed/canceled purchasing a home Delayed/canceled plans to buy a car Delayed/canceled plans to make a major household purchase
Cut back on vacation spending Cut back on eating out Cut back on home internet access Cut back on home landline telephone services
30. Which of the following types of telephone service do you have? Check all that apply.
Home landline telephone service Cellular telephone service Voice Over Internet Protocol (VOIP) No telephone service
31. At which of the following locations do you use the
internet? Check all that apply.
Home Work Library School
32. All things considered, during the next year, what
do you think will be your biggest challenges?
33. If you received a request to do another survey
like this one, would you prefer to participate in…
An in-person interview at your home An interview on your home phone An interview on your cell phone A paper survey sent by mail A survey on the internet No preference
34. If you received a request to do another survey
like this one, would you find it most convenient to participate in…
An in-person interview at your home An interview on your home phone An interview on your cell phone A paper survey sent by mail A survey on the internet No preference
35. If you received a request to do another survey
like this one, would you be most comfortable answering questions in…
An in-person interview at your home An interview on your home phone An interview on your cell phone A paper survey sent by mail A survey on the internet No preference
3
Survey Participation Figure 2. Experimental versions of open-ended question
especially in self-administered modes (Dillman et al., 2009).Previous research has shown that providing larger answerboxes increases the amount of information reported becausethe size of the box communicates to respondents that moreinformation is needed (Christian & Dillman, 2004; Israel,2010; Smyth, Dillman, Christian, & McBride, 2009). How-ever, larger answer boxes may also increase the perceivedburden of the task, resulting in higher item nonresponse rates.
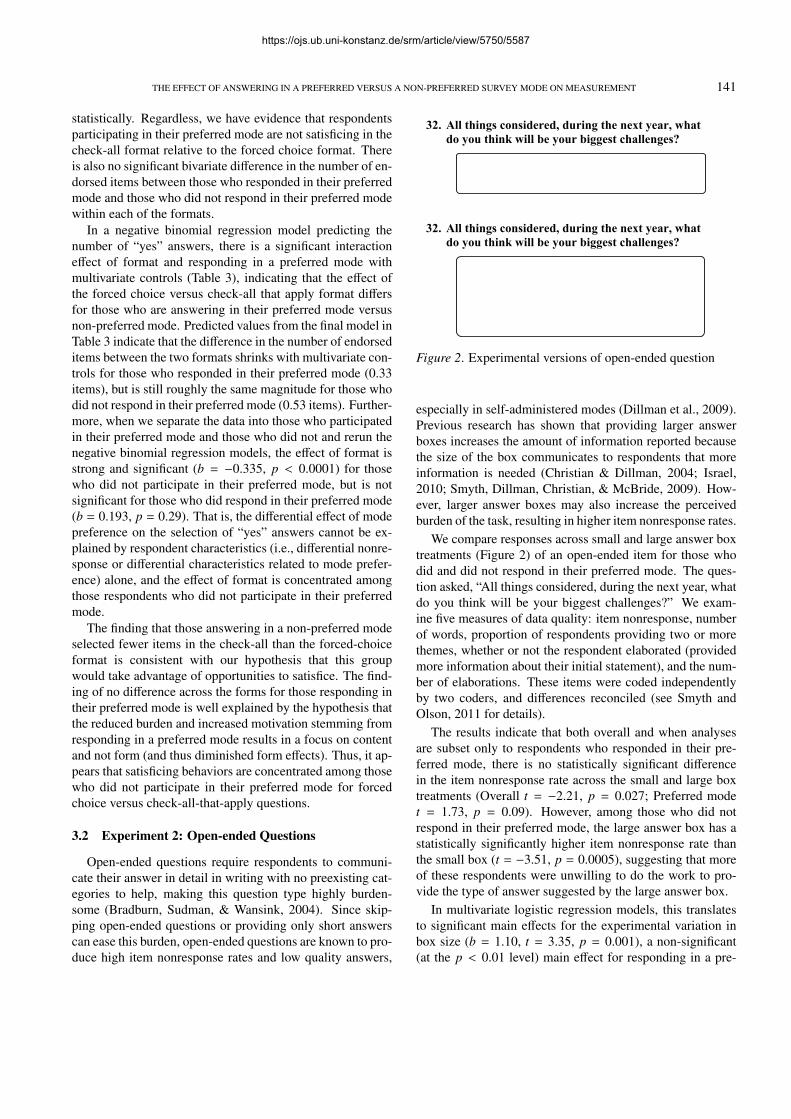
We compare responses across small and large answer boxtreatments (Figure 2) of an open-ended item for those whodid and did not respond in their preferred mode. The ques-tion asked, “All things considered, during the next year, whatdo you think will be your biggest challenges?” We exam-ine five measures of data quality: item nonresponse, numberof words, proportion of respondents providing two or morethemes, whether or not the respondent elaborated (providedmore information about their initial statement), and the num-ber of elaborations. These items were coded independentlyby two coders, and differences reconciled (see Smyth andOlson, 2011 for details).
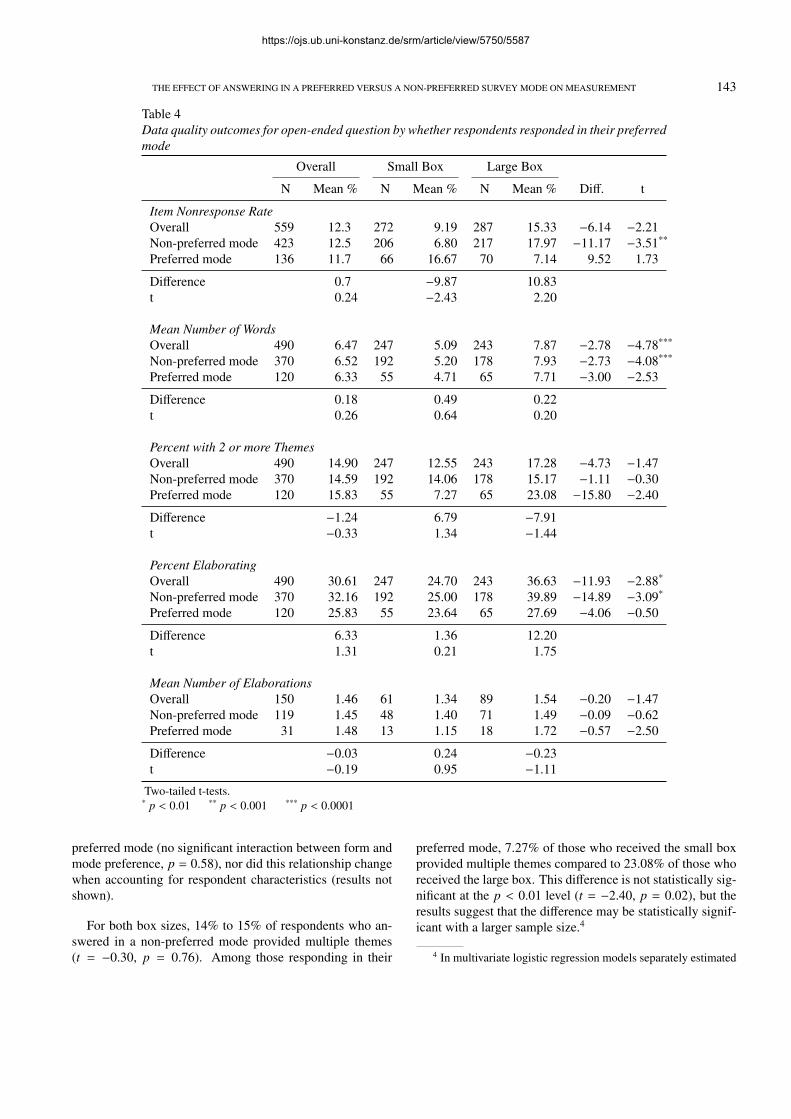
The results indicate that both overall and when analysesare subset only to respondents who responded in their pre-ferred mode, there is no statistically significant differencein the item nonresponse rate across the small and large boxtreatments (Overall t = −2.21, p = 0.027; Preferred modet = 1.73, p = 0.09). However, among those who did notrespond in their preferred mode, the large answer box has astatistically significantly higher item nonresponse rate thanthe small box (t = −3.51, p = 0.0005), suggesting that moreof these respondents were unwilling to do the work to pro-vide the type of answer suggested by the large answer box.
In multivariate logistic regression models, this translatesto significant main effects for the experimental variation inbox size (b = 1.10, t = 3.35, p = 0.001), a non-significant(at the p < 0.01 level) main effect for responding in a pre-
https://ojs.ub.uni-konstanz.de/srm/article/view/5750/5587

142 JOLENE D. SMYTH, KRISTEN OLSON, AND ALIAN KASABIAN
Table 2Mean number of items selected in the forced-choice and check-all formats by whether respondentsresponded in their preferred mode
Overall Forced Choice Check All
Responded N Mean N Mean N Mean Diff. t
Overall 557 1.55 270 1.69 287 1.43 0.25 2.01Non-preferred mode 422 1.57 205 1.81 217 1.33 0.48 3.39**
Preferred mode 135 1.52 65 1.28 70 1.74 −0.47 −1.80
Difference 0.05 0.54 −0.41t 0.32 2.39 −2.19
* p < 0.01 ** p < 0.001 *** p < 0.0001
Table 3Negative binomial regression coefficients and standard errors, number of "yes" answers
Model 1 Model 2 Model 3
Coef. SE Coef. SE Coef. SE
Check-all −0.309* 0.095 −0.336*** 0.094 −0.339*** 0.094Responded in preferred mode −0.351 0.145 −0.354 0.143 −0.317 0.144Check-all × Resp. in preferred mode 0.620* 0.196 0.574* 0.194 0.558* 0.193Female 0.252* 0.088 0.252* 0.087Age −0.008 0.004 −0.009 0.004Rural 0.111 0.101 0.109 0.101Income < $40K 0.286* 0.111 0.263 0.111Income missing −0.224 0.158 −0.227 0.157Number of kids 0.037 0.048 0.031 0.048Some college −0.084 0.108 −0.088 0.108BA or higher −0.277* 0.104 −0.262 0.104Married −0.025 0.101 −0.028 0.100Employed full-time 0.247 0.115 0.248 0.115Employed part-time 0.112 0.127 0.132 0.127Responded in web −0.184 0.103Constant 0.596** 0.064 0.794 0.311 0.870* 0.312
Overdispersion parameter 0.309** 0.068 0.208*** 0.061 0.202*** 0.060LR chi2 13.77* 60.93*** 64.16***
Pseudo R2 (in %) 0.74 3.35 3.53N 557 546 546
* p < 0.01 ** p < 0.001 *** p < 0.0001
ferred mode (b = 1.01, t = 2.34, p = 0.02) with a signif-icant interaction effect (interaction b = −2.06, t = −3.13,p = 0.002) between box size and responding in a preferredmode that holds with multivariate controls (Table 5). Whenwe estimate the multivariate models separately for those whoresponded in their preferred mode and those who did not re-spond in their preferred mode, once again all of the formeffect is concentrated among those who did not respond intheir preferred mode (not preferred mode: b = 1.11, t = 3.26,p = 0.001; preferred mode: b = −1.24, t = −1.84, p = 0.07).Thus, these results are also consistent with our hypothesis
that those answering in a non-preferred mode will take ad-vantage of opportunities to satisfice introduced by questionformat and those answering in a preferred mode will be lessaffected by question format.
We include only persons who provided an answer to theopen-ended items to test the effect of box size on the qual-ity of open-ended responses. Consistent with previous re-search, among all respondents, the large box yielded morewords than the small box (t = −4.78, p < 0.0001). In mul-tivariate negative binomial models, this increase did not sig-nificantly vary by whether the respondent responded in their
https://ojs.ub.uni-konstanz.de/srm/article/view/5750/5587
THE EFFECT OF ANSWERING IN A PREFERRED VERSUS A NON-PREFERRED SURVEY MODE ON MEASUREMENT 143
Table 4Data quality outcomes for open-ended question by whether respondents responded in their preferredmode
Overall Small Box Large Box
N Mean % N Mean % N Mean % Diff. t
Item Nonresponse RateOverall 559 12.3 272 9.19 287 15.33 −6.14 −2.21Non-preferred mode 423 12.5 206 6.80 217 17.97 −11.17 −3.51**
Preferred mode 136 11.7 66 16.67 70 7.14 9.52 1.73
Difference 0.7 −9.87 10.83t 0.24 −2.43 2.20
Mean Number of WordsOverall 490 6.47 247 5.09 243 7.87 −2.78 −4.78***
Non-preferred mode 370 6.52 192 5.20 178 7.93 −2.73 −4.08***
Preferred mode 120 6.33 55 4.71 65 7.71 −3.00 −2.53
Difference 0.18 0.49 0.22t 0.26 0.64 0.20
Percent with 2 or more ThemesOverall 490 14.90 247 12.55 243 17.28 −4.73 −1.47Non-preferred mode 370 14.59 192 14.06 178 15.17 −1.11 −0.30Preferred mode 120 15.83 55 7.27 65 23.08 −15.80 −2.40
Difference −1.24 6.79 −7.91t −0.33 1.34 −1.44
Percent ElaboratingOverall 490 30.61 247 24.70 243 36.63 −11.93 −2.88*
Non-preferred mode 370 32.16 192 25.00 178 39.89 −14.89 −3.09*
Preferred mode 120 25.83 55 23.64 65 27.69 −4.06 −0.50
Difference 6.33 1.36 12.20t 1.31 0.21 1.75
Mean Number of ElaborationsOverall 150 1.46 61 1.34 89 1.54 −0.20 −1.47Non-preferred mode 119 1.45 48 1.40 71 1.49 −0.09 −0.62Preferred mode 31 1.48 13 1.15 18 1.72 −0.57 −2.50
Difference −0.03 0.24 −0.23t −0.19 0.95 −1.11
Two-tailed t-tests.* p < 0.01 ** p < 0.001 *** p < 0.0001
preferred mode (no significant interaction between form andmode preference, p = 0.58), nor did this relationship changewhen accounting for respondent characteristics (results notshown).
For both box sizes, 14% to 15% of respondents who an-swered in a non-preferred mode provided multiple themes(t = −0.30, p = 0.76). Among those responding in their
preferred mode, 7.27% of those who received the small boxprovided multiple themes compared to 23.08% of those whoreceived the large box. This difference is not statistically sig-nificant at the p < 0.01 level (t = −2.40, p = 0.02), but theresults suggest that the difference may be statistically signif-icant with a larger sample size.4
4 In multivariate logistic regression models separately estimated
https://ojs.ub.uni-konstanz.de/srm/article/view/5750/5587

144 JOLENE D. SMYTH, KRISTEN OLSON, AND ALIAN KASABIAN
Table 5Logistic regression coefficients and standard errors predicting item nonresponse to open-ended question(Q32)
Coef. SE Coef. SE Coef. SE
Large box 1.100** 0.328 1.148** 0.338 1.149** 0.339Responded in preferred mode 1.009 0.431 0.984 0.450 0.980 0.454Large box × responded in preferred mode −2.056* 0.658 −2.089* 0.681 −2.088* 0.681Female −0.377 0.291 −0.378 0.292Age −0.023 0.012 −0.023 0.012Rural −0.421 0.378 −0.420 0.378Income < $40K −0.444 0.397 −0.442 0.399Income missing 0.937 0.400 0.938 0.400Number of kids −0.037 0.154 −0.037 0.154Some college −0.568 0.371 −0.567 0.371BA or higher −0.409 0.339 −0.411 0.339Married −0.445 0.323 −0.445 0.323Employed full time −0.172 0.367 −0.173 0.368Employed part time −0.562 0.440 −0.564 0.442Responded in web 0.023 0.329Constant −2.618*** 0.277 −0.266 0.975 −0.274 0.981
LR chi2 15.60* 32.84* 32.86*
Pseudo R2 (in %) 3.73 7.92 7.92N 559 548 548
* p < 0.01 ** p < 0.001 *** p < 0.0001
Although there are bivariate effects of not participating inone’s preferred mode and answer box size on the percent whoelaborated on a theme, there are not differential effects ofanswer box size for those who participated versus did notparticipate in their preferred mode on the elaboration ratein multivariate logistic regression models controlling for re-spondent characteristics (multivariate results not shown). Wesee no significant effect of answer box size on the number ofelaborations overall or in multivariate models for any group.
Thus, answer box size had the same effect on the lengthof responses, providing multiple themes, and the provisionof elaborations across those answering in preferred and non-preferred modes, but had differential effects on item non-response for those who responded in their preferred vs.non-preferred mode. As was the case with the forcedchoice/check-all-that-apply experiments, where we see sta-tistically significant results, they occur among those respon-dents who did not participate in their preferred mode, whichis highly consistent with our hypothesis about this group.However, the findings for those answering in their preferredmode are more mixed. That they were not more likely toskip the question in the large answer box treatment is con-sistent with the hypothesis that they would be focused oncontent and less affected by form; however, the finding ofshorter answers in the small answer box treatment suggeststhat those answering in their preferred mode were affected
by the question format, although not more than or in differ-ent ways than their counterparts who were answering in anon-preferred mode.
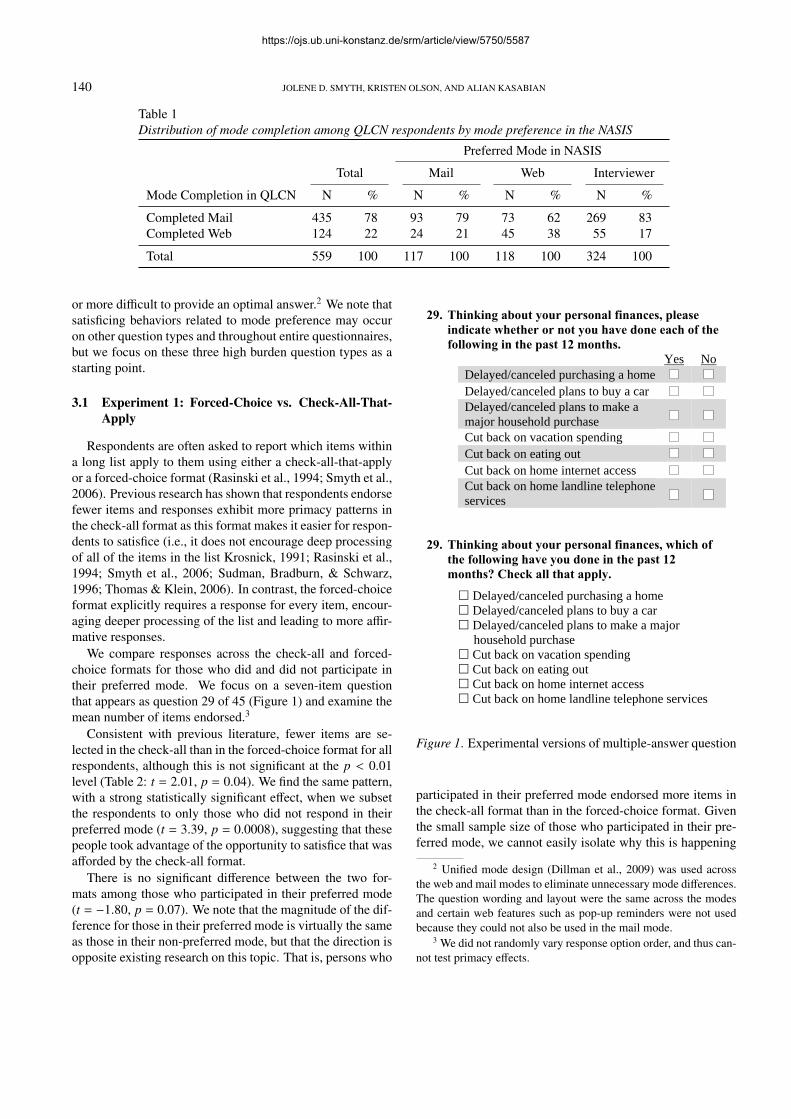
3.3 Experiment 3: Grid Questions
The grid format (i.e., matrices; Dillman et al. 2009) iscommonly used to save space by grouping questions thathave the same response options. In this format, respondentsdo not have to process a new question stem or the format ofthe response options after the first prompt, but they do haveto register their answer in the space that aligns with both therow of the item and the column of the desired response op-tion. This requires them to track both horizontally and verti-cally, which is burdensome. As respondents move to the rightand/or downward in the grid the two pieces of informationthey are trying to connect become further apart, making thetask even more difficult (Couper, 2008; Kaczmirek, 2011).As a result, the grid format often results in item missing dataand straightlining (Couper, Tourangeau, Conrad, & Zhang,2013; Tourangeau, Couper, & Conrad, 2004).
One possible way to reduce navigational and responseburden is by repeating the response option labels in every
for the two mode preference groups, the effect of form has a signif-icance level of p=0.02 for those who responded in their preferredmode, and a significance level of p=0.73 for those who did not re-spond in their preferred mode.
https://ojs.ub.uni-konstanz.de/srm/article/view/5750/5587
THE EFFECT OF ANSWERING IN A PREFERRED VERSUS A NON-PREFERRED SURVEY MODE ON MEASUREMENT 145
14. Please indicate how satisfied or dissatisfied you are with the availability of each of the following in your
community.
Very Dissatisfied Dissatisfied
Neither Satisfied nor Dissatisfied Satisfied
Very Satisfied
Parks
Very Diss.
Diss.
Neither
Sat.
Very Sat. Bicycle paths
Very Diss.
Diss.
Neither
Sat.
Very Sat. Outdoor areas to hunt, fish, or hike
Very Diss.
Diss.
Neither
Sat.
Very Sat. Sporting events
Very Diss.
Diss.
Neither
Sat.
Very Sat. Restaurants
Very Diss.
Diss.
Neither
Sat.
Very Sat. Fine arts (museums and theatres)
Very Diss.
Diss.
Neither
Sat.
Very Sat. Cell phone service
Very Diss.
Diss.
Neither
Sat.
Very Sat. Internet access
Very Diss.
Diss.
Neither
Sat.
Very Sat. Libraries
Very Diss.
Diss.
Neither
Sat.
Very Sat. 15. Please indicate whether or not you have each of
the following types of reading material in your home.
Fiction and literature books
Yes
No Non-fiction books
Yes
No Magazines
Yes
No Newspapers
Yes
No
16. Please indicate if each of the following statements
is true or false.
There are 25 or more books in your home right now.
True False
There is a variety of magazines and other reading materials in your home.
True False
17. Would you say your health in general is excellent,
very good, good, fair, or poor?
Excellent Very good Good Fair Poor
18. How would you rate your hearing?
Excellent Very good Good Fair Poor
19. How many days in the last week, including today, did you feel sad?
20. How many days in the last week, including today,
did you feel depressed?
21. How many days in the past week have you done
any exercise? When you consider exercise be sure to include walking, work around the house, or work on a job, if you think they constituted exercise.
Days of exercise (0 to 7)
22. How would you describe the job opportunities in your area?
Too few jobs available About the right number of jobs available Plenty of jobs available
23. Are you now employed full-time, part-time, or
not employed?
Full-time Part-time Not employed
2
Leisure and Health
Economics
14. Please indicate how satisfied or dissatisfied you are with the availability of each of the following in your community.
Very
Dissatisfied Dissatisfied
Neither Satisfied nor Dissatisfied Satisfied
Very Satisfied
Parks
Bicycle paths
Outdoor areas to hunt, fish, or hike
Sporting events
Restaurants
Fine arts (museums and theatres)
Cell phone service
Internet access
Libraries
15. Please indicate whether or not you have each of
the following types of reading material in your home.
Yes No Fiction and literature books
Non-fiction books
Magazines
Newspapers
16. Please indicate if each of the following statements
is true or false. There are 25 or more books in your home right now.
True False
There is a variety of magazines and other reading materials in your home.
True False
17. Would you say your health in general is excellent,
very good, good, fair, or poor?
Excellent Very good Good Fair Poor
18. How would you rate your hearing?
Excellent Very good Good Fair Poor
19. How many days in the last week, including today, did you feel sad?
Days (0 to 7)
20. How many days in the last week, including today,
did you feel depressed?
Days (0 to 7)
21. The next question is going to ask you about how
often you’ve engaged in exercise. We want you to include walking, anything you may do around the house, or work you do on a job if you think they constitute exercise. So using that definition, in the last week, on how many days did you do any exercise?
Days of exercise (0 to 7)
22. How would you describe the job opportunities in your area?
Plenty of jobs available About the right number of jobs available Too few jobs available
23. Are you now employed full-time, part-time, or
not employed?
Full-time Part-time Not employed
Leisure and Health
Economics
2
Figure 3. Experimental versions of grid item
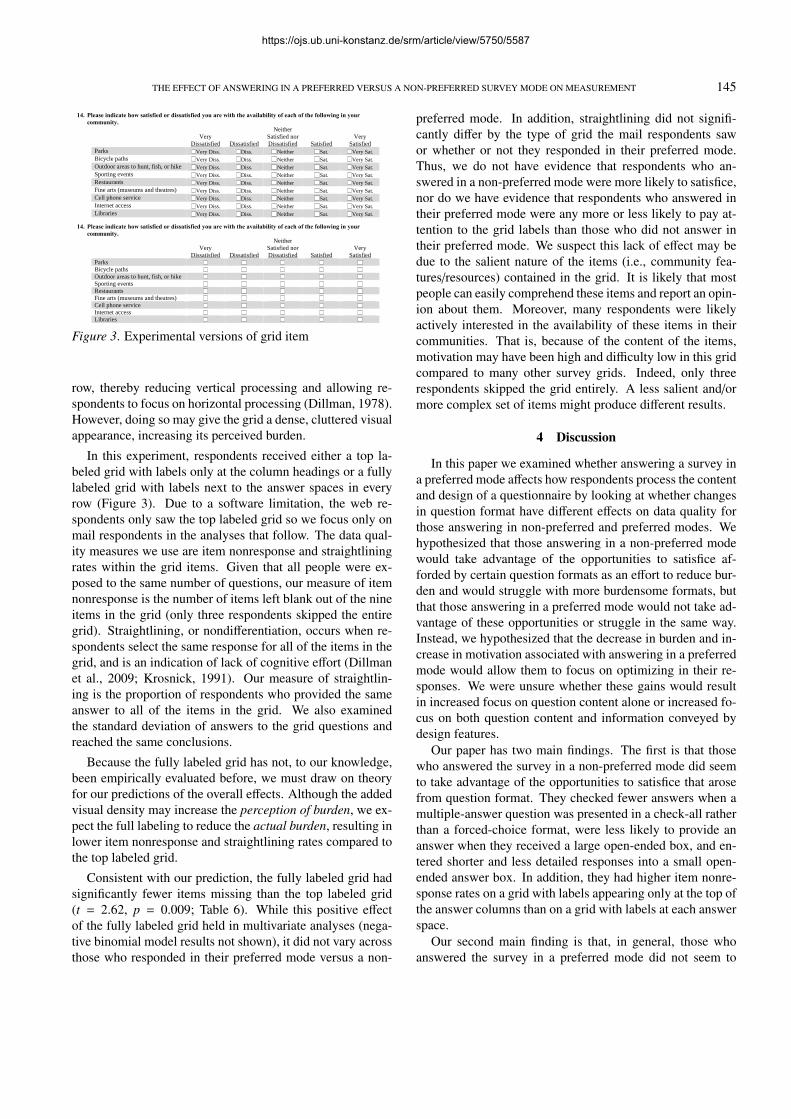
row, thereby reducing vertical processing and allowing re-spondents to focus on horizontal processing (Dillman, 1978).However, doing so may give the grid a dense, cluttered visualappearance, increasing its perceived burden.
In this experiment, respondents received either a top la-beled grid with labels only at the column headings or a fullylabeled grid with labels next to the answer spaces in everyrow (Figure 3). Due to a software limitation, the web re-spondents only saw the top labeled grid so we focus only onmail respondents in the analyses that follow. The data qual-ity measures we use are item nonresponse and straightliningrates within the grid items. Given that all people were ex-posed to the same number of questions, our measure of itemnonresponse is the number of items left blank out of the nineitems in the grid (only three respondents skipped the entiregrid). Straightlining, or nondifferentiation, occurs when re-spondents select the same response for all of the items in thegrid, and is an indication of lack of cognitive effort (Dillmanet al., 2009; Krosnick, 1991). Our measure of straightlin-ing is the proportion of respondents who provided the sameanswer to all of the items in the grid. We also examinedthe standard deviation of answers to the grid questions andreached the same conclusions.
Because the fully labeled grid has not, to our knowledge,been empirically evaluated before, we must draw on theoryfor our predictions of the overall effects. Although the addedvisual density may increase the perception of burden, we ex-pect the full labeling to reduce the actual burden, resulting inlower item nonresponse and straightlining rates compared tothe top labeled grid.
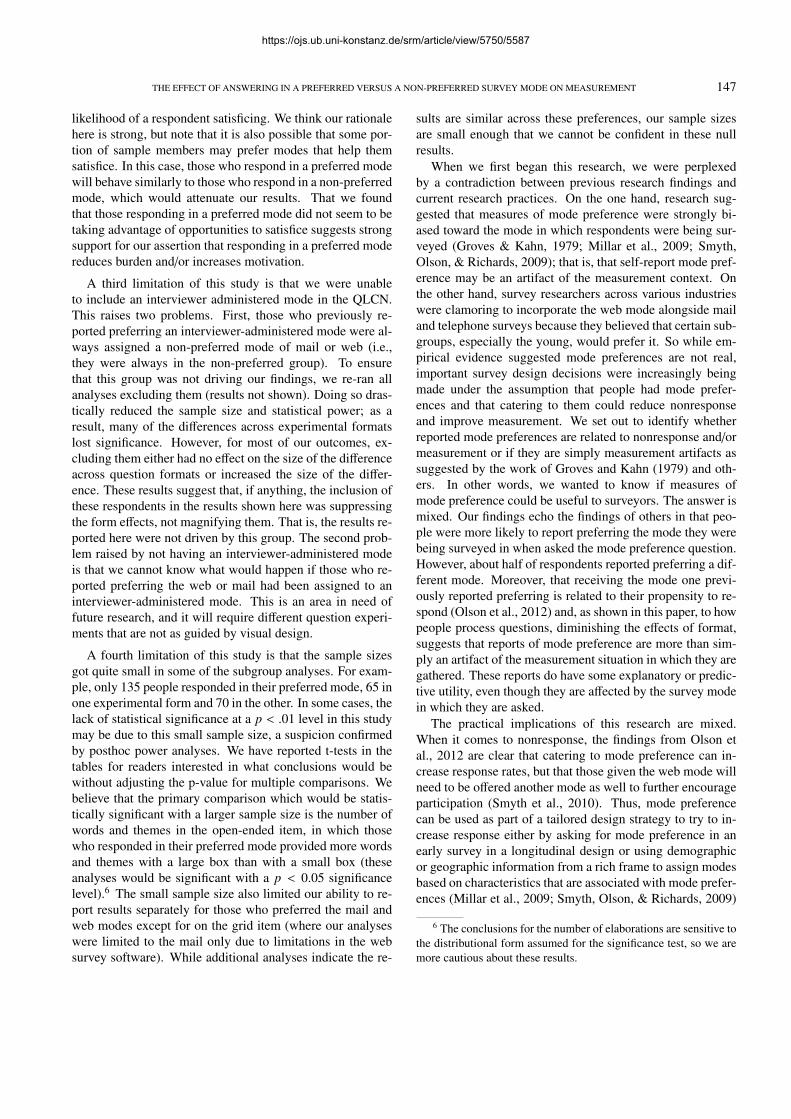
Consistent with our prediction, the fully labeled grid hadsignificantly fewer items missing than the top labeled grid(t = 2.62, p = 0.009; Table 6). While this positive effectof the fully labeled grid held in multivariate analyses (nega-tive binomial model results not shown), it did not vary acrossthose who responded in their preferred mode versus a non-
preferred mode. In addition, straightlining did not signifi-cantly differ by the type of grid the mail respondents sawor whether or not they responded in their preferred mode.Thus, we do not have evidence that respondents who an-swered in a non-preferred mode were more likely to satisfice,nor do we have evidence that respondents who answered intheir preferred mode were any more or less likely to pay at-tention to the grid labels than those who did not answer intheir preferred mode. We suspect this lack of effect may bedue to the salient nature of the items (i.e., community fea-tures/resources) contained in the grid. It is likely that mostpeople can easily comprehend these items and report an opin-ion about them. Moreover, many respondents were likelyactively interested in the availability of these items in theircommunities. That is, because of the content of the items,motivation may have been high and difficulty low in this gridcompared to many other survey grids. Indeed, only threerespondents skipped the grid entirely. A less salient and/ormore complex set of items might produce different results.
4 Discussion
In this paper we examined whether answering a survey ina preferred mode affects how respondents process the contentand design of a questionnaire by looking at whether changesin question format have different effects on data quality forthose answering in non-preferred and preferred modes. Wehypothesized that those answering in a non-preferred modewould take advantage of the opportunities to satisfice af-forded by certain question formats as an effort to reduce bur-den and would struggle with more burdensome formats, butthat those answering in a preferred mode would not take ad-vantage of these opportunities or struggle in the same way.Instead, we hypothesized that the decrease in burden and in-crease in motivation associated with answering in a preferredmode would allow them to focus on optimizing in their re-sponses. We were unsure whether these gains would resultin increased focus on question content alone or increased fo-cus on both question content and information conveyed bydesign features.
Our paper has two main findings. The first is that thosewho answered the survey in a non-preferred mode did seemto take advantage of the opportunities to satisfice that arosefrom question format. They checked fewer answers when amultiple-answer question was presented in a check-all ratherthan a forced-choice format, were less likely to provide ananswer when they received a large open-ended box, and en-tered shorter and less detailed responses into a small open-ended answer box. In addition, they had higher item nonre-sponse rates on a grid with labels appearing only at the top ofthe answer columns than on a grid with labels at each answerspace.
Our second main finding is that, in general, those whoanswered the survey in a preferred mode did not seem to
https://ojs.ub.uni-konstanz.de/srm/article/view/5750/5587

146 JOLENE D. SMYTH, KRISTEN OLSON, AND ALIAN KASABIAN
Table 6Item nonresponse and straightlining rates for top labeled versus fully labeled grids by whetherrespondents responded in their preferred mode, mail respondents only
Overall Top Labeled Fully Labeled
N Mean % N Mean % N Mean % Diff. t
Mean Number of Missing ItemsOverall 433 0.31 205 0.46 228 0.18 0.28 2.62*
Non-preferred mode 341 0.30 162 0.41 179 0.19 0.22 2.02Preferred mode 92 0.37 43 0.63 49 0.14 0.49 1.69
Difference −0.07 −0.21 0.05t −0.56 −0.90 0.39
Percent StraightliningOverall 430 8.37 203 8.37 227 7.05 1.33 0.51Non-preferred mode 339 7.96 161 8.70 178 7.30 1.39 0.47Preferred mode 91 6.59 42 7.14 49 6.12 1.02 0.19
Difference 1.37 1.55 1.18t 0.44 0.32 0.28
Mail cases only; Two tailed t-tests:* p < 0.01 ** p < 0.001 *** p < 0.0001
take advantage of the opportunities to satisfice afforded byquestion format. There were few differences in the variousdata quality outcomes across the different formats for thosewho responded in their preferred mode. Overall, the lackof differences is consistent with the hypothesis that thosewho received their preferred mode were able to focus on thecontent of the question and were less affected by formattingdifferences than those who received a non-preferred mode.Where there were differences across formats for this group(e.g., more themes in the larger answer box and less itemnonresponse in the fully labeled grid), the differences weresimilar to those that occurred among respondents answeringin a non-preferred mode but also in a way that suggestedmore motivation (less item nonresponse, more themes).
Like all studies, this one has limitations. One possiblelimitation is that all of the QLCN respondents were previoussurvey participants who were willing to participate in futurestudies. Thus, this is a more cooperative sample than thegeneral population. If this cooperative nature translates intohigher motivation while responding to the survey, we wouldexpect an attenuation of our effects as even our most un-motivated respondents (those responding in a non-preferredmode) are fairly highly motivated compared to the generalpopulation. Thus, our comparisons of the effect of formacross those who did and did not complete the survey in theirpreferred mode may be somewhat conservative. That said,the form effects that we found overall are consistent withthose reported in previous research. For example, we foundthat overall the forced-choice format yielded an additional0.25 items selected while previous studies have found that it
yielded increases ranging from 0.17 to 0.52 items selected insimilar behavior-type questions5 (Smyth et al., 2008, 2006;Thomas & Klein, 2006). We also found that the large an-swer box yielded an additional 2.78 words over the smallbox compared to increases ranging from 1.8 to 7.9 reportedin previous studies where the answer box size is doubled(Christian & Dillman, 2004; Israel, 2010). One exception isthat we found that the large open-ended box increased itemnonresponse by about six percentage points while previousstudies have not found increases in item nonresponse as aresult of answer box size; however, the previous studies wereconducted via the web and were limited to specialized popu-lations such as college students and Florida Extension users(Israel, 2010; Smyth, Dillman, Christian, & McBride, 2009).
While the use of multiple surveys likely resulted in a morecooperative sample, it is also a unique strength of this studyin that it allowed us to measure mode preference separatelyfrom and prior to the collection of the data assessed for qual-ity. Thus, we avoid the endogeneity problem that arises whenthese outcomes are measured simultaneously. Moreover,inasmuch as measuring mode preference and then catering toit in this way is only possible with multiple survey contacts,this limitation may be endemic to all work of this nature.
A second possible limitation is that our hypotheses as-sume that responding in one’s preferred mode will lower the
5 We limit the comparisons here to behavior and event ques-tions similar to the item in the QLCN because Smyth, Dillman, andChristian (2008, 2006) found that attitude and opinion questionsyielded even larger differences.
https://ojs.ub.uni-konstanz.de/srm/article/view/5750/5587
THE EFFECT OF ANSWERING IN A PREFERRED VERSUS A NON-PREFERRED SURVEY MODE ON MEASUREMENT 147
likelihood of a respondent satisficing. We think our rationalehere is strong, but note that it is also possible that some por-tion of sample members may prefer modes that help themsatisfice. In this case, those who respond in a preferred modewill behave similarly to those who respond in a non-preferredmode, which would attenuate our results. That we foundthat those responding in a preferred mode did not seem to betaking advantage of opportunities to satisfice suggests strongsupport for our assertion that responding in a preferred modereduces burden and/or increases motivation.
A third limitation of this study is that we were unableto include an interviewer administered mode in the QLCN.This raises two problems. First, those who previously re-ported preferring an interviewer-administered mode were al-ways assigned a non-preferred mode of mail or web (i.e.,they were always in the non-preferred group). To ensurethat this group was not driving our findings, we re-ran allanalyses excluding them (results not shown). Doing so dras-tically reduced the sample size and statistical power; as aresult, many of the differences across experimental formatslost significance. However, for most of our outcomes, ex-cluding them either had no effect on the size of the differenceacross question formats or increased the size of the differ-ence. These results suggest that, if anything, the inclusion ofthese respondents in the results shown here was suppressingthe form effects, not magnifying them. That is, the results re-ported here were not driven by this group. The second prob-lem raised by not having an interviewer-administered modeis that we cannot know what would happen if those who re-ported preferring the web or mail had been assigned to aninterviewer-administered mode. This is an area in need offuture research, and it will require different question experi-ments that are not as guided by visual design.
A fourth limitation of this study is that the sample sizesgot quite small in some of the subgroup analyses. For exam-ple, only 135 people responded in their preferred mode, 65 inone experimental form and 70 in the other. In some cases, thelack of statistical significance at a p < .01 level in this studymay be due to this small sample size, a suspicion confirmedby posthoc power analyses. We have reported t-tests in thetables for readers interested in what conclusions would bewithout adjusting the p-value for multiple comparisons. Webelieve that the primary comparison which would be statis-tically significant with a larger sample size is the number ofwords and themes in the open-ended item, in which thosewho responded in their preferred mode provided more wordsand themes with a large box than with a small box (theseanalyses would be significant with a p < 0.05 significancelevel).6 The small sample size also limited our ability to re-port results separately for those who preferred the mail andweb modes except for on the grid item (where our analyseswere limited to the mail only due to limitations in the websurvey software). While additional analyses indicate the re-
sults are similar across these preferences, our sample sizesare small enough that we cannot be confident in these nullresults.
When we first began this research, we were perplexedby a contradiction between previous research findings andcurrent research practices. On the one hand, research sug-gested that measures of mode preference were strongly bi-ased toward the mode in which respondents were being sur-veyed (Groves & Kahn, 1979; Millar et al., 2009; Smyth,Olson, & Richards, 2009); that is, that self-report mode pref-erence may be an artifact of the measurement context. Onthe other hand, survey researchers across various industrieswere clamoring to incorporate the web mode alongside mailand telephone surveys because they believed that certain sub-groups, especially the young, would prefer it. So while em-pirical evidence suggested mode preferences are not real,important survey design decisions were increasingly beingmade under the assumption that people had mode prefer-ences and that catering to them could reduce nonresponseand improve measurement. We set out to identify whetherreported mode preferences are related to nonresponse and/ormeasurement or if they are simply measurement artifacts assuggested by the work of Groves and Kahn (1979) and oth-ers. In other words, we wanted to know if measures ofmode preference could be useful to surveyors. The answer ismixed. Our findings echo the findings of others in that peo-ple were more likely to report preferring the mode they werebeing surveyed in when asked the mode preference question.However, about half of respondents reported preferring a dif-ferent mode. Moreover, that receiving the mode one previ-ously reported preferring is related to their propensity to re-spond (Olson et al., 2012) and, as shown in this paper, to howpeople process questions, diminishing the effects of format,suggests that reports of mode preference are more than sim-ply an artifact of the measurement situation in which they aregathered. These reports do have some explanatory or predic-tive utility, even though they are affected by the survey modein which they are asked.
The practical implications of this research are mixed.When it comes to nonresponse, the findings from Olson etal., 2012 are clear that catering to mode preference can in-crease response rates, but that those given the web mode willneed to be offered another mode as well to further encourageparticipation (Smyth et al., 2010). Thus, mode preferencecan be used as part of a tailored design strategy to try to in-crease response either by asking for mode preference in anearly survey in a longitudinal design or using demographicor geographic information from a rich frame to assign modesbased on characteristics that are associated with mode prefer-ences (Millar et al., 2009; Smyth, Olson, & Richards, 2009)
6 The conclusions for the number of elaborations are sensitive tothe distributional form assumed for the significance test, so we aremore cautious about these results.
https://ojs.ub.uni-konstanz.de/srm/article/view/5750/5587
148 JOLENE D. SMYTH, KRISTEN OLSON, AND ALIAN KASABIAN
for a cross sectional design.When it comes to measurement, more research is needed
before firm recommendations can be made. This researchshould examine the effects of answering in a preferred versusa non-preferred mode on different types of questions (i.e., at-titude, behavior, etc.); across different question formats (i.e.,rating scales, list-style open-ends, etc.); across low and highburden questions; across socially desirable and undesirablequestions, and in telephone and face-to-face modes. Thispaper is a first examination of whether there is a relation-ship between answering in a preferred mode and the qualityof survey responses. That it shows such a relationship doesexist should be a catalyst for further research on this topic.
Acknowledgments
The authors thank the Bureau of Sociological Researchat the University of Nebraska-Lincoln for access to the NA-SIS data and Dan Hoyt for support in collecting the ini-tial mode preference questions. Additional data collectionwas supported by a University of Nebraska-Lincoln Officeof Research Layman Award to K.O. (PI). Analysis of thesedata was supported by Cooperative Agreement #58-3AEU-0-0020 between the University of Nebraska-Lincoln (PIsSmyth and Olson) and the U.S. Department of AgricultureNational Agricultural Statistics Service, supported by theNational Center for Science and Engineering Statistics of theNational Science Foundation. The authors also thank theanonymous reviewers for their careful and thoughtful com-ments.
References
American Association for Public Opinion Research.(2011). Standard definitions: final dispositionsof case codes and outcome rates for surveys.Retrieved from http : / / aapor . org / Content /
NavigationMenu/AboutAAPOR/StandardsampEthics/StandardDefinitions/StandardDefinitions2011.pdf
Bradburn, N., Sudman, S., & Wansink, B. (2004). Ask-ing questions: the definitive guide to questionnairedesign—for market research, political polls, and socialand health questionnaires. San Francisco, CA: Jossey-Bass.
Christian, L. M. & Dillman, D. A. (2004). The influence ofgraphical and symbolic language manipulations on re-sponses to self-administered questions. Public Opin-ion Research, 68, 57–80.
Couper, M. P. (2008). Designing effective web surveys. NewYork: Cambridge University Press.
Couper, M. P., Tourangeau, R., Conrad, F. G., & Zhang, C.(2013). The design of grids in web surveys. Social Sci-ence Computer Review, 31, 322–345.
de Leeuw, E. (2005). To mix or not to mix data collectionmodes in surveys. Journal of Official Statistics, 21,233–255.
Dillman, D. A. (1978). Mail and telephone surveys: the totaldesign method. New York: John Wiley & Sons.
Dillman, D. A., Smyth, J. D., & Christian, L. M. (2009). In-ternet, mail and mixed-mode surveys: the tailored de-sign method (3rd ed.). New York: John Wiley & Sons.
Groves, R. M. & Kahn, R. L. (1979). Surveys by telephone.New York: John Wiley & Sons.
Iannacchione, V. G. (2011). The changing role of address-based sampling in survey research. Public OpinionQuarterly, 75, 556–575.
Israel, G. D. (2010). Effects of answer space size on re-sponses to open-ended questions in mail surveys. Jour-nal of Official Statistics, 26, 271–285.
Kaczmirek, L. (2011). Attention and usability in Internet sur-veys: effects of visual feedback in grid questions. InM. Das, P. Ester, & L. Kaczmirek (Eds.), Social andbehavioral research and the Internet: advances in ap-plied methods and research strategies (pp. 191–214).New York: Routledge.
Kalsbeek, W. D. & Agans, R. P. (2008). Sampling andweighting in household telephone surveys. In J. M.Lepkowski, C. Tucker, J. M. Brick, E. D. de Leeuw,L. Japec, P. J. Lavrakas, . . . R. L. Sangster (Eds.), Ad-vances in telephone survey methodology (pp. 29–55).Hoboken, NJ: John Wiley & Sons.
Krosnick, J. A. (1991). Response strategies for coping withthe cognitive demands of attitude measures in surveys.Applied Cognitive Psychology, 5, 213–236.
Krosnick, J. A. & Alwin, D. F. (1987). An evaluation ofa cognitive theory of response-order effects in surveymeasurement. Public Opinion Quarterly, 51, 201–219.
Krosnick, J. A., Narayan, S. S., & Smith, W. R. (1996). Sat-isficing in surveys: initial evidence. In M. T. Braver-man & J. K. Slater (Eds.), Advances in survey research(pp. 29–44). San Francisco: Jossey-Bass.
Millar, M. M., O’Neill, A. C., & Dillman, D. A. (2009).Are mode preferences real? Technical Report 09-003of the Social and Economic Sciences Research Center,Washington State University, Pullman, WA.
Olson, K., Smyth, J. D., & Wood, H. (2012). Does giv-ing people their preferred survey mode actually in-crease survey participation? an experimental examina-tion. Public Opinion Quarterly, 76, 611–635.
Rasinski, K. A., Mingay, D., & Bradburn, N. M. (1994).Do respondents really ‘mark all that apply’ on self-administered questions? Public Opinion Quarterly, 58,400–408.
Shih, X., T. Fan. (2002). Response rates and mode pref-erences in web-mail mixed-mode surveys: a meta-
https://ojs.ub.uni-konstanz.de/srm/article/view/5750/5587
THE EFFECT OF ANSWERING IN A PREFERRED VERSUS A NON-PREFERRED SURVEY MODE ON MEASUREMENT 149
analysis. International Journal of Internet Science, 2,59–82.
Smyth, J. D., Dillman, D. A., & Christian, L. M. (2008).Does ‘yes or no’ on the telephone mean the sameas ‘check-all-that-apply’ on the web? Public OpinionQuarterly, 72, 103–113.
Smyth, J. D., Dillman, D. A., Christian, L. M., & McBride,M. (2009). Open-ended questions in web surveys: canincreasing the size of answer boxes and providing ex-tra verbal instructions improve response quality? Pub-lic Opinion Quarterly, 73, 325–337.
Smyth, J. D., Dillman, D. A., Christian, L. M., & O’Neill,A. C. (2010). Using the Internet to survey small townsand communities: limitations and possibilities in theearly 21 century. American Behavioral Scientist, 53,1423–1448.
Smyth, J. D., Dillman, D. A., Christian, L. M., & Stern, M. J.(2006). Comparing check-all and forced-choice ques-tion formats in web surveys. Public Opinion Quar-terly, 70, 66–77.
Smyth, J. D. & Olson, K. (2011). Comparing numeric andtext open-end responses in mail and web surveys. Pa-per presented at the Annual Meeting of the AmericanAssociation of Public Opinion Research, May 11–15,Phoenix, AZ.
Smyth, J. D., Olson, K., & Richards, A. (2009). Unravel-ing mode preference. Presented at the annual meetingof the American Association for Public Opinion Re-search, Hollywood, FL. May ,14–17, 2009.
Stern, M. J., Dillman, D. A., & Smyth, J. D. (2007). Visualdesign, order effects and respondent characteristics ina self-administered survey. Survey Research Methods,1, 121–138.
Sudman, S., Bradburn, N. M., & Schwarz, N. (1996). Think-ing about answers: the application of cognitive pro-cesses to survey methodology. San Francisco, CA:Jossey-Bass.
Thomas, R. K. & Klein, J. D. (2006). Merely incidental?effects of response format on self-reported behavior.Journal of Official Statistics, 22, 221–244.
Tourangeau, R., Couper, M. P., & Conrad, F. (2004). Spacing,position, and order: interpretive heuristics for visualfeatures of survey questions. Public Opinion Quar-terly, 68, 368–393.
Tourangeau, R., Rips, L. J., & Rasinski, K. (2000). The psy-chology of survey response. New York: CambridgeUniversity Press.
https://ojs.ub.uni-konstanz.de/srm/article/view/5750/5587

150 JOLENE D. SMYTH, KRISTEN OLSON, AND ALIAN KASABIAN
AppendixQuestion Wording
Mode Preference If you received a request to do anothersurvey like this one, would you prefer to participate inan in-person interview at your home, an interview onyour home phone, an interview on your cell phone, apaper survey sent by mail, or a survey on the Internet?
Willingness We are in the process of putting together a listof people who are willing to be contacted in the fu-ture to be a part of additional social research projects.Would you be willing to be contacted again by re-searchers at the University of Nebraska-Lincoln to par-ticipate in a similar research study?
https://ojs.ub.uni-konstanz.de/srm/article/view/5750/5587
THE EFFECT OF ANSWERING IN A PREFERRED VERSUS A NON-PREFERRED SURVEY MODE ON MEASUREMENT 151
Table A1Distribution of mode assignment among QLCN respondents by mode preference in the NASIS
Preferred Mode in NASIS
Total Mail Web Interviewer
Mode Assignment in QLCN N % N % N % N %
Assigned Mail First 315 56 68 58 58 49 189 58Assigned Web First 244 44 49 42 60 51 133 42
Table A2Mean number of items selected in the forced-choice and check-all formatsby whether respondents were assigned to their preferred mode
Forced CheckChoice All Difference t
Overall 1.69 1.43 0.25 2.01Assigned non-preferred mode 1.74 1.37 0.37 2.60*
Assigned preferred mode 1.47 1.63 −0.16 −0.60
Two-tailed t-tests* p < 0.01 ** p < 0.001 *** p < 0.0001
Table A3Data quality outcomes for open-ended question by whether respondents were as-signed to their preferred mode
Small Box Large Box Difference t
Item Nonresponse RateOverall 9.19 15.33 −6.14 −2.21Assigned Non-preferred mode 7.01 16.44 −9.42 −3.07*
Assigned preferred mode 17.24 11.76 5.48 0.87
Mean Number of WordsOverall 5.09 7.87 −2.78 −4.78**
Assigned Non-preferred mode 5.15 7.81 −2.66 −4.08**
Assigned preferred mode 4.85 8.07 −3.21 −2.46
Percent with 2 or more ThemesOverall 12.55 17.28 −4.73 −1.47Assigned Non-preferred mode 14.07 16.39 −2.32 −0.63Assigned preferred mode 6.25 20.00 −13.75 −2.08
Percent ElaboratingOverall 24.70 36.63 −11.92 −2.88*
Assigned Non-preferred mode 23.12 39.89 −16.77 −3.59**
Assigned preferred mode 31.25 26.67 4.58 0.52
Mean Number of ElaborationsOverall 1.34 1.54 −0.20 −1.47Assigned Non-preferred mode 1.39 1.48 −0.09 −0.57Assigned preferred mode 1.20 1.81 −0.61 −2.56
Two-tailed t-tests* p < 0.01 ** p < 0.001 *** p < 0.0001
https://ojs.ub.uni-konstanz.de/srm/article/view/5750/5587
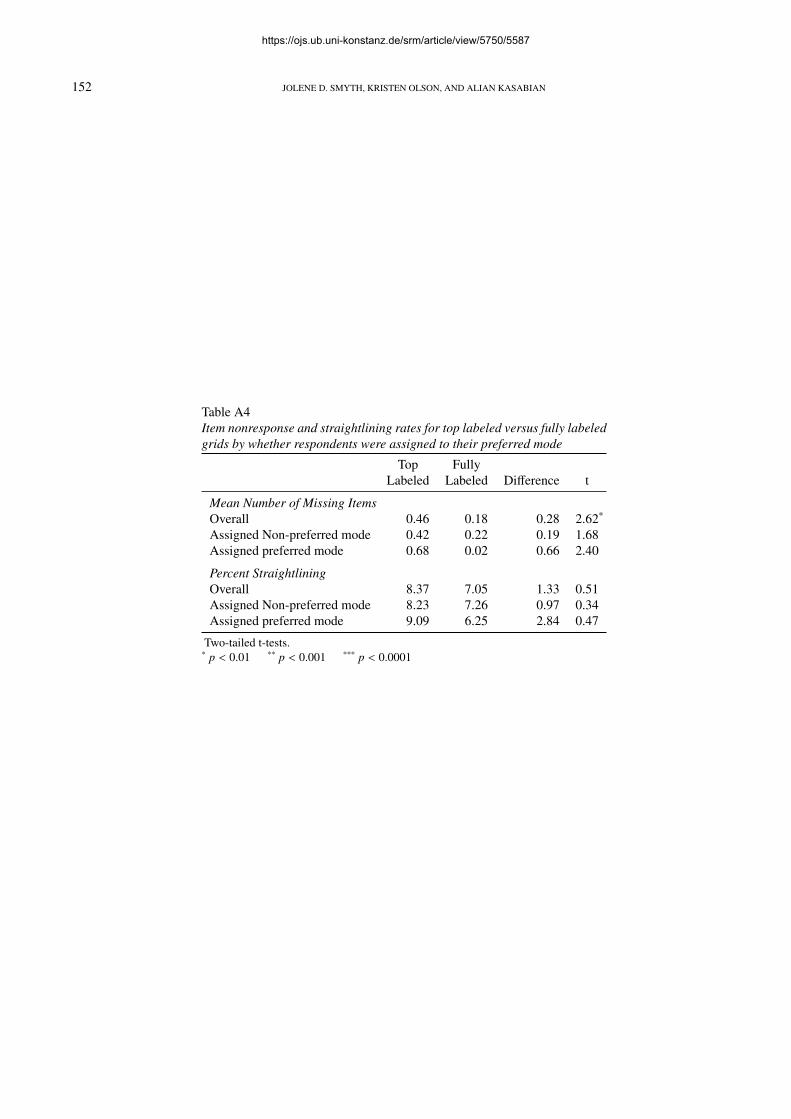
152 JOLENE D. SMYTH, KRISTEN OLSON, AND ALIAN KASABIAN
Table A4Item nonresponse and straightlining rates for top labeled versus fully labeledgrids by whether respondents were assigned to their preferred mode
Top FullyLabeled Labeled Difference t
Mean Number of Missing ItemsOverall 0.46 0.18 0.28 2.62*
Assigned Non-preferred mode 0.42 0.22 0.19 1.68Assigned preferred mode 0.68 0.02 0.66 2.40
Percent StraightliningOverall 8.37 7.05 1.33 0.51Assigned Non-preferred mode 8.23 7.26 0.97 0.34Assigned preferred mode 9.09 6.25 2.84 0.47
Two-tailed t-tests.* p < 0.01 ** p < 0.001 *** p < 0.0001
https://ojs.ub.uni-konstanz.de/srm/article/view/5750/5587