Rocket and ground-based study of an auroral breakup event
13
Planet. Space Sci., Vol. 31, No. 2, pp. 207-220, 1983 Printed in Great Britain. 00324633/83/020207-13903.00/O Pergamon Press Ltd. ROCKET AND GROUND-BASED STUDY OF AN AURORAL BREAKUP EVENT G. MARKLUND,* W. BAUMJOHANNt and I. SANDAHLf *Department of Plasma Physics, Royal Institute of Technology S-100 44 Stockholm, Sweden t Institut fiir Geophysik der Universitlt Miinster, D-4400 Miinster, Germany $ Kiruna Geophysical Institute S-981 27 Kiruna, Sweden (Receioed injinal,form 8 July 1982) Abstract&On 27 January, 1979 the Substorm-GEOS rocket S23H was launched from ESRANGE, Kiruna, shortly after the onset of an intense magnetospheric substorm over northern Scandinavia. Rocket electric field and particle observations have been used to calculate ionospheric currents and heating rates. These results are generally consistent with the ground magnetic(SMA*) and optical (all-sky, TV) observations. An important finding emerging from a comparison of this event with a pre-breakup event earlier on this day (Marklund etal., 1982) is that the ionospheric substorm-related electric field could be split up into two parts, namely: (1) an ambient LT dependent field, probably of magnetospheric origin; (2) superimposed on this a small-scale electric field associated with the bright aurora1 structures, being southward for both events. This is shown to have important consequences on the location of the ionospheric currents and the Joule energy dissipation relative to the aurora1 forms. For example, in the pre-breakup arc, Joule energy dissipation and particle energy flux were found to be anti-correlated, while in the breakup case correlated. 1. INTRODUCTION Recent progress within the field of aurora1 substorms is largely a result of the strong efforts being made to coordinate space and ground observations in a systematic way. Since in situ observations by satellites, rockets or balloons are point-measurements that connect to very localized regions in the ionosphere, meaningful correlation studies profit greatly from a dense and extensive network of ground observations. An excellent example of the latter is the geophysical network operated during the IMS in northern Scandinavia with the Scandinavian Magnetometer Array, SMA (Maurer and Theile, 1978 ; Kiippers et ul., 1979), the Finnish riometer and all-sky camera chains and the STARE radars (Scandinavian Twin Aurora1 Radar Experiment, Greenwald et al., 1978). The purpose of this paper is to point out some important and characteristic features of the electro- dynamics associated with aurora1 forms during an aurora1 breakup event. The results are based on ground observations from the IMS-network mentioned above and high resolution rocket electric field and particle observations made on the Substorm-GEOS rocket S23H, launched from ESRANGE, Kiruna on 27 January, 1979 during an intense magnetospheric substorm over northern Scandinavia (cf. Fig. 1). * Scandinavian Magnetometer Array (SMA). Comparisons are also made with the results from a similar study but of a pre-breakup arc occurring earlier this evening (Marklund et al., 1982). This reveals a number of interesting differences between the two events. In particular we shall discuss characteristics of the substorm-associated electric field, ionospheric currents and power dissipation during a time period of about 15 minutes after substorm onset. Associated with a breakup event is the well known expansion to the West and North of the region of enhanced aurora1 activity which is known as the Westward Travelling Surge. From a number of studies the WTS is believed to form the leading edge of the substorm enhanced westward electrojet and to carry the western localized upward field aligned current (Inhester et al., 1981; Opgenoorth et al., 1980). Together with a more extended and less well defined downward current region to the East ofthe onset region, this is the typical current wedge associated with aurora1 breakups. As has been shown by e.g. Baumjohann et al. (1981), this closure current may at least partly be a Cowling current formed within the high-conductivity channel generated behind the leading edge ofthe surge. For an ideal Cowling channel, where Birkeland currents are impeded at the northern and southern boundaries, the Pedersen current due to the southward polarisation electric field must balance the enhanced northward Hall current caused by the westward component of the primary electric field 207
Transcript of Rocket and ground-based study of an auroral breakup event

Planet. Space Sci., Vol. 31, No. 2, pp. 207-220, 1983 Printed in Great Britain.
00324633/83/020207-13903.00/O Pergamon Press Ltd.
ROCKET AND GROUND-BASED STUDY OF AN AURORAL BREAKUP EVENT
G. MARKLUND,* W. BAUMJOHANNt and I. SANDAHLf
*Department of Plasma Physics, Royal Institute of Technology S-100 44 Stockholm, Sweden t Institut fiir Geophysik der Universitlt Miinster, D-4400 Miinster, Germany
$ Kiruna Geophysical Institute S-981 27 Kiruna, Sweden
(Receioed injinal,form 8 July 1982)
Abstract&On 27 January, 1979 the Substorm-GEOS rocket S23H was launched from ESRANGE, Kiruna, shortly after the onset of an intense magnetospheric substorm over northern Scandinavia. Rocket electric field and particle observations have been used to calculate ionospheric currents and heating rates. These results are generally consistent with the ground magnetic(SMA*) and optical (all-sky, TV) observations. An important finding emerging from a comparison of this event with a pre-breakup event earlier on this day (Marklund et al., 1982) is that the ionospheric substorm-related electric field could be split up into two parts, namely:
(1) an ambient LT dependent field, probably of magnetospheric origin; (2) superimposed on this a small-scale electric field associated with the bright aurora1 structures, being
southward for both events.
This is shown to have important consequences on the location of the ionospheric currents and the Joule energy dissipation relative to the aurora1 forms. For example, in the pre-breakup arc, Joule energy dissipation and particle energy flux were found to be anti-correlated, while in the breakup case correlated.
1. INTRODUCTION
Recent progress within the field of aurora1 substorms is largely a result of the strong efforts being made to coordinate space and ground observations in a systematic way. Since in situ observations by satellites, rockets or balloons are point-measurements that connect to very localized regions in the ionosphere, meaningful correlation studies profit greatly from a dense and extensive network of ground observations. An excellent example of the latter is the geophysical network operated during the IMS in northern Scandinavia with the Scandinavian Magnetometer Array, SMA (Maurer and Theile, 1978 ; Kiippers et ul., 1979), the Finnish riometer and all-sky camera chains and the STARE radars (Scandinavian Twin Aurora1 Radar Experiment, Greenwald et al., 1978).
The purpose of this paper is to point out some important and characteristic features of the electro- dynamics associated with aurora1 forms during an aurora1 breakup event. The results are based on ground observations from the IMS-network mentioned above and high resolution rocket electric field and particle observations made on the Substorm-GEOS rocket S23H, launched from ESRANGE, Kiruna on 27 January, 1979 during an intense magnetospheric substorm over northern Scandinavia (cf. Fig. 1).
* Scandinavian Magnetometer Array (SMA).
Comparisons are also made with the results from a similar study but of a pre-breakup arc occurring earlier this evening (Marklund et al., 1982). This reveals a number of interesting differences between the two events.
In particular we shall discuss characteristics of the
substorm-associated electric field, ionospheric currents and power dissipation during a time period of about 15 minutes after substorm onset. Associated with a breakup event is the well known expansion to the West and North of the region of enhanced aurora1 activity which is known as the Westward Travelling Surge. From a number of studies the WTS is believed to form the leading edge of the substorm enhanced westward electrojet and to carry the western localized upward field aligned current (Inhester et al., 1981; Opgenoorth et al., 1980). Together with a more extended and less well defined downward current region to the East ofthe onset region, this is the typical current wedge associated with aurora1 breakups. As has been shown by e.g. Baumjohann et al. (1981), this closure current may at least partly be a Cowling current formed within the high-conductivity channel generated behind the leading edge ofthe surge. For an ideal Cowling channel, where Birkeland currents are impeded at the northern and southern boundaries, the Pedersen current due to the southward polarisation electric field must balance the enhanced northward Hall current caused by the westward component of the primary electric field
207
208 G. MARKLUND et al.
Q +200nT
+ +X0 nT
$ +200 nT
L
/ f
r
20 22 Time (UT)
Jan. 1979
FIG. 1. KIRUNAMAGNETOGRAM~~-~~JANUARY 1979.
(Bostriim, 1964). In a realistic case current continuity is ensured by a polarisation electric fieid as well as by Birkeland currents, as will be demonstrated later.
The region covered by the surge is typically strongly inhomogeneous with a concentration of intense auroras close to the front and nonuniform diffuse auroras (Meng et al., 1978)further back. The equivalent ionospheric current pattern inferred from the ground magnetometer observations does however seem to be fairly homogeneous and last for much longer time than would be expected from the time constants for decay of the ionospheric conductivity as the precipitation becomes weaker. It is of interest to find out whether the typical large scale electrodynamical features in the active region behind the surge are also characteristic of the small-scale localized aurora1 forms, of which one was passed by the rocket.
2. INSTRUMENTATION
Rocket instrumentation The Royal Institute of Technology (RIT) double
probe electric field experiment carried out instan- taneous electric field measurements with a time resolution of 2 ms and local plasma diagnostic measurements with 5 s intervals, providing information on local electron density and temperature. A detailed
description of this experiment is given elsewhere (Marklund et al., 1981). By subtraction of the v x B
contribution the electric field signal was transformed to an Earth-fixed system, namely the Kiruna system described below.
Measurements of electrons and positive ions were performed over a wide range of energies by the Kiruna Geophysical Institute (KGI) particle detectors. Between about 12 eV and 30 keV ten electrostatic analyzers were used and above 40 keV measurements were performed with solid state detectors. In the present study most of the data were taken from one detector measuring electrons with pitch angles 5525” and energies s26.5 keV and another detector measuring electrons above 40 keV with pitch angles 20- 70”. The proton spectra used were taken from a positive ion spectrometer (tX45”) with the assumption that all measured ions were protons. A detailed technical report on the KG1 particle experiments on the Substorm-GEOS rockets has been given by Sandahl (1981). Other experiments on board the Substorm- GEOS rocket S23H are listed in Marklund et al. (1981).
Ground instrumentation
Ground magnetic observations have been obtained from the Scandinavian Magnetometer Array, shown in Fig. 2. A detailed description of this network has been given by Kiippers et al. (1979) and Maurer and Theile (1978). The optical information used for this study has been obtained from :
(1) a low light level TVcamera operated at ESRANGE by Uppsala Ionospheric Observatory (UIO) providing excellent information of temporal and spatial variations of aurora1 structures close to the rocket.
(2) all-sky cameras(ASC) at Kiruna and Kilpisjarvi (cf. Fig. 2). Distinct aurora1 structures, seen in the all- sky data, have been digitized along their lower borders, rectified and mapped under the assump- tion of a normal height of 100 km (by courtesy of H. Opgenoorth, UIO and K. Kaila, FMI*).
The rocket and the ground data will be presented in a special Cartesian coordinate system, the so-called Kiruna system (cf. Fig. 2), introduced by Kiippers et al. (1979). It is obtained by a stereographic projection of the globe on to a tangential plane centered at Kiruna, Sweden. The y,, axis of the system is taken as the tangent to the revised corrected geomagnetic circle of latitude running through Kiruna (Gustafsson, 1970).
* Finnish Meteorological Institute.

Rocket and ground-based study of an aurora1 breakup event 209
l IMS Magnetometer,
U of Miinster
l IMS Magnetometer, TU Braunschwecg
() All-sky camera
100 km *
2 l KVI
OOKS
KlR l MUO
.
*HAS
I
UAT OPEL
i l JOK
l SAU I
yt
AKUU
16”E 2CE 3:
74ON
70°N
66’~
FIG. 2. LWATIONS OF THE MAGNETIC STATIONS ANV THE TWO ALL-SKY CAMERAS USED FOR THIS STUVY.
The axes define the Kiruna coordinate system (see text).
3. TEMPORAL DEVELOPMENT
OF THE MAGNETOSPHERIC SUBSTORM
NEAR LOCAL MAGNETIC MIDNIGHT
ON 27 JANUARY, 1979
The Substorm-GEOS rocket S23H was launched at 21.0159 U.T. on 27 January, 1979 from ESRANGE, Kiruna shortly after the onset of an intense magnetospheric substorm over northern Scandinavia. Before this there was a 1 h period beginning with the recovery phase of an earlier substorm (cf. Fig. 1) as indicated by pulsations and decreasing activity and the growth phase of a new substorm as indicated by a southward movement of aurora and the tail-like conliguration of the magnetic field as observed on GEOS (Baumjohann, 1979). Around 20.58 U.T. a faint arc brightened approx. 400 km South-East of Kiruna in the central part of northern Finland as could be seen by the Muonio all-sky camera (data not shown here). At about this time practically all ground-based instru-
ments and GEOS instruments noted sudden changes. Figure 3 shows, in a sequence of pictures, the temporal development of the aurora1 activity and the equivalent current flow as deduced from the SMA data. It can be seen that the region of active aurora spread to the West and North along a pre-existing arc. This expansion was accompanied by theintrusion ofwestward current flow. At Iaunch (21.02 U.T.) this region already covered ESRANGE and a wide belt extending almost all the way to the Norwegian coast line. Note that the most intense structures seem to be connected to the front of the active region.
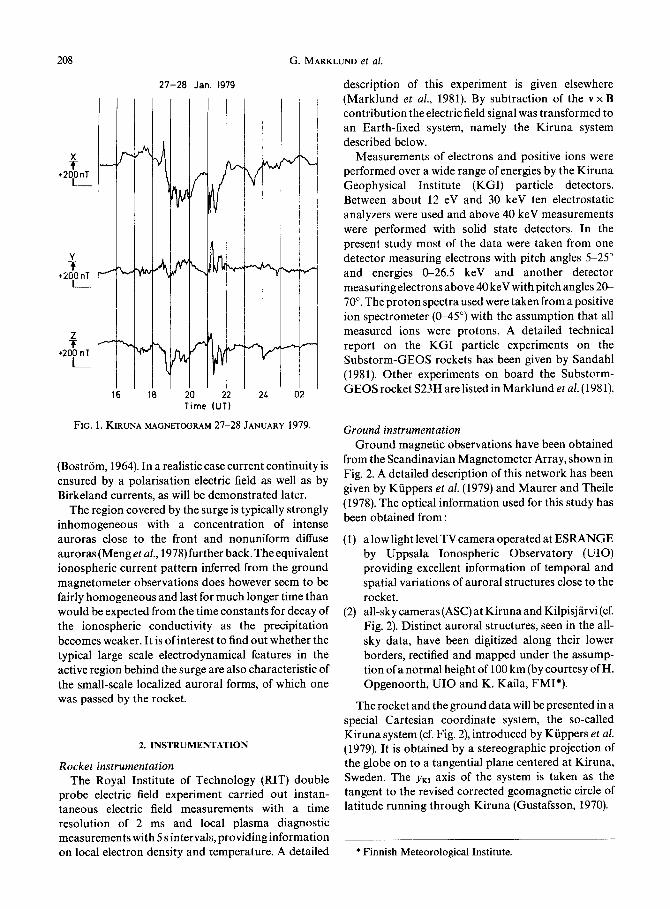
It can be seen that in the Kiruna area, the time-period after the rapid poleward expansion at 21.02 U.T. and until approx. 21.06 U.T. could be characterized by decreasing aurora1 activity. This can be better seen in Fig. 4 which shows the development of the equivalent current vectors for the Kiruna latitude profile and the corresponding TV-pictures in steps of 30 s. Until 21.03 U.T. the centre of the westward electrojet was close to

210 G. MARKLUND et al.
Kiruna. During the subsequent period of decreasing southwestward current flow came in from the North- activity the centre moved southwards. A second onset East (cf. Fig. 3 and Fig. 4). The sharp longitudinal with an enhancement of a widespread nonuniform gradient in the equivalent current distribution at the diffuse aurora occurred shortly after 21.06 U.T., front of the active region (cf. for example Fig. 3,21.01 foIlowed by an enhancement and northward shift of the U.T.) suggests localized upward field-aligned currents westward -electrojet. After 21.09 U.T. a region of there (Baumjohann ef al., 1981).
4xT
21.00 UT
21.03UT I
21.06UT 1
21.09UT
I 1.. J FIG. 3, TEMPORAL DEI'ELOPMENT OF
- 18C 4 - 1ec 3 ___ IBCZ ~ IBC 1
21.01 UT
1 21.04UT 1
1 21.07UT I
21 .lOUT Y --.4-W--
1 21.02UT I
ME AURORAL ACTIVITY AND THE EQUIVALENT CURRENT FLOW AFTER
SUBSTORM ONSET AT 20.58 U.T. The region of active aurora spreads to the West and North along a pre-exlstmg arc. ‘l‘hls expansion IS
accompanied by the intrusion of westward current flow.
N
t E
300nT
- ORockei
position -=
s 2G2.00
I 1CO
km
\ - _=
= 21.04.30
rz=
-==
z 21.05.00
2 - .
21.05.30
3 2&00
s _A
2108.30
_zzz
/ 21
.09~
00
\
F 2z2.30
k 21.03.00
a 21.06.00
+
-
21.06.30
e 21.09.30
-5
2 21.10.00
21.03.30
21.04.00
- 21.07.00
-5
2 21.10.30
- /
1 21.07. 30
6
FIG
. 4. T
EM
PO
RA
L D
EV
ELO
PM
EN
T OF
TH
E A
UR
OR
AL A
CT
IVIT
Y C
LOS
E T
O K
IKU
NA
AN
D T
HE
EQ
UIV
AL
EN
T CU
RR
EN
T F
LO
W F
OR
TH
E S
MA
-LA
TIT
UD
E
PR
OF
ILE
PA
SSIN
G
TH
RO
UG
H K
IRU
NA
.
Not
e th
e en
han
cem
ent
of t
he
non
un
ifor
m
diff
use
au
rora
an
d th
e cu
rren
ts
nor
th
of K
iru
na
afte
r 21
.06.
30
U.T
.

Rocket and ground-based study of an aurora1 breakup event 213
4. ROCKET OBSERVATIONS
Figure 5 shows a series of measured electron spectra for each fifth second of the flight. These spectra have been smoothed in order to make it easier to follow the time development of the characteristic spectral features. Note the two intervals 22&280 s and 38G-515 s respectively, characterized by quasi-monoenergetic spectra, peaked at about 2-3 keV. These intervals correspond to the times for which the rocket encountered aurora1 structures as can be seen in Fig. 4. Sometimes the peaks were extremely sharp, as is shown by the spectrum to the left, which is presented with
maximum time resolution. Outside the aurora the spectra were found tobe approximately nonaccelerated Maxwellians. The arrows denote field-aligned currents and are discussed in the subsequent section.
The observations made by the electric field experiment have once been described in the paper by Marklund et al. (1981). Figure 6 shows the components of the horizontal electric field (upper graph) and the electron energy flux as calculated from the particle observations (lower graph). Note that the electric field is here presented in the Kiruna system instead of the geographical coordinate system used by Marklund et al. (198 1). The westward component of the electric field
ELECTRON SPECTRA S23H
0 I 0.6 < E<ZOkeV; 5’<+ < 25”
DIL E> LO keV j 20°<dp <TO’
EnergylkeV)
FIG. 5. ELECTRON ENERGY SPECTRA vs FLIGHT TIME. The thick arrows represent intervals of up- and downward field-aligned currents as inferred from the div j calculation and the attached numbers maximum and average current density in PA m-‘. The insert is an
example of a quasi-monoenergetic spectra with maximum energy and time resolution.

214 G. MARKLUND et al.
IO -2 orthward camp, E,
>
E T3 0 --------___
t .-
u ;
2 -10
5
0
1
-10
-20
IO
50 100 200 300 400 500 600 Flight time(s)
1 , / 1 2103 2104 2105 21 06 2107 2108 21 09 2110 21.11 Univ. time (ill
FIG. 6. HORIZONTAL COMPONENTS OF THE ELECTRIC FIELD (RIT) AND THE ELECTRON ENERGY FLUX (KGI). Note thesuddenreversalofE,around230~(21.06.00U.T.)occurringsimultaneouslywiththesharpincreasein
the electron energy flux.
remained fairly constant during the flight with a value was associated with the aurora1 enhancement (see
of about 15 mV m- ‘, while the northward component above). These observations were interpreted in an
exhibited a reversal at approx. 230 s (- 21.06 U.T.). This earlier paper (Marklund et al., 198 1) in terms of a rocket
occurred simultaneously with a sharp increase by one passage through an upward field-aligned current sheet.
order of magnitude in the electron energy flux which This is only part of the truth since the current sheet was,
I I I I I I I I 100 200 300 400 500 600 Flight time(s)
I I I I I I 1 I I I I 100 200 300 360 400 413.1 400 360 300 200 100 Altitude(km)
FIG. 7. ELECTRON DENSITY VARIATION ALONG THE ROCKET TRAJECTORY. The crosses denote the densities obtained from the double probe experiment. The dots show the equilibrium
density values (n,,), calculated from the measured electron spectra.

Rocket and ground-based stud!
as is often the case, intimately coupled to an arc- associated polarisation electric field, as we shall discuss
below. A large peak in the F-region electron density was also observed around this time(cf. Fig. 7). However, this peak was most probably a residual effect from the intense precipitation which occurred about two minutes earlier in this area, as could be judged from the TV pictures (cf. Fig. 4).
The left part of Fig. 8 is a vector representation of the electric field along a horizontal projection of the rocket trajectory. By comparing with the Kiruna equivalent
i of an aurora1 breakup event 215
current vectors which have been inferred as dotted
arrows (right) from Fig. 4 one notes that there is a fairly good alignment between these vectors throughout most of the flight. As shown by Marklund et al. (1981) such an alignment could have been achieved if a southwestward neutral wind with a velocity of the order of E/B was present throughout the flight. In the following section we shall present an alternative and in fact more probable interpretation in which all the above observations fit in a consistent way including the electric field reversal around 21.06 U.T.
Observed horizontal Calculated horizontal helght-
electric faeld Integrated ionospheric currents
1 f
3 210‘
10
20 mV/m -.__ - Jca~c
FIG.% VECTORREPRESENTATIONOFTHEMEASUREDELECTRICFIELDSANDTHECALCULATEDCURRENTSALONGA HORlZONTALPROJECTIONOFTHEROCKETTRAJECTORY.
Before 21.06 U.T. J,,,,, is predominantly northward in contrast to the westward equivalent current vectors (J,,) inferred from Fig. 4. Between 21.06 U.T. and 21.08 U.T. the current vectors Jcalc, and J,, are roughly
parallel.

216 G. MARKLUND et al.
5. IONOSPHERIC CURRENTS
AND ENERGY DISSIPATION
AS CALCULATED FROM THE ROCKET DATA
The rocket data have been used to calculate height- integrated conductivities, ionospheric currents and power dissipation, which are presented in this order from the top in Fig. 9. The height-integrated conductivities, have been calculated from the energetic
electron and proton spectra using the method described in Marklund et al. (1982) which is based on the algorithms for ionization by electrons (Rees, 1963) and protons (Eather and Burrows, 1966) respectively. The Hall to Pedersen conductivity ratio C,/C, is approx. 1.5 throughout the flight, the constant value being a consequence of a fairly constant hardness of the spectra. For these calculations steady state has been assumed between ion production and recombination losses. A way to test the validity of this assumption is to compare the calculated electron densities with the measured electron densities along the rocket trajectory. For this flight the latter were obtained for altitudes
above 200 km, which is above the altitude at which the steady state condition,
q = a-n,2 (1)
(q = ion production rate and a = effective recom- bination coefficient) generally holds. It can be seen in Fig. 7 that the agreement between measured (n,) and calculated (n,,) electron densities at rocket altitude is fairly good in the beginning and at the end of the flight but poor in between, especially around 230 s (21.06 U.T.). This difference may partly be due to the steady state equation (1) above not being valid. However, the major reason is that the observed density peak was a residual effect from an earlier precipitation period as mentioned above. At lower altitudes, e.g. in the E- region, the recombination times are so short (typically less than 15 s) that such a residual effect is negligible. This also implies that the height-integrated con- ductivities which are dominated by the E-region contribution were unaffected by this earlier intense precipitation.
In the middle panel of Fig. 9 are shown the horizontal
60- 100 I 200 300 400 500 I -60
me _ Ir S23H - ;” 40- -Ul
I”$ c_ >
$2 20- - 20
“? - E -_-____
18 0, 0
10.82 keV-30 keV1
Y Joule heating (xp E2)
I I I I I I I 50 100 200 300 400 500 600 Flight time(s) t , I I I I I I 1 4 21.03 21.04 21.05 21.06 21.07 21.08 21.09 21.10 21.11 Univ. tame (UT)
FIG.~. HEIGHT-INTEGRATEDCONDUCTIVITIES(C~,~~)ANDIONOSPHERICCURRENTDENSITIES(~,,J,)ANDPOWER DISSIPATIONBYJOULEHEATINGANDPRECIPITATINGPARTICLESASCALCULATEDFROMTHEROCKETDATA.
Note the following: (1) J,beingrelativelysmall,showsamonotonicdecreaseafter 220sfollowedbyareversal. -.l,intensifiesto
1 A mm’ as the aurora1 activity increases after 220 s. (2) A fairly good correlation exists between the power dissipation by particles and Joule heating.

Rocket and ground-based study of an aurora1 breakup event 211
height-integrated ionospheric current densities J, and
J, as calculated from the observed electric field (Fig. 6) and the height-integrated conductivities (top panel) assuming the neutral winds to be negligible. The northward component of the current (J,) is relatively small and shows a monotonic decrease after 220 s followed by a reversal, while the westward component (-J,,) intensifies from 0.2 A m- ’ up to 1 A m ’ starting at 230 s, i.e. the time for the second onset. These results are also presented in vector form to the right in Fig. 8. Note the current intensification and change of direction from predominantly North to predominantly West after 220 s.
A similar directional change could not be observed for the equivalent current-vectors inferred from Fig. 4. The current intensification to the North of Kiruna, i.e. very close to the rocket is however clearly visible.
In order to obtain a rough estimate of the field- aligned currents we have simply taken the divergence of the horizontal currents, assuming the East-West gradients to be negligible, i.e.
AJx 1 AJ In= -== --.
V’ At’
The result is shown schematically in Fig. 5 by the different time intervals (I-IV) denoted by upward and downward arrows, corresponding to time periods of upward and downward field-aligned currents respec- tively. The attached numbers are the maximum and the average current densities in PA mm2 within these intervals. It must be remembered that for the dynamic breakup situation considered here this method to calculate Birkeland currents is quite uncertain. For example, for period I in Fig. 5 we obtained a relatively strong upward current sheet, which probably did not exist. This stems from the inability of this method to separate the actual decrease of the precipitation with time, from a spatial decrease. Only the latter may correspond to a true Birkeland current sheet. However, there is an excellent agreement between the periods of upward field-aligned currents (III and IV) and the periods of strongly peaked electron spectra, which suggests that relatively intense upward Birkeland currents (~40 PA m2) were associated with the aurora1 forms. Electrons in the energy range 0.9930 keV were found to carry about 3-8 PA mm2 which is considerably less than what was found by the divergence method.
In thelower panel of Fig. 9 it can be noted that there is a positive correlation between the power dissipation by Joule heating and precipitating particles. In an earlier study of a pre-breakup event on this same day (Marklund et al., 1982) these two power dissipation
mechanisms were found to be anti-correlated. This
indicates an interesting difference between breakup and pre-breakup situations which reflects differences in the physical mechanisms involved in the two kinds of
events.
6. DlSCUSSlON
Studies of aurora1 breakup events mainly based on ground-based observations have been reported in a number of recent papers (e.g. Baumjohann et al., 1981; Opgenoorth er al., 1980,and Inhester et al., 1981). From these studies a fairly consistent picture of the large scale features of the development of the substorm in terms of ionospheric current flow and electric field configur- ation has arisen. In particular, the westward travelling surge is known to form the leading edge of the substorm-enhanced westward electrojet. Behind the surge a region of discrete aurora1 structures imbedded in widespread nonuniform diffuse auroras forms a high- conductivity channel in which the enhanced aurora1 electrojet can flow. This current could at least partly be viewed as a Cowling current (Bostriim, 1964; Baumjohann et al., 1981) associated with a southward polarisation electric field which is set up in order to preserve current continuity across the channel. Baumjohannetal.(1981)found thateachofanumberof aurora1 breakups was associated with a turnover of the North-West electric field towards South-West and the appearance of a strong westward equivalent current. These observations were interpreted to be consistent with the generation of a Cowling channel in the active region.
Due to rapid motions and intensity variations of the aurora1 forms within the active region behind the surge the conductivity will be very inhomogeneous within this area. Thus the broad westward electrojet is typically highly structured and a number of more localized high conductivity channels associated with local enhancements of aurora1 activity will form. These channels could not strictly be named Cowling channels, since up- and downward field-aligned currents at the
northern and southern edges ofthese belts are not likely to be totally inhibited (as indicated by Baumjohann et al., 1981).
For this event it can be seen that the enhanced westward current associated with the active region covered by the surge seems to maintain its intensity for several minutes after the passage of the front (cf. Fig. 3) although the aurora1 activity becomes weaker. Initially, the ionospheric conductivity was enhanced only very locally in those areas which were associated with intense arcs. Later on precipitation associated with widespread nonuniform diffuse aurora caused a

218 G. MARKLUND etal.
moderate conductivity enhancement over a wider area, enabling the currents to flow in wider sheets. A comparison between the rocket electric field and ionospheric current-vectors presented in Fig. 8 and the equivalent current-vectors representative for Kiruna (dotted arrows) reveals the following.
In the beginningoftheflight(21.03.3~21.06.00 U.T.) the centre of the electrojet was slightly South of Kiruna and the electric field and the equivalent current-vectors were found to be roughly parallel. At the second onset shortly after 21.06.00 U.T., there was an enhancement of nonuniform diffuse aurora and electrojet current strength close to the rocket, which measured a rotation of the electric field from West to South-West. As can be seen the directions of the calculated current vectors and the equivalent current-vectors deviate markedly in the beginning of the flight but after the enhancement they are roughly in agreement. This can be understood in the following way.
At first the rocket intercepted a region in between the major region of the westward electrojet to the South and a probable narrow high conductivity current channel to the North as indicated by the intense arcs there and measured an ambient (not arc associated) west-north-westward electric field. The equivalent current-vectors which were found to have approx. the same directions must however have been controlled by the intense currents predominantly to the South, due to the large integration area of the ground magneto- meters. These currents could be viewed as westward Cowling currents associated with a southward polarisation electric field within the high conductivity region.
As a localized high conductivity region was passed by the rocket after 2 1.06 U.T. the rocket measured a south- westward electric field, which thus presumably was the sum of the external predominantly westward electric field and a southward arc-associated polarisation electric field of about equal magnitude, i.e. 15 mV m- I. Whether the measured predominantly westward electric field was the pure ambient field or whether it was the result of a north-westward ambient field added to a weak southward polarisation electric field, associated with the weak precipitation there, wecannot say for sure. It is however unimportant for the discussion here. In agreement with what should be expected from the above discussion, there is an enhancement of the calculated ionospheric current- vectors at this time (cf. Fig. 8) and a good directional agreement with the equivalent current-vectors. The excellent agreement between the periods of strongly peaked electron distributions and the periods of upward field-aligned currents as inferred from the div j calculation (cf. Fig. 5) suggests that current continuity
across the high conductivity channels were not only ensured by the southward polarisation electric fields but also by intense Birkeland currents, connecting with the net Hall currents across the region. If the field- aligned current densities obtained by the two methods are assumed to be roughly correct this would imply that the major part of the current, i.e. about SOo/, must have been carried by electrons below 0.9 keV.
A comparison between the breakup case near local magnetic midnight which is studied here and the arc- crossing during a pre-breakup event earlier on this day (Marklund et al., 1982) reveals a number of differences that may be characteristic for the two types of events. For both cases a southward polarisation electric field of about equal magnitude as the ambient electric field seems to have been generated within the aurora1 forms (de la Beaujardiere et al., 1977). These polarisation electric fields are needed as well as Birkeland currents in order to preserve current continuity across the high- conductivity regions produced by the aurora1 precipitation (Mozer, 1971; Coroniti and Kennel, 1972; de la Beaujardiere et al., 1981; Marklund et al., 1982). The ambient electric field, which presumably was of magnetospheric origin, showed a typical local-time dependence (Mozer, 1971), being predominantly northward for the pre-breakup event around 1800 L.T. (cf. Fig. 10) and predominantly westward for the breakup event close to magnetic midnight (cf. Fig. 8). For the first event the two electric fields were oppositely directed, and almost cancelled each other within the arc, with the consequence that a large part of the total eastward ionosphericcurrent flow was concentrated to the South of the arc. This was also the case for the Joule heating which was found to be anticorrelated with the dissipation by precipitating energetic particles (cf. Fig. 11).
For the breakup case the two electric fields were approx. perpendicular and equal in strength and added to form a south-westward electric held only slightly stronger than the ambient field. In contrast to the pre- breakup case the ionospheric current flow and the Joule heating were now more or less confined to the aurora1 forms, i.e. a positive correlation between the two power dissipation mechanisms discussed above (cf. Fig. 9).
From this discussion it appears as if the active region, defined here as the region of ionospheric current-flow and energy-dissipation by particles and Joule heating, does not widen that much between the pre-breakup case and the breakup case as could have been expected from the aurora1 display only. During breakup the visible aurora1 structures seem to reflect the active regions, while for the pre-breakup case the visible aurora1 arcs seem to represent only a minor part of the active region.

Rocket and ground-bawd study of an aurora1 breakup event
Observed horizontal Calculated horizontal height- electric field, intesrated ionosuheric currents.
219
FIG. 10. SAME AS h lg.5 BUT FOR AN ARC CROSSING BY THE SZ-JLl ROCKET DURING A PRE-BREAKUP EVENT EARLlER
THIS EVENING.
t 1
WL 400 Flight timelst
Fro. 11. SAME AS THE LOWER PANEL OF Fig. 9 RUT MIR THE PRE-BREAKUP EVENT_
7. SJMMARY AND CONCKXJSiONS
(1) After substorm onset at 20.58 UT. a region of enhanced a~lrora~ activity associated with west- ward currents spread to the West and North over (2) northern Scandinavia (Fig. 3). The south-western leading edge with WC-4 auroras was associated
with localized upward Eel&aligned currentq as indicated by the sharp gradient in the equivalent current vector distribution. The intense no~u~~~or~ diffuse aurora en- countered by the rocket after 2 I .@6 U.T. (Fig. 4) was associated with a southward polarisation electric

220 G. MARKLUND et al.
(3)
(4)
(5)
field, an enhanced westward current (Fig. 8) probably connected with alarge scale upward field- aligned current to the West and finally a N-S directed localized upward field-aligned current sheet (~40 PA m-2) as inferred from the div j calculation and the electron distribution (cf. Fig. 5). Thus, current continuity across the high conduc- tivity regions seems to have been ensured by polarisation electric fields as well as by Birkeland currents. Several such high-conductivity and localized current channels, associated with intense time and space variable auroras, together seem to have
formed the broad westward electrojet (Fig. 3). Due to the large integration area for the ground magnetometers, the equivalent current structure was fairly homogeneous and only slowly varying. For this event and a pre-breakup event earlier on this day (Marklund et al., 1982), a southward polarisation electric field was found to be associated with the aurora1 forms. This field added to the L.T.-dependent ambient field, directed westward and northward for the two events respectively. Consequently the magnitude of the
total electric field became relatively unchanged for the present case while drastically reduced in the pre-breakup situation (cf. Fig. 8 and Fig. 10). For the breakup case with the westward ambient electric field the results above imply that the ionospheric currents and the Joule power dissipation became roughly limited to the high- conductivity region associated with aurora. For the pre-breakup case with the northward external electric field the power dissipation by Joule heating and particle precipitation respectively was anti- correlated and a large part of the current flew in regions outside the visible aurora (cf. Figs. 8,9, 10 and 11).
Acknowledgements-We are greatly indebted to H. Opgenoorth at the Uppsala Ionospheric Observatory for informative and valuable discussions on this work and also for providing the all-sky data which he has analyzed together with K. Kaila at the Finnish Meteorological Institute. We also wish to thank B. Holback at the Uppsala Ionospheric Observatory for providing the low light level TV pictures, past and present members of the magnetometer group at the University of Miinster and H. Maurer at the University at Braunschweig for providing the SMA magnetometer data, R. Mehra and P.-A. Lindqvist at the Royal Institute of Technology for part of the programming work on the rocket data, K. For&erg for making excellent drawings, and L. Block and C.-G. FLlthammar, at the Royal Institute of Technology, for valuable discussions and comments on the manuscript. This research was supported by the Swedish Board of Space Activities. The SMA observations were performed in cooperation with numerous Scandinavian institutions (see
Kiippers et al., 1979) and financially supported by the Deutsche Forschungsgemeinschaft.
REFERENCES
Baumjohann, W. (1979) Review on observations during the ABC II 79-Ol-27,20-22 U.T. interval. Prepared for the IMS Workshop in Skokloster, Sweden.
Baumjohann, W., Pellinen, R. J., Opgenoorth, H. J. and Nielsen, E. (1981) Joint two-dimensional observations of ground magnetic and ionospheric electric fields associated with aurora1 zone currents : current systems associated with local break-ups. Planet. Space Sci. 29,431.
Bostriim, R. (1964) A model of the aurora1 electrojets. J. geophys. Res. 69,4983.
Coroniti, F. V. and Kennel, C. F. (1972) Polarization of the aurora1 electrojet. J. geophys. Res. 77, 2835.
De la Beaujarditre, O., Vondrak, R. and Baron, M. (1977) Radar observations ofelectric fields and currents associated with aurora1 arcs. J. geophys. Res. 82,5051.
De la Beaujarditre, O., Vondrak, R., Heelis, R., Hanson, W. and Hoffman, R. (1981) Aurora1 arc electrodynamic parameters measured by AE-C and the Chatanika radar. J. geophys. Res. 86,4671.
Eather, R. H. and Burrows, K. M. (1966) Excitation and ionization by aurora1 protons. Amt. J. Phys. 19, 309.
Greenwald, R. A., Weiss, W., Nielsen, E. and Thomson, N. R. (1978) STARE : anew radar aurora1 backscatter experiment in northern Scandinavia. Radio Sci. 13, 1021.
Gustafsson, G. (1970) A revised corrected geomagnetic coordinate system. Ark. Geofys. 5, 595.
Inhester, B., Baumjohann, W., Greenwald, R. A. and Nielsen, E. (1981) Joint two-dimensional observations of ground magnetic and ionospheric electric fields associated with aurora1 zone currents, 3. Aurora1 zone currents during the passage of a westward travelling surge. J. Geophys. 49,155.
Kiippers, F., Untiedt, J., Baumjohann, W., Lange, K. and Jones, A. G. (1979) A two-dimensional magnetometer array for ground-based observations of aurora1 zone electric currents during the International Magnetospheric Study (IMS). J. Geophys. 46,429.
Marklund, G., Block, L. and Lindqvist, P.-A. (1981) Rocket measurements of electric fields, electron density and temperature during different phases of aurora1 substorms. Planet. Space Sci. 29,249. _
Marklund. G.. Sandahl. I. and Ooaenoorth. H. (1982) A studv ._ ~ I
of the dynamics of a discrete aurora1 arc. Planet. Space SC;. 30, 179.
Maurer, H. and Theile, B. (1978) Parameters of the aurora1 electrojet from magnetic variations along a meridian. J. Geophys. 44,415.
Meng, C. I., Snyder, A. L., Jr. and Kroehl, H. W. (1978) Observations of aurora1 westward travelling surges and electron precipitation. J. geophys. Res. 83, 575.
Mozer, F. S. (1971) Origin and effects of electric fields during isolated magnetospheric storms. J. geophys. Res. 76, 7595.
Ongenoorth, H. J.. Pellinen, R. J.. Maurer, H.. Kiiupers, F.. Heikkila, W. J.,’ Kaila, i. U. and Tanskanen, p. (148Oj Ground-based observations of an onset of localized field- aligned currents during aurora1 breakup around magnetic midnight. J. Geophys. 48, 101.
Rees, M. H. (1963) Aurora1 ionization and excitation by incident energetic electrons. Planet. Space Sci. 11, 1209. _
Sandahl, I. (1981) The Particle Experiment on the Substorm- GEOS Rockets, KG1 Techn. Rep. 031.