Characterization and Fate of Gun and Rocket Propellant ...
597
ERDC TR-08-1 Strategic Environmental Research and Development Program Characterization and Fate of Gun and Rocket Propellant Residues on Testing and Training Ranges: Final Report Thomas F. Jenkins, Guy Ampleman, Sonia Thiboutot, Susan R. Bigl, Susan Taylor, Michael R. Walsh, Dominic Faucher, Richard Martel, Isabelle Poulin, Katerina M. Dontsova, Marianne E. Walsh, Sylvie Brochu, Alan D. Hewitt, Guillaume Comeau, Emmanuela Diaz, Mark A. Chappell, Jennifer L. Fadden, André Marois, Lieutenant (N) Rick Fifield, Bernadette Quémerais, Jiri Šimunek, Nancy M. Perron, Annie Gagnon, Thérèse Gamache, Judith C. Pennington, Victoria Moors, Dennis J. Lambert, Major Denis Gilbert, Ronald N. Bailey, Vincent Tanguay, Charles A. Ramsey, Larry Melanson, and Marie- Claude Lapointe January 2008 US Army Engineer Research and Development Center Approved for public release; distribution is unlimited.
-
Upload
khangminh22 -
Category
Documents
-
view
0 -
download
0
Transcript of Characterization and Fate of Gun and Rocket Propellant ...

ERD
C TR
-08
-1
Strategic Environmental Research and Development Program
Characterization and Fate of Gun and Rocket Propellant Residues on Testing and Training Ranges: Final Report
Thomas F. Jenkins, Guy Ampleman, Sonia Thiboutot, Susan R. Bigl,
Susan Taylor, Michael R. Walsh, Dominic Faucher, Richard Martel, Isabelle Poulin, Katerina M. Dontsova, Marianne E. Walsh, Sylvie
Brochu, Alan D. Hewitt, Guillaume Comeau, Emmanuela Diaz,
Mark A. Chappell, Jennifer L. Fadden, André Marois, Lieutenant (N) Rick Fifield, Bernadette Quémerais, Jiri Šimunek, Nancy M. Perron,
Annie Gagnon, Thérèse Gamache, Judith C. Pennington, Victoria
Moors, Dennis J. Lambert, Major Denis Gilbert, Ronald N. Bailey, Vincent Tanguay, Charles A. Ramsey, Larry Melanson, and Marie-
Claude Lapointe
January 2008
US
Arm
y E
ngi
nee
r R
esea
rch
an
d D
evel
opm
ent
Cen
ter
Approved for public release; distribution is unlimited.

COVER: A 155-mm howitzer fires a projectile, emitting a cloud of gases and propellant particles.
Strategic Environmental Research and Development Program
ERDC TR-08-1 January 2008
Characterization and Fate of Gun and Rocket Propellant Residues on Testing and Training Ranges: Final Report
Thomas F. Jenkins, Susan R. Bigl, Susan Taylor, Michael R. Walsh, Marianne E. Walsh, Alan D. Hewitt, Jennifer L. Fadden, Nancy M. Perron, Victoria Moors, Dennis J. Lambert, and Ronald N. Bailey
Cold Regions Research and Engineering Laboratory US Army Engineer Research and Development Center 72 Lyme Road Hanover, NH 03755-1290
Katerina M. Dontsova, Mark A. Chappell, and Judith C. Pennington
Environmental Laboratory US Army Engineer Research and Development Center 3909 Halls Ferry Road Vicksburg, MS 39180-6199
Guy Ampleman, Sonia Thiboutot, Dominic Faucher, Isabelle Poulin, Sylvie Brochu, Emmanuela Diaz, André Marois, Lieutenant (N) Rick Fifield, Annie Gagnon, Thérèse Gamache, Major Denis Gilbert, Vincent Tanguay, Larry Melanson, and Marie-Claude Lapointe
Defence R&D Canada-Valcartier 2459 Pie-XI Blvd North Québec, Quebec G3J 1X5 CANADA
Richard Martel and Guillaume Comeau
Institut national de la recherche scientifique Centre Eau, Terre et Environnement 290, de la Couronne Québec, Québec G1K 9A9 CANADA
Charles A. Ramsey Bernadette Quémerais Jiri Šimunek
EnviroStat, Inc. Defence R&D Canada-Toronto Department of Environmental Sciences PO Box 636 1133 Sheppard Ave West University of California Fort Collins, CO 80522 Toronto, ON, M3M 3B9 CANADA Riverside, CA 92521
Final report
Approved for public release; distribution is unlimited.
Prepared for Strategic Environmental Research and Development Program (SERDP) Arlington, Virginia 22203
ERDC TR-08-1 ii
Abstract: Over the past two years, the U.S. Army Engineer Research and Development Center and the Defence R&D Canada Valcartier have part-nered to develop an improved understanding of the distribution and fate of propellant residues on military training ranges in SERDP Project ER-1481. As a portion of this work, field studies have been conducted to esti-mate the mass of propellant residues deposited per round fired from vari-ous munitions. This research included artillery, mortars, small arms, shoulder-fired rockets, and several large missiles. Particles of the propel-lant residues deposited have been collected and studied, and initial ex-periments conducted to measure the rate of release of nitroglycerin (NG) and 2,4-dinitrotoluene (DNT) after deposition. Field studies have been conducted at a number of U.S. and Canadian installations to determine the mass and distribution of residue accumulation from different types of mu-nitions. Depth profiling has been accomplished to document the depth to which these residues have penetrated the shallow subsoil. Laboratory col-umn studies have been conducted with NG, nitroguanidine, and diphenyl-amine to document transport rates for solution phase propellant constitu-ents and develop process descriptors for use in mathematical models to enable prediction of fate and transport for these constituents. Subsequent column studies have utilized intact propellants. The major accomplish-ments from these field and laboratory studies are presented.
DISCLAIMER: The contents of this report are not to be used for advertising, publication, or promotional purposes. Citation of trade names does not constitute an official endorsement or approval of the use of such commercial products. All product names and trademarks cited are the property of their respective owners. The findings of this report are not to be construed as an official Department of the Army position unless so designated by other authorized documents. DESTROY THIS REPORT WHEN NO LONGER NEEDED. DO NOT RETURN IT TO THE ORIGINATOR.

ERDC TR-08-1 iii
Contents Figures and Tables..................................................................................................................................x
Preface..................................................................................................................................................xix
Nomenclature.................................................................................................................................... xxiii
1 Introduction..................................................................................................................................1-1 Susan R. Bigl and Thomas F. Jenkins
Background ...........................................................................................................................1-1 Gun and Small Rocket Propellant Formulations .........................................................................1-2 Larger Rocket Propellants ............................................................................................................1-6
Previous Research on Propellant Residues at Military Ranges..........................................1-7 Objectives ............................................................................................................................1-10 Scope of Project ..................................................................................................................1-11 References...........................................................................................................................1-14
2 Characteristics of Propellant Residues....................................................................................2-1
Susan Taylor, Michael R. Walsh, Jennifer L. Fadden, Marianne E. Walsh, Victoria Moors, Susan R. Bigl, Alan D. Hewitt, Nancy M. Perron, and Dennis J. Lambert
Introduction ...........................................................................................................................2-1 Materials and Methods.........................................................................................................2-2 Appearance and Composition of Propellants ......................................................................2-4
Single-Base Propellants................................................................................................................2-4 Double-Base Propellants ..............................................................................................................2-7 Nitrocellulose Propellants...........................................................................................................2-12
Dissolution Tests .................................................................................................................2-14 Results .................................................................................................................................2-16 Conclusions .........................................................................................................................2-19 References...........................................................................................................................2-20
3 Propellant Residues Deposition from Small Arms Munitions................................................3-1
Michael R. Walsh, Marianne E. Walsh, Susan R. Bigl, Nancy M. Perron, Dennis J. Lambert, and Alan D. Hewitt
Introduction ...........................................................................................................................3-1 Background ...........................................................................................................................3-2 Field Tests..............................................................................................................................3-4
Field Site ........................................................................................................................................3-4 Munitions.......................................................................................................................................3-5 Tests...............................................................................................................................................3-6 Sampling Method..........................................................................................................................3-7 Sample Processing and Analysis ...............................................................................................3-12

ERDC TR-08-1 iv
Quality Control Procedures.........................................................................................................3-15 Results .................................................................................................................................3-16
Background Samples..................................................................................................................3-16 Firing Points.................................................................................................................................3-16
Discussion ...........................................................................................................................3-22 Conclusions .........................................................................................................................3-25 References...........................................................................................................................3-26 Appendix 3-A: Munitions Data ............................................................................................3-28 Appendix 3-B: Sampling Data.............................................................................................3-29 Appendix 3-C: Firing Point Test Analytical Results.............................................................3-33
4 Energetic Residues Deposition from 84-mm Carl Gustav Antitank Live Firing ...................4-1
Sonia Thiboutot, Guy Ampleman, André Marois, Annie Gagnon, Major Denis Gilbert, Vincent Tanguay, and Isabelle Poulin
Abstract..................................................................................................................................4-1 Executive Summary...............................................................................................................4-3 Introduction ...........................................................................................................................4-5 Experimental Methods..........................................................................................................4-7
Field Work......................................................................................................................................4-7 Material .......................................................................................................................................4-10 Weapon Description and Propellant Composition ....................................................................4-12 Field Setup...................................................................................................................................4-15 Sample Processing .....................................................................................................................4-19 Extraction and Analysis...............................................................................................................4-21
Results and Discussion.......................................................................................................4-23 Test Setup....................................................................................................................................4-23 Particle Size, Distribution, and Type ..........................................................................................4-23 Estimate of the Mass of Nitroglycerin Deposited ......................................................................4-28
Recommendations and Conclusion ...................................................................................4-31 Acknowledgements .............................................................................................................4-33 References...........................................................................................................................4-34 Nomenclature......................................................................................................................4-36
5 Assessment of Gaseous and Particulate Propellant Residues Resulting from Small Arms Live Firing ................................................................................................................5-1
Dominic Faucher, Sylvie Brochu, Isabelle Poulin, and Michael R. Walsh
Abstract..................................................................................................................................5-1 Introduction ...........................................................................................................................5-3 Experimental Setup...............................................................................................................5-5
Selection of Calibers and Weapons .............................................................................................5-5 Description of Test Site and Firing Device.................................................................................5-11 Sampling Methodology ...............................................................................................................5-13 Sample Processing and Analysis ...............................................................................................5-21
Results .................................................................................................................................5-28 Ground Samples .........................................................................................................................5-28

ERDC TR-08-1 v
Gas Samples ...............................................................................................................................5-35 Particulate Samples....................................................................................................................5-36
Discussion ...........................................................................................................................5-47 Conclusions .........................................................................................................................5-51 References...........................................................................................................................5-52 Appendix 5-A: Description of Each Trial .............................................................................5-54 Appendix 5-B: Calculation of the Total Amount of NG (or 2,4-DNT) Dispersed per Round Shot ..........................................................................................................................5-60 Appendix 5-C: Analytical Methods Used for Gas Analysis .................................................5-66 Appendix 5-D: EDX Spectra for Particulate Matter Analysis..............................................5-67
6 Study of Propellant Residues Emitted During 105-mm Leopard Tank Live Firing and Sampling of Demolition Ranges at CFB Gagetown, Canada .........................................6-1
Guy Ampleman, Sonia Thiboutot, André Marois, Annie Gagnon, and Major Denis Gilbert
Abstract..................................................................................................................................6-1 Introduction ...........................................................................................................................6-4 Background ...........................................................................................................................6-7
Logistics.........................................................................................................................................6-7 Equipment and Munitions ............................................................................................................6-7
Experimental Methods........................................................................................................6-19 Sampling Strategy and Nomenclature.......................................................................................6-19 Parameter, Sample Collection, and Analytical Methods...........................................................6-27
Results and Discussion.......................................................................................................6-29 Propellant Residues....................................................................................................................6-29 Demolition Ranges......................................................................................................................6-31
Conclusion ...........................................................................................................................6-35 References...........................................................................................................................6-37
7 Study of Propellant Residues and Gases Emitted During 105-mm Howitzer Live Firing at the Muffler Installation in Nicolet, Lac St-Pierre, Canada ......................................7-1
Guy Ampleman, Sonia Thiboutot, André Marois, Thérèse Gamache, Isabelle Poulin, Emmanuela Diaz, Bernadette Quémerais, and Larry Melanson
Abstract..................................................................................................................................7-1 Introduction ...........................................................................................................................7-3 Experimental Methods..........................................................................................................7-5
Logistics.........................................................................................................................................7-5 Muffler Chamber ...........................................................................................................................7-5 Equipment and Munitions ..........................................................................................................7-10 Sampling Strategy and Nomenclature.......................................................................................7-16 Parameter, Sample Collection, and Analytical Methods...........................................................7-22
Results and Discussion.......................................................................................................7-26 Gun Firing in the Muffler: Witness Plates ..................................................................................7-27 Outdoor Gun Firing: Witness Plates ...........................................................................................7-31 Muffler Firing: Residue Collected on the Floor After 20 Rounds..............................................7-34 Air Emission Results ...................................................................................................................7-42

ERDC TR-08-1 vi
Conclusion ...........................................................................................................................7-52 References...........................................................................................................................7-57
8 Accumulation of Propellant Residues at Small Arms Firing Points ......................................8-1
Thomas F. Jenkins, Alan D. Hewitt, Michael R. Walsh, Marianne E. Walsh, Ronald N. Bailey, Charles A. Ramsey, Susan R. Bigl, Dennis J. Lambert, Sylvie Brochu, Emmanuela Diaz, Marie-Claude Lapointe, Isabelle Poulin, and Dominic Faucher
Abstract..................................................................................................................................8-1 Introduction ...........................................................................................................................8-2 Objectives ..............................................................................................................................8-5 Methods.................................................................................................................................8-6
Soil Sample Collection at Fort Richardson, Alaska .....................................................................8-6 Soil Sample Collection at 29 Palms, California ...........................................................................8-8 Soil Sample Collection at CFB Petawawa, Ontario....................................................................8-12 Soil Sample Collection at CFB/ASU Wainwright, Alberta..........................................................8-18 Soil Sample Processing of Samples from 29 Palms and Fort Richardson ..............................8-20 Soil Sample Processing of Samples from CFB Petawawa and CFB/ASU Wainwright.............8-21 Sample Extraction and Analysis for Propellant Constituents from 29 Palms and Fort Richardson ..................................................................................................................................8-21 Soil Sample Extraction and Analysis for Propellant Constituents from CFB Petawawa and CFB/ASU Wainwright ...........................................................................................................8-22
Results .................................................................................................................................8-23 Laboratory QC: CRREL ................................................................................................................8-23 Subsampling Error Assessment: 29 Palms and Fort Richardson ............................................8-24 Total Characterization Error Assessment ..................................................................................8-25 Scoops Versus Coring Tool for Collection of Multi-Increment Samples ...................................8-26 29 Palms Ranges........................................................................................................................8-27 Fort Richardson Ranges .............................................................................................................8-30 CFB Petawawa.............................................................................................................................8-33 CFB/ASU Wainwright ..................................................................................................................8-39
Discussion ...........................................................................................................................8-43 9-mm Pistol Ranges....................................................................................................................8-43 5.56 mm Rifle Ranges................................................................................................................8-44 Multi-Purpose Machine Gun Ranges .........................................................................................8-44 Comparison of Data with Human Health and Exotoxicological Criteria ...................................8-47
References...........................................................................................................................8-49 Appendix 8-A: Analysis of Subsampling and Sampling Replicate Results .......................8-51
9 Propellant Residues in Surface Soils and Groundwater at Firing Positions at Canadian Force Base Petawawa, Ontario................................................................................9-1
Richard Martel, Guillaume Comeau, Sylvie Brochu, and Alan D. Hewitt
Abstract..................................................................................................................................9-1 Introduction ...........................................................................................................................9-2 Background of Study Area ....................................................................................................9-5
Location .........................................................................................................................................9-5 Historical Settings and Current Land Use ...................................................................................9-6

ERDC TR-08-1 vii
Environmental Settings.................................................................................................................9-6 Field and Laboratory Strategies ...........................................................................................9-7
Sample Collection .........................................................................................................................9-7 Chemical Parameters and Analytical Methods ...........................................................................9-9 Samples Quality Control .............................................................................................................9-10
Results and Discussion.......................................................................................................9-12 Anti-tank Firing Positions ............................................................................................................9-12 Artillery/Mortar Firing Positions .................................................................................................9-16 Small Arms Firing Positions ........................................................................................................9-23
Conclusion ...........................................................................................................................9-25 References...........................................................................................................................9-27 Appendix 9-A: Drilling Logs .................................................................................................9-28 Appendix 9-B: Soil Sampling Results .................................................................................9-40 Appendix 9-C: Groundwater Sampling Results ..................................................................9-50
10 Assessment of the Dispersion of Propellant Residues from Naval Live-Fire Training...... 10-1
Sonia Thiboutot, Guy Ampleman, Lieutenant (N) Rick Fifield, André Marois, and Annie Gagnon
Abstract................................................................................................................................10-1 Executive Summary.............................................................................................................10-2 Acknowledgements .............................................................................................................10-3 Introduction .........................................................................................................................10-4 Experimental Methods........................................................................................................10-6
Naval Munitions and Propellants ...............................................................................................10-6 HMCS Montréal ...........................................................................................................................10-8 Sampling Strategy.................................................................................................................... 10-10 Live-Fire Exercise ..................................................................................................................... 10-13 Osborne Head .......................................................................................................................... 10-13 Soil Sampling............................................................................................................................ 10-17 Extraction and Analysis............................................................................................................ 10-18
Results and Discussion.................................................................................................... 10-21 57-mm Live Firing .................................................................................................................... 10-21 Former Osborne Head Navy Firing Positions.......................................................................... 10-21 Other Compounds and Impacts on the User .......................................................................... 10-22
Recommendations and Conclusion ................................................................................ 10-23 References........................................................................................................................ 10-25 Nomenclature................................................................................................................... 10-28
11 Characterization of Air Emissions from Artillery Live Firing of LG1 Mark II 105-mm and M777 155-mm Howitzers ................................................................................................ 11-1
Isabelle Poulin, Emmanuela Diaz, and Bernadette Quémerais
Abstract................................................................................................................................11-1 Introduction .........................................................................................................................11-3 Experimental Methods........................................................................................................11-7
Weapons Description and Propellants Composition.................................................................11-7

ERDC TR-08-1 viii
Exercise Descriptions and Field Sampling Setups ................................................................. 11-14 Parameters and Sampling Methods ....................................................................................... 11-20 Analytical Methods for Airborne Particles Characterization .................................................. 11-28
Results and Discussion.................................................................................................... 11-32 LG1 Mark II 105-mm Howitzer ................................................................................................ 11-32 M777 155-mm Howitzer ......................................................................................................... 11-52
Conclusion ........................................................................................................................ 11-68 References........................................................................................................................ 11-70
12 Dissolution and Transport of Nitroglycerin, Nitroguanidine, and Ethyl Centralite from M9 and M30 Propellants in Soil.................................................................................... 12-1
Katerina M. Dontsova, Mark A. Chappell, Jiri Šimunek, and Judith C. Pennington
Abstract................................................................................................................................12-1 Introduction .........................................................................................................................12-3
Background .................................................................................................................................12-3 Objectives ....................................................................................................................................12-7 Approach .....................................................................................................................................12-7
Materials and Methods.......................................................................................................12-8 Propellants ..................................................................................................................................12-8 Soils .............................................................................................................................................12-9 Results ...................................................................................................................................... 12-15
Conclusion ........................................................................................................................ 12-26 References........................................................................................................................ 12-27 Nomenclature................................................................................................................... 12-30
13 Estimating Perchlorate Deposition from the Firing of a MLRS Rocket............................. 13-1
Thomas F. Jenkins, Alan D. Hewitt, Susan R. Bigl, Dennis J. Lambert, and Judith C. Pennington
Abstract................................................................................................................................13-1 Introduction .........................................................................................................................13-2 Objective ..............................................................................................................................13-3 Methods...............................................................................................................................13-4
Surface Soil Sampling.................................................................................................................13-4 Sample Processing, Subsampling..............................................................................................13-5
Results and Discussion.......................................................................................................13-8 Conclusion ........................................................................................................................ 13-11 References........................................................................................................................ 13-12
14 Summary and Conclusions...................................................................................................... 14-1
Thomas F. Jenkins, Susan R. Bigl, and Judith C. Pennington
Deposition............................................................................................................................14-1 Physical Nature of Residues.......................................................................................................14-1 Mass of Energetic Residues Deposited for Various Types of Munitions..................................14-8
Accumulation of Resides at Firing Points for Various Weapons .................................... 14-13 Artillery, Mortar, and Tank Firing Points ................................................................................. 14-13

ERDC TR-08-1 ix
Antitank Rocket Firing Ranges................................................................................................ 14-15 Small Arms Ranges.................................................................................................................. 14-16
Fate and Transport of Propellant-Related Compounds.................................................. 14-19 Recommendations for Additional Research ................................................................... 14-25 References........................................................................................................................ 14-28
Appendix A: Bibliography of ER-1481 Publications........................................................................A-1
Report Documentation Page
ERDC TR-08-1 x
Figures and Tables
Figures
Figure 1-1. Propellant grain shapes and example sizes......................................................................1-4
Figure 1-2. Schematic of propelling charge ignition train ...................................................................1-5
Figure 2-1. Side view and end view of M1 single-perforated propellant............................................2-5
Figure 2-2. Multi-perforated M1 propellant used to fire the 105-mm howitzer rounds and the resultant fiber residues ............................................................................................................2-6
Figure 2-3. Unfired M45 propellant and the propellant residues remaining after firing..................2-8
Figure 2-4. Unfired and fired M9 propellant used for the 81-mm illumination mortars ..................2-8
Figure 2-5. Bullets and casings of the small arms ammunition propellants studied, including those for pistol, rife, and machine gun .........................................................................2-9
Figure 2-6. Unfired grains and fired residues from a .50-caliber machine gun..............................2-10
Figure 2-7. Unfired grains and fired residues from a 7.62-mm machine gun .................................2-11
Figure 2-8. Unfired grains and fired residues from a 5.56-mm rifle ................................................2-11
Figure 2-9. Unfired grains and fired residues from a 9-mm pistol ...................................................2-12
Figure 2-10. Unfired grains and fired residues of the M10 propellant ............................................2-13
Figure 2-11. Laboratory setup for drip tests.......................................................................................2-15
Figure 2-12. Cumulative mass loss of 2,4-DNT and 2,6-DNT from fired propellant fibers and from an unfired propellant grain...........................................................................................2-16
Figure 2-13. Cumulative mass loss of NG from five unfired M9 propellant grains ........................2-18
Figure 3-1. Looking downrange at Range 6.2, Camp Ethan Allen, Vermont .....................................3-4
Figure 3-2. Firing the M16 5.56-mm automatic rifle at Range 6.2, Camp Ethan Allen, Vermont ............................................................................................................................................3-6
Figure 3-3. Sampling the M2HB 12.7-mm machine gun firing point decision units at Range 6.5, Camp Ethan Allen, Vermont........................................................................................3-8
Figure 3-4. Areas sampled for small arms propellant residues tests ................................................3-9
Figure 3-5. Concentric circle sampling of firing position plume and OTP areas..............................3-11
Figure 3-6. Sampling from fixed lanes in firing position plume area................................................3-12
Figure 4-1. Arnhem antitank range target area....................................................................................4-7
Figure 4-2. Arnhem antitank range firing positions .............................................................................4-8
Figure 4-3. Briefing the PP1 Infantry 06/07 group prior to the firing exercise..................................4-9
Figure 4-4. Students of the PP1 Infantry 06/07 course prior to firing...............................................4-9
Figure 4-5. Particle trap........................................................................................................................4-12
Figure 4-6. Integrated 84-mm round...................................................................................................4-13
Figure 4-7. Propelling chamber of the 84-mm round.........................................................................4-14
Figure 4-8. Two 84-mm rounds, Gagetown NB ..................................................................................4-14
Figure 4-9. Particle trap behind firing line with snow stopper ..........................................................4-15
Figure 4-10. Lines of particle traps in front of the firing line.............................................................4-16
ERDC TR-08-1 xi
Figure 4-11. Lines of particle traps behind the firing line, between –30 and –50 m....................4-17
Figure 4-12. Particle traps behind the firing line, between –5 and –20 m.....................................4-17
Figure 4-13. Field setup........................................................................................................................4-18
Figure 4-14. Sample processing..........................................................................................................4-20
Figure 4-15. Snow sample collection, –20-m area............................................................................4-21
Figure 4-16. View looking rearward from FP #1 after completion of firing......................................4-24
Figure 4-17. Particles collected at +5 and –5 m................................................................................4-24
Figure 4-18. Particles collected at –10 m ..........................................................................................4-25
Figure 4-19. Particles collected at –15 m, FP #1 and #2.................................................................4-25
Figure 4-20. Particles collected at –20 m in the middle and in external traps...............................4-26
Figure 4-21. Particles collected at –30 and –40 m...........................................................................4-26
Figure 4-22. ATR FTIR and related match from a database for the larger particles.......................4-27
Figure 4-23. ATR FTIR and related match for the thin glassy particles............................................4-27
Figure 5-1. Fixed mount equipped with a pistol .................................................................................5-12
Figure 5-2. Stop butts and sampling layout........................................................................................5-12
Figure 5-3. Ground sampling layout ....................................................................................................5-14
Figure 5-4. Sampling setup for Browning pistol .................................................................................5-16
Figure 5-5. Browning pistol surrounded by air-monitoring cassettes and sorbent tubes...............5-17
Figure 5-6. C6 machine gun with weapon enclosure bag and sampling tubes installed ..............5-17
Figure 5-7. Close view inside the weapon enclosure bag on the C6 machine gun.........................5-18
Figure 5-8. C7 automatic rifle with weapon enclosure bag and sampling tubes installed............5-18
Figure 5-9. Close view inside the weapon enclosure bag on the C7 automatic rifle......................5-19
Figure 5-10. Homogenization of pail content on an orbital shaker..................................................5-22
Figure 5-11. Evaporation of pail content.............................................................................................5-23
Figure 5-12. Portion of the filters used for SEM analyses.................................................................5-25
Figure 5-13. Micrograph of a blank monitoring cassette filter at a 5000× magnification.............5-26
Figure 5-14. Typical EDX spectrum of particulate matter analysis...................................................5-27
Figure 5-15. Dispersion of NG on the ground for the 9-mm caliber after 1000 rounds ................5-29
Figure 5-16. Dispersion of NG on the ground for the 7.62-mm caliber after 1000 rounds...........5-30
Figure 5-17. Dispersion of NG on the ground for the 5.56-mm caliber after 1000 rounds...........5-31
Figure 5-18. Dispersion of NG on the ground for the .50 cal after 1000 rounds ...........................5-34
Figure 5-19. Dispersion of NG on the ground for the .338 cal after 1000 rounds.........................5-34
Figure 5-20. Monitoring cassettes.......................................................................................................5-37
Figure 5-21. Micrographs of particles collected on monitoring filter #9..........................................5-40
Figure 5-22. Micrograph of particles collected on monitoring filter #10.........................................5-41
Figure 5-23. Micrograph of particles collected on monitoring filter #11.........................................5-42
Figure 5-24. Micrograph of particles collected on monitoring filter #12 .........................................5-43
Figure 5-25. Micrographs of particles collected on monitoring filter #13.......................................5-45
Figure 5-26. Micrographs of particles collected on monitoring filter #14 .......................................5-46
Figure 6-1. Leopard C2 main battle tank..............................................................................................6-8

ERDC TR-08-1 xii
Figure 6-2. Representations of all 105-mm tank gun ammunition....................................................6-9
Figure 6-3. Projectiles of the armor piercing weapons (APFSDC-T)..................................................6-10
Figure 6-4. Different designs for the APFSDS-T..................................................................................6-11
Figure 6-5. Practice ammunition TP/FSDS-T, C71, and SR/TPDS-T, C148......................................6-13
Figure 6-6. Practice round SR/TPDS-T, C148.....................................................................................6-14
Figure 6-7. Representations of HESH-T and SH/Pract ammunition.................................................6-15
Figure 6-8. SH/Pract tank gun ammunition .......................................................................................6-16
Figure 6-9. Representations of Smoke WP-T M 416 ammunition....................................................6-17
Figure 6-10. Smoke WP-T M 416 ammunition ...................................................................................6-18
Figure 6-11. Sampling strategy used in September 2003................................................................6-19
Figure 6-12. Particle traps used in front of the tank..........................................................................6-20
Figure 6-13. Sampling strategy used in front of the tank..................................................................6-21
Figure 6-14. Disposition of particle traps in front of the tank...........................................................6-22
Figure 6-15. Craters in front of the bunker in Drummond Demo Range.........................................6-23
Figure 6-16. Demolition bays in South Boundary Demo Range.......................................................6-24
Figure 6-17. Walls surrounding the concrete pads.............................................................................6-25
Figure 6-18. Small construction to practice door demolition ...........................................................6-25
Figure 6-19. Concrete cutting area in South Boundary Demo Range .............................................6-26
Figure 6-20. Crater area in South Boundary Demo Range...............................................................6-26
Figure 6-21. New pan holders developed to protect particle traps..................................................6-32
Figure 6-22. Particle traps inserted into the new pan holders .........................................................6-32
Figure 7-1. Gun muzzle at one end of the first cell of the muffler......................................................7-6
Figure 7-2. Side view of the muffler ......................................................................................................7-6
Figure 7-3. Exit of the muffler ................................................................................................................7-7
Figure 7-4. Plate cut in half ....................................................................................................................7-7
Figure 7-5. Witness plate at the bottom of the first cell ......................................................................7-8
Figure 7-6. Gas valve with pumps and opened hatch.........................................................................7-9
Figure 7-7. Evacuation system for gases in the muffler ......................................................................7-9
Figure 7-8. Protective outfit and mask................................................................................................7-10
Figure 7-9. Types of guns used by the Canadian Army......................................................................7-11
Figure 7-10. Propellant bags within the M67 charge ........................................................................7-14
Figure 7-11. Bag 1 opened: Small propellant grain...........................................................................7-15
Figure 7-12. Bags 5 and 6 opened: Large propellant grain..............................................................7-15
Figure 7-13. Primer locations within the Squash Head Practice C60..............................................7-17
Figure 7-14. Squash Head Practice C60 105-mm round projectile.................................................7-18
Figure 7-15. Empty shells that were sampled after firing .................................................................7-18
Figure 7-16. Residue on the floor of the first cell...............................................................................7-19
Figure 7-17. Setup of witness plate outside the muffler ...................................................................7-20
Figure 7-18. Setup of the part of the study conducted outside of the muffler ...............................7-21
Figure 7-19. SEM micrograph of the residue collected on the floor of the muffler after 20 rounds fired (seen at a magnification of 50×), showing large, fractured particles.................7-35

ERDC TR-08-1 xiii
Figure 7-20. SEM micrograph of the residue collected on the floor of the muffler after 20 rounds fired (seen at a magnification of 50×), showing fibers.................................................7-36
Figure 7-21. EDX spectrum of the fiber on Figure 7-20b ..................................................................7-37
Figure 7-22. EDX spectrum of the bulk particle on Figure 7-20b.....................................................7-37
Figure 7-23. SEM micrograph of the residue collected on the floor of the muffler after 20 rounds fired (seen at a magnification of 1,000×)......................................................................7-38
Figure 7-24. EDX spectrum of the particle on Figure 7-23 ...............................................................7-38
Figure 7-25. SEM micrograph of the residue collected on the floor of the muffler after 20 rounds fired seen at a magnification of 1,500× in the backscattered electron imaging mode...............................................................................................................................................7-39
Figure 7-26. EDX spectra......................................................................................................................7-40
Figure 7-27. Typical TGA-DTA of the residue collected on the floor of the muffler after 20 rounds fired....................................................................................................................................7-41
Figure 8-1. Sampling layout at Oates Firing Range, Fort Richardson, Alaska ...................................8-6
Figure 8-2. Profile sampling in soil pit at Oates Firing Range Lane 7, Fort Richardson, Alaska ...............................................................................................................................................8-7
Figure 8-3. Sampling layout at Sports Firing Range, Fort Richardson, Alaska..................................8-8
Figure 8-4. Range 5/5A at 29 Palms, California..................................................................................8-9
Figure 8-5. Sampling layout at Range 5/5A, 29 Palms, California.....................................................8-9
Figure 8-6. Schematic of depth profile sample locations collected at Range 5/5A, 29 Palms, California............................................................................................................................8-10
Figure 8-7. Range 2, site of 9-mm pistol firing at 29 Palms, California............................................8-10
Figure 8-8. Layout of 40-m-wide samples areas at Range 2, 29 Palms, California .......................8-11
Figure 8-9. Range 113, site with multi-purpose machine gun training at 29 Palms, California ........................................................................................................................................8-11
Figure 8-10. Sampling layout at Range 113, 29 Palms, California ..................................................8-12
Figure 8-11. Pistol Range Q, CFB Petawawa, Ontario........................................................................8-13
Figure 8-12. Sampling layout at Range Y, used for rifle training, CFB Petawawa, Ontario, in 2005...............................................................................................................................................8-15
Figure 8-13. Sampling layout at Range Y, used for rifle training, CFB Petawawa, Ontario, in 2006...............................................................................................................................................8-16
Figure 8-14. Layout of sampling at Rifle B Range, CFB Petawawa, Ontario, in 2007 ....................8-17
Figure 8-15. Sampling layout at the 9-mm Pistol Range Q, CFB Petawawa, Ontario, in 2005...............................................................................................................................................8-18
Figure 8-16. Range 5 in CFB/ASU Wainwright, Alberta, showing the target area with white signs and the first firing line in the foreground...........................................................................8-19
Figure 8-17. CRREL-designed corer used for sampling......................................................................8-20
Figure 8-18. % RSD due to subsampling uncertainty as a function of mean concentration of NG in soil ....................................................................................................................................8-25
Figure 8-19. Total error % RSD due to field sampling and sample processing as a function of mean concentration of NG in soil ............................................................................................8-27
Figure 8-20. Plot of NG concentration vs. depth for soil profile samples collected at small arms ranges ...................................................................................................................................8-46

ERDC TR-08-1 xiv
Figure 8-21. Plot of 2,4-DNT concentration vs. depth for soil profile samples collected at small arms ranges.........................................................................................................................8-47
Figure 9-1. Location map of CFB Petawawa, Ontario ..........................................................................9-5
Figure 9-2. Groundwater sampling of well GW-A-7 near anti-tank firing position 4 in Alpha Range................................................................................................................................................9-8
Figure 9-3. Anti-tank firing positions in Alpha Range.........................................................................9-13
Figure 9-4. Profiling of NG concentration in soil behind firing bay 4, Alpha Range ........................9-14
Figure 9-5. Anti-tank firing positions in Area 8 ...................................................................................9-15
Figure 9-6. Artillery firing positions at Juliet Tower, Area 2................................................................9-18
Figure 9-7. Artillery firing positions at Hotel Tower, Area 2 ................................................................9-20
Figure 10-1. HMCS Montréal ...............................................................................................................10-8
Figure 10-2. Outside of the gun mount...............................................................................................10-9
Figure 10-3. Inside of the gun mount............................................................................................... 10-10
Figure 10-4. Sampling area A, vertical surface ............................................................................... 10-11
Figure 10-5. Sampling area D, horizontal surface .......................................................................... 10-12
Figure 10-6. Sampling area F, using aluminum foil ........................................................................ 10-13
Figure 10-7. Naval Facility located near Dartmouth........................................................................ 10-14
Figure 10-8. Two fixed firing positions aimed offshore................................................................... 10-14
Figure 10-9. Closer view of one of the firing positions.................................................................... 10-15
Figure 10-10. Cliff in front of the fixed firing positions ................................................................... 10-16
Figure 10-11. Upper view of the firing positions from the cliff....................................................... 10-16
Figure 10-12. Potential former firing positions.................................................................................10-17
Figure 10-13. Sampling areas .......................................................................................................... 10-18
Figure 11-1. LG1 Mark II 105-mm howitzer.......................................................................................11--8
Figure 11-2. 105-mm HE projectiles ...................................................................................................11-8
Figure 11-3. M67 propelling charges (105 mm)................................................................................11-9
Figure 11-4. M777 155-mm howitzer.............................................................................................. 11-11
Figure 11-5. 155-mm HE projectiles ................................................................................................ 11-12
Figure 11-6. Emissions at the muzzle of the gun of the M777 155-mm howitzer ...................... 11-12
Figure 11-7. M3A1 propelling charge (155 mm)............................................................................. 11-13
Figure 11-8. LG1 Mark II 105-mm howitzers on sector #14 at CFB Valcartier............................ 11-15
Figure 11-9. Military personnel's position during firings of the LG1 Mark II 105-mm howitzers ..................................................................................................................................... 11-16
Figure 11-10. Plume created after the firing of the LG1 Mark II 105-mm howitzer .....................11-17
Figure 11-11. Table setup for the firings of the LG1 Mark II 105-mm howitzers..........................11-17
Figure 11-12. Gunners' positions during the M777 155-mm howitzer exercise ......................... 11-18
Figure 11-13. Table setup for the M777 155-mm howitzer firings ............................................... 11-19
Figure 11-14. Sampling material/accessories................................................................................ 11-21
Figure 11-15. Cascade impactor ...................................................................................................... 11-22
Figure 11-16. Sampling stations....................................................................................................... 11-23
Figure 11-17. Portion of filter and cascade impactor substrate used for SEM analysis ............. 11-29

ERDC TR-08-1 xv
Figure 11-18. Micrograph of an unused monitoring cassette filter............................................... 11-29
Figure 11-19. Micrographs of a blank cascade impactor substrate at various magnifications ............................................................................................................................ 11-30
Figure 11-20. Typical EDX spectrum of particulate matter analysis ............................................. 11-31
Figure 11-21. Micrographs of particles collected on monitoring filter #105-1 ............................ 11-38
Figure 11-22. Micrographs of particles collected at different positions on monitoring filter #105-1......................................................................................................................................... 11-40
Figure 11-23. Micrographs of particles collected on the center of monitoring filter #105-2 ......11-41
Figure 11-24. Micrographs of particles collected on the center of monitoring filter #105-2, showing a large, irregularly shaped particle ............................................................................ 11-43
Figure 11-25. Micrographs of the substrate of Stage #3 of the cascade impactor .................... 11-45
Figure 11-26. Micrographs of the substrate of Stage #4 of the cascade impactor .................... 11-46
Figure 11-27. Micrographs of the substrate of Stage #5 of the cascade impactor......................11-47
Figure 11-28. Micrographs of the substrate of Stage #6 of the cascade impactor .................... 11-49
Figure 11-29. Micrographs of the substrate of Stage #7 of the cascade impactor (105-mm trial) .......................................................................................................................................11-51
Figure 11-30. Micrographs of the substrate of Stage #8 of the cascade impactor (105-mm trial) ...................................................................................................................................... 11-53
Figure 11-31. Micrographs of different positions of Filter #155-1................................................ 11-57
Figure 11-32. Micrographs of particles collected on Filter #155-2 .............................................. 11-59
Figure 11-33. Micrographs of the substrate of Stage #7 of the cascade impactor (155-mm trial) ...................................................................................................................................... 11-61
Figure 11-34. Micrographs of the substrate of Stage #8 of the cascade impactor (155-mm trial) ...................................................................................................................................... 11-63
Figure 12-1. Propellants tested in this study......................................................................................12-8
Figure 12-2. Breakthrough curves for nitroglycerin, nitroguanidine, and ethyl centralite from M30 propellant, and tritiated water in Adler silt under continuous-flow and stopped-flow conditions............................................................................................................. 12-19
Figure 12-3. Breakthrough curves for nitroglycerin, nitroguanidine, and ethyl centralite from M30 propellant, and tritiated water in Adler silt under continuous-flow and stopped-flow conditions............................................................................................................. 12-20
Figure 12-4. Breakthrough curves for nitroglycerin and ethyl centralite from M9 propellant, and tritiated water in Adler silt under continuous-flow and stopped-flow conditions .......... 12-23
Figure 12-5. Breakthrough curves for nitroglycerin and ethyl centralite from M9 propellant, and tritiated water in Plymouth silt under continuous-flow and stopped-flow conditions.................................................................................................................................... 12-24
Figure 13-1. Soil sampling plan for sled track area...........................................................................13-5
Figure 13-2. Blast deflector positioned at the start of the sled track ........................................... 13-10
Tables
Table 1-1. Summary of solid propellant classes with common examples.........................................1-2
Table 1-2. Significant compounds in propellant formulations ............................................................1-6
Table 2-1. Residues collected and examined to date..........................................................................2-2
Table 2-2. Dimensions and mass of 10 propellant fibers extracted and analyzed for DNT ............2-7

ERDC TR-08-1 xvi
Table 2-3. Results to date on the dissolution of M1 fiber residues, an M1 unfired grain, and an unfired M9 propellant ......................................................................................................2-17
Table 3-1. Propellant constituents for munitions used during firing point tests ...............................3-5
Table 3-2. Areas sampled for small-arms tests....................................................................................3-7
Table 3-3. Sampled areas ....................................................................................................................3-16
Table 3-4. Analytical results and per-round calculations for small arms tests................................3-17
Table 3-5. Summary of small arms firing point propellant residues test results ............................3-20
Table 3-6. Sampler variation test results ............................................................................................3-21
Table 3-7. Downrange estimates of small-arms propellant residues deposition ............................3-22
Table 3-8. Comparison of various firing point residues loads...........................................................3-23
Table 4-1. Number of rounds fired by each group at both firing positions ......................................4-10
Table 4-2. Analytical results: Mass of NG deposited..........................................................................4-29
Table 5-1. Description of ammunitions and weapons used for each trial.........................................5-6
Table 5-2. Priming compositions used in the 9-mm MK1 ball cartridges .........................................5-6
Table 5-3. Description of munitions used.............................................................................................5-8
Table 5-4. Priming compositions used in the 7.62-mm C21 ball cartridges .....................................5-9
Table 5-5. Weapons and ammunition used for air sampling with the respective duration of sampling and firing........................................................................................................................5-15
Table 5-6. Collection media for gases and particles sampling .........................................................5-20
Table 5-7. Nomenclature of the samples and position according to the weapon...........................5-21
Table 5-8. NG residues per ammunition/weapon .............................................................................5-32
Table 5-9. Gas analysis of air samples collected at the muzzle and the upper receiver of the gun............................................................................................................................................5-35
Table 5-10. Comparison of particulate matter collected with monitoring cassettes for different weapons/ammunitions.................................................................................................5-39
Table 6-1. 105-mm tank gun ammunition propelling charges .........................................................6-12
Table 6-2. Composition of single-base propellants M1 and M6.......................................................6-18
Table 6-3. Results from the Leopard tank gun firing .........................................................................6-30
Table 6-4. Results from the soils in demolition ranges .....................................................................6-33
Table 7-1. Mass of propellant in Bags 1 to 7 in 105-mm rounds.....................................................7-12
Table 7-2. Composition of single-base propellant M1.......................................................................7-16
Table 7-3. Methods, sampling media, and equipment for each contaminant................................7-23
Table 7-4. Results from analyses of particles emitted during the muffler gun firing .....................7-30
Table 7-5. Results from analyses of particles emitted during outdoor gun firing ...........................7-32
Table 7-6. Gravimetric analysis of the residue ...................................................................................7-41
Table 7-7. Thermogravimetric analysis of the residue .......................................................................7-42
Table 7-8. Elemental analysis of the residue......................................................................................7-43
Table 7-9. Size distribution of particles for the various tests............................................................7-45
Table 7-10. Recommendations for particulate matter concentration in ambient air.....................7-45
Table 7-11. Total hydrogen cyanide concentrations for the various tests........................................7-47
Table 7-12. Benzene and toluene concentrations.............................................................................7-49

ERDC TR-08-1 xvii
Table 7-13. 2,4 dinitrotoluene concentrations for the various tests................................................7-51
Table 8-1. Propellant constituents for munitions used during firing point tests ...............................8-3
Table 8-2. Records of rounds fired in the small arm ranges of CFB Petawawa from 1997 to 2006...............................................................................................................................................8-14
Table 8-3. Laboratory blanks and laboratory control samples analyzed along with soil samples from Petawawa, 29 Palms, and Fort Richardson small arms ranges.......................8-23
Table 8-4. Relative standards deviation distribution for triplicate replicate subsample results for soils from small arms ranges at CFB Petawawa, 29 Palms, and Fort Richardson .....................................................................................................................................8-25
Table 8-5. Relative standard deviation distribution for sampling replicates from CFB Petawawa, 29 Palms, and Fort Richardson small arms ranges ...............................................8-26
Table 8-6. Concentrations of propellant-related chemicals in soils at Range 5/5A, 5.56-mm rifle range, 29 Palms, California...........................................................................................8-28
Table 8-7. Concentrations of propellant-related chemicals in soils at Range 2, 9-mm pistol range, 29 Palms, California. .........................................................................................................8-29
Table 8-8. Concentrations of propellant-related chemicals in soils at Range 113, machine gun range, 29 Palms, California...................................................................................................8-29
Table 8-9. Concentrations of propellant-related chemicals in soils at Oates machine gun firing range, Fort Richardson, Alaska...........................................................................................8-31
Table 8-10. Concentrations of propellant-related chemicals in soils at the sports firing range, Fort Richardson, Alaska ....................................................................................................8-32
Table 8-11. Concentrations of propellant-related chemicals in soils at Y Range, used for rifle training, CFB Petawawa, 2005 and 2006...........................................................................8-36
Table 8-12. Concentrations of propellant-related chemicals in soils at Rifle B Range, CFB Petawawa, 2005 and 2007..........................................................................................................8-38
Table 8-13. Concentrations of propellant-related chemicals in soils at Rifle C and D Ranges, CFB Petawawa, 2006.....................................................................................................8-39
Table 8-14. Concentrations of propellant-related chemicals in soils at Pistol Q and E Ranges, CFB Petawawa, October 2005 ......................................................................................8-40
Table 8-15. Energetic materials at firing positions at Pistol Range 4 and Rifle Range 5, CFB/ASU Wainwright.....................................................................................................................8-41
Table 8-16. Approximate number of munitions fired at Range 5, CFB/ASU Wainwright ...............8-41
Table 8-17. Energetic materials at firing positions in Rifle Range 6, CFB/ASU Wainwright ...........8-42
Table 8-18. Energetic materials at firing positions at Zeroing Range 9, CFB/ASU Wainwright......................................................................................................................................8-42
Table 8-19. Military Training Soil Quality Guidelines for the Protection of Human Health and Environment ...........................................................................................................................8-48
Table 9-1. Well information at firing positions at CFB Petawawa .......................................................9-4
Table 9-2. Maximum concentrations seen at anti-tank, artillery/mortar, and small arms firing positions in surface soils and groundwater.......................................................................9-24
Table 10-1. Chemical composition of WC859 propelling charge, 20-mm gun ...............................10-6
Table 10-2. Chemical composition of NC1066 propelling charge, 40-mm gun and 57-mm gun ..................................................................................................................................................10-7
Table 10-3. Chemical composition of NC 1281 propelling charge, 57-mm gun.............................10-7
Table 10-4. Chemical composition of the M6 +2 propelling charge, 76-mm gun ..........................10-7

ERDC TR-08-1 xviii
Table 10-5. Sample locations and area sampled ........................................................................... 10-11
Table 10-6. GPS positions for soil samples collected at the Osborne Head range...................... 10-18
Table 10-7. Results, soil samples collected at the Osborne Head range...................................... 10-22
Table 11-1. M1 propellant composition........................................................................................... 11-10
Table 11-2. Propelling charge M67 .................................................................................................. 11-10
Table 11-3. Propelling charges M3A1.............................................................................................. 11-13
Table 11-4. Overview of sampling conditions.................................................................................. 11-18
Table 11-5. Pump flows for particles sampling ............................................................................... 11-20
Table 11-6. Cut points for each stage of the cascade impactor.................................................... 11-23
Table 11-7. Polycyclic aromatic hydrocarbons analyzed in this study ........................................... 11-26
Table 11-8. Metals analyzed in this study........................................................................................ 11-27
Table 11-9. Aldehydes analyzed in this study.................................................................................. 11-28
Table 11-10. Mass of particles on the monitoring cassettes......................................................... 11-33
Table 11-11. Distribution of particles according to the cut points of the impactor ..................... 11-33
Table 11-12. Calculated total particle concentration in the plume............................................... 11-35
Table 11-13. Recommendations for particulate matter concentration in ambient air ............... 11-35
Table 11-14. Mass of particles on the monitoring cassettes......................................................... 11-54
Table 11-15. Distribution of particles according to the cut points of the impactor ..................... 11-55
Table 11-16. Calculated total particles concentration in the plume............................................. 11-55
Table 11-17. Pump calibration for each type of substance............................................................ 11-65
Table 11-18. Concentrations of formaldehyde for each sampling location.................................. 11-65
Table 12-1. Formulas and properties of nitroglycerin, nitroguanidine, and ethyl centralite ..........12-4
Table 12-2. Physical and chemical properties of test soils ............................................................ 12-10
Table 12-3. Initial mas of M9 and M30 propellants and recovery of nitroglycerin, nitroguanidine, ethyl centralite, and 3H2O tracer..................................................................... 12-14
Table 12-4. Solute transport parameters obtained by HYDRUS-1D for saturated flow experiments with 3H2O, nitroglycerin, nitroguanidine, and ethyl centralite eluting from M30 and M9 propellants in Adler and Plymouth soils............................................................ 12-16
Table 12-5. Concentrations of nitroglycerin and ethyl centralite in Adler and Plymouth soils after experiment completion ..................................................................................................... 12-22
Table 13-1. Concentration of perchlorate in surface soils at Eglin AFB sled track before and after MLRS rocket firing.........................................................................................................13-9
Table 14-1. Mass of NG or 2,4-DNT deposited per round fired for various weapon systems........14-9
Table 14-2. Summary of surface soil concentration estimates for NG and 2,4-DNT at artillery and mortar firing points ............................................................................................... 14-14
Table 14-3. Summary of surface soil concentration estimates for NG at antitank rocket firing points.................................................................................................................................. 14-16
Table 14-4. Summary of surface soil concentration estimates for NG and 2,4-DNT at small arms range firing points....................................................................................................14-17
Table 14-5. Summary of partition coefficient (Kd) and chemical half-life measurements for NG ................................................................................................................................................ 14-22
Table 14-6. Summary of batch sorption partition coefficient (Kd) and chemical half-life measurements for 2,4-DNT........................................................................................................14-24

ERDC TR-08-1 xix
Preface
This report was prepared by the US Army Engineer Research and Devel-opment Center (ERDC) and represents the collaboration of the ERDC Cold Regions Research and Engineering Laboratory (CRREL), Hanover; New Hampshire, the Defence Research Establishment Canada-Valcartier (DRDC-Val), Quebec, Canada; and the ERDC Environmental Laboratory (EL), Vicksburg, Mississippi. The research was sponsored by the Strategic Environmental Research and Development Program (SERDP), Arlington, Virginia, Mr. Bradley P. Smith, Executive Director, Dr. Jeff Marqusee, Technical Director, and Dr. Andrea Leeson, Project Monitor, under Envi-ronmental Restoration Project Number ER-1481. The principal investiga-tor was Dr. Thomas Jenkins, Research Chemist, Environmental Sciences Branch (ESB), CRREL, and co-principal investigators Dr. Guy Ampleman and Dr. Sonia Thiboutot, Research Chemists at DRDC-Valcartier.
Various chapters of this report were reviewed by Dr. Clarence L. Grant, Professor Emeritus, University of New Hampshire; Marianne E. Walsh, Michael R. Walsh, Dr. Susan Taylor, Dr. Thomas F. Jenkins, and Susan R. Bigl from ERDC-CRREL; and Dr. Mark A. Chappell, ERDC-EL.
At the time this work was performed, Colonel Richard B. Jenkins was Commander and Executive Director of ERDC. Dr. James R. Houston was Director.
ERDC TR-08-1 xx
This report may be cited as one document or by chapters as follows:
Whole document:
Characterization and Fate of Gun and Rocket Propellant Residues on Testing and Training Ranges: Final Report; ERDC Technical Report 08-1
Jenkins, T.F., G. Ampleman, S. Thiboutot, S.R. Bigl, S. Taylor, M.R. Walsh, D. Faucher, R. Martel, I. Poulin, K.M. Dontsova, M.E. Walsh, S. Brochu, A.D. Hewitt, G. Comeau, E. Diaz, M.A. Chappell, J.L. Fadden, A. Marois, R. Fifield, B. Quémerais, J. Šimunek, N.M. Perron, A. Gagnon, T. Gamache, J.C. Pennington, V. Moors, D.J. Lambert, D. Gilbert, R.N. Bailey, V. Tanguay, C.A. Ramsey, L. Mel-anson, and M.-C. Lapointe
Chapter 1: Introduction
S.R. Bigl and T.F. Jenkins
Chapter 2: Characteristics of Propellant Residues
S. Taylor, M.R. Walsh, J.L. Fadden, M.E. Walsh, V. Moors, S.R. Bigl, A.D. Hewitt, N.M. Perron, and D.J. Lambert
Chapter 3: Propellant Residues Deposition from Small Arms Munitions
M.R. Walsh, M.E. Walsh, S.R. Bigl, N.M. Perron, D.J. Lambert, and A.D. Hewitt
Chapter 4: Energetic Residues Deposition from 84-mm Carl Gustav Antitank Live Firing
S. Thiboutot, G. Ampleman, A. Marois, A. Gagnon, D. Gilbert, V. Tanguay, and I. Poulin
Chapter 5: Assessment of Gaseous and Particulate Propellant Residues Resulting from Small Arms Live Firing
D. Faucher, S. Brochu, I. Poulin, and M.R. Walsh

ERDC TR-08-1 xxi
Chapter 6: Study of Propellant Residues Emitted During 105-mm Leopard Tank Live Firing and Sampling of Demolition Ranges at CFB Gage-town, Canada
G. Ampleman, S. Thiboutot, A. Marois, A. Gagnon, and Major D. Gilbert
Chapter 7: Study of Propellant Residues and Gases Emitted During 105-mm Howitzer Live Firing at the Muffler Installation in Nicolet, Lac St-Pierre, Canada
G. Ampleman, S. Thiboutot, A. Marois, T. Gamache, I. Poulin, E. Diaz, B. Quémerais, and L. Melanson
Chapter 8: Accumulation of Propellant Residues at Small Arms Firing Points
T.F. Jenkins, A.D. Hewitt, M.R. Walsh, M.E. Walsh, R.N. Bailey, C.A. Ramsey, S.R. Bigl, D.J. Lambert, S. Brochu, E. Diaz, M.-C. Lapointe, I. Poulin, and D. Faucher
Chapter 9: Propellant Residues in Surface Soils and Groundwater at Firing Positions at Canadian Force Base Petawawa, Ontario
R. Martel, G. Comeau, S. Brochu, and A.D. Hewitt
Chapter 10: Assessment of the Dispersion of Propellant Residues from Naval Live-Fire Training
S. Thiboutot, G. Ampleman, Lieutenant (N) R. Fifield, A. Marois, and A. Gagnon
Chapter 11: Characterization of Air Emissions from Artillery Live Firing of LG1 Mark II 105-mm and M777 155-mm Howitzers
I. Poulin, E. Diaz, and B. Quémerais

ERDC TR-08-1 xxii
Chapter 12: Dissolution and Transport of Nitroglycerin, Nitroguanidine, and Ethyl Centralite from M9 and M30 Propellants in Soil
K. Dontsova, M.A. Chappell, J. Šimunek, and J.C. Pennington
Chapter 13: Estimation of Perchlorate Deposition from the Firing of a MLRS Rocket
T.F. Jenkins, A.D. Hewitt, S.R. Bigl, D.J. Lambert, and J.C. Pennington
Chapter 14: Summary and Conclusions
T.F. Jenkins, S.R. Bigl, and Judith C. Pennington

ERDC TR-08-1 xxiii
Nomenclature
ACGIH American Conference of Governmental Industrial Hygienists
ACN Acetonitrile
AEC Army Environmental Center
Ald Aldehydes
APFSDS Armor Piercing Fin Stabilized Discarding Sabot
ATR Attenuated Total Reflectance
BEI Backscattered Electron Imaging mode
BLP Blind Loaded Plug
BTC Breakthrough Curve
BTEX Benzene, Ethylbenzene, Toluene, and Xylene (o, m, p)
CCME Canadian Council of the Ministry of Environment
CEA Camp Ethan Allen
CEC Cation Exchange Capacity
CFB Canadian Force Base
CFB/ASU Canadian Force Bases/Area Support Unit
CN Total Cyanide
CRREL Cold Regions Research and Engineering Laboratory
DAD Diode Array Detector
DND Department of National Defence
DNT Dinitrotoluene
DoD Department of Defense

ERDC TR-08-1 xxiv
DPA Diphenylamine
DRDC Defence Research and Development Canada
DTA Donnelly Training Area (formerly Fort Greely), Alaska
EC Ethyl Centralite (diethyl diphenyl urea)
EDX Energy Dispersive X-ray Analysis
EL Environmental Laboratory
EOD Explosives Ordnance Disposal
EPA Environmental Protection Agency
ERDC Engineer Research and Development Center
FP Firing Position
FTIR Fourier Transform Infrared spectroscopy
GC Gas Chromatography
GC/MS Gas Chromatography/Mass Spectrometry
GPS Global Positioning System
HE High Explosive
HESH High Explosive Squash Head
HMCS Her Majesty’s Canadian Ship
HMX 1,3,5,7-tetrahydro-1,3,5,7-tetranitrotetrazocine
HPLC High-Performance Liquid Chromatography
IC/ESI/MS/MS Ionic Chromatography/Electrospray Ionization Tandem Mass Spectrometry
ICP/MS Inductively Coupled Plasma/Mass Spectrometry
LC/MS/MS Liquid Chromatography/Tandem Mass Spectrometry
kd Adsorption coefficient (cm3 g–1)

ERDC TR-08-1 xxv
METC Munitions Experimental Test Center
MG Machine Gun
MLRS Multiple Launch Rocket System
MMR Massachusetts Military Reservation
MTSQG Military Training Soil Quality Guidelines (Canada) HH - Human Health; GW - Human Health; E - Environment; AL - Aquatic Life
NC Nitrocellulose
NCSM Notre Commandant Sa Majesté
nd Not Detected
NESTR(A) Naval Electronic Systems Test Range (Atlantic)
NIOSH National Institute for Occupational Safety and Health
NG Nitroglycerin
NQ Nitroguanidine
NSN NATO Stock Number
OM Organic Matter
OSHA Occupational Safety and Health Administration
OTP Outside of the Plume
PAH Polycyclic Aromatic Hydrocarbon
PM Particulate Matter
PV Pore Volume
QC Quality Control
RDDC Recherche et Développement pour la Défense Canada
RDX 1,3,5-hexahydro-1,3,5-trinitrotriazine

ERDC TR-08-1 xxvi
RfC Reference Concentration (US EPA)
RPD Relative Percent Differences
RP-HPLC Reverse-Phase High-Performance Liquid Chromatography
RSD Relative Standard Deviation
SAW Squad Automatic Weapon (a machine gun)
SE Secondary Electron imaging mode
SEM Scanning Electron Microscopy
SERDP Strategic Environmental Research and Development Program
SH Squash Head
SH/PRAC Squash Head Practice
SRTPDS Short Range Target Practice Discarding Sabot
SVOC Semi-Volatile Organic Compound
TLV Threshold Limit Value
TNT 2,4,6-trinitrotoluene
TPFSDS Target Practice Fin Stabilized Discarding Sabot
TP RAP Target Practice Rocket Assisted Projectiles
TSP Total Suspended Particulate
UTM Universal Transverse Mercator
UV Ultraviolet
VOC Volatile Organic Compound
WP White Phosphorus
YTC Yakima Training Center, Washington

ERDC TR-08-1 1-1
— Chapter 1 —
Introduction
SUSAN R. BIGL AND THOMAS F. JENKINS
Background
To maintain readiness, armed forces of the United States and Canada must regularly conduct live-fire training exercises at Department of Defense (DoD) and Department of National Defence - Canada (DND) training ranges. To allow sustained training, each installation must comply with environmental regulations ensuring that human health and the environ-ment are not unacceptably compromised. In particular, the DoD and DND must ensure compounds produced by live-fire training residues do not mi-grate beyond installation boundaries at concentrations that impair the use of ground and surface water resources for the surrounding communities. In a DoD study funded by the Strategic Environmental Research and De-velopment Program (SERDP), ER-1155 (initially CP-1155), research was conducted largely to understand the nature and mobility of explosives residues deposited at impact areas where munitions detonate. Some initial research was also conducted on propellant residues deposited at firing point areas. Because there was substantial remaining uncertainty about the nature and mobility of propellant residues, SERDP funded ER-1481, “Characterization and Fate of Gun and Rocket Propellant Residues on Testing and Training Ranges.” This report summarizes the research con-ducted under ER-1481 by the US Army Corps of Engineers Engineer Re-search and Development Center (ERDC) and the Defence Research and Development Canada - Valcartier (DRDC Valcartier). Assessing the depo-sition, accumulation, and fate of residues associated with propellants at training range firing points furthers the DoD and DND goal of quantifying potential contaminants of concern.

ERDC TR-08-1 1-2
Gun and Small Rocket Propellant Formulations
Composition
Solid propellants for guns, artillery, and mortars are low-explosive materi-als designed to burn at a controlled rate and rapidly produce gases that create the pressure to accelerate projectiles from guns or propel rockets toward targets (US Army 1990, Folly and Mäder 2004). The rapid but con-trolled burning of low explosives such as propellants is known as deflagra-tion. Propellant formulations contain several components, with the pri-mary being an energetic material, commonly a nitro-containing organic chemical such as nitrocellulose (NC), often combined with other energetic compounds such as dinitrotoluenes (DNT), nitroglycerin (NG), or nitro-guanidine (NQ). Also included are compounds that modify burn rate, binders or plasticizers (both energetic and inert) that enable loading and packing the propellant into the shell, and lastly, compounds that absorb nitrogen oxides, the breakdown products of NC, to increase propellant stability during storage. Solid propellants used for rocket fuel (termed “composite”) include an oxidizing solid (such as ammonium perchlorate, powdered aluminum, or barium nitrate) together with an organic binder, which acts as a fuel.
Table 1-1. Summary of solid propellant classes with common examples.
Type Examples Particle type* Principal ingredients
Single base
M1 M6
M10
Single- or multi-perforated cylinder Multi-perforated cylinder
Flake; Single- or multi-perforated cylinder
NC, 2,4-DNT NC, 2,4-DNT
NC, diphenylamine
Double base
M2 M5 M8
Single- or multi-perforated cylinder Single-perforated cylinder or flake
Increment sheet
NC, NG, ethyl centralite NC, NG, ethyl centralite
NC, NG, diethyl phthalate
Triple base
M30 M31
Multi-perforated cylinder or hexagonal Multi-perforated cylinder;
Single-perforated cylinder or stick NC, NG, NQ, ethyl centralite NC, NG, NQ, ethyl centralite
* Particle shapes are shown in Figure 1-1.
Solid propellants with NC are divided into three classes based on presence of added energetic compounds (Table 1-1). Single-base propellants contain NC alone as the principal energetic material. Double-base propellants contain NC infused with a liquid organic nitrate, such as NG, which can gelatinize the NC. Triple-base propellants include the two double-base compounds NC and NG along with nitroguanidine (NQ), also known as

ERDC TR-08-1 1-3
picrite. NQ has an explosive power similar to that of NG, but burns at a lower temperature, thereby reducing erosion in the gun barrel and reduc-ing flash.
Three of the stabilizers utilized in propellant formulations are diphenyl-amine (DPA), ethyl centralite (diethyl diphenyl urea), and akardites (methyl diphenyl urea). DPA is used only in single-base propellants because it is incompatible with the gelatinizing agent NG. Double- and triple-base propellant formulations with NG use either ethyl centralite or 2-nitrodiphenylamine as a stabilizer. Some double- and triple-base compositions that employ diethylene glycol dinitrate (DEGDN) rather than NG as the gelatinizer use a form of akardite for stabilization.
Deterrents or burn rate modifiers are added to propellants used in small arms and large-caliber artillery rounds. They are impregnated into the propellant surface, forming a coating that slows the initial burning rate. Commonly used deterrents include 2,4-dinitrotoluene (DNT), 2,6-dinitrotoluene, and ethyl centralite. A variety of alkali metal salts are also added to some propellants to help reduce secondary flash and smoke.
Other non-energetic binders and plasticizers are included in some propel-lant compositions to make the grains less brittle. Examples are two esters of 1,2-benzenedicarboxylic (or phthalic) acids—dibutyl phthalate and di-ethyl phthalate. A less commonly used binder is triacetin.
The propellant grains are also often coated with graphite, a lubricant that prevents the grains from sticking together and dissipates static electricity, avoiding undesired ignitions. Other additives can be included to lower wear of the gun barrel liners. Examples include wax, talc, and titanium dioxide.
Grain Size and Shape
The properties of the propellant are greatly influenced by the size and shape of the grains, which can be in a variety of small spherical balls, plates, or flakes, or in different forms of extruded cylinders (Fig. 1-1). The propellant burns only on the particle surfaces; therefore, larger grains burn slower. Many of the cylindrical shapes have internal perforations to allow burning from the inside outwards simultaneously with burning from the outside inwards. Some cylinders have a single central perforation; oth-ers have multiple perforations, commonly with a central hole surrounded

ERDC TR-08-1 1-4
by six others. The size and shape of propellant grains used in a particular munition are balanced in an attempt to regulate the burn so that an evenly constant pressure is exerted on the propelled projectile while it is in the barrel.
a. Propellant grain shapes.
b. Example sizes.
Figure 1-1. Propellant grain shapes and example sizes. (From US Army 1990, 1993.)

ERDC TR-08-1 1-5
Ignition Train
Propelling charges are ignited through a chain reaction called an ignition train, usually a series of combustibles and explosives arranged according to decreasing sensitivity (Fig. 1-2). To activate, a stimulus such as impact, heat, or spark ignites a small primer. In artillery ammunition, the primer then sets fire to the igniter charge, which intensifies the small flame pro-duced by the primer and initiates combustion of the large quantity of pro-pellant. In some cases, igniter charges are also sandwiched between layers of propellant. Commonly used igniter charges include black powder—a combination of potassium nitrate, charcoal, and sulfur—and potassium nitrate by itself.
Figure 1-2. Schematic of propelling charge ignition train. (From US Army 1990.)
Primer compositions are a mixture of primary explosives, fuels, oxidizers, and other binders. Primary explosives include lead azide, diazodinitrophe-nol (DDNP), lead styphnate, tetracene, potassium dinitrobenzofuroxane (KDNBF), and lead mononitroresorcinate (LMNR). Fuels used are metal thiocynates, antimony sulfide, and calcium silicide. Oxidizing agents in-clude potassium chlorate and barium nitrate.
Primers include three main types: percussion, stab detonator, and electri-cal. Several percussion and stab detonator priming compositions include the compounds lead styphnate, tetracene, barium nitrate, antimony sul-fide, powdered zirconium, lead dioxide, and PETN.

ERDC TR-08-1 1-6
The most commonly used electrical primers are the exploding bridge wire, the hot wire bridge, and the film bridge. In an exploding wire detonator, a large current passing through the wire causes it to burst, creating a shock wave that causes the detonation. With this type, no priming composition is needed; the wire is placed directly in a charge of RDX or PETN. Hot wire and film bridges use priming compositions that include potassium chlo-rate with various combinations of lead mononitroresorcinate, NC, lead thiocynate, DDNP, charcoal, nitrostarch, titanium, and aluminum.
Summary
Table 1-2 summarizes the significant ingredients that compose the propel-lant portion of propelling charges. The greatest mass is composed of the oxidizers and energetic binders, ranging between 60 and 90 percent by weight (Miller 1997, MIDAS 2007, Mirecki et al. 2006). Plasticizers and inert binders account for approximately 5 to 25 weight percent. Stabilizers and other compounds (flash reducers, primers, and igniters) account for the remainder, occurring at less than 5 weight percent each.
Table 1-2. Significant compounds in propellant formulations.
Oxidizers and energetic plasticizers Stabilizers
Inert binders and plasticizers Other
Nitro-based diphenylamine dibutyl phthalate Burn rate modifiers nitrocellulose 2-nitrodiphenylamine diethyl phthalate 2,4-dinitrotoluene
nitroglycerin ethyl centralite triacetin 2,6-dinitrotoluene
nitroguanidine akardite wax ethyl centralite
diethylene glycol dinitrate talc Flash reducers
Other titanium oxide potassium sulfate
ammonium perchlorate potassium nitrate
potassium perchlorate
Larger Rocket Propellants
Composite propellants, typically used in medium and large rocket motors, contain neither nitrocellulose nor an organic nitrate. They generally con-sist of a physical mixture of an organic fuel (such as ammonium picrate), an inorganic oxidizer (commonly perchlorate or aluminum), and an or-ganic binding agent. These mixtures have adequate mechanical strength to be manufactured in dimensions larger than NC-based propellants, making them favorable for use in larger rocket motors.

ERDC TR-08-1 1-7
Previous Research on Propellant Residues at Military Ranges
The first documented results for propellant residues in soil were from samples collected at Explosives Ordnance Disposal (EOD) ranges in Alaska and Mississippi. During an investigation of the reason for a series of waterfowl deaths at Eagle River Flats, an artillery impact area at Fort Richardson, Alaska, Racine et al. (1992) analyzed sediments collected near an EOD range and reported detecting 2,4-DNT, a component of M1 pro-pellant used with 105-mm howitzers. These samples and several others from an EOD range at Camp Shelby, Mississippi, were further analyzed by GC/MS and found to contain not only 2,4-DNT, but also diphenylamine and dibutyl phthalate, also ingredients of M1 propellant (Walsh and Jen-kins 1992). Similarly, Phillips and Bouwkamp (1994) found nitroglycerin, 2,4-DNT, n-nitrosodiphenyl amine, and dibutyl phthalate in soil samples collected from firing point areas at Aberdeen Proving Ground, Maryland. N-nitrosodiphenyl amine is a product formed from the reaction of nitro-gen oxides (released from decomposition of NC during storage of M1 pro-pellants) and diphenylamine (Folly and Mäder 2004).
A series of investigations at impact areas and firing point areas were spon-sored by US Army Environmental Center (AEC), SERDP (ER-1155), the National Guard Bureau at Massachusetts Military Reservation (MMR), the US Army Alaska, and the Canadian Government by the Department of National Defence Canada.
The AEC program sampled artillery firing point areas at Camp Shelby, Mississippi; Fort Bliss, New Mexico; Fort Polk, Louisiana; Fort Hood, Texas; and Fort Carson, Colorado. At Camp Shelby, AEC found 2,4-DNT, 2,6-DNT, and NG at one of two firing point areas that were sampled (USACHPPM 2001). At Fort Bliss, where two artillery firing points were sampled, NG was the only propellant-related compound detected, at the sub mg/kg level. At Fort Carson, surface soils at Firing Point 141, which has been used for direct live-fire training exercises with heavy artillery and numerous other ammunition types, had NG at concentrations ranging from 0.18 to 23.0 mg/kg (USACHPPM 2007). A small amount of 2,4-DNT, 0.16 mg/kg, was found in only one sample.

ERDC TR-08-1 1-8
A series of studies sponsored by US Army Garrison Alaska investigated the levels of propellant residues at firing points and impact areas at Fort Richardson and Fort Greely, Alaska. In the initial study, two types of firing points were sampled: an area where 40-mm grenades were fired for a spe-cial test, and a firing point used for firing a number of weapon systems in-cluding mortars and 105-mm howitzers (Walsh et al. 2001). No energetic residues were found in soils at the 40-mm test site, but this was likely due to its active floodplain location in an area with evidence of recent erosion. Both NG and 2,4-DNT were found in two surface soil samples collected at the multi-use firing point (NG: 3.3 and 16.5 mg/kg; 2,4-DNT: 0.005 and 0.044 mg/kg).
Subsequent studies concentrated on 105-mm howitzer firing points at the Donnelly Training Area (DTA, formerly Fort Greely). Extensive sampling was conducted at both vegetated and unvegetated firing points. Concen-trations of 2,4-DNT were generally in the low mg/kg range. Experiments determined that residues were deposited at least 100 m from the muzzle (Walsh et al. 2004). The research also found that the propellant residues were deposited as fibers of burned and unburned propellant (Walsh et al. 2004). Iterative sampling at the DTA firing points showed no significant accumulation of 2,4-DNT over the years, indicating that possible leaching and degradation reactions are occurring (Walsh et al. 2007). Studies at Fort Richardson 105-mm firing points also found 2,4-DNT and NG con-centrations in the low mg/kg (Walsh et al. 2007). A component of these studies involved evaluating the ability of sampling and sample preparation techniques to produce representative results. Multi-increment samples composed of at least 50 increments provided representative samples for areas as large as 10,800 m2. Accurate estimation of the analyte concentra-tions in these samples required that either the entire sample had to be ex-tracted or the sample had to be ground thoroughly before it could be re-producibly subsampled (Walsh et al. 2007).
The largest number of soil samples collected at any training range has been at Camp Edwards, Massachusetts Military Reservation, on Cape Cod. Clausen et al. (2004) summarized the results from this study for gun and mortar firing points. 2,4-DNT was detected in 4% of the soil samples col-lected at this range, mostly in the surface to 1-ft-depth samples. Also, 2,6-DNT, diethyl phthalate, n-nitrosodiphenylamine, and di-n-butyl phthalate were occasionally found. In addition, 2,4-DNT and NG were found on the KD rocket range (Ogden 2000).
ERDC TR-08-1 1-9
As a part of SERDP Environmental Restoration Research Project ER-1155, which had a primary objective of evaluating energetic residues at impact areas, several firing point areas were also sampled. Antitank rocket firing points were sampled at Yakima Training Center (Pennington et al. 2002), Canadian Force Base (CFB) Valcartier (Jenkins et al. 2004), CFB Gage-town (Thiboutot et al. 2004), and CFB Petawawa (Brochu et al. 2006). In all cases, NG was found in front, and to a much greater extent, behind the line where the shoulder-fired anti-tank rockets are fired. Concentrations as high as 2400 mg/kg have been found in surface soils and NG deposition has been detected at least 25 m behind the firing line.
Artillery firing points also were sampled at Fort Lewis and Yakima Train-ing Center, in Washington State. At Fort Lewis, 2,4-DNT was detected in surface samples in front of a firing position where 105-mm howitzers had fired more than 600 rounds in the proceeding month (Jenkins et al. 2001). At Yakima, samples were collected at the multi-purpose range complex at a fixed firing position where 120-mm tank cannons were fired. Both 2,4-DNT and NG were detected as far as 75 m in front of the firing position (Pennington et al. 2002).
Recent interest has turned to propellant compound deposition at small arms ranges. To our knowledge, prior to the current study the only publi-cation related to this was by Brochu et al. (2006) and provides initial re-sults for several small arms ranges at CFB Petawawa. At both pistol and rifle ranges, 2,4-DNT was found in surface soils with a maximum concen-tration of 9.6 and 2.3 mg/kg, respectively. Although NG was not detected in samples collected during 2004 at these ranges, it has been detected in more recent sampling (Brochu, personal communication, Chapter 8 of this report).

ERDC TR-08-1 1-10
Objectives
The two major objectives of this SERDP-sponsored project, ER-1481, titled “Characterization and Fate of Gun and Rocket Propellant Residues on Testing and Training Ranges,” are:
1. Develop the environmental data to characterize potential releases and fate of gun and rocket propellants as they occur on training and testing ranges.
2. Characterize residues from gun propellants and characterize leach-ing rates of contaminants bound in these materials.
ERDC TR-08-1 1-11
Scope of Project
ER-1481 was designed to acquire data for estimating mass and concentra-tions of propellant residues in the source zone, as well as process descrip-tors for mass transport from the surface to groundwater or in runoff—the data needed for use in risk assessments. Another objective was to evaluate actual ground-truth of propellant transport at specific sites.
The study was executed in several thrust areas. The first involved quantify-ing the amounts of burned combustion products being emitted during an individual firing of various gun and rocket types, including both gaseous emissions and particulate residues. Field experiments were conducted during live-fire training of various weapons to delineate the footprint of deposition and mass deposited as a function of distance from the firing position. Winter trials utilized pristine snow surfaces for collection of sam-ples to estimate mass. In summer trials, we used witness plates or small pans to collect residue for mass estimation and microscopic analysis. Ini-tial studies discussed in the first annual report (Jenkins et al. 2007) in-cluded mass-estimation tests with 60- and 81-mm mortars, and with a 155-mm howitzer, and witness plate sampling at Canadian exercises with 105-mm howitzers (LG1 Mark II and C3) and an Mk58 rocket motor. After a second year of study, we report here on the microscopic analyses of pro-pellant particles (Chapter 2). Mass-estimation tests were conducted with several types of small arms both on snow (Chapter 3) and in summer trials (Chapter 5) . Other live-firing studies were done with various munitions, including the 84-mm Garl Gustav antitank weapon (Chapter 4), the 105-mm Leopard tank (Chapter 6), the 105-mm howitzer (Chapter 7), the Canadian Naval 57-mm cannon (Chapter 10), and an MLRS rocket motor (Chapter 13). Gaseous air emissions from Canadian howitzers were also evaluated, both in an enclosed muffler facility and during outdoor trials (Chapters 7 and 11).
A second thrust involved collecting representative soil samples at several training ranges to assess the accumulation rate of propellant residues for the different weapons systems. A portion of this work involved an effort to refine sampling, subsampling, and analytical protocols that were devel-oped in ER-1155 for explosives residues, to accommodate the determina-tion of propellant residues. During the first year, we sampled soils at a
ERDC TR-08-1 1-12
wide variety of training ranges (Jenkins et al. 2007). Locations sampled included two antitank rocket ranges, a 155-mm howitzer firing point, two 105-mm howitzer (LG1 Mark II and C3) firing points, areas where 40-mm rifle grenades were fired, an 81-mm mortar firing point, and several small arms firing points.
Sampling experiments during the first year indicated that multi-increment surface soil samples collected using a systematic-random sampling design provide reproducible results for energetic propellant residues. It is recom-mended that samples be constructed with between 30 and 100 increments and have a mass of at least 300 g, with a goal of achieving a 1-kg mass. Presence of a fairly small number of individual fibers and propellant pieces in firing point soils makes it difficult to obtain representative subsamples. We found that processing and subsampling protocols developed by Walsh et al. (2004, 2007) provide reliable subsamples from soil samples contain-ing propellant residues. These protocols require samples to be air-dried, passed through a 10-mesh (2-mm) sieve to remove oversize material, and adequately pulverized with a mechanical grinder using five 60-sec grind-ing cycles.
During our second study year, soil sampling was conducted at numerous small arms firing points (Chapter 8). We also include a chapter that com-piles results from multiple years of soil sampling conducted at CFB Peta-wawa (Chapter 9). The sites investigated included multiple-use firing posi-tions where primarily (~95%) small arms bullets (5.56 mm, 7.62 mm, 9 mm) were fired. The remainder of use at these sites included 25-mm car-tridges and a wide variety (nearly 60 different types) of munitions of me-dium (60 mm, 81 mm) and large caliber (105 mm, 155 mm) as well as gre-nades, anti-tank rockets, and missiles. Surface soil was also sampled at a Navy land-based fixed firing position where munitions had been fired faced offshore until 1992 (Chapter 10).
Another thrust of this study was to define transport process descriptors suitable for use in environmental transport models or in environmental and human health risk assessments. This was accomplished by conducting laboratory column experiments with selected propellant constituents and solid-phase propellant formulations under different flow regimes and in different soils. The first year report describes tests with NG, NQ, and DPA in both a sandy and silty matrix. The second year tests, reported on in Chapter 12, involved column experiments with full M30 and M9 propel-

ERDC TR-08-1 1-13
lant grains and characterizing transport of dissolved propellant compo-nents NG, NQ, and ethyl centralite.
An ultimate goal is to evaluate transport of compounds to groundwater. CFB Petawawa has an excellent groundwater monitoring infrastructure and results of groundwater sampling at that site are also described in Chapter 9.
ERDC TR-08-1 1-14
References
Brochu, S., E. Diaz, S. Thiboutot, G. Ampleman, A.D. Hewitt, S.R. Bigl, M.E. Walsh, K. Bjella, T. Ranney, M.R. Walsh, S. Taylor, C. Ramsey, D. Lambert, and N. Perron (2006) Assessment of 100 Years of Military Training in Canada: The Case of Canadian Force Base Petawawa. In Distribution and Fate of Energetics on DoD Test and Training Ranges: Interim Report 6. US Army Engineer Research and Development Center, Vicksburg, Mississippi, Technical Report ERDC TR-06-12.
Clausen, J., J. Robb, D. Curry, and N. Korte (2004) A case study of contaminants on military ranges: Camp Edwards, Massachusetts, USA. Environmental Pollution 129:13–21.
Folly, P., and P. Mäder (2004) Propellant Chemistry. CHIMIA International Journal for Chemistry 58(6):374–382.
Jenkins, T.F., J.C. Pennington, T.A. Ranney, T.E. Berry, Jr., P.H. Miyares, M.E. Walsh, A.D. Hewitt, N. Perron, L.V. Parker, C.A. Hayes, and Major E. Wahlgren (2001) Characterization of Explosives Contamination at Military Firing Ranges. US Army Engineer Research and Development Center, Vicksburg, Mississippi, Technical Report ERDC TR-01-05.
Jenkins, T.F., T.A. Ranney, A.D. Hewitt, M.E. Walsh, and K.L. Bjella (2004) Repre-sentative Sampling for Energetic Compounds at an Antitank Firing Range. US Army Engineer Research and Development Center, Cold Regions Research and Engineering Laboratory, Hanover, New Hampshire, Technical Report ERDC/ CRREL TR-04-7.
Jenkins, T.F., J.C. Pennington, G. Ampleman, S. Thiboutot, M.R. Walsh, E. Diaz, K. Dontsova, A. Hewitt, M.E. Walsh, S. Bigl, S. Taylor, D. MacMillan, J. Clausen, D. Lambert, N. Perron, M. Lapointe, S. Brochu, M. Brassard, R. Stowe, R. Farinaccio, A. Gagnon, A. Marois, D. Gilbert, D. Faucher, S. Yost, C. Hayes, C. Ramsey, R. Rachow, J. Zufelt, C. Collins, A. Gelvin, and S. Saari (2007) Characterization and Fate of Gun and Rocket Propellant Residues on Testing and Training Ranges: Interim Report 1. US Army Engineer Research and Development Center, Cold Regions Research and Engineering Laboratory, Hanover, New Hampshire, Technical Report ERDC TR-07-1.
MIDAS (Munitions Items Disposal Action System) (2007) Defense Ammunition Center, McAlester, Oklahoma (http://www.dac.army.mil/TD/Midas/Index.htm)
Miller, M.S. (1997). Thermochemical Properties of Six Solid Gun Propellants. ARL-TR-1322. Army Research Laboratory, Aberdeen Proving Ground, Maryland.
Mirecki, J.E., B. Porter, and C.A. Weiss, Jr. (2006) Environmental Transport and Fate Process Descriptors for Propellant Compounds. US Army Engineer Research and Development Center, Vicksburg, Mississippi, Technical Report ERDC/EL TR-06-7.

ERDC TR-08-1 1-15
Ogden (2000) Final IAGS Technical Team Memorandum 99-1 KD & U Ranges for the Camp Edwards Impact Area Groundwater Quality Study, Massachusetts Mili-tary Reservation Cape Cod, Massachusetts (MMR-1903), July, 2000. Report prepared for the National Guard Bureau. Westford, Massachusetts: Ogden Envi-ronmental and Energy Services.
Pennington, J.C., T.F. Jenkins, G. Ampleman, S. Thiboutot, J.M. Brannon, J. Lynch, T.A. Ranney, J.A. Stark, M.E. Walsh, J. Lewis, C.A. Hayes, J.E. Mirecki, A.D. Hewitt, N. Perron, D. Lambert, J. Clausen, and J.J. Delfino (2002) Distribution and Fate of Energetics on DoD Test and Training Ranges: Interim Report 2. US Army Engineer Research and Development Center, Vicksburg, Mississippi, Technical Report ERDC TR-02-8.
Phillips, L.F., and C.A. Bouwkamp (1994) Wastewater management study No. 32-24-HP16-94. Effects of active firing range activities on environmental media. Aberdeen Proving Ground—Aberdeen Area, Maryland, 31 January–30 Novem-ber 1993. Aberdeen Proving Ground, MD: US Army Environmental Hygiene Agency.
Racine, C.H., M.E. Walsh, C.M. Collins, D.J. Calkins, B.D. Roebuck, and L. Reitsma (1992) Waterfowl Mortality in Eagle River Flats, Alaska: The Role of Munitions Residues. US Army Cold Regions Research and Engineering Laboratory, Hanover, New Hampshire, CRREL Report 92-5.
Thiboutot, S., G. Ampleman, A. Marois, A. Gagnon, M. Bouchard, A. Hewitt, T. Jenkins, M. Walsh, K. Bjella, C. Ramsey, and T.A. Ranney (2004) Environmental Con-ditions of Surface Soils, CFB Gagetown Training Area: Delineation of the Presence of Munitions-Related Residues (Phase III, Final Report). DRDC Valcartier TR 2004-205. Québec, Québec: Defence Research and Development Canada - Valcartier.
USACHPPM (2001) Final Geohydrologic Study No. 38-EH-6807-02. Training range site characterization and risk screening, Camp Shelby, Mississippi, 7–23 September 1999. Aberdeen Proving Ground, Maryland: US Army Center for Health Promo-tion and Preventive Medicine.
USACHPPM (2007) Training range site characterization and risk evaluation, regional range study, Fort Carson, Colorado, Project No. 38-EH-02M6-04. Aberdeen Proving Ground, Maryland: US Army Center for Health Promotion and Preven-tive Medicine
US Army (1990) Military explosives. Department of the Army, Headquarters, Washing-ton, DC, Army Technical Manual TM 9-1300-214 (with Change No. 4).
US Army (1993) Ammunition, general. Department of the Army, Headquarters, Wash-ington, DC, Army Technical Manual TM 9-1300-200 (with Change No. 5).
Walsh, M.E., and T. Jenkins (1992) Identification of TNT Transformation Products in Soil. US Army Cold Regions Research and Engineering Laboratory, Hanover, New Hampshire, Special Report 92-16.

ERDC TR-08-1 1-16
Walsh, M.E., C.M. Collins, C.H. Racine, T.F. Jenkins, A.B. Gelvin, and T.A. Ranney (2001) Sampling for Explosives Residues at Fort Greely, Alaska: Reconnais-sance Visit July 2000. US Army Engineer Research and Development Center, Cold Regions Research and Engineering Laboratory, Hanover, New Hampshire, Technical Report ERDC/CRREL TR-01-15.
Walsh, M.E., C.M. Collins, A.D. Hewitt, M.R. Walsh, T.F. Jenkins, J. Stark, A. Gelvin, T.S. Douglas, N. Perron, D. Lambert, R. Bailey, and K. Myers (2004) Range Characterization Studies at Donnelly Training Area, Alaska: 2001 and 2002. US Army Engineer Research and Development Center, Cold Regions Research and Engineering Laboratory, Hanover, New Hampshire, Technical Report ERDC/CRREL TR-04-3.
Walsh, M.E., C.M. Collins, C.A Ramsey, T.A. Douglas, R.N. Bailey, M.R. Walsh, A.D. Hewitt, and J.L. Clausen (2007) Energetic Residues on Alaskan Training Ranges: Studies for US Army Garrison Alaska in 2005 and 2006. US Army Engineer Research and Development Center, Cold Regions Research and Engineering Laboratory, Hanover, New Hampshire, Technical Report ERDC/CRREL TR-07-9.

ERDC TR-08-1 2-1
— Chapter 2 —
Characteristics of Propellant Residues
SUSAN TAYLOR, MICHAEL R. WALSH, JENNIFER L. FADDEN, MARIANNE E. WALSH, VICTORIA MOORS, SUSAN R. BIGL,
ALAN D. HEWITT, NANCY M. PERRON, AND DENNIS J. LAMBERT
Introduction
Nitrocellulose-based propellants, impregnated with either 2,4-dinitro-toluene (2,4-DNT), known as single base, or nitroglycerin NG (double base), are commonly used to fire military munitions. The fate and trans-port of the energetic compounds NG and 2,4-DNT are of environmental interest as they can contaminate groundwater. Little is known about the form in which the energetic constituents are deposited onto the soil sur-face and how quickly they dissolve. We examined propellant residues collected at artillery and small arms firing points and performed short dissolution studies on them. We also obtained samples of the unfired propellant grains to help guide our search for the fired residues.
In this chapter we describe the appearance of the unfired and fired propel-lants. We then show the results of dissolution tests on fired and unfired M1 propellants and of unfired M9 propellants.

ERDC TR-08-1 2-2
Materials and Methods
We examined propellant residues collected at the firing points of artillery and mortar rounds (155- and 105-mm howitzers, and 120-, 81-, and 60-mm mortars), and from firing a variety of small arms (9-mm pistol, 5.56-mm rifle, and a 7.62-mm and a .50-caliber machine gun) (Table 2-1).
Table 2-1. Residues collected and examined to date.
% energetics
Weapon Munition Propellant Type Unfired* Unfired† Fired†
Howitzer 155 mm M1 - 1 hole DNT 10 ± 2 9.2 BD
Howitzer 155 mm M1 - 1 hole DNT 10 ± 2 9.0 BD
Howitzer 105 mm M1 - 7 hole DNT 10 ± 2 9.7 9.4 ± 1.6**
Stryker 120 mm M45 NG 44 ± 1.5 9
Mortar 81-mm Ill M9 NG 40 ± 1.5 39.2 20
Mortar 81-mm HE M10 NC 98 — —
Mortar 60-mm HE M10 NC 98 — —
Pistol 9 mm WPR289 NG 12 to 18 12.2 ± 0.6 9
Rifle 5.56 mm WC844 NG 9 to 11 9.9 ± 0.2 7
Machine gun 7.62 mm WC846 NG 8 to 11 10.2 ± 0.3 4
Machine gun .50 cal WC860 NG 8 to 11 9.7 ± 0.1 6
* From Technical Manuals † Analyzed at CRREL ** n = 30 fibers
We collected these residues in one of two ways, either using aluminum trays set at specified distances in front of the gun muzzles or by collecting and melting the top layer of snow after wintertime firing exercises. The residues were examined at CRREL using a Wild 2 stereomicroscope. We sorted through the residue collected for each type of round and separated out likely propellant residues from any soil present. Candidate particles were photographed and then a representative particle of each type was placed in a 20-mL scintillation vial with 1.0 mL of acetonitrile, allowed to stand overnight, and then analyzed by high-performance liquid chroma-tography (HPLC) to determine its composition.
Energetic compounds found in propellants were determined following SW-846 Method 8330B (EPA 2006). Three mL of water were added to

ERDC TR-08-1 2-3
the 1-mL acetonitrile extracts and filtered through a 0.45-µm Millipore cartridge. HPLC was used to separate NG, 2,4-DNT, and their co-contaminants using a Water NovaPak C8 column eluted at 1.4 mL/min (28 °C) with 85:15 water: isopropanol mix and detected by UV at 254 nm or 210 nm. Commercially available standards (Restek) developed for energetics were used for calibration. We prepared 1-ppm and 10-ppm 8095A standards. Ideally, the samples should have had concentrations around 1 ppm, and if their concentrations were >20 ppm, they were diluted and reanalyzed. The 1-ppm standard was run every ten samples to recalibrate the instrument. Blanks were run before each standard run to minimize the possibility of carryover, which would produce a poor calibration. The 10-ppm standard was interspersed with the samples as an unknown, and a blank was run after each to minimize carryover.

ERDC TR-08-1 2-4
Appearance and Composition of Propellants
Single-Base Propellants
Single-base propellants are widely used to fire artillery and mortar rounds and generally contain the energetic compounds NC and 2,4-DNT. We examined propellant residues from both 105-mm and 155-mm howitzers. The firing point residues for the howitzer rounds were collected at Eagle River Flats and Fort Greeley, Alaska; Yuma Proving Ground, Arizona; and Fort Lewis, Washington.
155-mm Howitzer
The 155-mm howitzer rounds sampled were fired using a 5.5-mm by 1.5-mm, single perforated propellant grain (Fig. 2-1a and b). Residues collected after firing the 155-mm rounds contained many rounded, clear particles, some metal fragments and beads, pieces of fabric from the propellant bags, and black particles that are aggregates of metal and soot. The ubiquitous clear particles (Fig. 2-1c) appeared not to be energetic components of the propellant, but stabilizers or binders in the M1 grain. These particles dissolved in acetone, and energy dispersive X-ray analyses showed they contain potassium and sulfur, probably potassium sulfate, which is used in the M1 composition 3 formulation (Technical Manual 9-1300-214). In none of the 155-mm residues did we identify particles that contained 2,4 DNT. Furthermore, for residues collected from snow samples, the snow extracted and analyzed after the firing of these rounds contained very low levels of 2,4-DNT (Walsh et al. 2005).
105-mm Howitzer
The 105-mm howitzer rounds were fired using 8-mm-long by 3.5-mm-diameter, multi-perforated propellant grains (Fig. 2-2a). In contrast to the residues from the 155-mm propellants, the residues collected after firing the 105-mm rounds contained low parts per million (ppm) quantities of 2,4 DNT on the soil (Walsh et al. 2007). The 2,4-DNT occurs in mm-long fibers that have triangular cross sections. Technical Manual 9-1300-214 describes how the multi-perforated grain burns from the hole interiors outward, leaving 12 slivers of unfired propellant (Fig. 2-2b) that account for 15% of the mass of each propellant grain. These slivers—we call them fibers—contained 2,4-DNT, as can be seen by their reaction with tetra

ERDC TR-08-1 2-5
butyl ammonium hydroxide (Fig. 2-2c), forming the highly colored Janowsky anion (Jenkins and Walsh 1992), and by analysis of individual fibers (Table 2-2 and Walsh et al. 2007).
Figure 2-1. Side view (a) and end view (b) of M1 single-perforated propellant. Clear grains
deposited from firing this propellant (c) contain potassium and sulfur, but no 2,4-DNT.

ERDC TR-08-1 2-6
Figure 2-2. Multi-perforated M1 propellant used to fire the 105-mm howitzer rounds (a)
and the resultant fiber residues (b). Tetra butyl ammonium hydroxide placed on one of these fibers (c) shows that it contains 2,4-DNT.
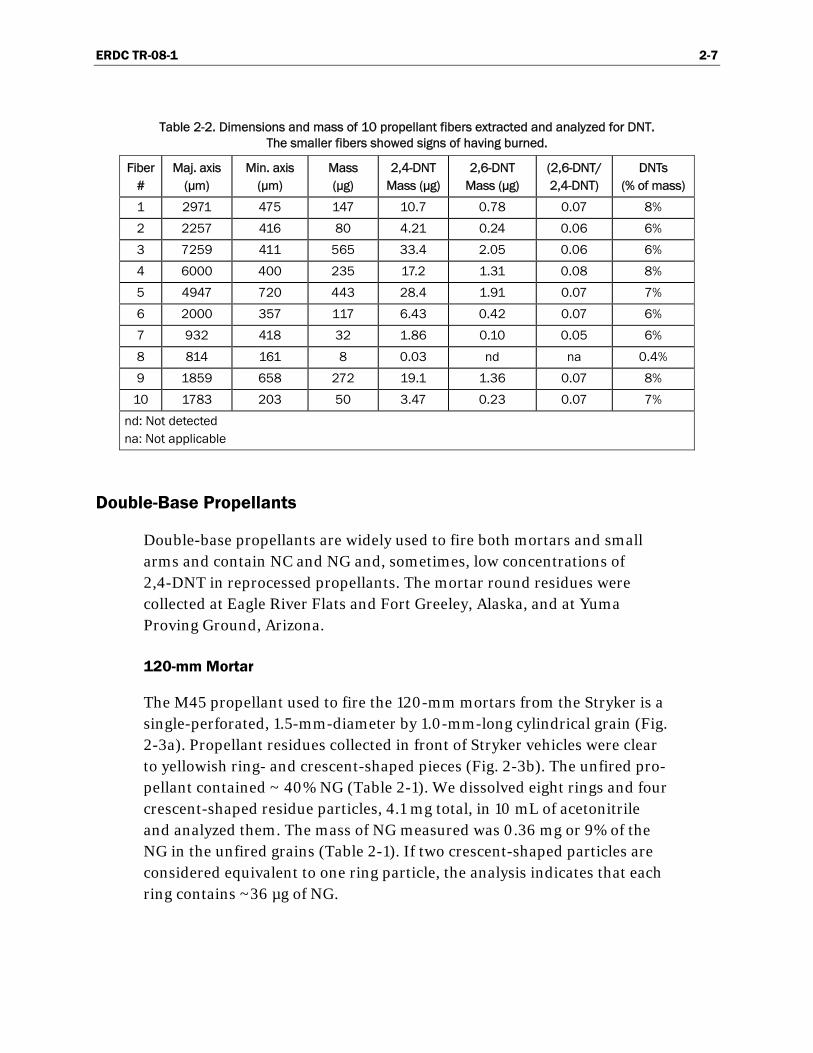
ERDC TR-08-1 2-7
Table 2-2. Dimensions and mass of 10 propellant fibers extracted and analyzed for DNT. The smaller fibers showed signs of having burned.
Fiber #
Maj. axis (µm)
Min. axis (µm)
Mass (µg)
2,4-DNT Mass (µg)
2,6-DNT Mass (µg)
(2,6-DNT/ 2,4-DNT)
DNTs (% of mass)
1 2971 475 147 10.7 0.78 0.07 8%
2 2257 416 80 4.21 0.24 0.06 6%
3 7259 411 565 33.4 2.05 0.06 6%
4 6000 400 235 17.2 1.31 0.08 8%
5 4947 720 443 28.4 1.91 0.07 7%
6 2000 357 117 6.43 0.42 0.07 6%
7 932 418 32 1.86 0.10 0.05 6%
8 814 161 8 0.03 nd na 0.4%
9 1859 658 272 19.1 1.36 0.07 8%
10 1783 203 50 3.47 0.23 0.07 7%
nd: Not detected na: Not applicable
Double-Base Propellants
Double-base propellants are widely used to fire both mortars and small arms and contain NC and NG and, sometimes, low concentrations of 2,4-DNT in reprocessed propellants. The mortar round residues were collected at Eagle River Flats and Fort Greeley, Alaska, and at Yuma Proving Ground, Arizona.
120-mm Mortar
The M45 propellant used to fire the 120-mm mortars from the Stryker is a single-perforated, 1.5-mm-diameter by 1.0-mm-long cylindrical grain (Fig. 2-3a). Propellant residues collected in front of Stryker vehicles were clear to yellowish ring- and crescent-shaped pieces (Fig. 2-3b). The unfired pro-pellant contained ~ 40% NG (Table 2-1). We dissolved eight rings and four crescent-shaped residue particles, 4.1 mg total, in 10 mL of acetonitrile and analyzed them. The mass of NG measured was 0.36 mg or 9% of the NG in the unfired grains (Table 2-1). If two crescent-shaped particles are considered equivalent to one ring particle, the analysis indicates that each ring contains ~36 µg of NG.

ERDC TR-08-1 2-8
Figure 2-3. Unfired M45 propellant (a) and the propellant residues remaining after firing (b).
81-mm Illumination Mortar
The M9 propellant used to fire 81-mm illumination mortars is a cylinder 1.5 mm in diameter by 0.5 mm long. The propellant grain is yellow in color, has a metallic sparkle, and contains no hole (Fig. 2-4a). The propel-lant residues that resulted from burning these grains are grey disks that have similar or smaller diameters. Some are fragments of disks (Fig. 2-4b). To quantify the composition, we dissolved and analyzed 117 mg of the unfired propellant in 250 mL of acetonitrile. The percentage of NG was 39%, within the range 40 ± 1.5% listed in Technical Manual 43-0001-28. We dissolved 7.3 mg of the fired propellant disks in 10 mL of acetonitrile. The mass of NG measured was 1.47 mg or 20% of the mass of the unfired grains (Table 2-1).
Figure 2-4. Unfired (a) and fired (b) M9 propellant used for the 81-mm illumination mortars. Note that some of the residues (grey disks) are almost the same size as the original grain.

ERDC TR-08-1 2-9
Figure 2-5. Bullets and casings of the small arms ammunition propellants studied,
including those for pistol, rifle, and machine gun (MG).
Small Arms
Figure 2-5 shows the bullets and casings of the four small arms for which propellants were studied. These residues were collected mainly at Camp Ethan Allen, Vermont, although some rifle propellant residues were also obtained from Yuma Proving Ground, Arizona, and Fort Lewis, Washing-ton.
.50-Caliber Machine Gun
The WC 860 propellant used to fire the .50-caliber machine gun contains ~9.5% NG in a graphite-coated grain (Technical Manual 43-0001-27). These grains are shiny, black, ~0.4 mm thick and are > 1 mm in diameter (Fig. 2-6a). We weighed four unfired grains individually on a microbalance and obtained an average mass of 0.57 ± 0.14 mg. The residues are smaller and white to brown in color (Fig. 2-6b). Twenty-eight of these weighed 4.67 mg, or about 0.17 mg each.

ERDC TR-08-1 2-10
Figure 2-6. Unfired grains (a) and fired residues (b) from a .50-caliber machine gun
photographed at the same scale.
We estimated the amount of NG still present in the residue by extracting a known mass of the residue in 1 mL of acetonitrile. For the .50-caliber residues, 3 mg of the residue yielded 0.18 mg of NG, or about 6% of the residue mass. This value is less than the 8 to 11% NG in the unfired grains (Table 2-1).
7.62-mm Machine Gun
The WC 846 propellant used to fire the 7.62-mm machine gun contains ~9.5% NG in a graphite-coated grain (Technical Manual 43-0001-27). These grains are metallic grey in color, 0.3 mm-thick disks that are about 1.0 mm in diameter (Fig. 2-7a). Four unfired grains weighed 0.91 mg or about 0.23 ± 0.08 mg each. The residues were much smaller than the original grain, generally less than 1 mm in diameter, and shiny white to brown in color (Fig. 2-7b). Twenty-two residue grains weighed 0.09 mg or about 4 µg each.
We extracted 0.7 mg of the residue in 1 mL of acetonitrile. The resulting mass of NG extracted was 0.028 mg or about 4% of the mass of the residue (Table 2-1).
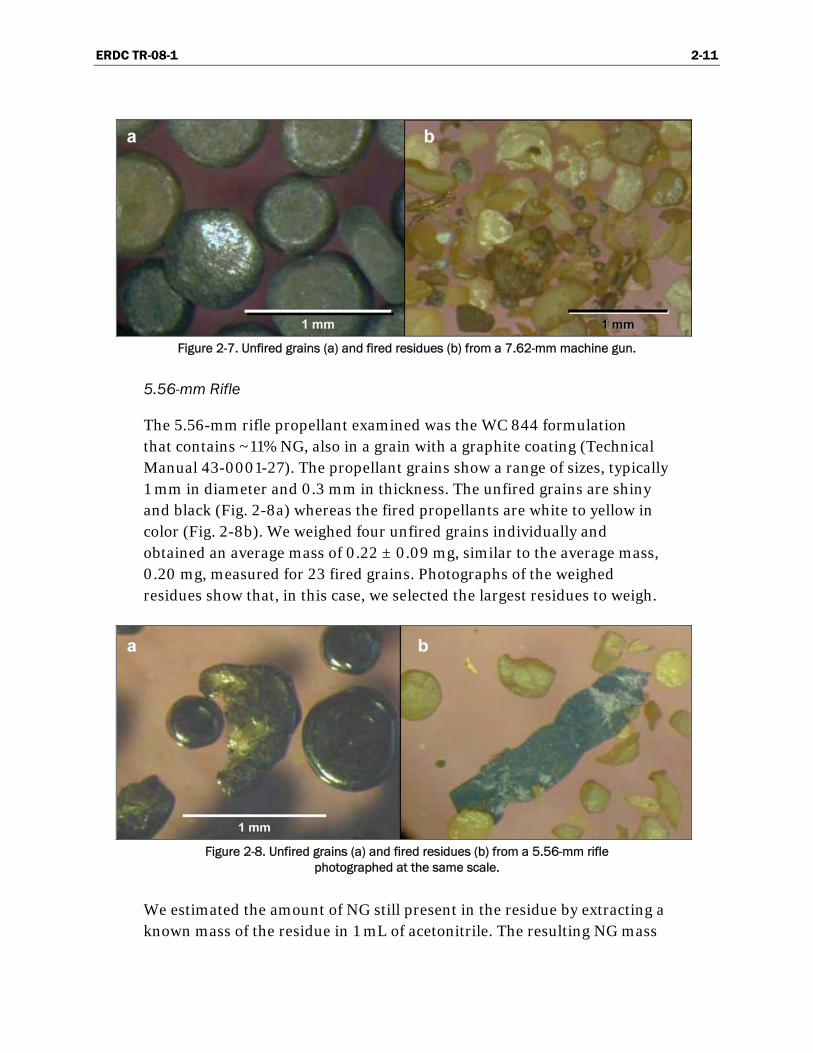
ERDC TR-08-1 2-11
Figure 2-7. Unfired grains (a) and fired residues (b) from a 7.62-mm machine gun.
5.56-mm Rifle
The 5.56-mm rifle propellant examined was the WC 844 formulation that contains ~11% NG, also in a grain with a graphite coating (Technical Manual 43-0001-27). The propellant grains show a range of sizes, typically 1 mm in diameter and 0.3 mm in thickness. The unfired grains are shiny and black (Fig. 2-8a) whereas the fired propellants are white to yellow in color (Fig. 2-8b). We weighed four unfired grains individually and obtained an average mass of 0.22 ± 0.09 mg, similar to the average mass, 0.20 mg, measured for 23 fired grains. Photographs of the weighed residues show that, in this case, we selected the largest residues to weigh.
Figure 2-8. Unfired grains (a) and fired residues (b) from a 5.56-mm rifle
photographed at the same scale.
We estimated the amount of NG still present in the residue by extracting a known mass of the residue in 1 mL of acetonitrile. The resulting NG mass

ERDC TR-08-1 2-12
from 2.4 mg of residue was 0.18 mg, or about 7% of the mass of the residues.
9-mm Pistol
The WPR289 propellant used in 9-mm pistols contains ~15% NG and is also graphite coated (Technical Manual 43-0001-27). The propellant grains vary in size, but are typically 0.8 mm in diameter and 0.2 mm thick. Unfired grains are shiny and silvery and often have faceted sides (Fig. 2-9a). The fired propellants are yellow in color and vary both in size and shape (Fig. 2-9b). Nine of the unfired grains weighed 2.49 mg or about 0.28 mg each. The fired particles weighed 0.10 mg on average. When 1 mg of the residue was extracted in 1 mL of acetonitrile, the extracted mass was 0.093 mg or about 9% of the residue’s mass.
Figure 2-9. Unfired grains (a) and fired residues (b) from a 9-mm pistol
photographed at the same scale.
Nitrocellulose Propellants
Nitrocellulose propellants are a type of single-base propellant that con-tains no appreciable amount of other energetic compounds. They often are used as propellants for mortar rounds. The residues studied here were collected at Eagle River Flats and Fort Greeley, Alaska, and at Yuma Proving Ground, Arizona.
81-mm and 60-mm HE Mortars
The M10 propellant was used to fire both the 60-mm and 81-mm HE mor-tars. The unfired grains are 1-mm-diameter disks that are about 250 µm thick and are called flakes in propellant manuals (Fig. 2-10a). This propel-
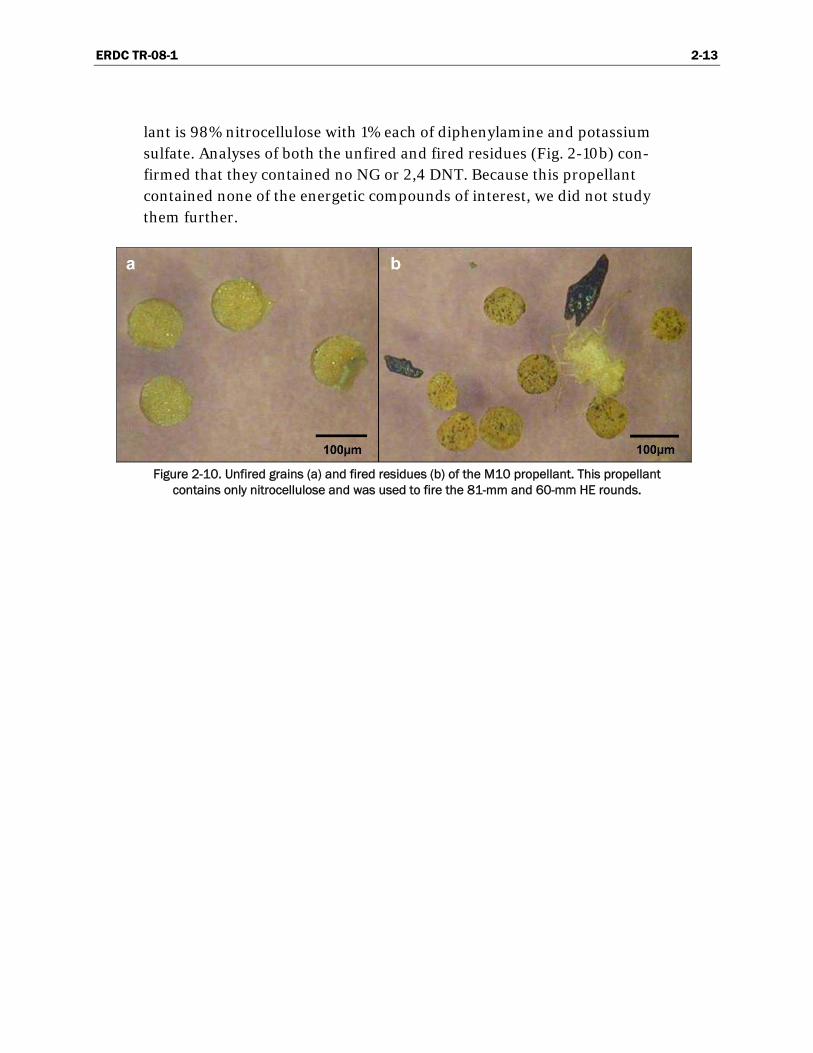
ERDC TR-08-1 2-13
lant is 98% nitrocellulose with 1% each of diphenylamine and potassium sulfate. Analyses of both the unfired and fired residues (Fig. 2-10b) con-firmed that they contained no NG or 2,4 DNT. Because this propellant contained none of the energetic compounds of interest, we did not study them further.
Figure 2-10. Unfired grains (a) and fired residues (b) of the M10 propellant. This propellant
contains only nitrocellulose and was used to fire the 81-mm and 60-mm HE rounds.

ERDC TR-08-1 2-14
Dissolution Tests
The amount of NG and 2,4-DNT released into the environment from pro-pellants used to fire munitions depends on three factors: (1) how much NG or 2,4-DNT remains after firing the different types of weapon systems (deposition); (2) how much NG and 2,4-DNT accumulate in a given area due to training; and (3) how quickly NG and 2,4-DNT dissolve or leach from their nitrocellulose matrix when this is wetted by rainfall or snow-melt.
This SERDP project focused primarily on the first two processes. However, since little is known about how quickly energetic compounds leach from the propellant grains or residues, we initiated a laboratory experiment to look at the release of 2,4-DNT from the seven-hole M1 propellant and its residue and of NG from the M9 propellant. We used laboratory drip tests to mimic field conditions on training ranges, where propellant residues are scattered on the soil surface. We think that 2,4-DNT and NG are released when the residue is wetted by rainfall or snowmelt.
Before beginning the drip tests, which are still in progress, we weighed twelve M1 residue fibers on a Mettler Toledo MX5 microbalance and weighed a single unfired seven-hole M1 grain on a Mettler A230 balance. The fibers and the grains were placed in two separate, 1-cm-diameter Buchner funnels fitted with a glass frit (Fig. 2-11). A syringe pump dripped distilled water (pH = 6) at 0.5 mL/hr onto the propellants. The water flowed through the frit into a 20-mL scintillation vial. We replaced the vials daily and measured the water volume in the vials. The concentration of 2,4 DNT was measured using an HPLC. When we no longer detect 2,4-DNT, we will again weigh the particles and then extract them to ensure that we have recovered all of the 2,4-DNT from the fibers and the grain. This test will help us determine whether the dissolution of the energetics or the breakdown of the nitrocellulose controls the release rate of these compounds.

ERDC TR-08-1 2-15
Figure 2-11. Laboratory setup for drip tests.
We used the same setup to drip water on M9 propellant grains. Five unfired grains were dripped on for 55 days, at which time NG was no longer detected in the water. We therefore stopped the experiment and extracted one of the five propellant grains.
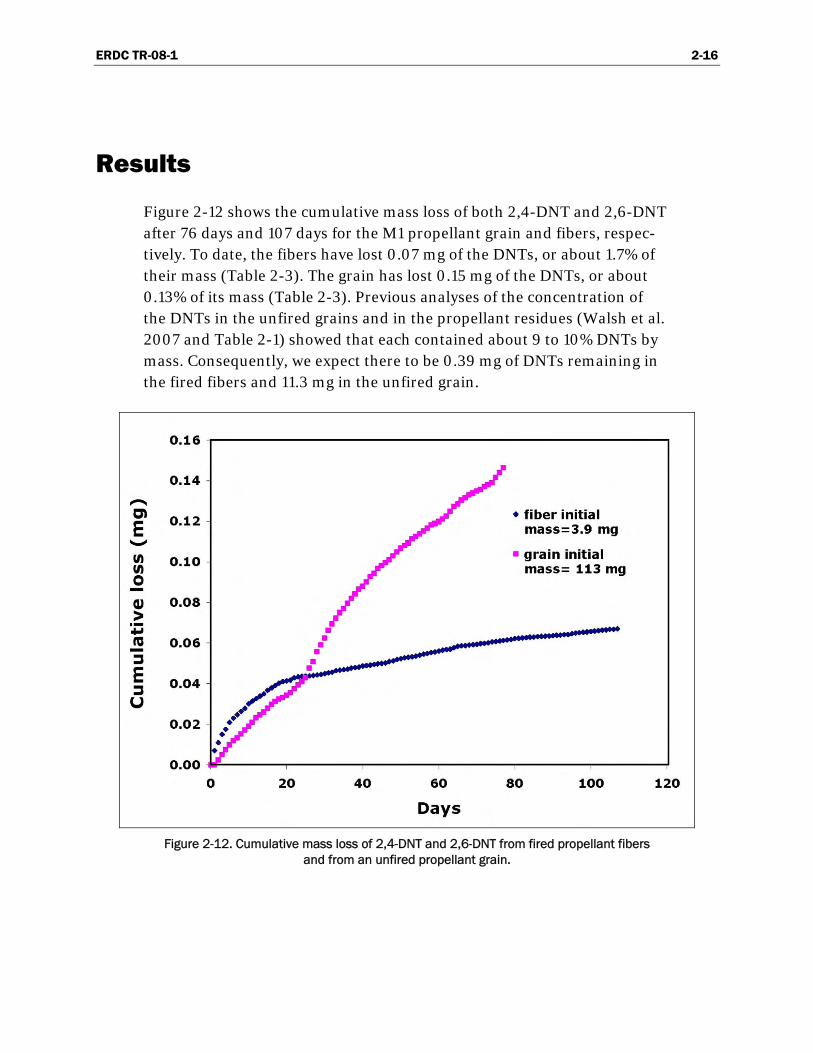
ERDC TR-08-1 2-16
Results
Figure 2-12 shows the cumulative mass loss of both 2,4-DNT and 2,6-DNT after 76 days and 107 days for the M1 propellant grain and fibers, respec-tively. To date, the fibers have lost 0.07 mg of the DNTs, or about 1.7% of their mass (Table 2-3). The grain has lost 0.15 mg of the DNTs, or about 0.13% of its mass (Table 2-3). Previous analyses of the concentration of the DNTs in the unfired grains and in the propellant residues (Walsh et al. 2007 and Table 2-1) showed that each contained about 9 to 10% DNTs by mass. Consequently, we expect there to be 0.39 mg of DNTs remaining in the fired fibers and 11.3 mg in the unfired grain.
Figure 2-12. Cumulative mass loss of 2,4-DNT and 2,6-DNT from fired propellant fibers
and from an unfired propellant grain.

ERDC TR-08-1 2-17
Table 2-3. Results to date on the dissolution of M1 fiber residues, an M1 unfired grain, and an unfired M9 propellant.
Propellant Mass (mg) #
DNTs expected (mg) Length of test
DNT in water samples
(mg)
Fired M1 (fibers) 3.9 12 0.39 107 days 0.07
Unfired M1 (7-hole grain) 113.3 1 11.3 77 days 0.15
NG expected
(mg) NG in water
sample
Unfired M9 7.1 5 2.8 53 days 1.2
1 0.57 53 days + Acn 0.14
Using values in Table 2-3, we can estimate the percentage of DNT the fibers lost in 107 days to be about 18%. As the rate of loss is decreasing (Fig. 2-12), the DNTs in the fiber’s interior may be shielded from dissolu-tion by the nitrocellulose. The breakdown of, or diffusion from, the nitro-cellulose matrix appears to control the release rate of the DNTs from these fibers.
As expected due to surface area versus volume considerations, the unfired grain has lost more mass, but a smaller percentage of the DNTs present in the grain, only a little over 1%. The loss rate is linear with time, suggesting that the water interacting with the outermost layer of the grain dissolves the maximum amount of DNT possible given the contact time and the solubilities of the DNTs. When the outermost layer of the grain has been depleted, we expect to see a decrease in the loss rate with time. When this occurs, we should be able to calculate the depth of this layer since the pro-pellant grain has a known shape and surface area.
The results for the drip test on the unfired M9 propellant are shown in Figure 2-13 and listed in Table 2-3. NG was released at a high rate for the first 20 days, and then decreased to a much slower rate. A final cumulative loss in NG mass after 53 days was 1.2 mg. Given that the unfired grains contain about 40% NG (Tables 2-1 and 2-3), we estimate that collectively the five grains should contain ~2.8 mg of NG. Because the measured amount of 1.2 mg is only about 42% of the 2.8 mg expected, we thought the propellant grains probably still contained NG. To determine whether this was the case, we extracted one of the five grains in 1 mL of aceto-nitrile. We obtained 0.14 mg of NG from this grain (Table 2-3), or about

ERDC TR-08-1 2-18
25% of its “original” NG. The other four grains have similar amounts of NG; 0.7 mg of NG remained in the grains after the dissolution tests. This mass, when summed with the 1.2 mg recovered from the water samples, accounts for about 68% of the NG expected to be present in the grains. Given the unknown variability in both the initial and final NG concen-tration in these grains, these estimates seem reasonable.
Figure 2-13. Cumulative mass loss of NG from five unfired M9 propellant grains.
If we assume that the rapid loss of NG is due to contact with water—a reasonable assumption given the high solubility of NG in water, 1,250 to 1,950 mg/L (Rosenblatt et al. 1991, Windholz 1976)—we can estimate the depth to which water has penetrated the propellant grain. Each grain is about 1.5 mm in diameter by 0.5 mm high and has a volume of 0.88 mm3. If the original grain contained 0.57 mg of NG, and we recovered 0.14 mg upon extraction, then the grain lost 0.43 mg (75% of its NG) by dissolu-tion. If the NG was homogeneously distributed within the grain, we calcu-late that loss of the NG from the outer ~0.15 mm of the grain would cause the 75% depletion observed.
In summary, our results show that the NG in the M9 propellant dissolves more quickly than the 2,4- and 2,6-DNT in either the M1 grain or the pro-pellant residues. Hewitt and Bigl (2005) obtained similar results when they eluted propellant-contaminated range soils.

ERDC TR-08-1 2-19
Conclusions
The shape of the original propellant grain and the presence or absence of holes (made to increase the burn rate) dictates the appearance of the resi-due. For example, the thin, long, single-perforated M1 propellant used to fire howitzer rounds appears to burn completely, leaving only inert com-ponents. On the other hand, the multi-perforated M1 propellant deposits up to 15% of its mass as mainly unfired slivers of the original propellant. A multi-perforated scalloped edged M1 propellant has been designed to minimize depositing 2,4-DNT on the ground, but we have not had the opportunity to sample its residue.
The M45 used to fire 120-mm mortars has a diameter large enough that, even with a center hole, the entire grain is sometimes not consumed. When this occurs, rings or crescent-shaped pieces of the propellant grain are deposited. The M9 and M10 propellants used to fire the 60- and 81-mm mortars are smaller in diameter and do not have a central hole. Con-sequently, they burn from the outside inward, producing residues that are smaller versions of the original grain, with sizes that vary depending on how well they burned.
The W-series propellants series used to fire small arms also have grains with no central holes. However, the residues from these appear to be gen-erally smaller, relative to their starting diameter, than the M9 and M10 propellants. All of these propellants are coated with graphite to retard the burn rate.
Our study of M9 and M1 propellants shows that the NG in the M9 propel-lant dissolves more quickly than does the 2,4- and 2,6-DNT in the unfired grains or in the propellant residues of the M1 propellant. We also find that both propellants trap some proportion of the energetic compound in their nitrocellulose matrix. More tests are needed to determine exactly what controls the release rate of the energetic compounds. However, the speed at which the NG is initially released suggests that the wettable outer sur-faces of the grains lose their NG quickly and that, subsequently, diffusion of the NG from the inner to the outer areas of the grain controls the release rate.

ERDC TR-08-1 2-20
References
Environmental Protection Agency (2006) Nitroaromatics, Nitramines and Nitrate Esters by High Performance Liquid Chromatography (HPLC), SW-846 Method 8330B (http://www.epa.gov/epaoswer/hazwaste/test/new-meth.htm#8330B).
Hewitt, A., and S. Bigl (2005) Elution of Energetic Compounds from Propellant and Composition B residues. US Army Engineer Research and Development Center, Cold Regions Research and Engineering Laboratory, Hanover, New Hampshire, ERDC/CRREL Technical Report TR-05-13.
Jenkins, T.F., and M.E. Walsh (1992) Development of Field Screening Methods for TNT, 2,4-DNT, and RDX in Soil. Talanta, 39, 419–428.
Rosenblatt, D.H., E.P. Burrows, W.R. Mitchell, and D.L. Parmer (1991) Organic explosives and related compounds. In The Handbook of Environmental Chemistry, O. Hutzinger (Ed.), p. 195–234. Heidelberg, Germany: Springer-Verlag Berlin.
Technical Manual 43-0001-27, Data Sheets: Small Caliber Ammunition.
Technical Manual 43-0001-28, Data Sheets: Artillery Ammunition.
Technical Manual 9-1300-214, Military Explosives.
US Army (2006) Propellant Identification Manual, Defense Ammunition Center, MacAlester, Oklahoma.
Walsh, M.E., C.A. Ramsey, S. Taylor, A.D. Hewitt, K. Bjella, and C.M. Collins (2007) Subsampling variance for 2,4-DNT in firing point soils. Soil and Sediment Contamination: An International Journal, 16, 459–472.
Walsh M.R., S. Taylor, M.E. Walsh, S. Bigl, K. Bjella, T. Douglas, A. Gelvin, D. Lambert, N. Perron, and S. Saari (2005) Residues from Live Fire Detonations of 155-mm Howitzer Rounds. US Army Engineer Research and Development Center, Cold Regions Research and Engineering Laboratory, Hanover, New Hampshire, ERDC/CRREL Technical Report TR-05-14.
Windholz, M. (1976) The Merck Index, 9th Edition. Rahway, New Jersey: Merck and Co., Inc.

ERDC TR-08-1 3-1
— Chapter 3 —
Propellant Residues Deposition from Small Arms Munitions
MICHAEL R. WALSH, MARIANNE E. WALSH, SUSAN R. BIGL, NANCY M. PERRON, DENNIS J. LAMBERT, AND ALAN D. HEWITT
Introduction
Military live-fire training missions utilize a variety of energetic materials. In the case of small arms, cartridges are issued with various types and con-figurations of propellants, depending on the type and age of the round. These energetic materials are never completely consumed during firing and have the potential to accumulate on military training ranges where they are used (Pennington et al. 2002, Hewitt et al. 2003, Jenkins et al. 2005). In February 2007, CRREL teamed with the Vermont National Guard to conduct two series of tests utilizing small arms. The objective of this field work was to determine mass loadings at firing points for the 5.56-mm automatic rifle and machine gun, the 7.62-mm machine gun, the 9-mm pistol, and the 12.7-mm (0.50-cal.) machine gun, all standard weapon systems of the U.S. Army and many foreign military inventories. The results of these live-fire tests will enable us to obtain controlled base-line data on a per-round basis for commonly used ammunition expended at firing ranges during training exercises. These data can be used by the military in general and range managers in particular in planning range use and maintenance while considering the environmental impact of this type of activity.

ERDC TR-08-1 3-2
Background
The examination of firing points as a source of energetic residues is a re-cent thrust in range sustainability research. Studies funded by U.S. Army Alaska (Soil and Water Quality Monitoring Fund) at Fort Wainwright’s Donnelly Training Area (DTA) starting in 2000 (Walsh et al. 2001) indi-cated that propellant-related energetic compounds were accumulating at heavily used indirect- and direct-fire firing points. Further research in 2001 and 2002 (Walsh et al. 2004) reinforced the original indications, with the propellant constituents nitroglycerin (NG) and 2,4-dinitrotoluene (DNT) recovered at several firing points. The State of Alaska lists DNT as a hazardous substance.
In 2002, SERDP funded research at Fort Richardson in Alaska to estimate residue deposition from the live-fire detonation of 105-mm and 81-mm high-explosive (Composition B) projectiles. Following the firing of the 105-mm howitzers, residues were collected from the snow-covered area in front of one of the guns. The results indicated concentrations of propellant residues much higher than found at the impact areas (Hewitt et al. 2003, Walsh et al. 2004, 2005b, 2007, Ramsey et al. in prep).
The ease of sample collection on snow and the processing of these samples led us to consider further work on winter firing point sampling as an ad-junct to the impact area work we were then conducting for SERDP. The methodology for collecting samples on snow originally developed by Jen-kins et al. (2000, 2002) was optimized by Walsh et al. (2005a), making sampling much more efficient and repeatable. Leveraging funding from SERDP, the Army Environmental Center (Dr. Bonnie Packer), and U.S. Army Alaska allowed us to sample active firing points and burn points for 120-mm mortars and the 155-mm howitzer to further this preliminary in-vestigation (Walsh et al. 2005b, 2005c). Results from these tests demon-strated that firing points and burn points are areas of concern for range sustainability and maintenance.
The accumulated information led to the submission of a proposal to SERDP (ER-1481) to formally investigate military range firing points. In January 2006, tests were conducted in Alaska utilizing 60-mm and 81-mm mortars (Walsh et al. 2006). This completed a series of tests on energetics residues deposition on a per-round basis for various indirect-fire weapon systems. Residues accumulation data for several types of firing points have

ERDC TR-08-1 3-3
also been reported by Jenkins et al. (2007). Our attention has now shifted to small arms ranges, where firing points are more defined, concentrated, and heavily used. This study examines the deposition rates for common small arms ammunition.

ERDC TR-08-1 3-4
Field Tests
Field Site
The tests were conducted at Camp Ethan Allen (CEA), Jericho, Vermont. Two ranges were utilized. Range 6-2 is a small range sheltered on three sides by trees and berms, affording some protection from the winds that frequent the base (Fig. 3-1). The 5.56-, 7.62-, and 9-mm weapon systems were fired on this range. Range 6-5 is located in a large open area with a long, cleared downrange area. The 12.7-mm machine gun was fired on this range. The 6-5 range was a more difficult area in which to conduct tests as it is exposed to the wind, but it is the only available range at CEA for the large machine gun.
Figure 3-1. Looking downrange at Range 6.2, Camp Ethan Allen, Vermont.
During these tests, daytime temperatures ranged from –16°C to –7°C. Winds were variable at 0–4 m/s with partially overcast skies. Firing was conducted only when winds diminished below 1 m/s. The snow depth at the firing points ranged from 33 to 60 cm, with depths exceeding 120 cm downrange at Range 6.5. No precipitation accumulated during testing, al-though some light drifting occurred, especially during the firing and sam-pling of the first 12.7-mm firing point.

ERDC TR-08-1 3-5
Table 3-1. Propellant constituents for munitions used during firing point tests.
Weapon Munition (Mil / DODIC) Propellant Constituent Constituent load
(mg / % of total load)
M16 Automatic Rifle (5.56-mm) M855 / A059 (Ball) WC844 NG 164 (9.2%)†
M249 Machine Gun (5.56-mm)
M27 / A059 (Linked) M855 / A059 (Ball) M856 / A063 (Tracer)
WC844 WC844
NG NG
189 (12.9%) 161.5 (12.6%)
M60 Machine Gun (7.62-mm)
M13 / A143 (Linked) M80 / A143 (Ball)
WC846
NG DNT
267 (10.2%)†
3.7 (0.14%)†
M9 Pistol (9-mm) M882 / AA49 (Ball) WPR289 NG* 39.5 (12.2%)
M2HB Machine Gun (12.7-mm / .50 Cal.)
M9 / A557(Linked) M33 / A552 (Ball) M17 / A571 (Tracer)
WC860 WC857
NG NG
1478 (9.7%)† 1570 (11 %)
* Up to 1% DNT specified. None detected when raw propellant analyzed. † Data from laboratory analyses. All others are range medians. Refs: See Appendix A
Munitions
Five types of munitions were fired during our tests (Table 3-1). The 5.56-mm test munitions both utilized the M855 ball cartridge, and the tests run with the M249 Squad Automatic Weapon (SAW, a machine gun) utilized the M856 tracer as every fifth round. Both types of cartridges contained WC844 propellant (U.S. Army 1994). The constituent of interest was nitro-glycerin (NG). One hundred rounds were fired with the M16 automatic ri-fle, and 200 rounds were fired with the SAW. The 7.62-mm machine gun fired 100 M80 ball rounds containing WC846 propellant. This propellant contains NG and up to 1% DNT as an artifact of the reworked propellant. For the 9-mm pistol tests, 100 M882 ball cartridges with WPR289 propel-lant were fired. The propellant contains NG and up to 1% DNT, although no DNT was detected in an analysis of the raw propellant. For the 12.7-mm machine gun, we fired 95 and 100 rounds of M9 linked ammunition con-taining four M33 ball rounds for every one M17 tracer round. The respec-tive cartridge propellants were WC860 and WC857. The propellant con-stituent of interest for both rounds was NG. Grains of raw propellant for both charges were analyzed for NG and DNT as a check on the specifica-tions given for each round, as we could find only constituent ranges for some of the munitions. Although nitrocellulose (NC) is the major constitu-ent for all these propellants (67–78% of the total load), we did not analyze for it as it is not soluble and is not a constituent of concern. Also, there is

ERDC TR-08-1 3-6
no reliable method for analyzing for NC in environmental samples. Ap-pendix A contains complete munitions data for these tests.
Tests
Our tests were conducted over the course of two separate deployments, the first on 9 February and the second on 23 February 2007. We were assisted during both series of tests by the Vermont National Guard, who scheduled ranges, provided the weapon systems and ammunition, and manned the guns for the firings.
Prior to the tests, background snow samples were collected at each range. Paths to firing points were packed out and meteorological conditions checked with a Nielsen-Kellerman Kestrel 3000. A single round was ob-tained prior to firing for the later analysis of the raw propellant to verify the propellant constituent loads.
The weapons were set up with a minimum of disturbance to the surround-ing snow. Traffic around the firing points was kept to a minimum and re-stricted to established paths. The guns were elevated off the snow surface just high enough to minimize the surface effects of the muzzle blast (Fig. 3-2). This minimized wind velocity at the muzzle and reduced the dispersion of the non-ballistic material that comprised the plume. The minimum dis-tance between firing positions was 10 m. The 9-mm pistol, 5.56-mm automatic rifle, and 7.62-mm machine gun were fired during the
Figure 3-2. Firing the M16 5.56-mm automatic rifle at Range 6.2, Camp Ethan Allen, Vermont.
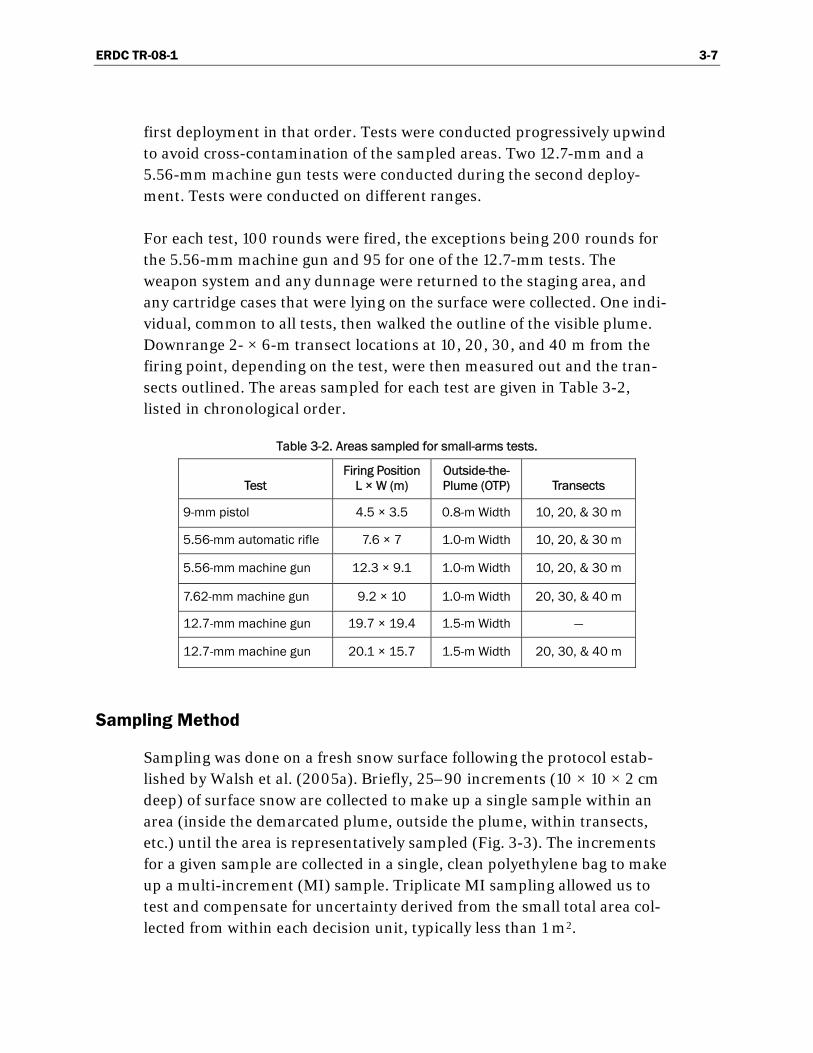
ERDC TR-08-1 3-7
first deployment in that order. Tests were conducted progressively upwind to avoid cross-contamination of the sampled areas. Two 12.7-mm and a 5.56-mm machine gun tests were conducted during the second deploy-ment. Tests were conducted on different ranges.
For each test, 100 rounds were fired, the exceptions being 200 rounds for the 5.56-mm machine gun and 95 for one of the 12.7-mm tests. The weapon system and any dunnage were returned to the staging area, and any cartridge cases that were lying on the surface were collected. One indi-vidual, common to all tests, then walked the outline of the visible plume. Downrange 2- × 6-m transect locations at 10, 20, 30, and 40 m from the firing point, depending on the test, were then measured out and the tran-sects outlined. The areas sampled for each test are given in Table 3-2, listed in chronological order.
Table 3-2. Areas sampled for small-arms tests.
Test Firing Position
L × W (m) Outside-the-Plume (OTP) Transects
9-mm pistol 4.5 × 3.5 0.8-m Width 10, 20, & 30 m
5.56-mm automatic rifle 7.6 × 7 1.0-m Width 10, 20, & 30 m
5.56-mm machine gun 12.3 × 9.1 1.0-m Width 10, 20, & 30 m
7.62-mm machine gun 9.2 × 10 1.0-m Width 20, 30, & 40 m
12.7-mm machine gun 19.7 × 19.4 1.5-m Width —
12.7-mm machine gun 20.1 × 15.7 1.5-m Width 20, 30, & 40 m
Sampling Method
Sampling was done on a fresh snow surface following the protocol estab-lished by Walsh et al. (2005a). Briefly, 25–90 increments (10 × 10 × 2 cm deep) of surface snow are collected to make up a single sample within an area (inside the demarcated plume, outside the plume, within transects, etc.) until the area is representatively sampled (Fig. 3-3). The increments for a given sample are collected in a single, clean polyethylene bag to make up a multi-increment (MI) sample. Triplicate MI sampling allowed us to test and compensate for uncertainty derived from the small total area col-lected from within each decision unit, typically less than 1 m2.

ERDC TR-08-1 3-8
To estimate the mass of energetic residues, we need to know the area over which the energetic material is deposited and the average concentration for that area. A critical assumption is that the plume represents the major area of deposition. The plume is composed of deflagration products, and its depositional pattern will be affected by wind. However, because there is no other way to estimate the area of deposition, we assume that most resi-dues are deposited within the plume. This assumption was tested by taking multi-increment samples in concentric annuli around the outside of the plume (OTP). The objectives of OTP sampling are to ensure that the plume was adequately outlined and to determine how much, if any, of the uncon-sumed energetics are measurable outside of the plume. Samples were ob-tained for annuli at varying distances (0–0.8 to 0–1.5 m) surrounding the plume edge.
Figure 3-3. Sampling the M2HB 12.7-mm machine gun firing point decision units at Range 6.5, Camp Ethan Allen, Vermont.
The layouts of the various areas sampled during these tests are depicted in Figure 3-4. The maps are derived from data obtained with a Trimble GPS Pathfinder Pro XR system (±1 m) supplemented with hand measurements taken with a tape. On 9 February, two firing positions were set up for each munition tested (#), the upwind position being used for this study. One of

ERDC TR-08-1 3-9
these firing points was used for a parallel study not reported here. On 23 February, only one firing point was set up for each test related to this study. Two tests were conducted for the 12.7-mm machine gun, only one of which measured residues downrange along fixed transects. Increments were collected with Teflon-lined aluminum scoops to obtain 10- × 10- × 2-cm-deep volumes of snow. The number of increments was loosely based on the area sampled, with larger areas having a proportionately greater number of increments. Data for the sampling are given in Appendix B.
#
#
#
#
#
#
FP 6 (7.62 mm)
FP 2 (9 mm)
0 10 20 m
FP 4 (5.56 mm) Firing points
OTP Area
Plume Access Path
Downrange Transects
a. Test sampling layout, Camp Ethan Allen, Range 6.2, 9 February 2007.
Figure 3-4. Areas sampled for small arms propellant residues tests.

ERDC TR-08-1 3-10
#
0 10 m
b. Test sampling layout, 5.56-mm machine gun, Camp Ethan Allen, Range 6.2, 23 February 2007.
FP1
FP2#
#
0 10 20 m
c. Test sampling layout, 12.7-mm machine gun, Camp Ethan Allen, Range 6.5, 23 February 2007.
Figure 3-4 (cont’d.). Areas sampled for small arms propellant residues tests.

ERDC TR-08-1 3-11
Figure 3-5. Concentric circle sampling of firing position plume and OTP areas.
Sampling for the tests on 9 February was done on foot. After the firing po-sition plume and the downrange transects were demarcated, multi-increment samples were taken from within each area. Increments for the firing position were taken by walking in concentric circles and sampling every set number of paces, based on the size of the area being sampled (Fig. 3-5). The goal was to obtain between 50 and 100 increments per area. OTP areas were demarcated and similarly sampled. The transects were sampled from the edges towards the center, with an additional sampling lane down the center. The goal for the transects was 40 increments.
Because of the deeper snow, sampling for the tests on 23 February was from snowshoes. The demarcation of the firing position plumes, OTP ar-eas, and downrange transects was conducted in the same way as for the tests on the 9th, but the sampling design differed. Lanes were marked and packed for the firing position plume area, and samples were taken from these lanes, using the same spacing but different starting points for each replicate (Fig. 3-6). OTPs were sampled from the firing position perimeter as well as from a path 1 m out. Downrange transect sampling remained the same.

ERDC TR-08-1 3-12
Figure 3-6. Sampling from fixed lanes in firing position plume area.
The firing positions were also sampled for each test. These samples were taken from the gunner’s position and encompassed a 2-m-diameter area. These areas were highly disturbed from the activities associated with set-ting up the weapon, firing the weapon, dismantling the position, and cleaning up the spent links and brass prior to sampling. It was difficult to obtain a sample from these areas. Replicate sampling was conducted in all sampled areas except one transect and the firing points.
Sample Processing and Analysis
The multi-increment snow samples were trucked to Hanover for process-ing and analysis. Upon arrival, the samples were transferred from the field bags to clean bags, double-bagged, and placed in clean polyethylene tubs for thawing. Placing the samples in clean bags reduces the chances of cross-contamination from contact with adjoining bags and residues on the exterior of the sample bags. Double-bagging and the tubs were necessary because of the inclusion of debris such as plant stems collected with the snow samples. Plant stems can pierce the sample bags, allowing the thawed sample to leak.

ERDC TR-08-1 3-13
Samples were shifted from warmer to cooler areas to prevent over-warming (>10°C) of the samples after melting. The order of processing was based on the weapon system (all samples from a weapon system were run before starting on the samples for a different weapon system), the area from which the samples were taken, and the completion of melting the samples in that group. The melted samples were filtered using a vacuum system to separate the soot fraction from the aqueous fraction. Filter pa-pers (Whatman glass microfiber 90-mm ∅ grade GF/A) containing the soot are placed in clean amber jars, dried, and stored in a refrigerator at <5°C. For extraction, each sample was shaken with acetonitrile for 18 hours.
A 500-mL aliquot of the filtrate was pre-concentrated by passing it through a Waters Porpak RDX (Sep-Pak, 6-cm3, 500-mg) solid-phase ex-traction cartridge and eluted with 5 mL of acetonitrile, resulting in a 100:1 concentration of the analytes (Walsh and Ranney 1998). The concentrate was split into two aliquots, 3.5 mL for analysis and 1.5 mL for archiving.
The acetonitrile extracts from the solid-phase extraction of the melted snow and of the solid residue on the filters were analyzed by either RP-HPLC-UV or GC-µECD, depending on the analyte concentration. Extract concentrations greater than 100 µg/L were determined following the gen-eral procedures of SW 846 Method 8330 (Nitroaromatics and Nitramines by High-Performance Liquid Chromatography [HPLC]) (U.S. Environ-mental Protection Agency [USEPA] 1994). Lower concentrations were de-termined using Method 8095 (Nitroaromatics and Nitramines by GC) (USEPA 2000), which uses an electron capture detector and provides de-tection limits near 1 µg/L for RDX and 20 µg/L for NG in solvent extracts. The advantage of the HPLC method is that the analytical error is very small, about 2% relative standard deviation (RSD) for replicate injections. Although the GC-µECD method can detect much lower concentrations, the analytical error is much greater, approaching 20% RSD.
Prior to HPLC analysis, 1.00 mL of each acetonitrile extract was mixed with 3.00 mL of reagent-grade water. Determinations were made on a modular system from Thermo Electron Corporation composed of a Finni-gan SpectraSYSTEM Model P4000 pump, a Finnigan SpectraSYSTEM UV2000 dual wavelength UV/VS absorbance detector set at 210 and 254 nm (cell path 1 cm), and a Finnigan SpectraSYSTEM AS300 autosampler. Samples were introduced with a 100-µL sample loop. Separations were

ERDC TR-08-1 3-14
achieved on a 15-cm × 3.9-mm (4-µm) NovaPak C8 column (Waters Chromatography Division, Milford, Massachusetts) at 28°C and eluted with 1.4 mL/min of 15:85 isopropanol/water (v/v). HPLC analyses that needed confirmation were run on the GC.
For GC analysis, the acetonitrile extracts were transferred to autosampler vials, which were then placed into an HP 7683 Series autosampler tray that was continuously refrigerated by circulating 0°C glycol/water through the trays. A 1-µL aliquot of each extract was directly injected into the HP 6890 purged packed inlet port (250°C) containing a deactivated Restek Uniliner. Primary separation was conducted on a 6-m × 0.53-mm-ID fused-silica column, with a 0.5-µm film thickness of 5% (phenyl) methylsi-loxane (RTX-5 from Restek). The GC oven was temperature-programmed as follows: 100°C for 2 min, 10°C/min ramp to 250°C. The carrier gas was hydrogen at 0.85 psi inlet pressure. The µECD detector temperature was 280°C; the makeup gas was nitrogen at 60 mL/min. Extracts were also analyzed using an RTX-TNT2 confirmation column. Column dimensions were 6-m × 0.53-mm ID with a 1.5-µm film thickness. The GC oven was temperature-programmed as follows: 130°C for 1 min, 10°C/min ramp to 160°C, 30°C/min ramp to 270. The carrier gas was hydrogen at 1.6 psi inlet pressure. The µECD temperature was 310°C, and the makeup gas was nitrogen at 60 mL/min. All firing point samples were analyzed by HPLC. Those thought to contain DNT were analyzed by both HPLC and GC.
Calibration standards were prepared from analytical reference materials obtained from Restek Corporation (Bellefonte, Pennsylvania). The analyti-cal reference materials were 8095 Calibration Mix A (1 mg/mL) and a sin-gle-component solution of NG (1 mg/mL). A spike solution at 1,000 µg/L was prepared from 8330 Calibration Mix 1 and the single-component solu-tion of NG (1 mg/mL). Spiked water samples at 2 µg/L were prepared by mixing 1.00 mL of the spike solution with 499 mL of water. Following SPE, the extract target concentration was 200 µg/L for each analyte.
To calculate the mass of unreacted energetics deposited on the snow, we combined the estimated masses derived for the soot and aqueous frac-tions. For the aqueous fraction, we divided the average concentration of the extract (in µg/L) by 100. We then multiplied this value by the total volume of filtrate for the sample (in L), giving us the mass dissolved in the meltwater from the snow (in µg). For the soot fraction, we multiplied the filter extract (in µg/L) by the volume of AcN used in the extraction process
ERDC TR-08-1 3-15
(in L), giving us the mass of residues on the filter (in µg). We then com-bined these mass values and divided by the area sampled, giving us a mass-per-unit-area estimate (in µg/m2). Multiplying this value by the measured area of the decision unit (in m2) gives us the final estimate for the residue mass for that sample (in µg) (Jenkins et al. 2002, Hewitt et al. 2003).
Quality Control Procedures
Quality control (QC) procedures were conducted both in the field and in the lab. Field QC, noted previously, included replicate sampling within the residue plumes and sampling outside the demarcated plumes. In the proc-essing laboratory, blank samples consisting of filtered water (Millipore Milli-Q reagent water filtration system) were periodically run through a filter assembly and SPE setup for later analysis at the lab. This procedure was designed to determine whether cross-contamination from the sample filtering apparatus was occurring. Water fractions for several samples were divided into three aliquots and run through the SPE to determine whether recovery rates from the SPE procedure were consistent. SPE spikes and blanks were run to determine cartridge filter retention and recovery dur-ing the elution process. These processes are described in greater detail in Walsh et al. (2005c).
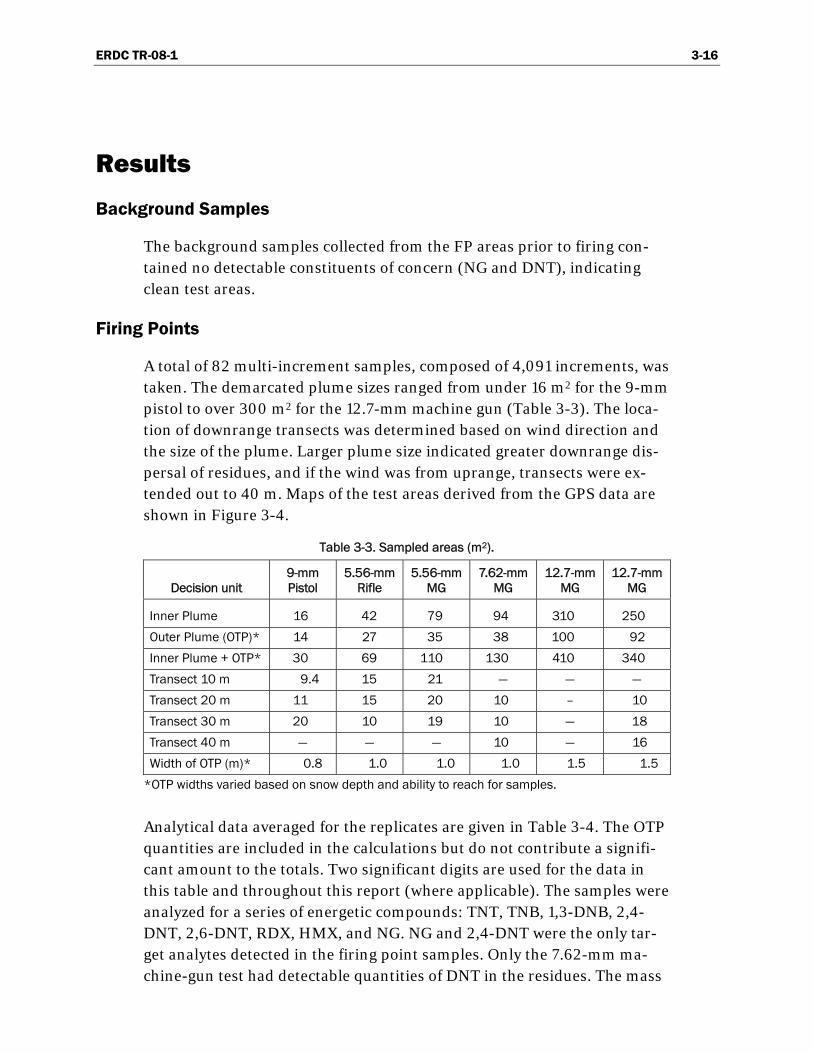
ERDC TR-08-1 3-16
Results
Background Samples
The background samples collected from the FP areas prior to firing con-tained no detectable constituents of concern (NG and DNT), indicating clean test areas.
Firing Points
A total of 82 multi-increment samples, composed of 4,091 increments, was taken. The demarcated plume sizes ranged from under 16 m2 for the 9-mm pistol to over 300 m2 for the 12.7-mm machine gun (Table 3-3). The loca-tion of downrange transects was determined based on wind direction and the size of the plume. Larger plume size indicated greater downrange dis-persal of residues, and if the wind was from uprange, transects were ex-tended out to 40 m. Maps of the test areas derived from the GPS data are shown in Figure 3-4.
Table 3-3. Sampled areas (m2).
Decision unit 9-mm Pistol
5.56-mm Rifle
5.56-mm MG
7.62-mm MG
12.7-mm MG
12.7-mm MG
Inner Plume 16 42 79 94 310 250
Outer Plume (OTP)* 14 27 35 38 100 92
Inner Plume + OTP* 30 69 110 130 410 340
Transect 10 m 9.4 15 21 — — —
Transect 20 m 11 15 20 10 – 10
Transect 30 m 20 10 19 10 — 18
Transect 40 m — — — 10 — 16
Width of OTP (m)* 0.8 1.0 1.0 1.0 1.5 1.5
*OTP widths varied based on snow depth and ability to reach for samples.
Analytical data averaged for the replicates are given in Table 3-4. The OTP quantities are included in the calculations but do not contribute a signifi-cant amount to the totals. Two significant digits are used for the data in this table and throughout this report (where applicable). The samples were analyzed for a series of energetic compounds: TNT, TNB, 1,3-DNB, 2,4-DNT, 2,6-DNT, RDX, HMX, and NG. NG and 2,4-DNT were the only tar-get analytes detected in the firing point samples. Only the 7.62-mm ma-chine-gun test had detectable quantities of DNT in the residues. The mass

ERDC TR-08-1 3-17
quantity was very small, less than 2 µg/round, and is not reported in the body of the table of analytical results.
Table 3-4. Analytical results and per-round calculations for small arms tests. (Results for NG only.)
Data from samples Per-round calculations
Sample area Aqueous mass
(µg) Soot mass
(mg) Total mass
(mg) Mass/round
(mg) Averages
(mg) SA/(SA+Plume)
(%)
9-mm Pistol: 100 Rounds of M882 (DODIC AA49) Ammunition Consumed
Plume ND 5.4 5.4 1.7 ND 7.4 7.4 2.1 — 0.12 8.3 8.3 2.6 2.1 OTP: 0-3 m 0.0030 0.052 0.052 0.013 0.0021 0.030 0.030 0.009 0.011 0.52% 10-m Transect ND 0.0022 0.0022 0.00040 ND 0.0037 0.0037 0.00070 ND 0.001 0.0010 0.00019 0.00043 0.020% 20-m Transect ND ND ND — ND ND ND — ND ND ND — — 30-m Transect ND ND ND — — Firing Point 2 0.012 0.26 0.26 0.068 Firing Point 1 0.0047 0.092 0.092 0.024 0.046 2.2%
Lab / QA Samples
Blank (DI Water) ND Lab Spike 0.95000 0.00095
5.56-mm Rifle: 100 Rounds of M855 (DODIC A059) Ammunition Consumed
Plume 0.01 3.0 3.0 1.8 0.01 2.8 2.8 1.7 0.01 2.9 2.9 1.8 1.7 — OTP: 0-3 m 0.0010 0.183 0.184 0.07 0.0011 0.154 0.155 0.06 0.06 3.6% 10-m Transect ND 0.020 0.020 0.0057 ND 0.018 0.018 0.0052 ND 0.018 0.018 0.0052 0.01 0.30% 20-m Transect ND ND ND — ND ND ND — ND ND ND — — 30-m Transect ND ND ND — ND ND ND — — Firing Point 2 ND 0.0063 0.0063 0.001 Firing Point 1 0.0024 0.67 0.67 0.1 0.1 5.9% Lab / QA Samples Blank (DI Water) ND Lab Spike 0.95 0.00095

ERDC TR-08-1 3-18
Data from samples Per-round calculations
Sample area Aqueous mass
(µg) Soot mass
(mg) Total mass
(mg) Mass/round
(mg) Averages
(mg) SA/(SA+Plume)
(%)
5.56-mm MG: 200 Rounds of M27 Linked (DODIC A064) M855 / M856 Ammunition Consumed
Plume 7.3 0.92 0.93 0.53 9.0 3.0 3.0 1.73 10 2.8 2.8 1.62 1.3 OTP: 0-3 m 0.7 0.080 0.080 0.029 ND 0.077 0.077 0.026 0.03 2.1% 10-m Transect ND 0.0068 0.0068 0.0019 ND 0.0055 0.0055 0.0019 ND 0.016 0.016 0.0058 0.0032 0.2% 20-m Transect ND 0.001 0.0010 0.00030 ND ND ND — ND ND ND — 30-m Transect ND ND ND — ND ND ND — ND 0.001 0.0012 0.0060 Firing Point ND 0.011 0.011 0.056 0.031 Lab / QA Samples Background 1 & 2 ND ND ND Blank (DI Water) ND Lab Spike 0.95 0.00095
7.62-mm MG: 100 Rounds of M13 Linked (DODIC A143) M80 Ammunition Consumed
Plume 0.00 1.0 1.0 1.1 0.00 1.5 1.5 1.8 0.00 1.2 1.2 1.6 1.5 OTP: 0-3 m 0.015 0.015 0.010 0.016 0.016 0.010 0.010 0.6% 20-m Transect ND ND ND — ND ND ND — ND ND ND — 30-m Transect ND ND ND — ND ND ND — ND ND ND — 40-m Transect ND ND ND — ND ND ND — Firing Point 2 0.00058 0.060 0.061 0.0076 Firing Point 1 0.013 0.013 0.0025 0.0051 Lab / QA Samples Background 1 & 2 ND ND ND Blank (DI Water) ND Lab Spike 0.95 0.00095

ERDC TR-08-1 3-19
Data from samples Per-round calculations
Sample area Aqueous mass
(µg) Soot mass
(mg) Total mass
(mg) Mass/round
(mg) Averages
(mg) SA/(SA+Plume)
(%)
12.7-mm MG-1: 95 Rounds of M9 Linked (DODIC A557) M33/M17 Ammunition Consumed
Plume 11 1.4 1.4 5.5 15 2.0 2.0 7.8 13 2.7 2.7 10 7.8 OTP: 0-3 m ND 0.081 0.081 0.10 ND 0.041 0.041 0.056 0.08 1.0% Firing Point 0.0024 0.0024 0.00042 0.00042 Lab / QA Samples Background 1 ND ND ND Background 2 ND ND ND Blank (DI Water) ND Lab Spike 0.95 0.00095
12.7-mm MG-2: 100 Rounds of M9 Linked (DODIC A557) M33/M17 Ammunition Consumed
Plume 11 3.4 3.4 11 14 3.2 3.2 10 17 6.4 6.4 20 14 OTP: 0-3 m ND 0.021 0.021 0.025 ND 0.044 0.044 0.051 0.04 0.3% 20-m Transect ND 0.017 0.017 0.0050 ND 0.012 0.012 0.0037 ND 0.012 0.012 0.0039 0.0042 0.03% 30-m Transect ND 0.006 0.0056 0.0032 ND 0.003 0.0033 0.0019 ND 0.004 0.0040 0.0023 0.0024 0.02% 40-m Transect ND 0.001 0.0008 0.00035 ND 0.002 0.0015 0.00059 ND 0.001 0.0010 0.00032 0.00042 0.003% Firing Point ND ND ND — Lab / QA Samples Blank (DI Water) 0.000 Lab Spike 0.95 0.00095
Notes ND denotes non-detect on all analyses. Presence is below detection limits. Data from samples are for sampled area only and are not extrapolated over the complete area sampled. Per-round calculations take the full area sampled into consideration. DNT found only in 7.62-mm plume residues. Values were 1.5, 1.9, and 2.0 µg/round for the plume replicates.
The OTP sample results indicate that the demarcated plumes were ade-quately sized to encompass the major area of propellant residues deposi-tion. The NG residues recovered from the OTPs averaged 1.35% (0.3–3.6%) of the combined residues of the plume plus the OTP. To test this
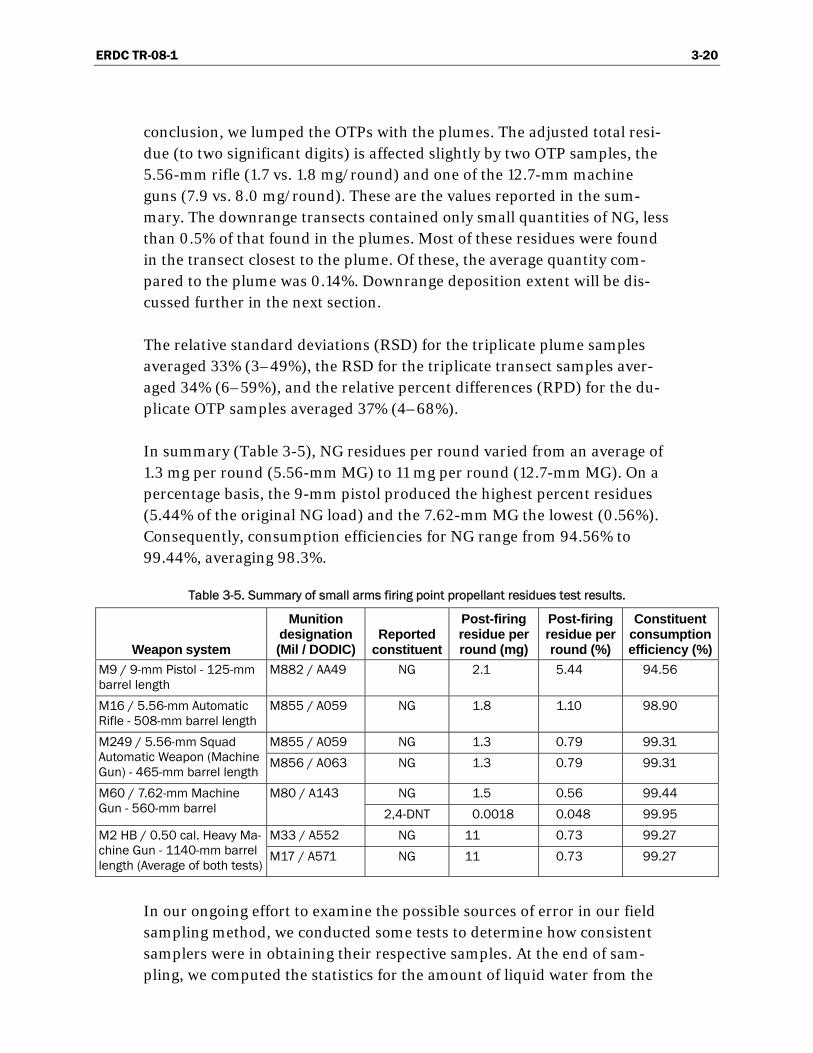
ERDC TR-08-1 3-20
conclusion, we lumped the OTPs with the plumes. The adjusted total resi-due (to two significant digits) is affected slightly by two OTP samples, the 5.56-mm rifle (1.7 vs. 1.8 mg/round) and one of the 12.7-mm machine guns (7.9 vs. 8.0 mg/round). These are the values reported in the sum-mary. The downrange transects contained only small quantities of NG, less than 0.5% of that found in the plumes. Most of these residues were found in the transect closest to the plume. Of these, the average quantity com-pared to the plume was 0.14%. Downrange deposition extent will be dis-cussed further in the next section.
The relative standard deviations (RSD) for the triplicate plume samples averaged 33% (3–49%), the RSD for the triplicate transect samples aver-aged 34% (6–59%), and the relative percent differences (RPD) for the du-plicate OTP samples averaged 37% (4–68%).
In summary (Table 3-5), NG residues per round varied from an average of 1.3 mg per round (5.56-mm MG) to 11 mg per round (12.7-mm MG). On a percentage basis, the 9-mm pistol produced the highest percent residues (5.44% of the original NG load) and the 7.62-mm MG the lowest (0.56%). Consequently, consumption efficiencies for NG range from 94.56% to 99.44%, averaging 98.3%.
Table 3-5. Summary of small arms firing point propellant residues test results.
Weapon system
Munition designation (Mil / DODIC)
Reported constituent
Post-firing residue per round (mg)
Post-firing residue per round (%)
Constituent consumption efficiency (%)
M9 / 9-mm Pistol - 125-mm barrel length
M882 / AA49 NG 2.1 5.44 94.56
M16 / 5.56-mm Automatic Rifle - 508-mm barrel length
M855 / A059 NG 1.8 1.10 98.90
M855 / A059 NG 1.3 0.79 99.31 M249 / 5.56-mm Squad Automatic Weapon (Machine Gun) - 465-mm barrel length
M856 / A063 NG 1.3 0.79 99.31
NG 1.5 0.56 99.44 M60 / 7.62-mm Machine Gun - 560-mm barrel
M80 / A143 2,4-DNT 0.0018 0.048 99.95
M33 / A552 NG 11 0.73 99.27 M2 HB / 0.50 cal. Heavy Ma-chine Gun - 1140-mm barrel length (Average of both tests)
M17 / A571 NG 11 0.73 99.27
In our ongoing effort to examine the possible sources of error in our field sampling method, we conducted some tests to determine how consistent samplers were in obtaining their respective samples. At the end of sam-pling, we computed the statistics for the amount of liquid water from the

ERDC TR-08-1 3-21
snow each sampler obtained per sample increment. The results are pre-sented in Table 3-6. The results for 1a, 2a, and 3 are for 9 February, while those for 1b, 2b, and 4 are for 23 February. The liquid water content dif-fered substantially between the two tests as a result of the snow morphol-ogy. The snow on the 6.5 range is denser because of exposure to the wind and sun. The means and medians are quite close, with RSDs averaging around 12%.
Table 3-6. Sampler variation test results.
(mL water / sample incre-ment)
Sampler Number of samples Mean Median Range
Relative std. deviation (%)
1a 11 15 15 5.0 11
2a 20 21 22 5.3 9
3 14 14 13 5.1 11
1b 11 33 35 13 14
2b 15 40 40 16 9
4 14 38 36 19 17
What is indicated in our limited study is that different samplers may ob-tain different quantities of the sampled material (in our case, snow) from a plume, but the difference may not be significant. We are not sure whether the differences between samples (range) are a function of depth of sam-pling (surface area sampled remains constant) or area (dragging the scoop through the snow, thus sampling more of the surface). Samplers 1, 2, and 3 (in that order) are experienced samplers, while sampler 4 was a novice. Experience pays off with consistency, but even the novice did well.

ERDC TR-08-1 3-22
Discussion
Testing out of doors always presents challenges. In our case, wind was the confounding factor. At the time of the tests, mild winds (<4 m/s) were blowing either across the line of fire or quartering from behind. We at-tempted to check fire when the wind kicked up but were not always suc-cessful. For this reason, we designated larger residue plumes than we normally would have. Transect and OTP results indicate that the plume designations are reasonable, with small amounts of residues found in both areas. Still, we feel that replication would have been better had there been no wind moving the surface snow around. Although we consider an RSD of less than 50% acceptable (ours averaged below 40%), we would have pre-ferred that all the replicate groups had had an RSD below 50%. That said, we feel that our results are a good estimate of propellant residues deposi-tion rates for small-arms munitions.
The area of deposition associated for each weapon system can be esti-mated from the data obtained for these tests. In Table 3-3, the total area for each sampled area is given, and in Figure 3-4, scaled maps of the firing point sampling configurations are illustrated. Data from Table 3-5 can be used to determine the extent of the residues deposition, from the plume, through the OTP area, and out across the transects. The data for our tests are summarized in Table 3-7. When sampling to obtain a residue accumu-lation estimation, these are likely minimum distances from the firing posi-tions that need to be sampled, and they will need to be adjusted according to the prevailing wind direction. The sampling width will be half the dis-tance to the adjoining lane on either side, as most small-arms firing ranges are set up with closely spaced lanes.
Table 3-7. Downrange estimates of small-arms propellant residues deposition.
Weapon system Propellant constituent
Major (>99%) deposition:
downrange (m)
Detectable deposition:
downrange (m) 5.56-mm Rifle NG 8.6 10
5.56-mm MG NG 13 20
NG 9.2 10 7.62-mm MG
DNT 9.2 9.2
9-mm Pistol NG 4.5 10
12.7-mm MG NG 20 40

ERDC TR-08-1 3-23
So how do propellant residues from firing small arms stack up to the big guns? Table 3-8 summarizes the work cited previously that we have done with mortars and howitzers and compares it to the more recent small-arms results. The results are generalized to the propellant constituents of concern, mainly NG and DNT. Although the mass of residues per round is generally higher for the larger caliber munitions, their consumption effi-ciencies are much higher. Interestingly, the firing efficiencies of the mortar rounds we tested are generally less than those for the small arms. In this case, size is not the dominant factor. Deflagration pressure and time-in-barrel, related to barrel length, may be more important factors for burn efficiency.
Table 3-8. Comparison of various firing point residues loads.
Weapon system Propellant ConstituentsLoad/ rnd (g)
Residues/ round (mg)
Residues/ load (%)
Howitzers
105-mm M1-I & II DNT 42 34 8 x 10⁻²
155-mm M1 DNT 275 1.2 5 x 10⁻⁴
Mortars
81-mm M9 NG 30 1,000 3.5
120-mm M45 NG 26 350 1.4
Small Arms
5.56-mm Rifle WC844 NG 0.164 1.8 1.10
5.56-mm MG* WC844 NG 0.163 1.3 0.79
7.62-mm MG WC846 NG 0.271 1.5 0.56
9-mm Pistol WPR289 NG 0.040 2.1 5.44
12.7-mm MG* WC860 & WC857
NG 1.496 11. 0.73
* Averages loads and residues from ball and tracer rounds in linked ammunition.
What do these results mean for the range manager? Small-arms ammuni-tion, with the exception of that for the 9-mm pistol, tends to be efficient in its consumption of the propellant constituents of concern. However, two factors will offset this advantage: Small arms ranges tend to be very struc-tured, and a large number of rounds are fired from these fixed locations. This means that there is a legitimate concern over the accumulation of constituents such as nitroglycerin at firing points.
The variability of propellant loads for a given munition family can be quite large. Army Technical Manual TM 43-0001-27 (1994) lists 17 types of 12.7-
ERDC TR-08-1 3-24
mm cartridges, not counting blanks and plastic rounds. There is no “stan-dard” propellant or load across all cartridges. Many cartridges have alter-native propellant types and loads, making it very difficult to actually know what you have in your hand. It was only through a laborious learning process and verification through laboratory analyses that we were able to determine exactly what was fired. Even the lot specification sheets do not match the analysis data. It is imperative, therefore, to obtain as much in-formation on the munitions being tested as possible, including DODIC, NSN, and lot numbers, and verify the information obtained using these numbers and the available databases with analysis of the raw propellant from each type of round tested, including both ball and tracer rounds where applicable.

ERDC TR-08-1 3-25
Conclusions
A series of firing point tests was conducted on energetics associated with firing of military small arms. Firing points at two snow-covered ranges at Camp Ethan Allen were utilized on two dates in February 2007. Samples were taken from several areas associated with each test and analyzed for unburned explosives residues. Results indicate that the residue masses are small but significant, ranging from 1.3 mg/round (NG) to 11 mg/round (NG). Propellant consumption efficiency, illustrated by the percent of un-burned energetics compared to the original constituent load, ranges from 0.56% to 5.4%. Smaller-caliber weapon systems tend to be less efficient than larger systems, and machine guns are slightly more efficient than non-fully-automatic weapons. Although residues per round are low, con-centrated firing of a great quantity of rounds, typical on small-arms train-ing ranges, will result in the deposition of a significant mass of propellant residues in a small (16–300 m2) area. This study reinforces once again the importance of maintaining firing points to avoid their becoming a source of energetic residues on ranges.
These results are estimates of unreacted residues from activities associated with the live-fire of small-arms munitions. They are indicators of possible residue masses that will result from such activities. Some values, especially for the transects, are at or near detection limits for the analytical instru-mentation and are difficult to interpret. It is important to keep in mind that there is much variability between range activities and some variability between rounds and that these results should be considered a general es-timate.

ERDC TR-08-1 3-26
References Hewitt, A.D., T.F. Jenkins, T.A. Ranney, J.A. Stark, M.E. Walsh, S. Taylor, M.R. Walsh,
D.J. Lambert, N.M. Perron, N.H. Collins, and R. Kern. 2003. Estimates for explosives residues from the detonation of army munitions. ERDC/CRREL TR-03-16. Hanover, NH: U.S. Army Engineer Research and Development Center, Cold Regions Research and Engineering Laboratory.
Jenkins, T.J., T.A. Ranney, P.H. Miyares, N.H. Collins, and A.D. Hewitt. 2000. Use of surface snow sampling to estimate the quantity of explosives residues resulting from land mine detonations. ERDC/CRREL TR-00-12. Hanover, NH: U.S. Army Engineer Research and Development Center, Cold Regions Research and Engineering Laboratory.
Jenkins, T.F., M.E. Walsh, P.H. Miyares, A.D. Hewitt, N.H. Collins, and T.A. Ranney. 2002. Use of snow-covered ranges to estimate explosives residues from high-order detonations of army munitions. Thermochimica Acta 384: 173–185.
Jenkins, T.F., A.D. Hewitt, M.E. Walsh, T.A. Ranney, C.A. Ramsey, C.L. Grant, and K.L. Bjella. 2005. Representative sampling for energetic compounds at military training ranges. Environmental Forensics 6: 25–55.
Jenkins, T.F., A.D. Hewitt, S.R. Bigl, S. Taylor, D.J. Lambert, D.K. MacMillan, J.L. Clausen, and N.M. Perron. 2007. Sampling of various types of firing point areas for propellant residues at several military reservations. Chapter 3 in T.F. Jenkins et al. Characterization and fate of gun and rocket propellant residues on testing and training ranges: Interim Report 1. ERDC TR-07-1. Vicksburg, MS: U.S. Army Engineer Research and Development Center.
Pennington, J.C., T.F. Jenkins, G. Ampleman, S. Thiboutot, J.M. Brannon, J. Lynch, T.A. Ranney, J.A. Stark, M.E. Walsh, J. Lewis, C.A. Hayes, J.E. Mirecki, A.D. Hewitt, N. Perron, D. Lambert, J. Clausen, and J.J. Delfino. 2002. Distribution and fate of energetics on DoD test and training ranges: Interim Report 2. ERDC TR-02-8. Vicksburg, MS: U.S. Army Engineer Research and Development Center.
Ramsey, C.A., S. Taylor, and M.E. Walsh (in prep.) An examination of the processing of propellant residues from 105-mm howitzers.
U.S. Army. 1994. Army ammunition data sheets: Small caliber ammunition—FSC 1305. Technical Manual TM 43-0001-27. Washington, DC: U.S. Government Printing Office. 1994-546-043:80742.
U.S. Army. 1998. Propellant management guide. Savanna, IL: U.S. Army Defense Ammunition Center, Logistics Review and Technical Assistance Office.
U.S. Environmental Protection Agency. 1994. SW846 Method 8330. Nitroaromatics and nitroamines by HPLC. USEPA Office of Solid Waste standard methods of analysis test methods for evaluating solid wastes, physical and chemical methods. Update II (www.epa.gov/epaoswer/hazwaste/test/pdfs/8330.pdf).
U.S. Environmental Protection Agency. 2000. SW846 Method 8095. Explosives by gas chromatography. Update IVB (www.epa.gov/epaoswer/hazwaste/test/pdfs/ 8095.pdf).

ERDC TR-08-1 3-27
Walsh, M.R. 2007. Explosives residues resulting from the detonation of common military munitions: 2001–2006. ERDC/CRREL TR-07-02. Hanover, NH: U.S. Army Engineer Research and Development Center, Cold Regions Research and Engineering Laboratory.
Walsh, M.E., and T.A. Ranney. 1998. Determination of nitroaromatic, nitramine, and nitrate ester explosives in water using solid-phase extraction and GC-ECD. Special Report 98-2. Hanover, NH: U.S. Army Cold Regions Research and Engineering Laboratory.
Walsh, M.E., C.M. Collins, C.H. Racine, T.F. Jenkins, A.B. Gelvin, and T.A. Ranney. 2001. Sampling for explosives residues at Fort Greely, Alaska. TR-01-15. Hanover, NH: U.S. Army Engineer Research and Development Center, Cold Regions Research and Engineering Laboratory.
Walsh, M.E., C.M. Collins, A.D. Hewitt, M.R. Walsh, T.F. Jenkins, J. Stark, A. Gelvin, T.S. Douglas, N. Perron, D. Lambert, R. Bailey, and K. Myers. 2004. Range characterization studies at Donnelly Training Area, Alaska: 2001 and 2002. ERDC/CRREL TR-04-3. Hanover, NH: U.S. Army Engineer Research and Development Center, Cold Regions Research and Engineering Laboratory.
Walsh, M.R., M.E. Walsh, C.A. Ramsey, and T.F. Jenkins. 2005a. An examination of protocols for the collection of munitions-derived explosives residues on snow-covered ice. ERDC/CRREL TR-05-08. Hanover, NH: U.S. Army Engineer Research and Development Center, Cold Regions Research and Engineering Laboratory.
Walsh, M.R., S. Taylor, M.E. Walsh, S.R. Bigl, K. Bjella, T.A. Douglas, A.B. Gelvin, D.J. Lambert, N.M. Perron, and S.P. Saari. 2005b. Residues from live-fire detonations of 155-mm howitzer rounds. ERDC/CRREL TR-05-14. Hanover, NH: U.S. Army Engineer Research and Development Center, Cold Regions Research and Engineering Laboratory.
Walsh, M.R., M.E. Walsh, C.M. Collins, S.P. Saari, J.E. Zufelt, A.B. Gelvin, and J.W. Hug. 2005c. Energetic residues from live-fire detonations of 120-mm mortar rounds. ERDC/CRREL TR-05-15. Hanover, NH: U.S. Army Engineer Research and Development Center, Cold Regions Research and Engineering Laboratory.
Walsh, M.R., M.E. Walsh, C.A. Ramsey, R.J. Rachow, J.E. Zufelt, C.M. Collins, A.B. Gelvin, N.M. Perron, and S.P. Saari. 2006. Energetic residues deposition from 60-mm and 81-mm mortars. ERDC/CRREL TR-06-10. Hanover, NH: U.S. Army Engineer Research and Development Center, Cold Regions Research and Engineering Laboratory.

ERDC TR-08-1 3-28
Appendix 3-A: Munitions Data
Table 3-A1 contains information relevant to the munitions used during the tests covered in this report. Table 3-A2 contains data on the energetic load of the test components. Propellant loads for the analytes of concern are given in Table 3-1.
Table 3-A1. Munitions data.
NSN DODIC Nomenclature Lot No. Drawn
for tests
1305-01-470-2090 AA49 Cartridge, 9-mm, Ball, NATO, M882 WCC06A037-093 100
1305-01-155-5462 A059 Cartridge, 5.56-mm, Ball, M855 — 100
1305-01-156-7584* A064 CTG, 5.56-mm, 4 Ball M855 / 1 TR M856, LNKD M27
LC-05E693L254 200
1305-00-892-2330 A143 Cartridge, 7.62-mm NATO Ball, M80 Linked SPD05L001-002 100
1305-01-370-2594* A557 CTG, Cal .50, 4 Ball M33 / 1 TR M17, LNKD M9 LC-05G614-137 200
Notes: Drawn from inventory, Camp Ethan Allen, and from USFPO-VT ASP, Camp Johnson, Colchester, VT *Data from DA Form 581: Request for Issue and Turn-in of Ammunition (Doc. # W81EWF 70510500)
Table 3-A2. Primary propellant constituents for fired rounds.
Mass / Round (g)
Munition Propellant NC NG DNT DB DP Total**
Cartridge, 9-mm Ball, M882 WPR289 0.253 0.040* 0.00* — 0.003 0.32
Cartridge, 5.56-mm Ball, M855 WC844 1.13 0.189* — 0.101 0.025 1.69
Cartridge, 5.56-mm Tracer, M856
WC844 1.11 0.162 — 0.076 0.021 1.60
Cartridge, 7.62-mm Ball, M80 WC846 2.14 0.267* 0.004* 0.137 0.030 2.66
Cartridge, CAL .50 Ball, M33 WC860 12.0 1.48* — 1.22 0.172 15.2
Cartridge, CAL .50 Tracer, M17 WC857 11.7 1.57 — 0.856 0.178 14.6
Sources: MIDAS Database, JEDMICS Database, WARP Database (Restricted access Web sites); US Army (1998). *Values for ammunition test-fired confirmed by GCMS at CRREL. ** Total propellant mass per round includes constituents not shown in table.

ERDC TR-08-1 3-29
Appendix 3-B: Sampling Data
Table 3-B1 contains sampling data for the tests conducted at Camp Ethan Allen on 9 February. Table 3-B2 contains sampling data for the 23 Febru-ary Camp Ethan Allen tests.
Table 3-B1. 9 February sampling data.
Decision unit Rep # # Increments Sampler Volume (Melt-mL) mL / Incr Area sampled (m2)
9-mm Pistol Plume 1 50 MRW 940 18.8 0.50
2 56 MRW 1060 18.9 0.56
3 52 MRW 1060 20.4 0.52
OTP: 0-0.8 m 1 59 MEW 710 12.0 0.59
2 53 MEW 740 14.0 0.53
10-m Transect 1 52 ST 720 13.8 0.52
2 50 ST 660 13.2 0.50
3 50 ST 660 13.2 0.50
20-m Transect 1 37 MRW 880 23.8 0.37
2 40 MRW 760 19.0 0.40
3 40 MRW 800 20.0 0.40
30-m Transect 1 44 MEW 700 15.9 0.44
FP-Mass 1 20 MRW 460 23.0 0.20
FP-Trays 1 20 MRW 440 22.0 0.20
Mean: 17.7
Median: 18.9
Range: 11.7
5.56-mm Automatic Rifle Plume 1 72 MRW 1480 20.6 0.72
2 70 MRW 1400 20.0 0.70
3 70 MRW 1330 19.0 0.70
OTP: 0-1 m 1 72 MEW 1010 14.0 0.72
2 71 DJL 1380 19.4 0.71
10-m Transect 1 50 ST 660 13.2 0.50
2 50 ST 700 14.0 0.50
3 50 ST 800 16.0 0.50
20-m Transect 1 42 MEW 640 15.2 0.42
2 40 MEW 600 15.0 0.40
3 40 MEW 580 14.5 0.40

ERDC TR-08-1 3-30
Decision unit Rep # # Increments Sampler Volume (Melt-mL) mL / Incr Area sampled (m2) 30-m Transect 1 46 ST 770 16.7 0.46
2 50 ST 810 16.2 0.50
FP-Mass 1 27 MRW 600 22.2 0.27
FP-Trays 1 30 MRW 560 18.7 0.30
Mean: 16.7
Median: 16.1
Range: 9.0 0.00
7.62-mm Machine Gun Plume 1 84 MRW 1980 23.6 0.84 2 80 MRW 1820 22.8 0.80 3 72 MRW 1580 21.9 0.72 OTP: 0-1 m 1 60 MEW 980 16.3 0.60 2 66 MEW 1120 17.0 0.66 20-m Transect 1 25 MRW 600 24.0 0.25 2 28 MRW 620 22.1 0.28 3 30 MEW 500 16.7 0.30 30-m Transect 1 50 ST 660 13.2 0.50 2 50 ST 600 12.0 0.50 3 50 ST 580 11.6 0.50 40-m Transect 1 50 ST 660 13.2 0.50 2 50 ST 620 12.4 0.50 FP-Mass* 1 40 MRW 900 22.5 0.40 FP-Trays 1 25 MRW 560 22.4 0.25 Background-1 1 50 MEW 600 12.0 0.50 Background-2 1 50 ST 720 14.4 0.50
Mean: 18.1 Median: 17.0
Range: 12.4
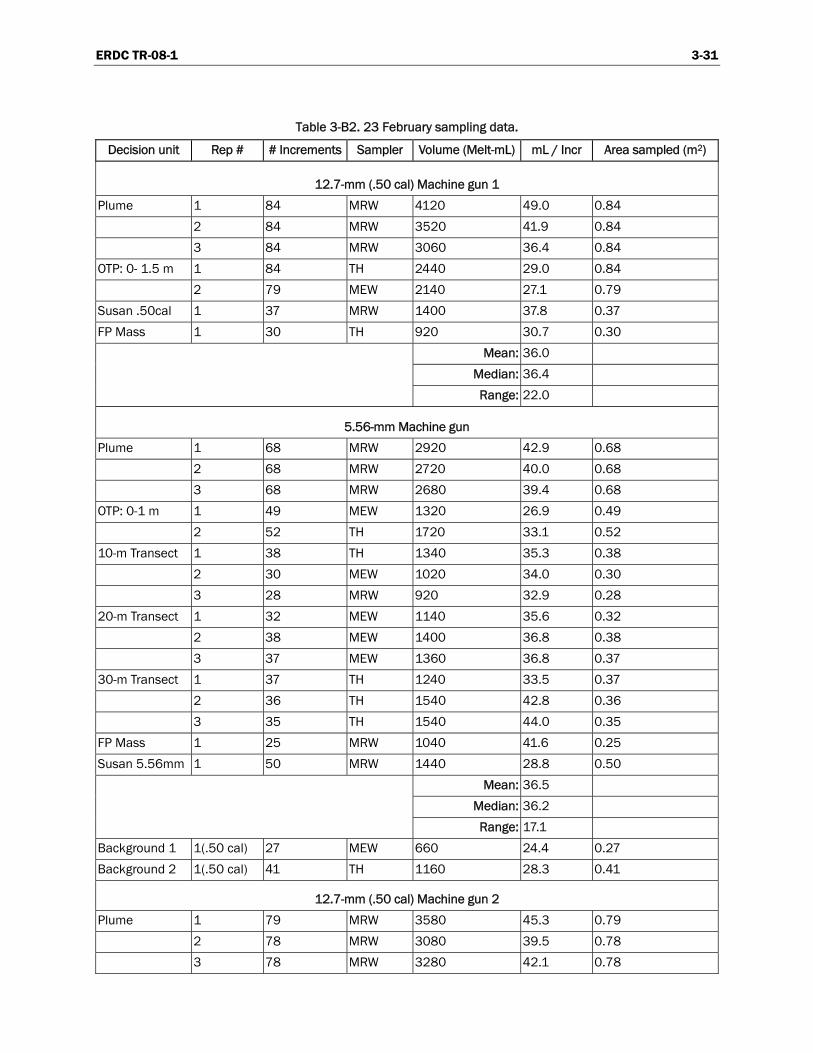
ERDC TR-08-1 3-31
Table 3-B2. 23 February sampling data.
Decision unit Rep # # Increments Sampler Volume (Melt-mL) mL / Incr Area sampled (m2)
12.7-mm (.50 cal) Machine gun 1 Plume 1 84 MRW 4120 49.0 0.84 2 84 MRW 3520 41.9 0.84 3 84 MRW 3060 36.4 0.84 OTP: 0- 1.5 m 1 84 TH 2440 29.0 0.84 2 79 MEW 2140 27.1 0.79 Susan .50cal 1 37 MRW 1400 37.8 0.37 FP Mass 1 30 TH 920 30.7 0.30
Mean: 36.0 Median: 36.4
Range: 22.0
5.56-mm Machine gun Plume 1 68 MRW 2920 42.9 0.68 2 68 MRW 2720 40.0 0.68 3 68 MRW 2680 39.4 0.68 OTP: 0-1 m 1 49 MEW 1320 26.9 0.49 2 52 TH 1720 33.1 0.52 10-m Transect 1 38 TH 1340 35.3 0.38 2 30 MEW 1020 34.0 0.30 3 28 MRW 920 32.9 0.28 20-m Transect 1 32 MEW 1140 35.6 0.32 2 38 MEW 1400 36.8 0.38 3 37 MEW 1360 36.8 0.37 30-m Transect 1 37 TH 1240 33.5 0.37 2 36 TH 1540 42.8 0.36 3 35 TH 1540 44.0 0.35 FP Mass 1 25 MRW 1040 41.6 0.25 Susan 5.56mm 1 50 MRW 1440 28.8 0.50
Mean: 36.5 Median: 36.2
Range: 17.1 Background 1 1(.50 cal) 27 MEW 660 24.4 0.27 Background 2 1(.50 cal) 41 TH 1160 28.3 0.41
12.7-mm (.50 cal) Machine gun 2 Plume 1 79 MRW 3580 45.3 0.79 2 78 MRW 3080 39.5 0.78 3 78 MRW 3280 42.1 0.78

ERDC TR-08-1 3-32
Decision unit Rep # # Increments Sampler Volume (Melt-mL) mL / Incr Area sampled (m2) OTP: 0-1.5 m 1 77 MEW 2520 32.7 0.77 2 80 TH 2760 34.5 0.80 FP Mass 1 32 MRW 1240 38.8 0.32 20-m Transect 1 30 TH 1330 44.3 0.30 2 28 TH 1320 47.1 0.28 3 27 TH 1200 44.4 0.27 30-m Transect 1 32 MRW 1340 41.9 0.32 2 32 MRW 1220 38.1 0.32 3 32 MRW 1220 38.1 0.32 40-m Transect 1 37 MEW 1280 34.6 0.37 2 41 MEW 1520 37.1 0.41 3 51 TH 2220 43.5 0.51
Mean: 40.1 Median: 39.5
Range: 14.4 Background 1 1(5.56mm) 20 TH 740 37.0 0.20 Background 2 1(5.56mm) 20 MEW 700 35.0 0.20
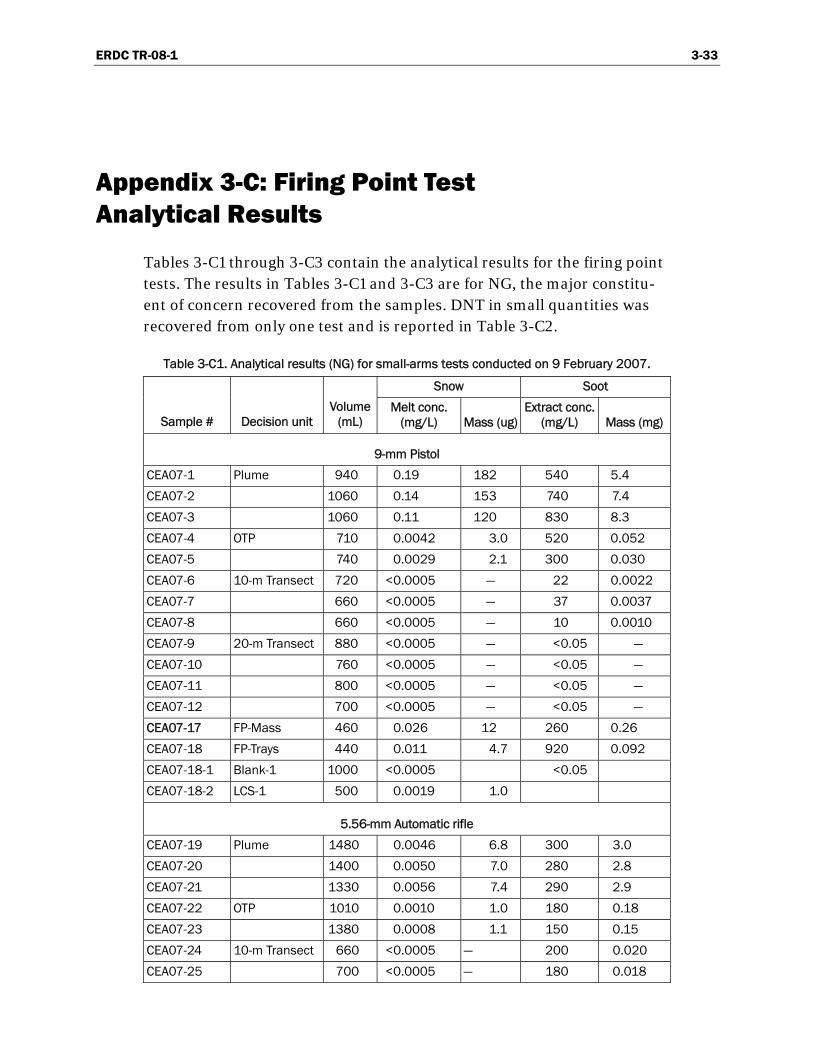
ERDC TR-08-1 3-33
Appendix 3-C: Firing Point Test Analytical Results
Tables 3-C1 through 3-C3 contain the analytical results for the firing point tests. The results in Tables 3-C1 and 3-C3 are for NG, the major constitu-ent of concern recovered from the samples. DNT in small quantities was recovered from only one test and is reported in Table 3-C2.
Table 3-C1. Analytical results (NG) for small-arms tests conducted on 9 February 2007.
Snow Soot
Sample # Decision unit Volume
(mL) Melt conc.
(mg/L) Mass (ug) Extract conc.
(mg/L) Mass (mg)
9-mm Pistol
CEA07-1 Plume 940 0.19 182 540 5.4
CEA07-2 1060 0.14 153 740 7.4
CEA07-3 1060 0.11 120 830 8.3
CEA07-4 OTP 710 0.0042 3.0 520 0.052
CEA07-5 740 0.0029 2.1 300 0.030
CEA07-6 10-m Transect 720 <0.0005 — 22 0.0022
CEA07-7 660 <0.0005 — 37 0.0037
CEA07-8 660 <0.0005 — 10 0.0010
CEA07-9 20-m Transect 880 <0.0005 — <0.05 —
CEA07-10 760 <0.0005 — <0.05 —
CEA07-11 800 <0.0005 — <0.05 —
CEA07-12 700 <0.0005 — <0.05 —
CEA07-17 FP-Mass 460 0.026 12 260 0.26
CEA07-18 FP-Trays 440 0.011 4.7 920 0.092
CEA07-18-1 Blank-1 1000 <0.0005 <0.05
CEA07-18-2 LCS-1 500 0.0019 1.0
5.56-mm Automatic rifle
CEA07-19 Plume 1480 0.0046 6.8 300 3.0
CEA07-20 1400 0.0050 7.0 280 2.8
CEA07-21 1330 0.0056 7.4 290 2.9
CEA07-22 OTP 1010 0.0010 1.0 180 0.18
CEA07-23 1380 0.0008 1.1 150 0.15
CEA07-24 10-m Transect 660 <0.0005 — 200 0.020
CEA07-25 700 <0.0005 — 180 0.018
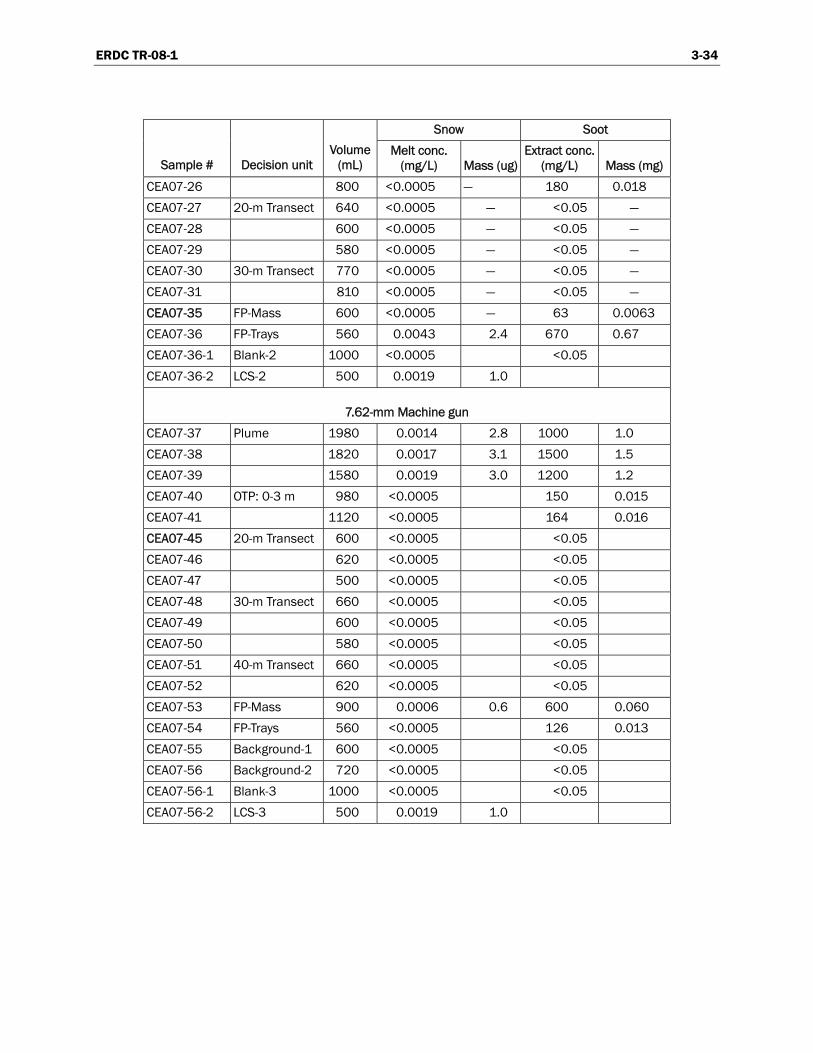
ERDC TR-08-1 3-34
Snow Soot
Sample # Decision unit Volume
(mL) Melt conc.
(mg/L) Mass (ug) Extract conc.
(mg/L) Mass (mg)
CEA07-26 800 <0.0005 — 180 0.018
CEA07-27 20-m Transect 640 <0.0005 — <0.05 —
CEA07-28 600 <0.0005 — <0.05 —
CEA07-29 580 <0.0005 — <0.05 —
CEA07-30 30-m Transect 770 <0.0005 — <0.05 —
CEA07-31 810 <0.0005 — <0.05 —
CEA07-35 FP-Mass 600 <0.0005 — 63 0.0063
CEA07-36 FP-Trays 560 0.0043 2.4 670 0.67
CEA07-36-1 Blank-2 1000 <0.0005 <0.05
CEA07-36-2 LCS-2 500 0.0019 1.0
7.62-mm Machine gun
CEA07-37 Plume 1980 0.0014 2.8 1000 1.0
CEA07-38 1820 0.0017 3.1 1500 1.5
CEA07-39 1580 0.0019 3.0 1200 1.2
CEA07-40 OTP: 0-3 m 980 <0.0005 150 0.015
CEA07-41 1120 <0.0005 164 0.016
CEA07-45 20-m Transect 600 <0.0005 <0.05
CEA07-46 620 <0.0005 <0.05
CEA07-47 500 <0.0005 <0.05
CEA07-48 30-m Transect 660 <0.0005 <0.05
CEA07-49 600 <0.0005 <0.05
CEA07-50 580 <0.0005 <0.05
CEA07-51 40-m Transect 660 <0.0005 <0.05
CEA07-52 620 <0.0005 <0.05
CEA07-53 FP-Mass 900 0.0006 0.6 600 0.060
CEA07-54 FP-Trays 560 <0.0005 126 0.013
CEA07-55 Background-1 600 <0.0005 <0.05
CEA07-56 Background-2 720 <0.0005 <0.05
CEA07-56-1 Blank-3 1000 <0.0005 <0.05
CEA07-56-2 LCS-3 500 0.0019 1.0

ERDC TR-08-1 3-35
Table 3-C2. Analytical results (DNT) for small-arms test conducted on 9 February 2007.
Snow Soot
Sample # Decision unit Volume
(mL) Melt conc.
(mg/L) Mass (ug) Extract conc.
(mg/L) Mass (mg)
7.62-mm Machine gun
CEA07-37 Plume 1980 <0.0005 — 13 0.0013 CEA07-38 1820 <0.0005 — 16 0.0016 CEA07-39 1580 <0.0005 — 15 0.0015 CEA07-40 OTP: 0-3 m 980 <0.0005 — <0.02 — CEA07-41 1120 <0.0005 — <0.02 — CEA07-45 20-m Transect 600 <0.0005 — <0.02 — CEA07-46 620 <0.0005 — <0.02 — CEA07-47 500 <0.0005 — <0.02 —
Table 3-C3. Analytical results (NG) for small-arms tests conducted on 23 February 2007.
Snow Soot
Sample # Decision unit Volume
(mL) Melt conc.
(mg/L) Mass (ug) Extract conc.
(mg/L) Mass (mg)
12.7-mm Machine gun - 1
CEA07-101 Plume 4120 0.27 11 14.2 1.4
CEA07-102 3520 0.44 15 20.1 2.0
CEA07-103 3060 0.41 13 27.1 2.7
CEA07-104 OTP 2440 <0.05 — 8.09 0.081
CEA07-105 2140 <0.05 — 4.1 0.041
CEA07-118 FP Mass 920 <0.05 0.24 0.0024
CEA07-118-1 Blank 1 1000 <0.05 <0.05
CEA07-118-2 LCS 1 500 0.19 0.95
5.56-mm Machine gun
CEA07-119 Plume 2920 0.25 7.3 9.19 0.92
CEA07-120 2720 0.33 9.0 29.9 3.0
CEA07-121 2680 0.36 10 28.0 2.8
CEA07-122 OTP 1320 0.05 0.7 7.98 0.080
CEA07-123 1720 <0.05 — 7.68 0.077
CEA07-124 10-m Transect 1340 <0.05 — 0.68 0.0068
CEA07-125 1020 <0.05 — 0.55 0.0055
CEA07-126 920 <0.05 — 1.56 0.016
CEA07-127 20-m Transect 1140 <0.05 — 0.10 0.001
CEA07-128 1400 <0.05 — <0.05 —

ERDC TR-08-1 3-36
Snow Soot
Sample # Decision unit Volume
(mL) Melt conc.
(mg/L) Mass (ug) Extract conc.
(mg/L) Mass (mg)
CEA07-129 1360 <0.05 — <0.05 — CEA07-130 30-m Transect 1240 <0.05 — <0.05 — CEA07-131 1540 <0.05 — <0.05 — CEA07-132 1540 <0.05 — 0.12 0.001
CEA07-135 FP Mass 1040 <0.05 — 1.11 0.011
CEA07-136-1 Blank 2 1000 <0.05 <0.05
CEA07-136-2 LCS 2 0.20
CEA07-137 Background 1 660 <0.05 — <0.05 — CEA07-138 Background 2 1160 <0.05 — <0.05 —
12.7-mm Machine gun - 2
CEAO7-139 Plume 3580 0.32 11 34.1 3.4
CEA07-140 3080 0.44 14 32.1 3.2
CEA07-141 3280 0.53 17 31.8 6.4
CEA07-142 OTP 2520 <0.05 — 2.11 0.021
CEA07-143 2760 <0.05 — 4.41 0.044
CEA07-144 FP Mass 1240 <0.05 — <0.05 — CEA07-145 20-m Transect 1330 <0.05 — 1.66 0.017
CEA07-146 1320 <0.05 — 1.15 0.012
CEA07-147 1200 <0.05 — 1.15 0.012
CEA07-148 30-m Transect 1340 <0.05 — 0.56 0.006
CEA07-149 1220 <0.05 — 0.33 0.003
CEA07-150 1220 <0.05 — 0.40 0.004
CEA07-151 40-m Transect 1280 <0.05 — 0.08 0.001
CEA07-152 1520 <0.05 — 0.15 0.002
CEA07-153 2220 <0.05 — 0.10 0.001
CEA07-154 Background 1 740 <0.05 — <0.05 — CEA07-155 Background 2 700 <0.05 — <0.05 — CEA07-155-1 Blank 3 1000 <0.05 <0.05
CEA07-155-2 LCS 3 0.18
All samples taken with 10- x 10- x 2-cm scoops Soot: Filters extracted with 10 mL of AcN with the exception of CEA07-141, which had 20 mL * 20 mL of acetonitrile used
ERDC TR-08-1 4-1
— Chapter 4 —
Energetic Residues Deposition from 84-mm Carl Gustav Antitank Live Firing
SONIA THIBOUTOT, GUY AMPLEMAN, ANDRÉ MAROIS, ANNIE GAGNON, DENIS GILBERT, VINCENT TANGUAY, AND ISABELLE POULIN
Abstract
The potential environmental contamination as a result of live-fire military training has to be assessed in order to train our troops in a sustainable manner. Recently, propellant residues were detected around artillery, anti-tank, and small arms firing positions during field characterization. How-ever, the source term per round is an important parameter and has not been defined yet for shoulder-fired antitank weapons. In February 2007, DRDC Valcartier teamed with the Canadian Infantry School to sample the residues generated by the firing of thirty-nine 84-mm Carl Gustav rockets. Samples were collected using 16 rows of particle traps up to 50 m in front of and behind the weapons. This allowed the calculation of an estimate of the percentage of un-reacted nitroglycerin (NG) that is expelled on the surface soil in the area where our traps were installed. As much as 780 g (14% w/w) of NG was expelled on the soil surface, with 98% of the resi-dues being deposited rearwards of the firing positions, mostly within the first 15 m. There is a high uncertainty in the calculated estimate, but this trial clearly demonstrated that firing the 84-mm Carl Gustav weapon is not efficient and will lead to the rapid buildup of propellant residues in the surface soils. Our results are in agreement with the high levels of NG that were detected at many antitank ranges and demonstrate that these weap-ons have the highest environmental impact measured up to now. Other similar trials should be conducted to confirm these results, and research is needed to develop better propelling charges that will reduce this adverse

ERDC TR-08-1 4-2
impact. This work was supported by the Sustain Thrust of DRDC, Canada, and the Strategic Environmental Research and Development Program (SERDP ER-1481), Washington DC, USA.

ERDC TR-08-1 4-3
Executive Summary
This study is part of a larger effort undertaken in the context of sustaining operational military activities. The Canadian Forces need to be informed about the potential environmental and human health impacts of activities such as live firing, detonation of unexploded ordnance, and detonation of surplus ammunition. This is critical to ensure that training can be con-ducted on a sustainable basis, with minimal adverse environmental and health impact. In the past, much effort was invested in the characteriza-tion of energetic materials contamination at live-fire range impact areas. However, fewer efforts were dedicated to the characterization of the muni-tions firing positions. At these locations, the propellant included in the cartridge is ignited to propel the projectile toward the impact zone. Based on recent field characterization, it was noted that propellant residues ac-cumulated to reach levels of concern at firing locations. These results demonstrated that firing points are of concern for range sustainability and maintenance. This study was aimed at measuring the dispersion of propel-lant residues both from the rearward and front blast of Carl Gustav 84-mm antitank weapons, which are frequently fired in Canadian ranges. The 84-mm recoilless gun consists of an open tube that will propel an explo-sive warhead with a flat and short trajectory upon ignition of the propel-lant charge. The fact that the rear of the tube is open allows a rearward blast that might project propellant grains as far as 50 meters backward. DRDC Valcartier participated in a Carl Gustav live-firing exercise con-ducted by the Infantry 06/07 school in February 2007 and installed parti-cle traps behind and in front of the firing positions to catch the solid resi-dues that were expelled upon firing. Another team sampled the gaseous emissions produced by the propellant combustion, and these will be the subject of another report. After the firing of thirty-nine Carl Gustav 84-mm rockets, the traps were sampled and analyzed for propellant residues. The use of the particle traps provided an elegant way of catching the parti-cles without any interference. It was demonstrated that 14% w/w of NG was dispersed by each firing. The highest levels of residues are projected between 5 and 15 m behind the firing position, which corresponds with what was observed in past antitank site characterization across Canada and the United States. This work allowed the calculation of the dispersion of contaminant per firing of 84-mm rounds, which will in turn contribute to the prediction of the environmental impact of live firing with these

ERDC TR-08-1 4-4
weapons. By knowing how much residue is ejected per round and its loca-tion, one can calculate how many rounds can be fired before the soil con-centrations reach levels of concern of contaminants. Also, by learning the fate of these contaminants, a global assessment of the environmental risk associated with the activity can be evaluated. Finally, by better under-standing the impact of past formulations, work can be conducted to de-velop future formulations for shoulder-launched rocket propellants that will have less adverse environmental impact.

ERDC TR-08-1 4-5
Introduction
Activities such as routine military training involving munitions in live-fire exercises have proven to lead to the buildup of explosives or propellant residues in soils. In the context where military activities are essential to maintain troop combat readiness, it is imperative to better understand the specific impact of each type of live-firing activity. This will allow man-agement of these ranges to minimize adverse environmental effects and development of future weapons with lesser environmental impact and lead to recommendations that will minimize adverse environmental or human health impact of actual weapons without reducing the training tempo.
Numerous live-fire ranges have been characterized over the last several years [1–6]. Past studies conducted at antitank ranges demonstrated that both target impact areas and firing positions (FP) contain high concentra-tions of explosive and propellant residues in the surface soils [7,8]. The explosive cyclotetramethylene-tetranitramine (HMX) accumulates at the target area, while high levels of nitroglycerin (NG) have been detected both in front of and behind the FP. The dispersion of HMX is due to the high dud rate of antitank weapons and has been studied extensively in the past [7-9]. The accumulation of NG at the FP has been attributed to the projec-tion of unburned propellant grains, which are never completely consumed and have the potential to contaminate the surface soils and underlying groundwater. The delineation of the impacted areas proved that propellant residues were dispersed up to 50 meters away from the firing line both be-tween the firing point and the target and behind the firing line [8]. Carl Gustav 84-mm antitank weapons are frequently fired on Canadian anti-tank ranges. They are shoulder-launched and use a double-base propellant composed mainly of NG dispersed in a nitrocellulose (NC) matrix. It was hypothesized that propellant residues are spread both in front of and be-hind the firing line, since the rear end of the launcher is open to eliminate the recoil effect. The objective of the present study was to examine the mass loading of propellant residue at firing point for the Carl Gustav weapon. This will generate pertinent information on the source term of propellant residues, enable further modeling studies, and allow the evalua-tion of the time needed for the accumulation to levels of concern of propel-lant residues on a given site based on the frequency of its use.

ERDC TR-08-1 4-6
The work described in the present report was conducted on 6 and 7 Febru-ary 2007 and was conducted within Sustain Thrust, work breakdown ele-ment 12SG02, and was co-sponsored by the Strategic Environmental R&D Program (SERDP).

ERDC TR-08-1 4-7
Experimental Methods
Field Work
The live firing was conducted at the Arnhem antitank range, located within the Garrison Valcartier training area, on 7 February 2007, from 9h15 am to 11h45 am (Fig. 4-1). This site has been in use for more than 50 years by the Canadian Forces for live-fire training with antitank weapons. The range has five target tanks, three that are located in a sandy flat area at the bottom of a cliff at approximately 100 meters from the firing line, and two targets that are located in the cliff, respectively at 120 and 150 m from the firing line. In the last five years, only practice rounds were fired at the Arnhem range, while in the past, live HMX-based warheads were fired, and this site was extensively studied [6, 8-9]. There are two FP, 40 meters away from each other (Fig. 4-2).
Figure 4-1. Arnhem antitank range target area.

ERDC TR-08-1 4-8
Figure 4-2. Arnhem antitank range firing positions.
The DRDC team participated in an exercise of the Infantry course to col-lect particles ejected by the 84-mm rocket firing. A delay of one hour was available to the team to collect samples after the firing event, since the military group was scheduled to fire mortar rounds at 13h00. The installa-tion of the particle traps in front of the FP and behind the FP (from –30 m to –50 m) was begun the day prior to the firing, on the afternoon of 6 Feb-ruary, and was completed on the morning of the 7th from 7h30 to 9h00. The meteorological conditions prevailing on 7 February were sunny with-out winds, with a temperature that varied between –26°C at 7h30 to –17°C at noon. Firing instructions, safety briefing, and explanation on the aim of our sampling study were given to the military group prior to the exercise (Fig. 4-3). The live firing was conducted by 36 students of the PP1 Infantry 06/07 course, split in nine groups of four students who fired in teams at both FP (Fig. 4-4). Each student fired a minimum of two 84-mm rounds, and a few groups fired more than four rounds per FP. Each student fired a 7.62-mm sub-caliber tracer round (FFV553) using the Carl Gustav launcher prior to firing the 84-mm rounds.

ERDC TR-08-1 4-9
Figure 4-3. Briefing the PP1 Infantry 06/07 group prior to the firing exercise.
Figure 4-4. Students of the PP1 Infantry 06/07 course prior to firing.
A total of 77 rounds was fired, and the exact number of rounds fired by each group is reported in Table 4-1. Thirty nine rounds were fired from bay one (FP#1) and 38 from bay two (FP#2).

ERDC TR-08-1 4-10
Table 4-1. Number of rounds fired by each group at both firing positions.
Team Position Number of
84-mm rounds Total
#1 4 1
#2 4 8
#1 4 2
#2 6 10
#1 4 3
#2 5 9
#1 5 4
#2 5 10
#1 4 5
#2 4 8
#1 4 6
#2 4 8
#1 6 7
#2 4 10
#1 4 8
#2 4 8
#1 4 9
#2 2 6
The sampling for solid propellant residues was conducted in front of and behind FP #1, while sampling pumps were installed behind FP #2, in order to collect the gaseous emission emitted upon firing. A separate report will be published by Drs. Diaz and Poulin on the gaseous emissions. Sampling at both FPs for solid residues was not possible considering the short time frame between the Carl Gustav and following mortar round firings by the same group. Moreover, it would have impaired the safe movements of the military students on the firing pad.
Material
Past studies on particle collection from detonation events or live firing have mostly used either aluminum witness plates [10] or snow cover as the receptacle for particles [11–15]. Witness plates used in the past were not considered for this study, because of their flat aluminum surface and the poor retention of these flat surfaces toward solid particles in a highly tur-bulent situation. The use of snow as a pristine media for the collection of a contamination plume has many advantages and has been used successfully
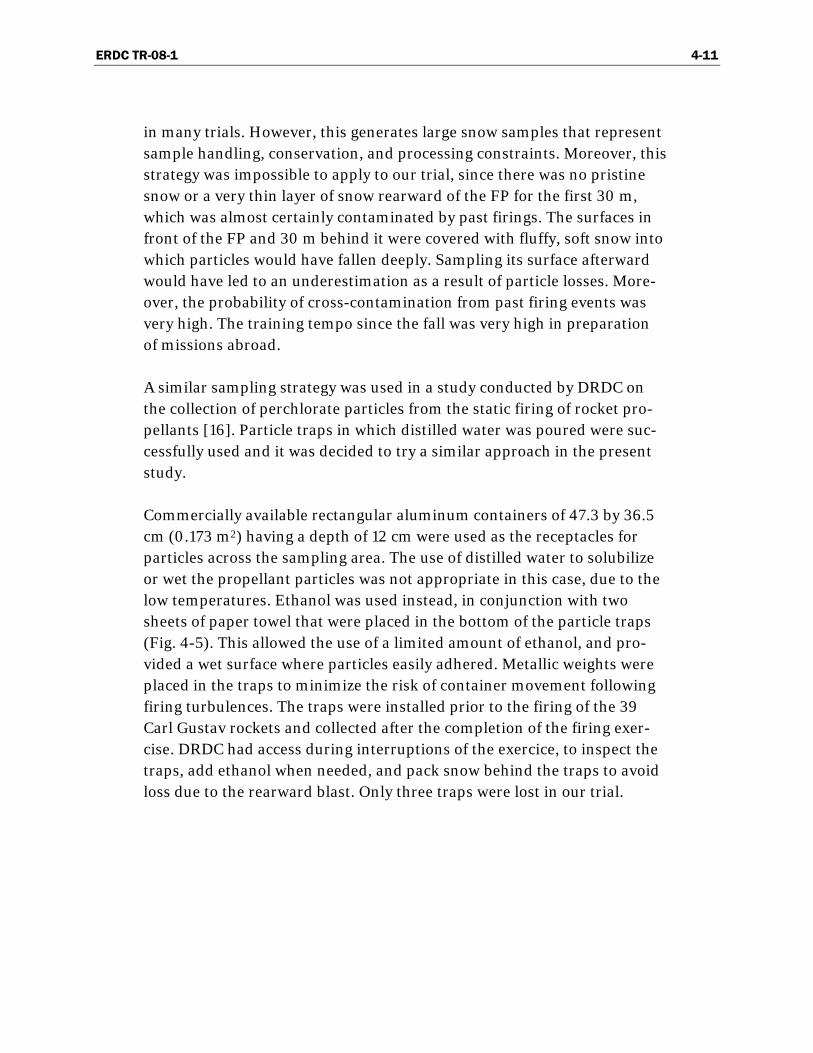
ERDC TR-08-1 4-11
in many trials. However, this generates large snow samples that represent sample handling, conservation, and processing constraints. Moreover, this strategy was impossible to apply to our trial, since there was no pristine snow or a very thin layer of snow rearward of the FP for the first 30 m, which was almost certainly contaminated by past firings. The surfaces in front of the FP and 30 m behind it were covered with fluffy, soft snow into which particles would have fallen deeply. Sampling its surface afterward would have led to an underestimation as a result of particle losses. More-over, the probability of cross-contamination from past firing events was very high. The training tempo since the fall was very high in preparation of missions abroad.
A similar sampling strategy was used in a study conducted by DRDC on the collection of perchlorate particles from the static firing of rocket pro-pellants [16]. Particle traps in which distilled water was poured were suc-cessfully used and it was decided to try a similar approach in the present study.
Commercially available rectangular aluminum containers of 47.3 by 36.5 cm (0.173 m2) having a depth of 12 cm were used as the receptacles for particles across the sampling area. The use of distilled water to solubilize or wet the propellant particles was not appropriate in this case, due to the low temperatures. Ethanol was used instead, in conjunction with two sheets of paper towel that were placed in the bottom of the particle traps (Fig. 4-5). This allowed the use of a limited amount of ethanol, and pro-vided a wet surface where particles easily adhered. Metallic weights were placed in the traps to minimize the risk of container movement following firing turbulences. The traps were installed prior to the firing of the 39 Carl Gustav rockets and collected after the completion of the firing exer-cise. DRDC had access during interruptions of the exercice, to inspect the traps, add ethanol when needed, and pack snow behind the traps to avoid loss due to the rearward blast. Only three traps were lost in our trial.

ERDC TR-08-1 4-12
Figure 4-5. Particle trap.
Weapon Description and Propellant Composition
The 84-mm infantry antitank gun is of Swedish design and manufacture. It is a recoilless, low-velocity weapon that is breech-loaded and percus-sion-fired. Two versions of the weapon are in service with the Canadian Forces, the original High-Explosive (HE) weapon and the Target Practice Rocket Assisted Projectiles (TP RAP). The Infantry school information book for the Carl Gustav 84-mm weapon describes it as a recoilless weapon that produces at firing a distinct flash and blast rearward, with a danger area that extends to 50 m rearward [17, 18]. There are clear in-structions to clean the venturi and the chamber between rounds to remove any unburned propellant. Note that in the instruction manual, it is made clear that the propellant does not burn completely.
The 84-mm round consists of a projectile and a cased propellant charge that are integrated together in a single round (Fig. 4-6). Target Practice Rocket Assisted Projectiles (TP RAP) were fired in our trial. For this dummy round, the warhead is replaced by an aluminum alloy, without ex-plosive. The propellant is layered in strips and is packed in the propelling chamber (Fig. 4-7). The size of the round is illustrated in Figure 4-8, where two HE rounds were open-detonated at CFB-Gagetown while we were sampling the Gagetown antitank range [1]. Note the reddish color of the thermoplastic rear end of the weapon.
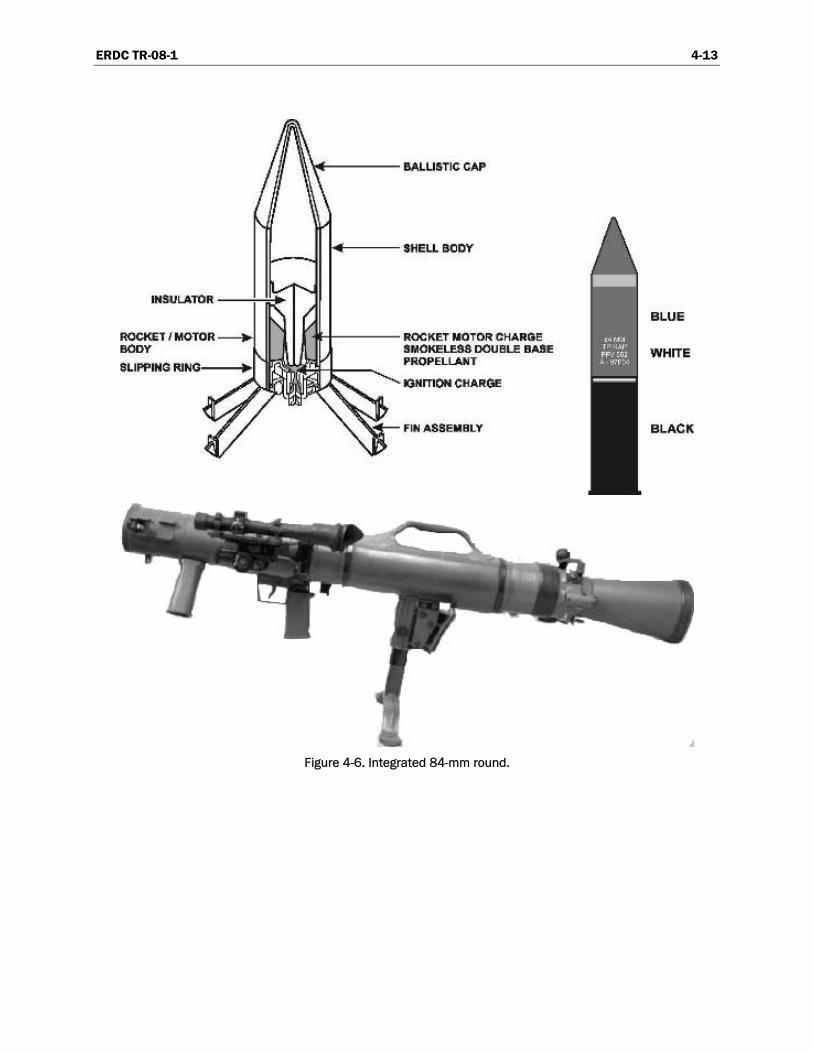
ERDC TR-08-1 4-13
Figure 4-6. Integrated 84-mm round.

ERDC TR-08-1 4-14
Figure 4-7. Propelling chamber of the 84-mm round.
Figure 4-8. Two 84-mm rounds, Gagetown NB.
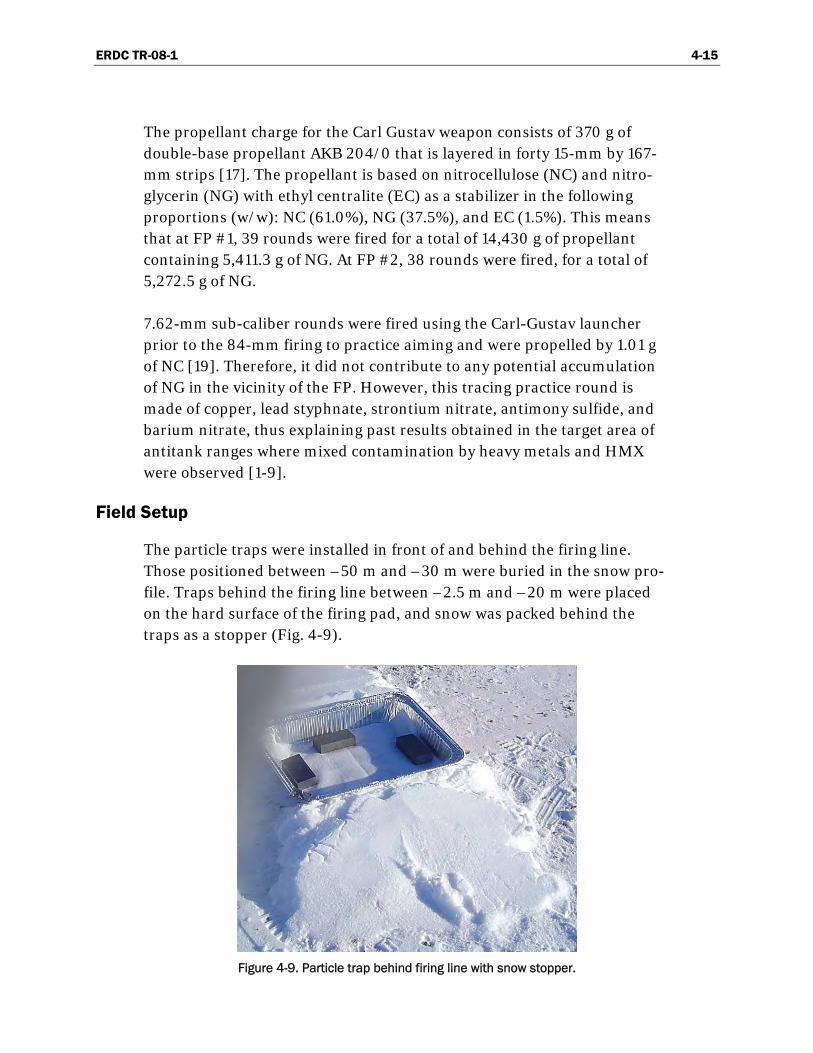
ERDC TR-08-1 4-15
The propellant charge for the Carl Gustav weapon consists of 370 g of double-base propellant AKB 204/0 that is layered in forty 15-mm by 167-mm strips [17]. The propellant is based on nitrocellulose (NC) and nitro-glycerin (NG) with ethyl centralite (EC) as a stabilizer in the following proportions (w/w): NC (61.0%), NG (37.5%), and EC (1.5%). This means that at FP #1, 39 rounds were fired for a total of 14,430 g of propellant containing 5,411.3 g of NG. At FP #2, 38 rounds were fired, for a total of 5,272.5 g of NG.
7.62-mm sub-caliber rounds were fired using the Carl-Gustav launcher prior to the 84-mm firing to practice aiming and were propelled by 1.01 g of NC [19]. Therefore, it did not contribute to any potential accumulation of NG in the vicinity of the FP. However, this tracing practice round is made of copper, lead styphnate, strontium nitrate, antimony sulfide, and barium nitrate, thus explaining past results obtained in the target area of antitank ranges where mixed contamination by heavy metals and HMX were observed [1-9].
Field Setup
The particle traps were installed in front of and behind the firing line. Those positioned between –50 m and –30 m were buried in the snow pro-file. Traps behind the firing line between –2.5 m and –20 m were placed on the hard surface of the firing pad, and snow was packed behind the traps as a stopper (Fig. 4-9).
Figure 4-9. Particle trap behind firing line with snow stopper.

ERDC TR-08-1 4-16
Sixteen trap lines were set up perpendicular to the line of fire. In front of the FP, traps were placed at respective distances of +5, +10, +15, +20, +30, +40, and +50 m from the firing line. The setup used in front of the firing line is illustrated in Figure 4-10.
Figure 4-10. Lines of particle traps in front of the firing line.
At the +5, +10, +15, and +30 m lines, three traps were used, with the mid-dle trap being installed directly in front of the FP and two traps along the same line, 5 m away in each direction. At the +20 and +40 m lines, five traps were used, the center trap being installed directly in front of the FP, with four traps placed 5 m and 10 m away in each direction. Behind the FP, traps were placed at respective distances of –2.5, –5, –7.5, –10, –15, –20, –30, –40, and –50 m from the firing line. At the –2.5-, –5-, –7.5-, –10-, –15-, and –30-m lines, three traps were used, with the center trap being installed directly behind the FP and two traps along the same line, 5 m away in each direction. At the –20- and –40-m lines, five traps were used, the center trap being installed directly behind the FP, and four traps placed 5 m and 10 m away in each direction. At the –50 m position, a sin-gle trap was located at the centerline. The setup of the traps rearward of the firing line is illustrated in Figures 4-11, 4-12, and 4-13.
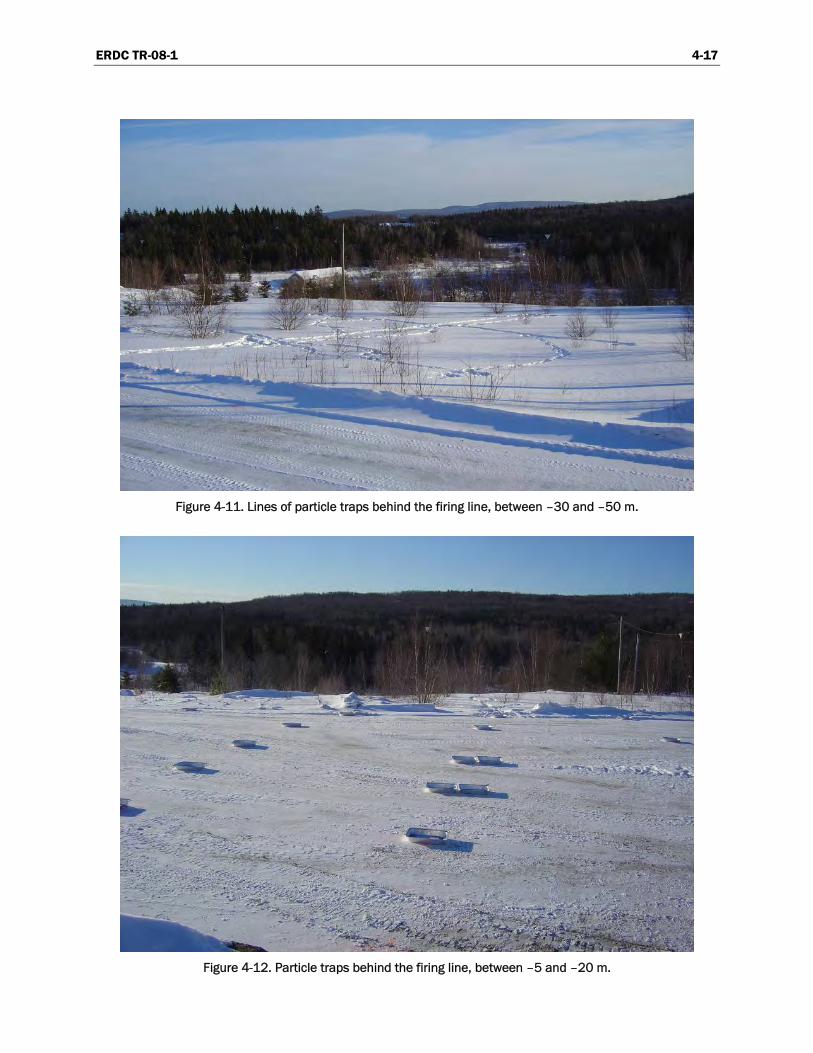
ERDC TR-08-1 4-17
Figure 4-11. Lines of particle traps behind the firing line, between –30 and –50 m.
Figure 4-12. Particle traps behind the firing line, between –5 and –20 m.

ERDC TR-08-1 4-18
Figure 4-13. Field setup.

ERDC TR-08-1 4-19
Figure 4-13 presents the trap locations as well as the areas that were inte-grated by our sampling pattern, which are highlighted in corresponding colors. The total surface of each represented area is given in the two right-hand columns, with a color code identical to the area that it represents.
A sampling line using three traps was also installed at –15 m, behind the second firing position to obtain a field replicate of FP1. All the traps were labeled using duct tape. The labeling system consisted of – or + x m, with x being the distance from the firing line, – being behind the FP and + in front. For the lines that had three traps, samples were combined so they were all labeled the same. For the lines having five traps, the two traps at 10-m distance from the middle traps were labeled + or – x m ext, and they were later combined in a second jar. Two field blanks were installed ap-proximately 50 m away from the FP, to its west, along a tree line.
The live firing was conducted in nine groups of four students, with 10-minute intervals between groups. The sampling team went 150 m away from the firing pad at each firing, but was allowed on site in the intervals to verify the status of the traps and make any corrective action when needed. The traps directly behind the FP were the most problematic; three were lost at –2.5, –5 and –7.5 m from the rearward blast. For these three lines, results will be integrated using only two traps. The middle trap at –10 m was blown away from its original position without losing its con-tent, so it was re-installed twice and kept in the trial. The other traps were stable and all remained in place.
Sample Processing
At the completion of the live firing, the traps were brought back to the firing pads to be processed (Fig. 4-14). As explained earlier, samples were combined for the three center traps; for the lines that had five traps, the two external traps were combined in a second sampling jar. The very short time frame allowed to our team between the end of the 84-mm firing and our departure mandated that we combine our samples and limited the number of samples that we collected.
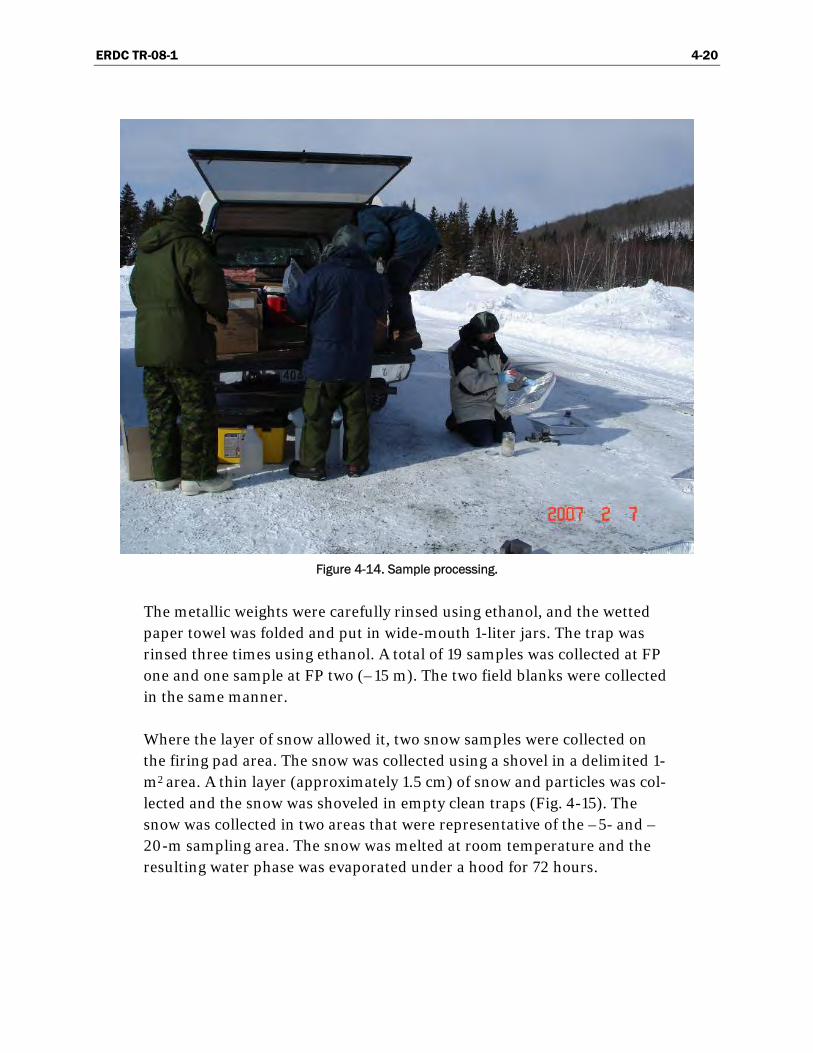
ERDC TR-08-1 4-20
Figure 4-14. Sample processing.
The metallic weights were carefully rinsed using ethanol, and the wetted paper towel was folded and put in wide-mouth 1-liter jars. The trap was rinsed three times using ethanol. A total of 19 samples was collected at FP one and one sample at FP two (–15 m). The two field blanks were collected in the same manner.
Where the layer of snow allowed it, two snow samples were collected on the firing pad area. The snow was collected using a shovel in a delimited 1-m2 area. A thin layer (approximately 1.5 cm) of snow and particles was col-lected and the snow was shoveled in empty clean traps (Fig. 4-15). The snow was collected in two areas that were representative of the –5- and –20-m sampling area. The snow was melted at room temperature and the resulting water phase was evaporated under a hood for 72 hours.

ERDC TR-08-1 4-21
Figure 4-15. Snow sample collection, –20-m area.
Extraction and Analysis
The glass jars were opened under a hood for 72 hours to allow the evapora-tion of the ethanol. Pictures of representative particles were taken, and the particles were added back to the jars containing the absorbent papers. A known volume of ACN was added to cover the adsorbent papers and allow a freestanding solution. The volume of ACN used for the extraction of each sample is reported in Table 4-2. The bottles were placed on a wrist-action shaker table for one hour and then transferred to an ultrasonic bath for 18 hours. Finally, a quantity of the final solution (between 700 and 800) was transferred with an Eppendorf pipet into a 3-mL Luer-Lok syringe fitted with a 0.45-μm filter. The resulting solution was filtered into a 2-mL am-ber vial. Samples were analyzed using Reverse-Phase High-Performance Liquid Chromatography (RP-HPLC). The HPLC was equipped with an ultraviolet diode array detector monitoring at 210, 220, and 254 nm. The column used was a Supelcosil LC-8 column 25 cm × 3 mm × 5 μm eluted with 15:85 isopropanol/water (v/v) at a flow rate of 0.75 mL/min, with an injection of 20 μL. The concentrations measured by HPLC allowed the
ERDC TR-08-1 4-22
determination of how much NG was deposited. This gave a concentration deposited in a given area, which was calculated depending on the number of traps that were combined to build each sample.
Tests were conducted prior to the trial to verify that the paper towel did not interfere in the extraction process by irreversibly absorbing NG. Paper towel was wetted, spiked, and extracted successfully without losing any NG, in five replicates at two concentrations.
A few samples were pre-concentrated using a Zymark pre-concentrator, while others were diluted prior to injection to obtain results within the calibration curve. The two main types of particles were analyzed using a BioRad FTS-3000 Excalibur Series FTIR, using a Varian UMA 600 FTIR microscope with 15X objective, and the slides were deposited on an ATR W/Ge crystal. Spectra were recorded between 4000 and 400 cm–1.

ERDC TR-08-1 4-23
Results and Discussion
Test Setup
The test setup that we used was appropriate to collect propellant residues. Only three traps were lost due to the rearward blast, the center traps at –5 m and –7.5 m. No traps were lost or even moved in front of the FP. The total area that was covered by our sampling pattern was 1300 m2, which seemed appropriate, based on the absence of visible particles on the snow surface outside of the boundary of the area sampled. However, because of the time constraints, a limited number of traps were used and they were also combined by rows, leading to higher uncertainty in the corresponding results.
Particle Size, Distribution, and Type
The particle size, distribution, and type varied greatly with distance and location (forward or rearward of FP). Rearward of the firing line, the parti-cle size varied from fine dust near the FP to large particles, up to 2-mm size 40 m away. The distribution was quite homogeneous near the FP, while highly heterogeneous farther away. Figure 4-16 illustrates this phe-nomenon. The fine particles suffer air resistance (drag) and fall rapidly on the soil surface, while larger particles have more inertia and less friction surface and therefore fly longer paths and are projected at greater dis-tances. The traps were successful at catching a representative number of particles, as determined when we compared the content of the traps with the particles dispersed on the snow surface around them.
In front of the firing line, particles were observed only in the first row (+5 m), and they were thin and of a glassy appearance (Fig. 4-17). Pictures of all particles collected were taken prior to grinding to illustrate the varia-tion in size and type with distances. These are illustrated in Figures 4-17 to 4-21. Particles rearward consisted, for the first 10 m, of particles smaller than 1 mm with a mix of thin and glassy appearance and chunks of pale yellow particles. At –15 m, particles collected at both FP had the same distribution, quantity, and appearance, with a mixture of solid pale yellow particles up to 1.5-mm length and thin glassy ones.

ERDC TR-08-1 4-24
Figure 4-16. View looking rearward from FP #1 after completion of firing.
At –20 m, the three center traps caught larger particles varying from 0.2- to 1-cm diameter, and larger glassy particles as well. The external traps caught approximately the same amount of particles, indicating that the plume at –20 m is at least 20 m wide. At –30 m and –40 m, no thin glassy particles were caught, while larger ones up to 1.3 cm long were caught. Most of the particles were caught in the center traps. No visible particles were projected outside of the boundary of our setup.
Figure 4-17. Particles collected at +5 and –5 m.
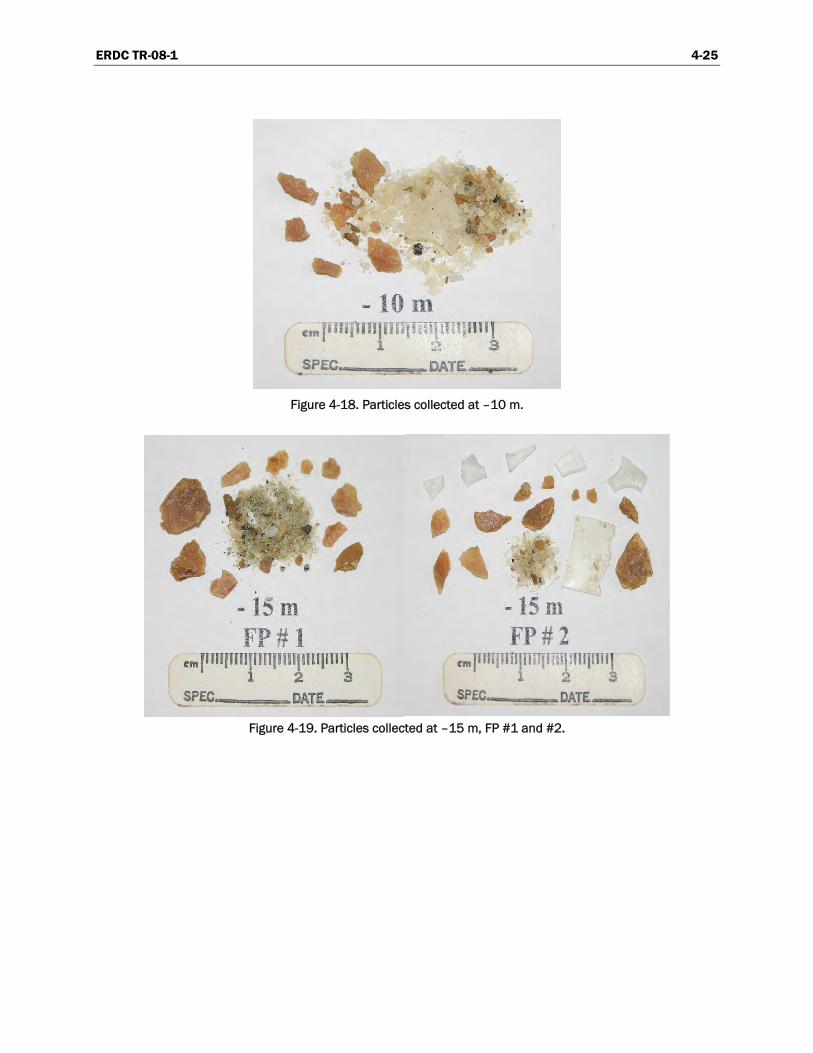
ERDC TR-08-1 4-25
Figure 4-18. Particles collected at –10 m.
Figure 4-19. Particles collected at –15 m, FP #1 and #2.
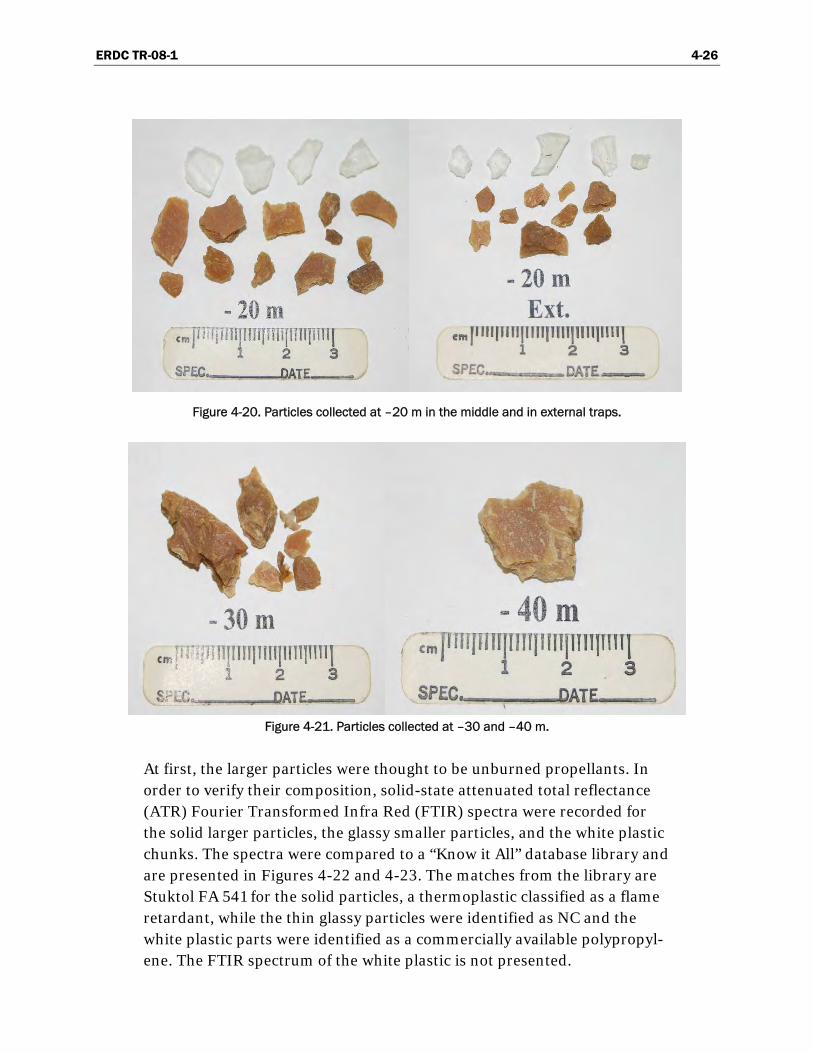
ERDC TR-08-1 4-26
Figure 4-20. Particles collected at –20 m in the middle and in external traps.
Figure 4-21. Particles collected at –30 and –40 m.
At first, the larger particles were thought to be unburned propellants. In order to verify their composition, solid-state attenuated total reflectance (ATR) Fourier Transformed Infra Red (FTIR) spectra were recorded for the solid larger particles, the glassy smaller particles, and the white plastic chunks. The spectra were compared to a “Know it All” database library and are presented in Figures 4-22 and 4-23. The matches from the library are Stuktol FA 541 for the solid particles, a thermoplastic classified as a flame retardant, while the thin glassy particles were identified as NC and the white plastic parts were identified as a commercially available polypropyl-ene. The FTIR spectrum of the white plastic is not presented.

ERDC TR-08-1 4-27
Figure 4-22. ATR FTIR and related match from a database for the larger particles.
Figure 4-23. ATR FTIR and related match for the thin glassy particles.

ERDC TR-08-1 4-28
The ATR spectra proved that the larger particles were not composed of un-reacted propellant, but rather the thermoplastic layer located at the rear end of the 84-mm (see Fig. 4-8), which is designed to break into pieces when the propellant ignites. The large particles of breakable thermoplastic are projected farther than the fine unreacted propellant. However, it is highly plausible that the larger thermoplastic pieces are contaminated by propellant on their surface, and that by being projected far back they con-tribute to the spreading of the propellant residues.
Estimate of the Mass of Nitroglycerin Deposited
Results are presented in Table 4-2. Some samples were concentrated using a Zymark pre-concentrator and the final volumes are reported. Other sam-ples were not concentrated and had to be diluted in order to obtain a result that was in the region of linearity of the calibration curve.
The total amount of NG dispersed is approximated to be 780 g. Thirty-nine rounds were fired; each round contained 370 g of propellant, com-posed of 37.5% NG, leading to 5,411 g of NG fired. So, 780 g of NG or 14% w/w of NG was deposited on the surface soil, or else 20 g of NG per round, as unreacted residue. If we examine the results in term of what was depos-ited in front versus behind, 15.38 g was projected in front while 765.7 g was projected behind, meaning that 98% of the residue is projected behind the FP. Of the material that is projected rearwards, 96% is located in the first 15 m.
Results obtained for the farthest samples collected ( +30 m to +50 m and –30 m to –50 m) are considered not significant, since the area sampled versus the global area is too small, and also since the results are smaller than the estimated errors on the data, which is at least an order of magni-tude higher than the results themselves. Visually, it was obvious that most of the residues were ejected behind and in the first 10–15 meters. The fact that we still detected NG at farthest distances might be explained by the projection of pieces of the thermoplastic rear end of the weapon, and these might be contaminated by traces of propellants.

ERDC TR-08-1 4-29
Table 4-2. Analytical results: Mass of NG deposited.
sampleVolume of ACN
mlResultmg/L
NG in traps mg
Numberof traps
Surface m2
Total area m2
Total NG mg
NG/roundg
+ 50 m 6.6 5.56 0.07 1 0.173 100 40 negligeable + 40 m 6.3 1.75 0.02 3 0.519 100 4 negligeable + 40 m ext 4.4 3.97 0.03 2 0.346 100 9 negligeable + 30 m 6.9 4.54 0.06 3 0.519 100 12 negligeable + 20 m 13.8 362.87 10.00 3 0.519 50 963 negligeable + 20 m ext 5.5 64.34 0.70 2 0.346 50 101 negligeable + 15 m 5.2 124.43 1.30 3 0.519 50 125 negligeable + 10 m 12.2 310.98 7.60 3 0.519 50 732 0.02 + 5 m 453 153.45 139.00 3 0.519 50 13391 0.34total NG in front 15378 0.39 - 2.5 m 61.5 701.53 86.30 2 0.346 25 6236 0.16 - 5 m 500 356.25 3562.30 2 0.346 25 257392 6.60 - 7.5 m 500 494.96 4949.60 2 0.346 25 357630 9.17 - 10 m 500 188.06 1880.80 3 0.519 25 90597 2.32 - 15 m 500 108.19 360.60 3 0.519 50 34740 0.89 - 20 m 151.7 277.66 84.20 3 0.519 50 8112 0.21 - 20 m ext 60.2 401.02 48.30 2 0.346 50 6980 0.18 - 30 m 10.2 20.33 0.40 3 0.519 100 77 negligeable - 40 m 10.4 16.85 0.30 3 0.519 100 58 negligeable - 40 m ext 10.5 5.95 0.10 2 0.346 100 29 negligeable - 50 m 6.6 507.44 6.70 1 0.173 100 3873 0.10Total NG behind 765723 19.63Total NG 781100 20.03 - 15 m FP # 2 500 146.04 481.2 3 0.519 50 46358 1.22Blank 1 0 1 0.173 0.173Blank 2 0 1 0.173 0.173Snow 1 1808 345.51 24987 1 1 50 1249350Snow 2 2246 334.55 30056 1 1 50 1502800
snow samples: diluted by a factor of 40
samples -15m : diluted by a factor of 6.66samples -10, -7.5 and -5 m: diluted by a factor of 20
FP# 1: 39 rounds, FP# 2: 38 rounds
We have only one field replicate in this trial at –15 m, and results are high-lighted in yellow in Table 4-2. If we consider that 39 rounds were fired at FP #1 and 38 rounds were fired at FP #2, it means that we measured a deposition of 0.89 g of NG per round in one case and 1.22 g of NG in the other. These are within 15% of their average value and represent an indica-tion that our trap system was effective at this distance.
The results on the external traps (+20, +40, and –40 m ext) demonstrate that most of the particles are projected mostly within the three-trap center area (10 m wide), with the exception of the –20-m row where the pattern of dispersion is larger than 10 m. Our template did not take into account the “cone-like” projection area rearwards of the FP, and future templates

ERDC TR-08-1 4-30
should take that into account. In our trial, time was of the essence since the military personnel had to perform mortar training one hour after the completion of the 84-mm firing. The sampling team combined the extracts by rows to clear the range on time, so no information was obtained on the dispersion of the residues, with the exception of rows located at 20-m and 40-m distances.
Results obtained for the two snow samples proved that the snow had been contaminated from past firing exercises, because if we did integrate the results obtained over the projected area behind the FP, there would have been more NG spread in the environment than what was actually fired. This demonstrates again the high deposition rate of this weapon and the accumulation of high concentration of propellant residues behind the FP. The snow behind the FP was not pristine snow, as past firing exercises were conducted and the snowplowing conducted there has clearly not removed residues from past exercises.
We also learned another interesting fact while performing this trial. The military personnel explained that antitank ranges are also frequently used to fire mortars, and when doing so, they fire a few meters in front of the antitank FP. This partly explains the high levels of propellant residues that were encountered in front of the FP in antitank ranges.

ERDC TR-08-1 4-31
Recommendations and Conclusion
The goal of this study was to characterize live-firing residues that were generated by the firing of 84-mm Carl Gustav antitank weapons. Our re-sults demonstrate that the combustion of the propellant charge is highly inefficient, with 14% w/w of NG being deposited as unreacted propellant residue. Testing in live-fire exercises always presents a challenge. In our case, time was a limiting factor and the main weakness of our trial was the relatively limited area that was sampled using small particle traps because of the short timeframe in which it was conducted. This represents a high approximation when integrating the results for large areas with such small decision units. In our case, the use of snow as the receptacle for particles was not possible, and the time constraints allowed the use of only a limited number of traps that were combined by rows. These results should then be considered as preliminary, but they still clearly demonstrate that this weapon is propelled by a highly inefficient system. In the Carl-Gustav in-struction manual, instructions are given to visually inspect the venturi chamber to remove any unburned propellant between rounds, so it is an accepted fact that the propellant is inefficiently burned.
From studies conducted thus far in Canada and the United States, the 84-mm rocket’s propulsion is the least efficient propellant burning process measured. The same calculations were made for 60-mm, 81-mm, and 120-mm mortars and conducted to the respective dispersion of 0.65, 3.3, and 1.4% w/w of the original NG mass [12, 20]. Artillery 105- and 155-mm howitzer firings led respectively to 0.2 to 0.5% and 5 × 10 -4 w/w of 2,4 DNT as a residue [10,21].
It is recommended to repeat the experiment to confirm our results, which are considered preliminary.
The level of NG deposited is estimated to be 14% w/w for 84-mm rockets, but it still might be underestimated based on the results of the external traps and on the snow samples. The fact that very high levels of residues were collected in the snow samples indicates that past firings contami-nated the area. If time had allowed, background samples should have been collected in the snow behind the firing point and would have allowed the determination of the background level of contamination prior to firing.
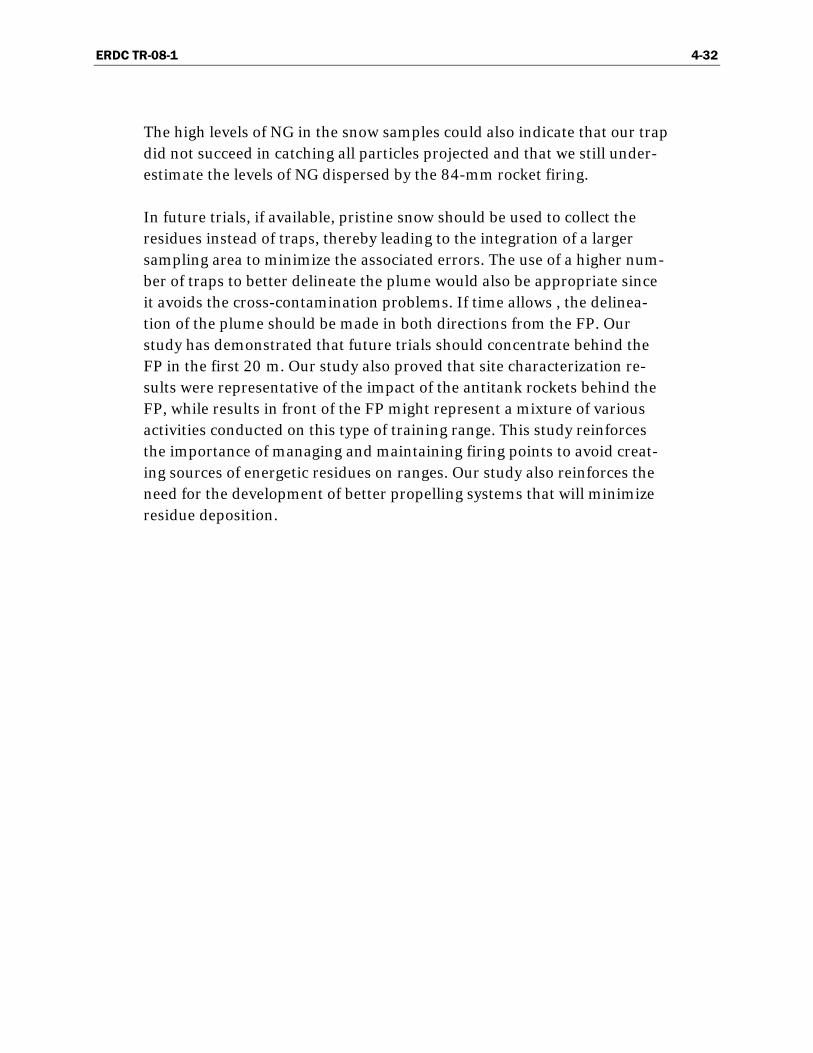
ERDC TR-08-1 4-32
The high levels of NG in the snow samples could also indicate that our trap did not succeed in catching all particles projected and that we still under-estimate the levels of NG dispersed by the 84-mm rocket firing.
In future trials, if available, pristine snow should be used to collect the residues instead of traps, thereby leading to the integration of a larger sampling area to minimize the associated errors. The use of a higher num-ber of traps to better delineate the plume would also be appropriate since it avoids the cross-contamination problems. If time allows , the delinea-tion of the plume should be made in both directions from the FP. Our study has demonstrated that future trials should concentrate behind the FP in the first 20 m. Our study also proved that site characterization re-sults were representative of the impact of the antitank rockets behind the FP, while results in front of the FP might represent a mixture of various activities conducted on this type of training range. This study reinforces the importance of managing and maintaining firing points to avoid creat-ing sources of energetic residues on ranges. Our study also reinforces the need for the development of better propelling systems that will minimize residue deposition.

ERDC TR-08-1 4-33
Acknowledgements
Lieutenant Colonel Lalonde, school’s commander, Lieutenant Frédérique Lépine, and W.O. Dominic April from PP1 Infantry 06/07 course are greatly acknowledged for allowing our participation in the live-fire exer-cise and sampling of the propellant emissions. We also thank Mr. Firmin Boucher, who provided us with forty-two 84-mm Carl Gustav weapons, which improved the firing exercise and our sampling trial. Éric Bergeron from the emerging concepts and modeling group is also acknowledged for the FTIR spectroscopy. Thrust Sustain, WBE 12sg02, and the Strategic Environmental R&D Program (SERDP) are greatly acknowledged for their financial support.
ERDC TR-08-1 4-34
References
1. Thiboutot, S., G. Ampleman, A. Marois, A. Gagnon, M. Bouchard, A. Hewitt, T. Jenkins, M. Walsh, K. Bjella, C. Ramsey, and T.A. Ranney (2004) Environmental Conditions of Surface Soils, CFB Gagetown Training Area: Delineation of the Presence of Munitions Related Residues (Phase III, Final Report), DRDC Valcartier TR 2004-205, Unclassified.
2. Pennington, J.C., T.F. Jenkins, G. Ampleman, S. Thiboutot, A.D. Hewitt, S. Brochu, J. Robb, E. Diaz, J. Lewis, H. Colby, R. Martel, K. Poe, K. Groff, K.L. Bjella, C.A. Ramsey, C.A. Hayes, S. Yost, A. Marois, A. Gagnon, B. Silverblatt, T. Crutcher, K. Harriz, K. Heisen, S.R. Bigl, T.E. Berry, Jr., J. Muzzin, D.J. Lambert, M.J. Bishop, B. Rice, M. Wojtas, M.E. Walsh, M.R. Walsh, and S. Taylor (2006) Distribution and Fate of Energetics on DoD Test and Training Ranges: Interim Report 6, ERDC TR-06-12.
3. Jenkins, T.F., A.D. Hewitt, C.L. Grant, S. Thiboutot, G. Ampleman, M.E. Walsh, T.A. Ranney, C.A. Ramsey, A.J. Palazzo, and J.C. Pennington (2006) Identity and Distribution of Residues of Energetic Compounds at Army Live-Fire Training Ranges. Chemosphere, 63, 1280–1290.
4. Jenkins, T.F., J.C. Pennington, T.A. Ranney, T.E. Berry, P.H. Miyares, M.E. Walsh, A.D. Hewitt, N. Perron, L.V. Parker, C.A. Hayes, and E. Wahlgren (2001) Characterization of explosives contamination at military firing ranges. US Army Cold Regions Research and Engineering Laboratory, ERDC TR-01-5.
5. Pennington, J.C., T.F. Jenkins, S. Thiboutot, G. Ampleman, J. Clausen, A.D. Hewitt, J. Lewis, M.R. Walsh, T.A. Ranney, B. Silverblatt, A. Marois, A. Gagnon, P. Brousseau, J.E. Zufelt, K. Poe, M. Bouchard, R. Martel, J. Lewis, D.D. Walker, C.A. Ramsey, C.A. Hayes, S. Yost, K.L. Bjella, L. Trépanier, T.E. Berry, D.J. Lambert, P. Dubé, and N.M. Perron (2002) Distribution and Fate of Energetics on DoD Test and Training Ranges: Report 5, ERDC TR-05-02, US Army Engineer Research and Development Centre, Environmental Laboratory, Vicksburg, Mississippi.
6. Marois, A.,A. Gagnon, S. Thiboutot, G. Ampleman, et M. Bouchard, M. (2004) Caractérisation des sols de surface et de la biomasse dans les secteurs d’entraînement, base des Forces canadiennes, Valcartier, RDDC Valcartier TR 2004-206, Non classifié.
7. Thiboutot, S., G. Ampleman, A. Gagnon, A. Marois, T.F. Jenkins, M.E. Walsh, P.G. Thorne, T.A. Ranney (1998) Characterization of Anti-tank Firing Ranges at CFB Valcartier, WATC Wainwright and CFAD Dundurn, DREV-R-9809, Unclassified.
8. Jenkins, T.F., T.A. Ranney, A.D. Hewitt, M.E. Walsh, and K.L. Bjella (2004) Representative Sampling for Energetic Compounds at an Antitank Firing Range, ERDC/CRREL TR-04-7.
9. Dubois, C., C. Salt, S. Thiboutot, P. Dubé, G. Nadeau, C. Greer, and J. Godbout (2001) A First Field-Scale Bioremediation of Octahydro-1,3,5,7-tetranitro-1,3,5,7-tetrazocine (HMX) Contaminated Soils at CFB Valcartier, DREV-TR- 2001-008.

ERDC TR-08-1 4-35
10. Dubé, P., S. Thiboutot, G. Ampleman, A. Marois, and M. Bouchard (2005) Preliminary Assessment of the Dispersion of Propellant Residues from the Static Live Firing of 105-mm Howitzer, DRDC Valcartier TM 2005-284.
11. Jenkins, T.F., T.A. Ranney, A.D. Hewitt, M.E. Walsh, J.A. Stark, and J.C. Pennington (2001) Use of Snow-Covered Ranges to Determine the Amount of Explosives Residues Deposited From High-Order Detonations of Army Munitions, GSA Annual Meeting symposium proceedings, 5 November 2001, session 48, paper 48-0.
12. Walsh, M.R., M.E. Walsh, C.A. Ramsey, R.J. Rachow, J.E. Zufelt, C.M. Collins, A.B. Gelvin, N.M. Perron, and S.P. Saari (2006) Energetic Residues Deposition from 60-mm and 81-mm Mortars, ERDC/CRREL TR-06-10.
13. Walsh, M.R., M.E. Walsh, G. Ampleman, S. Thiboutot, and D.D. Walker (2006) Comparison of explosives residues from the blow-in-place detonation of 155-mm high-explosive projectiles, ERDC/CRREL TR-06-13.
14. Walsh, M.R., M.E. Walsh, C.A. Ramsey, and T.F. Jenkins (2005) An Examination of Protocols for the Collection of Munitions-Derived Explosives Residues on Snow-Covered Ice, ERDC/CRREL Technical Report 05-8.
15. Hewitt, A.D., T.F. Jenkins, T.A. Ranney, M.E. Walsh, S. Taylor, M.R. Walsh, D.J. Lambert, N.M. Perron, N.H. Collins, and R. Karn (2003) Estimates for Explosives Residue from the Detonation of Army Munitions, EDRC/CRREL TR-03-16.
16. Thiboutot, S., G. Ampleman, M.C. Lapointe, S. Brochu, M. Brassard, M. Stowe, R. Farinaccio, A. Gagnon, and A. Marois (2001) Dispersion of Ammonium Perchlorate Following the Firing of Mk58 Rocket Motors, Chapter 7, SERDP Annual Report, Characterization and Fate of Gun and Rocket Propellant Residues on Testing and Training Ranges, ERDC/CRREL TR 07-01.
17. Carl Gustav-Short Range Anti-Armour Weapon (Medium), Canadian Infantry School, Volume 9, Publication # B-GL-835-009/PT-001, September 1995.
18. Ammunition and Explosive Technical Information, 84 millimeter Gun Ammunition, Canadian Forces Technical Order, Information note # C-74-315-EAO/TA-000, November 1988.
19. Ammunition and Explosive Technical Information, Cartriges 7.62 tracer FFV 553 for use with gun, 84-mm, Infantry anti-armour weapon, Canadian Forces Technical Order, Information note # C-74-305-NAA/TA-000, February 1994.
20. Walsh, M.R., M.E. Walsh, C.M. Collins, S.P. Saari, J. Zufelt, A.B. Gelvin, and J.W. Hug (2005) Energetic Residues from Live-Fire Detonations of 120-mm Mortar Rounds, EDRC/CRREL TR-05-15.
21. Walsh, M.R., S. Taylor, M.E. Walsh, S. Bigl, K. Bjella, T. Douglas, A. Gelvin, D. Lambert, N. Perron, and S. Saari (2005) Residues from Live Fire Detonations of 155-mm Howitzer Rounds, EDRC/CRREL TR-05-14.

ERDC TR-08-1 4-36
Nomenclature
ACN Acetonitrile
ATR Attenuated Total Reflectance
DND Department of National Defence
DNT Dinitrotoluene
DRDC Defence Research and Development Canada
EPA Environmental Protection Agency
FP Firing Position
FTIR Fourier Transform Infrared spectroscopy
GPS Global Positioning System
HE High Explosive
HMX Cyclotetramethylene Tetranitramine, or high-melting explosive
NC Nitrocellulose
nd Not Detected
NG Nitroglycerin
RP-HPLC Reverse-Phase High -Performance Liquid Chromatography
SERDP Strategic Environmental R&D Program
TP RAP Target Practice Rocket Assisted Projectiles
UTM Universal Transverse Mercator Grip
UV Ultraviolet

ERDC TR-08-1 5-1
— Chapter 5 —
Assessment of Gaseous and Particulate Propellant Residues
Resulting from Small Arms Live Firing
DOMINIC FAUCHER, SYLVIE BROCHU, ISABELLE POULIN, AND MICHAEL R. WALSH
Abstract
A large number of small arms ranges have been characterized in Canada and the United States (Chapter 8, this report) to assess propellant residue accumulation in near-surface soils at firing point areas. However, from range characterization data, the evaluation of the extent of contamination associated with the use of a specific ammunition/weapon system is impos-sible. Indeed, none of these ranges is used for a single munition, and infor-mation on the historic use of a range is limited and sometimes inaccurate. Moreover, the soil of these ranges is often contaminated from unknown past activities. Not only is there a lack of information on the buildup of propellant residues on the ground, but also there is little information on the gaseous emissions resulting from the live fire of the weapons. How-ever, there is a need to better understand the gun propellant combustion and the parameters having an influence on the propellant efficiency. This information is critical to help us properly advise the US and Canadian Forces to sustain military training, and to help design alternative gun pro-pellant formulation with better combustion properties than current ones.
A study was thus undertaken to estimate the amount of unburned ener-getic residues deposited per round fired for 15 different caliber/weapon systems involving 9 mm, 7.62 mm, 5.56 mm, .50 cal, and .338 cal; many of them were done in duplicate and one was done in triplicate. For all trials,

ERDC TR-08-1 5-2
samples were collected in aluminum plates strategically located on the ground in front of the gun. To identify the most common air contaminants and their concentrations, air samples were also collected for the three most commonly used systems using pumps and enclosure bags to optimize sampling. All samples were analyzed for nitroglycerin and 2,4-dinitro-toluene. Also, gas samples were analyzed for polycyclic aromatic hydro-carbons, total cyanides, the BTEX suite, aldehydes, and nitric acid.
The percentage of unburned nitroglycerin (NG) per round was found to vary between 0.001% and 3.90%, and up to 2.03 mg NG per round was deposited, depending on the caliber/weapon used. This makes the burning efficiency of most small arms better than mortars, but worse than some artillery rounds. Although the amount of dispersed NG per round seems low, the large amount of small caliber ammunition fired in military train-ing as compared to medium and large caliber ammunition can lead to rapid accumulation on the surface of the soil. Moreover, the small arms residues accumulate in a much smaller area than those of mortars and artillery, leading to a higher concentration buildup. The results show that accumulation of NG in the environment is cumulative over years, and probably decades.

ERDC TR-08-1 5-3
Introduction
Small arms training is a huge portion of military activities, since all service personnel must be qualified in the handling of a personal weapon. In Can-ada, millions of small caliber rounds are fired annually to maintain the troops in a high state of preparedness; this training has been increasing in the past years due to the numerous military operations abroad. In this context, small arms training ranges are being used extensively, which con-tributes to the escalation of residues accumulation on site.
Over the past years, Defence Research and Development Canada - Valcar-tier (DRDC Valcartier) has been working on the characterization of con-tamination on various types of outdoor ranges. Specifically, sampling at strategic positions on the ranges was performed at the firing positions and the target area. It is well known that heavy metals such as lead, copper, and antimony accumulate at the stop butts in concentrations high enough to impact the soil, biomass, surface water, or even groundwater (ITRC 2003 and 2005). Jenkins et al. (Chapter 8, this report) have also shown that residues coming from the incomplete combustion of gun propellant accumulate as solid particulates in front of the firing positions of small arms ranges. Major constituents of concern are 2,4-dinitrotoluene (2,4-DNT) and nitroglycerin (NG), which are part of single- and double-base propellant, respectively.
The combustion efficiency is thought to be influenced by the type of cali-ber, propellant, and weapon used, as well as weather conditions. However, since small arms ranges are usually employed for multiple weapons, little information can be extracted about the contamination related to a specific round. The purpose of this research project was thus to better define the amount and distribution of residues emitted per types of rounds and weapons, in order to have a better understanding of the parameters con-trolling the combustion of gun propellant in small arms. This study is complementary to the project of Walsh et al. (Chapter 3, this report; 2007) where per-round estimates were obtained in winter conditions.
The firing of a weapon produces an aerial plume composed of various gases and particles that will eventually be dispersed by the wind or settle on the ground. Walsh et al. (Chapter 3, this report; 2007) were able to es-

ERDC TR-08-1 5-4
timate the mass of unreacted energetics deposited on the ground during the firing. However, little is known about the composition of the aerial plume that can stay in suspension several minutes around the shooter. Previous work was conducted in the United States by the US Army Envi-ronmental Center to develop emission factors based on firing point emis-sions for various types of range operation, such as weapons firing, smoke and pyrotechnic devices, and high-explosive munitions. The work, con-ducted with the Environmental Protection Agency (EPA), used different munitions test facilities, such as test chambers, blast spheres, and bang-boxes at the Aberdeen Test Center, Maryland, to sample and analyze emit-ted products. The results of these tests led to the calculation of emission factors that were published in the USEPA Compilation of Air Pollutant Emission Factors (AP-42) (Bach 2006). An emission factor is a represen-tative value that attempts to relate the quantity of a pollutant released to the atmosphere with an activity associated with the release of that pollut-ant. These factors are usually expressed as the weight of pollutant divided by a unit weight, volume, distance, or duration of the activity emitting the pollutant (e.g., kilograms of particulate emitted per megagram of coal burned). Most specifically, the particulate matters were not thoroughly studied, and this work is intended to fill this gap.
The objective of this study is thus to assess the nature of those compounds, both gaseous species and solid particles, and to determine the size distri-bution of the latter, emitted in the vicinity of the gun during the live firing of small arms. A series of experiments was thus designed to characterize the behaviour of various types of small caliber ammunition and the distri-bution of gun propellant residues on a range using the most common weapons under realistic training conditions. The outdoor trial occurred from 18 to 25 April 2007, on a site adjacent to DRDC Valcartier, operated by the Munitions Experimental Test Center (METC). The calibers tested were 9 mm, 7.62 mm, 5.56 mm, .338, and .50 cal. For each caliber, up to three different weapons were used to evaluate the effect of the length of the barrel on the propellant combustion. Solid particles that settle on the ground and air samples were collected and analyzed. The present report contains information about the equipment used, sampling methodology, laboratory work, results, discussion, and recommendations. The study of these results will then lead to a better understanding of the burning mechanisms for a specific propellant under various conditions. This will help decision-makers in developing improved management tools for out-door military training ranges.
ERDC TR-08-1 5-5
Experimental Setup
This section presents the different equipment that was used for the tests. It covers the weapons and ammunition used for the tests, and a description of the test site and the sampling equipment used. The detailed sampling strategy will be discussed in the next section, Sampling Methodology.
Selection of Calibers and Weapons
As previously mentioned, the purpose of the trial was to replicate military training under the most realistic conditions. Although the use of enclosure bags on weapons is not representative of real training, it was very useful to optimize the collection of airborne particles and gases emitted in the im-mediate vicinity of the weapon. It is, however, not representative of the soldiers’ exposure, since the sample collection was not made in the breath-ing zone. A set of small-caliber weapons was selected to represent the most extensive scale of weapons used in day-to-day training by infantry units of Canada and the United States. The following ammunition calibers were chosen because of their intensive use in training: 9 mm, 7.62 mm, 5.56 mm, .50 cal (less frequent), and .338 cal. The following paragraphs give more details about each of these calibers. A brief description of each ammunition/weapon system is given in Table 5-1, and a more thorough description of the ammunition tested, including the measured amount of NG and 2,4-DNT in each propellant and the number of rounds used for each trial, is reported in Table 5-3.
9 mm
The 9-mm rounds are usually fired on small shooting ranges, usually around 25-m distance to the target. Currently, there are two types of 9-mm rounds used in Canada, each fired with a different weapon: MK1 is designed to be fired from a Browning pistol, whereas Luger 115 FMJ is fired from a Sig Sauer pistol. The Browning pistol, with its overall length of 197 mm and its barrel length of 123.8 mm, is slightly larger than the Sig Sauer, which has an overall length of 180 mm and a barrel length of 97.8 mm (Table 5-1). Both types of rounds usually contain the same composi-tion and quantity of double-base propellant (Table 5-3), but the Luger con-tains a lead-free primer.

ERDC TR-08-1 5-6
Table 5-1. Description of ammunitions and weapons used for each trial.
Ammunition Weapon
Caliber Type Type
Weapon length (mm)
Barrel length (mm)
Muzzle velocity (m/s)
9 mm
MK1 Ball Luger 115 FMJ
Frangible Browning pistol Sig Sauer pistol
197 180
123.8 97.8
365
Link 4-Ball (C21)- 1-tracer (C19)
7.62 mm C24 Blank link C6 Machine gun 1231 679 838
C77 Ball clip
Link 4-Ball (C77)- 1 tracer (C78)
C79A1 Blank link
5.56 mm Frangible
C7 Automatic rifle C8 Automatic carbine C9 Light machine gun
1006
1038
530 400 530
926 926 926
Link 4-ball (M2)- 1-tracer (M17)
Browning heavy machine gun 1140 na 893
.50 cal AAA750 Hodgdon H50BMG 225 gr McMillan rifle 1450 737 818
0.338 cal Lapua Magnum Timberwolf na 690 na
na: Not available
Table 5-2. Priming compositions used in the 9-mm MK1 ball cartridges. Composition
Ingredient Type B
(% dry weight) Type C
(% dry weight)
Lead styphnate 40 37
Tetracene 5 4
Barium nitrate 30 32
Antimony sulphide 9 15
Lead dioxide 9 0
PETN 7 5
Aluminium powder 0 7
Gum solution 0 As required
The MK1 bullet is made of a 98/2 lead/antimony core covered with a copper/zinc jacket. The primer consists of a brass cup containing ap-proximately 0.017 g of priming composition. Two different priming com-positions can be used in the MK1, as shown in Table 5-2. It was impossible
ERDC TR-08-1 5-7
to retrieve the specific composition of the primer used for this experiment. However, one can see that lead styphnate is present at approximately 40% in the two compositions. Also, in the primer, after pressing the charge and coating it with varnish, a lead foil disc is placed over the composition, fol-lowed by a brass anvil having two flash holes.
7.62 mm
In normal training conditions, the 7.62-mm caliber is fired at distances up to 400 m from the target. This type of round used to be the routine service ammunition for all personnel in the Canadian Forces; it was replaced by the 5.56-mm about 20 years ago. At this time, weapons firing this ammu-nition included rifles and carbines with longer barrels than today’s more versatile 5.56 mm. This ammunition is still part of training for some field units using the machine gun, but is less frequently used than the 5.56 mm. For the purpose of this study, rounds were fired using the machine gun C6 having a barrel length of 679 mm (Table 5-1).
For our experiments, only two types of rounds were tested: the C21 ball and the C24 blank. These types of rounds come in belts of 220 rounds, designed to feed the C6 machine gun. The belt contains sequences of four balls (C21) and one tracer (C19), all containing double-base propellant. The tracer round contains a slightly different amount of propellant, usu-ally less than the normal round (Table 5-3).
The C21 ball is composed of four parts: cartridge case, bullet, propellant, and primer. The bullet is 29.21 mm long and weighs 9.53 g. It consists of a 90/10 lead/antimony core covered with a gilding metal jacket (copper/ zinc). The propellant in the C21 ball weighs 2.75 g and is a colloid of nitro-cellulose, containing diphenylamine as a stabilizer. It is coated with a sur-face moderant and glazed with graphite. The primer consists of a brass cup containing approximately 0.032 g of priming composition. The pressed composition is varnished and a lead foil disc is placed over the composi-tion. Three priming compositions are in use in the 7.62-mm ball car-tridges, as shown in Table 5-4, but the information about the exact composition in the balls used during the trial could not be retrieved.
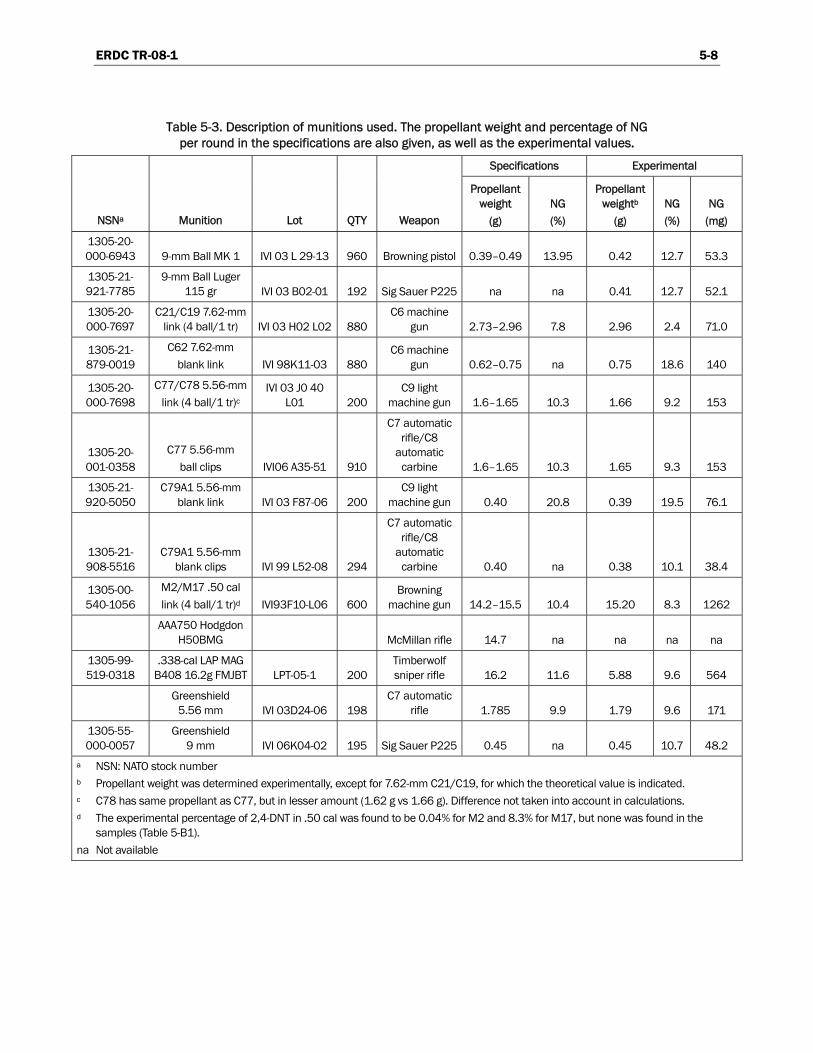
ERDC TR-08-1 5-8
Table 5-3. Description of munitions used. The propellant weight and percentage of NG per round in the specifications are also given, as well as the experimental values.
Specifications Experimental
NSNa Munition Lot QTY Weapon
Propellant weight
(g) NG (%)
Propellant weightb
(g) NG (%)
NG (mg)
1305-20-000-6943 9-mm Ball MK 1 IVI 03 L 29-13 960 Browning pistol 0.39–0.49 13.95 0.42 12.7 53.3
1305-21-921-7785
9-mm Ball Luger 115 gr IVI 03 B02-01 192 Sig Sauer P225 na na 0.41 12.7 52.1
1305-20-000-7697
C21/C19 7.62-mm link (4 ball/1 tr) IVI 03 H02 L02 880
C6 machine gun 2.73–2.96 7.8 2.96 2.4 71.0
1305-21-879-0019
C62 7.62-mm blank link IVI 98K11-03 880
C6 machine gun 0.62–0.75 na 0.75 18.6 140
1305-20-000-7698
C77/C78 5.56-mm link (4 ball/1 tr)c
IVI 03 J0 40 L01 200
C9 light machine gun 1.6–1.65 10.3 1.66 9.2 153
1305-20-001-0358
C77 5.56-mm ball clips IVI06 A35-51 910
C7 automatic rifle/C8
automatic carbine 1.6–1.65 10.3 1.65 9.3 153
1305-21-920-5050
C79A1 5.56-mm blank link IVI 03 F87-06 200
C9 light machine gun 0.40 20.8 0.39 19.5 76.1
1305-21-908-5516
C79A1 5.56-mm blank clips IVI 99 L52-08 294
C7 automatic rifle/C8
automatic carbine 0.40 na 0.38 10.1 38.4
1305-00-540-1056
M2/M17 .50 cal link (4 ball/1 tr)d IVI93F10-L06 600
Browning machine gun 14.2–15.5 10.4 15.20 8.3 1262
AAA750 Hodgdon
H50BMG McMillan rifle 14.7 na na na na
1305-99-519-0318
.338-cal LAP MAG B408 16.2g FMJBT LPT-05-1 200
Timberwolf sniper rifle 16.2 11.6 5.88 9.6 564
Greenshield
5.56 mm IVI 03D24-06 198 C7 automatic
rifle 1.785 9.9 1.79 9.6 171
1305-55-000-0057
Greenshield 9 mm IVI 06K04-02 195 Sig Sauer P225 0.45 na 0.45 10.7 48.2
a NSN: NATO stock number b Propellant weight was determined experimentally, except for 7.62-mm C21/C19, for which the theoretical value is indicated. c C78 has same propellant as C77, but in lesser amount (1.62 g vs 1.66 g). Difference not taken into account in calculations. d The experimental percentage of 2,4-DNT in .50 cal was found to be 0.04% for M2 and 8.3% for M17, but none was found in the
samples (Table 5-B1). na Not available

ERDC TR-08-1 5-9
Table 5-4. Priming compositions used in the 7.62-mm C21 ball cartridges. Composition
Ingredient Type A
(% weight dry) Type B
(% weight dry) Type C
(% weight dry)
Lead styphnate 37 40 37 + 5
Tetracene 3 3 4 + 1
Barium nitrate 38 30 32 + 5
Calcium silicide 13 0 0
Lead dioxide 9 9 0
Antimony sulphide 0 9 15 + 2
PETN 0 7 5 + 1
Aluminium powder 0 0 7 + 1
Gum solution 0 0 As required
5.56 mm
As for the 7.62-mm caliber, the 5.56-mm rounds are usually fired at dis-tances up to 400 m from the target. This caliber is now part of routine ser-vice ammunition in most countries. In Canada, 5.56 mm is used in many types of weapons: C7 automatic rifle (530-mm barrel), C8 automatic car-bine (400-mm barrel), C9 light machine gun (530-mm barrel), and MP5 submachine gun (Table 5-1). The first three types of weapons can be em-ployed by field units, but the C7 automatic rifle is definitely the weapon that is most employed, since every member has to carry it during initial training. The rounds come in two types: C77 standard balls designed to be fired from magazine-fed C7 and C8, and C77 linked cartridges (200 rounds per belt, sequence of four balls (C77) and one tracer (C78) designed to be fired from the belt-fed C9. The same propellant is used for C77 and C78, but in smaller quantity for the tracer (Table 5-3). The MP5 submachine gun is used only by naval boarding parties and some specialized field units, thus it was not covered in the experiment. For the three weapons used in the test, blank firing was also performed. All types of 5.56-mm rounds contain double-base propellant.
The C77 ball cartridge case is made of drawn brass (copper/zinc 70/30). Each cartridge contains approximately 1.65 g of PRB SS109, a double-base propellant made of laminated grains containing diphenylamine as a stabi-lizer. Calcium carbonate, sodium sulphate, and potassium nitrate are added as erosion and flash reducers. The propellant is coated with dibutyl-
ERDC TR-08-1 5-10
phthalate and dinitrotoluene, which act as surface moderants and mois-ture-proofing agents. Graphite is used to glaze the finished propellant.
The C77 ball primer (Boxer type) consists of a non-corrosive brass cup containing approximately 0.022 g of priming composition. After being pressed into the cup, the charge is sealed with varnish and a foil disc before the brass anvil is inserted. If a dry priming composition is used, the charge is sealed with varnish and covered with a lead foil disc before the anvil is inserted. If a wet priming composition is used, the charge is covered with a red foil paper disc, then sealed with varnish and the anvil added. In the latter method, an additional coat of varnish may be applied after anvil assembly.
.50 cal
In the past years, this caliber was designed to be fired from a belt-fed machine gun, but in Canada it has been slowly discarded since no vehicle is now fitted with this weapon. However, every Canadian Forces ship con-tains up to four machine guns on board. Since this weapon has been used in the past by field units and is still used by the Navy, it has been decided to include this caliber in the test. The rounds come in a 200-cartridge belt in four balls (M2) plus one tracer (M17) sequence. The lot employed in the trial contained double-base propellant.
Rounds of .50 cal were also fired with a tactical sniper McMillan rifle. The rounds used with this weapon are not made of the same propellant as those for the machine gun (Table 5-3) and are usually coated with molybdenum to reduce barrel wear.
.338 cal
The .338-cal Timberwolf rifle is a more recent type of weapon designed to be used by snipers in the present battle context and eventually replace the .50-cal McMillan rifle, which is larger. Currently, the .338-cal rifle is em-ployed only by some units, but since it has been recently implemented, it was a good opportunity to test it on a range. The .338-cal Lapua Magnum is the round designed to be fired from the rifle. It contains a double-base propellant (Table 5-3).

ERDC TR-08-1 5-11
Frangible Ammunition: 9 mm and 5.56 mm
Frangible ammunition does not contain lead in the priming composition and bullet and is designed to disintegrate upon impact on hard surfaces. To verify the efficiency of propellant combustion, two different calibers of frangible ammunition (9 mm and 5.56 mm), manufactured under the name Greenshield Simunition, were included in this study. The 9-mm rounds were fired from a Sig Sauer pistol and the 5.56-mm rounds were fired from a C7 rifle. Both types of rounds contain a double-base propel-lant (Table 5-3).
Description of Test Site and Firing Device
One of the major concerns that occur when planning such a trial is the es-tablishment of a danger zone that will cover the different types of weapons used. To significantly reduce this danger zone, the approach was to con-duct all the tests with the weapons firing from a fixed mount equipped with a remote firing device that allows the rounds to exit the barrel in the relatively same trajectory. This setup presents the advantage of promoting a more even distribution of particles. The fixed mount is a heavy steel structure bolted on top of a thick steel plate. The dimensions of the mount are approximately 1 m wide by 1 m high by 70 cm deep. The top of the mount is equipped with an adjustable sliding track on which the weapon is secured for firing. The securing device will change depending on the weapon fired. As mentioned previously, every weapon was fired using a remote firing device, composed of a control box equipped with push-buttons and a compressor to activate the trigger mechanism. The control box runs on a three-second sequential mode, in order to prevent weapon malfunction. This sequential control can be deactivated when firing in fully automatic mode. Figure 5-1 shows a typical setup with a pistol. Every weapon tested was set at about 1 m from the ground.
The test site, a flat area located on the properties of METC, measures about 600 m long by 200 m wide, and is surrounded by a road that is ac-cessible from two points of entry (one at the northern end and one at the southern end). The area is bordered by woods on the south and west ends, and by METC buildings on the north and east ends. The two stop butts are located in the middle of the field and are facing north. They are covered by thick concrete walls; this is shown in Figure 5-2. Only the left-hand butt was used during the trials.
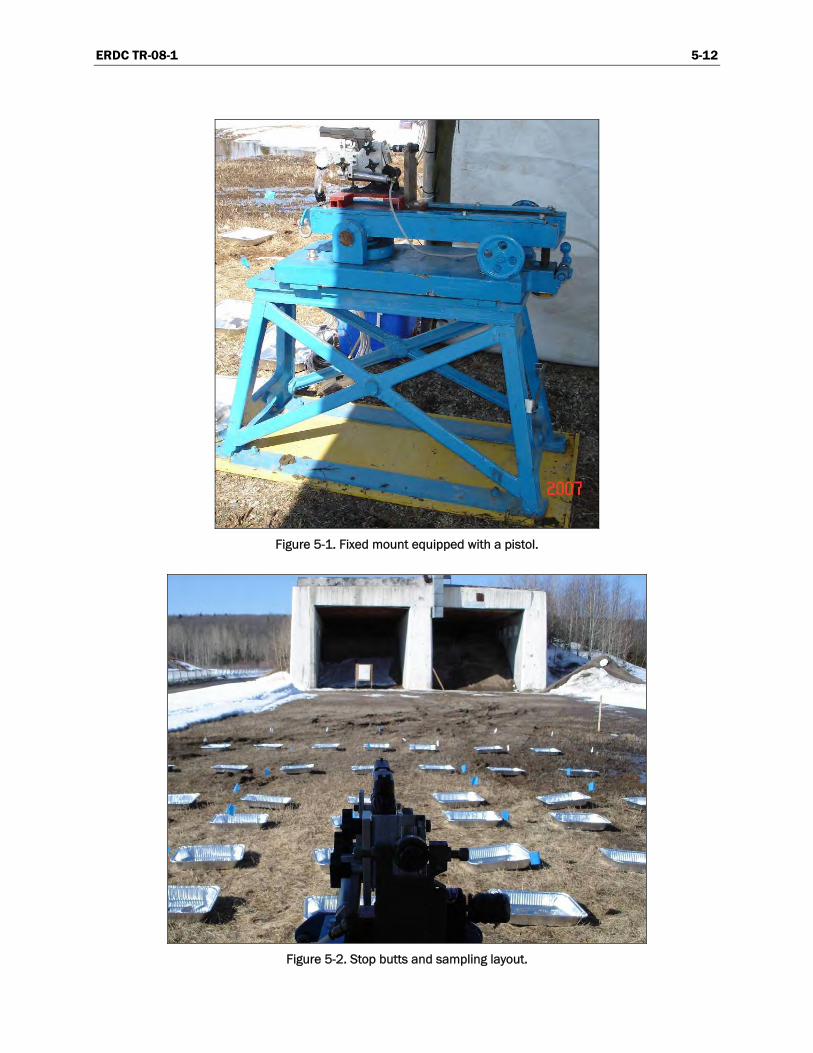
ERDC TR-08-1 5-12
Figure 5-1. Fixed mount equipped with a pistol.
Figure 5-2. Stop butts and sampling layout.

ERDC TR-08-1 5-13
Sampling Methodology
Ground Sampling
Aluminum trays were used to collect particles that settle on the ground after the firing, hereafter called ground samples; no soil sampling was performed. The sampling area was chosen based on the results of Walsh et al. (2007) for similar trials on snow, where the plume could be clearly delineated. Sampling distances in front of a specific weapon were similar or greater than those of Walsh et al. (2007), but sampling width was usu-ally kept constant at 6.45 m. The use of a large number of sampling plates on each line allowed for a precise determination of propellant dispersion away from the weapon’s barrel.
The equipment used was composed of aluminum trays, measuring ap-proximately 45 cm wide by 35 cm long with a 10-cm lip. As shown on Figure 5-2 and Figure 5-3, these containers were placed on parallel lines, perpendicular to the firing direction. The trays were placed so that the trajectory of the round was over the symmetrical center of the setup. Each line contained seven trays placed at every meter, except the first line at 0 m, which contained three containers on a 3-m-wide line. The sampling lines were placed at the following distances from the weapon’s barrel: 0, 1, 2, 3, 4, 5, 7.5, and 10 m. When larger calibers were used, additional lines were installed at 12.5, 15, 20, and 25 m from the weapon. Also, when more winds were present, some containers were added in a column at the left of the sampling area to prevent the loss of particles. Table 5-A1 in Appendix 5-A gives a summary of each test along with the number of samples col-lected. (Note that the sort order in Table 5-A1 and Table 5-B1 is different: results are reported in order of trials in Table 5-A1, while they are grouped by caliber/weapon in Table 5-B1.)

ERDC TR-08-1 5-14
Figure 5-3. Ground sampling layout (not to scale).
Each aluminum container was filled with an arbitrary volume of solvent (ethanol, water, or acetone) large enough to cover all the bottom of the container. The choice of collection solvent is not critical, because its role is only to prevent particles from sticking to the trays and/or be blown away by the wind or the blast of the weapon. The use of a volatile solvent short-ens the evaporation time. To prevent the containers from flipping over

ERDC TR-08-1 5-15
with the wind, small steel weights were placed inside. After a test, the con-tents of all containers from a single line (by distance from the weapon) were placed in a plastic pail. The containers then were carefully washed with acetone and wiped with paper towels that were also placed in the plastic pails. The choice of paper towel is important, because some of them are loaded with small black particles that become suspended in the collec-tion solvent, and that obstruct the filter in the subsequent processing of the sample. For the purpose of this study, Scott-brand paper towel was adequate. Preliminary trials done with paper towel spiked with the com-plete suite of explosive residues from SW846 EPA method 8330b indi-cated that no significant loss of NG and 2,4-DNT was observed during the processing of the sample, from the tray to the HPLC vial. The containers were placed back on the ground ready for the next test.
Air Sampling
Three air sampling trials were done, one with each of the most commonly used calibers (9 mm, 7.62 mm, and 5.56 mm), fired with the Browning pis-tol, the C6 machine gun, and the C7 automatic rifle, respectively. As usual, the 7.62-mm link rounds came in sequence of one tracer (C19) every four balls (C21). Propellants are the same for both rounds, but the total amount in the C19 is lower (Table 5-3). A high number of rounds were fired for each sampling event in order to account for the anticipated low concentra-tion of emitted gases and particles. Details of each trial are given in Table 5-5.
Table 5-5. Weapons and ammunition used for air sampling with the respective duration of sampling and firing.
Weapon Ammunition Number
of rounds
Duration of the
sampling (min)
Duration of the
firing only (min)
Browning pistol 9-mm MK1 ball 500 120 90
Machine gun C6 7.62-mm Link C21/C19 ball 880 100 58
Automatic rifle C7 5.56-mm C77 ball 450 60 19
The collection of particles was done using low-flow pumps equipped with air-monitoring cassettes. The pumps for particle and gas collection were placed in a box near the gun as shown on Figure 5-4 to facilitate their transport. The tubes were directed to strategic positions according to the

ERDC TR-08-1 5-16
gun used. In the case of Browning pistol, as shown on Figure 5-5, one sampling kit is close to the muzzle of the gun, and another one is behind the gun near the upper receiver or the cocking handle. In the case of the C6 machine gun and C7 automatic rifle, an enclosure bag was placed over the gun in order to minimize the gas and particle dispersion and maximize their collection, as shown on Figure 5-6 and Figure 5-8. One sampling kit was placed close to the muzzle of the guns and another kit was placed in-side the enclosure bag close to the upper receiver, as shown on Figure 5-7 and Figure 5-9. Sampling was made as close as possible to the gun to minimize dilution of the combustion products. Temperature during the trials was between 10°C and 14°C and wind was very low or even absent. This setup was used to try to optimize the sample collection. The inlets of the sampling material were not placed in the breathing zone of the military personnel and sampling was not done according to the standard proce-dures for exposure assessment, thus it has to be noted that the concentra-tion of particulate matter and of gases determined in this study is thus not representative of the exposure of the military personnel.
Figure 5-4. Sampling setup for Browning pistol.
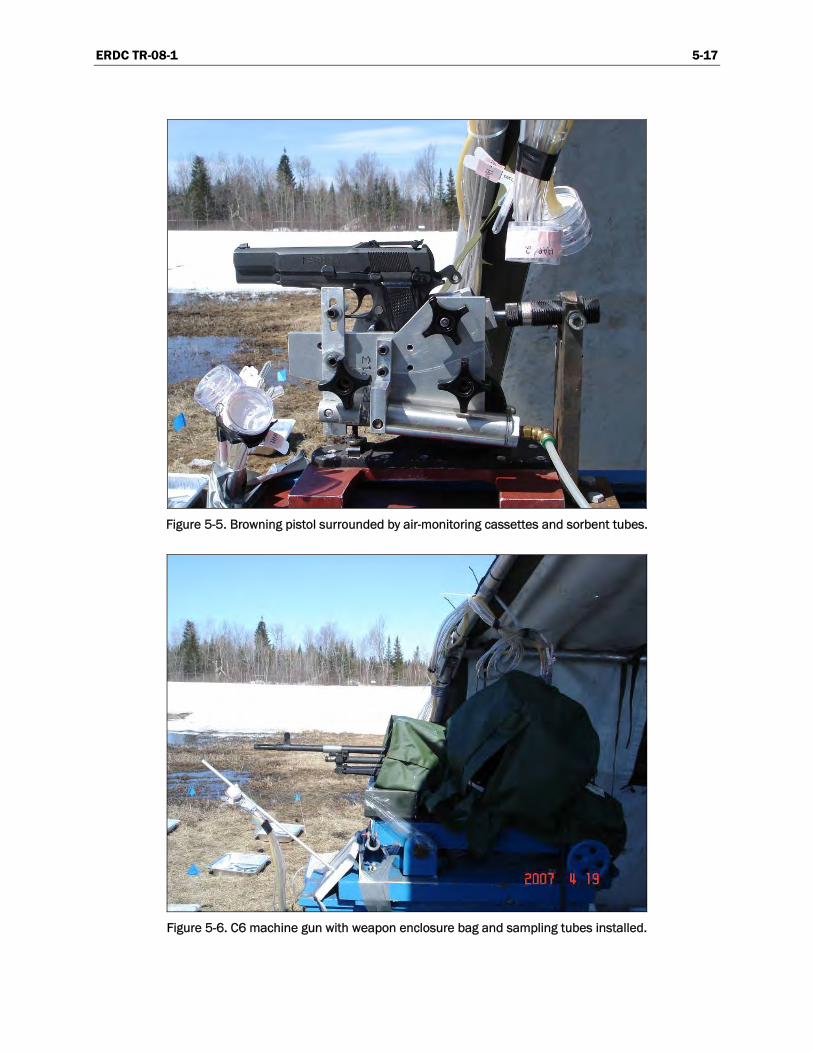
ERDC TR-08-1 5-17
Figure 5-5. Browning pistol surrounded by air-monitoring cassettes and sorbent tubes.
Figure 5-6. C6 machine gun with weapon enclosure bag and sampling tubes installed.

ERDC TR-08-1 5-18
Figure 5-7. Close view inside the weapon enclosure bag on the C6 machine gun.
Figure 5-8. C7 Automatic rifle with weapon enclosure bag and sampling tubes installed.
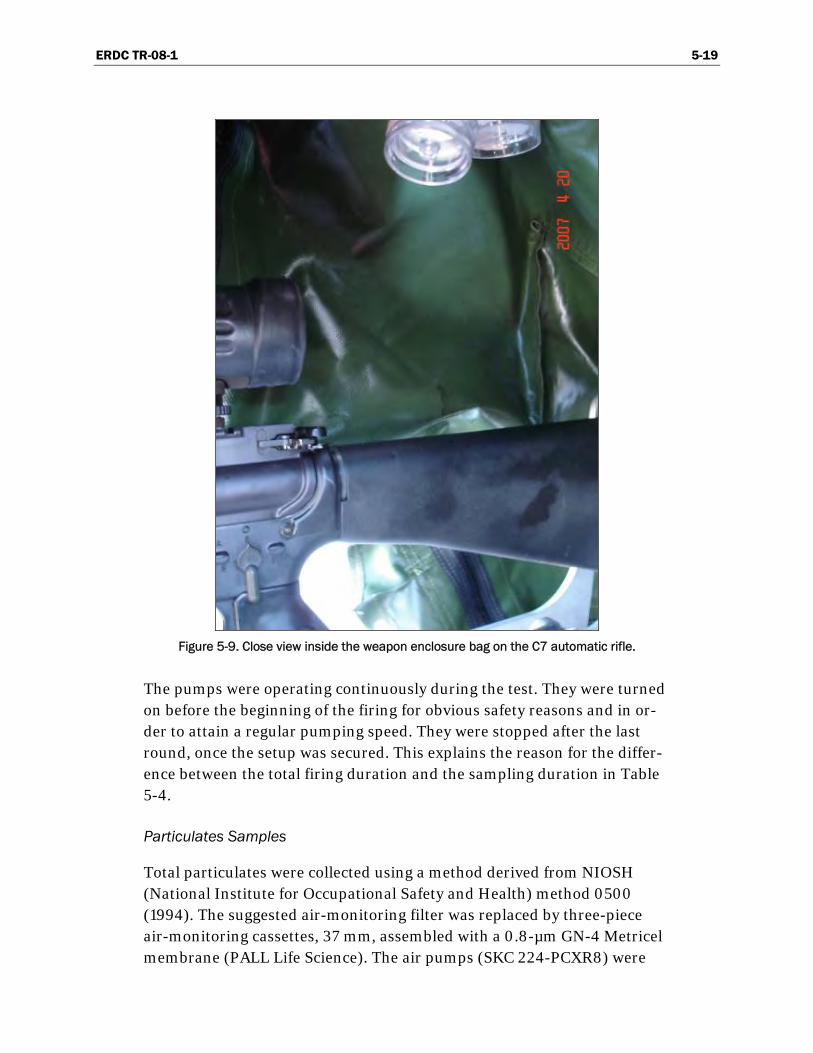
ERDC TR-08-1 5-19
Figure 5-9. Close view inside the weapon enclosure bag on the C7 automatic rifle.
The pumps were operating continuously during the test. They were turned on before the beginning of the firing for obvious safety reasons and in or-der to attain a regular pumping speed. They were stopped after the last round, once the setup was secured. This explains the reason for the differ-ence between the total firing duration and the sampling duration in Table 5-4.
Particulates Samples
Total particulates were collected using a method derived from NIOSH (National Institute for Occupational Safety and Health) method 0500 (1994). The suggested air-monitoring filter was replaced by three-piece air-monitoring cassettes, 37 mm, assembled with a 0.8-µm GN-4 Metricel membrane (PALL Life Science). The air pumps (SKC 224-PCXR8) were

ERDC TR-08-1 5-20
adjusted with a flow calibrator (Primary flow calibrator with bubble gen-erator/standard flow cell, Gilan Instrument Corp. USA) with a representa-tive sampler in line, prior to and after sampling. The cassette is connected to the pump with Tygon tubing (internal diameter ¼ inch). The air flow was calibrated at 4 L/min.
Gas Samples
Based on previous work (US EPA 2006a, Quémerais et al. 2007), some target gaseous compounds were chosen for sampling during the live firing of the weapons. These compounds are polycyclic aromatic hydrocarbons (PAHs), total cyanides (CN), 2,4-dinitrotoluene (2,4-DNT), the BTEX suite (benzene, ethylbenzene, toluene, and o-, m- and p-xylene), aldehydes (Ald), and nitric acid (NO3). Gaseous NG was not added to the list of gases analyzed because a limited amount of tubes were available and even though the same kind of tubes (Tenax) can be used for both 2,4-DNT and NG, the extraction procedure is different. The gases were collected using sorbent tubes or bubbler, as described in Table 5-6, along with the details for particle sampling. The air flow in the media was controlled by sampling pumps (SKC 224-PCXR8, Gilan Gilair 5 and Gilan LFS-113DC) calibrated using a primary flow calibrator with bubble generator/standard flow cell (Gilan Instrument Corp. USA) before and after sampling, thus giving a mean flow. Standard sampling conditions are described in the Substance Records from the Workplace Air Contaminant Sampling Guide of the Institut de recherche Robert-Sauvé en santé et en sécurité du travail (IRSST), except for 2,4-DNT, which was sampled according to modified OSHA method 44 (OSHA 2007, Bishop et al. 1981).
Table 5-6. Collection media for gases and particles sampling.
Parameter Symbol Target flow (mL/min) Collection media
Polycyclic aromatic hydrocarbons PAHs 2000
Glass fiber filter and porous polymer tube (Supelpack 20P/Orbo 42)
Total cyanides CN 1500 KOH 0.1N bubbler
2,4-dinitrotoluene 2,4-DNT 1000 Tenax tube (SKC 226-35-03)
Benzene, ethylbenzene, toluene, xylene (o, m, p) BTEX 200
Activated coconut charcoal tube (ST226-01)
Aldehydes Ald 100 2-(hydroxymethyl)piperidine on Supelpack
20N (Orbo 23)
Nitrates NO3 500 Activated silica gel (SKC 226-10-03)
Particulate matter PM 4000 Metricel membrane monitoring cassettes,
0.8 µm

ERDC TR-08-1 5-21
Sample Nomenclature
All the adsorbent tubes and cassettes were numbered as shown in Table 5-7. The term [Compound] stands for either PAH, CN, DNT, BTEX, Ald, or NO3. For example, in the case of the Browning pistol, the sampling tube for PAHs placed at the muzzle of the gun was identified [PAH]1. The moni-toring cassettes for particulate matter sampling were identified with the PM abbreviation.
Table 5-7. Nomenclature of the samples and position according to the weapon.
Sample identification
Weapon/ammunition Gaseous compounds Particles Position
[Compound] 1 PM 9 Gun muzzle Browning pistol/9-mm MK1 ball
[Compound] 2 PM 10 Upper receiver
[Compound] 3 PM 11 Gun muzzle C6 Machine gun/7.62-mm C21/C19 (4 ball – 1 tr) [Compound] 4 PM 12 Upper receiver
[Compound] 5 PM 13 Gun muzzle C7 Automatic rifle/5.56-mm C77 ball
[Compound] 6 PM 14 Upper receiver
Sample Processing and Analysis
Ground Samples
All ground samples (samples from tray, including towel wipes) contained in 3.8-L HDPE pails (IPL, St-Damien, Qc, Canada) were stored in the lab, except those suspected to contain 2,4-DNT, which were kept in a refriger-ated room at 4°C as prescribed for conservation of energetic material sam-ples (Thiboutot et al. 2003). The pails were opened and inspected in the next few days, in order to make sure that enough solvent was present in-side. If the amount of solvent was not sufficient to cover the contents of the pail, acetone was added until all the paper towels were soaked. The samples were then put in batch on an orbital shaker (VWR DS2-500-1, Mississauga, On, Canada) for a minimum period of 15 hours; this duration was chosen from results of preliminary trials done with spiked paper tow-els. This step was important in the homogenization of the samples before treating them manually. Figure 5-10 shows how the pails were installed on the orbital shaker.

ERDC TR-08-1 5-22
Figure 5-10. Homogenization of pail content on an orbital shaker.
Once the samples had reached homogenization, each pail was opened in order to remove the paper towels and any other large debris found inside. The paper towels were removed individually with tweezers and pressed through a 60-mL syringe, so that a maximum amount of solvent could be returned to the pail. After removal of the debris, the pails were then left open and placed in batch under a fume hood at room temperature to allow a slow evaporation of the solvent. Figure 5-11 gives an overview of the setup of pails for evaporation.

ERDC TR-08-1 5-23
Figure 5-11. Evaporation of pail content.
After the complete evaporation of the solvent, the samples were treated individually using the following sequence:
1. Rinse with two volumes of acetonitrile. This step consisted in extract-ing the particles from the pail a first time with a volume of 50 mL of ace-tonitrile, and a second time with the same volume or less, depending on the amount of particles left inside the pail after the first rinse. The con-tents of the pail were removed using a brush and poured along with the acetonitrile into a large syringe fitted with a 0.45-µm Acrodisc filter.
2. Filtration of the sample. During this step, the acetonitrile was pressed through the syringe so that nitrocellulose or any remaining debris present in the sample could be filtered onto a 0.45-µm filter disc. The filtrate was transferred into a vial. Note that for some samples, more than one filter was used; this led to a small loss of solvent in each filter. The volume of solvent in the vial was obtained by weighing the vial with and without solvent.

ERDC TR-08-1 5-24
3. Evaporation of the sample. The solution in the vial was composed of about 100 mL of acetonitrile containing NG, DNT, and any other solutes (including nitrocellulose [NC]) that passed through the 0.45-µm filter. To lower the detection limit, the samples were pre-concentrated in a Zymark gas-directed evaporator (model TurboVap LV) at 33°C under a nitrogen flow at a pressure of 12 psi until a volume of 10 mL or less was left inside the vial. This operation allows quantifying the concentrations of residues that are near detection limits and that could only be reported otherwise as “traces” or “below detection limits.” In-house studies of this process con-ducted on 26 multi-contaminated soil samples analyzed in duplicate indi-cate that no loss of residues occurs during evaporation. The mean %RSD was calculated as the ratio of standard deviation divided by the mean be-tween the with- and without-Zymark concentrations. Results show that a variation of the measured concentrations with and without Zymark was observed, leading to an uncertainty of 15% (mean %RSD) for NG and 12% for 2,4-DNT. The use of the Zymark evaporator allowed the quantification of gun propellant residues below the usual detection limits for two samples out of 52 for NG and 37 samples out of 52 for 2,4-DNT (unpublished re-sults).
4. Transfer into a preparation bottle. The contents of the Zymark vial were transferred into a 25-mL clear glass preparation bottle. If necessary, a minimal volume of acetonitrile (1–3 mL) was used in order to rinse the vial. The final volume was determined by weighing the vial.
5. Dilution and transfer into an analysis vial. A volume of 0.7 mL was ex-tracted from the preparation bottle and diluted with the same volume of a CaCl2/H2O solution. This method was used to prevent a large concentra-tion of any residual NC swollen particles before sending the vial to the HPLC.
6. HPLC analysis. The vials were sent to the HPLC for analysis using an in-house method derived from current EPA analysis methods (US EPA SW846 method 8330b). The parameters analyzed include NG for all sam-ples and 2,4-DNT in samples coming from single-base propellant.
Gas Samples
After sampling, the tubes and cassettes were closed and kept in the dark in a cooler at 4°C. Back in the lab, the tubes were sent for analysis to IRSST. The analytical methods and minimum reported values are presented in
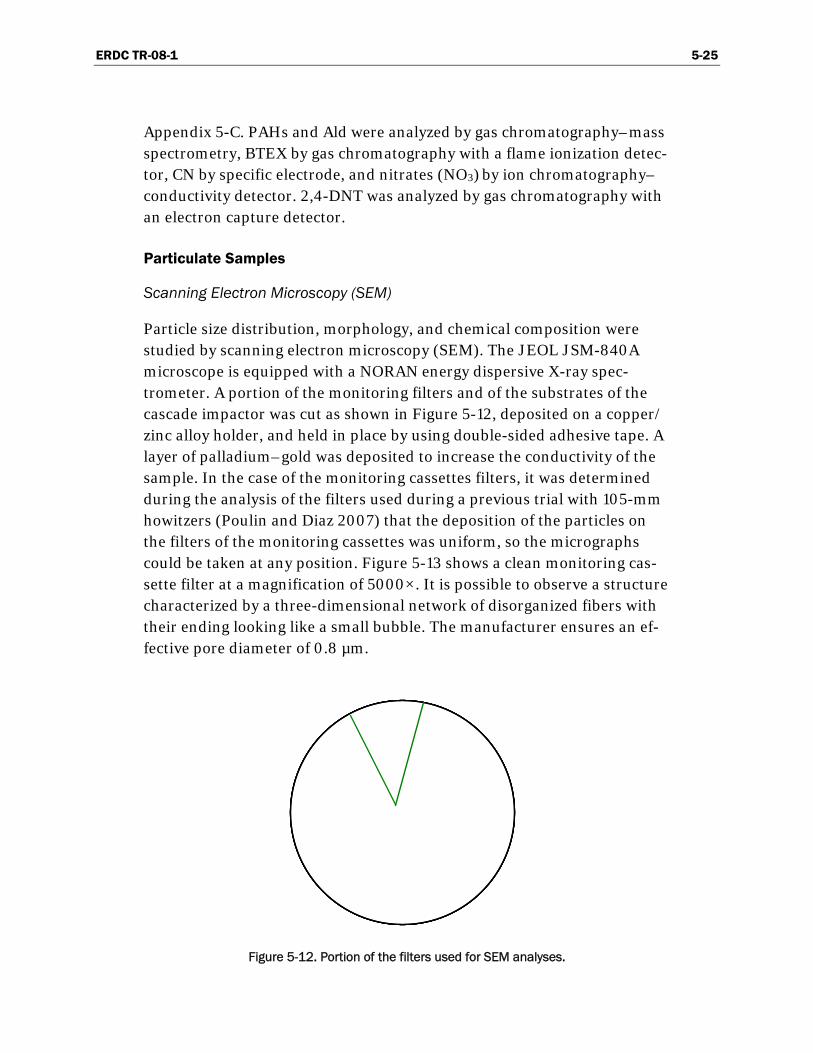
ERDC TR-08-1 5-25
Appendix 5-C. PAHs and Ald were analyzed by gas chromatography–mass spectrometry, BTEX by gas chromatography with a flame ionization detec-tor, CN by specific electrode, and nitrates (NO3) by ion chromatography–conductivity detector. 2,4-DNT was analyzed by gas chromatography with an electron capture detector.
Particulate Samples
Scanning Electron Microscopy (SEM)
Particle size distribution, morphology, and chemical composition were studied by scanning electron microscopy (SEM). The JEOL JSM-840A microscope is equipped with a NORAN energy dispersive X-ray spec-trometer. A portion of the monitoring filters and of the substrates of the cascade impactor was cut as shown in Figure 5-12, deposited on a copper/ zinc alloy holder, and held in place by using double-sided adhesive tape. A layer of palladium–gold was deposited to increase the conductivity of the sample. In the case of the monitoring cassettes filters, it was determined during the analysis of the filters used during a previous trial with 105-mm howitzers (Poulin and Diaz 2007) that the deposition of the particles on the filters of the monitoring cassettes was uniform, so the micrographs could be taken at any position. Figure 5-13 shows a clean monitoring cas-sette filter at a magnification of 5000×. It is possible to observe a structure characterized by a three-dimensional network of disorganized fibers with their ending looking like a small bubble. The manufacturer ensures an ef-fective pore diameter of 0.8 µm.
Figure 5-12. Portion of the filters used for SEM analyses.
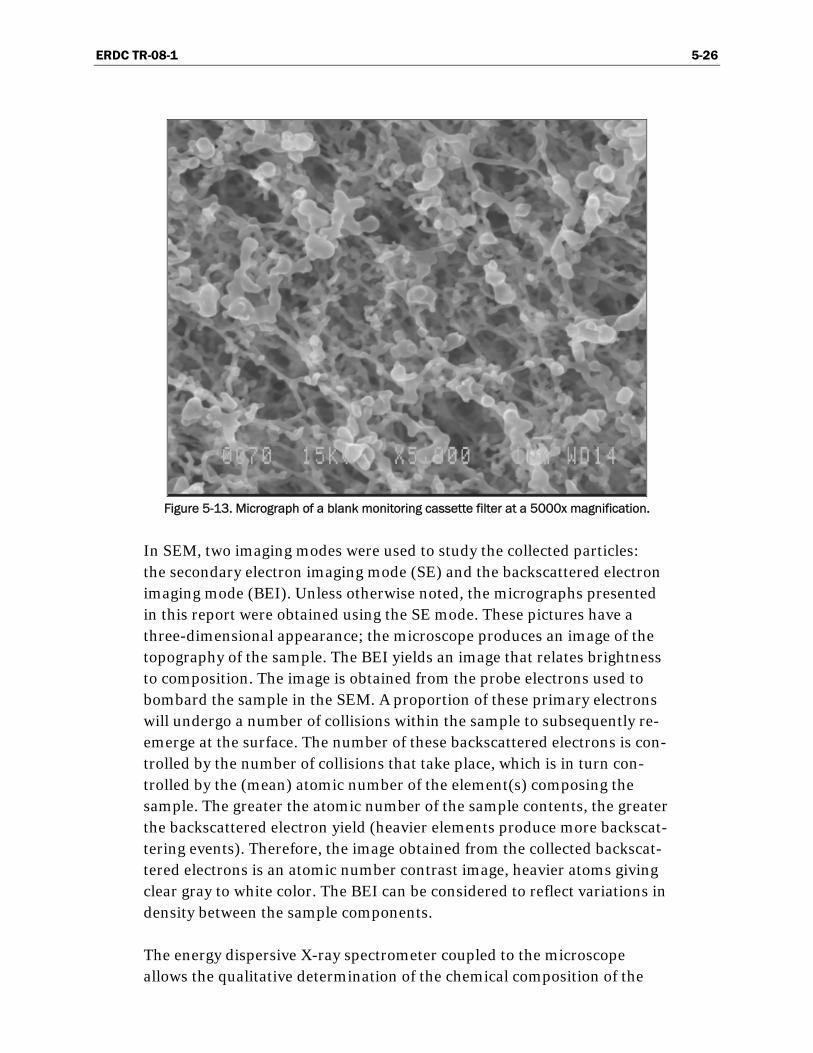
ERDC TR-08-1 5-26
Figure 5-13. Micrograph of a blank monitoring cassette filter at a 5000x magnification.
In SEM, two imaging modes were used to study the collected particles: the secondary electron imaging mode (SE) and the backscattered electron imaging mode (BEI). Unless otherwise noted, the micrographs presented in this report were obtained using the SE mode. These pictures have a three-dimensional appearance; the microscope produces an image of the topography of the sample. The BEI yields an image that relates brightness to composition. The image is obtained from the probe electrons used to bombard the sample in the SEM. A proportion of these primary electrons will undergo a number of collisions within the sample to subsequently re-emerge at the surface. The number of these backscattered electrons is con-trolled by the number of collisions that take place, which is in turn con-trolled by the (mean) atomic number of the element(s) composing the sample. The greater the atomic number of the sample contents, the greater the backscattered electron yield (heavier elements produce more backscat-tering events). Therefore, the image obtained from the collected backscat-tered electrons is an atomic number contrast image, heavier atoms giving clear gray to white color. The BEI can be considered to reflect variations in density between the sample components.
The energy dispersive X-ray spectrometer coupled to the microscope allows the qualitative determination of the chemical composition of the

ERDC TR-08-1 5-27
sample. During the energy dispersive X-ray analysis (EDX), the electron beam (15 keV) strikes a very small surface of the conducting sample. This causes X-rays to be emitted from the material. The material under exami-nation gives a spectrum, an example being shown in Figure 5-14. Each element gives a signal at a characteristic energy (x-axis). Signals are ob-tained for elements ranging from C to U, the energy of N being absorbed by a window in the microscope. No information on the oxidation state of the element is obtained. It is not possible to determine, for example, if the carbon present on the filter is organic or inorganic. The y-axis cannot be used to directly quantitate the elements present; the X-ray signals give only qualitative information about the chemical composition. As the sam-ple is coated with a layer of Pd-Au, it is normal to detect the characteristic X-rays of these elements in the spectrum. In Figure 5-14, the material un-der examination is made of Pb, C, O, and Cu. As all the spectra are similar, only the list of the elements present will be given in the result section. The spectra are given in Appendix 5-D for consultation. At best, this method can be considered as semi-quantitative.
Figure 5-14. Typical EDX spectrum of particulate matter analysis.
ERDC TR-08-1 5-28
Results
Ground Samples
This section describes the results for ground sample dispersion and mass of residues deposited per round. An example of detailed calculations is given in Appendix 5-B. Calculations are based on the assumption that 100% of the residues collected were contained within the sampled area. The dispersion of NG per caliber is shown in Figures 5-15 to Figure 5-19; to ease reading, NG concentrations are reported in mg per 1000 rounds, per area sampled (e.g., per line). When duplicates and triplicates were made, they are reported with the same name of ammunition/weapon, fol-lowed by #2 or #3, depending on the case. Table 5-B1 in Appendix 5-B re-ports the total amount of unburned residues per round and the percentage of unburned NG in the propellant for each trial. Table 5-8 gives a summary for each ammunition/weapon. For most of the trials, a complete round (intact cartridge and projectile) was saved and the initial mass of propel-lant per round was measured. The concentration of NG and 2,4-DNT in each round was evaluated using EPA SW846 Method 8330b (2006b). Re-sults are given in Table 5-3. This procedure is more precise than trying to rely on manufacturers’ data, which are often hard to find, inaccurate, or imprecise. For link rounds, the propellant is usually the same for the ball and for the tracer, but the quantity of propellant in the tracer is slightly lower. This has not been taken into account in the calculation of burning efficiency, also because only one tracer was used for every four balls.
9 mm
A total of five trials was done with 9-mm rounds: three with the MK1/ Browning, one with the Luger/Sig Sauer, and one with the frangible/ Sig Sauer. The same double-base propellant (WPR 289) was used for the MK1 and Luger, but the primer was different, the Luger using a lead-free primer. The frangible round contained a different propellant (PCL 2585) and a lead-free primer. Results shown in Figure 5-15 indicate that most of the contamination is contained in the first 5 m in front of the weapon. All three trials done with the Browning show a similar dispersion pattern. The two trials with the Sig Sauer also show a similar dispersion pattern, which is, however, different from the Browning’s. Of the three trials done with the MK1, #1 and #2 lead to a higher amount of NG per round than #3

ERDC TR-08-1 5-29
(Table 5-B1 in Appendix 5-B). This is probably the result of the wind that was blowing from southeast at an average speed of 14 km/h for the first two trials done on the same day, while the third one was done with a southwest wind of 29 km/h. Since the wind was roughly parallel to the firing direction and blowing toward the gun during #3, more particles are likely to have been blown at a shorter distance from the muzzle of the gun or even behind the gun.
Figure 5-15. Dispersion of NG on the ground for the 9-mm caliber after 1000 rounds.
#1, #2, and #3 are triplicates of Ball MK1/Browning.
The residues per load (Table 5-8) for the MK1 (1.39%) and the frangible round (1.97%) are very similar, but much lower than the Luger’s (3.90%). However, since the trial with the frangible round was done on a windy day (southwest, 31 km/h), care has to be exercised when comparing the re-sults, because the burning efficiency of the frangible round could actually be lower than the one calculated. From these results, it is hard to say whether the higher dispersion of NG with the Luger and potentially the frangible is due to the type of weapon or the lead-free primer. Indeed, the shorter barrel length of the Sig Sauer (98 vs. 124 mm) could play a role in the burning efficiency of the gun propellant. More trials would be needed to verify those results.

ERDC TR-08-1 5-30
Figure 5-16. Dispersion of NG on the ground for the 7.62-mm caliber
after 1000 rounds. #1 and #2 are duplicates.
7.62 mm
A total of four trials was performed with the 7.62 mm using a C6 machine gun: two with the C21/C19 4-ball/1-tracer, and two with the C24 blank. Dispersion results for all trials are shown in Figure 5-16. Residues for the C21 ball were detected up to 12 m in front of the gun, but most of them were dispersed within the first 8 m. Unexpectedly, residues of NG and 2,4-DNT were detected on the ground after the firing event. The mean amount of dispersed NG per round was 0.98 mg (1.36% of unburned NG [Table 5-8]). No explanation was found for the presence of a small amount of 2,4-DNT (0.031 mg/round) that is usually not present in double-base propel-lant. One hypothesis is that DNT was used as a coating agent, as for the C77 5.56 mm. Another possibility is that the propellant for the tracer and the ball was not the same. Unfortunately, at the time this report was written, the trial with 7.62 mm was the only one for which no bullet was spared for a subsequent analysis in the laboratory. This was corrected and additional results will be available in an upcoming DRDC report. Con-tamination of aluminum trays from previous trials does not seem possible. Previous trials were with 9-mm caliber and 2,4-DNT was never detected.
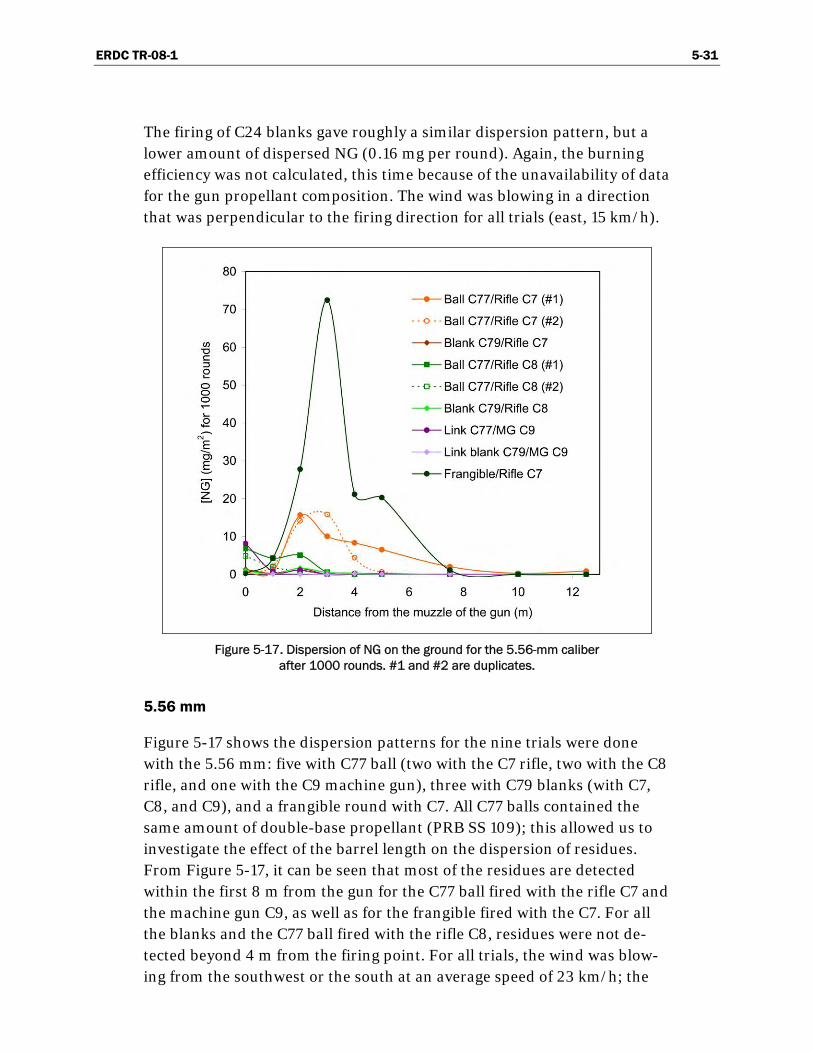
ERDC TR-08-1 5-31
The firing of C24 blanks gave roughly a similar dispersion pattern, but a lower amount of dispersed NG (0.16 mg per round). Again, the burning efficiency was not calculated, this time because of the unavailability of data for the gun propellant composition. The wind was blowing in a direction that was perpendicular to the firing direction for all trials (east, 15 km/h).
Figure 5-17. Dispersion of NG on the ground for the 5.56-mm caliber
after 1000 rounds. #1 and #2 are duplicates.
5.56 mm
Figure 5-17 shows the dispersion patterns for the nine trials were done with the 5.56 mm: five with C77 ball (two with the C7 rifle, two with the C8 rifle, and one with the C9 machine gun), three with C79 blanks (with C7, C8, and C9), and a frangible round with C7. All C77 balls contained the same amount of double-base propellant (PRB SS 109); this allowed us to investigate the effect of the barrel length on the dispersion of residues. From Figure 5-17, it can be seen that most of the residues are detected within the first 8 m from the gun for the C77 ball fired with the rifle C7 and the machine gun C9, as well as for the frangible fired with the C7. For all the blanks and the C77 ball fired with the rifle C8, residues were not de-tected beyond 4 m from the firing point. For all trials, the wind was blow-ing from the southwest or the south at an average speed of 23 km/h; the

ERDC TR-08-1 5-32
only exceptions were for the frangible round trial (southwest, 31 km/h) and the C77/C7 trials (east, 22 km/h). As a southwest wind blows toward the muzzle of the gun, its potential effect would be to shorten the distance at which particles are dispersed in front of the gun. The east wind would, however, carry along the particles on the right side of the sampling area.
With 1.06 mg NG dispersed per round (0.62% of unburned NG (Table 5-8), the most contaminating 5.56 mm is definitely the frangible round. Given the similar result obtained for the 9-mm frangible round, more tri-als should be undertaken to verify the effectiveness of the lead-free primer.
Table 5-8. NG residues per ammunition/weapon.
NG/round
Caliber Weapon Round Propellant type mg %
Browning pistol MK1 ball WPR 289 0.74 1.39
Sig Sauer Frangible PCL 2595 0.95 1.97 9 mm
Sig Sauer Luger 115 FMJ ball WPR 289 2.03 3.90
C6 Machine gun C21/C19 ball link (4-ball/1-tracer) CMR 100 0.98 1.36 7.62 mm
C6 Machine gun C24 blank Unique no. 20 0.16 na
C7 Automatic rifle Frangible WC 747 1.06 0.62
C7 Automatic rifle C77 ball clip PRB SS 109 0.30 0.19
C7 Automatic rifle C79A1 blank clip 0.02 0.05
C8 Automatic carbine C77 ball clip PRB SS 109 0.07 0.04
C8 Automatic carbine C79A1 blank clip 0.02 0.06
C9 Light machine gun C77/C78 link
(4-ball/1-tracer) PRB SS 109 0.05 0.03
5.56 mm
C9 Light machine gun C79A1 blank clip XPRO-11GO 0.01 0.01
Browning machine gun M2/M17 link
(4-ball/1-tracer) WC 860 0.25 0.02 .50 cal
McMillan rifle AAA750 Hodgdon
H50BMG 0.27 0.02
.338 cal Sniper rifle (Timberwolf) Match B406 RP15/LAPUA 0.03 0.001
na: Not available
High contamination was also obtained from the C77 ball fired with the C7, for which were dispersed 0.30 mg NG/round (0.19% of unburned NG). For all the other trials, a maximum of 0.09 mg NG per round, or 0.6% of the initial amount of propellant in the round, was obtained (Table 5-B1 in Appendix 5-B). The amount of dispersed NG per round for blanks is gen-
ERDC TR-08-1 5-33
erally lower than those of balls, but since the amount of initial gun propel-lant in blanks is also lower, the burning efficiency is similar. The precision of the results did not allow us to investigate the effect of the barrel length (530 mm for C7 and C9, and 400 mm for C8) on the burning efficiency. The wind, which was generally blowing at the same average speed for most of the trials, but in different directions (toward the gun for C7 and perpen-dicular to the firing direction for C8), could be at the origin of the differ-ence of deposited NG residues observed between C7 and C8.
.50 cal
Three trials were conducted with .50 cal, two using the Browning heavy machine gun and the third using the McMillan sniper rifle. The dispersion patterns for NG are shown in Figure 5-18. Most of the residues are found up to 5 m in front of the gun and nothing is detected beyond 10 m. The dispersion patterns are similar for the three trials, as well as the amount of dispersed NG per round (0.25–0.27 mg/round, 0.02% of unburned NG per round). This level of contamination is similar to that of the 5.56-mm C77 ball fired with C7 rifle, but lower than that of the 9-mm and 7.62-mm ball fired with C6. For all trials, the average wind speed was 30 km/h; wind was blowing from the southeast or southwest, potentially shortening the distance at which particles were dispersed in front of the gun.
.338 cal
For many years, the Canadian Forces used the .50 cal as their current sniper rifle. However, since the battle context has evolved, a more compact weapon, capable of achieving greater round velocities, was necessary. The Canadian Forces recently adopted the .338-cal Timberwolf as their new sniper rifle. The only trial made shows that residues are found up to 10 m in front of the gun (Fig. 5-19). The amount of dispersed NG per round was 0.03 mg/round (0.001% of unburned NG). Winds were blowing from the southeast at an average speed of 30 km/h during the experiment.

ERDC TR-08-1 5-34
Figure 5-18. Dispersion of NG on the ground for the .50 cal
after 1000 rounds. #1 and #2 are duplicates.
Figure 5-19. Dispersion of NG on the ground for the .338 cal after 1000 rounds.
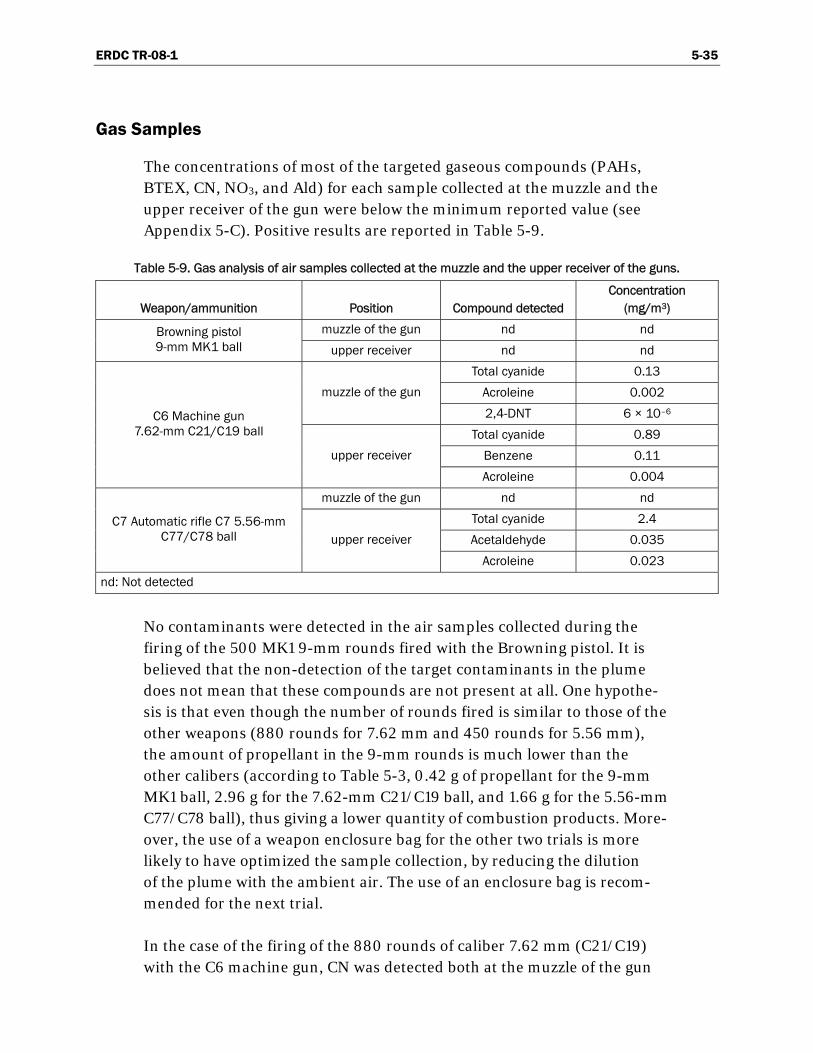
ERDC TR-08-1 5-35
Gas Samples
The concentrations of most of the targeted gaseous compounds (PAHs, BTEX, CN, NO3, and Ald) for each sample collected at the muzzle and the upper receiver of the gun were below the minimum reported value (see Appendix 5-C). Positive results are reported in Table 5-9.
Table 5-9. Gas analysis of air samples collected at the muzzle and the upper receiver of the guns.
Weapon/ammunition Position Compound detected Concentration
(mg/m3)
muzzle of the gun nd nd Browning pistol 9-mm MK1 ball upper receiver nd nd
Total cyanide 0.13
Acroleine 0.002 muzzle of the gun
2,4-DNT 6 × 10⁻⁶
Total cyanide 0.89
Benzene 0.11
C6 Machine gun 7.62-mm C21/C19 ball
upper receiver
Acroleine 0.004
muzzle of the gun nd nd
Total cyanide 2.4
Acetaldehyde 0.035 C7 Automatic rifle C7 5.56-mm
C77/C78 ball upper receiver
Acroleine 0.023
nd: Not detected
No contaminants were detected in the air samples collected during the firing of the 500 MK1 9-mm rounds fired with the Browning pistol. It is believed that the non-detection of the target contaminants in the plume does not mean that these compounds are not present at all. One hypothe-sis is that even though the number of rounds fired is similar to those of the other weapons (880 rounds for 7.62 mm and 450 rounds for 5.56 mm), the amount of propellant in the 9-mm rounds is much lower than the other calibers (according to Table 5-3, 0.42 g of propellant for the 9-mm MK1 ball, 2.96 g for the 7.62-mm C21/C19 ball, and 1.66 g for the 5.56-mm C77/C78 ball), thus giving a lower quantity of combustion products. More-over, the use of a weapon enclosure bag for the other two trials is more likely to have optimized the sample collection, by reducing the dilution of the plume with the ambient air. The use of an enclosure bag is recom-mended for the next trial.
In the case of the firing of the 880 rounds of caliber 7.62 mm (C21/C19) with the C6 machine gun, CN was detected both at the muzzle of the gun

ERDC TR-08-1 5-36
(0.13 mg/m3) and at the upper receiver (0.89 mg/m3). Considering the volume of air sampled, this corresponds to a mass of 0.02 and 0.14 mg of cyanide collected. Acroleine was also detected at both positions, 2 µg/m3 (0.04 µg) at the muzzle of the gun and 4 µg/m3 (0.04 µg) at the upper re-ceiver. Benzene was detected at a concentration of 0.11 mg/m3 (0.002 mg) at the upper receiver. 2,4-DNT was detected in the plume at the muzzle of the gun at a concentration of 0.006 µg/m3. The presence of 2,4-DNT in the plume is logical since it was experimentally measured at 0.1% in the pro-pellant of the C21 balls, but not in the other rounds (9 mm or 5.56 mm). We were not able to determine if 2,4-DNT collected by the sorbent tubes was in the gaseous or solid phase.
The air sample taken during firing of the 450 rounds of the 5.56-mm C77 ball with the C7 automatic rifle was found to have concentrations of the target compounds below the minimum reported value. At the upper re-ceiver, CN was detected at 2.4 mg/m3 (0.22 mg), acetaldehyde at 35 µg/m3 (0.21 µg), and acroleine at 23 µg/m3 (0.14 µg). Again, as stated previously, all the concentrations reported for all the weapons/ammunition are not representative of the soldiers’ exposure since the sample collection was not made in the breathing zone. The presence of the enclosure bag for two out of three trials seems to have an important influence on the collection effi-ciency. Its use for further trials is recommended. The assessment of mili-tary personnel exposure to diverse contaminants does not fall within the competence of DRDC Valcartier, so it is recommended that specialists in occupational health investigate the exposure during this type of activity.
Particulate Samples
Monitoring cassettes were inspected visually to make a qualitative evalua-tion of the particles collection. As seen in Figure 5-20a, after firing 500 rounds of 9-mm MK1 ball with the Browning pistol, the monitoring cas-settes have a very different appearance, depending on whether they were positioned at the gun muzzle (#9) or at the upper receiver (#10). The cas-sette at the gun muzzle is light grey, while the cassette at the upper re-ceiver is still white. Obviously, the number of particles collected at the muzzle is higher.
Figure 5-20 b and c show the monitoring cassettes after the firing of 7.62-mm C21/C19 rounds with the C6 machine gun and of 5.56-mm C77 rounds with the C7 automatic rifle, respectively. In both cases, the number of par-ticles is higher at the upper receiver (#12, 14) than at the muzzle of the gun
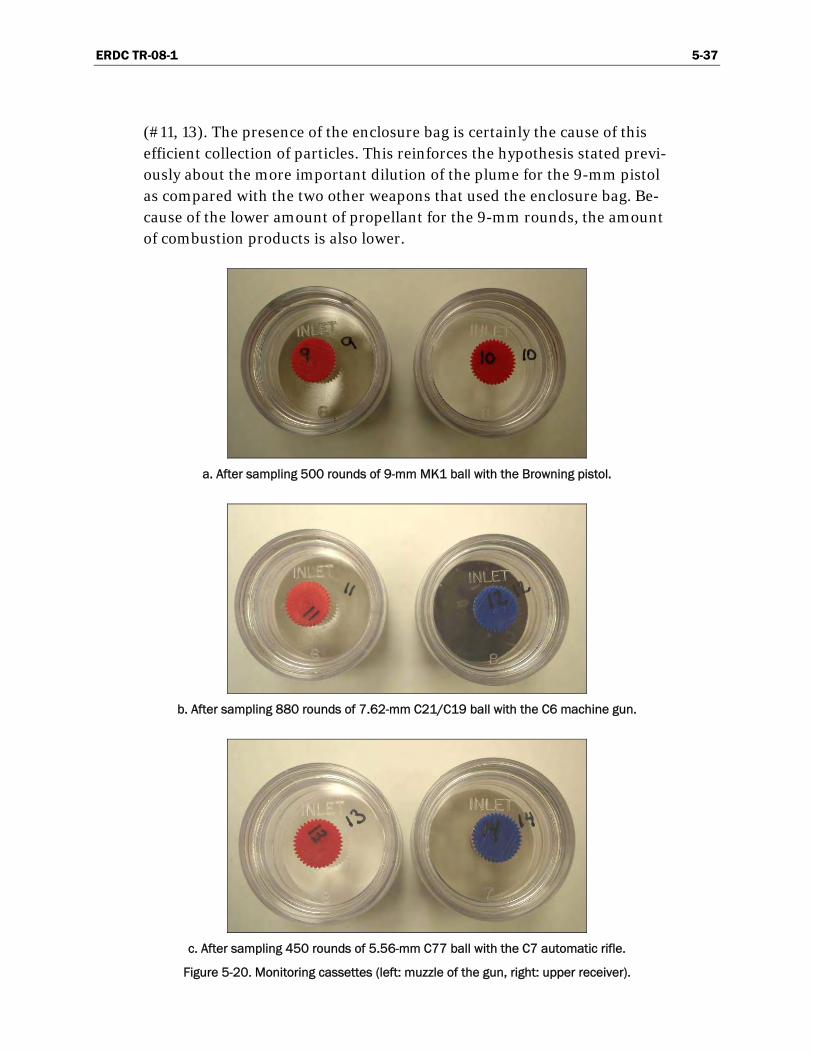
ERDC TR-08-1 5-37
(#11, 13). The presence of the enclosure bag is certainly the cause of this efficient collection of particles. This reinforces the hypothesis stated previ-ously about the more important dilution of the plume for the 9-mm pistol as compared with the two other weapons that used the enclosure bag. Be-cause of the lower amount of propellant for the 9-mm rounds, the amount of combustion products is also lower.
a. After sampling 500 rounds of 9-mm MK1 ball with the Browning pistol.
b. After sampling 880 rounds of 7.62-mm C21/C19 ball with the C6 machine gun.
c. After sampling 450 rounds of 5.56-mm C77 ball with the C7 automatic rifle.
Figure 5-20. Monitoring cassettes (left: muzzle of the gun, right: upper receiver).
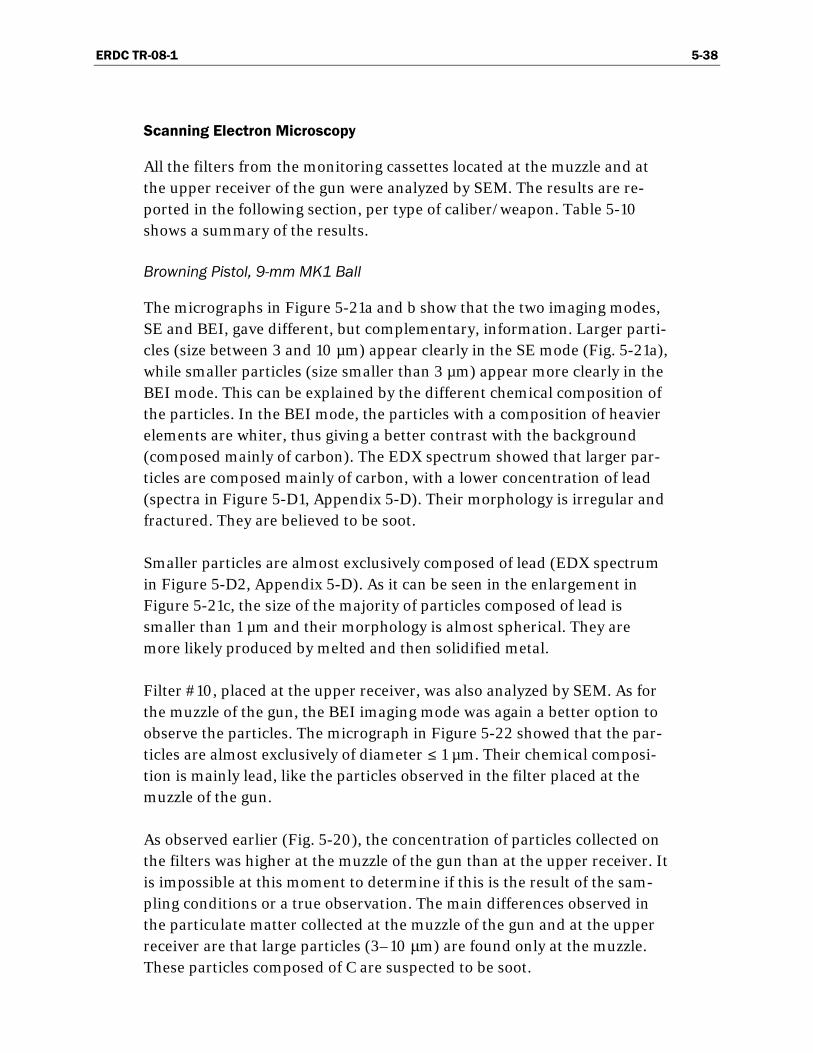
ERDC TR-08-1 5-38
Scanning Electron Microscopy
All the filters from the monitoring cassettes located at the muzzle and at the upper receiver of the gun were analyzed by SEM. The results are re-ported in the following section, per type of caliber/weapon. Table 5-10 shows a summary of the results.
Browning Pistol, 9-mm MK1 Ball
The micrographs in Figure 5-21a and b show that the two imaging modes, SE and BEI, gave different, but complementary, information. Larger parti-cles (size between 3 and 10 µm) appear clearly in the SE mode (Fig. 5-21a), while smaller particles (size smaller than 3 µm) appear more clearly in the BEI mode. This can be explained by the different chemical composition of the particles. In the BEI mode, the particles with a composition of heavier elements are whiter, thus giving a better contrast with the background (composed mainly of carbon). The EDX spectrum showed that larger par-ticles are composed mainly of carbon, with a lower concentration of lead (spectra in Figure 5-D1, Appendix 5-D). Their morphology is irregular and fractured. They are believed to be soot.
Smaller particles are almost exclusively composed of lead (EDX spectrum in Figure 5-D2, Appendix 5-D). As it can be seen in the enlargement in Figure 5-21c, the size of the majority of particles composed of lead is smaller than 1 µm and their morphology is almost spherical. They are more likely produced by melted and then solidified metal.
Filter #10, placed at the upper receiver, was also analyzed by SEM. As for the muzzle of the gun, the BEI imaging mode was again a better option to observe the particles. The micrograph in Figure 5-22 showed that the par-ticles are almost exclusively of diameter ≤ 1 µm. Their chemical composi-tion is mainly lead, like the particles observed in the filter placed at the muzzle of the gun.
As observed earlier (Fig. 5-20), the concentration of particles collected on the filters was higher at the muzzle of the gun than at the upper receiver. It is impossible at this moment to determine if this is the result of the sam-pling conditions or a true observation. The main differences observed in the particulate matter collected at the muzzle of the gun and at the upper receiver are that large particles (3–10 μm) are found only at the muzzle. These particles composed of C are suspected to be soot.

ERDC TR-08-1 5-39
Table 5-10. Comparison of particulate matter collected with monitoring cassettes for different weapons/ammunitions.
Sampling position
Gun/ammunition Muzzle of the gun Upper receiver
Majority Small particles (< 3 µm, majority < 1 µm) Composition: Pb Morphology: spherical Hypothesis: molten, then solidified metal, Pb origin: primer
Majority Small particles (≤ 1µm) Composition: Pb Morphology: spherical Hypothesis: molten, then solidified metal, Pb origin: primer Browning pistol, 9-mm MK1 ball
Minority Large particles (3–10 µm) Composition: C and Pb Morphology: irregular and fractured Hypothesis: soot
Majority Small particles (100 nm–3 µm) Composition: Cu (+ Sr and Pb in lesser concentration) Morphology: spherical Hypothesis: molten, then solidified metal, Cu origin: erosion of the cartridge inside the gun, Sr origin: tracer composition
Majority Small particles (< 1 µm) Morphology: spherical Composition: Pb (+Sb, Cu, Ca, K, C, and O in lesser concentration) Hypothesis: Sb and Pb origin: priming composition (Type C), Cu origin: erosion of the cartridge inside the gun, K origin: propellant
Machine gun C6, 7.62-mm C21 ball (weapon enclosure bag)
Minority Large particles (5 µm) Composition: C and O Morphology: flaky and irregular Hypothesis: soot
Minority Large particles (1–5 µm) Morphology: flaky and irregular
Majority Small particles (< 5 µm, mostly < 1 µm) Composition: Cu (+Al, Ba, Sb, and S) m Morphology: spherical Hypothesis: origin: Cu: erosion of the cartridge case inside the barrel of the gun
Majority Small particles (< 0.5 µm) Morphology: spherical Composition: Pb, Sb and Cu Al, Sb, Ba, S Hypothesis: condensation of vaporized metal. Cu: erosion of the cartridge case inside the barrel of the gun
Automatic rifle C7, 5.56-mm C77 ball (weapon enclosure bag)
Minority Large particles: > 5 µm Morphology: irregular Composition: C and O
Minority Large particles: 5–10 µm Morphology: fractured, irregular and flaky Composition: C and O Hypothesis: soot Aggregates: > 3 μm Morphology: irregular fluffy and condensed particles Composition: Cu, Ca, S, O, and C

ERDC TR-08-1 5-40
a. SE 1000×.
b. BEI 1000×.
c. BEI 4000×, zoom of the red-squared region.
Figure 5-21. Micrographs of particles collected on monitoring filter #9 (muzzle, 9-mm balls).
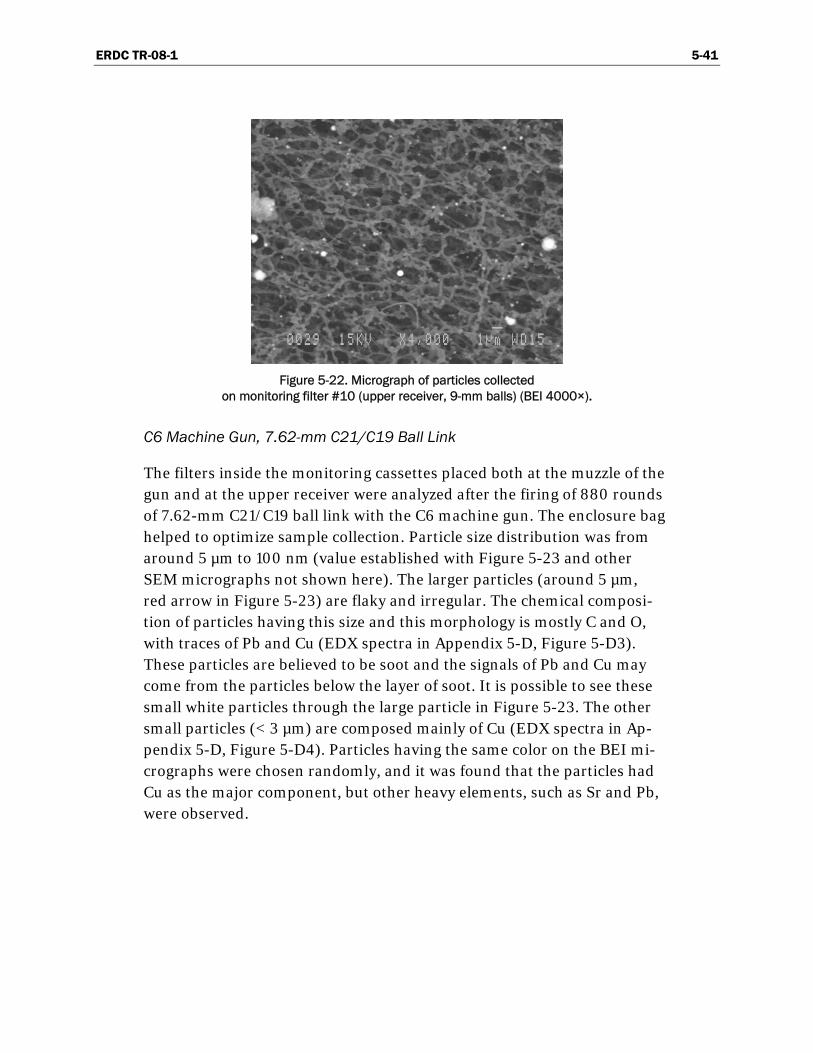
ERDC TR-08-1 5-41
Figure 5-22. Micrograph of particles collected
on monitoring filter #10 (upper receiver, 9-mm balls) (BEI 4000×).
C6 Machine Gun, 7.62-mm C21/C19 Ball Link
The filters inside the monitoring cassettes placed both at the muzzle of the gun and at the upper receiver were analyzed after the firing of 880 rounds of 7.62-mm C21/C19 ball link with the C6 machine gun. The enclosure bag helped to optimize sample collection. Particle size distribution was from around 5 µm to 100 nm (value established with Figure 5-23 and other SEM micrographs not shown here). The larger particles (around 5 µm, red arrow in Figure 5-23) are flaky and irregular. The chemical composi-tion of particles having this size and this morphology is mostly C and O, with traces of Pb and Cu (EDX spectra in Appendix 5-D, Figure 5-D3). These particles are believed to be soot and the signals of Pb and Cu may come from the particles below the layer of soot. It is possible to see these small white particles through the large particle in Figure 5-23. The other small particles (< 3 µm) are composed mainly of Cu (EDX spectra in Ap-pendix 5-D, Figure 5-D4). Particles having the same color on the BEI mi-crographs were chosen randomly, and it was found that the particles had Cu as the major component, but other heavy elements, such as Sr and Pb, were observed.

ERDC TR-08-1 5-42
Figure 5-23. Micrograph of particles collected
on monitoring filter #11 (muzzle, 7.62-mm balls) (BEI 4000×).
Particles collected at the upper receiver were all < 5 µm, with a majority of particles < 1 μm. Figure 5-24a shows a micrograph (4000× magnification) of the filter, and one can see the same type of morphology for larger parti-cles as were observed on the filter at the muzzle end: flaky irregular shape. The BEI micrograph in Figure 5-24b shows that particles < 1 µm have a similar spherical morphology and color (white particles), indicating that their chemical composition is similar and composed of heavy elements. The EDX spectrum of randomly chosen particles of size < 1 µm showed that the composition is mainly Pb, with other components such as Sb, Cu, C, and O. Ca and K were also observed in low concentration. One typical spectrum is presented in Appendix 5-D, Figure 5-D5.
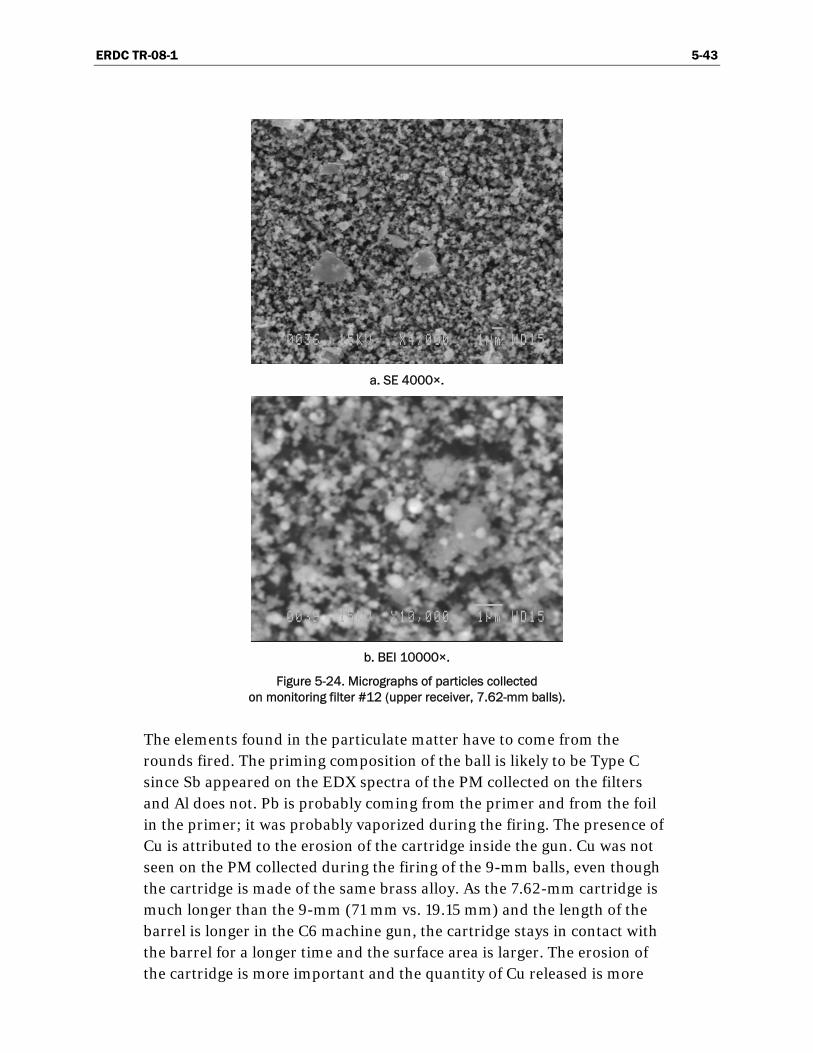
ERDC TR-08-1 5-43
a. SE 4000×.
b. BEI 10000×.
Figure 5-24. Micrographs of particles collected on monitoring filter #12 (upper receiver, 7.62-mm balls).
The elements found in the particulate matter have to come from the rounds fired. The priming composition of the ball is likely to be Type C since Sb appeared on the EDX spectra of the PM collected on the filters and Al does not. Pb is probably coming from the primer and from the foil in the primer; it was probably vaporized during the firing. The presence of Cu is attributed to the erosion of the cartridge inside the gun. Cu was not seen on the PM collected during the firing of the 9-mm balls, even though the cartridge is made of the same brass alloy. As the 7.62-mm cartridge is much longer than the 9-mm (71 mm vs. 19.15 mm) and the length of the barrel is longer in the C6 machine gun, the cartridge stays in contact with the barrel for a longer time and the surface area is larger. The erosion of the cartridge is more important and the quantity of Cu released is more

ERDC TR-08-1 5-44
important. Another factor is that the number of 7.62-mm cartridges is 880 vs. 500 for the 9-mm cartridges. The presence of Sr is due to the firing of tracer balls. K may come from the propellant.
C7 Automatic Rifle, 5.56-mm C77/C78 Ball
Two monitoring cassettes were used during the firing of 450 rounds of 5.56-mm C77/C78 ball with the C7 automatic rifle. As for the other weap-ons, one cassette was placed near the muzzle of the gun (#13) and another was placed near the upper receiver (#14). The weapon enclosure bag was used to optimize sample collection at the upper receiver.
As expected from Figure 5-20c, the filter at the muzzle end presents a low number of particles as compared to the other filters. As for the other weapons, some particles (e.g., particles pointed by the red arrow in Figure 5-25a) are irregular, with a size > 5 µm, but this time the morphology does not seem to be flaky. Smaller particles (< 5 µm) seem to be mostly < 1 μm (Fig. 5-25b). Their morphology is spherical and their composition is ex-pected to be uniform, as they exhibit the same contrast in the EDX spectra. The randomly chosen particles present chemical composition that varies, but Cu was always present. Al, Ba, Sb, and S were among the other ele-ments found in the particles of diameter < 1 µm.
The filter in the monitoring cassette placed in the enclosure bag near the upper receiver was analyzed by SEM. The collection of particles was more efficient with the enclosure bag and the particle concentration on the filter was higher, as can be seen by comparing Figure 5-25 and Figure 5-26. When observing Figure 5-26a and b, one can separate the morphology of the different particles deposited on the filter into four types: 1) spherical (almost perfect) particles, 2) fractured, irregular, and flaky particles, 3) irregular fluffy particles, and 4) aggregates. The size distribution of the particles seems to be related to the particles’ shape. The spherical particles are mostly the smaller particles (diameter < 0.5 µm). On the EDX spectra, these particles are white, thus indicating a composition of heavy elements, mainly Pb, Sb, and Cu. Irregular, fractured, and flaky particles have a diameter between 5 and 10 µm. They are composed of C and O, thus are probably soot. The two other morphologies are related in the sense that the irregular fluffy particles (diameter between 1 and 3 µm) seem to have coalesced to form the large aggregates (diameter up to 10 µm). These par-ticles are composed of many elements: Cu, Ca, S, O, and C.

ERDC TR-08-1 5-45
a. BEI 1000×.
b. BEI 4000×.
Figure 5-25. Micrographs of particles collected on monitoring filter #13 (muzzle, 5.56-mm balls).

ERDC TR-08-1 5-46
a. BEI 1000×.
b. BEI 4000×
Figure 5-26. Micrographs of particles collected on monitoring filter #14 (upper receiver, 5.56-mm balls).
ERDC TR-08-1 5-47
Discussion
The results from ground dispersion of NG show that most of the rounds and weapons tested deposit a mass of NG below 0.09 mg per rounds or that the percentage of unburned NG per round is lower than 0.06%. Ex-ceptions are the following:
• 9-mm rounds, which deposit between 0.74 and 2.13 mg NG/round (1.39 to 3.90% of unburned NG per round). The dispersion seems to be worst when the Sig Sauer pistol is used.
• 7.62 mm, both C21/C19 ball link and C24 blank link, fired with the C6 machine gun, which were found to deposit approximately 0.98 and 0.16 mg NG per round, corresponding to 1.36% and 0.11% of unburned NG per round, respectively.
• 5.56-mm C77/C78 ball rounds fired with the C7 automatic rifle that deposit 0.30 mg/round (0.19% of unburned NG per round).
• 5.56-mm frangible round fired with the C7 automatic rifle, which leads to an amount of 1.06 mg NG/round (0.62% of unburned NG per round).
The results indicate that 9-mm rounds deposit a larger amount of un-burned NG on the soil and have a lower burning efficiency. The burning efficiency seems to increase as the amount of propellant in the round in-creases, with the exception of 7.62 mm, for which more gun propellant residues are emitted for both balls and blanks, as compared to 5.56-mm rounds. Blanks have a burning efficiency similar to balls, but since less propellant is present, smaller amounts of NG (0.01–0.02 mg, as compared to 0.05–0.30 mg) per shot are deposited.
The results also confirm that either the weapon and/or the primer have a significant effect on the burning efficiency, because very different values were obtained for the 9 mm fired with the same propellant (WPR 289), but using different pistols and primers (0.74 and 2.03 mg NG). The results for the 9-mm and 5.56-mm frangible rounds should be verified in a subse-quent study, because the contamination associated with those two rounds

ERDC TR-08-1 5-48
is unusually high. These findings suggest that the lead-free primer may not be as effective as the traditional formulations to ignite the gun propellant.
The 5.56-mm rounds were fired with the same propellant (PRB SS 109), but using three weapons with different barrel length (C7, 530 mm; C8, 480 mm; C9, 530 mm); the precision of the results was not high enough because of the wind. We were not able to see any clear tendency of the ef-fect of the barrel length or firing mechanism. The .50-cal round has a high burning efficiency, but because of the larger amount of propellant in the round, each shot deposited a larger amount of NG (0.25 mg) in the envi-ronment. And lastly, considering the large amount of propellant in the Lapua Magnum, the release of NG by the Timberwolf sniper rifle is quite small (0.03 mg) as compared to the other small arms.
The percentages of unburned NG per round were within an order of magnitude to those of Walsh et al. (2007), who obtained 1.1% of the 5.56 mm/rifle (as opposed to 0.2–0.6% in this study), 0.56% for the 7.62 mm/machine gun (as opposed to 1.36% in this study), 5.4% for the 9 mm (vs. 1.39–3.90% in this study) and 0.73% for the .50 cal (vs. 0.02% in this study). Dispersion patterns for all the rounds are also similar.
A certain number of reasons can be invoked to explain the differences be-tween the trials of Walsh et al. (2007, Chapter 3, this report) and those of this study. One of them is certainly the trial setup. Walsh’s trial was con-ducted on snow, with the weapon located just high enough (approximately 30 cm) from the surface to minimize the effect of the muzzle blast. For our study, the trial was done in spring, at temperatures approximately 30°C higher than those of Walsh’s; samples were recovered in aluminum plates filled with solvent, and weapons were much farther from the ground (1 m). The effect of the wind, which was more significant during some of our trials with the 5.56 mm and the .50 cal, cannot be ruled out. Another important point is that the Canadian and US Forces do not use the same weapons, and often not the same gun propellants and primers. This could contribute to significant differences, as shown from our results for the 9 mm fired with Sig Sauer and a lead-free primer (2.03 mg NG, 3.90% of unburned NG) and the Browning pistol with a traditional primer (0.74 mg NG, 1.39% of unburned NG per round). Also, the manufacturer’s data are often imprecise, inaccurate, or hard to obtain; in-house analysis of the gun propellant used for a given experiment should always be obtained to allow more accurate estimates of burning efficiencies.

ERDC TR-08-1 5-49
At first glance, the reported amounts of unburned NG per rounds in both studies can be seen as low, and the burning efficiency, pretty high. How-ever, artillery rounds generally have higher burning efficiencies (0.0005 to 0.08% of unburned NG per bullet) than small arms (Walsh et al. 2007, Chapter 3, this report); the burning efficiency of mortars (1.4 to 3.5% of unburned NG per round) is either similar or lower than those of small arms. Moreover, the large number of bullets fired on small arms ranges has to be taken into account to evaluate the impact on the environment. For example, in the case of Y Range in Canadian Force Base (CFB) Petaw-awa, Canada, on which were fired approximately 0.5M 5.56-mm balls per year since 1996, the calculated amount of NG deposited on the surface of the soil is 150 g per year. If we make the hypothesis that all the rounds were fired from the 100-m berm to the 400-m berm in a 75 000-m2 area, and using a soil density of 1.7 g/cm3, this leads to a concentration of NG on the top 2 cm of surface soil of 0.06 mg/kg. Reported concentrations on the 100-yard firing berm are three orders of magnitude higher than that (Jen-kins et al. 2007, Chapter 8, this report), but they tend to decrease after 15 m. Nevertheless, none of the results goes below 0.1 mg/kg up to 40 m in front of the firing point, and the mean NG concentration is 8.8 mg/kg. If we use Walsh’s values of 1.1% per round, and a 1-cm sampling depth in-stead, the loading rate is 0.7 mg/kg/yr, which is closer to, but still lower than, the reported concentrations of NG. Of course, other munitions were also fired in that range, but they amount to less than 4% of the total num-ber of rounds fired. They include 7.62-mm (1.4%), linked 5.56-mm (1.4%) or 9-mm (0.3%) rounds. So, the results tend to indicate that NG has a sig-nificant cumulative effect. Care has to be taken, however, when interpret-ing these soil surface characterization results, because only 12% of the en-tire surface was sampled, and no depth sampling was done.
The same calculation was applied to Pistol Range Q in CFB Petawawa. This time, all the surface of the range was sampled because of its small size (1250 m2). The calculated loading from the amount of unburned NG per round using an average of 70,000 9-mm rounds fired each year leads to a deposit of 52 g NG on the soil each year. However, the estimated loading from surface soil characterization of the top 2 cm gives an amount of NG slightly over 1 kg, which corresponds to a 20-year accumulation. This does not take into account contaminants below soil surface, because no depth profiling was done in Q Range. So, either the amount of unburned NG per round is grossly underestimated, or there is a significant cumulative effect of NG in the environment. Although the amount of NG is certainly slightly
ERDC TR-08-1 5-50
underestimated, the long persistency of NG is not unexpected, because it is embedded in a NC matrix, which is insoluble in water and does not de-grade. NC can thus stay a very long time on the surface of the soil, and is probably trapping NG (Pennington et al. 2006).
Another discrepancy between soil surface characterization and the results of this study is worth noting. Indeed, energetic residues were detected up to 40 m in front of the firing points, while in this study residues do not get farther than 12 m from the muzzle of the gun. Several hypotheses could explain this phenomenon. This could be the result of a multi-decade use that allowed the NG concentrations to build up high enough for detection. It could also be the result of runoff water carrying particles far from their ejection point, or be due to dominant wind that could blow in a direction that is parallel to the firing lanes. The hypothesis of soldiers firing between berms is considered improbable, because this has not been the usual mili-tary practice for the last three decades, except for the 100-m berm. Older military practices are unknown.
The analysis of gases emitted from 9-mm rounds fired with the Browning Pistol indicate that lead is the main component of the particles smaller than 1 µm (both sampling positions). Even though lead is present in the bullet, as it is covered with a copper/zinc jacket, it is not believed that it can liberate any lead while it is propelled. The main source for lead on the filters is probably the primer: lead is vaporized during the firing and is condensed shortly afterward in small particles. These particles may be carried by the winds, spreading lead in areas other than the firing point. This assumption has to be confirmed by further studies.
Most of the particles collected at the muzzle and the upper receiver of C21/ C19 7.62-mm balls fired with the C6 machine gun are small (< 1 µm). A similar situation was observed for the C77 5.56-mm fired with the rifle C7. In both cases, Cu was the main component at the muzzle, while at the up-per receiver, it was Pb. This supports the hypothesis that Cu is released by the erosion of the cartridge inside the barrel. As these particles (created by the melting then solidification of the metal) are following the trajectory of the bullet, it is normal that they are ejected mainly at the muzzle of the gun. The erosion of the cartridge seems to become significant enough so particles of copper are found for longer barrels (C6 machine gun and C7 automatic rifle). At the upper receiver, particles collected are from the combustion of the primer.

ERDC TR-08-1 5-51
Conclusions
In this study, 23 trials were done with 15 different calibers/weapons; many of them were conducted in duplicate, one was done in triplicate, and three were air-sampled to measure target gaseous compounds and particulate matter. The results indicate that up to 2.03 mg NG per round was depos-ited, depending on the caliber/weapon used. The burning efficiency of most small arms is better than that of mortars, but worse than that of artil-lery. Although the amount of dispersed NG per bullet seems low, the large amount of small caliber ammunition used in military training can lead to significant accumulation on the surface of the soil, especially since pistol and rifle ranges are small. The results show that NG accumulates on the soil surface over years, and probably decades.
To increase the precision in the results, it is recommended that this trial be reconducted in an indoor facility, or care taken to eliminate as much as possible wind effect. Because of the short time frame available for this trial, it was not possible to wait until no wind was present. Frangible am-munition should be reexamined, and efforts made to find precise informa-tion about the propellant and the primer of each round. Also, the composi-tion of each gun propellant should be obtained in the laboratory.
Some target compounds were found in detectable concentrations in gase-ous emissions for the 7.62-mm and the 5.56-mm rounds, for example cya-nide and acroleine. The presence of the enclosure bag for two out of three trials improved the collection efficiency. The majority of the particulate matter collected using air sampling was of size smaller than 1 µm and made of metal, either lead or copper. Again, the enclosure bag helped in optimizing the collection. Its use for further trials is thus recommended. It is important to note that the concentrations reported for all the weapons/ ammunitions are not representative of the soldiers’ exposure since the sample collection was not made in the breathing zone, and it is believed that the concentration will be lower in that area since dilution will occur without the enclosure bag and the effect of any wind present. The assess-ment of military personnel exposure to diverse contaminants does not fall within the competence of DRDC Valcartier, so it is recommended that spe-cialists in occupational health investigate the exposure during these types of activities.

ERDC TR-08-1 5-52
References
Bach, J.C., B.E. Conway, S.B. Mulligan, K.A. Watts (2006) US Army Environmental Center’s Development of AP-42 Emission Factors for Munition Use, 15th International Emission Inventory Conference, Reinventing Inventories—New Ideas in New Orleans, New Orleans.
Bishop, R.W., T.A. Ayers, and D.S. Rinehart (1981) The use of a solid sorbent as a collection medium for TNT and RDX vapors. American Industrial Hygiene Association Journal 42, 586–589.
DHHS (NIOSH) (1994) Publication 94-113, NIOSH Manual of Analytical Methods (NMAM), 4th ed., 1st Supplement Publication 96-135, 2nd Supplement Pub-lication 98-119, 3rd Supplement 2003-154, P.C. Schlecht and P.F. O’Connor, Eds. (http://www.cdc.gov/niosh/nmam).
IRSST, Substance Records from the Workplace Air Contaminant Sampling Guide (http://www.irsst.qc.ca/en/_listersst.html).
ITRC Small Arms Firing Range Team (2003) Characterization and Remediation of Soils at Closed Small Arms Firing Ranges. Interstate Technology and Regulatory Council (http://www.itrcweb.org/gd_smart.asp).
ITRC Small Arms Firing Range Team (2005) Environmental Management at Operating Outdoor Small Arms Firing Range. Interstate Technology and Regulatory Council (http://www.itrcweb.org/gd_smart.asp).
OSHA (2007) Index of sampling and analytical methods (http://www.osha.gov/dts/sltc/ methods/toc.html).
Pennington, J.C., T.F. Jenkins, G. Ampleman, S. Thiboutot, A.D. Hewitt, S. Brochu, J. Robb, E. Diaz, J. Lewis, H. Colby, R. Martel, K. Poe, K. Groff, K.L. Bjella, C.A. Ramsey, C.A. Hayes, S. Yost, A. Marois, A. Gagnon, B. Silverblatt, T. Crutcher, K. Harriz, K. Heisen, S.R. Bigl, T.E. Berry, J. Muzzin, D.J. Lambert, M.J. Bishop, B. Rice, M. Wojtas, M.E. Walsh, M.R. Walsh, and S. Taylor (2006) Distribution and Fate of Energetics on DoD Test and Training Ranges: Interim Report 6. US Army Engineer Research and Development Center, Vicksburg, Mississippi, ERDC Technical Report TR-06-12.
Poulin, I., and E. Diaz (2007) Airborne Particulate Matter Emissions During Live Firing of LG1 Mark II 105-mm Howitzer. Defence Research and Development Canada - Valcartier, Quebec, Québec, DRDC Valcartier TM 2007-297.
Quémerais, B., L. Melanson, G. Ampleman, S. Thiboutot, E. Diaz, and I. Poulin (2007) Characterization of atmospheric emissions during live gun firing at the muffler installation in Nicolet, Lac St. Pierre, Canada: Test on Howitzer 105 mm. Defence Research and Development Canada - Toronto, Toronto, Ontario, DRDC Toronto TR 2007-060.

ERDC TR-08-1 5-53
Thiboutot, S., G. Ampleman, S. Brochu, R. Martel, G. Sunahara, J. Hawari, S. Nicklin, A. Provatas, J. Pennington, T. Jenkins, and A. Hewitt (2003) Protocol for Energetic Materials-Contaminated Sites Characterization. Proceedings of the 28th TTCP Meeting, WTP4, KTA 4-28, Final Report, Vol II, Valcartier, Québec, Canada (www.em-guidelines.org).
US Environmental Protection Agency (2006a) Background document—Report on revisions to 5th edition AP-42 Chapter 15, Ordnance detonation (http:// www.epa.gov/ttn/chief/ap42/ch15/index.html).
US Environmental Protection Agency (2006b) Nitroaromatics and Nitramines by High Performance Liquid Chromatography (HPLC); SW-846 Method 8330B (http://www.epa.gov/epaoswer/hazwaste/test/pdfs/8330b.pdf).
Walsh, M.R., M.E. Walsh, S. Bigl, N.M. Perron, D.J. Lambert, A.D. and Hewitt (2007) Propellant Residues Deposition from Small Arms Munitions. US Army Engineer Research and Development Center, Cold Regions Research and Engineering Laboratory, Hanover, New Hampshire, Technical Report ERDC/CRREL TR-07-17.

ERDC TR-08-1 5-54
Appendix 5-A: Description of Each Trial
Samples were identified using the following convention: SAR (Small Arms Residues), Test Number (from 1 to 17), Distance from the weapon and/or special note (being blank, duplicate [DUP], or triplicate [TRI]). For exam-ple, the sample collected on Test #1 at the 2-m line was identified SAR 1-2. The blank sample collected during Test #1 was identified SAR 1-Blank.
Table 5-A1. Amount of NG and 2,4-DNT collected in each sampling line.
Trial Samples Solvent in trays NG
(mg) 2,4-DNT (mg/L)
9-mm Mk1 SAR 1-0 Ethanol 6.273 nd
Trial #1 SAR 1-1 Ethanol 9.426 nd
18/04/07 SAR 1-2 Ethanol 15.297 nd
SAR 1-3 Ethanol 8.517 nd
SAR 1-4 Ethanol 2.792 nd
SAR 1-5 Ethanol 1.336 nd
SAR 1-7.5 Ethanol 0.110 nd
SAR 1-10 Ethanol 0.038 nd
9-mm Mk1 SAR 1-0-DUP Ethanol 1.424 nd
Trial #2 SAR 1-1-DUP Ethanol 7.017 nd
18/04/07 SAR 1-2-DUP Ethanol 11.760 nd
SAR 1-3-DUP Ethanol 9.797 nd
SAR 1-4-DUP Ethanol 4.967 nd
SAR 1-5-DUP Ethanol 1.739 nd
SAR 1-7.5-DUP Ethanol 0.236 nd
SAR 1-10-DUP Ethanol 0.146 nd
SAR 1-DUP-BLANK Ethanol nd nd
9-mm Luger SAR 3-0 Ethanol 10.117 nd
Trial #4 SAR 3-1 Ethanol 17.842 nd
18/04/07 SAR 3-2 Ethanol 22.730 nd
SAR 3-3 Ethanol 6.786 nd
SAR 3-4 Ethanol 1.523 nd
SAR 3-5 Ethanol 0.364 nd
SAR 3-7.5 Ethanol 0.317 nd
SAR 3-10 Ethanol 0.059 nd
nd: Below HPLC detection limit of 0.1 mg/L
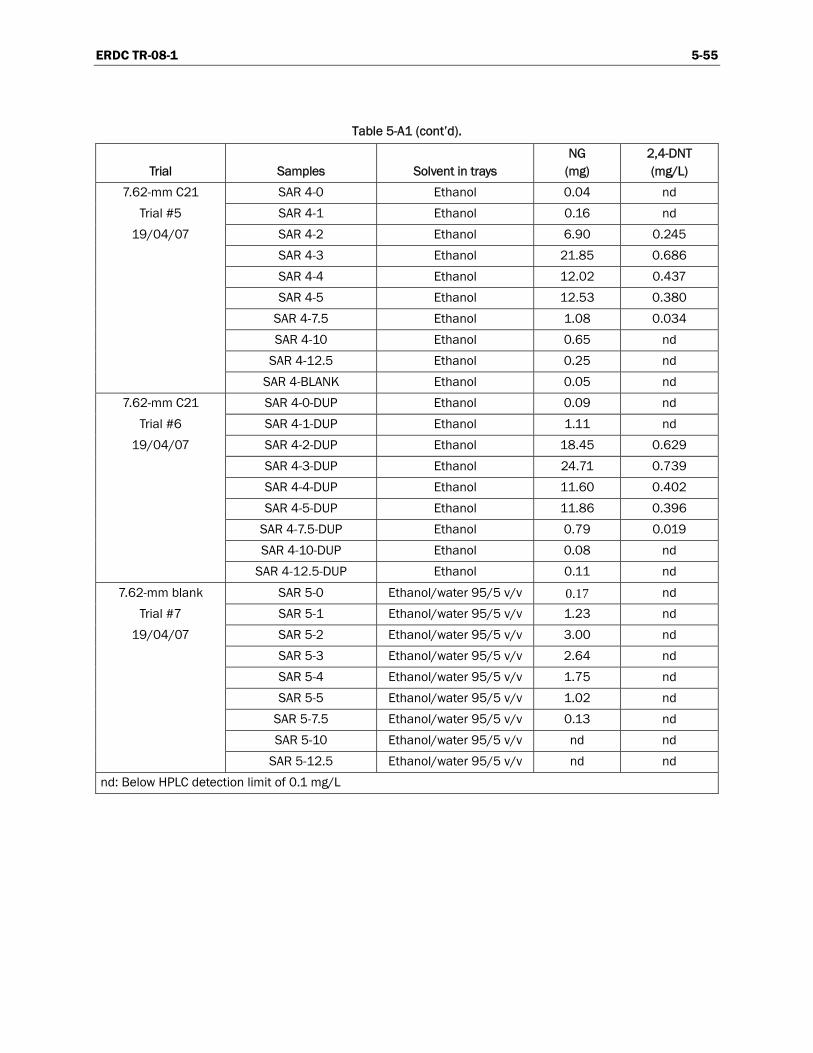
ERDC TR-08-1 5-55
Table 5-A1 (cont’d).
Trial Samples Solvent in trays NG
(mg) 2,4-DNT (mg/L)
7.62-mm C21 SAR 4-0 Ethanol 0.04 nd
Trial #5 SAR 4-1 Ethanol 0.16 nd
19/04/07 SAR 4-2 Ethanol 6.90 0.245
SAR 4-3 Ethanol 21.85 0.686
SAR 4-4 Ethanol 12.02 0.437
SAR 4-5 Ethanol 12.53 0.380
SAR 4-7.5 Ethanol 1.08 0.034
SAR 4-10 Ethanol 0.65 nd
SAR 4-12.5 Ethanol 0.25 nd
SAR 4-BLANK Ethanol 0.05 nd
7.62-mm C21 SAR 4-0-DUP Ethanol 0.09 nd
Trial #6 SAR 4-1-DUP Ethanol 1.11 nd
19/04/07 SAR 4-2-DUP Ethanol 18.45 0.629
SAR 4-3-DUP Ethanol 24.71 0.739
SAR 4-4-DUP Ethanol 11.60 0.402
SAR 4-5-DUP Ethanol 11.86 0.396
SAR 4-7.5-DUP Ethanol 0.79 0.019
SAR 4-10-DUP Ethanol 0.08 nd
SAR 4-12.5-DUP Ethanol 0.11 nd
7.62-mm blank SAR 5-0 Ethanol/water 95/5 v/v 0.17 nd
Trial #7 SAR 5-1 Ethanol/water 95/5 v/v 1.23 nd
19/04/07 SAR 5-2 Ethanol/water 95/5 v/v 3.00 nd
SAR 5-3 Ethanol/water 95/5 v/v 2.64 nd
SAR 5-4 Ethanol/water 95/5 v/v 1.75 nd
SAR 5-5 Ethanol/water 95/5 v/v 1.02 nd
SAR 5-7.5 Ethanol/water 95/5 v/v 0.13 nd
SAR 5-10 Ethanol/water 95/5 v/v nd nd
SAR 5-12.5 Ethanol/water 95/5 v/v nd nd
nd: Below HPLC detection limit of 0.1 mg/L
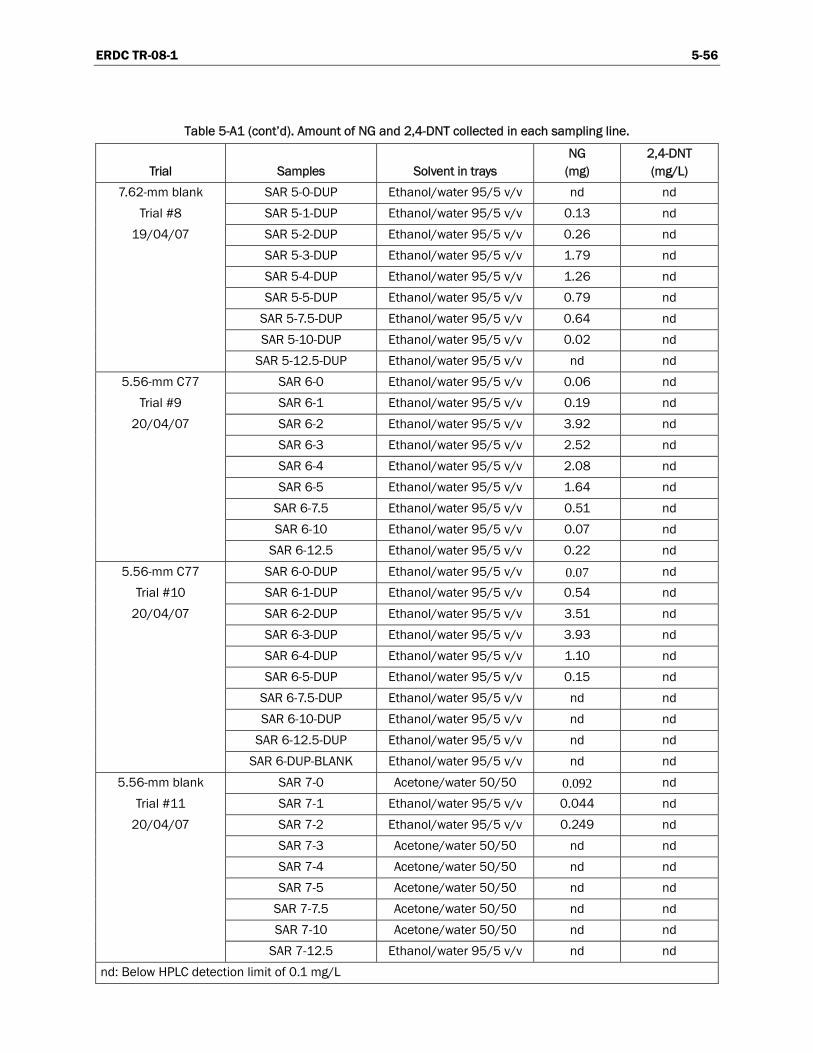
ERDC TR-08-1 5-56
Table 5-A1 (cont’d). Amount of NG and 2,4-DNT collected in each sampling line.
Trial Samples Solvent in trays NG
(mg) 2,4-DNT (mg/L)
7.62-mm blank SAR 5-0-DUP Ethanol/water 95/5 v/v nd nd
Trial #8 SAR 5-1-DUP Ethanol/water 95/5 v/v 0.13 nd
19/04/07 SAR 5-2-DUP Ethanol/water 95/5 v/v 0.26 nd
SAR 5-3-DUP Ethanol/water 95/5 v/v 1.79 nd
SAR 5-4-DUP Ethanol/water 95/5 v/v 1.26 nd
SAR 5-5-DUP Ethanol/water 95/5 v/v 0.79 nd
SAR 5-7.5-DUP Ethanol/water 95/5 v/v 0.64 nd
SAR 5-10-DUP Ethanol/water 95/5 v/v 0.02 nd
SAR 5-12.5-DUP Ethanol/water 95/5 v/v nd nd
5.56-mm C77 SAR 6-0 Ethanol/water 95/5 v/v 0.06 nd
Trial #9 SAR 6-1 Ethanol/water 95/5 v/v 0.19 nd
20/04/07 SAR 6-2 Ethanol/water 95/5 v/v 3.92 nd
SAR 6-3 Ethanol/water 95/5 v/v 2.52 nd
SAR 6-4 Ethanol/water 95/5 v/v 2.08 nd
SAR 6-5 Ethanol/water 95/5 v/v 1.64 nd
SAR 6-7.5 Ethanol/water 95/5 v/v 0.51 nd
SAR 6-10 Ethanol/water 95/5 v/v 0.07 nd
SAR 6-12.5 Ethanol/water 95/5 v/v 0.22 nd
5.56-mm C77 SAR 6-0-DUP Ethanol/water 95/5 v/v 0.07 nd
Trial #10 SAR 6-1-DUP Ethanol/water 95/5 v/v 0.54 nd
20/04/07 SAR 6-2-DUP Ethanol/water 95/5 v/v 3.51 nd
SAR 6-3-DUP Ethanol/water 95/5 v/v 3.93 nd
SAR 6-4-DUP Ethanol/water 95/5 v/v 1.10 nd
SAR 6-5-DUP Ethanol/water 95/5 v/v 0.15 nd
SAR 6-7.5-DUP Ethanol/water 95/5 v/v nd nd
SAR 6-10-DUP Ethanol/water 95/5 v/v nd nd
SAR 6-12.5-DUP Ethanol/water 95/5 v/v nd nd
SAR 6-DUP-BLANK Ethanol/water 95/5 v/v nd nd
5.56-mm blank SAR 7-0 Acetone/water 50/50 0.092 nd
Trial #11 SAR 7-1 Ethanol/water 95/5 v/v 0.044 nd
20/04/07 SAR 7-2 Ethanol/water 95/5 v/v 0.249 nd
SAR 7-3 Acetone/water 50/50 nd nd
SAR 7-4 Acetone/water 50/50 nd nd
SAR 7-5 Acetone/water 50/50 nd nd
SAR 7-7.5 Acetone/water 50/50 nd nd
SAR 7-10 Acetone/water 50/50 nd nd
SAR 7-12.5 Ethanol/water 95/5 v/v nd nd
nd: Below HPLC detection limit of 0.1 mg/L
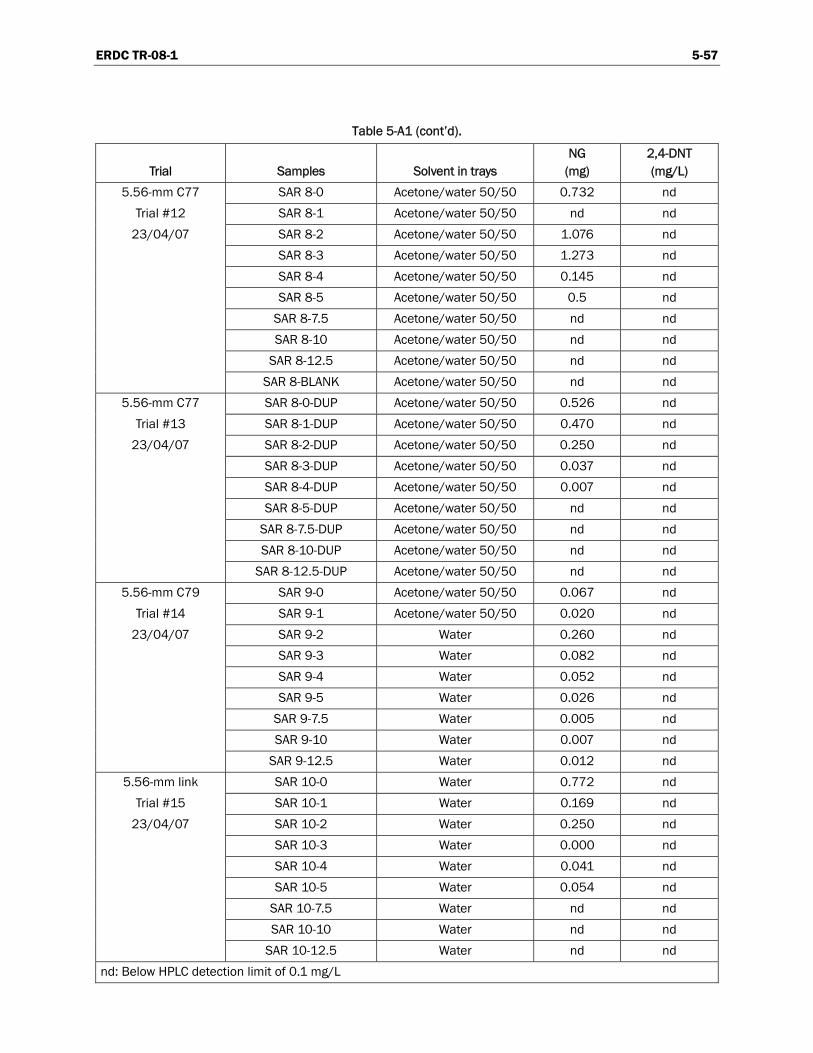
ERDC TR-08-1 5-57
Table 5-A1 (cont’d).
Trial Samples Solvent in trays NG
(mg) 2,4-DNT (mg/L)
5.56-mm C77 SAR 8-0 Acetone/water 50/50 0.732 nd
Trial #12 SAR 8-1 Acetone/water 50/50 nd nd
23/04/07 SAR 8-2 Acetone/water 50/50 1.076 nd
SAR 8-3 Acetone/water 50/50 1.273 nd
SAR 8-4 Acetone/water 50/50 0.145 nd
SAR 8-5 Acetone/water 50/50 0.5 nd
SAR 8-7.5 Acetone/water 50/50 nd nd
SAR 8-10 Acetone/water 50/50 nd nd
SAR 8-12.5 Acetone/water 50/50 nd nd
SAR 8-BLANK Acetone/water 50/50 nd nd
5.56-mm C77 SAR 8-0-DUP Acetone/water 50/50 0.526 nd
Trial #13 SAR 8-1-DUP Acetone/water 50/50 0.470 nd
23/04/07 SAR 8-2-DUP Acetone/water 50/50 0.250 nd
SAR 8-3-DUP Acetone/water 50/50 0.037 nd
SAR 8-4-DUP Acetone/water 50/50 0.007 nd
SAR 8-5-DUP Acetone/water 50/50 nd nd
SAR 8-7.5-DUP Acetone/water 50/50 nd nd
SAR 8-10-DUP Acetone/water 50/50 nd nd
SAR 8-12.5-DUP Acetone/water 50/50 nd nd
5.56-mm C79 SAR 9-0 Acetone/water 50/50 0.067 nd
Trial #14 SAR 9-1 Acetone/water 50/50 0.020 nd
23/04/07 SAR 9-2 Water 0.260 nd
SAR 9-3 Water 0.082 nd
SAR 9-4 Water 0.052 nd
SAR 9-5 Water 0.026 nd
SAR 9-7.5 Water 0.005 nd
SAR 9-10 Water 0.007 nd
SAR 9-12.5 Water 0.012 nd
5.56-mm link SAR 10-0 Water 0.772 nd
Trial #15 SAR 10-1 Water 0.169 nd
23/04/07 SAR 10-2 Water 0.250 nd
SAR 10-3 Water 0.000 nd
SAR 10-4 Water 0.041 nd
SAR 10-5 Water 0.054 nd
SAR 10-7.5 Water nd nd
SAR 10-10 Water nd nd
SAR 10-12.5 Water nd nd
nd: Below HPLC detection limit of 0.1 mg/L

ERDC TR-08-1 5-58
Table 5-A1 (cont’d). Amount of NG and 2,4-DNT collected in each sampling line.
Trial Samples Solvent in trays NG
(mg) 2,4-DNT (mg/L)
5.56-mm link blank SAR 11-0 Water 0.020 nd
Trial #16 SAR 11-1 Water 0.023 nd
23/04/07 SAR 11-2 Water 0.020 nd
SAR 11-3 Water 0.000 nd
SAR 11-4 Water 0.039 nd
SAR 11-5 Water 0.019 nd
SAR 11-7.5 Water 0.019 nd
SAR 11-10 Water 0.015 nd
SAR 11-12.5 Water nd nd
9-mm frangible SAR 12-0 Ethanol 0.505 nd
Trial #17 SAR 12-1 Ethanol 6.152 nd
24/0407 SAR 12-2 Ethanol 14.295 nd
SAR 12-3 Ethanol 8.187 nd
SAR 12-4 Ethanol 1.453 nd
SAR 12-5 Ethanol 0.208 nd
SAR 12-7.5 Ethanol 0.110 nd
SAR 12-10 Ethanol 0.012 nd
SAR 12-12.5 Ethanol nd nd
5.56-mm frangible SAR 13-0 Ethanol 0.025 nd
Trial #18 SAR 13-1 Ethanol 0.927 nd
24/0407 SAR 13-2 Ethanol 6.067 nd
SAR 13-3 Ethanol 15.815 nd
SAR 13-4 Ethanol 4.617 nd
SAR 13-5 Ethanol 4.426 nd
SAR 13-7.5 Ethanol 0.251 nd
SAR 13-10 Ethanol nd nd
SAR 13-12.5 Ethanol nd nd
9-mm Mk1 SAR 1-0-TRI Ethanol 0.806 nd
Trial #19 SAR 1-1-TRI Ethanol 9.006 nd
24/0407 SAR 1-2-TRI Ethanol 1.474 nd
SAR 1-3-TRI Ethanol 0.484 nd
SAR 1-4-TRI Ethanol 0.083 nd
SAR 1-5-TRI Ethanol nd nd
SAR 1-7.5-TRI Ethanol nd nd
SAR 1-10-TRI Ethanol nd nd
SAR 1-12.5-TRI Ethanol nd nd
nd: Below HPLC detection limit of 0.1 mg/L

ERDC TR-08-1 5-59
Table 5-A1 (cont’d).
Trial Samples Solvent in trays NG
(mg) 2,4-DNT (mg/L)
.50-cal M2 SAR 14-0 Ethanol 0.039 nd
Trial #20 SAR 14-1 Ethanol 1.919 nd
24/0407 SAR 14-2 Ethanol 5.073 nd
SAR 14-3 Ethanol 1.578 nd
SAR 14-4 Ethanol 1.009 nd
SAR 14-5 Ethanol 0.113 nd
SAR 14-7.5 Ethanol 0.008 nd
SAR 14-10 Ethanol nd nd
SAR 14-12.5 Ethanol nd nd
SAR 14-15 Ethanol nd nd
.50-cal M2 SAR 15-0 Ethanol nd nd
Trial #21 SAR 15-1 Ethanol 0.334 nd
25/04/07 SAR 15-3 Ethanol 2.362 nd
SAR 15-5 Ethanol 0.678 nd
SAR 15-7.5 Ethanol 0.077 nd
SAR 15-10 Ethanol nd nd
SAR 15-12.5 Ethanol nd nd
SAR 15-15 Ethanol nd nd
SAR 15-20 Ethanol nd nd
SAR 15-25 Ethanol nd nd
SAR 15-BLANK Ethanol nd nd
.338 cal SAR 16-0 Ethanol 0.187 nd
Trial #22 SAR 16-1 Ethanol 0.057 nd
25/04/07 SAR 16-2 Ethanol 0.228 nd
SAR 16-3 Ethanol 0.149 nd
SAR 16-4 Ethanol 0.118 nd
SAR 16-5 Ethanol 0.038 nd
SAR 16-7.5 Ethanol nd nd
SAR 16-10 Ethanol 0.038 nd
.50 cal SAR 17-0 Ethanol 1.828 nd
Trial #23 SAR 17-1 Ethanol 3.305 nd
25/04/07 SAR 17-2 Ethanol 2.368 nd
SAR 17-3 Ethanol 1.112 nd
SAR 17-4 Ethanol 0.274 nd
SAR 17-5 Ethanol 0.016 nd
SAR 17-7.5 Ethanol nd nd
SAR 17-10 Ethanol nd nd
nd: Below HPLC detection limit of 0.1 mg/L

ERDC TR-08-1 5-60
Appendix 5-B: Calculation of the Total Amount of NG (or 2,4-DNT) Dispersed per Round Shot
Step 1. Calculation of the concentration of NG (or 2,4-DNT) in the area sampled.
Each trap used for sampling is represented as a rectangle of width 0.35 m and length 0.45 m. The area of each particle trap (Atrap) is Atrap = 0.35 m × 0.45 m = 0.1575 m2
The sampling setup can be represented by Figure 5-B1 (values presented for Trial #1).
Traps were placed at a distance i from the muzzle of the gun.
For example, in trial #1, i = 0, 1, 2, 3, 4, 5, 7.5, 10 m.
The number of traps at a distance i (Ntraps i ) varies from one trial to another.
For example, in trial #1, Ntraps 0 = 3 and Ntraps 1 = 7.
The area sampled (As i) is defined by As i = (Atrap)(Ntraps i).
For example, in trial #1, As 0 = (0.1575m2)(3) = 0.4725 m2, and As 1 = (0.1575m2)(7) = 1.1025 m2.
The samples in the traps placed at a distance i were combined for analysis by HPLC, and the mass of NG for these traps at this distance i (MNG traps i) was obtained.
The concentration of NG in the area sampled (CNG i) is defined as CNG i = (MNG traps i)/(As i).
For example, in trial #1, CNG 0 = (MNG traps 0) (As 0) = (6.273 mg)/(0.4725 m2) = 13.276 mg/m2, and CNG 1 = (MNG traps 1) (As 1) = (9.426 mg)/(1.1025 m2) = 8.550 mg/m2.

ERDC TR-08-1 5-61
Figure 5-B1. Sampling setup.

ERDC TR-08-1 5-62
Step 2. Calculation of the mass of NG on the lines.
The concentration of NG calculated for the area sampled is considered to be the same for the area (At) that is defined by a rectangle that encircles all the traps at a distance i, as represented in yellow on the previous scheme. This area will be called “line.” It is constant for all the distances i in a spe-cific trial (t). It varies between trial (t), as the maximum Ntraps i varies. The length of this line is the length of the sampling trap (0.35 m) and because there is 1 m between the center of two consecutive traps, its width (Wt) is defined as Wt = (max Ntraps i) –1) + 0.45 m.
For example, in trial #1, the max Ntraps i is 7, thus the width of the line is W1 = (7 – 1) + 0.45 m = 6.45 m.
For each trial, the area (At) of the lines is At = (0.35 m) (Wt).
For example, in trial #1, A1 = (0.35 m) (6.45 m) = 2.2575 m2.
Knowing the concentration of NG on the line, the mass of NG (MNG i) on the line i is calculated as (MNG i) = (CNG i) (At).
For example in trial #1, for the line at 0 m, (MNG 0) = (13.276 mg/m2) (2.2575m2) = 29.97 mg.
Step 3. Calculation of the intermediate area (unsampled) between two consecutives lines i and j.
A large area was not sampled between the lines i and j, as shown in pink in Figure 5-B1. These intermediates lines have the same width (Wt) as the lines i, and their length varies upon the distance between the lines i and j.
For example, it is clear on the scheme that the pink area is larger between the lines at 7.5 and 10 m than between the 0- and 1-m lines.
The length (Lint. i–j) of the area between the lines i and j is Lint. i–j = (j – (i + 0.35).
For example, in trial #1, between the lines at 0 and 1 m, the length of the rectangle is Lint. 0–1 = 1 – (0 + 0.35m) = 0.65 m.

ERDC TR-08-1 5-63
Between the lines at 5 and 7.5 m, Lint. 5–7.5 = 7.5 – (5 + 0.35m) = 2.15 m.
The area of these intermediates lines (Aint i–j) is defined as Aint. i–j = (Lint. i–j) (Wt).
For example, in trial #1 between the lines at 0 and 1 m, Aint. 0–1 = (0.65 m) (6.45 m) = 4.1925 m2. Between the lines at 5 and 7.5 m, Aint. 5–7.5 = (2.15 m) (6.45 m) = 13.8675 m2.
Note that there is no area after the last line i; for example in trial #1, the last sampled line is at 10 m, so no area was calculated after this line.
Step 4. Calculation of the mass of NG on the intermediate lines.
The concentration of NG on the area Aint. i–j (CNG int. i–j) is supposed to be the mean of the concentration of the two adjacent lines, i and j: CNG int. i–j = (CNG i + CNG j)/2.
For example, in trial #1, the concentration of NG in the area between the lines at 0 and 1 m is the mean of the concentrations of NG in line at 0 m and at 1 m.
CNG int. 0–1 = (CNG 0 + CNG 1)/2 = (13.276 mg/m2 + 8.550 mg/m2)/2 = 10.913 mg/m2.
Between the lines at 5 and 7.5 m, CNG int. 5–7.5 = CNG 5 + CNG 7.5)/2 = (1.21 mg/m2 + 0.10 mg/m2)/2 = 0.66 mg/m2.
The mass on NG on the intermediate lines (MNG int. i–j) is calculated as MNG
int. i–j = (CNG int. i–j)(Aint. i–j).
For example, in trial #1, the mass of NG in the area between lines at 0 and 1 m is MNG int. 0–1 = (CNG int. 0–1)(Aint. i–j) = (10.913 mg/m2) (4.1925m2) = 45.75 mg.
The mass of NG in the area between the lines at 5 and 7.5 m is MNG int. 5–7.5 = (CNG int. 5–7.5)(Aint. 5–7.5) = (0.66 mg/m2) (13.8675m2) = 9.1 mg.
ERDC TR-08-1 5-64
Step 5. Calculation of the total mass of NG deposited on the ground per round.
The total mass of NG (MNG) for each trial is the total of the discrete values obtained for each line (MNG i) and the intermediate lines (MNG int. i–j): MNG =
∑ MNG i + ∑ MNG int..i–j.
For example, in trial #1, MNG = 284.204 mg.
As the number of rounds shot (R) varies from one trial to another, it is im-portant to calculate the amount of NG emitted on a uniform basis: MNG,
round = (MNG)/(R).
For example, in trial #1, 250 rounds were fired, MNG round = (284.204 mg)/250 = 1.137 mg.

ERDC TR-08-1 5-65
Table 5-B1. Calculated residual quantity of NG on a single-round basis for each trial.
Residual NG/round
Caliber Trial Weapon Round mg %
9 mm 1 Browning pistol MK 1 ball 1.14 2.13
2 Browning pistol MK 1 ball 0.93 1.74
19 Browning pistol MK 1 ball 0.16 0.30
Mean 0.74 1.39
17 Sig Sauer P225 Greenshield frangible 0.95 1.97
4 Sig Sauer P225 Luger 115 FMJ ball 2.03 3.90
7.62 mm 5 C6 machine gun
C21/C19 ball link 4 ball/1 tr* 0.90 1.26
6 C6 machine gun C21/C19 ball link
4 ball/1 tr* 1.05 1.46
Mean 0.98 1.36
7 C6 machine gun C24 Blank link 0.15 0.11
8 C6 machine gun C24 Blank link 0.17 0.12
Mean 0.16 0.11
5.56 mm 15 C9 light machine gun
C77/C78 Ball link 4 ball/1 tr 0.05 0.03
16 C9 light machine gun C79A1 Blank link 0.01 0.01
18 C7 automatic rifle Greenshield frangible 1.06 0.62
9 C7 automatic rifle C77 Ball clips 0.35 0.23
10 C7 automatic rifle C77 Ball clips 0.25 0.16
Mean 0.30 0.19
11 C7 automatic rifle C79A1 Blank clips 0.02 0.05
12 C8 automatic carbine C77 Ball clips 0.09 0.06
13 C8 automatic carbine C77 Ball clips 0.04 0.03
Mean 0.07 0.04
14 C8 automatic carbine C79A1 Blank clips 0.02 0.06
.50 cal 20 Browning machine gun M2/M17 Link (4 ball/1 tr) 0.29 0.02
21 Browning machine gun M2/M17 Link (4 ball/1 tr) 0.21 0.02
Mean 0.25 0.02
23 McMillan Rifle AAA750 Hodgdon
H50BMG 0.27 0.02
.338 cal 22 Timberwolf sniper rifle Match B406 0.03 0.001
* 2,4-DNT was detected only for C21/C19 7.62 mm fired with C6 (0.028 and 0.033 mg per round, mean 0.031 mg/round).
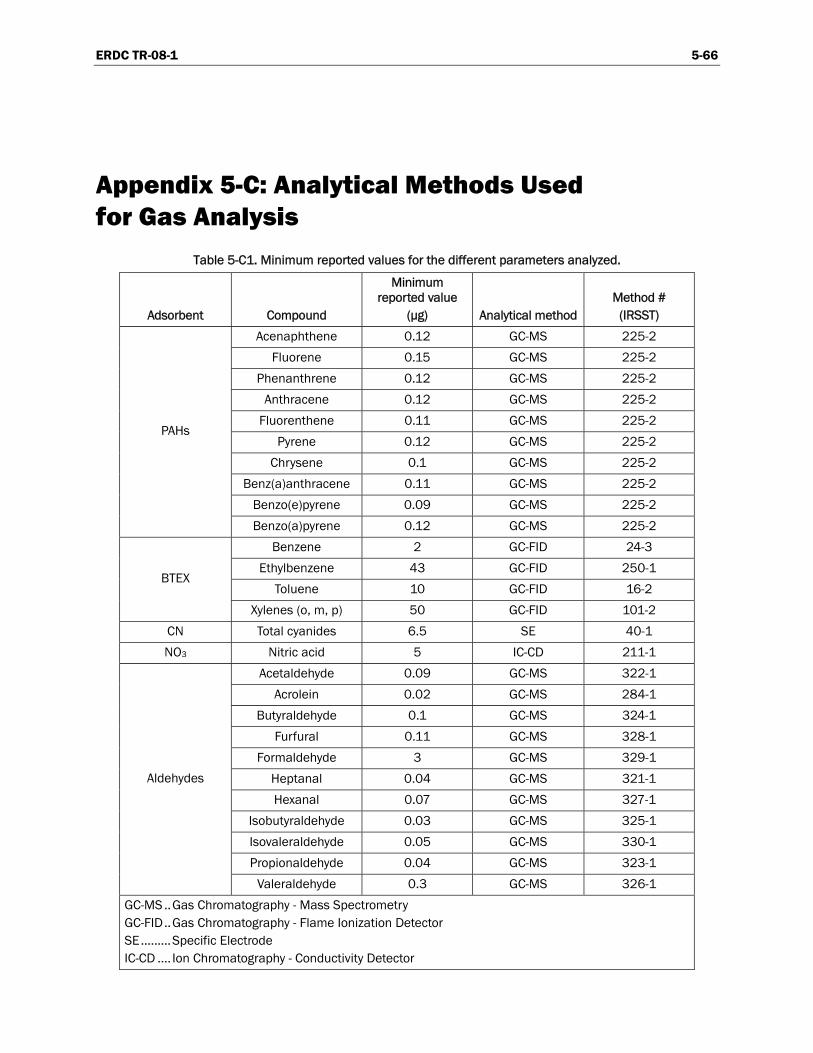
ERDC TR-08-1 5-66
Appendix 5-C: Analytical Methods Used for Gas Analysis
Table 5-C1. Minimum reported values for the different parameters analyzed.
Adsorbent Compound
Minimum reported value
(µg) Analytical method Method #
(IRSST)
Acenaphthene 0.12 GC-MS 225-2
Fluorene 0.15 GC-MS 225-2
Phenanthrene 0.12 GC-MS 225-2
Anthracene 0.12 GC-MS 225-2
Fluorenthene 0.11 GC-MS 225-2
Pyrene 0.12 GC-MS 225-2
Chrysene 0.1 GC-MS 225-2
Benz(a)anthracene 0.11 GC-MS 225-2
Benzo(e)pyrene 0.09 GC-MS 225-2
PAHs
Benzo(a)pyrene 0.12 GC-MS 225-2
Benzene 2 GC-FID 24-3
Ethylbenzene 43 GC-FID 250-1
Toluene 10 GC-FID 16-2 BTEX
Xylenes (o, m, p) 50 GC-FID 101-2
CN Total cyanides 6.5 SE 40-1
NO3 Nitric acid 5 IC-CD 211-1
Acetaldehyde 0.09 GC-MS 322-1
Acrolein 0.02 GC-MS 284-1
Butyraldehyde 0.1 GC-MS 324-1
Furfural 0.11 GC-MS 328-1
Formaldehyde 3 GC-MS 329-1
Heptanal 0.04 GC-MS 321-1
Hexanal 0.07 GC-MS 327-1
Isobutyraldehyde 0.03 GC-MS 325-1
Isovaleraldehyde 0.05 GC-MS 330-1
Propionaldehyde 0.04 GC-MS 323-1
Aldehydes
Valeraldehyde 0.3 GC-MS 326-1
GC-MS ..Gas Chromatography - Mass Spectrometry GC-FID..Gas Chromatography - Flame Ionization Detector SE.........Specific Electrode IC-CD .... Ion Chromatography - Conductivity Detector

ERDC TR-08-1 5-67
Appendix 5-D: EDX Spectra for Particulate Matter Analysis
Figure 5-D1. EDX spectrum of large (> 5 µm) particles in Figure 5-21c.
Figure 5-D2. EDX spectrum of small (< 5 µm) particles in Figure 5-21c.

ERDC TR-08-1 5-68
Figure 5-D3. EDX spectrum of the particle shown by the red arrow in Figure 5-23.
Figure 5-D4. Typical EDX spectrum of the small particles (< 3 µm) in Figure 5-23.

ERDC TR-08-1 5-69
Figure 5-D5. Typical EDX spectrum of a small particle (< 1 µm) in Figure 5-24b.

THIS PAGE IS INTENTIONALLY BLANK.
ERDC TR-08-1 6-1
— Chapter 6 —
Study of Propellant Residues Emitted During 105-mm Leopard Tank Live Firing
and Sampling of Demolition Ranges at CFB Gagetown, Canada
GUY AMPLEMAN, SONIA THIBOUTOT, ANDRÉ MAROIS, ANNIE GAGNON, AND MAJOR DENIS GILBERT
Abstract
The accumulation of propellant residues at firing positions represents a concern both for the environment and human health. In order to better assess the impacts of each activity, a series of tests has been conducted to measure the deposition of propellant residues from many sources. The present study was conducted with a Leopard tank firing 105-mm tank gun ammunition; DRDC Valcartier assessed particles emitted and also the gaseous emissions and the particle size distribution during the live firing at CFB Gagetown. Gases were collected in front of and inside the tank and the results from the gaseous emissions study will be described in another report. This chapter describes the results obtained on the projection of solid particles during tank live firing. Particle traps were initially installed at 5, 10, 15, 20, 30, 40, and 50 m in front of the tank, and paper towels soaked with ethanol were placed inside the traps to improve the adherence of the projected particles. No propellant residues were detected in any of the particle traps. After the firing of four rounds, the first two rows of par-ticle traps were destroyed. Our setup was not efficient at collecting the par-ticles as many traps were lost, but we may still summarize that firing 105-mm tank gun ammunition does not lead to the accumulation of solid pro-pellant residues in the vicinity of the gun. Another trial should be con-

ERDC TR-08-1 6-2
ducted to confirm these results by using traps that will resist the blast. An-other important source term of explosives and propellant residues in train-ing ranges are demolition ranges. Two demo ranges were sampled while on site. Soils were collected in the Drummond and the South Boundary Demolition Ranges. At the Drummond Demolition Range, explosives were detected in all samples. HMX, RDX, TNT, NG, and 2,4-DNT were detected at concentrations up to 0.73, 0.53, 0.27, 1.45, and 0.71 ppm, respectively. At the South Boundary Demolition Range, explosives were detected at higher concentrations with a maximum of 234 ppm for TNT. This paper describes the sampling strategy, the laboratory procedure, and the results obtained.
L’accumulation de résidus de propergol aux positions de tir représente une source de préoccupation tant pour l’environnement que pour la santé humaine. Afin de mieux évaluer les impacts de chaque activité, une série d’essais a été effectuée pour mesurer la déposition de résidus de propergol provenant de nombreuses sources. La présente étude a été réalisée avec un char d’assaut Léopard faisant feu avec des obus de 105 mm, et RDDC Val-cartier a évalué la dispersion des particules émises ainsi que les émissions de gaz et la distribution granulométrique des particules durant le tir réel. Les gaz ont été recueillis à l’avant et à l’intérieur du char d’assaut et ces résultats des émissions gazeuses seront décrit dans un autre rapport. Ce chapitre décrit les résultats obtenus sur la projection de particules solides durant les tirs réels effectués par le char d’assaut. Des pièges à particules ont été installés à 5, 10, 15, 20, 30, 40, et 50 m en avant du char d’assaut et des serviettes en papier imbibées d’éthanol ont été placées dans ces pièges pour améliorer l’adhésion des particules. Aucun résidu de propergol n’a été détecté dans aucun des pièges à particules. Après le tir de quatre obus, les deux premières rangées de pièges à particules ont été détruites. Notre installation n’a pas été très efficace à capter les particules compte tenu que bien des pièges ont été perdus, mais malgré tout, nous pouvons conclure que le tir de munitions de 105 mm de char d’assaut ne conduit pas à l’ac-cumulation de résidus de propergol solide dans l’environnement. Un autre essai devra être effectué pour confirmer ces résultats en utilisant des pièges qui résisteront au souffle du tir. Une autre source importante d’explosifs et de résidus de propergol dans les aires d’entrainement provi-ent des secteurs de démolition. Étant sur place, deux secteurs de démoli-tion ont été échantillonnés. Les sols ont été prélevés dans les secteurs de démolition Drummond et frontière sud. Au secteur Drummond, des ex-plosifs ont été détectés dans tous les échantillons. HMX, RDX, TNT, NG,

ERDC TR-08-1 6-3
et 2,4-DNT ont été détectés à des concentrations respectives de 0,73, 0,53, 0,27, 1,45, et 0,71 ppm. Au secteru de démolition frontière sud, des ex-plosifs ont été détectés à des concentrations plus élevées allant jusqu’à un maximum de 234 ppm pour le TNT. Ce document décrit la stratégie d’échantillonnage, la méthode de laboratoire, et les résultats obtenus.

ERDC TR-08-1 6-4
Introduction
For many years, DRDC Valcartier has been involved in the evaluation of the environmental impacts of live-fire training to characterize and mitigate adverse effects on training ranges and thereby sustain the military activi-ties [1]. Over the years, many efforts were conducted to assess the envi-ronmental loading of explosives at most of the Canadian Forces bases (CFB). To date, these efforts addressed mainly heavily used target areas [2–10]. Many of these studies were conducted in collaboration with the US Army Corps of Engineers, Cold Regions Research and Engineering Labo-ratory (CRREL), in Hanover, New Hampshire, and the Environmental Laboratory (EL) in Vicksburg, Mississippi [7, 11–14]. Walsh et al. (2001) observed that the firing positions were also experiencing a buildup of en-ergetic residues, and since then, many studies have been dedicated to the characterization of the firing positions [13, 15–16]. It was determined that NG and/or 2,4-dinitrotoluene (2,4-DNT) embedded in nitrocellulose fi-bers are deposited in front of and around firing positions [5, 15–17]. More-over, it is a common practice in Canada to burn directly on the ground ex-cess propellant bags that are removed from the munitions to adjust the ballistic parameters. This practice results in an improper incomplete com-bustion of the propellants, therefore leaving high concentrations of propel-lant chemicals in the soil. This practice is being assessed by DRDC Valcar-tier and Director Land Environment and hopefully will soon be replaced by an environmental alternative.
Two years ago, DRDC Valcartier assessed the dispersion of propellant residues following 105-mm artillery and tank gun firings at CFB Valcartier by placing aluminum witness plates in front of the muzzles of the guns [18]. At CRREL, similar trials were conducted using snow as a collection media [19]. Both studies demonstrated that propellant residues composed of nitrocellulose fibers containing 2,4-DNT were deposited in front of the muzzle of artillery guns, but no residues were found after firing tank am-munition in Valcartier [18]. More recently, Walsh et al. studied residues at mortar firing positions [20]. NG was found at elevated concentrations for 81-mm mortars.
During the DRDC trial in CFB Valcartier, it came to our attention that gunners often suffered from headaches after gun-firing exercises. Fur-
ERDC TR-08-1 6-5
thermore, in some case the headaches persisted for days and their body fluids smelled of gunpowder for days following artillery training exercises. One potential explanation is the intake of chemicals by the gunners during the exercise. This study was undertaken to further investigate the emission of propellant particles and gases in the area where gunners normally stand while firing. Of particular interest is the size of the particles emitted during the firing, since sub-micron particles represent an adverse impact for hu-man health.
Our first attempts to collect emissions from live-firing exercises were compromised (poor recoveries) by windy conditions [18]. In September 2006, a study was conducted using the muffler facility at Nicolet, Lac St-Pierre, Canada. The 105-mm squash head practice, C60, fired with a how-itzer C3 gun, was evaluated in this study and it was demonstrated that studies conducted in the muffler were very effective at sampling particles and the gases. Sub-micron particles, toxic gases, and 2,4-DNT were identi-fied and it was concluded that up to 0.39% of 2,4-DNT are ejected into the environment [21, 22, Chapter 7]. Results also indicated that the gunners’ positions are exposed to high concentrations of 2,4-DNT when firing the Howitzer gun.
Considering that tank gunners can be exposed to gases inside the turret and because of the growing interest for the contamination of firing posi-tions, it was decided to re-investigate the tank 105-mm gun live firing. Par-ticle traps were installed in front of the tank and gases pumping systems were installed in front of and inside the Leopard tank. A different pattern was used to collect the particles in front of the tank. Practice rounds were fired for an entire day and two sets of samples were collected at the end of the afternoon.
In parallel to the propellant emission study, it was decided to sample the Gagetown demolition ranges that were not sampled in past studies. Previ-ous studies indicated that demolition ranges are often contaminated with energetic materials [2, 10]. In CFB Chilliwack, it was found that in the demolition range, the cratering, wood, concrete, steel cutting, and demoli-tion pad areas were contaminated with energetic materials [10]. The demolition range in CFB Petawawa was also sampled and contamination by explosives was found [2]. During the Gagetown sampling campaigns, the Drummond and South Boundary Demolition ranges were not available for sampling and were neglected. It was decided to sample them during

ERDC TR-08-1 6-6
this study since they were available. In the Drummond Demolition Range, mostly cratering was conducted and samples were collected in triplicate. In the South Boundary Demolition Range, samples were collected to evaluate the wood, concrete, steel, and demolition pad areas. Moreover, a new facility to simulate urban warfare was recently built on this range and this was sampled as well. This paper describes the results of both studies. This work was co-funded by the Sustain Trust from Defence Research and Development Canada and by the Strategic Environmental Research and Development Program of the United States through project ER 1481, and was conducted in April 2007.

ERDC TR-08-1 6-7
Background
Logistics
The trial was organized and conducted in CFB Gagetown during a course for tank users (Tank Commander 0701B). A Leopard tank was used to fire 105-mm practice rounds in the anti-armor range, at Firing Position 4, and propellant residues were collected using particle traps containing ethanol to improve the adherence of the propellant residues. To minimize distur-bances to the military exercises, pans were installed before and removed after the firings. At noon, after 10 rounds were fired, traps that were de-stroyed were removed and another series of traps (labelled T2) was in-stalled near the one already in place in the rows farther away (labelled T1) to obtain a larger sampling area. DRDC Valcartier collected the contents of the traps at 6:00 PM after 69 additional rounds were fired, for a total number of 79 rounds fired in the entire day. Gaseous emissions were also collected during the day and results will be reported in a subsequent paper.
Equipment and Munitions
The 105-mm tank gun is the main armament of the Leopard C2 Main Bat-tle Tank (Fig. 6-1). This tank provides close and direct fire support and anti-tank defence for the mechanized battle group. The turret of the Leop-ard tank is the spaced armor, welded type and carries a crew of three: the Commander, the Gunner and the Loader. The main armament consists of the 105-mm QF gun, either the British L7A3 or the American M68, with semi-automatic, horizontal sliding breechblock. The tube is 51 calibers in length and is equipped with a bore evacuator (fume extractor) and a ther-mal tube jacket. The barrel is rifled for 471 cm (185.5 in.) with a uniform twist of one turn in 18 calibers. The fire control equipment for this system is the SABCA TFCS with laser range finder.
All ammunition for the 105-mm gun, with the exception of the blank car-tridge, is of the “fixed” type (Fig. 6-2). Operational ammunition consists of three types: Armor Piercing Fin Stabilized Discarding Sabot (APFSDS), Smoke White Phosphorus (WP), and High Explosive Squash Head (HESH); practice (training) ammunition consists of Short Range Target Practice Discarding Sabot (SRTPDS), Target Practice Fin Stabilized Dis-

ERDC TR-08-1 6-8
carding Sabot (TPFSDS), Squash Head Practice (SH Practice), and Blank. The Leopard C2 tank can carry 59 rounds of ammunition. Most of these rounds contain a tracer composition to help aim at the target; these 105-mm rounds have a T at the end of their name. As an example, APFSDS-T would be the operational weapon containing the tracer composition.
Figure 6-1. Leopard C2 main battle tank.
Mainly there are two types of attacking weapons, the armor piercing (sabot type) and the squash head. The smoke white phosphorus produces a pro-tective screen smoke. For the operational APFSDS-T, three models exist. The first one is available with three different cartridge contents, the sec-ond is the Canadian version APFSDS-T, C-76 that is based on US design APFSDS-T M735, and the third is the APFSDS-T M428 (SWORD) that has a longer length for the penetrator. Roughly, they all have the same design but differ in some characteristics such as propellant loading, type of ig-niter, length of the penetrator, etc. As an example, the first APFSDS-T model is available with three different cartridges, M111, DM23A1, and DM63C, which all incorporate a fin-stabilized, kinetic energy, armor pierc-ing, discarding sabot shot with tracer. The projectiles, when fired, have a flat trajectory, together with muzzle velocities in the 1,450 to 1,500 m/s

ERDC TR-08-1 6-9
range at a maximum range of 26,000 m and utilize their high striking energy alone to defeat heavily armored targets.
Figure 6-2. Representations of all 105-mm tank gun ammunition.

ERDC TR-08-1 6-10
The typical armor piercing weapons (M111, DM23A1) projectile (Fig. 6-3, 6-4) consists of a three-segment aluminum alloy sabot and a swaged high-density monobloc tungsten alloy penetrator core of high length-to-diameter ratio. A six-finned aluminum fin assembly is fitted to the rear of the penetrator rod and contains a tracer element that burns for at least 3.5 seconds after firing. The three 120° sabot segments are held together and are discarded by blast and air pressure after the projectile leaves the gun tube, leaving the sub-projectile core free to continue at a high velocity in a flat trajectory to the target.
Figure 6-3. Projectiles of the armor piercing weapons (APFSDC-T).

ERDC TR-08-1 6-11
Figure 6-4. Different designs for the APFSDS-T.
The charges are loose-loaded to the maximum capacity of the case and consist of 5.8 kg of M30M multi-perforated triple-base propellant (M111, DM23A1), or 6.0 kg of M26 multi-perforated double-base propellant (DM63C). The tracers used with these rounds consist of 2.5 g of igniter composition and 8.5 g of tracer composition contained in a brass cup.
The DM63C version is a product improvement of the DM23AI. Changes include a longer L/D ratio for the projectile, M26 double-base propellant instead of triple-base M30M, and improved design for the primer. The penetrator’s shape was designed to achieve high kinetic energy coupled with a small impact area in order to obtain better penetration perform-ance. The maximum range for that weapon is 27,500 m at 10° gun eleva-tion. These new, longer projectile designs can be seen in Figure 6-4 where the DM 63 C and the latest version, APFSDS-T M428 (SWORD), are seen on the right side of the picture. The charge propelling and the type of pro-pellant for all the 105-mm tank gun ammunition can be found in Table 6-1.
The practice versions of the armor piercing weapon are the TP/FSDS-T, C71, and the SR/TPDS-T, C148 (Fig. 6-5). The C71 consists of a sub-caliber tubular projectile made of heat-treated steel with a flat nose with a dis-carding sabot, and has a greatly reduced range. The C71 shot has a muzzle

ERDC TR-08-1 6-12
velocity of 1,590 m/s and is a ballistic match with the APFSDS C76 round up to 3,000 m. Beyond 3,000 m, the projectile becomes unstable due to aerodynamic action of three spin damping fins, thus limiting the maxi-mum range to 8,000 m at 10° gun elevation. This allows practice in ranges considering the security area of this live-fire activity. Training with triple-base propelled operational weapons is not possible in CFB Gagetown be-cause the safety template needed to fire these weapons is larger than the one available in this training area. It would have been interesting to sam-ple a live firing event involving triple-base propellants, but these types of weapons can be fired only in CFB Suffield where the safety templates can be obtained. The British army is firing triple-base weapons in CFB Suffield and discussions are being held to conduct sampling during one of their ac-tivities.
Table 6-1. 105-mm tank gun ammunition propelling charges.
Ammunition Weight of propellants
(g) Type of propellants
APFSDS-T, M111 5800 M30 triple base
APFSDS-T, DM23A1 5800 M30 triple base
APFSDS-T, DM63C 6000 M26 double base
APFSDS-T, C76 5350 NQ/M triple base
APFSDS-T, M428 5800 M26 double base
HESH-T, L35 2857 M1 single base
WP-T M416* 2780 M1 single base
SR/TPDS-T, C148* 5120 M6 single base
TP/FSDS-T, C71* 5075 M6 single base
SH/PRACT, C109* 3000 M1 single base
* Ammunition studied in this report
The practice SR/TPDS-T, C148, was developed as a joint DRDC Valcartier project with SNC Tec to modify the earlier design C71 TPDS projectile technology into an economical round that would match the ballistic trajec-tory of the APFSDS–T shot out to 2,500 m or 8,000 m at 10° gun eleva-tion, but would destabilize at a predetermined velocity to limit the maxi-mum range to impact. Research at DRDC Valcartier determined that a shorter range together with all ballistic requirements could be achieved by adding three small spin damping fins to the rear of the C74 sub-projectile and by modifying the projectile from a solid steel shot to a two part steel/aluminum assembly. The SR/TPDS-T, C148, was the practice weapon that was used in this study (Fig. 6-6).

ERDC TR-08-1 6-13
Figure 6-5. Practice ammunition TP/FSDS-T, C71, and SR/TPDS-T, C148.

ERDC TR-08-1 6-14
Figure 6-6. Practice round SR/TPDS-T, C148.
The second type of attacking weapons is the Squash Head type. The High Explosive Squash Head (HESH-T) cartridge is a base-detonated, thin-walled, high-explosive-filled cartridge of British manufacture, and is de-signed to defeat armoured targets and fortified structures such as concrete emplacements by blast, spalling, and shock wave effect. There are also sec-ondary anti-personnel effects caused by blast and fragmentation. The pro-jectile is spin stabilized and is effective at both large and small angles of attack, and at relatively low striking velocities. The projectile, when fired, has a muzzle velocity of 731 m/s. The charge consists of 2.857 kg of single-base-type M1 NH .033 propellant contained in three longitudinal pockets within a silk cloth bag. A tin/lead foil decoppering strip 298 mm × 178 mm × 0.05 mm thick is sewn inside the bag at the top. The projectile filling consists of approximately 2.1 kg of RDX/WAX 88/12 pressed explosive.
The practice version, the C109 squash-head practice-tracer, is a training round designed as a ballistic match for the current HESH L35 cartridges (Fig. 6-7). The CI09A1 differs from the C109 only in the simplified projec-tile design to reduce production costs. This was the practice weapon that was used in this study (Fig. 6-8). The nominal charge consists of 3.0 kg of

ERDC TR-08-1 6-15
M1 (NH .034) propellant divided into three equal pockets within a viscose rayon cloth bag. A tin/lead foil strip is sewn into the upper section of the bag to act as a decoppering agent. The projectile is similar in external con-figuration to the HESH projectile and contains an inert load of castor-oil-type filler with a density of 1.6 in a plastic container.
Figure 6-7. Representations of HESH-T and SH/Pract ammunition.
The smoke 105-mm tank ammunition WP-T M416 is the same weapon used in operations or in practice. The M416 cartridge is a fixed round in-tended for screening and spotting fire from 105-mm gun canons. There is some limited incendiary effect. The projectile when fired has a muzzle ve-locity of 730 m/s. The propelling charge consists of 2.78 kg of M1 (NH .034) Type 1 propellant divided into three equal increments and filled into the three pockets of a silk cloth bag. Decoppering lead foil is sewn into the bag during manufacture. The steel projectile is loaded with 2.7 kg of white phosphorus (Fig. 6-9). The maximum range for this weapon is 9,150 m.

ERDC TR-08-1 6-16
This weapon was used in our exercise (Fig. 6-10). A total of 46 SH/ Pract C109, 24 SRTPDS-T C148, and nine Smoke WP-T M416 105-mm tank gun ammunitions were fired during our study. Considering Tables 6-1 and 6-2, this means that 286 kg of M1 and M6 propellant corresponding to 28.6 kg of 2,4-DNT were burned during the exercise.
Figure 6-8. SH/Pract tank gun ammunition.

ERDC TR-08-1 6-17
Figure 6-9. Representations of Smoke WP-T M 416 ammunition.

ERDC TR-08-1 6-18
Figure 6-10. Smoke WP-T M 416 ammunition.
Table 6-2. Composition of single-base propellants M1 and M6.
Weight percentage in the propellant (%)
Chemical M1 M6
Nitrocellulose 85% ± 2% 86% ± 2%
2,4-DNT 10% ± 2% 10% ± 2%
Dibutylphthalate 5% ± 1% 3% ± 1%
Potassium sulphate 1% ± 0.3% 0%
Diphenylamine 0.9% ± 1.2% 1% ± 1%
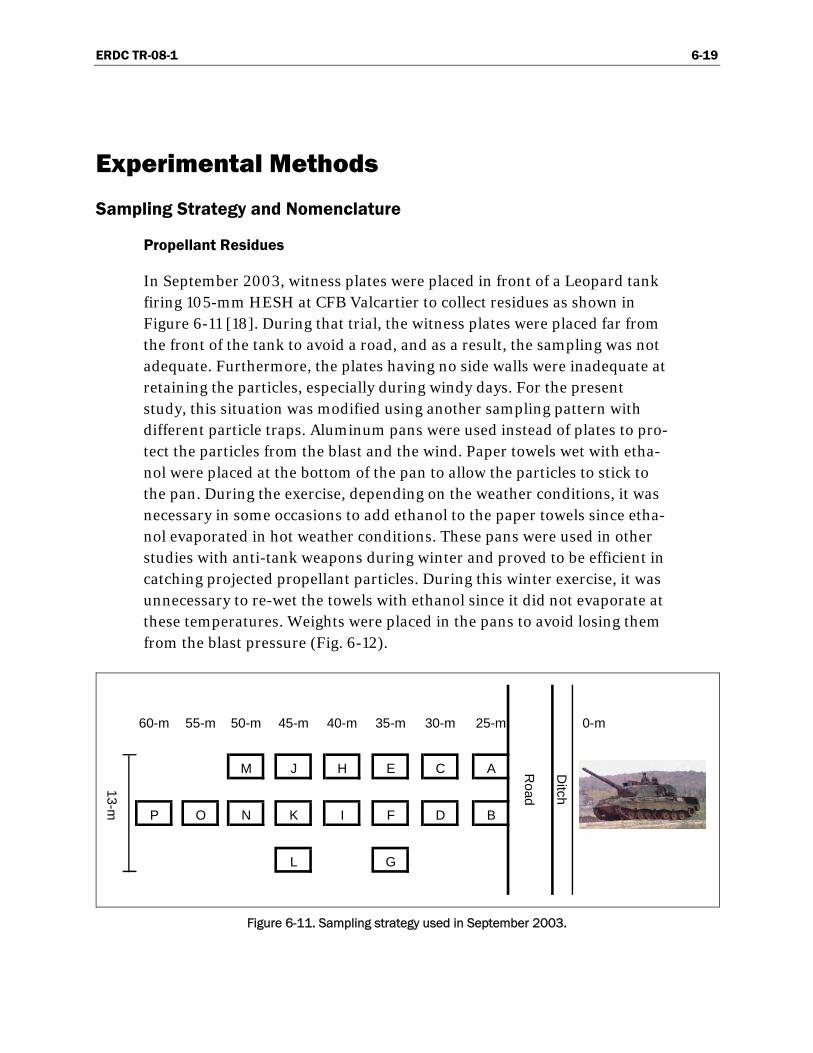
ERDC TR-08-1 6-19
Experimental Methods
Sampling Strategy and Nomenclature
Propellant Residues
In September 2003, witness plates were placed in front of a Leopard tank firing 105-mm HESH at CFB Valcartier to collect residues as shown in Figure 6-11 [18]. During that trial, the witness plates were placed far from the front of the tank to avoid a road, and as a result, the sampling was not adequate. Furthermore, the plates having no side walls were inadequate at retaining the particles, especially during windy days. For the present study, this situation was modified using another sampling pattern with different particle traps. Aluminum pans were used instead of plates to pro-tect the particles from the blast and the wind. Paper towels wet with etha-nol were placed at the bottom of the pan to allow the particles to stick to the pan. During the exercise, depending on the weather conditions, it was necessary in some occasions to add ethanol to the paper towels since etha-nol evaporated in hot weather conditions. These pans were used in other studies with anti-tank weapons during winter and proved to be efficient in catching projected propellant particles. During this winter exercise, it was unnecessary to re-wet the towels with ethanol since it did not evaporate at these temperatures. Weights were placed in the pans to avoid losing them from the blast pressure (Fig. 6-12).
60-m 55-m 50-m 45-m 40-m 35-m 30-m 25-m 0-m
M J H E C A
P O N K I F D B
L G
13-m
Road
Ditch
Figure 6-11. Sampling strategy used in September 2003.

ERDC TR-08-1 6-20
Figure 6-12. Particle traps used in front of the tank.
Considering that the tank was firing in a static position but aiming at dif-ferent targets within the firing area, we used a strategy based on a semi-circular pattern. The tank firing area had poles on the right and left sides to show the limits of the area where firing was authorized. When looking at the poles standing on the tank, an angle of approximately 50 degrees was observed. An angle of 60 degrees was chosen to allow the capture of the particles in all possible directions of shooting. Semi-circular sampling lines were set at 5, 10, 15, 20, 30, 40, and 50 m in front of the tank. A rope was marked at these pre-set distances allowing the disposition of the trays in a semi-circular pattern (Fig. 6-13). Particle traps were placed at 0-, 15-, 30-, 45-, and 60-degree angles. To that setup, two additional lines of traps were placed, aiming directly at the poles. This is illustrated in Figure 6-14 and it can be seen that seven particle traps are found on each circular line at specified distances.

ERDC TR-08-1 6-21
Figure 6-13. Sampling strategy used in front of the tank.
At the end of the exercise, it was anticipated that all the traps on each row would be combined to represent what is expelled at specific distances. These samples were labelled GAG07-T1-15m, GAG for Gagetown, 07 for 2007, T1 for first set of traps, and 15 m being the distance from the muzzle of the gun. After firing the first four rounds, it was realized that the first two rows, 5 m and 10 m away from the gun, were destroyed by the blast. Since we had the opportunity to return in the sampling area after 10 rounds were fired at lunch time, it was decided to remove the remains of the traps at 5 and 10 m and not replace them since they were not able to survive the blast. For the following rows, traps were doubled beside the original ones, and weights were added to the traps located at 15 m. These second traps were combined at the end of the trial and were named GAG07-T2-15m, T2, for the second set of traps. Considering that 79 rounds were fired during the entire day, and that T2 was installed after firing 10 rounds, this means that T1 samples represented 79 rounds while T2 samples represented 69 rounds.

ERDC TR-08-1 6-22
Figure 6-14. Disposition of particle traps in front of the tank.
Gagetown Demolition Ranges
As mentioned earlier, we took the opportunity to sample the Drummond and the South Boundary Demolition ranges. Demolition ranges are used by the military EOD technicians to destroy various munitions that are con-sidered safe to move. Sometimes chunks of HE or unused propellants are also destroyed at these ranges, either by demolition or burning. Demoli-tion ranges are generally small in size and sparsely vegetated near demoli-tion craters. Demolition craters are often used many times before being filled in. Wood, steel, and concrete cutting activities are also conducted in these demolition ranges. Since the sites were partially covered by snow, a preliminary sampling was accomplished with the intention of re-sampling more extensively at fall.
The Drummond Demolition Range was a flat terrain where some muni-tions were open-detonated. Six craters were found in front of the bunker,

ERDC TR-08-1 6-23
as seen in Figure 6-15. Multi increment (MI) soil samples were collected using a random-systematic approach and built out of 100 sub-samples within the cratered area. Triplicate samples were collected using the same pattern around the craters and were named DDR-1 to DDR-3.
Figure 6-15. Craters in front of the bunker in Drummond Demo Range.
The South Boundary Demolition Range was more sophisticated. Wood, steel, concrete cutting, cratering, demolition on pads, and demolition in urban scenarios activities were conducted on this range. There were eight demolition bays in the range and duplicate composite samples were built of seven sub-samples collected in each bay, resulting in two samples built with 56 sub-samples each. These samples were named SBDB-1 and 2 for South Boundary Demolition Bay composite 1 and composite 2 (Fig. 6-16).
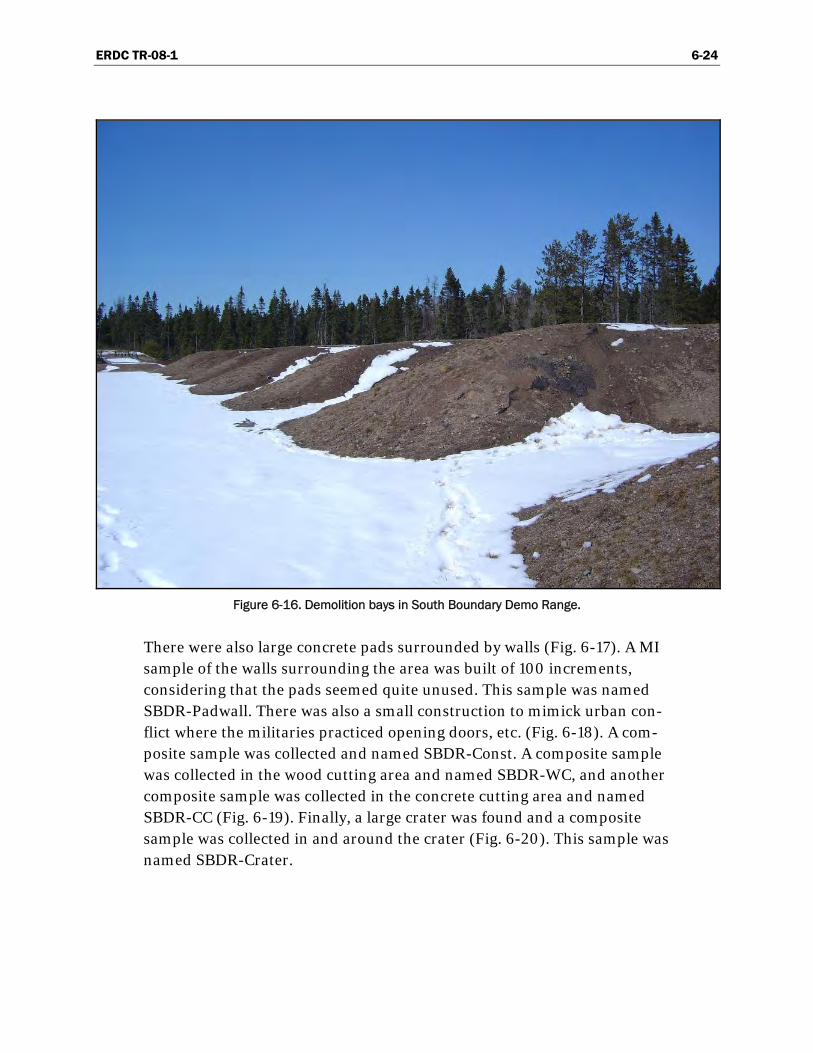
ERDC TR-08-1 6-24
Figure 6-16. Demolition bays in South Boundary Demo Range.
There were also large concrete pads surrounded by walls (Fig. 6-17). A MI sample of the walls surrounding the area was built of 100 increments, considering that the pads seemed quite unused. This sample was named SBDR-Padwall. There was also a small construction to mimick urban con-flict where the militaries practiced opening doors, etc. (Fig. 6-18). A com-posite sample was collected and named SBDR-Const. A composite sample was collected in the wood cutting area and named SBDR-WC, and another composite sample was collected in the concrete cutting area and named SBDR-CC (Fig. 6-19). Finally, a large crater was found and a composite sample was collected in and around the crater (Fig. 6-20). This sample was named SBDR-Crater.

ERDC TR-08-1 6-25
Figure 6-17. Walls surrounding the concrete pads.
Figure 6-18. Small construction to practice door demolition.

ERDC TR-08-1 6-26
Figure 6-19. Concrete cutting area in South Boundary Demo Range.
Figure 6-20. Crater area in South Boundary Demo Range.
ERDC TR-08-1 6-27
Parameter, Sample Collection, and Analytical Methods
To avoid the degradation of the energetic materials residue, particle traps were sampled immediately after the firing was completed. All traps on a specific row were combined as T1 or T2 samples, respectively. The ethanol suspensions and the towels were transferred into plastic pails. Each trap was then thoroughly rinsed with ethanol and combined in the pail. All the pails were sealed for transport and named according to the nomenclature explained earlier. Since the weather temperature was cold, no precautions were taken to protect the samples from heat during transport to DRDC Valcartier. Upon arrival at the lab, the pails were kept at –20 °C until ex-traction.
To prepare the samples for RP-HPLC analysis, the paper towels in the pails as well as the ethanol solution were transferred in a glass jar. Acetone was used to rinse the pail to completely extract the particles. Then, a vol-ume of acetone between 100 and 150 mL was added to each bottle that was placed on a shaker table for 18 hours followed by one hour in a sonic bath. The paper towels were then thoroughly squeezed, rinsed twice, and dis-carded. The solvent was evaporated and the residues dissolved in 40 mL of acetonitrile. The extracts were filtered using a 0.45-μm filter and con-centrated in a Zymark Turbovap evaporator apparatus (produced by Zy-mark Corporation, Hopkinton, Massachussetts, USA) to reach lower de-tection limits, or diluted to obtain final concentrations within the linear response of the calibration curve.
Extracts were maintained at 4°C. Analyses were performed with a HPLC Agilent HP 1100 equipped with a degasser G1322A, a quaternary pump model G1311A, an autosampler G1313A, and a UV diode array detector model G1315A monitoring at 210, 220, and 254 nm. The injection volume was 20 μL and the column was a Supelcosil LC-8 (25 cm × 3-mm × 5 μm) eluted with 15:85 isopropanol/water (v/v) at a flow rate of 0.75 mL/min. The column temperature was maintained at 25° C during the analysis. Standards and solvents were diluted 1:1, acetonitrile to water (0.5 mL Acn/0.5 mL water).
Soil samples were dried in the dark and homogenized by adding acetone to form slurry, which was then evaporated. Soils were sieved through 25-mesh sieves and extracted at DRDC Valcartier according to the following procedure. Eight grams of soil were put into an amber glass vial and mixed with acetonitrile (10 mL). A vortex was applied for one minute, followed by
ERDC TR-08-1 6-28
a sonication period of 18 hours in an ultrasonic bath in the dark. The vials were centrifuged for one hour. To lower the detection limit, 5 mL of the extract was filtered and placed in a test tube to be evaporated to dryness into the Zymark evaporator (model TurboVap LV) apparatus. Acetonitrile (0.5 mL) and water (0.5 mL) were added to the test tube and the solution was filtered on a 0.45-μm filter, ready to be analyzed by HPLC.
Soil extracts were maintained at 4°C until analyzed by HPLC according to Method EPA 8330 update SW 846 (1994). Analyses were performed with a HPLC Agilent HP 1100 equipped with a degasser G1322A, a quaternary pump model G1311A, an autosampler G1313A, and a UV diode array detec-tor model G1315A monitoring at 210, 220, and 254 nm. The injection vol-ume was 20 μL and the column was a Supelcosil LC-8 (25 cm × 3 mm × 5 μm) eluted with 15:85 isopropanol/water (v/v) at a flow rate of 0.75 mL/min. The column temperature was maintained at 25° C during the analysis. Standards and solvents were diluted 1:1, acetonitrile to water (0.5 mL Acn/0.5 mL water). When 8 g in 10 mL of acetonitrile were used for the soil extraction, the detection limit for this method was 0.25 ppm. When using the Zymark procedure with the extracts, the detection limit was 0.062 ppm.
ERDC TR-08-1 6-29
Results and Discussion
Propellant Residues
During the tank trial, 10 rounds including four Squash Head and six short-range Sabot munitions were fired in the morning. After firing the first four Squash Head practice rounds, the two first rows of pans were destroyed by the blast of small rocks projected by the pressure wave. After firing the first 10 rounds, we were allowed to look after our setup and decided to re-move the first two rows, put more weights into the row at 15 m, and double the amount of pans in all the remaining rows. These new pans were named T2. After firing the first 10 rounds, we did not observe residue presence in any of our pans. We added more pans in each rows because we thought that there was too much space between the pans in the original setup. The strategy of disposing the pans in a circular pattern was used because the tank was not static at its targeting and because this allowed covering most of the area where particles could have been projected. The firing started after lunch for another 69 rounds, and at the end of the day, a total of 46 Squash Head/practice, 24 short-range SRTPDS, and nine Smoke WP-T rounds had been fired by our Leopard tank.
If one examines Table 6-3, it is seen that no propellant residues were detected in any of the samples T1 and T2. Considering that 79 rounds were fired, this means that 286 kg of M1 and M6 propellant corresponding to 28.6 kg of 2,4-DNT were burned during the exercise. It was found at Nicolet that the 105-mm artillery gun ejected up to 0.39% of 2,4-DNT when firing Squash Head Practice [21]. Dubé et al. found that after the firing of 10 105-mm HE rounds by an artillery LG1 Mark II gun, 1.74 g of 2,4-DNT, 56 mg of 2,6-DNT, and 1.7 g of nitrocellulose were spread on site [18]. When put in relation with the initial quantity fired, these quantities represent 0.56% of 2,4-DNT, 0.04% of 2,6-DNT, and 0.05% of nitrocellu-lose. These percentages are in agreement with the one found during the Nicolet study [21]. Considering that the 105-mm artillery firing spread residues of 2,4-DNT, similar results were expected after the firing of 105-mm tank gun firing [23].

ERDC TR-08-1 6-30
Table 6-3. Results from the Leopard tank gun firing.
It is possible that our setup was inadequate at catching the particles emit-ted during the firing or that particles are emitted farther than 50 m. Jen-kins et al. observed concentrations of NG and 2,4-DNT 10 m in front of the tank firing positions at Yakima Training Center at concentrations in soils as high as 17 and 33 ppm, respectively. They also mentioned that concen-trations were still observed at 75 m in front of the fixed positions [13]. These concentrations in soils represent the accumulation of many firings from these positions. More experiments will have to be performed to verify other setups at different distances in front of the tank. Dubé et al. also ob-served in their study that after the firing of sixty 105-mm HESH rounds by a Leopard C2 tank, no energetic materials residues were collected [18]. It was concluded that the witness plates failed at collecting the residues be-cause their locations were not adequate. Again, the strategy of sampling was blamed for not collecting any particles.
It is more likely that the combustion of 105-mm tank gun ammunition is more complete than the 105-mm artillery gun ammunition. The artillery is built to attack in an indirect fire and is intended to hit at long distances. The tank ammunition is built to propel projectiles at high velocity using high kinetic energy to cause lethal effect in a direct fire. To achieve their terminal effects, the artillery gun ammunition propelling charges contain approximately 1.28 kg of propellant (seven bags) while the 105-mm tank ammunition contains from 3.0 to 6.0 kg of propellant from Practice Squash Head to operational APFSDS rounds (Table 6-1). During the Nicolet trial, C-60 Squash Head artillery rounds were fired at Charge 6 and
Sample NG
(mg) HMX (mg)
RDX (mg)
TNT (mg)
2,4-DNT (mg)
2,6-DNT (mg)
GAG07-15m-T1 nd nd nd nd nd nd
GAG07-20m-T1 nd nd nd nd nd nd
GAG07-30m-T1 nd nd nd nd nd nd
GAG07-40m-T1 nd nd nd nd nd nd
GAG07-50m-T1 nd nd nd nd nd nd
GAG07-15m-T2 nd nd nd nd nd nd
GAG07-20m-T2 nd nd nd nd nd nd
GAG07-30m-T2 nd nd nd nd nd nd
GAG07-40m-T2 nd nd nd nd nd nd
GAG07-50m-T2 nd nd nd nd nd nd

ERDC TR-08-1 6-31
Charge 4, meaning that only 840 and 467 g of propellant, respectively, were burned, ejecting 0.23 and 0.39% of 2,4-DNT [21]. The tank Squash Head practice ammunition uses more than three times the amount of pro-pellant compared to the artillery rounds of the Nicolet study [21]. This means that higher temperature and pressure are resulting in the Tank gun barrel, leading to a cleaner combustion without residues. One conclusion that can be drawn here is that the combustion is becoming complete some-where between 840 and 3,000 g of propellant in the gun chamber. These hypotheses will have to be verified by calculation. If the hypothesis of com-plete or “cleaner” combustion is verified in relation to temperature and pressure versus amount of propellant, it will be very interesting to study artillery and tank firing with triple-base propellant. Firing with triple-base propellant should lead to cleaner combustion and no particles emitted, since the energy contained in triple-base propellant is greater. These tri-ple-base propellants should lead to higher temperature and pressure if the hypothesis is verified.
More recently, experiments were done with the 84-mm Carl Gustav anti-tank weapons to collect residues at firing positions, and the traps that were installed behind these firing positions were also projected by the blast. A new design for pan holder was developed and proven to be effective to re-sist the firings blast (Fig. 6-21, 6-22). A new trial using these new trap holders will be done using a Leopard tank, but this time in a static target-ing position using farther distances to verify if particles are ejected farther than 50 m.
Demolition Ranges
Results for both demo ranges are presented in Table 6-4. Triplicate sam-ples were collected around the craters in front of the bunker area in Drum-mond Demolition Range. HMX was found in all samples of the Drum-mond Range at concentrations up to 0.73 ppm, while RDX and TNT were found in one or two triplicates at concentrations varying from 0.05 to 0.53 ppm. All values are of the same order of magnitude, below 1 ppm in the triplicates. This indicates that this site is not highly impacted when com-pared to other demolition ranges. In fact, the site was quite large and it seemed that not many activities were conducted there during the last months. Propellant residues were also identified and are probably the re-sult of burning excess propelling charges. NG and 2,4 DNT were found in the three triplicate samples at concentrations ranging from 0.21 to 1.45 ppm for NG and 0.08 to 0.71 for 2, 4-DNT.

ERDC TR-08-1 6-32
Figure 6-21. New pan holders developed to protect particle traps.
Figure 6-22. Particle traps inserted into the new pan holders.

ERDC TR-08-1 6-33
Table 6-4. Results from the soils in demolition ranges.
Sample*
NG (ppm)
HMX (ppm)
RDX (ppm)
TNT (ppm)
2,4-DNT (ppm)
2,6-DNT (ppm)
0.39 0.13 0.51 0.27 0.71 nd DDR-1
0.28 0.13 0.53 0.22 0.59 nd
0.21 0.34 0.06 nd 0.15 nd DDR-2
nd 0.42 nd nd 0.13 nd
1.26 0.67 nd 0.05 0.11 nd DDR-3
1.45 0.73 nd 0.05 0.08 nd
10.19 4.63 24.85 93.15 0.60 nd SBDR-DB-1
10.74 4.30 24.09 95.15 0.59 nd
9.48 4.40 27.59 227.30 0.80 nd SBDR-DB-2
9.35 4.43 28.61 234.05 0.76 nd
nd nd nd 0.50 nd nd SBDR-Crater
nd nd nd 0.15 nd nd
nd 0.04 0.16 0.13 nd nd SBDR-WC
nd 0.05 0.19 0.12 0.17 nd
nd 0.06 1.22 0.15 nd nd SBDR-CC
nd 0.05 0.93 0.14 nd nd
nd nd nd nd 0.20 nd SBDR-Const
nd nd nd nd 0.22 nd
nd 0.06 nd nd 0.55 nd SBDR-Padwall
nd 0.06 nd nd 0.66 nd
* Each sample was analyzed twice (two different sub-samples).
On the South Boundary Demolition Range, it was evident that more activi-ties were conducted from concrete, wood, steel, cratering, and different demolition activities. In the demolition bays’ composite samples, HMX was found at concentrations of 4.30–4.63 ppm, while RDX was observed at 24.09–28.61 ppm. TNT was observed at high concentrations ranging from 93.15 to 234.05. TNT metabolites such as 2-ADNT and 4-ADNT were not observed in any samples of the Demo ranges except in the demolition bays, where they were identified at concentrations ranging from 0.38 to 0.60 ppm for 2-ADNT and 0.26 to 0.42 for 4-ADNT (not seen in Table 6-4). NG was observed only in the composite samples of the demolition bays at 9.35–10.74 ppm, while 2,4-DNT was observed also in the wood cutting, construction, and pad areas at levels ranging from 0.17 to 0.80 ppm. The demolition bays are the most contaminated areas of this range.
In the crater, only TNT was measured at 0.15 to 0.50 ppm. This is not sur-prising since the craters are often made by detonating TNT base charges
ERDC TR-08-1 6-34
(trigran). In the wood and concrete cutting, HMX, RDX, and TNT were found at low levels below the ppm, except for RDX, which was detected at 1.22 ppm in the concrete area. These two areas were visually quite clean and that would explain the low explosives concentrations observed. No explosives were detected in the construction area except for 2,4-DNT, which was detected at 0.20–0.22 ppm. This area was quite large, with con-crete pads where they probably burned excess propellant; that would ex-plain why 2,4-DNT was found. The wooden urban warfare structure was new, which could explain why no explosives were found in it. Finally, sam-ples collected near the walls surrounding the pads contained 2,4-DNT at concentrations of 0.55–0.66ppm. HMX was also identified at very low 0.06 ppm concentrations.
With the exception of anti-tank ranges, demolition ranges are the most contaminated areas sampled up to now in army training ranges. In Chilli-wack, even after years of not using these demolition ranges, concentra-tions up to 85 ppm were found for RDX [10]. Demo ranges in the United States are also contaminated as well, since chunks of C4 (91% RDX, 9% wax) lying in the ground were visually seen at Fort Richardson, Alaska [23]. The contamination occurs when a block of C4 (not confined explo-sive) is used to blast an item. Sometimes, the item does not fully detonate and a second-order detonation occurs, spreading pieces of explosives in the area. The block of C4 itself, not being confined, may undergo partial detonation and explosives may be spread by its explosion. New ways of open-detonating items should be pursued to improve the efficiency of the demolition activities. Attention should also be given to examining the spe-cific activity and finding mitigation measures. Nevertheless, open detona-tion is an important part of the military work and cannot be avoided, so it is imperative to find solutions to this activity if sustainable training must be achieved.
It was decided recently that the Royal military College Kingston School of EOD will move to CFB Gagetown in the coming years. This will increase the EOD activities and will, of course, put more pressure on both demoli-tion ranges. It will be interesting to follow the situation and compare the results once the school begins training on an intense basis at Gagetown demolition ranges.
ERDC TR-08-1 6-35
Conclusion
105-mm tank gun practice rounds were fired during an entire day using a Leopard tank in CFB Gagetown. A total of 79 rounds, including 46 Squash Head Practice, 24 Short Range Target Practice Discarding Sabot, and nine Smoke White Phosphorus rounds, was fired. That represents 286 kg of M1 and M6 propellant corresponding to 28.6 kg of 2,4-DNT burned during the exercise. A semi-circular sampling strategy was used that consisted of placing particle traps containing a paper towel wet with ethanol at differ-ent distances in front of the muzzle of the tank gun. Distances up to 50 m were used in our study. The first two rows (5 and 10 m) were destroyed by the blast and therefore more resistant traps should be used in the future.
According to the latest results obtained from artillery exercises, it was found that 0.4–0.6% of 2,4-DNT is ejected during the firing of 105-mm artillery gun firing. In our study, it was found that no propellant residues were found following the firing of the 79 tank gun ammunition rounds. Dubé et al. studied the firing of tank 105-mm ammunition and also found that no propellant residues were ejected after firing 60 105-mm HESH tank gun ammunitions. At the time that study was conducted, the results were explained by an inadequate sampling strategy. The same conclusions can still apply to this study since no residues were found in front of the tank between distances of 15 to 50 m after firing 79 rounds.
The other explanation is the fact that the combustion of 105-mm tank gun ammunition is probably more complete than the 105-mm artillery gun ammunition. The artillery is built to attack in an indirect fire mode and is intended to hit at long distances. The tank ammunition is built to propel projectiles at high velocity using high kinetic energy to cause lethal effect in a direct fire mode. The artillery 105-mm ammunition propelling charges contain approximately 1.28 kg of propellant while the 105-mm tank am-munition contains from 3.0 to 6.0 kg of propellant from practice to opera-tional rounds. The Squash Head practice round used in our study contains almost three times the amount of propellant compared to the artillery Squash Head C-60 practice rounds that were fired at Charge 6 in Nicolet, Lac St-Pierre, Canada. This suggests that higher temperature and pressure are experienced in the tank gun barrel, leading to a more complete or “cleaner” combustion without projection of solid unreacted residues. It

ERDC TR-08-1 6-36
is highly possible that to get the ideal pressure and temperature to com-pletely burn the propelling charge, the mass of propellant should be between 800 and 3,000 g of propellant in a 105-mm gun chamber. More work will have to be conducted to validate this hypothesis.
Another aspect of the tank trial is the fact that the shock wave from the blast is more important than the artillery. Therefore, better and more solid particle traps will have to be installed close to the tank gun. Lately, a trap protector was built and will be evaluated the next time 105-mm tank gun ammunition is fired. Moreover, the next trial should involved static firing, which will minimize the dispersion of the projected material. By doing that, a different sampling strategy using systematic sampling positions will be used. Greater distances in front of the tank will also be sampled to see if particles are ejected at greater distances, taking into account that more en-ergy related to more propellant is used in tank ammunition.
Drummond and South Boundary Demolition ranges were visited during this study. Soils were collected in triplicate in Drummond cratering area, while the South Boundary Demolition Range areas, such as the demolition bays, concrete, wood, cratering, and pad areas, were sampled for explo-sives and propellant residues. In general, demolition ranges can be heavily contaminated. In Drummond, the contamination was at the 1-ppm level, while in the South Boundary Demolition Range, the concentrations of TNT went up to 200 ppm. This is one of the highest concentrations experienced in demolition ranges in Canada. Propellant residues were also found in both demolition ranges, proving that burning excess propellant is not a clean process. This activity should be banned from Canadian training areas. Finally, explosives concentrations will probably increase since the Royal Military College Kingston School of EOD will practice more in CFB Gagetown in the coming years. It will be interesting to verify and compare the results once the school practices on a daily basis.
ERDC TR-08-1 6-37
References
1. Pennington, J.C., T.F. Jenkins, S. Thiboutot, G. Ampleman, J. Clausen, A.D. Hewitt, J. Lewis, M.R. Walsh, T.A. Ranney, B. Silverblatt, A. Marois, A. Gagnon, P. Brousseau, J.E. Zufelt, K. Poe, M. Bouchard, R. Martel, J. Lewis, D.D. Walker, C.A. Ramsey, C.A. Hayes, S. Yost, K.L. Bjella, L. Trepanier, T.E. Berry, D.J. Lambert, P. Dubé, and N.M. Perron (2005) Distribution and Fate of Energetics on DoD Test and Training Ranges: Report 5. US Army Engineer Research and Development Center, Environmental Laboratory, Vicksburg, MS, Technical Report ERDC TR-05-02.
2. Brochu, S., E. Diaz, S. Thiboutot, G. Ampleman, A.D. Hewitt, S.R. Bigl, M. Walsh, K. Bjella, T. Ranney, M. Walsh, S. Taylor, C. Ramsey, D. Lambert, and N. Perron (2005) Assessment of 100 Years of Military Training in Canada: The Case of Canadian Force Base Petawawa; Chapter 3, Distribution and Fate of Energetics on DoD Test and Training Ranges: Report 6. US Army Engineer Research and Development Center, Environmental Laboratory, Vicksburg, MS, Technical Report ERDC TR-06-12.
3. Diaz, E., S. Brochu, S. Thiboutot, G. Ampleman, A. Marois, and A. Gagnon (2005) Assessment of Contamination by Energetic Materials and Metals in Soils and Biomasses at Western Area Training Center (WATC) in Wainwright, Alberta (Phase I); Chapter 4, Distribution and Fate of Energetics on DoD Test and Training Ranges: Report 6. US Army Engineer Research and Development Center, Environmental Laboratory, Vicksburg, MS, Technical Report ERDC TR-06-12.
4. Ampleman, G., S. Thiboutot, J. Lewis, A. Marois, A. Gagnon, M. Bouchard, T.F. Jenkins, T.A. Ranney, and J.C. Pennington (2004) Evaluation of the Con-tamination by Explosives and Metals in Soils, Vegetation, Surface Water and Sediment at Cold Lake Air Weapons Range (CLAWR), Alberta, Phase II, Final report. DRDC Valcartier TR 2004-204.
5. Thiboutot, S., G. Ampleman, A. Marois, A. Gagnon, M. Bouchard, A. Hewitt, T.F. Jenkins, M. Walsh, K. Bjella, C. Ramsey, and T.A. Ranney (2004) Environmental Conditions of Surface Soils, CFB Gagetown Training Area: Delineation of the Presence of Munitions Related Residues (Phase III, Final Report). DRDC Valcartier TR 2004-205.
6. Marois, A., A. Gagnon, S. Thiboutot, G. Ampleman, et M. Bouchard (2004) Caractéri-sation des sols de surface et de la biomasse dans les secteurs d’entraînement, Base des Forces Canadiennes, Valcartier. DRDC TR-2004-206.
7. Pennington, J.C., T.F. Jenkins, G. Ampleman, S. Thiboutot, J. Brannon, J. Clausen, A.D. Hewitt, S. Brochu, P. Dubé, J. Lewis, T.A. Ranney, D. Faucher, A. Gagnon, J.A. Stark, P. Brousseau, C.B. Price, D. Lambert, A. Marois, M. Bouchard, M.E. Walsh, S.L. Yost, N.M. Perron, R. Martel, S. Jean, S. Taylor, C.A. Hayes, J.M. Ballard, M.R. Walsh, J.E. Mirecki, S. Downe, N.H. Collins, B. Porter, and R. Karn (2004) Distribution and Fate of Energetics on DoD Test and Training Ranges; Interim Report 4. US Army Engineer Research and Development Center, Environmental Laboratory, Vicksburg, MS, Technical Report ERDC TR-04-4.

ERDC TR-08-1 6-38
8. Ampleman, G., S. Thiboutot, J. Lewis, A. Marois, A. Gagnon, M. Bouchard, R. Martel, R. Lefebvre, C. Gauthier, J.M. Ballard, T. Jenkins, T. Ranney, and J. Pennington (2003) Evaluation of the Impacts of Live-Fire Training at CFB Shilo (Final Report). DRDC Valcartier TR 2003-066.
9. Thiboutot, S., G. Ampleman, A. Gagnon, and A. Marois (2000) Characterization of an Unexploded Ordnance Contaminated Range (Tracadie Range) for Potential Con-tamination by Energetic Materials. DREV Report TR-2000-102.
10. Ampleman, G., S. Thiboutot, S. Désilets, A. Gagnon, and A. Marois (2000) Evaluation of the Soils Contamination by Explosives at CFB Chilliwack and CFAD Rocky Point. DREV Report TR-2000-103.
11. Jenkins, T.F., S. Thiboutot, G. Ampleman, A.D. Hewitt, M.E. Walsh, T.A. Ranney, C.A. Ramsey, C.L. Grant, C.M. Collins, S. Brochu, S.R. Bigl, and J.C. Pennington (2005) Identity and Distribution of Residues of Energetic Compounds at Military Live-Fire Training Ranges. US Army Engineer Research and Development Center, Cold Regions Research and Engineering Laboratory, Hanover, NH, Technical Report ERDC TR-05-10.
12. Pennington, J., T. Jenkins, G. Ampleman, S. Thiboutot, J. Brannon, J. Lewis, J. DeLaney, J. Clausen, A.D. Hewitt, M. Hollander, C. Hayes, J. Stark, A. Marois, S. Brochu, H. Dinh, D. Lambert, A. Gagnon, M. Bouchard, R. Martel, P. Brousseau, N. Perron, R. Lefebvre, W. Davis, T.A. Ranney, C. Gauthier, S. Taylor, and J.M. Ballard (2003) Distribution and Fate of Energetics on DoD Test and Training Ranges: Interim Report 3; SERDP interim Report. US Army Engineer Research and Development Center, Environmental Laboratory, Vicksburg, MS, Technical Report ERDC TR-03-2.
13. Pennington, J.C., T.F. Jenkins, G. Ampleman, S. Thiboutot, J.M. Brannon, J. Lynch, T.A. Ranney, J.A. Stark, M.E. Walsh, J. Lewis, C.A. Hayes, J.E. Mirecki, A.D. Hewitt, N. Perron, D. Lambert, J. Clausen, and J.J. Delfino (2002) Distribution and Fate of Energetics on DoD Test and Training Ranges: Interim Report 2. US Army Engineer Research and Development Center, Environmental Laboratory, Vicksburg, MS, Technical Report ERDC TR-02-8.
14. Pennington, J., T. Jenkins, G. Ampleman, S. Thiboutot, J. Brannon, J. Lynch, T.A. Ranney, J. Stark, M. Walsh, J. Lewis, C. Hayes, J. Mirecki, A. Hewitt, N. Perron, D. Lambert, J. Clausen, and J. Delfino (2002) Distribution and Fate of Energetics on DoD Test and Training Ranges: Interim Report 1. US Army Engineer Research and Development Center, Environmental Laboratory, Vicksburg, MS, Technical Report ERDC TR-01-13.
15. Jenkins, T.F., J.C. Pennington, T.A. Ranney, T.E. Berry, Jr., P.H.Miyares, M.E. Walsh, A.D. Hewitt, N. Perron, L.V. Parker, C.A. Hayes, and Major E. Wahlgren (2001) Characterization of Explosives Contamination at Military Firing Ranges. US Army Engineer Research and Development Center, Cold Regions Research and Engineering Laboratory, Hanover, NH, Technical Report ERDC TR-01-05.
16. Walsh, M.E., C.M. Collins, C.H. Racine, T.F. Jenkins, A.B. Gelvin, and T.A. Ranney (2001) Sampling for Explosives Residues at Fort Greely, Alaska: Reconnaissance Visit July 2000. US Army Engineer Research and Development Center, Cold Regions Research and Engineering Laboratory, Hanover, NH, Technical Report ERDC/CRREL-01-15.

ERDC TR-08-1 6-39
17. Jenkins, T.F., A.D. Hewitt, C.L. Grant, S. Thiboutot, G. Ampleman, M.E. Walsh, T.A. Ranney, C.A. Ramsey, A.J. Palazzo, and J.C. Pennington (2006) Identity and distribution of residues of energetic compounds at Army live-fire training ranges. Chemosphere, 63, 1280.
18. Dubé, P., S. Thiboutot, G. Ampleman, A. Marois, and M. Bouchard (2006) Prelimi-nary Assessment of the Dispersion of Propellant Residues from the Static Live Firing of 105-mm Howitzer. DRDC Valcartier TM 2005-284.
19. Walsh, M.R., S. Taylor, M.E. Walsh, S. Bigl, K. Bjella, T. Douglas, A.B. Gelvin, D. Lambert, N.M. Perron, and S.P. Saari (2005) Residues from Live-Fire Detonation of 155-mm Howitzer Rounds. US Army Engineer Research and Development Center, Cold Regions Research and Engineering Laboratory, Hanover, NH, Technical Report ERDC/CRREL TR 05-14.
20. Walsh, M.R., M.E. Walsh, C.A. Ramsey, R.J. Rachow, J.E. Zufelt, C.M. Collins, A.B. Gelvin, N.M. Perron, and S.P. Saari (2006) Energetic Residues Deposition from 60-mm and 81-mm Mortars. US Army Engineer Research and Development Center, Cold Regions Research and Engineering Laboratory, Hanover, NH, Technical Report ERDC/CRREL TR 06-10.
21. Ampleman, G., S. Thiboutot, A. Marois, T. Gamache, I. Poulin, B. Quémerais, and L. Melanson (2007) Analysis of Propellant Residues Emitted During 105-mm Howitzer Live-Firing at the Muffler Installation in Nicolet, Lac St-Pierre, Canada. DRDC Valcartier TR 2007-514.
22. Quémerais, B., L. Melanson, G. Ampleman, S. Thiboutot, E. Diaz, I. Poulin (2007) Characterization of the Air Emissions During Live Gun Firing at the Muffler Installation in Nicolet Lac-St-Pierre, Canada. DRDC Toronto TR 2007-060.
23. Walsh, M.E., C.M. Collins, C.A. Ramsey, T.A. Douglas, R.N. Bailey, M.R. Walsh, A.D. Hewitt, and J.L. Clausen (2007) Energetic Residues on Alaskan Training Ranges. US Army Engineer Research and Development Center, Cold Regions Research and Engineernig Laboratory, Hanover, NH, Technical Report ERDC/CRREL TR 07-9.

THIS PAGE IS INTENTIONALLY BLANK.

ERDC TR-08-1 7-1
— Chapter 7 —
Study of Propellant Residues and Gases Emitted During 105-mm Howitzer
Live Firing at the Muffler Installation in Nicolet, Lac St-Pierre, Canada
GUY AMPLEMAN, SONIA THIBOUTOT, ANDRÉ MAROIS, THÉRÈSE GAMACHE, ISABELLE POULIN, EMMANUELA DIAZ,
BERNADETTE QUÉMERAIS, AND LARRY MELANSON
Abstract
For many years, the Defence Research and Development - Valcartier (DRDC Valcartier) and the US Army Corps of Engineers’ Cold Regions Re-search and Engineering Laboratory (CRREL) have evaluated impacts of live-fire training exercises on Canadian and US ranges. Most of the efforts have focused on impact areas and target positions. More recently, investi-gations have addressed propellant residues, i.e., NG and 2-4 DNT at anti-tank, artillery, and mortar firing positions. In addition to environmental impacts, there are health concerns for artillery gunners. Headache is one symptom often experienced by the gunners. DRDC Valcartier and DRDC Toronto collaborated in this study to assess the gaseous emissions and the particles size distribution during live-firing of a 105-mm howitzer gun. Studies were performed both in the open atmosphere and inside a muffler installation in Nicolet. The trials inside the muffler enhanced the collec-tion of emitted particles and gases. Furthermore, to better understand the combustion processes, firings at full and partial charges were performed using both settings. Gases were collected in parts of the study conducted inside and outside the muffler to compare the results. Sub-micron parti-cles were

ERDC TR-08-1 7-2
observed, as well as contaminants of concern such as cyanhydric acid, aromatic hydrocarbons, and others. This area deserves more attention to evaluate the potential health risk to the users. Different concentrations of the gases were observed at Charge 6 and at Charge 4. Firing at Charge 6 leads to a better combustion process than firing at a partial charge of four bags. Firing at Charge 4 in the muffler spread 2,4-DNT ranging from 0.29 to 0.39%, while firing with six bags spread 0.019 to 0.23%. Atmospheric firings confirmed those results. Results also indicate that the gunners posi-tions are exposed to high concentrations of 2,4-DNT when firing the how-itzer gun. A potential health risk will have to be evaluated in further study. This paper describes the sampling strategy, the laboratory procedure, and the results obtained.

ERDC TR-08-1 7-3
Introduction
For many years, DRDC Valcartier has been involved in the evaluation of the environmental impacts of live-fire training to characterize and mitigate adverse effects on training ranges and thereby sustain the military activi-ties [1]. Over the years, many efforts have been conducted to assess the environmental loading of explosives at most of the major Canadian Forces bases (CFB). To date, these efforts addressed mainly heavily used target areas [2-10]. Many of these studies were conducted in collaboration with the US Army Corps of Engineers’ Cold Regions Research and Engineering Laboratory (CRREL) in Hanover, New Hampshire, and the Environmental Laboratory (EL) in Vicksburg, Mississippi [7, 11–14]. Walsh et al. (2001) observed that the firing positions were also experiencing a buildup of en-ergetic residues, and since then, a number of studies have been dedicated to the characterization of the firing positions [13, 15–16]. It was deter-mined that NG and/or 2,4-dinitrotoluene (2,4-DNT) embedded in nitro-cellulose fibers are deposited in front of and around firing positions [5, 15–17]. Moreover, a common practice in Canada and the United States is to burn excess propellant bags that are removed from the munitions to adjust the ballistic parameters directly on the ground following artillery training exercises. This practice results in an improper incomplete combustion of the propellants, therefore having pronounced environmental conse-quences. This practice is being assessed by DRDC Valcartier and Director Land Environment.
Two years ago, DRDC Valcartier assessed 105-mm artillery and tank gun firing at CFB Valcartier by placing aluminum witness plates in front of the gun muzzles [18]. At CRREL, a similar study characterized the deposition of the propellant residues using snow as a collection surface [19]. Both studies demonstrated that propellant residues composed of nitrocellulose fibers containing 2,4-DNT were deposited in front of the gun muzzle. More recently, Walsh et al. studied residues at mortar firing positions [20]. NG was found at elevated concentrations for 81-mm mortars.
During the DRDC trial in CFB Valcartier, it came to our attention that the gunners often suffered from headaches after gun firing exercises. Further-more, in some cases the headaches persisted for days and the gunners’ body fluids smelled of gunpowder for days following artillery-training ex-
ERDC TR-08-1 7-4
ercises. One explanation for these potential health effects is the adsorption of propellant chemicals by the gunners during the exercise. This study was undertaken to further investigate the emission of propellant particles and gases in the area where gunners normally stand while firing. Of particular interest is the size of the particles emitted during the firing, since sub-micron particles present an adverse impact for human health.
Our first attempts to collect emissions from live-firing exercises were often compromised (poor recoveries) by windy conditions [18]. In Nicolet, Lac St-Pierre, Canada, DND has a site where SNC Technologies Inc. is testing and proofing munitions. At this facility, a muffler was constructed to miti-gate the noise impact from firing artillery to the surrounding community. The muffler is a closed vessel that holds most of the muzzle emissions until they are pumped out, and therefore it was ideally suited for this study. The 105-mm squash head practice, C60, fired with a howitzer C3 gun, was evaluated in this study.
The muffler chamber has three compartments with a large opening at one end and a small opening at the other end for the gun muzzle. After firing, gases mostly accumulate in the first compartment, which we equipped with a gas sampler. Aluminum witness plates were placed at specified dis-tances from the gun muzzle on the chamber floor to collect the particles. For experiments conducted inside and outside the muffler chamber, ten rounds were fired with six out of six bags of propellant (Charge 6) and ten rounds were fired with four out of six bags (Charge 4). The propellant charge was varied to see if there was an effect on the nature and quantity of the emissions.
This study is a joint effort between DRDC Valcartier, which is experienced in environmental impacts of energetic residues, and DRDC Toronto, which is experienced in chemical impacts on human health. This SERDP chapter describes how the study was performed in September 2006 at Nicolet. Complete reports from DRDC Valcartier and DRDC Toronto were also published in 2007 [21, 22]. This work was co-funded by the Sustain Trust from Defence Research and Development Canada and by the Strategic Environmental Research and Development Program of the United States through project ER-1481.

ERDC TR-08-1 7-5
Experimental Methods
Logistics
The Munitions Experimental Test Centre (METC), which is part of DRDC Valcartier, manages the Nicolet site and was responsible for acquiring, shipping, and handling the 105-mm squash head practice C-60 rounds. They were also responsible for setting test dates and obtaining permission to manufacture a sampling device for the muffler with SNC Tech Inc. METC and SNC Tech Inc. assisted DRDC Valcartier and DRDC Toronto in the fabrication of a gaseous sampling manifold. DRDC Toronto was re-sponsible for supplying the gaseous sampling equipment and for the analysis of these samples. Media to collect gas and particulate samples as well as sample analysis were provided by Clayton Group Services Inc. (Novi, Michigan and Atlanta, Georgia). DRDC Valcartier was responsible for project management and for the collection and analysis of energetic materials deposited onto witness plates.
Muffler Chamber
The muffler chamber consists of a large tube 30 m in length comprising three compartments of different diameters. The first compartment, where the gun muzzle is inserted (Fig. 7-1), is the longest (20 m) and widest sec-tion (diameter of 4 m) and has hatches on the side for instrumentation (Fig. 7-2). The second compartment is 6 m long with a diameter of 3 m; the last section is 4 m long and 2 m in diameter. Openings between the compartments are 75-cm diameter (Fig. 7-3). For this reason, we had to cut our 1-m2 witness plate in half to be able to pass through these holes (Fig. 7-4). At the muffler’s exit, a large concrete sand butt is installed to stop the incoming rounds.

ERDC TR-08-1 7-6
Figure 7-1. Gun muzzle at one end of the first cell of the muffler.
Figure 7-2. Side view of the muffler.

ERDC TR-08-1 7-7
Figure 7-3. Exit of the muffler.
Figure 7-4. Plate cut in half.

ERDC TR-08-1 7-8
Figure 7-5. Witness plate at the bottom of the first cell.
Before performing our study, the first chamber of the muffler was cleaned and vacuumed to remove debris and dust. Clean witness plates were placed on the floor of the muffler in front of the gun muzzle at 6, 11, and 16 m in the first chamber, at 22 m in the second, and at 26 m in the third (Fig. 7-5). A hatch was modified to install a gas sampling manifold near the gun muzzle. This manifold was built to accommodate numerous tubes for the collection of gases and aerosols (Fig. 7-6). A large maintenance hatch in the first chamber was opened to allow positioning and collection of witness plates and the collection of samples. At the top of the first cell chamber, there was an opening equipped with a large valve and a pumping system to evacuate the gases between the firing (Fig. 7-7). The muffler was equipped with carbon monoxide sensors that automatically activated the pumps when the concentration exceeded 250 ppm. For the purpose of our study, this system was operated manually to allow the collection of gases before they were evacuated. For safety reasons the muffler chambers were pumped after firing two rounds to avoid a fire. Personnel were allowed to enter the muffler only after 15 minutes of pumping, when the carbon monoxide monitors measured undetectable concentrations. Also, special respiratory protective equipment, i.e., a special mask, an outfit, and a con-tinuous multi-gas monitor for oxygen, carbon monoxide, and hydrogen

ERDC TR-08-1 7-9
sulphide, from Industrial Scientific Corporation Model ITX PN 1810-4307, were worn to prevent exposure (Fig. 7-8).
Figure 7-6. Gas valve with pumps and opened hatch.
Figure 7-7. Evacuation system for gases in the muffler.

ERDC TR-08-1 7-10
Figure 7-8. Protective outfit and mask.
Equipment and Munitions
Three 105-mm howitzer guns that are currently used in the Canadian Forces can be used for direct or indirect fire. These guns, the Howitzer Light Towed 105-mm C1, the Howitzer Light Towed 105-mm C3, and the Howitzer Light Towed 105-mm LG1 Mark II are illustrated in Figure 7-9. The C3 and the LG1 Mark II guns have been used at most of the past artil-lery trials DRDC Valcartier attended. The C3 Howitzer was used in this study. The C3 Howitzer consists of a RDM (Netherlands) modified and upgraded C1/M101 fitted with a 33-caliber progressive to constant right-hand twist barrel (1:35 increasing to 1:18 for 2.794 m, constant at 1:18 for last 0.306 m). The barrel has 36 grooves and is fitted with a muzzle brake. The C3 is manually single-loaded, is fitted with a horizontal sliding breech, and fires both standard (M67 charge) and extended range ammunition. Maximum range is 11.6 km with High Explosive gun propellant M1 (HE M1) and 19 km with HE C132 extended range. The C3 and the LG1 Mark II guns can use the same ammunition.

ERDC TR-08-1 7-11
Figure 7-9. Types of guns used by the Canadian Army.

ERDC TR-08-1 7-12
Ammunition for the 105-mm howitzer is classified as semi-fixed. All rounds including practice have adjustable propelling charges. Note that High Explosive Squash Head (HESH), and Squash Head/Practice, al-though using the M67 (adjustable) charge design, are furnished only with Charges 1 to 6, i.e., full charge for direct fire. For the purpose of our study, we fired at full charge but also at Charge 4. There are eight types of 105-mm ammunition available for the C3 gun. We used the Squash Head prac-tice C-60 for our study since it is forbidden to fire HE rounds in the sand butts at the Nicolet Range.
The C60 Squash Head Practice (SH/PRAC) projectile is ballistically matched (training equivalent) to the HESH, L43 series cartridges. The car-tridge consists of an M14 cartridge, M67 propelling charges (Charges 1 to 6), a M28A2 percussion Primer, and a Tracer C2 projectile [23]. The M28 percussion primer contains 19.5 g of Class 1 black powder and 0.065 g of No. 70 primer mixture [23–24]. Black powder is composed of 74.0 ± 1.0% potassium nitrate, 10.4 ± 1.0% sulfur, and 15.6 ± 1.0% charcoal. The primer mixture No. 70 is composed of 25 ± 3% of lead sulphocyanate, 17 ± 2% of antimony sulfide, 53 ± 5% of potassium chlorate, and 5 ± 0.5% of TNT, type II.
The M67 propelling charge consists of approximately 1.28 kg of M1 single base propellant. A typical adjusted charge weight (ACW) for a Wt Zone 2, HE, M1 projectile is shown in Table 7-1.
Table 7-1. Mass of propellant in Bags 1 to 7 in 105-mm rounds.
Bag number Weight of propellants
(g) Web size
(mm)
1 245 0.38
2 40 0.38
3 72 0.71
4 110 0.71
5 114 0.71
6 260 0.71
7 406 0.71
In our squash head practice C60 rounds, only six bags were used in the M67 propelling charge. The propellant for each charge increment is loaded into a polyester-viscose rayon cloth bag, which is marked with the incre-ment (charge) number. Charges 1 and 2 use 0.38-mm (FNH.015 inch)
ERDC TR-08-1 7-13
single perforation type II propellant while Charges 3 to 7 use 0.71-mm (FNH.025 inch) multi-perforated (seven holes) type I propellant. Charge 5 incorporates a piece of lead foil 114-mm × 198-mm × 0.05-mm as a de-coppering agent. All the charges are loaded to permit the withdrawal of the increment bags without disturbing the base charge (Fig. 7-10). The M67 charge provides improved uniformity of performance, better accuracy, and less muzzle flash than obtained with single granulated charges. The differ-ent grain sizes are illustrated and can be compared in Figures 7-11 and 7-12. The propellant is M1 single-base propellant described in Reference 25 and its composition is shown in Table 7-2.
2,6-DNT is present in the M1 propellant since it is an impurity associated with the manufacture of 2,4-DNT. Technical grade 2,4-DNT is typically composed of 70% 2,4-DNT, 30% 2,6-DNT, and small amounts of 3,4-DNT, 2,3-DNT, and 2,5-DNT [24]. The 105-mm squash head practice C60 round has a maximum propellant charge of 850 g instead of 1240 g since only six bags are present in the M67 design (Bag 7 being not present). When fired at Charge 4, Bags 5 and 6 were removed from the M67 charge, thus remov-ing 375 g of propellant grains (Fig. 7-12).
The projectile consists of a seamless steel tube fitted with a single copper driving band pressed into a groove machined in the projectile body. The nose of the projectile is made of aluminum alloy and is fitted with a threaded aluminum nose plug. Four C2 tracer assemblies are press-fitted into the base plug (Fig. 7-13). Each assembly contains 2.4 g of red tracer composition SR 372 and 0.5 g of igniter composition SR 399. A visible trace is provided from approximately 200 m to a minimum of 1000 m. The entire ammunition weighs 13.73 kg (Fig. 7-14).

ERDC TR-08-1 7-14
Figure 7-10. Propellant bags within the M67 charge.

ERDC TR-08-1 7-15
Figure 7-11. Bag 1 opened: Small propellant grain.
Figure 7-12. Bags 5 and 6 opened: Large propellant grain.
ERDC TR-08-1 7-16
Table 7-2. Composition of single-base propellant M1.
Chemical Weight percentage in the propellant
(%)
Nitrocellulose 85% ± 2%
2,4-DNT 10% ± 2%
Dibutylphthalate 5% ± 1%
Potassium sulphate 1% ± 0.3%
Diphenylamine 0.9% ± 1.2%
Sampling Strategy and Nomenclature
As described earlier, in the muffler, plates were placed at 6, 11, 16, 22, and 26 m in front of the gun muzzle. The first three plates were placed in the first cell and named A1, A2, and A3. The fourth and fifth plates were placed in B and C cells and named B1 and C1. Before the trials, the plates were thoroughly sprayed with acetone and distilled water to remove any residual energetic materials from past trials that may still have been present on the plates. Also, pre-firing blanks were obtained by wiping these plates with gauzes wetted with distilled water and ethanol to evalu-ate if particles were displaced and deposited on the plates simply by mov-ing around before sampling in the chambers. These blank samples were named Blanks A1, A2, A3, B1, and C1. Single background composite sam-ples were also collected before the firing on each chamber floor and were named Res-A, Res-B, and Res-C. These composite samples were analysed in the field using the TravelIR, a FT-IR from SensIR Technologies, and they were also analysed off site for energetic materials and metals.
The first part of the study involved firing 10 rounds using the full charge of six bags of propellant. After the first two rounds, gases were collected for 15 minutes by starting our small pumps. The sampling tubes clogged dur-ing this first sampling event since the concentrations of particles were too high. The hatch was then opened after complete carbon monoxide evacua-tion and the witness plates were sampled. These samples were named F-1-2-A1 to C1 to describe the samples collected after the first two rounds fired and collected in each of the cells. The same nomenclature was used to de-scribe all the samples collected during the gun firing in the muffler, so other samples were named F-3-6-A1 to C1 to describe the samples col-lected after firing the series of the third to sixth firings and so on. After observing the amount of residues collected on the plates, it was decided to collect gases after firing two rounds to avoid clogging of the tubes and to

ERDC TR-08-1 7-17
wipe the plates after firing four rounds. We also took the opportunity to sample one empty shell after the firing to evaluate the concentration of chemicals in the shells after firing (Fig. 7-15).
Figure 7-13. Primer locations within the Squash Head Practice C60.

ERDC TR-08-1 7-18
Figure 7-14. Squash Head Practice C60 105-mm round projectile.
Figure 7-15. Empty shells that were sampled after firing.
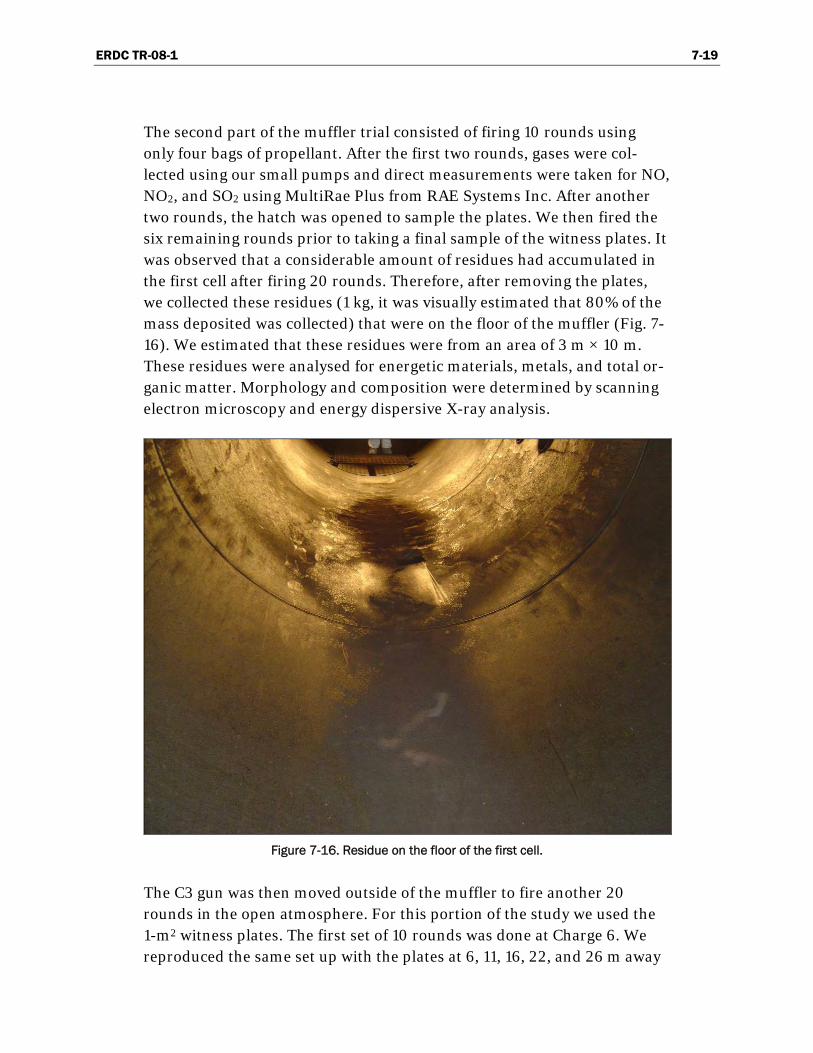
ERDC TR-08-1 7-19
The second part of the muffler trial consisted of firing 10 rounds using only four bags of propellant. After the first two rounds, gases were col-lected using our small pumps and direct measurements were taken for NO, NO2, and SO2 using MultiRae Plus from RAE Systems Inc. After another two rounds, the hatch was opened to sample the plates. We then fired the six remaining rounds prior to taking a final sample of the witness plates. It was observed that a considerable amount of residues had accumulated in the first cell after firing 20 rounds. Therefore, after removing the plates, we collected these residues (1 kg, it was visually estimated that 80% of the mass deposited was collected) that were on the floor of the muffler (Fig. 7-16). We estimated that these residues were from an area of 3 m × 10 m. These residues were analysed for energetic materials, metals, and total or-ganic matter. Morphology and composition were determined by scanning electron microscopy and energy dispersive X-ray analysis.
Figure 7-16. Residue on the floor of the first cell.
The C3 gun was then moved outside of the muffler to fire another 20 rounds in the open atmosphere. For this portion of the study we used the 1-m2 witness plates. The first set of 10 rounds was done at Charge 6. We reproduced the same set up with the plates at 6, 11, 16, 22, and 26 m away

ERDC TR-08-1 7-20
from the gun muzzle in front of the gun (Fig. 7-17). These samples were named F for firing followed by the number of the firing and position (see Fig. 7-18). As an example, the sample collected on the plate at 11 m in front of the gun after rounds 3 to 6 were fired was named F-3-6-ext2. Moreover, we placed an additional plate 29 m behind the gun where most of the smoke (gases) emitted from the muzzle were passing over. This plate was sampled only after all 20 rounds had been fired and was named EXT plate. Furthermore, upon discussion with the master gunner, it was decided to place four additional witness plates at positions where personnel normally stand during shooting exercises (Fig. 7-18). The samples collected at these positions were named according to F for firing followed by the number of the rounds fired and the number of the position, such as F-7-10-Pos 1. Wiping of the plates took place after the first two rounds and then after sets of four rounds. We also collected a surface composite sample around the plates and around the gun to evaluate if residues existed before the fir-ing. This sample was named soils ext. Two additional blank samples were done and named Blank ext 1 and 2.
Figure 7-17. Setup of witness plate outside the muffler.

ERDC TR-08-1 7-21
EXT 5 26 m
EXT 4 22 m
EXT 3 16 m
EXT 2 11 m
EXT 1 6 m
4.5 m
11 m
16 m 5.7 m
29 m WALLExt
Pos 1Pos 4,5,6
Table position 2
Table position 3
4.5 m
5.7 m
Table position 1
Pos 2Pos 3
Table Position 1, 2 and 3 are the positions where the gases were collected.
Gun4.5 m
Figure 7-18. Setup of the part of the study conducted outside of the muffler.
ERDC TR-08-1 7-22
For the gas samples, it was decided to pump continuously while firing all 10 rounds at Charge 6 outdoors. Upon visual inspection of the gases (smoke) emitted during the firings, the table containing the pumping sys-tem was moved three times to improve on intercepting the gases, the sec-ond position being the best place (Fig. 7-18). So, after firing four rounds, the table stayed at the second location for the remaining of the firings.
Firing of ten additional rounds with Charge 4 took place in two successive events of four and six rounds fired. Wiping took place after both of these series were fired. To complete the study, we collected a sample by wiping the gun barrel close to the muzzle and back of the tube near the breech. This sample was named Gun wiping.
Parameter, Sample Collection, and Analytical Methods
To avoid the degradation of the energetic materials residue, the witness plates were sampled immediately after firing was completed and the gases in the chamber evacuated. The solid residues deposited onto the alumi-num plates, if any, were first transferred to a 250-mL amber sample bottle with some clean dry 4-ply rayon polyester 10.2- × 10.2-cm swabs. Each plate was then thoroughly wiped with ethanol-soaked swabs that were put into the 250-mL amber sample bottle containing the particulates. Sample jars were immediately put in an icebox on site and were transferred to the lab where they were kept at –20 °C until extraction.
Based on the composition of the propellant it was decided to sample the gas emissions for nitrogen oxides, sulfur dioxide, hydrogen cyanide, nitro-aromatic compounds, benzene, toluene, ethylbenzene and xylene, and dinitrotoluene compounds. Although carbon dioxide and carbon monox-ide were expected, we did not feel these compounds would be present in concentrations high enough during outdoor exercises to create a serious health effect for gunners. However, these gases would become important to estimate if the soldiers were in a confined space. Samples were also collected for total particulates and an analysis of particle size distribution was performed on the filters.
Direct measurements were taken using MultiRae gas monitor for NO2, NO, and SO2. Gas samples were collected and sent for further analysis for dust and particle size, gaseous and particulate cyanide, nitroaromatic com-pounds, and volatile organic compounds (benzene, ethylbenzene, toluene, and xylene [BTEX]). Aerosol samples were also collected for 2,4-DNT and
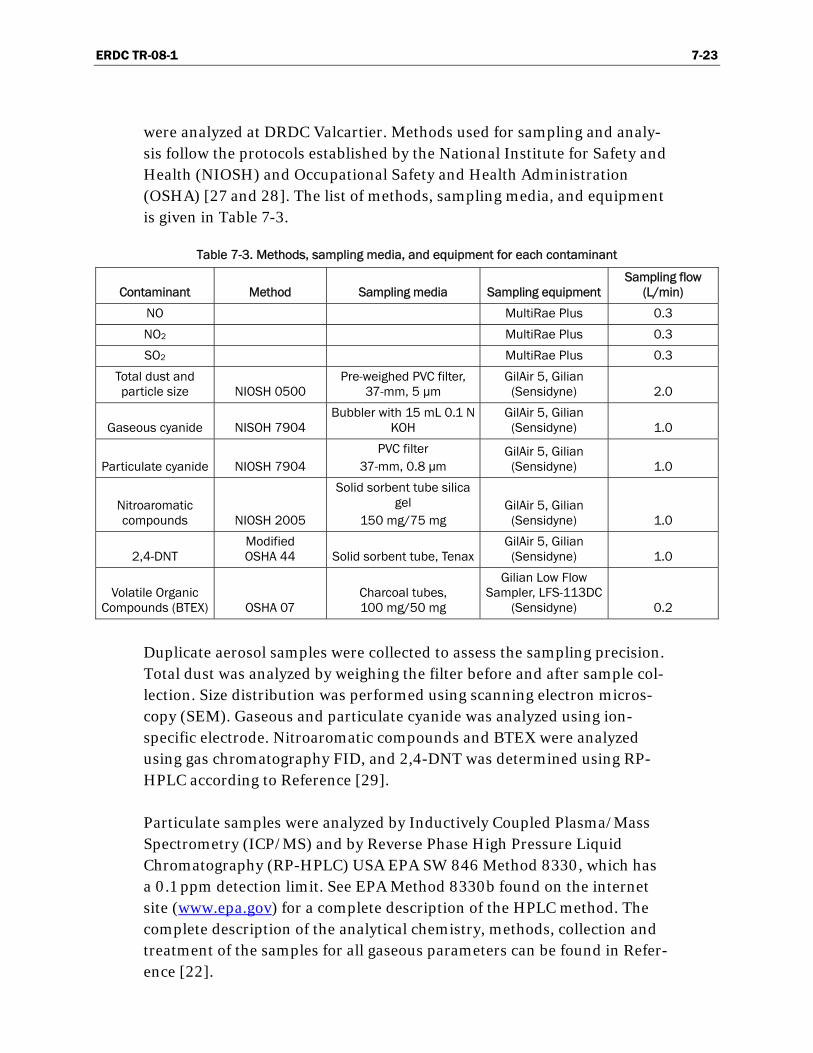
ERDC TR-08-1 7-23
were analyzed at DRDC Valcartier. Methods used for sampling and analy-sis follow the protocols established by the National Institute for Safety and Health (NIOSH) and Occupational Safety and Health Administration (OSHA) [27 and 28]. The list of methods, sampling media, and equipment is given in Table 7-3.
Table 7-3. Methods, sampling media, and equipment for each contaminant
Contaminant Method Sampling media Sampling equipment Sampling flow
(L/min)
NO MultiRae Plus 0.3
NO2 MultiRae Plus 0.3
SO2 MultiRae Plus 0.3
Total dust and particle size NIOSH 0500
Pre-weighed PVC filter, 37-mm, 5 µm
GilAir 5, Gilian (Sensidyne) 2.0
Gaseous cyanide NISOH 7904 Bubbler with 15 mL 0.1 N
KOH GilAir 5, Gilian
(Sensidyne) 1.0
Particulate cyanide NIOSH 7904 PVC filter
37-mm, 0.8 µm GilAir 5, Gilian
(Sensidyne) 1.0
Nitroaromatic compounds NIOSH 2005
Solid sorbent tube silica gel
150 mg/75 mg GilAir 5, Gilian
(Sensidyne) 1.0
2,4-DNT Modified OSHA 44 Solid sorbent tube, Tenax
GilAir 5, Gilian (Sensidyne) 1.0
Volatile Organic Compounds (BTEX) OSHA 07
Charcoal tubes, 100 mg/50 mg
Gilian Low Flow Sampler, LFS-113DC
(Sensidyne) 0.2
Duplicate aerosol samples were collected to assess the sampling precision. Total dust was analyzed by weighing the filter before and after sample col-lection. Size distribution was performed using scanning electron micros-copy (SEM). Gaseous and particulate cyanide was analyzed using ion-specific electrode. Nitroaromatic compounds and BTEX were analyzed using gas chromatography FID, and 2,4-DNT was determined using RP-HPLC according to Reference [29].
Particulate samples were analyzed by Inductively Coupled Plasma/Mass Spectrometry (ICP/MS) and by Reverse Phase High Pressure Liquid Chromatography (RP-HPLC) USA EPA SW 846 Method 8330, which has a 0.1 ppm detection limit. See EPA Method 8330b found on the internet site (www.epa.gov) for a complete description of the HPLC method. The complete description of the analytical chemistry, methods, collection and treatment of the samples for all gaseous parameters can be found in Refer-ence [22].
ERDC TR-08-1 7-24
To prepare the polyester swabs for RP-HPLC analysis, a known volume of acetonitrile between 100 and 150 mL was added to each bottle that was placed on a shaker table for 18 hours followed by one hour in a sonic bath. The extracts were filtered with a 0.45-μ filter and either concentrated in a Zymark apparatus to reach lower detection limits (Turbovap evaporator, produced by Zymark Corporation, Hopkinton, Massachusetts, USA) or di-luted to obtain final concentrations within the linear response of the cali-bration curve.
Extracts were maintained at 4°C. Analyses were performed with a HPLC Agilent HP 1100 equipped with a degasser G1322A, a quaternary pump model G1311A, an autosampler G1313A, and a UV diode array detector model G1315A monitoring at 210, 220, and 254 nm. The injection volume was 20 μL and the column was a Supelcosil LC-8 (25 cm × 3-mm × 5 μm) eluted with 15:85 isopropanol/water (v/v) at a flow rate of 0.75 mL/min. The column temperature was maintained at 25° C during the analysis. Standards and solvents were diluted 1:1, acetonitrile to water (0.5 mL Acn/0.5 mL water).
The residue collected on the floor of the muffler after 20 rounds (10 rounds at Charge 6 plus 10 rounds at Charge 4 [see Fig. 7-14]) was ana-lyzed by scanning electron microscopy (SEM) with a JEOL JSM-840A microscope equipped with a NORAN energy dispersive X-ray spectrometer in order to determine the morphology and chemical composition of the residue. Secondly, the residue was analyzed using energy dispersive X-ray analysis (EDX). In EDX, the X-ray signals give only qualitative informa-tion.
The residue was finally analyzed for organic material by thermal analysis. Classical gravimetric analysis was performed with regular ceramic crucible and a muffle furnace (Fisher Scientific). The procedure involved three heating phases: 1) 100°C for 60 minutes; 2) 550°C for 90 minutes; 3) 950°C for 60 minutes. After each heating step, the sample was cooled to room temperature in a desiccator and weighed. The weight loss in the first heating phase corresponds to the humidity of the sample; second step to the volatile content (organic matter); third step to the carbon content (in-organic carbon). The weight of the residues represents the ash content (other inorganics, as metals). Values for volatiles, fixed carbon, and ash were calculated on a dry weight basis. Triplicate samples were analyzed with an average weight of 2.5 g of residue.

ERDC TR-08-1 7-25
These results were compared to those obtained with thermogravimetry analysis and differential thermal analysis. The instrument used is a Simul-taneous DCS-TGA Q-series (SDT Q600) (TA Instruments). The heating program began at 30°C to 1500°C at a 10°C/min rate in dry air at 50 mL/min. Results were analyzed by the Universal Analysis 2000 (TA In-struments) software. The sample was dried in a desiccator prior to analy-sis. Average sample weight was 7 to 8 mg. Because of the very small sam-ple size, six replicates were analyzed. TGA-DTA graph showed two distinct curves. One showed the change in the weight of the sample while heating (TGA curve), the other showed the energy change in the sample while heating (DTA). The difference in temperature between the sample and the reference was measured in function of temperature. DTA tells if the reaction undergoing in the sample is endothermic (plotted downwards) or exothermic (upwards).
Metals were analysed using the methods from the Environment Ministry of the Province of Quebec [30] (MA. 203 – Met. 3.0, MA. 200 – Met 1) by Inductively Coupled Plasma/Mass Spectrometry (ICP/MS) by an external laboratory (Bodycote Canada Inc. in Montreal). Metals analyzed for this study were Ag, Al, As, B, Ba, Be, Bi, Ca, Cd, Co, Cr, Cu, Fe, K, Li, Mg, Mn, Mo, Na, Ni, P, Pb, Sb, Se, Sn, Sr, Ti, Tl, U, V, and Zn.

ERDC TR-08-1 7-26
Results and Discussion
All the samples collected during the gun firing inside and outside the muf-fler were placed in amber bottles and sent to DRDC Valcartier for HPLC analysis. One sample was lost during the shipping and the wipe for sample F-7-10 P 4/5/6 was not recovered, therefore no value is available for that position. Blank samples were collected before firing in the muffler to evaluate the dispersion of particles caused by our presence in the muffler during the sampling. Visual residues were seen on the floor of the first cell, which was vacuumed before starting the gun firing in the muffler. Efforts were made to have the muffler installation cleaned prior to our trial, but excessive costs were encountered and cleaning was not done. Vacuuming was performed only in the first cell, considered to be the most important cell, but the second and third cells were left as they were. Residues were observed in the last C cell, but we were not able to remove them. As de-scribed earlier, three series of firings were done in the muffler.
During the firing inside the muffler, the particle concentrations were extremely high, which induced clogging of the filters and of the sorbent tubes. The first test firing with six bags of propellants was aborted since some pumps stopped during the sampling due to filter/tube clogging. This test had to be repeated but the pumps were stopped earlier to avoid clog-ging. The first test using six bags was discarded since the total sampling volume was unknown and represented unreliable results.
For data interpretation of gaseous results, environmental standards and toxicology reports from the United States Environmental Protection Agency (US EPA), Health Canada, and the Canadian Council of the Minis-try of Environment (CCME) were used. Threshold Limit Values (TLV) from the American Conference of Governmental Industrial Hygienists (ACGIH) were not considered applicable in our case as we were not evalu-ating personal exposure over an eight-hour period. Data interpretation is mainly based on possible rather than actual health risks due to exposure to emissions compounds.
Mononitroaromatic compounds were never detected, even inside the muf-fler. It was concluded that the combustion process does not allow for the

ERDC TR-08-1 7-27
formation of these compounds. Dinitrotoluene was found only when firing at Charge 6 and at very low concentrations.
Gun Firing in the Muffler: Witness Plates
If one examines Table 7-4, which lists the results from witness plates dur-ing the muffler firing, it can be observed that explosives are found in the blank and also in some samples at low concentrations. Quantities of explo-sives varied between 1 and 12 µg with one value in the C cell at 44 µg. Out-side blank A1, no explosives were found in the A cell, possibly because it was vacuumed before taking the blanks. Normally, explosives should not be present in the muffler since gun powder does not contain conventional explosives such as TNT, RDX, and HMX. Double-base propellant contains nitrocellulose and nitroglycerin, but this latter compound was not de-tected. The explosives detected can be considered as anomalous and could possibly be the result of contamination of our protective gear or coming from contamination from the lab. Nevertheless, the concentrations being very low, these compounds were neglected. Nearly all the samples revealed 2,4-DNT contamination. In the blanks, 20 and 30 µg were found in A and B cells while 540 µg was found in the C cell, probably the result of the resi-dues from previous firing activities that were present in that cell. M1 gun propellant contains 10% of 2,4-DNT that is supposed to have an impurity of 2,6-DNT, its position isomer at a ratio of 70:30 [26]. The two M1 pro-pellant grain sizes were analysed by HPLC and revealed 2,4-DNT at 9.95% in the small grain while at 10.02% w/w in the large grain. 2,6-DNT was also observed at concentrations of 0.19 and 0.22% in small and large grain, respectively. The ratio of 70:30 for 2,4 and 2,6-DNT is not observed in the grain being at 98:2 ratio. Surprisingly, all the samples collected showed that 2,6-DNT is present at 1.7-2.2% of the 2,4-DNT. It is highly probable that military M1 gun propellant uses purified 2,4-DNT as a plasticizer showing very low concentrations of 2,6-DNT.
All samples showed concentrations of 2,4-DNT. After firing the first series of two rounds, 7 mg were found just in front of the gun muzzle in A1, and the concentrations decreased very rapidly with distance, especially outside of the A cell where most of the gases and residues were contained during the firings. The second series of four rounds was accomplished with twice the amount of rounds and 2,4-DNT was found roughly at twice the amount, except for A2, where four times the quantity was found. For the third series of four rounds fired at Charge 6, a lower concentration of 2,4-DNT was observed, but following our entry in the muffler after the second
ERDC TR-08-1 7-28
series, it was observed that condensation was forming on the walls of the muffler. Upon entering the muffler after firing the third series, visual in-spection of the plates revealed less residues; it is likely that residues stick to the walls, lowering the quantities of residues deposited on the plates.
The fourth and fifth series were fired at Charge 4, and for these samples most of the contamination was found on the A1 plate with a rapid decreas-ing concentration for the A2, A3, B1, and C1 plates. If we compare the fourth series that corresponds to firing four rounds with the series at F-3-6 fired at Charge 6, fewer residues of 2,4-DNT were found at Charge 4, but considering that less propellant was burned, this could result in a less effi-cient combustion. Finally, firing the last series with six rounds at Charge 4 revealed quantities of almost 30 mg on A1 plate. This last quantity is more than twice the firing of four rounds at same charge; normally, all things being equal, a quantity of 20 mg should have been observed. It is highly possible that residues coming from the accumulation of firing 20 rounds were contributing to this last firing. It must be pointed out that 1 kg of residues was collected on the floor of the A cell after firing the 20 rounds, so the possibility of disturbing residues in the final shootings is highly probable.
To evaluate the deposition surface for the residues, the floor of the A cell was measured and 3 m of the cell floor was judged significant for the depo-sition of the residues. Considering that the A cell has a diameter of 4 m, this leads to a half circumference of 6 m. Considering the length of the A cell, a surface of 125 m2 was calculated when using half of the cylinder as the surface of deposition. If we stick to our 3 m of real surface, the result-ing surface for cell A is 62.5 m2. Doing the same calculation for Cell B and C resulted in 14 and 6.25 m2 surfaces, respectively. Considering that the plates are 0.5 m2, firing 10 rounds at Charge 6 in A cell gave 38.5 mg ac-cumulated on a surface of 1.5 m2. Extrapolating to the deposition surface of the A cell at 62.5 m2 resulted in a quantity of 1.605 g of 2,4-DNT depos-ited by the firing of 10 rounds at Charge 6. These ten rounds represent 8.4 kg of propellant burned during the firing meaning 841 g of 2,4-DNT pre-sent in the charge. Therefore, we estimated that 0.19% of the original mass of 2,4-DNT was spread by the firing of 10 rounds and this only in cell A. If we combined all the DNT deposited in the three cells, we estimated that the percentage of 2,4-DNT spread by the firing of 10 rounds at Charge 6 is 0.20%. As mentioned, there was condensation in the muffler after firing the six first rounds at Charge 6; this could explain the lower results ob-

ERDC TR-08-1 7-29
served for the last rounds 7-10. It is thought that residues stick to the walls instead of being deposited on the plates. If we remove those rounds from our calculation, we obtain an estimate of 0.23% of 2,4-DNT spread by the rounds fired at Charge 6. This last percentage means that at Charge 6, each time a round is fired, 193 mg of 2,4-DNT is put in the environment.
Applying the same calculations to the firing of 10 rounds at Charge 4 in the muffler, considering that now the amount of propellant burned firing those 10 rounds is 4.67 kg, led to the spreading of 0.39% of 2,4-DNT. As discussed earlier, the muffler contained residues on the floor up to 1 kg at the end of the firings and it is highly possible that disturbances during the firing put these residues on the plates, inducing an error on the deposition values. Making the calculation with only the first four rounds fired at Charge 4 led to the spreading of 0.29% of 2,4-DNT. This last percentage means that at Charge 4, each time a round is fired, 135 mg of 2,4-DNT is put in the environment.
These results indicate that firing at Charge 6 spread fewer residues than firing at Charge 4. This could make sense if one thinks that igniting a lar-ger amount of propellant in the gun barrel should lead to higher tempera-ture and pressure, resulting in a better combustion and transformation of the product toward carbon dioxide formation, water, and nitrogen. Never-theless, it can be considered that firing 105-mm rounds spread in the envi-ronment between 0.2 and 0.4% of 2,4-DNT depending on the conditions of firing. Because of the size of our training areas, most of the artillery firings are done at lower charges, such as Charge 4. This means that for a normal firing activity, each round at Charge 4 puts 187 mg of 2,4-DNT in the environment. Considering that one gun can fire easily 100 rounds per activity, this would result in the spreading of 18.7 g of 2,4-DNT. All these results showed that artillery firing may spread important quantities of 2,4-DNT in the surface soils that may eventually reach the groundwater at firing positions.

ERDC TR-08-1 7-30
Table 7-4. Results from analyses of particles emitted during the muffler gun firing.
Sample Charge #bags
HMX (mg)
RDX (mg)
TNT (mg)
2,4-DNT (mg)
2,6-DNT (mg)
Blank A1 0.003 0.001 0.02
Blank A2
Blank A3
Blank B1 0.001 0.03
Blank C1 0.54 0.002
F- 1-2-A1 6 7.01 0.12
F- 1-2-A2 6 1.94
F- 1-2-A3 6 0.21
F- 1-2-B1 6 0.006 0.04
F- 1-2-C1 6 0.003 0.044 0.14
F- 3-6-A1 6 14.22 0.28
F- 3-6-A2 6 8.49 0.10
F- 3-6-A3 6 0.55
F- 3-6-B1 6 0.48
F- 3-6-C1 6 0.001 0.007 0.03
F- 7-10-A1 6 3.47 0.07
F- 7-10-A2 6 2.15 0.02
F- 7-10-A3 6 0.48
F- 7-10-B1 6 0.003 0.17
F- 7-10-C1 6 0.003 0.012 0.02
F- 11-14-A1 4 12.52 0.28
F- 11-14-A2 4 0.53 0.01
F- 11-14-A3 4 0.14
F- 11-14-B1 4 0.05
F- 11-14-C1 4 0.005 0.11
F- 15-20-A1 4 29.90 0.68
F- 15-20-A2 4 0.61 0.01
F- 15-20-A3 4 0.07
F- 15-20-B1 4 0.10
F- 15-20-C1 4 0.002 0.03
Nitroglycerin was not found in any samples.
ERDC TR-08-1 7-31
Outdoor Gun Firing: Witness Plates
In the outdoor gun firing, the only explosives (HMX, RDX, TNT, and NG) found on any plates were NG on plate F-15-20 Pos 3 detected at 4.3 mg and RDX detected in one blank at 0.02 mg. It is possible that NG was pre-sent at the firing positions coming from earlier firings using double-base propellant, but it was not detected in the soil sample collected around the plates and the gun. No NG was present in our firing and this chemical should not have been detected. For RDX, its presence at this concentration could come from contamination. Since the soil composite did not reveal any energetic compound except 2,4-DNT at 0.38 ppm, the RDX value was rejected as an impurity. 2,4-DNT was observed in all firings but not farther than 11 m in front of the gun muzzle. The wind was blowing in the direc-tion of the EXT plate and it is highly possible that without any wind, residues could have been observed farther than 11 meters. Dubé et al. ob-served residues deposited in front of an LG II Mark Gun at 7 m at concen-trations of 35 mg/m2 [18]. It is not known from this study if the concentra-tions would have decreased after 11 m, but they observed roughly constant concentrations from 0 to 7 m in front of the gun after firing 10 rounds.
The same pattern of firing was used for the outdoor experiment. First, two rounds were fired followed by two series of four rounds at Charge 6, then firing a series of four and six rounds at Charge 4. If one looks at the results in Table 7-5, firing two rounds at Charge 6 spread 0.22 mg, while shooting four rounds subsequently spread 1.97 and 2.55 mg of 2,4-DNT. 2,6-DNT when detected was always at concentrations representing 2% of the 2,4-DNT. Military MI gun propellant is probably prepared with purified 2,4-DNT that contains only 2% of 2,6-DNT as an impurity, such as the one sold by Aldrich Chem Co. Differences between firing two or four rounds can be explained by the presence of wind that blew irregularly that day, leading to a factor of 10 between concentrations. Firing at Charge 4 also showed great variations between firing four and six rounds, resulting in 13.47 and 9.33 mg deposited, respectively. It is highly possible that the wind blew away particles from the plates, lowering the concentrations. This demonstrated that studying emissions outside is much more difficult than inside the muffler, even if some limitations were encountered in the muffler. Comparison between firing at Charge 6 and 4 revealed again that more residues were observed when firing at Charge 4.
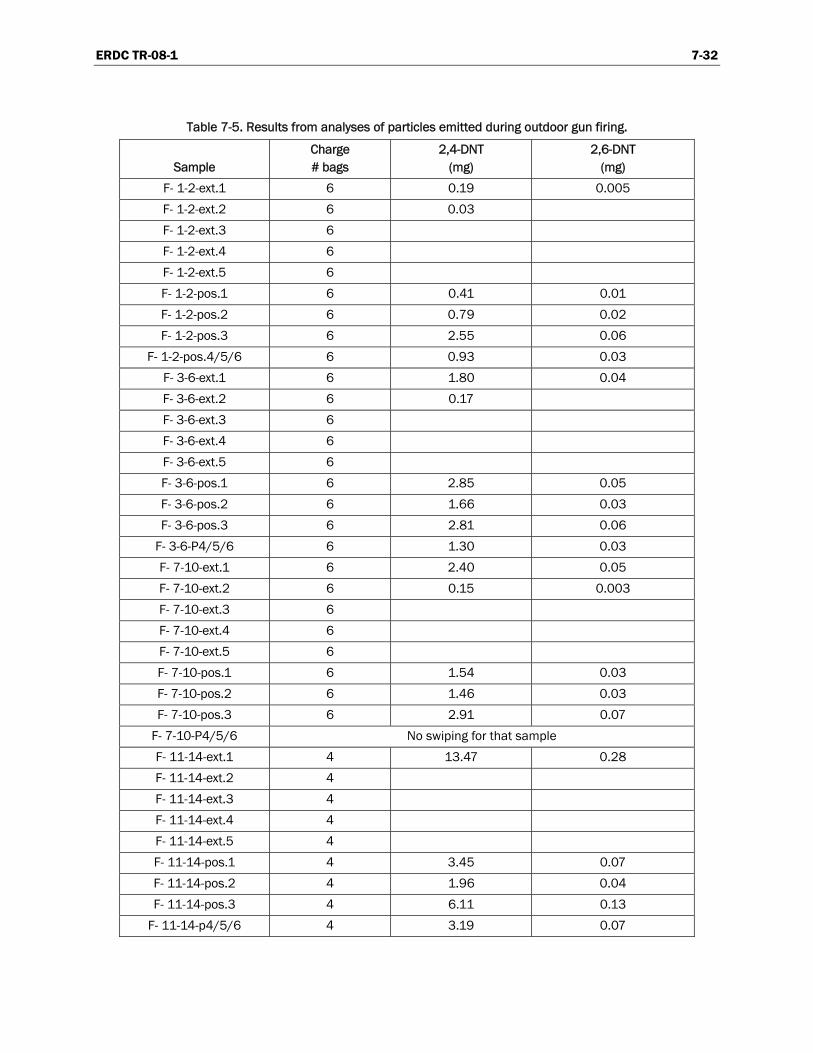
ERDC TR-08-1 7-32
Table 7-5. Results from analyses of particles emitted during outdoor gun firing.
Sample Charge # bags
2,4-DNT (mg)
2,6-DNT (mg)
F- 1-2-ext.1 6 0.19 0.005
F- 1-2-ext.2 6 0.03
F- 1-2-ext.3 6
F- 1-2-ext.4 6
F- 1-2-ext.5 6
F- 1-2-pos.1 6 0.41 0.01
F- 1-2-pos.2 6 0.79 0.02
F- 1-2-pos.3 6 2.55 0.06
F- 1-2-pos.4/5/6 6 0.93 0.03
F- 3-6-ext.1 6 1.80 0.04
F- 3-6-ext.2 6 0.17
F- 3-6-ext.3 6
F- 3-6-ext.4 6
F- 3-6-ext.5 6
F- 3-6-pos.1 6 2.85 0.05
F- 3-6-pos.2 6 1.66 0.03
F- 3-6-pos.3 6 2.81 0.06
F- 3-6-P4/5/6 6 1.30 0.03
F- 7-10-ext.1 6 2.40 0.05
F- 7-10-ext.2 6 0.15 0.003
F- 7-10-ext.3 6
F- 7-10-ext.4 6
F- 7-10-ext.5 6
F- 7-10-pos.1 6 1.54 0.03
F- 7-10-pos.2 6 1.46 0.03
F- 7-10-pos.3 6 2.91 0.07
F- 7-10-P4/5/6 No swiping for that sample
F- 11-14-ext.1 4 13.47 0.28
F- 11-14-ext.2 4
F- 11-14-ext.3 4
F- 11-14-ext.4 4
F- 11-14-ext.5 4
F- 11-14-pos.1 4 3.45 0.07
F- 11-14-pos.2 4 1.96 0.04
F- 11-14-pos.3 4 6.11 0.13
F- 11-14-p4/5/6 4 3.19 0.07

ERDC TR-08-1 7-33
Table 7-5 (cont’d).
Sample Charge # bags
2,4-DNT (mg)
2,6-DNT (mg)
F- 15-20-ext.1 4 7.59 0.15
F- 15-20-ext.2 4 1.74 0.03
F- 15-20-ext.3 4
F- 15-20-ext.4 4
F- 15-20-ext.5 4
F- 15-20-pos.1 4 7.88 0.16
F- 15-20-pos.2 4 3.43 0.07
F- 15-20-pos.3 4 10.40 0.22
F- 15-20-p4/5/6 4 0.87 0.01
Blank ext.1
Blank ext.2
Gun wiping 1.28
EXT plate 0.18
Spreading of 2,4-DNT can be estimated if we assume that the area where residues deposit in front of the gun has a maximum distance of 11 m and a maximum angle of dispersion of 60○. This represents the situation where the gun is used as direct fire. In the case where indirect fire is used, the elevation of the gun is different and should project particles at farther dis-tances, meaning a larger surface to be contaminated. With these parame-ters, the surface area would be 63 m2. Using this surface, firing two rounds at Charge 6 spread 0.007% of 2,4-DNT. Firing two series of four rounds at Charge 6 led to the spreading of 0.03% and 0.05% of 2,4-DNT. Firing a series of four and six rounds at Charge 4 led to the spreading of 0.45% and 0.21% of 2,4-DNT, respectively. It is observed here that firing six rounds at Charge 4 spread fewer residues than firing four rounds, and this repre-sents an inconsistency. The wind is clearly responsible for those discrep-ancies. Therefore, it is recommended that future trials use particle traps containing ethanol instead of witness plates. In particle traps, the wind can not move away the residues.
Results from the witness plates located where the users usually stand up during real exercises are also given in Table 7-5. We named those positions 1–6 according to Figure 7-18. In most of the cases, higher concentrations were found on these plates, indicating that the gunners are exposed to the gases and particles emitted during firing. The values ranged from 0.41 to

ERDC TR-08-1 7-34
2.91 mg when firing at Charge 6 compared to 0.87 to 10.40 mg when firing at Charge 4. Again, more residues were found when firing lower charges. In most cases, Position 3 was the most exposed. This plate was positioned between the gun muzzle and the EXT plate, in the direction of wind flow past the muzzle. This proves that the wind was a very important factor in this experiment. All the positions are exposed to important concentra-tions, and consequently, this indicates that the users may be exposed and a potential health risk will have to be evaluated. The gun wipe also showed 2,4-DNT at a concentration of 1.28 mg. Finally, the EXT plate that was placed far away from the gun muzzle in the wind direction showed 2,4-DNT at 0.18 mg. This indicates that this contaminant can be dispersed far away from the gun muzzle, also pointing out at the difficulty of evaluating the contaminated surface.
This part of the study demonstrated that it is more difficult to collect residues from firing outdoors than firing inside the muffler installation. Furthermore, the surface of contaminated area is also more difficult to evaluate, introducing uncertainty in the results.
Muffler Firing: Residue Collected on the Floor After 20 Rounds
The residue collected (1.079-kg sample) on the floor of the muffler after firing 20 rounds (Fig. 7-16) was put in a bag stored in the dark at 4°C until analysis. It was first characterized by scanning electron microscopy (SEM) and energy dispersive X-ray analysis (EDX). Figures 7-19 (#0045) and 7-20a (#0046) were obtained at a magnification factor of 50×. One can see that the particles are very large and irregular; intact fibers are present, but no spherical particles. Figure 7-20b is a backscattered electron image (BEI) of the same sample as presented on Fig. 7-20a. The white dots (indi-cated by the red arrows) are due to the copper-zinc alloy (holes in the ad-hesive tape). The EDX spectrum of the fiber (blue arrow) was obtained (Fig. 7-21). The X-ray spectrum showed that the composition of the fiber was mostly Pb, K, O, and C. We believe that this is a nitrocellulose fiber (as said earlier, N is not seen by the detector) coated with Pb and K. When firing the 105-mm howitzer, the Pb foil in bag #5 is vaporized and the fiber may have served as a condensation media. Potassium may come from the K2SO4 added in the M1 powder composition (1%). This compound is dis-persed in the gun powder, thus on the nitrocellulose fibers.
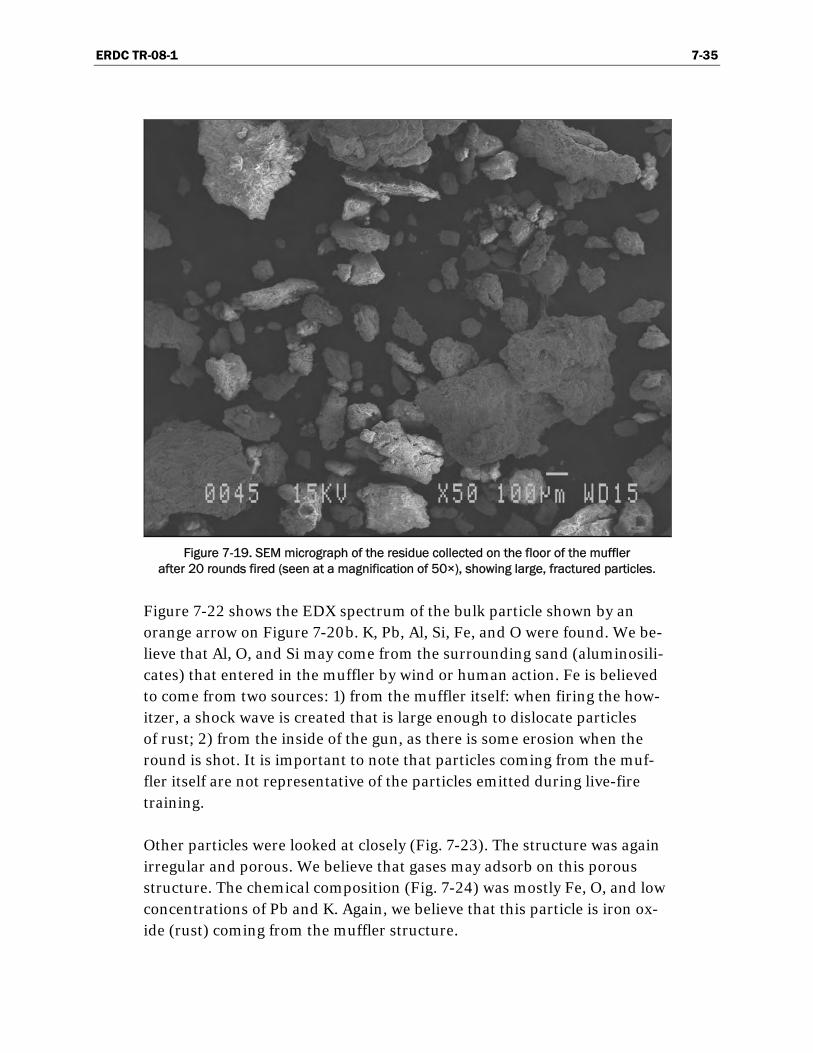
ERDC TR-08-1 7-35
Figure 7-19. SEM micrograph of the residue collected on the floor of the muffler
after 20 rounds fired (seen at a magnification of 50×), showing large, fractured particles.
Figure 7-22 shows the EDX spectrum of the bulk particle shown by an orange arrow on Figure 7-20b. K, Pb, Al, Si, Fe, and O were found. We be-lieve that Al, O, and Si may come from the surrounding sand (aluminosili-cates) that entered in the muffler by wind or human action. Fe is believed to come from two sources: 1) from the muffler itself: when firing the how-itzer, a shock wave is created that is large enough to dislocate particles of rust; 2) from the inside of the gun, as there is some erosion when the round is shot. It is important to note that particles coming from the muf-fler itself are not representative of the particles emitted during live-fire training.
Other particles were looked at closely (Fig. 7-23). The structure was again irregular and porous. We believe that gases may adsorb on this porous structure. The chemical composition (Fig. 7-24) was mostly Fe, O, and low concentrations of Pb and K. Again, we believe that this particle is iron ox-ide (rust) coming from the muffler structure.
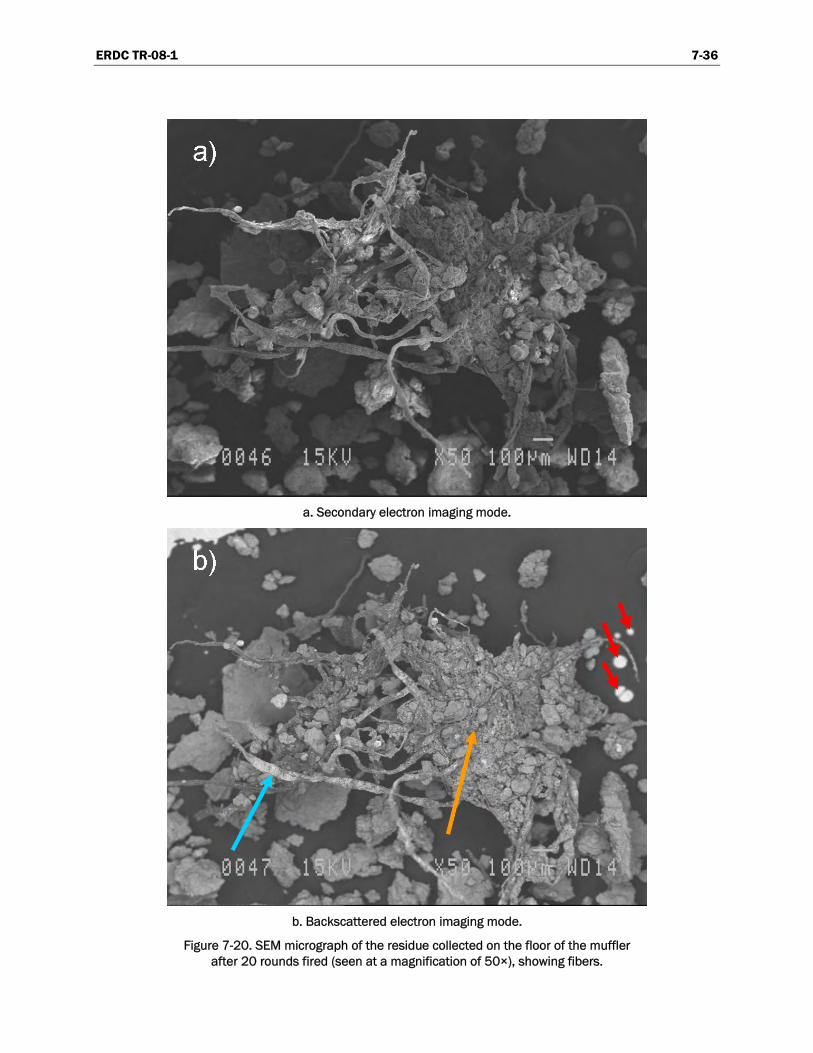
ERDC TR-08-1 7-36
a. Secondary electron imaging mode.
b. Backscattered electron imaging mode.
Figure 7-20. SEM micrograph of the residue collected on the floor of the muffler after 20 rounds fired (seen at a magnification of 50×), showing fibers.

ERDC TR-08-1 7-37
Figure 7-21. EDX spectrum of the fiber on Figure 7-20b (red arrow).
Figure 7-22. EDX spectrum of the bulk particle on Figure 7-20b (orange arrow).

ERDC TR-08-1 7-38
Figure 7-23. SEM micrograph of the residue collected on the floor of the muffler
after 20 rounds fired (seen at a magnification of 1,000×).
Figure 7-24. EDX spectrum of the particle on Figure 7-23.
Frequently, we observed uniform particles in composition (iron oxide, most probably originating from the muffler structure) (Fig. 7-25, BEI and Fig. 7-26a, EDX), but with nucleation centers of Pb (Fig. 7-26b, EDX). The presence of this kind of particle was very common in the sample.

ERDC TR-08-1 7-39
Figure 7-25. SEM micrograph of the residue collected on the floor of the muffler after 20
rounds fired seen at a magnification of 1,500× in the backscattered electron imaging mode (EDX of the regions pointed by the arrows on Figure 7-26).
It seems that the majority of the sample collected at the bottom of the muffler was iron oxide, thus not representing the usual conditions of live firing of ammunition. We do not know at this time if the liberation of iron oxide particles in the muffler atmosphere when firing the gun modifies the chemical reactions in the plume. Thermal analysis of the sample was undertaken to verify the proportion of inorganic material such as iron oxide, in the sample.
The proportion of organic matter versus inorganic matter determined by gravimetric analysis is shown in Table 7-6. The results confirmed the ob-servations made with SEM on particles. They are mainly composed of ele-ments other than carbon and oxygen, such as iron and lead. Only 13% of the mass is organic material, 0.50% is fixed carbon, and the final 87% is ash. As noted earlier, we believe that these results will not be observed for particles collected in live-fire training activities, as erosion of the muffler seemed to be the main source of particles collected on the floor of the muf-fler. Results obtained with classical gravimetry were compared with those obtained with differential thermal analysis. A typical graph is presented in Figure 7-27. A compilation of the replicates is presented in Table 7-7. Re-
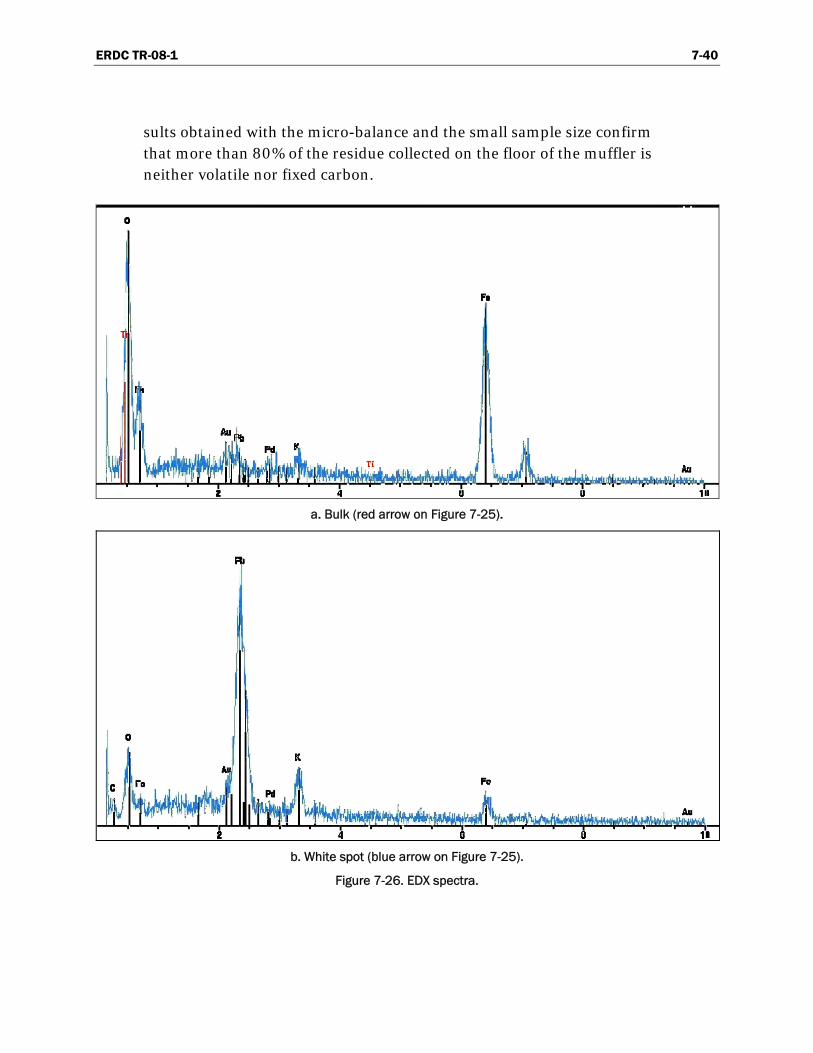
ERDC TR-08-1 7-40
sults obtained with the micro-balance and the small sample size confirm that more than 80% of the residue collected on the floor of the muffler is neither volatile nor fixed carbon.
a. Bulk (red arrow on Figure 7-25).
b. White spot (blue arrow on Figure 7-25).
Figure 7-26. EDX spectra.

ERDC TR-08-1 7-41
Table 7-6. Gravimetric analysis of the residue.
Sample Humidity
(wt.%) Volatiles (wt. %)
Fixed carbon (wt. %)
Ash (wt. %)
1 15.04 13.40 0.48 86.12
2 15.27 12.21 0.58 87.21
3 14.34 12.67 0.45 86.88
Mean 14.88 12.76 0.50 86.74
Figure 7-27. Typical TGA-DTA of the residue collected on the floor of the muffler after 20 rounds fired.
In Figure 7-27 and on graphs of other replicates, there is a loss in weight between 30 and 100°C associated with an endothermic process. This is probably due to the presence of humidity even though the sample was kept in a desiccator. Thus, the percentage of volatiles might be slightly over-estimated because it was calculated as the weight difference between the sample at 550°C and 30°C.The important mass loss between 200°C and 400°C, the degradation of volatiles, is of course associated with an exo-thermic process.

ERDC TR-08-1 7-42
Table 7-7. Thermogravimetric analysis of the residue.
Sample Volatiles (wt. %)
Fixed carbon (wt. %)
Ash (wt. %)
1 15.57 0.49 83.94
2 14.43 0.68 84.89
3 15.66 0.56 83.78
4 22.34 0.49 77.17
5 18.94 0.66 80.4
6 16.56 0.66 82.78
Mean 17.25 0.59 82.16
Results from the ICP-MS analysis of metals are presented in Table 7-8. More than 47% w/w of the sample is composed of metals, with 39% w/w of iron. This confirms that the majority of the sample was inorganic (metal oxides), most probably coming from erosion of the muffler itself. Copper (1.7 % w/w approximate) is believed to come from the projectile. Lead (1.2% w/w approximate) comes from the de-coppering agent present in Bag #5.
Finally, HPLC analyses of this large sample revealed that it contained 2,4-DNT at a concentration of 1,280 mg/kg with 2,6-DNT at 23 mg/kg. Again the ratio 2,4/2,6 DNT is 98:02, showing that the DNT used for the M1 formulation is a purified chemical and not the commercial technical grade.
Air Emissions Results
Particle Size and Distribution of the Particles Collected on the Monitoring Filters
Particles in the plume at the muzzle of the gun for trials both inside the muffler and outside were collected using filters. Particle concentrations for the different tests were determined by calculating the mass of particles de-posited and using the total volume of air drawn through the filter. It is be-lieved that the particles of rust observed on the floor of the muffler, which were discussed previously, due to their large size and high density, settle on the floor quickly and are not collected by the filters. For the muffler firings at six bags, airborne particle concentrations of 320 and 310 mg/m3 were obtained after firing two rounds, while at Charge 4, the concentra-tions were 180 and 150 mg/m3, also after firing two rounds. Sampling was stopped after two rounds because tubes clogged. For the outdoor firing,
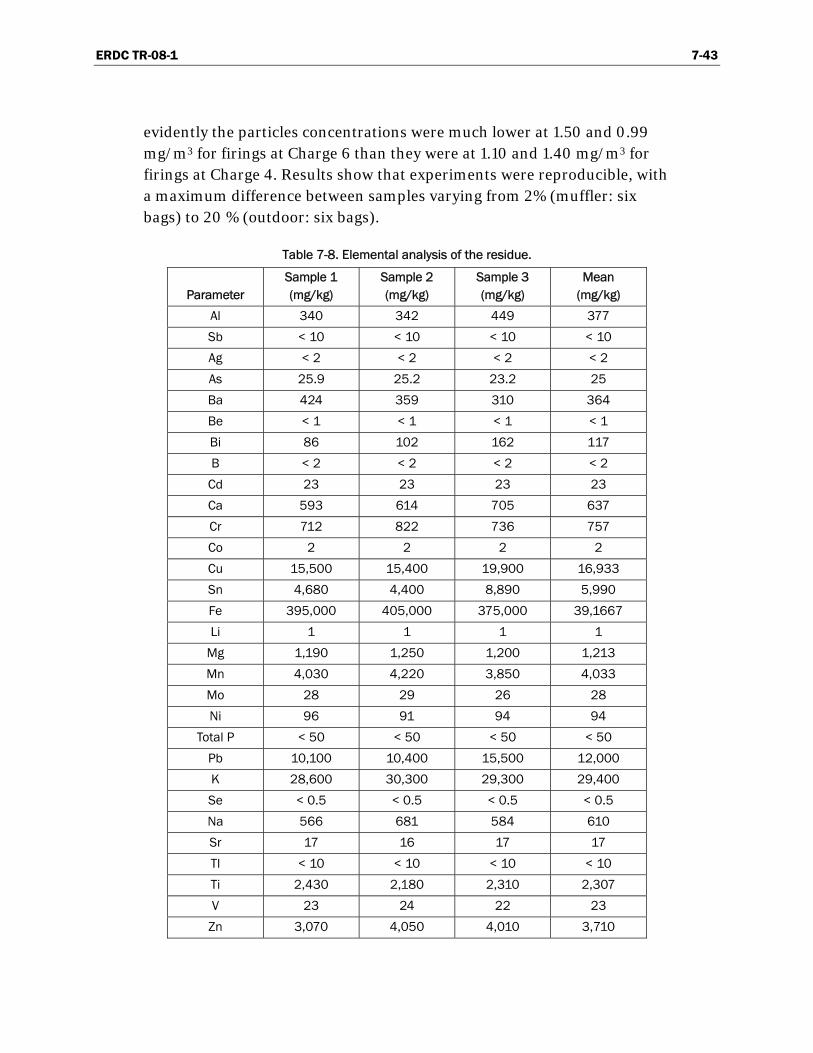
ERDC TR-08-1 7-43
evidently the particles concentrations were much lower at 1.50 and 0.99 mg/m3 for firings at Charge 6 than they were at 1.10 and 1.40 mg/m3 for firings at Charge 4. Results show that experiments were reproducible, with a maximum difference between samples varying from 2% (muffler: six bags) to 20 % (outdoor: six bags).
Table 7-8. Elemental analysis of the residue.
Parameter Sample 1 (mg/kg)
Sample 2 (mg/kg)
Sample 3 (mg/kg)
Mean (mg/kg)
Al 340 342 449 377
Sb < 10 < 10 < 10 < 10
Ag < 2 < 2 < 2 < 2
As 25.9 25.2 23.2 25
Ba 424 359 310 364
Be < 1 < 1 < 1 < 1
Bi 86 102 162 117
B < 2 < 2 < 2 < 2
Cd 23 23 23 23
Ca 593 614 705 637
Cr 712 822 736 757
Co 2 2 2 2
Cu 15,500 15,400 19,900 16,933
Sn 4,680 4,400 8,890 5,990
Fe 395,000 405,000 375,000 39,1667
Li 1 1 1 1
Mg 1,190 1,250 1,200 1,213
Mn 4,030 4,220 3,850 4,033
Mo 28 29 26 28
Ni 96 91 94 94
Total P < 50 < 50 < 50 < 50
Pb 10,100 10,400 15,500 12,000
K 28,600 30,300 29,300 29,400
Se < 0.5 < 0.5 < 0.5 < 0.5
Na 566 681 584 610
Sr 17 16 17 17
Tl < 10 < 10 < 10 < 10
Ti 2,430 2,180 2,310 2,307
V 23 24 22 23
Zn 3,070 4,050 4,010 3,710

ERDC TR-08-1 7-44
As expected, particle concentrations inside the muffler were extremely high. Comparison of concentrations after firing at Charge 6 and at Charge 4 showed that at Charge 6 the particle concentrations were roughly twice those observed after firing at Charge 4. If one looks carefully at the quanti-ties of propellant at Charge 4 and Charge 6, he will realize that both charges contained 285 g of 0.38-mm-diameter grains in Bags 1 and 2. When using the charge at four bags, an additional quantity of 182 g of 0.71-mm-diameter grain is burned, while when using the charge at six bags, the additional quantity is 556 g. If small-diameter grains burned dif-ferently than the larger grains, we should have observed three times more particles, considering that the quantity of large grains are three times big-ger at Charge 6 than at Charge 4 (556 g versus 182 g). If we do not dis-criminate between the combustion efficiency of small and large grains, taking into account that the quantities of propellants at Charge 6 is twice the one at Charge 4 therefore explain the results. Twice the quantity of propellants leads to twice the amount of particles emitted during the com-bustion. The main conclusion here is that the combustion behavior of small grains and large grains are similar regardless of the size and number of holes in the grains. If we consider that the combustion process and reac-tivity is closely related to the surface that burns, this indicates that the specific surface of the small grain should be very similar to the large grain.
Considering that the first cell of the muffler has a volume of 251.3 m3 and considering that a concentration of 320 mg/m3 was observed while firing at Charge 6, this means that 80.40 g of particles were emitted during the firing of four rounds at Charge 6. Out of a total amount of 3.364 kg of pro-pellant, this emission of 80.4 g of particles represents an emission of 2.4%. At this stage, it is impossible to determine what exactly these particles were, and earlier it was demonstrated that the residues at Charge 6 were deposited on the plates at a percentage of 0.2%. It is most likely that the particles that were in suspension and collected contained the rust emitted by the muffler that was found later deposited on the floor of cell A.
Outdoor tests gave an average concentration of particles of 1.25 mg/m3 for both six and four bags of propellant. It is highly possible that even at con-stant pumping, these tests never reached their maximum concentration, so no differences were observed. Considering the previous results obtained in the muffler, this indicates that the precision of the measurements outside is not as good as the measurements inside the muffler or that the combus-tion is completely different outside than inside the muffler. This could also

ERDC TR-08-1 7-45
indicate that our setup in these specific conditions reached a plateau or has a poor ability to catch gases and particles.
The size distribution of the particles is given in Table 7-9. There are no values available for the outdoor firing with a charge of four bags since the laboratory had a problem with the filter, therefore this sample was dis-carded. Recommendations for particulate matter concentrations from the United States Environmental Protection Agency (US EPA), Health Canada, and the Canadian Council of Ministers of the Environment (CCME) for total particles and various sizes of particles are shown in Table 7-10.
Table 7-9. Size distribution of particles for the various tests.
Test < 4 µm
(%) > 4 µm to < 10 µm
(%) > 10 µm to < 50 µm
(%)
79.8 19.0 1.2 Muffler: six bags
78.5 19.8 1.7
82.4 15.8 1.8 Muffler: four bags
76.6 21.3 2.1
98.7 1.3 0.0 Outdoor: six bags
90.6 8.7 0.7
Table 7-10. Recommendations for particulate matter concentration in ambient air.
Particle size
US EPA (mg/m3) Ref 34
Health Canada (mg/m3) Ref 35
CCME (mg/m3) Ref 31
PM10a 0.15
PM2.5b 0.015
PM2.5c 0.035 0.03
TSPd 0.07
TSPe 0.12
TSPf 0.40 a Particulate Matter < 10 µm, 24-hour standard b Particulate Matter < 2.5 µm, annual standard c Particulate Matter < 2.5 µm, 24-hour standard d Total Suspended Particulate, annual standard, maximum acceptable level e Total Suspended Particulate, 24-hour standard, maximum acceptable level f Total Suspended Particulate, 24-hour standard, maximum tolerable level
ERDC TR-08-1 7-46
The size distribution is similar for Charge 6 and 4 inside the muffler, with about 80% of the particles being lower than 4 µm and about 98% lower than 10 µm. For outdoor tests, more than 90% of the particles are lower than 4 µm and 100% are lower than 10 µm. This means that the combus-tion at Charges 4 and 6 produced similar particle size distribution even if the grain size proportion is different. This confirms that small and large grains burned similarly even if the sizes are different. This is another indi-cation that the specific surfaces might be similar in both sizes. Fine parti-cles are considered to be the most hazardous particles [31-32]. Particles under 4 µm are known to be deposited in the gas-exchange region of the lungs [33]. Chronic exposure to fine particles is known to induce cardiac-related and respiratory effects in humans [32]. In our case, sub-micron particles were observed during firings. The average concentration in out-door tests was 1.25 mg/m3, which was much higher than the recom-mended concentrations for total suspended particles, PM10 and PM2.5, from the US EPA, Health Canada, and the CCME. As outdoor sampling time was only about 40 minutes, it is difficult to compare the results with any standards. Nevertheless, particle concentrations showed a potential health risk for artillery military personnel since particles are mostly under 4 µm. Also, any contaminant associated with these fine particles will be deposited in the lungs. This potential health risk for the users will have to be assessed in further studies.
Hydrogen Cyanide
Total hydrogen cyanide levels are shown in Table 7-11, which includes the US EPA reference concentration (RfC) for chronic inhalation exposure [36]. The reference concentration for the US EPA is an estimate (with un-certainty spanning perhaps an order of magnitude) of a daily inhalation exposure of the human population (including sensitive subgroups) that is likely to be without an appreciable risk of deleterious effects during a life-time [36].
Cyanide is well absorbed by the gastrointestinal tract and the skin, and is rapidly absorbed by the respiratory tract. Cyanide is rapidly distributed through the body, although there is no accumulation of cyanide in the blood or tissues following chronic exposure. Approximately 80% of cya-nide is metabolized to thiocyanate in the liver, which is excreted in the urine [37]. Chronic hydrogen cyanide exposure is known to induce neuro-logical, respiratory, cardiovascular, and thyroid effects [36-37]. Occasion-ally, irritation to the skin and eyes may be observed. Typical exposure for
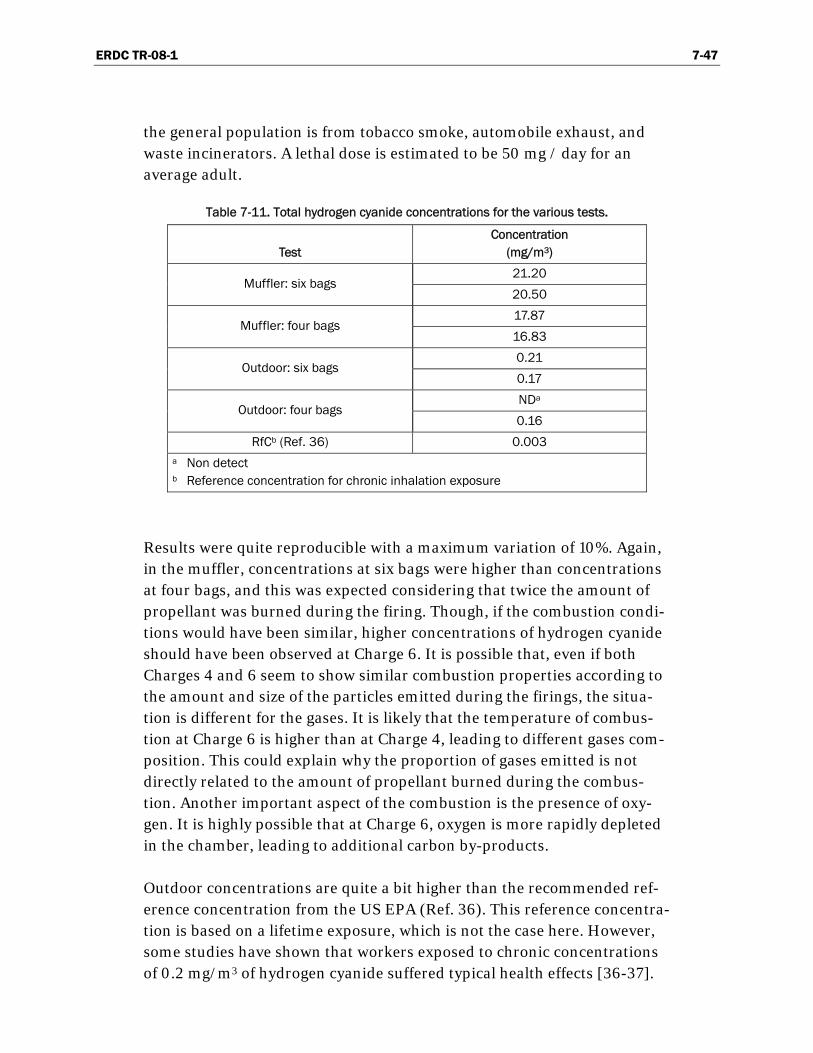
ERDC TR-08-1 7-47
the general population is from tobacco smoke, automobile exhaust, and waste incinerators. A lethal dose is estimated to be 50 mg / day for an average adult.
Table 7-11. Total hydrogen cyanide concentrations for the various tests.
Test Concentration
(mg/m3)
21.20 Muffler: six bags
20.50
17.87 Muffler: four bags
16.83
0.21 Outdoor: six bags
0.17
NDa Outdoor: four bags
0.16
RfCb (Ref. 36) 0.003 a Non detect b Reference concentration for chronic inhalation exposure
Results were quite reproducible with a maximum variation of 10%. Again, in the muffler, concentrations at six bags were higher than concentrations at four bags, and this was expected considering that twice the amount of propellant was burned during the firing. Though, if the combustion condi-tions would have been similar, higher concentrations of hydrogen cyanide should have been observed at Charge 6. It is possible that, even if both Charges 4 and 6 seem to show similar combustion properties according to the amount and size of the particles emitted during the firings, the situa-tion is different for the gases. It is likely that the temperature of combus-tion at Charge 6 is higher than at Charge 4, leading to different gases com-position. This could explain why the proportion of gases emitted is not directly related to the amount of propellant burned during the combus-tion. Another important aspect of the combustion is the presence of oxy-gen. It is highly possible that at Charge 6, oxygen is more rapidly depleted in the chamber, leading to additional carbon by-products.
Outdoor concentrations are quite a bit higher than the recommended ref-erence concentration from the US EPA (Ref. 36). This reference concentra-tion is based on a lifetime exposure, which is not the case here. However, some studies have shown that workers exposed to chronic concentrations of 0.2 mg/m3 of hydrogen cyanide suffered typical health effects [36-37].

ERDC TR-08-1 7-48
The latter is similar to concentrations observed during outdoor tests, sug-gesting that with long-term, continuous, and repeated exposure there is also here a potential health risk for artillery soldiers. In normal operations, artillery soldiers are not exposed in this manner (long-term, continuous and repeated) and the risk of any health effect is very small. Further inves-tigation will be needed to assess personal exposure.
Nitrogen Oxides and Sulfur Dioxide
As for the preliminary assessment [38], nitrogen dioxide, NO2, was never detected, even inside the muffler, suggesting that the combustion process does not allow for the production of NO2, although further investigation may be needed to confirm this result. In the outdoor test, only nitric oxide, NO, was detected. Inside the muffler, using firing with six bags of propel-lant, NO concentrations ranged from approximately 66 to 76 ppm, while sulfur dioxide concentrations ranged from 15 to 16 ppm. Firing with four bags of propellant, NO concentrations ranged from 52 to 65 ppm, while sulfur dioxide ranged from 10 to 11 ppm. Again, here the proportion of gases is not directly related to the amount of propellants burned, also pointing towards different combustion parameters, such as the tempera-ture of the combustion. Similarly to the previous assessment [38], NO con-centrations were lower than 1 ppm for all outdoor tests. As stated previ-ously, the MultiRae Plus is not accurate for concentrations below 1 ppm. According to MWO Newman (D FHP, personal communication), concen-trations below 1 ppm are a result of background interference.
Health effects due to nitric oxide exposure are irritation of the upper respi-ratory tract, hypoxia/cyanosis, and formation of nitrosylhemoglobin [39]. However, effects are seen only at high concentrations (60 to 150 ppm). Concentrations observed during the outdoor tests do not suggest any po-tential health risk for nitric oxide, although personal exposure should be properly assessed to confirm this finding.
Exposure to sulfur dioxide produces irritation to the upper and lower res-piratory tracts [40]. Health effects can be observed at a concentration of 1 ppm. However, when there is a combined exposure to sulfur dioxide and ozone, health effects are observed at lower levels. Also, it seems that sulfur dioxide increases the carcinogenicity of benzopyrene by promoting its me-tabolism. Although not measured during our tests, benzopyrene is also a combustion product and is likely to be present in gun smoke. We did not observe sulfur dioxide in outdoor samples, but did observe it inside the
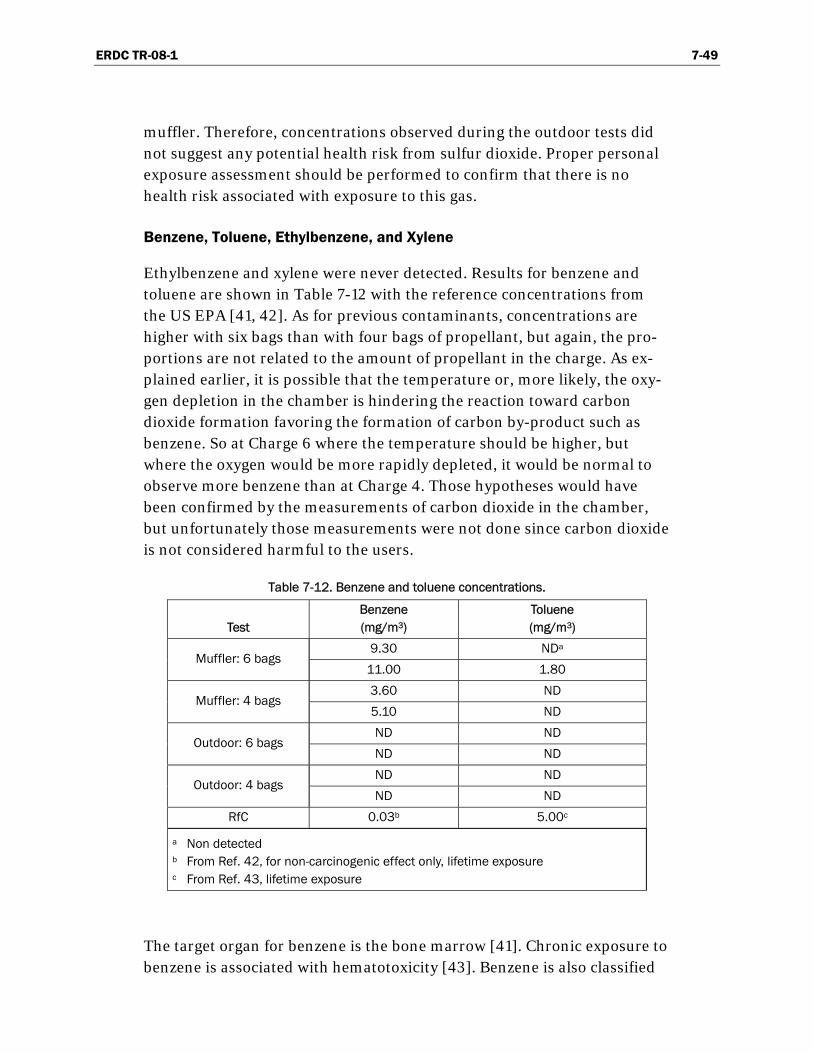
ERDC TR-08-1 7-49
muffler. Therefore, concentrations observed during the outdoor tests did not suggest any potential health risk from sulfur dioxide. Proper personal exposure assessment should be performed to confirm that there is no health risk associated with exposure to this gas.
Benzene, Toluene, Ethylbenzene, and Xylene
Ethylbenzene and xylene were never detected. Results for benzene and toluene are shown in Table 7-12 with the reference concentrations from the US EPA [41, 42]. As for previous contaminants, concentrations are higher with six bags than with four bags of propellant, but again, the pro-portions are not related to the amount of propellant in the charge. As ex-plained earlier, it is possible that the temperature or, more likely, the oxy-gen depletion in the chamber is hindering the reaction toward carbon dioxide formation favoring the formation of carbon by-product such as benzene. So at Charge 6 where the temperature should be higher, but where the oxygen would be more rapidly depleted, it would be normal to observe more benzene than at Charge 4. Those hypotheses would have been confirmed by the measurements of carbon dioxide in the chamber, but unfortunately those measurements were not done since carbon dioxide is not considered harmful to the users.
Table 7-12. Benzene and toluene concentrations.
Test Benzene (mg/m3)
Toluene (mg/m3)
9.30 NDa Muffler: 6 bags
11.00 1.80
3.60 ND Muffler: 4 bags
5.10 ND
ND ND Outdoor: 6 bags
ND ND
ND ND Outdoor: 4 bags
ND ND
RfC 0.03b 5.00c
a Non detected b From Ref. 42, for non-carcinogenic effect only, lifetime exposure c From Ref. 43, lifetime exposure
The target organ for benzene is the bone marrow [41]. Chronic exposure to benzene is associated with hematotoxicity [43]. Benzene is also classified
ERDC TR-08-1 7-50
as a known carcinogen and it has been associated with an increased risk of leukemia [41, 43]. At concentrations varying from 13 to 45 µg/m3, the risk level for cancer is 1 in 10,000 [41]. Environmental exposure to benzene is associated with automobile emissions, gas stations, and tobacco smoke, with inhalation as the primary route of exposure [43].
Results showed a variation between duplicate samples ranging from 8 to 17%. The high variation may be due to the fact that these results were close to the detection limit. Although benzene was not detected in outdoor tests, it was detected at high concentrations inside the muffler. Further investi-gation must be done to evaluate exposure to benzene to determine if there is any potential risk for the soldiers.
The main health effects associated with exposure to toluene are neurologi-cal effects [42–44]. Toluene is not considered carcinogenic and is known to be a competitive inhibitor of benzene [42, 44]. The principal routes of exposure are inhalation of contaminated air, ingestion of food and drink-ing water, and exposure to some consumer product where toluene is used as a solvent.
Toluene was detected only once inside the muffler using six bags of propel-lant. The observed concentration was lower than the RfC. It is therefore concluded that there is no potential health risk associated with exposure to toluene for artillery soldiers. However, it is recommended to assess per-sonal exposure to confirm this finding.
Dinitrotoluene Compounds
Concentrations of 2,4-dinitrotoluene in the gas phase are given in Table 7-13. There is no reference concentration for 2,4-dinitrotoluene [45]. 2,4-dinitrotoluene induces methemoglobinemia [46–47]. The resulting health effects are headaches, dizziness for acute exposure, and haemolytic anae-mia for chronic exposure. Also, 2,4-dinitrotoluene is a suspected carcino-gen [46, 48-49], the target organ being the urinary tract.
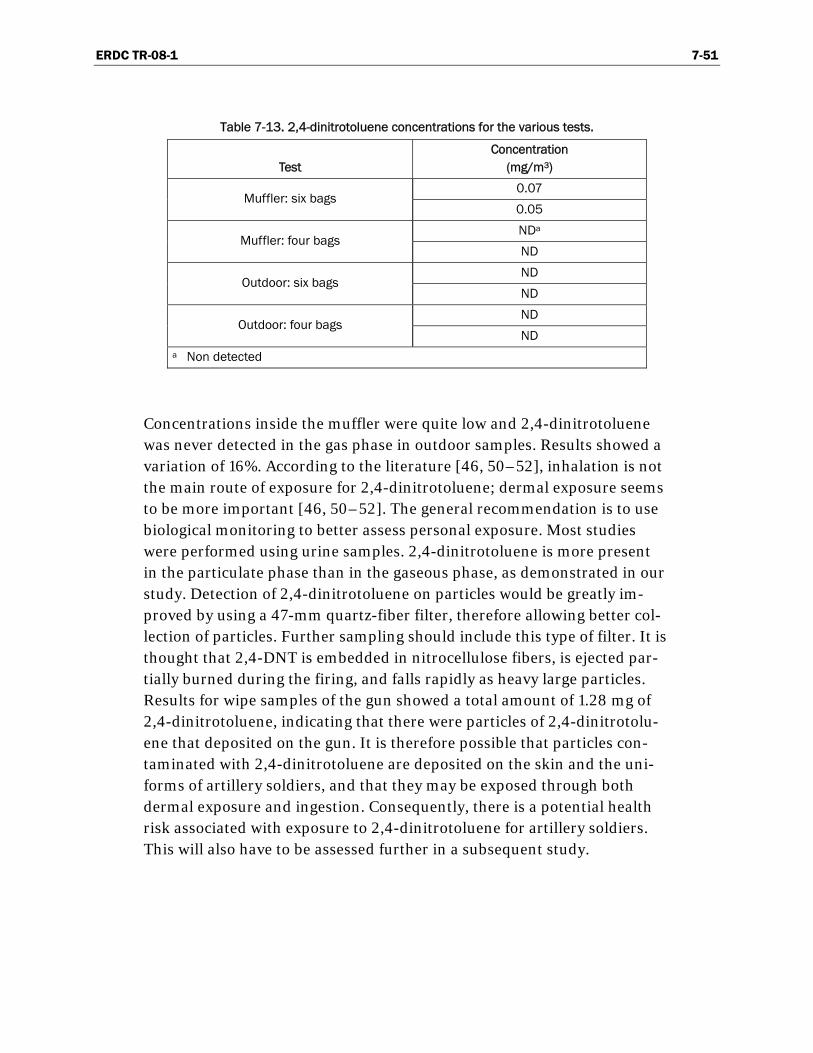
ERDC TR-08-1 7-51
Table 7-13. 2,4-dinitrotoluene concentrations for the various tests.
Test Concentration
(mg/m3)
0.07 Muffler: six bags
0.05
NDa Muffler: four bags
ND
ND Outdoor: six bags
ND
ND Outdoor: four bags
ND a Non detected
Concentrations inside the muffler were quite low and 2,4-dinitrotoluene was never detected in the gas phase in outdoor samples. Results showed a variation of 16%. According to the literature [46, 50–52], inhalation is not the main route of exposure for 2,4-dinitrotoluene; dermal exposure seems to be more important [46, 50–52]. The general recommendation is to use biological monitoring to better assess personal exposure. Most studies were performed using urine samples. 2,4-dinitrotoluene is more present in the particulate phase than in the gaseous phase, as demonstrated in our study. Detection of 2,4-dinitrotoluene on particles would be greatly im-proved by using a 47-mm quartz-fiber filter, therefore allowing better col-lection of particles. Further sampling should include this type of filter. It is thought that 2,4-DNT is embedded in nitrocellulose fibers, is ejected par-tially burned during the firing, and falls rapidly as heavy large particles. Results for wipe samples of the gun showed a total amount of 1.28 mg of 2,4-dinitrotoluene, indicating that there were particles of 2,4-dinitrotolu-ene that deposited on the gun. It is therefore possible that particles con-taminated with 2,4-dinitrotoluene are deposited on the skin and the uni-forms of artillery soldiers, and that they may be exposed through both dermal exposure and ingestion. Consequently, there is a potential health risk associated with exposure to 2,4-dinitrotoluene for artillery soldiers. This will also have to be assessed further in a subsequent study.

ERDC TR-08-1 7-52
Conclusion
105-mm practice rounds were fired at Charges 4 and 6 inside the muffler installation and also outdoors in open atmosphere to allow the comparison of data. The muffler chamber proved to be efficient for the collection of both particles and gases following artillery gun firing. The quantity of solid residues that were collected allowed the evaluation of the percentage of contaminants emitted during the firing of 105-mm rounds with charges of four and six bags of propellant. The manifold developed to collect gases was highly efficient at establishing the levels of gaseous emissions follow-ing gun firing.
Inside the muffler, three series of two, four, and four rounds at Charge 6 were fired followed by the firing of two series of four and six rounds at Charge 4. 2,4-DNT was the most important contaminant and was present on each plates after each series. These concentrations were higher in the A cell and ranged from 0.03 to 29.90 mg on half-meter plates. Surface of deposition was determined inside each cell of the muffler to allow the cal-culation of the percentage of 2,4-DNT dispersed by the firing. It was ob-served that firing at Charge 4 spread more residues than at Charge 6 with percentage of 2,4-DNT ranging from 0.29 to 0.39% for firing with four bags and from 0.019 to 0.23% when firing with six bags. This means that at Charge 6, each time a round is fired, 16 to 193 mg of 2,4-DNT is put in the environment, and at Charge 4, each time a round is fired, 135 to 182 mg of 2,4-DNT is put in the environment.
It is believed that the combustion process is better when using more pro-pellant because the temperature and pressure are higher, promoting the formation of end products such as carbon dioxide, water, and nitrogen. When firing inside the muffler, considering that this is a semi-closed space, this could on the other hand lead to a depletion of oxygen, hinder-ing the combustion. It is one of the recommendations of this study to monitor the carbon dioxide concentrations in future trials to evaluate if the reactions will be more or less complete. This was not done in this study because carbon dioxide is not considered harmful.
Before starting the gun firing in the muffler, the first cell was vacuumed, and upon firing, residues accumulated on the floor of the cell. At a certain
ERDC TR-08-1 7-53
point, especially for the last firings, these residues started interfering with the results. It was first thought that the 1-kg sample collected on the muf-fler floor was composed of residues from the gun firing. Many analyses were done to determine its composition and revealed that this large sam-ple was mainly rust coming from the muffler and also other metals such as lead. The sample also contained 0.12% of 2,4-DNT.
The second part of the firing was done outdoors using the same pattern. This part of the study consisted of firing three series of two, four, and four rounds at Charge 6, followed by the firing of two series of four and six rounds at Charge 4, all simulating direct fire. Plates were placed in front of the gun muzzle to allow the comparison between the two types of firings. Additional plates were also placed around the gun where users normally stand during the real firing activities. It was first observed that no 2,4-DNT was present at distances farther than 11 m. Wind was proposed as the cause to explain that the residues were not going very far in front of the gun. Evaluation of the contaminated surface was done and percentage of 2,4-DNT spread ranged from 0.007% to 0.05% when firing at Charge 6, while the percentage was 0.21 to 0.45% when firing at Charge 4. It was ob-served that these results were highly influenced by the wind direction and speed. It is recommended for future trials to use particle traps instead of witness plates, avoiding loss of residues blown away by the wind.
Positions of the gunners showed higher concentrations of 2,4-DNT than the plates in front of the gun, indicating that the gunners are exposed to the gases and particles emitted during firing and probably because the wind was blowing towards them during the exercise. The deposition ranged from 0.41 to 2.91 mg/m2 when firing at Charge 6, compared to 0.87 to 10.40 mg/m2 when firing at Charge 4. Again more residues were found when firing lower charges. In most cases, Position 3 was the most exposed, and this plate was between the gun muzzle and EXT plate, being in the di-rect passage of the wind. This proves that the wind played a very impor-tant role in this experiment. All the positions were exposed to important concentrations, and consequently, this indicated that the users may be ex-posed especially when the wind is blowing in their direction. When more data are available, it might be appropriate to perform a health risk assess-ment study. The gun was also wiped at the end of firing and showed 2,4-DNT at a concentration of 1.28 mg. Finally, the EXT plate that was placed far away from the gun muzzle in the wind direction showed 2,4-DNT at 0.18 mg. This indicated that this contaminant can be dispersed far away
ERDC TR-08-1 7-54
from the gun muzzle, also pointing out at the difficulty of evaluating the contaminated surface.
For the gaseous emissions and particle size distribution, tests inside the muffler installation as well as outdoor tests were quite conclusive, showing significant and statistically reproducible concentrations for various con-taminants. It was observed that particles are ejected during firing and the size distribution showed that sub-micron particles are emitted during the firing. Furthermore, results indicated that the quantities of particles were directly related to the quantities of propellant burned during the firing. Since the sizes of the propellant grains are different, it was concluded that both the small and large grains have similar specific surfaces exposed to the combustion due to the fact that large grains are multi-perforated. In the muffler during the firings, gases are not directly related to the quanti-ties of propellant burned during the firing. This was explained by the fact that at larger quantities of propellant, the temperature of the combustion should be higher, leading to different conditions in the combustion proc-ess. Consequently, hydrogen cyanide, nitric oxide, and benzene concentra-tions observed at Charge 6 were not twice that at Charge 4. Moreover, for benzene, it was observed that at Charge 6, the concentration was close to three times the one at Charge 4, while for hydrogen cyanide, the concen-tration at Charge 6 was only a little bit over the one at Charge 4. The same situation was observed for nitric oxide having a barely higher concentra-tion at Charge 6. As postulated, it is also possible that it is the oxygen de-pletion that is responsible for these differences. Oxygen depletion in the chamber would hinder the combustion reaction toward carbon dioxide formation, favoring the formation of carbon by-products such as benzene. So at Charge 6 where the temperature should be higher, but where the oxygen would be more rapidly depleted, it would be normal to observe more benzene than at Charge 4. The real confirmation of those hypotheses would have come from the measurements of carbon dioxide in the cham-ber, but unfortunately those measurements were not done since CO2 is not considered harmful to the users. All these results indicated a different chemistry in the plume for both charges resulting from different parame-ters in the combustion, such as temperature and oxygen presence. It is highly recommended that the temperature and carbon dioxide concentra-tions be monitored in the future study to confirm these hypotheses.
For outdoor firings, lower concentrations were observed for all the con-taminants, and this was expected. It was more difficult to catch gases in
ERDC TR-08-1 7-55
open atmosphere than in the muffler installation. It was also observed that our pumping systems were probably not adequate for outdoor sampling since we experienced a plateau in our measurements. It is thought that the concentrations measured outside are underestimated since our pumps were farther away from the gun than the users are in real operations. Nev-ertheless, the outdoors measurements were very important since they rep-resent the real situation.
In general, the results from the outdoor measurements indicated that there could be some potential health risks associated with exposure to the following contaminants: particulate matter at the sub-micron scale, hy-drogen cyanide, and 2,4-dinitrotoluene. Sulfur dioxide and aromatic com-pounds such as benzene do not seem to represent a problem, but further investigation will have to be done to confirm these results. When more data are available, it might be interesting to do a health risk assessment study.
Samples collected during this study are not representative of personal exposure. As soldiers are closer to the gun than where the pumps were located, it is expected that artillery soldiers are exposed to air concentra-tions higher than those recorded in outdoor tests during this study. During a field artillery exercise, gunners are very close to the gun, and a lot more rounds are being fired, therefore inducing the potential for higher con-taminant concentrations and higher exposure level. Also, weather may play an important role for soldiers’ exposure. In fact, if it is windy, the gun smoke will disperse a lot more rapidly. The wind direction is also impor-tant. Snow and rain may reduce the exposure by washing down the con-taminants and the particles of the gun smoke. The topography of the ter-rain may also enhance exposure if it allows the smoke to remain close to the gun, as if the gun is located in a depression. Assessing the potential health risks for the soldiers is not an easy task, but it is highly recom-mended that a further study be made to assess personnel exposure during firing in real situations.
Further investigations need to be done to verify our preliminary results. Personal exposure needs to be assessed by installing sampling equipment on the soldiers. Other contaminants also should be investigated. The United States Army Environmental Center (USAEC) prepared a report for the US EPA on emissions produced by ordnance detonation [53]. They ob-served air contamination for many other contaminants than those studied

ERDC TR-08-1 7-56
here. Based on their results, we recommend adding metals, polycyclic aromatic hydrocarbons (PAHs), aldehydes, nitric acid, and hydrogen sul-phide to our sampling protocol.
In conclusion, this study demonstrated that it is more difficult to collect residues from firing outdoor than firing inside the muffler installation. Also, the surface of contaminated area is more difficult to evaluate, intro-ducing uncertainty in the results. It was demonstrated that 2,4 DNT is spread by the firing of 105-mm howitzer artillery rounds. Furthermore, it was found that particles smaller than 4 μ in size are ejected during the fir-ing and might represent a problem for the users, therefore further studies are needed in this area.

ERDC TR-08-1 7-57
References
1. Pennington, J.C., T.F. Jenkins, S. Thiboutot, G. Ampleman, J. Clausen, A.D. Hewitt, J. Lewis, M.R. Walsh, T.A. Ranney, B. Silverblatt, A. Marois, A. Gagnon, P. Brousseau, J.E. Zufelt, K. Poe, M. Bouchard, R. Martel, J. Lewis, D.D. Walker, C.A. Ramsey, C.A. Hayes, S. Yost, K.L. Bjella, L. Trepanier, T.E. Berry, D.J. Lambert, P. Dubé, and N.M. Perron (2005) Distribution and Fate of Energetics on DoD Test and Training Ranges: Report 5. US Army Engineer Research and Development Center, Environmental Laboratory, Vicksburg, MS, Technical Report ERDC TR-05-02.
2. Brochu, S., E. Diaz, S. Thiboutot, G. Ampleman, A.D. Hewitt, S.R. Bigl, M. Walsh, K. Bjella, T. Ranney, M. Walsh, S. Taylor, C. Ramsey, D. Lambert, and N. Perron (2005) Assessment of 100 Years of Military Training in Canada: The Case of Canadian Force Base Petawawa. Chapter 3, Distribution and Fate of Energetics on DoD Test and Training Ranges: Report 6. US Army Engineer Research and Development Center, Environmental Laboratory, Vicksburg, MS, Technical Report ERDC TR-06-12.
3. Diaz, E., S. Brochu, S. Thiboutot, G. Ampleman, A. Marois, and A. Gagnon (2005) Assessment of Contamination by Energetic Materials and Metals in Soils and Biomasses at Western Area Training Center (WATC) in Wainwright, Alberta (Phase I). Chapter 4, Distribution and Fate of Energetics on DoD Test and Training Ranges: Report 6. US Army Engineer Research and Development Center, Environmental Laboratory, Vicksburg, MS, Technical Report ERDC TR-06-12.
4. Ampleman, G., S. Thiboutot, J. Lewis, A. Marois, A. Gagnon, M. Bouchard, T.F. Jenkins, T.A. Ranney, and J.C. Pennington (2004) Evaluation of the Con-tamination by Explosives and Metals in Soils, Vegetation, Surface Water and Sediment at Cold Lake Air Weapons Range (CLAWR), Alberta, Phase II, Final report. DRDC Valcartier TR 2004-204.
5. Thiboutot, S., G. Ampleman, A. Marois, A. Gagnon, M. Bouchard, A. Hewitt, T.F. Jenkins, M. Walsh, K. Bjella, C. Ramsey, and T.A. Ranney (2004) Environmental Conditions of Surface Soils, CFB Gagetown Training Area: Delineation of the Presence of Munitions-Related Residues (Phase III, Final Report). DRDC Valcartier TR 2004-205.
6. Marois, A., A. Gagnon, S. Thiboutot, G. Ampleman, et M. Bouchard (2004) Carac-térisation des sols de surface et de la biomasse dans les secteurs d’entraînement, Base des Forces Canadiennes, Valcartier. DRDC TR-2004-206.
7. Pennington, J.C., T.F. Jenkins, G. Ampleman, S. Thiboutot, J. Brannon, J. Clausen, A.D. Hewitt, S. Brochu, P. Dubé, J. Lewis, T.A. Ranney D. Faucher, A. Gagnon, J.A. Stark, P. Brousseau, C.B. Price, D. Lambert, A. Marois, M. Bouchard, M.E. Walsh, S.L. Yost, N.M. Perron, R. Martel, S. Jean, S. Taylor, C.A. Hayes, J.M. Ballard, M.R. Walsh, J.E. Mirecki, S. Downe, N.H. Collins, B. Porter, and R. Karn (2004) Distribution and Fate of Energetics on DoD Test and Training Ranges; Interim Report 4. US Army Engineer Research and Development Center, Environmental Laboratory, Vicksburg, MS, Technical Report ERDC TR-04-4.
ERDC TR-08-1 7-58
8. Ampleman, G., S. Thiboutot, J. Lewis, A. Marois, A. Gagnon, M. Bouchard, R. Martel, R. Lefebvre, C. Gauthier, J.M. Ballard, T. Jenkins, T. Ranney, and J. Pennington (2003) Evaluation of the Impacts of Live-Fire Training at CFB Shilo (Final Report). DRDC Valcartier TR 2003-066.
9. Thiboutot, S., G. Ampleman, A. Gagnon, and A. Marois (2000) Characterization of an Unexploded Ordnance-Contaminated Range (Tracadie Range) for Potential Con-tamination by Energetic Materials. DREV Report TR-2000-102.
10. Ampleman, G., S. Thiboutot, S. Désilets, A. Gagnon, and A. Marois (2000) Evaluation of the Soils Contamination by Explosives at CFB Chilliwack and CFAD Rocky Point. DREV Report TR-2000-103.
11. Jenkins, T.F., S. Thiboutot, G. Ampleman, A.D. Hewitt, M.E. Walsh, T.A. Ranney, C.A. Ramsey, C.L. Grant, C.M. Collins, S. Brochu, S.R. Bigl, and J.C. Pennington (2005) Identity and Distribution of Residues of Energetic Compounds at Military Live-Fire Training Ranges. US Army Engineer Research and Development Center, Cold Regions Research and Engineering Laboratory, Hanover, New Hampshire, Technical Report ERDC TR-05-10.
12. Pennington, J., T. Jenkins, G. Ampleman, S. Thiboutot, J. Brannon, J. Lewis, J. DeLaney, J. Clausen, A. Hewitt, M. Hollander, C. Hayes, J. Stark, A. Marois, S. Brochu, H. Dinh, D. Lambert, A. Gagnon, M. Bouchard, R. Martel, P. Brousseau, N. Perron, R. Lefebvre, W. Davis, T.A. Ranney, C. Gauthier, S. Taylor, and J.M. Ballard (2003) Distribution and Fate of Energetics on DoD Test and Training Ranges: Interim Report 3. US Army Engineer Research and Development Center, Environmental Laboratory, Vicksburg, Mississippi, Technical Report ERDC TR-03-2.
13. Pennington, J.C., T.F. Jenkins, G. Ampleman, S. Thiboutot, J.M. Brannon, J. Lynch, T.A. Ranney, J.A. Stark, M.E. Walsh, J. Lewis, C.A. Hayes, J.E. Mirecki, A.D. Hewitt, N. Perron, D. Lambert, J. Clausen, and J.J. Delfino (2002) Distribution and Fate of Energetics on DoD Test and Training Ranges: Interim Report 2. US Army Engineer Research and Development Center, Environmental Laboratory, Vicksburg, Mississippi, Technical Report ERDC TR-02-8.
14. Pennington, J., T. Jenkins, G. Ampleman, S. Thiboutot, J. Brannon, J. Lynch, T. Ranney, J. Stark, M. Walsh, J. Lewis, C. Hayes, J. Mirecki, A. Hewitt, N. Perron, D. Lambert, J. Clausen, J. Delfino (2002) Distribution and Fate of Energetics on DoD Test and Training Ranges: Interim Report 1. US Army Engineer Research and Development Center, Environmental Laboratory, Vicksburg, Mississippi, Technical Report ERDC TR-01-13.
15. Jenkins, T.F., J.C. Pennington, T.A. Ranney, T.E. Berry, Jr., P.H. Miyares, M.E. Walsh, A.D. Hewitt, N. Perron, L.V. Parker, C.A. Hayes, and Major E. Wahlgren (2001) Characterization of Explosives Contamination at Military Firing Ranges. US Army Engineer Research and Development Center, Cold Regions Research and Engineering Laboratory, Hanover, New Hampshire, Technical Report ERDC TR-01-05.

ERDC TR-08-1 7-59
16. Walsh, M.E., C.M. Collins, C.H. Racine, T.F. Jenkins, A.B. Gelvin, and T.A. Ranney (2001) Sampling for Explosives Residues at Fort Greely, Alaska: Reconnaissance Visit July 2000. US Army Engineer Research and Development Center, Cold Regions Research and Engineering Laboratory, Hanover, New Hampshire, Technical Report ERDC/CRREL-01-15.
17. Jenkins, T.F., A.D. Hewitt, C.L. Grant, S. Thiboutot, G. Ampleman, M.E. Walsh, T.A. Ranney, C.A. Ramsey, A.J. Palazzo, and J.C. Pennington (2006) Identity and distribution of residues of energetic compounds at Army live-fire training ranges. Chemosphere, 63, 1280.
18. Dubé, P., S. Thiboutot, G. Ampleman, A. Marois, and M. Bouchard (2006) Prelimi-nary Assessment of the Dispersion of Propellant Residues from the Static Live Firing of 105-mm Howitzer. DRDC Valcartier TM 2005-284.
19. Walsh, M.R., S. Taylor, M.E. Walsh, S. Bigl, K. Bjella, T. Douglas, A.B. Gelvin, D. Lambert, N.M. Perron, and S.P. Saari (2005) Residues from Live-fire Detonation of 155-mm Howitzer Rounds. US Army Engineer Research and Development Center, Cold Regions Research and Engineering Laboratory, Hanover, New Hampshire, Technical Report ERDC/CRREL TR 05-14.
20. Walsh, M.R., M.E. Walsh, C.A. Ramsey, R.J. Rachow, J.E. Zufelt, C.M. Collins, A.B. Gelvin, N.M. Perron, and S.P. Saari (2006) Energetic Residues Deposition from 60-mm and 81-mm Mortars. US Army Engineer Research and Development Center, Cold Regions Research and Engineering Laboratory, Hanover, New Hampshire, Technical Report ERDC/CRREL TR 06-10.
21. Ampleman, G., S. Thiboutot, A. Marois, T. Gamache, I. Poulin, B. Quémerais, and L. Melanson (2007) Analysis of Propellant Residues Emitted During 105-mm Howitzer Live-Firing at the Muffler Installation in Nicolet, Lac St-Pierre, Canada. DRDC Valcartier TR 2007-514.
22. Quémarais, B., L. Melanson, G. Ampleman, S. Thiboutot, E. Diaz, and I. Poulin (2007) Characterization of the Air Emissions During Live Gun Firing at the Muffler Installation in Nicolet Lac-St-Pierre, Canada. DRDC Toronto TR 2007-060.
23. Canadian Forces Technical Order (CFTO), Ammunition for 105-mm Howitzer, C-74-315-H00/TA-000.
24. Canadian Forces Technical Order (CFTO), Percussion Primers, C-74-390-FBO/TA-000.
25. Description sheet of M1 propellant, (1987) Expro Chemical Products Inc., lot PCE87M-2019.
26. Quinchon, J., et J. Tranchant (1984) Les poudres, propergols et explosives; les nitrocelluloses et autres matières de base des poudres et propergols, tome 2, lavoisier, ISBN 2-85206-159-7, Paris.
27. National Institute of Occupational Safety and Health (1994) NIOSH Manual of Analytical Methods, 4th Edition.

ERDC TR-08-1 7-60
28. Occupational Safety and Health Administration (2006) Sampling and Analytical Methods, in http://www.osha.gov/dts/sltc/methods/index.html.
29. Bishop, R.W.,T.A. Ayers, D.S. Rinehart (1981) The use of a solid sorbent as a collection medium for TNT and RDX vapors. American Industrial Hygiene Association Journal, 42 (8), p. 586–589.
30. Centre d’expertise en analyse environnementale du Québec, Ministère du Développement durable, de l’Environnement et des Parcs du Québec (2006) http://www.ceaeq.gouv.qc.ca.
31. Canadian Council of Ministers of the Environment (2000) Canada-wide standards for particulate matter (PM) and ozone, Quebec City.
32. United States Environmental Protection Agency (2004) Air Quality Criteria for Par-ticulate Matter, Vol. I and II, Office of Research Development.
33. American Conference of Governmental Industrial Hygienists (2006) Threshold Limit Values for Chemical Substances and Physical Agents & Biological Exposure Indices.
34. United States Environmental Protection Agency (2006) National Ambient Air Quality Standards, http://www.epa.gov/air/criteria.html.
35. Health Canada (2006) Regulations Related to Health and Air Quality, http://www.hc-sc.gc.ca/ewh-semt/air/out-ext/reg_e.html.
36. United States Environmental Protection Agency (2007) Integrated Risk Information System: Hydrogen cyanide, http://www.epa.gov/iris/subst/0060.htm.
37. National Library of Medicine’s TOXNET system (2007) Hazardous Substances Database: Hydrogen cyanide, http://toxnet.nlm.nih.gov.
38. D FHP (2004) Preventive Medicine Qualitative Assessment 105-mm howitzer firing and charge bag burning at CFB Valcartier, Quebec, 12–13 November 2003.
39. National Library of Medicine’s TOXNET system (2007) Hazardous Substances Database: Nitric oxide, http://toxnet.nlm.nih.gov.
40. National Library of Medicine’s TOXNET system (2007) Hazardous Substances Database: Sulfur dioxide, http://toxnet.nlm.nih.gov.
41. United States Environmental Protection Agency (2007) Integrated Risk Information System: Benzene, http://www.epa.gov/iris/subst/0276.htm
42. United States Environmental Protection Agency (2007) Integrated Risk Information System: Toluene, http://www.epa.gov/iris/subst/0118.htm.
43. National Library of Medicine’s TOXNET system (2007) Hazardous Substances Database: Benzene, http://toxnet.nlm.nih.gov.
44. National Library of Medicine’s TOXNET system (2007) Hazardous Substances Database: Toluene, http://toxnet.nlm.nih.gov.

ERDC TR-08-1 7-61
45. United States Environmental Protection Agency (2007) Integrated Risk Information System: 2,4-Dinitrotoluene, http://www.epa.gov/iris/subst/0524.htm.
46. National Library of Medicine’s TOXNET system (2007) Hazardous Substances Database: 2,4-Dinitrotoluene, http://toxnet.nlm.nih.gov.
47. Letzel, S., T. Goen, M. Baden, J. Angerer, and T. Kraus (2003) Exposure to nitroaromatic explosives and health effects during dispoal of military waste, Occupational and Environmental Medicine, 60 (7): 483–488.
48. Brüning, T., C. Chronz, R. Their, J. Havelka, Y. Ko, and H. Bolt (1999) Occurrence of urinary tract tumors in miners highly exposed to dinitrotoluene, Journal of Occupational and Environmental Medicine, 41 (3): 144–149.
49. Harth, V., H. Bolt, and T. Brüning (2005) Cancer of the urinary bladder in highly exposed workers in the production of dinitrotoluenes: A case report, Inter-national Archives of Occupational and Environmental Health, 78: 677–680.
50. Jones, C.R., O. Sepai, Y.-Y. Liu, H. Yan, and G. Sabbioni (2005) Urinary metabolites of workers exposed to nitrotoluenes, Biomarkers 10 (1): 10-28
51. Smith II, E.F., H.J. Smith, and E.J. Kuchar (1995) Monitoring of dinitrotoluene and its metabolites in urine by spectrophotometry of their coupled aryldiazonium salts, American Industrial Hygiene Association Journal, 56: 1175–1179.
52. Angere, J., and A. Weismantel (1998) Biological monitoring of dinitrotoluene by gas chromatographic-mass spectrometric analysis of 2,4-dinitrobenzoic acid in human urine, Journal of Chromatography, 713: 313–322.
53. US EPA (2006) Background document: Report on revisions to 5th edition AP-42 Chapter 15—Ordnance detonation. (http://www.epa.gov/ttn/chief/ap42/ch15/ index.html).

THIS PAGE IS INTENTIONALLY BLANK.

ERDC TR-08-1 8-1
— Chapter 8 —
Accumulation of Propellant Residues at Small Arms Firing Points
THOMAS F. JENKINS, ALAN D. HEWITT, MICHAEL R. WALSH, MARIANNE E. WALSH, RONALD N. BAILEY, CHARLES A. RAMSEY,
SUSAN R. BIGL, DENNIS J. LAMBERT, SYLVIE BROCHU, EMMANUELA DIAZ, MARIE-CLAUDE LAPOINTE, ISABELLE POULIN, AND DOMINIC FAUCHER
Abstract
Soil samples were collected at three types of small arms ranges to deter-mine the concentrations of propellant-related residues that have accumu-lated in near-surface soils. The ranges sampled included several M-16 ranges where 5.56-mm rounds are fired, 9-mm pistol ranges, and multi-purpose machine gun ranges. The small arms rounds fired at these ranges contain nitrocellulose (NC) and nitroglycerin (NG), and some have lesser amounts of 2,4-dinitrotoluene (2,4-DNT). NG concentrations were meas-ured in near-surface soil for all three types of ranges, and 2,4-DNT was found in most cases, but at much lower concentrations. Maximum concen-trations of NG in surface soils ranged from 18.2 to 504 mg/kg near the firing point for 5.56-mm rifle ranges, from 28.8 to 124 mg/kg for 9-mm pistol ranges, and from 8.6 to 576 mg/kg for machine gun ranges. Depth profile samples indicate that only small concentrations of propellant-related residues are present at depths below 10 cm. The major accumula-tion of propellant residues was within 20 m in front of the firing line for these small arms ranges.
ERDC TR-08-1 8-2
Introduction
Major goals of SERDP ER-1481 have been (1) to determine the masses of propellant-related residues that are deposited when various types of weapons are fired and (2) to determine the concentrations of these resi-dues that accumulate in soils at these ranges. A series of experiments has been conducted to address the first goal (Walsh et al. 2004, 2005a, 2005b, 2006). These experiments were conducted on fresh-snow-covered ranges to ensure that the residues collected were deposited from the experimental firing activity alone and not from previous training. The most recent study estimated the deposition of propellant-related residues from the firing of five small arms weapons: 5.56-mm rifle, 5.56 machine gun, 7.62-mm ma-chine gun, 9-mm pistol, and .50-caliber (12.7-mm) machine gun (Walsh et al. 2007, Chapter 3 this report). Walsh et al. (2007) summarized the pro-pellant constituents in the various small arms propellants (Table 8-1). The major constituent for all these propellants is the energetic binder nitrocel-lulose (NC), which is a polymeric compound with little aqueous solubility and no indication of mobility once deposited onto the soil. For double-base propellants, nitroglycerin (NG) is the second largest constituent and the compound with the largest potential to migrate from the residues once deposited. 2,4-dinitrotoluene can be present at low concentrations as well because it is the second largest constituent in single-base propellant after NC; it is also a minor constituent in M60 machine gun propellant.
Thus NG and 2,4-DNT are the energetic propellant constituents of interest for potential deposition and accumulation for firing point areas at small arms ranges. Experiments indicate that NG is the energetic compound deposited to the greatest extent, with deposition ranging from 1.3 to 11 mg per round fired (Chapter 3, Walsh et al. 2007). Because of the enormous number of small arms rounds fired, it appears probable that substantial concentrations of NG can accumulate in surface soils near small arms firing points.

ERDC TR-08-1 8-3
Table 8-1. Propellant constituents for munitions used during firing point tests. (From Chapter 3 this report, Walsh et al.)
Weapon Munition
(Mil/DODIC) Propellant Constituent Load (mg)
M16 Automatic rifle (5.56-mm) M855/A059 (Ball) WC844 NG 164
M249 Machine gun (5.56-mm)
M27/A059 (Linked) M855/A059 (Ball)
M856/A063 (Tracer)
WC844 WC844
NG NG
189
161.5
M60 Machine gun (7.62-mm)
M13/A143 (Linked) M80/A143 (Ball)
WC846
NG DNT
267 3.7
M9 Pistol (9-mm) M882/AA49 (Ball) WPR289 NG* 39.5
M2HB Machine gun (12.7-mm/.50-caliber)
M9/A557(Linked) M33/A552 (Ball)
M17/A571 (Tracer)
WC860 WC857
NG NG
1478 1570
* Up to 1% DNT specified. None detected when raw propellant analyzed.
Small arms ranges at four installations have been previously sampled to determine propellant residue accumulation in near-surface soils at firing point areas, two in Canada (Brochu et al. 2006, Diaz et al. 2006), and two in the United States (Jenkins et al. 2007). At Canadian Force Bases (CFB) Petawawa, Ontario, Rifle Ranges B and C and Pistol Range Q were sam-pled in 2004. In all three cases, only 2,4-DNT was reported with concen-trations as high as 2.3 mg/kg at one of the rifle ranges and 9.6 mg/kg at the pistol range (Brochu et al. 2006). At Canadian Force Bases/Area Sup-port Unit (CFB/ASU) Wainwright, Alberta, Rifle Ranges 1 and 8 were sam-pled along with outdoor Pistol Range 24. The major propellant-related compound detected at all of these ranges was NG (Diaz et al. 2006), with maximum concentrations at Ranges 1 and 8 of 22.6 and 52.8 mg/kg, re-spectively. The maximum 2,4-DNT concentrations at these two ranges were found to be only 0.5 and 1.1 mg/kg, respectively. Similarly, the ener-getic compound detected at highest concentration at the pistol range was NG; the maximum concentration was 7 mg/kg. The reason for the differ-ences found for residue accumulation at CFB Petawawa and CFB/ASU Wainwright for the same types of ranges are uncertain. One potential ex-planation could be that only single-base propellants were fired in Petaw-awa in the months preceding the sampling event. To verify those results, those ranges were sampled again in 2005 and 2006; the results are re-ported here.

ERDC TR-08-1 8-4
Four small arms ranges have been sampled at two U.S. Army installations (Jenkins et al. 2007). The first was Range 15 at Yakima Training Center (YTC), where vehicle-mounted troops fire small arms against simulated enemy attacks. The second was Range 4 at YTC, where dismounted troops fire small arms, mainly 5.56-mm and pistols. The third and fourth were Machine Gun Range 93Z and 5.56-mm Rifle Range 93 at Fort Lewis, Washington.
At all of these ranges, NG was the energetic compound detected at highest concentration, with only minor amounts of 2,4-DNT detected. These re-sults agree with that reported by Diaz et al. (2006) for CFB/ASU Wain-wright. At YTC, the maximum NG concentrations at Ranges 15 and 4 were 1.68 and 85.0 mg/kg, respectively. At Fort Lewis, maximum NG concen-trations at Ranges 93Z and 93 were 8.6 and 504 mg/kg, respectively.
ERDC TR-08-1 8-5
Objectives
The major objective of this study was to document the accumulation of propellant-related energetic compounds at firing points for the various types of small arms ranges commonly found at U.S. and Canadian Army training installations. This includes measuring the concentrations of NG and 2,4-DNT at the firing points, as well as determining the aerial extent of accumulation for the various types of small arms ranges. Soil profile samples were also collected where possible to assess the downward mobil-ity of these chemicals in soil.
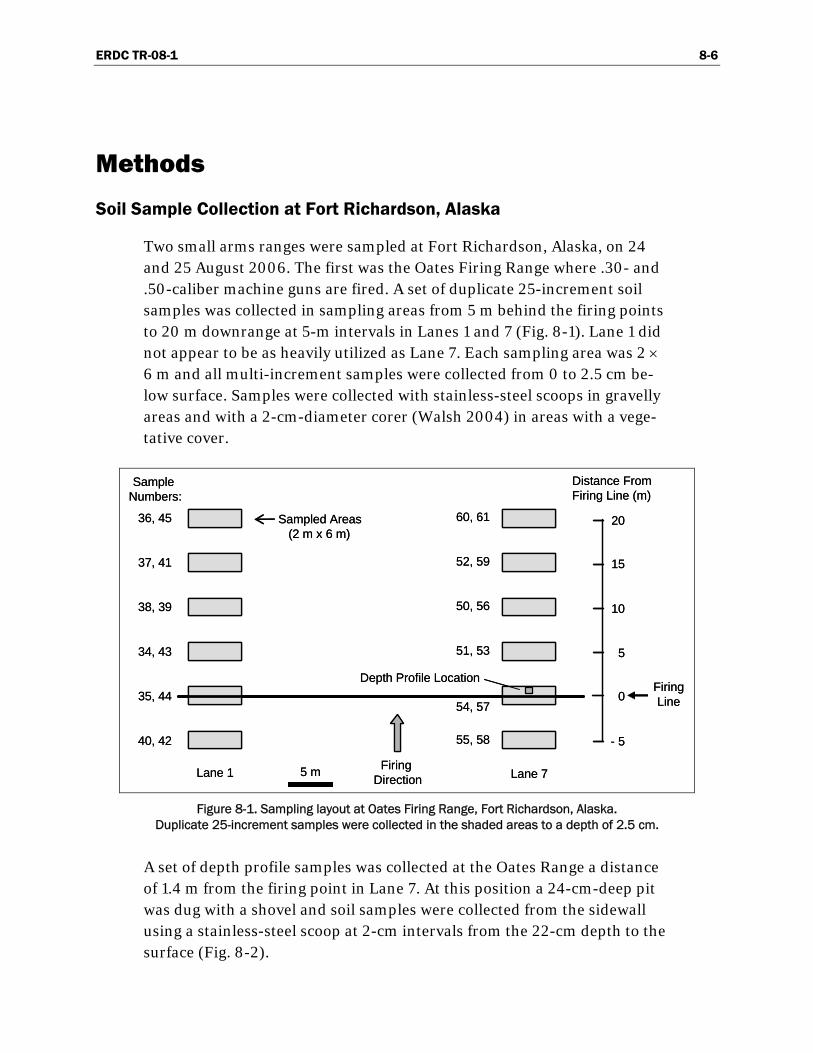
ERDC TR-08-1 8-6
Methods
Soil Sample Collection at Fort Richardson, Alaska
Two small arms ranges were sampled at Fort Richardson, Alaska, on 24 and 25 August 2006. The first was the Oates Firing Range where .30- and .50-caliber machine guns are fired. A set of duplicate 25-increment soil samples was collected in sampling areas from 5 m behind the firing points to 20 m downrange at 5-m intervals in Lanes 1 and 7 (Fig. 8-1). Lane 1 did not appear to be as heavily utilized as Lane 7. Each sampling area was 2 × 6 m and all multi-increment samples were collected from 0 to 2.5 cm be-low surface. Samples were collected with stainless-steel scoops in gravelly areas and with a 2-cm-diameter corer (Walsh 2004) in areas with a vege-tative cover.
FiringLine
Firing Direction5 m
Depth Profile Location
- 5
5
0
10
15
20
Distance FromFiring Line (m)
Lane 1 Lane 7
Sampled Areas(2 m x 6 m)
37, 41
38, 39
36, 45
35, 44
40, 42
Sample Numbers:
34, 43
52, 59
50, 56
60, 61
54, 57
55, 58
51, 53
FiringLine
Firing Direction5 m
Depth Profile Location
- 5
5
0
10
15
20
Distance FromFiring Line (m)
Lane 1 Lane 7
Sampled Areas(2 m x 6 m)
37, 41
38, 39
36, 45
35, 44
40, 42
Sample Numbers:
34, 43
52, 59
50, 56
60, 61
54, 57
55, 58
51, 53
Figure 8-1. Sampling layout at Oates Firing Range, Fort Richardson, Alaska.
Duplicate 25-increment samples were collected in the shaded areas to a depth of 2.5 cm.
A set of depth profile samples was collected at the Oates Range a distance of 1.4 m from the firing point in Lane 7. At this position a 24-cm-deep pit was dug with a shovel and soil samples were collected from the sidewall using a stainless-steel scoop at 2-cm intervals from the 22-cm depth to the surface (Fig. 8-2).
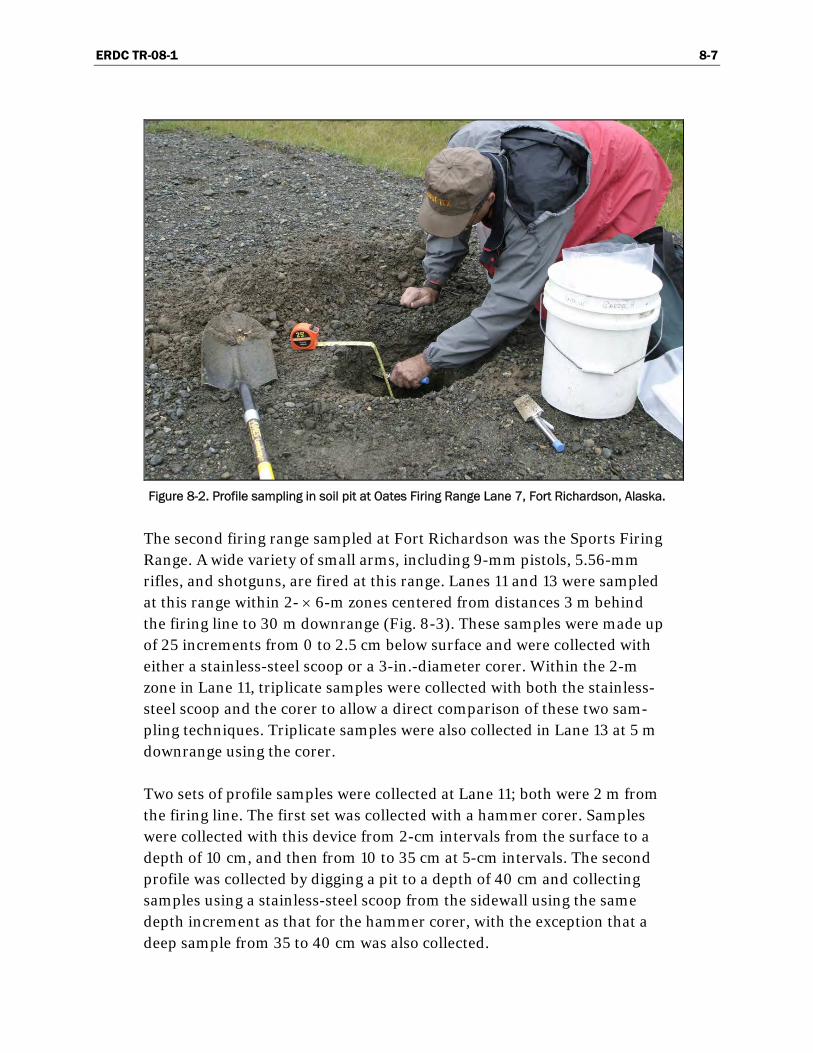
ERDC TR-08-1 8-7
Figure 8-2. Profile sampling in soil pit at Oates Firing Range Lane 7, Fort Richardson, Alaska.
The second firing range sampled at Fort Richardson was the Sports Firing Range. A wide variety of small arms, including 9-mm pistols, 5.56-mm rifles, and shotguns, are fired at this range. Lanes 11 and 13 were sampled at this range within 2- × 6-m zones centered from distances 3 m behind the firing line to 30 m downrange (Fig. 8-3). These samples were made up of 25 increments from 0 to 2.5 cm below surface and were collected with either a stainless-steel scoop or a 3-in.-diameter corer. Within the 2-m zone in Lane 11, triplicate samples were collected with both the stainless-steel scoop and the corer to allow a direct comparison of these two sam-pling techniques. Triplicate samples were also collected in Lane 13 at 5 m downrange using the corer.
Two sets of profile samples were collected at Lane 11; both were 2 m from the firing line. The first set was collected with a hammer corer. Samples were collected with this device from 2-cm intervals from the surface to a depth of 10 cm, and then from 10 to 35 cm at 5-cm intervals. The second profile was collected by digging a pit to a depth of 40 cm and collecting samples using a stainless-steel scoop from the sidewall using the same depth increment as that for the hammer corer, with the exception that a deep sample from 35 to 40 cm was also collected.
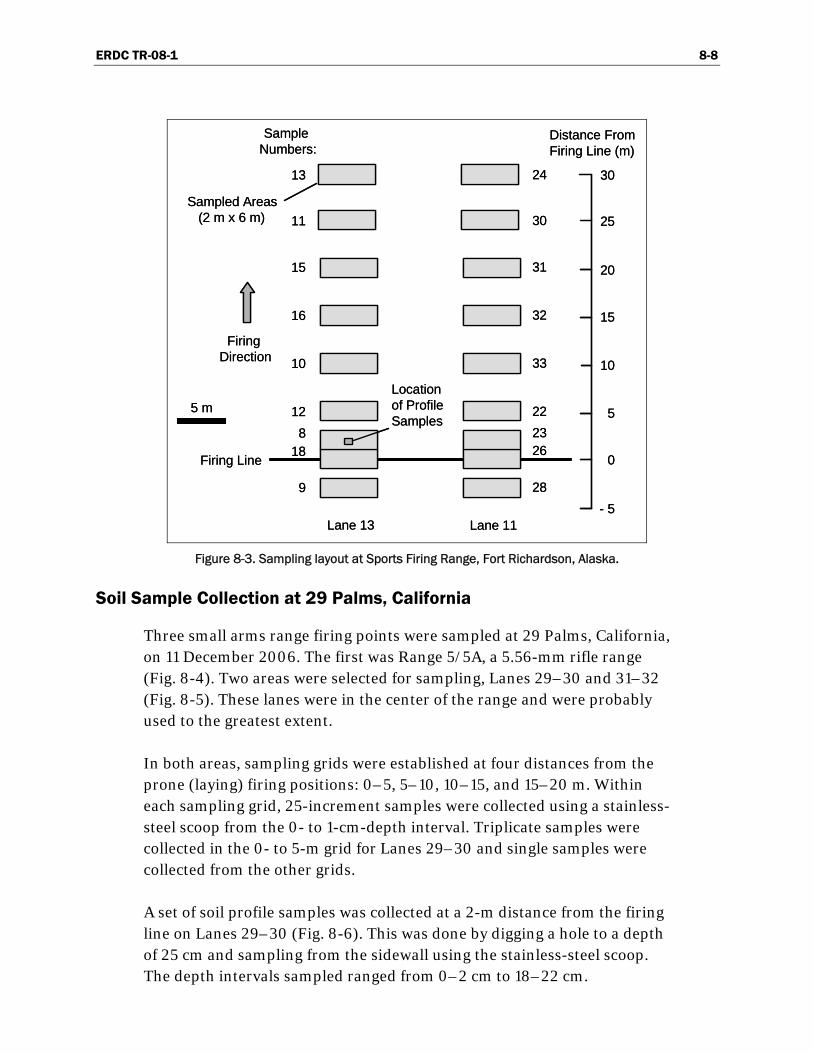
ERDC TR-08-1 8-8
Firing Line
Firing Direction
5 mLocation of Profile Samples
- 5
5
0
10
15
20
Distance FromFiring Line (m)
Lane 13 Lane 11
Sampled Areas(2 m x 6 m)
16
10
15
18
9
Sample Numbers:
12
30
25
8
13
11
32
33
31
26
28
2223
24
30
Firing Line
Firing Direction
5 mLocation of Profile Samples
- 5
5
0
10
15
20
Distance FromFiring Line (m)
Lane 13 Lane 11
Sampled Areas(2 m x 6 m)
16
10
15
18
9
Sample Numbers:
12
30
25
8
13
11
32
33
31
26
28
2223
24
30
Figure 8-3. Sampling layout at Sports Firing Range, Fort Richardson, Alaska.
Soil Sample Collection at 29 Palms, California
Three small arms range firing points were sampled at 29 Palms, California, on 11 December 2006. The first was Range 5/5A, a 5.56-mm rifle range (Fig. 8-4). Two areas were selected for sampling, Lanes 29–30 and 31–32 (Fig. 8-5). These lanes were in the center of the range and were probably used to the greatest extent.
In both areas, sampling grids were established at four distances from the prone (laying) firing positions: 0–5, 5–10, 10–15, and 15–20 m. Within each sampling grid, 25-increment samples were collected using a stainless-steel scoop from the 0- to 1-cm-depth interval. Triplicate samples were collected in the 0- to 5-m grid for Lanes 29–30 and single samples were collected from the other grids.
A set of soil profile samples was collected at a 2-m distance from the firing line on Lanes 29–30 (Fig. 8-6). This was done by digging a hole to a depth of 25 cm and sampling from the sidewall using the stainless-steel scoop. The depth intervals sampled ranged from 0–2 cm to 18–22 cm.

ERDC TR-08-1 8-9
Figure 8-4. Range 5/5A at 29 Palms, California.
Figure 8-5. Sampling layout at Range 5/5A, 29 Palms, California. Samples were collected using a stainless-steel scoop from 0- to 1-cm depth and contained 25 increments each.

ERDC TR-08-1 8-10
Figure 8-6. Schematic of depth profile sample locations collected
at Range 5/5A, 29 Palms, California.
Figure 8-7. Range 2, site of 9-mm pistol firing at 29 Palms, California.
The second range sampled at 29 Palms was Range 2, a 9-mm pistol range (Fig. 8-7). Two grids were established over a width of 40 m, one positioned 0–4 m and the other 4–7 m from the firing line (Fig. 8-8). In each grid, 30-increment samples were collected from the 0- to 1-cm depth.
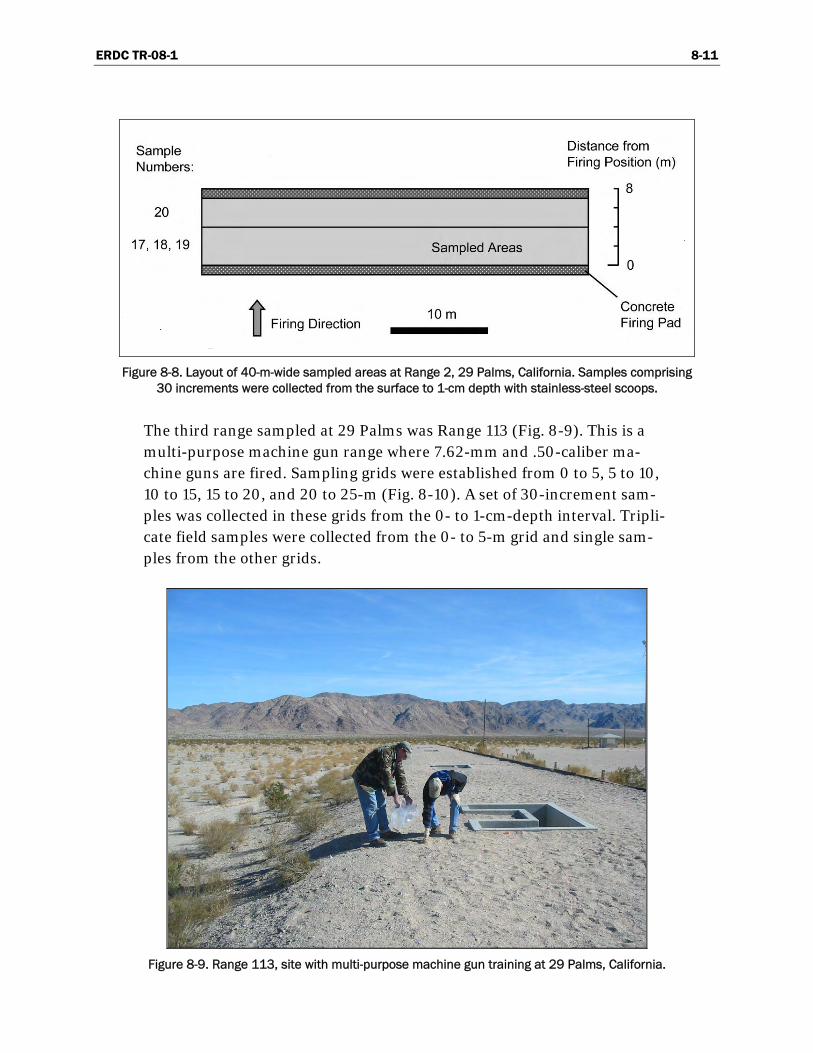
ERDC TR-08-1 8-11
Figure 8-8. Layout of 40-m-wide sampled areas at Range 2, 29 Palms, California. Samples comprising
30 increments were collected from the surface to 1-cm depth with stainless-steel scoops.
The third range sampled at 29 Palms was Range 113 (Fig. 8-9). This is a multi-purpose machine gun range where 7.62-mm and .50-caliber ma-chine guns are fired. Sampling grids were established from 0 to 5, 5 to 10, 10 to 15, 15 to 20, and 20 to 25-m (Fig. 8-10). A set of 30-increment sam-ples was collected in these grids from the 0- to 1-cm-depth interval. Tripli-cate field samples were collected from the 0- to 5-m grid and single sam-ples from the other grids.
Figure 8-9. Range 113, site with multi-purpose machine gun training at 29 Palms, California.

ERDC TR-08-1 8-12
Figure 8-10. Sampling layout at Range 113, 29 Palms, California. Samples were collected
from areas 5 m deep by 29 m wide using a stainless-steel scoop penetrating from the surface to a 1-cm depth. All samples contained 30 increments.
Soil Sample Collection at CFB Petawawa, Ontario
Six small arms ranges located in CFB Petawawa have been sampled since 2004, including two pistol ranges (Q, E) and four rifle ranges (B, C, D, and Y). Canadian rifle ranges typically include five to six firing lines with a berm at each 100-m distance from the target area, one stop butt with wooden targets to prevent bullets from going farther, and one berm sup-porting moving mechanical targets between the stop butt and the firing points. Soldiers usually fire at fixed positions on the berms. The only ex-ception to this is at the 100-m berm, where firing can occur closer to the targets. Any of a variety of small-caliber rifles, machine guns, or pistols (up to .50-caliber) can be fired on these ranges. C and D Ranges are 500-m ranges with 12 firing lanes; B and Y Ranges are 600-m and 600-yd ranges with 12 and 30 lanes, respectively. Of the two pistol ranges, Q Range is a 50-m, 20-lane range (Fig. 8-11) with two main firing positions at 20 and 40 m. E Range is 100 m long with 15 lanes, and firing mainly occurs from the 25-m and 50-m lines. During training, the soldiers sometimes walk forward from these positions as they are firing at the targets. Although both ranges are mainly designed for pistols, shotguns can also be used at Q Range and in Lanes 19 and 20 of E Range. Rifles and machine guns are authorized for use at E Range.

ERDC TR-08-1 8-13
Figure 8-11. Pistol Range Q, CFB Petawawa, Ontario.
Historic firing data between 1997 and 2006 at the small arms ranges of CFB Petawawa are reported in Table 8-2, along with the most common types of rounds fired at each range. Y Range is definitely the more inten-sively used rifle range of CFB Petawawa, with nearly 5.2 M rounds fired in 10 years. This amount nearly equals the total number of rounds fired in B, C, and D Ranges altogether. The most common munitions fired at the rifle ranges are 5.56 mm, 7.62 mm, and 9 mm, accounting for more than 95% of the rounds fired. Of these, more than 85% are 5.56 mm, and less than 2% are from machine guns (data not shown). Pistol Ranges E and Q are used less intensively, with 1.4 M and 0.7 M rounds recorded, respectively. The distribution of types used also differs from the rifle ranges. At Q Range, more than 95% of the rounds used are 9 mm; at E Range, this pro-portion decreases to 38%, with the remaining 61% being mostly 5.56 mm.
In 2005, soil samples were collected at all the above-mentioned small arms ranges at CFB Petawawa. The sampling strategy for the rifle ranges was mainly to evaluate the concentration of propellant residues on the fir-ing berm and in the 3-m area located in front of the berm. Because of their

ERDC TR-08-1 8-14
more intensive use and, therefore, higher potential for contamination, the berms closest to the targets were chosen for sampling. Overall, one to six multi-increment samples were collected at each berm. Samples were built by collecting either 30 increments from groups of three or five lanes, or by taking 100 increments along the entire berm. The sampling pattern is shown in Figure 8-12. At B, C, and D Ranges, samples were collected from groups of three lanes. Berms sampled at B Range were 100, 200, 300, and 400 m from the target; at C Range, the 100- and 200-m berms were evalu-ated; and at D Range, the 100-, 200-, and 300-m berms were sampled. In each case, a 30-increment sample was collected from the surface to 2 cm below surface at a distance of 0 to 3 m from the berm. At Y Range, the 100-m firing position was sampled (30 increments) from groups of five lanes, and the 200- and 300-m berms were evaluated with three samples of 50 increments from groups of 10 lanes at a time. Also, three samples (70–80 increments) were collected along the entire firing line for berms at 100, 200, and 300 m.
Table 8-2. Records of rounds fired in the small arm ranges of CFB Petawawa from 1997 to 2006.
Ammunition most fired
Range Total Type %
Rifle
CTG 5.56 mm 85.1
CTG 7.62 mm 6.2
CTG 7.62 mm 4 Ball/1TR linked 2.0 B Range 1,833,787
CTG 9 mm 1.3
CTG 5.56 mm 96.4
CTG 7.62 mm 1.7 C Range 1,872,461
CTG 9 mm 0.3
CTG 5.56 mm 92.4
CTG 7.62 mm 4.8 D Range 1,344,023
CTG 9 mm 0.9
CTG 5.56 mm 95.9
CTG 7.62 mm 4 Ball/1TR linked 1.4
CTG 5.56 mm 4 Ball/1TR 1.4 Y Range 5,169,114
CTG 9 mm 0.3
Pistol CTG 5.56 mm 60.6
E Range 1,419,946 CTG 9 mm 38.3
CTG 9 mm 95.2 Q Range 675,737
CTG Shotgun 12 gauge 3.1
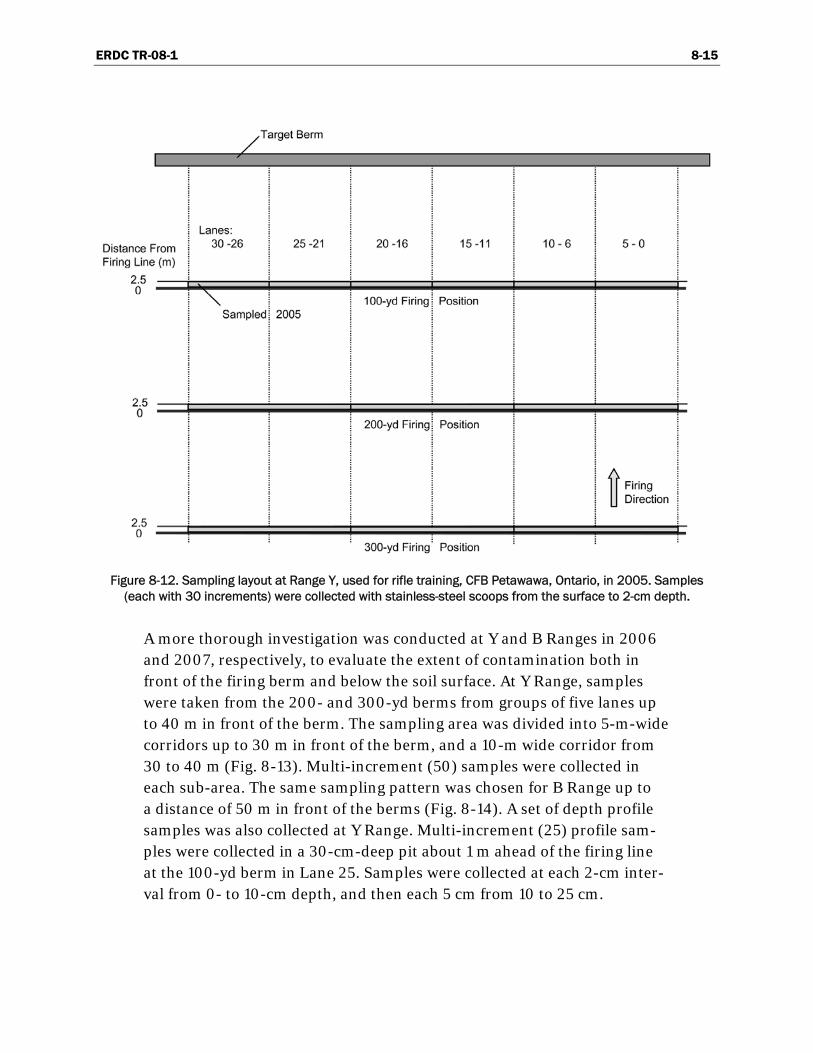
ERDC TR-08-1 8-15
Figure 8-12. Sampling layout at Range Y, used for rifle training, CFB Petawawa, Ontario, in 2005. Samples
(each with 30 increments) were collected with stainless-steel scoops from the surface to 2-cm depth.
A more thorough investigation was conducted at Y and B Ranges in 2006 and 2007, respectively, to evaluate the extent of contamination both in front of the firing berm and below the soil surface. At Y Range, samples were taken from the 200- and 300-yd berms from groups of five lanes up to 40 m in front of the berm. The sampling area was divided into 5-m-wide corridors up to 30 m in front of the berm, and a 10-m wide corridor from 30 to 40 m (Fig. 8-13). Multi-increment (50) samples were collected in each sub-area. The same sampling pattern was chosen for B Range up to a distance of 50 m in front of the berms (Fig. 8-14). A set of depth profile samples was also collected at Y Range. Multi-increment (25) profile sam-ples were collected in a 30-cm-deep pit about 1 m ahead of the firing line at the 100-yd berm in Lane 25. Samples were collected at each 2-cm inter-val from 0- to 10-cm depth, and then each 5 cm from 10 to 25 cm.

ERDC TR-08-1 8-16
Figure 8-13. Sampling layout at Range Y, used for rifle training, CFB Petawawa, Ontario, in 2006. Samples
(each with 50 increments) were collected with stainless-steel scoops from the surface to 2-cm depth.

ERDC TR-08-1 8-17
Figure 8-14. Layout of sampling at Rifle B Range, CFB Petawawa, Ontario, in 2007.
Soil samples (with 50 increments each) were collected from 0 to 2.5 cm below surface.
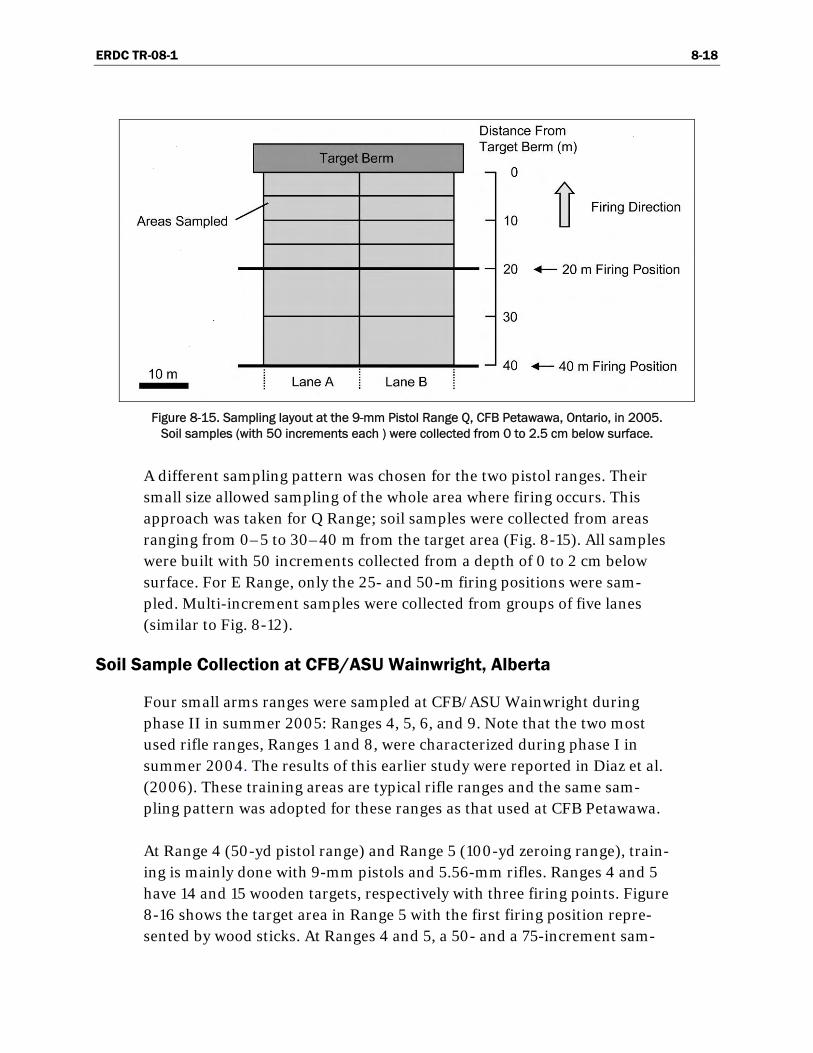
ERDC TR-08-1 8-18
Figure 8-15. Sampling layout at the 9-mm Pistol Range Q, CFB Petawawa, Ontario, in 2005.
Soil samples (with 50 increments each ) were collected from 0 to 2.5 cm below surface.
A different sampling pattern was chosen for the two pistol ranges. Their small size allowed sampling of the whole area where firing occurs. This approach was taken for Q Range; soil samples were collected from areas ranging from 0–5 to 30–40 m from the target area (Fig. 8-15). All samples were built with 50 increments collected from a depth of 0 to 2 cm below surface. For E Range, only the 25- and 50-m firing positions were sam-pled. Multi-increment samples were collected from groups of five lanes (similar to Fig. 8-12).
Soil Sample Collection at CFB/ASU Wainwright, Alberta
Four small arms ranges were sampled at CFB/ASU Wainwright during phase II in summer 2005: Ranges 4, 5, 6, and 9. Note that the two most used rifle ranges, Ranges 1 and 8, were characterized during phase I in summer 2004. The results of this earlier study were reported in Diaz et al. (2006). These training areas are typical rifle ranges and the same sam-pling pattern was adopted for these ranges as that used at CFB Petawawa.
At Range 4 (50-yd pistol range) and Range 5 (100-yd zeroing range), train-ing is mainly done with 9-mm pistols and 5.56-mm rifles. Ranges 4 and 5 have 14 and 15 wooden targets, respectively with three firing points. Figure 8-16 shows the target area in Range 5 with the first firing position repre-sented by wood sticks. At Ranges 4 and 5, a 50- and a 75-increment sam-

ERDC TR-08-1 8-19
ple were collected at each firing line, respectively, totaling three samples for each range.
Figure 8-16. Range 5 in CFB/ASU Wainwright, Alberta, showing the target area
with white signs and the first firing line in the foreground.
Range 6, a 300-m conventional range, is approximately 68 m wide with 20 targets. It comprises three firing lines (one at each 100-m distance from the target), one sandy stop butt with wooden targets, and one berm sup-porting moving mechanical targets between the stop butts and the firing points. Only the first two firing lines (100 and 200 m) were sampled to verify the extent of contamination by collecting composites of 25 to 30 increments from groups of four lanes. At the 100-m firing position, sam-ples were collected with two different sampling instruments: four with a scoop and five with a corer. The firing position at 200 m was sampled with only the corer, shown in Figure 8-17, and a total of seven soil samples was taken at this position. Two of them were composites built with 40 incre-ments collected on the entire firing line (grouping targets 1 to 20). The other five samples were built with 30 increments, grouping four lanes to-gether. Finally, 15 soil samples were taken at the target area, including two duplicates.

ERDC TR-08-1 8-20
Figure 8-17. CRREL-designed corer used for sampling.
Range 9 (30-yd zeroing range) is the smallest small arms range sampled during this phase. This range has 24 wooden targets with only one firing line at approximately 23 m from the target area. The sampling strategy (regrouping targets) was the same as for Range 6. Seven samples, includ-ing one duplicate, were collected at the firing position; all samples were composed of 25 to 30 increments.
Soil Sample Processing of Samples from 29 Palms and Fort Richardson
All soil samples from 29 Palms and Fort Richardson were returned to CRREL by overnight carrier. Samples were air-dried in the laboratory and passed through a 10-mesh (2-mm) sieve to remove oversized material. For the multi-increment samples, the < 2-mm fraction was ground on a Lab TechEssa LM2 (LabTech Essa Pty. Ltd., Bassendean, WA, Australia) puck-mill grinder for 60 seconds five times with a 60-second cooling period be-tween grinds. Grinding reduced the particle size of the material to a flour-like consistency (< 70 µm). After grinding, samples were mixed thoroughly and spread to form a 1-cm-thick layer; subsamples were obtained by col-lecting 30 increments randomly through the entire thickness of the layer
ERDC TR-08-1 8-21
of ground material to obtain a subsample mass of about 10 g. Triplicate laboratory subsamples were obtained from one of the ground soil samples to assess the processing and subsampling error.
Soil profile samples from 29 Palms and Fort Richardson were passed through a 10-mesh sieve and placed in a glass jar for extraction.
Soil Sample Processing of Samples from CFB Petawawa and CFB/ASU Wainwright
Soil samples were air-dried in the dark and homogenized by adding ace-tone to thoroughly wet the soil, then the acetone was evaporated, more homogeneously depositing the residues on the soil surfaces. The soils were sieved through 25-mesh sieves following the method described in Thibou-tot et al. (2003). Eight grams of soil were put into an amber vial for extrac-tion.
Sample Extraction and Analysis for Propellant Constituents from 29 Palms and Fort Richardson
The 10-g portions of soil from the multi-increment samples were com-bined with 20 mL of acetonitrile. The entire < 2-mm fractions of soil pro-file samples were combined with acetonitrile using a ratio of solvent (mL) to soil (g) of about 2 to 1. Both sample types were extracted on a shaker table for 18 h. The extracts were filtered by passing each through a Millex-FH PTFE 0.45 syringe filter (Millipore Corp.) and maintained at 4°C until analyzed. To conduct reverse-phase high-performance liquid chromatog-raphy (HPLC) analysis, this extract was diluted 1 to 3 with deionized water to match the solvent strength of the HPLC eluent.
HPLC analysis was conducted on a modular RP-HPLC system from Thermo Finnigan composed of a SpectraSYSTEM Model P1000 isocratic pump, a SpectraSYSTEM UV2000 dual wavelength UV/VS absorbance detector set at 210 and 254 nm (cell path 1 cm), and a SpectraSYSTEM AS300 autosampler. Samples were introduced by over-filling a 100-µL sampling loop. Separations were made on a 15-cm × 3.9-mm (4-µm) NovaPak C-8 column (Waters Chromatography Division, Milford, Mas-sachusetts) maintained at 28°C and eluted with 15:85 isopropanol/water (v/v) at 1.4-mL/min. Concentrations were estimated from peak heights compared to commercial multi-analyte standards (Restek). Detection limits for RP-HPLC analyses were 0.02 mg/kg except for 2-amino-DNT,
ERDC TR-08-1 8-22
4-amino-DNT, and NG, which had a detection limit of 0.05 mg/kg. The target analytes for RP-HPLC analysis were the 14 energetic compounds of SW846 Method 8330B (US EPA 1996) with the addition of nitroglycerin and PETN. Analyte identities were confirmed for selected samples using a 15-cm × 3.9-mm (4-µm) NovaPak LC-CN RP-HPLC column (Waters Chromatography Division, Milford, Massachusetts) eluted with 65% water, 25% methanol, and 10% acetonitrile (Jenkins and Golden 1993).
Soil Sample Extraction and Analysis for Propellant Constituents from CFB Petawawa and CFB/ASU Wainwright
The 8-g subsamples were mixed with acetonitrile (10 mL). A vortex was applied for 1 min, followed by sonication for 18 h in an ultrasonic bath in the dark. The samples were left to settle for 30 min. Some of the samples were pre-concentrated in order to obtain a lower detection limit: the HPLC method achieved a detection limit of 0.25 mg/kg for all analytes, which was reduced to 0.06 mg/kg when the sample extracts were concentrated in a Zymark apparatus. To pre-concentrate the sample, a 2-mL extract was evaporated to dryness in a Zymark evaporator (model TurboVap LV), then redissolved with 0.5 mL of acetonitrile and 0.5 mL of water containing cal-cium chloride (1%). The mixture was filtered on a 0.45-μ filter to get 1 mL of solution for injection into the HPLC. Soil extracts were maintained at 4°C until analyzed by HPLC according to SW 846 EPA Method 8330B.
Analyses were performed with an HPLC Agilent HP 1100 equipped with a degasser G1322A, a quaternary pump model G1311A, an autosampler G1313A, and an ultraviolet (UV) diode array detector model G1315A moni-toring at 210, 220, and 254 nm. The injection volume was 20 μL and the column used was a Supelcosil LC-8 column 25 cm × 3 mm × 5 μm eluted with 15:85 isopropanol/water (v/v) at a flow rate of 0.75 mL/min. The col-umn temperature was maintained at 25° C during the analysis.
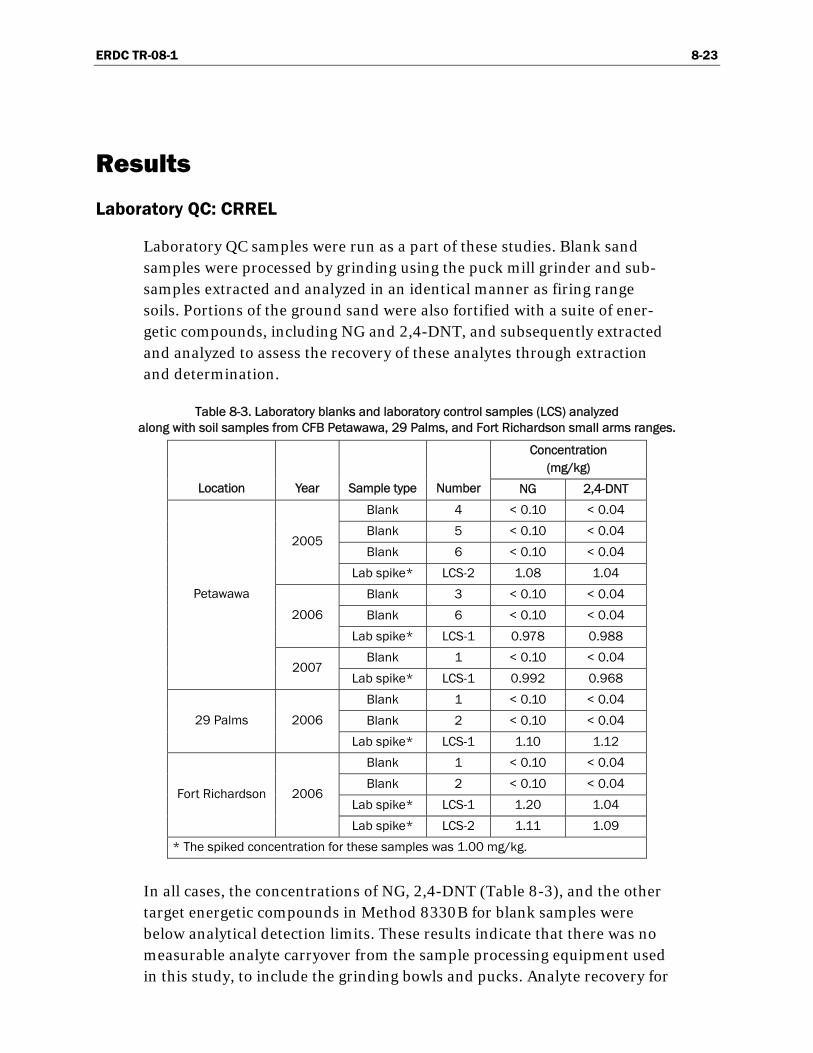
ERDC TR-08-1 8-23
Results
Laboratory QC: CRREL
Laboratory QC samples were run as a part of these studies. Blank sand samples were processed by grinding using the puck mill grinder and sub-samples extracted and analyzed in an identical manner as firing range soils. Portions of the ground sand were also fortified with a suite of ener-getic compounds, including NG and 2,4-DNT, and subsequently extracted and analyzed to assess the recovery of these analytes through extraction and determination.
Table 8-3. Laboratory blanks and laboratory control samples (LCS) analyzed along with soil samples from CFB Petawawa, 29 Palms, and Fort Richardson small arms ranges.
Concentration (mg/kg)
Location Year Sample type Number NG 2,4-DNT
Blank 4 < 0.10 < 0.04
Blank 5 < 0.10 < 0.04
Blank 6 < 0.10 < 0.04 2005
Lab spike* LCS-2 1.08 1.04
Blank 3 < 0.10 < 0.04
Blank 6 < 0.10 < 0.04 2006
Lab spike* LCS-1 0.978 0.988
Blank 1 < 0.10 < 0.04
Petawawa
2007 Lab spike* LCS-1 0.992 0.968
Blank 1 < 0.10 < 0.04
Blank 2 < 0.10 < 0.04 29 Palms 2006
Lab spike* LCS-1 1.10 1.12
Blank 1 < 0.10 < 0.04
Blank 2 < 0.10 < 0.04
Lab spike* LCS-1 1.20 1.04 Fort Richardson 2006
Lab spike* LCS-2 1.11 1.09
* The spiked concentration for these samples was 1.00 mg/kg.
In all cases, the concentrations of NG, 2,4-DNT (Table 8-3), and the other target energetic compounds in Method 8330B for blank samples were below analytical detection limits. These results indicate that there was no measurable analyte carryover from the sample processing equipment used in this study, to include the grinding bowls and pucks. Analyte recovery for

ERDC TR-08-1 8-24
NG and 2,4-DNT from the laboratory control spiked samples ranged from 97.8 to 120% and 96.8 to 112%, respectively, indicating that no losses of these analytes occurred during sample extraction and determination, and that the analytical process was both adequately precise and accurate. Pre-vious studies have indicated that NG and 2,4-DNT were stable during the grinding process (M.E. Walsh et al. 2007, Hewitt et al. in press).
Subsampling Error Assessment: 29 Palms and Fort Richardson
Replicate subsamples were collected from processed soil samples after air drying, sieving, and particle size reduction by grinding to assess the sub-sampling error for these propellant-related compounds from real field samples. A total of 27 sets of triplicate subsamples were analyzed with mean NG concentrations ranging from 0.220 to 664 mg/kg (Table 8-4 and Appendix Table 8-A1). The % RSD for these samples ranged from 0.182 to 28.4 with a median value of 4.38. Similarly, a total of 11 sets of triplicate samples had mean 2,4-DNT concentrations between 0.025 and 20.0 mg/ kg. The % RSD for the 2,4-DNT samples ranged from 0.916 to 20.2 with a median value of 6.61. For both analytes, subsampling reproducibility in these samples as measured by the % RSD was always less than 30%, even for samples with concentrations below 1 mg/kg. We plotted the % RSD versus the mean concentration for NG in these samples along with those from an earlier small arms study at Fort Lewis and Yakima Training Cen-ter (Jenkins et al. 2007). The data set comprises 50 sets of triplicates (Fig. 8-18). For samples with mean NG concentrations above 2 mg/kg, the RSD is generally below 10%. Clearly, the % RSD increases with decreasing mean concentrations below 2 mg/kg. We believe that most of the NG pre-sent in firing point soils is associated with small particles of nitrocellulose. For cases where the concentration is low, the numbers of individual parti-cles present in the soil is small. Even when these soils are ground to reduce particle size and increase the numbers of particles, the very low numbers of individual particles present can limit the ability to provide reproducible subsamples.
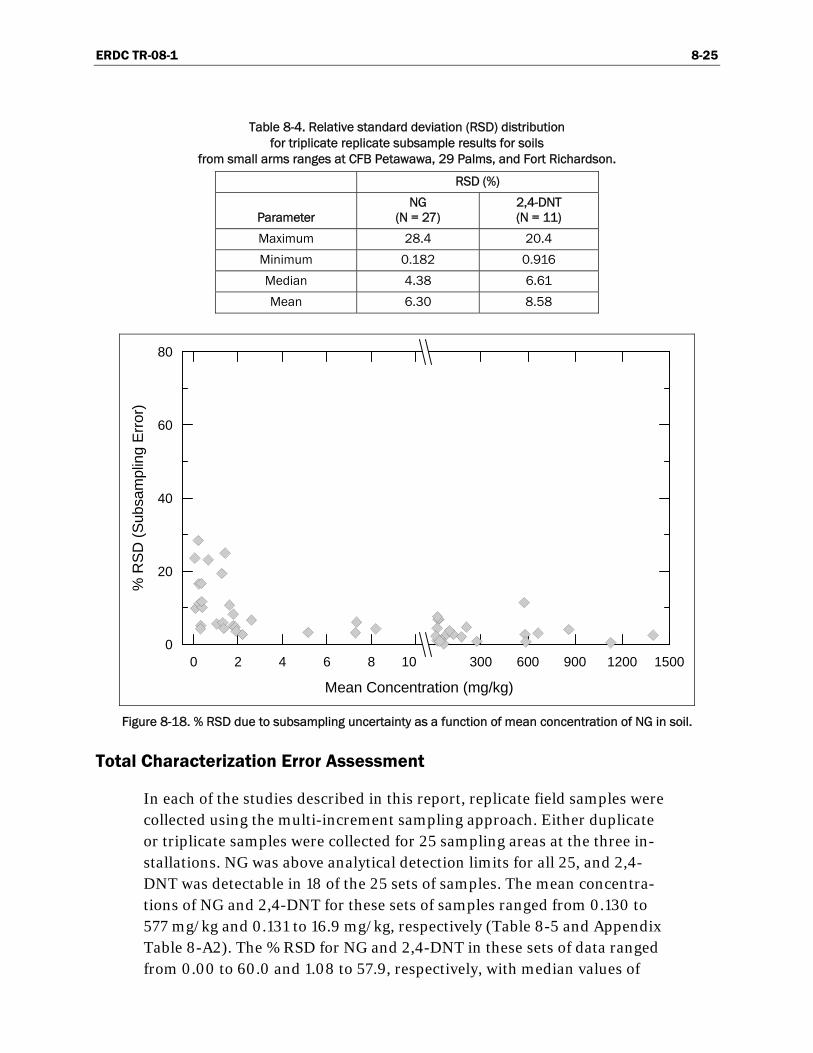
ERDC TR-08-1 8-25
Table 8-4. Relative standard deviation (RSD) distribution for triplicate replicate subsample results for soils
from small arms ranges at CFB Petawawa, 29 Palms, and Fort Richardson.
RSD (%)
Parameter NG
(N = 27) 2,4-DNT (N = 11)
Maximum 28.4 20.4
Minimum 0.182 0.916
Median 4.38 6.61
Mean 6.30 8.58
0 2 4 6 8 10 300 600 900 1200 1500
Mean Concentration (mg/kg)
0
20
40
60
80
% R
SD
(Sub
sam
plin
g E
rror)
Figure 8-18. % RSD due to subsampling uncertainty as a function of mean concentration of NG in soil.
Total Characterization Error Assessment
In each of the studies described in this report, replicate field samples were collected using the multi-increment sampling approach. Either duplicate or triplicate samples were collected for 25 sampling areas at the three in-stallations. NG was above analytical detection limits for all 25, and 2,4-DNT was detectable in 18 of the 25 sets of samples. The mean concentra-tions of NG and 2,4-DNT for these sets of samples ranged from 0.130 to 577 mg/kg and 0.131 to 16.9 mg/kg, respectively (Table 8-5 and Appendix Table 8-A2). The % RSD for NG and 2,4-DNT in these sets of data ranged from 0.00 to 60.0 and 1.08 to 57.9, respectively, with median values of
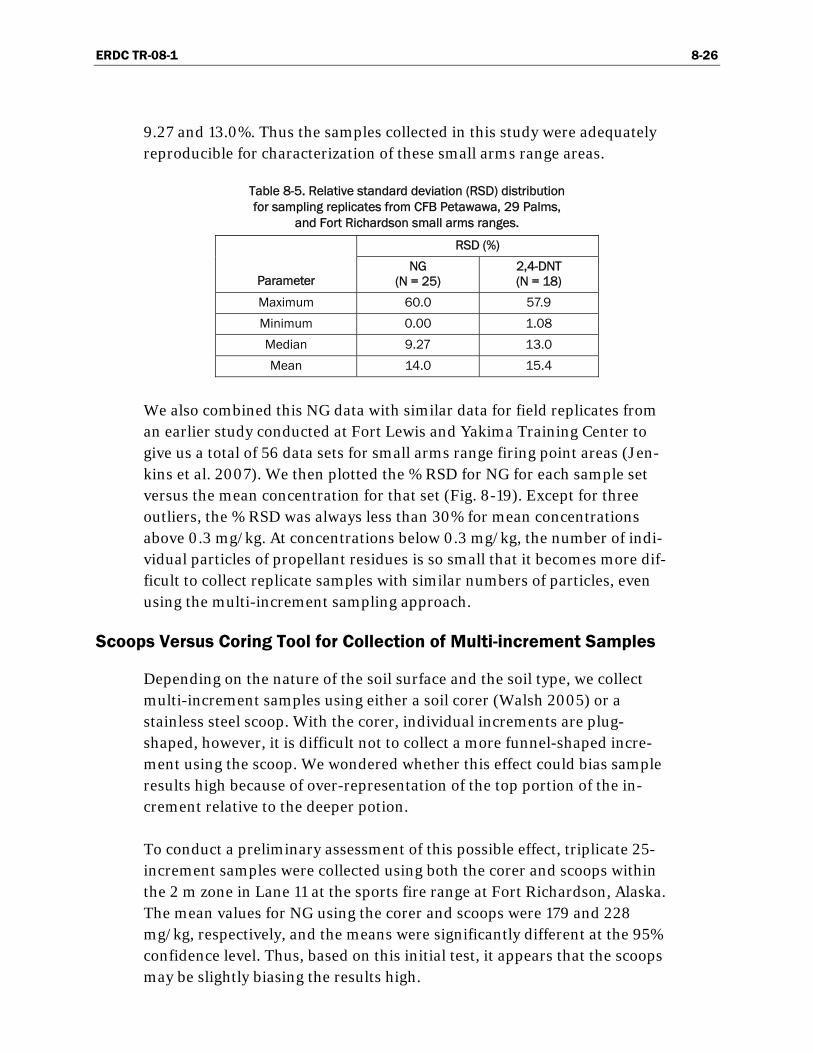
ERDC TR-08-1 8-26
9.27 and 13.0%. Thus the samples collected in this study were adequately reproducible for characterization of these small arms range areas.
Table 8-5. Relative standard deviation (RSD) distribution for sampling replicates from CFB Petawawa, 29 Palms,
and Fort Richardson small arms ranges.
RSD (%)
Parameter NG
(N = 25) 2,4-DNT (N = 18)
Maximum 60.0 57.9
Minimum 0.00 1.08
Median 9.27 13.0
Mean 14.0 15.4
We also combined this NG data with similar data for field replicates from an earlier study conducted at Fort Lewis and Yakima Training Center to give us a total of 56 data sets for small arms range firing point areas (Jen-kins et al. 2007). We then plotted the % RSD for NG for each sample set versus the mean concentration for that set (Fig. 8-19). Except for three outliers, the % RSD was always less than 30% for mean concentrations above 0.3 mg/kg. At concentrations below 0.3 mg/kg, the number of indi-vidual particles of propellant residues is so small that it becomes more dif-ficult to collect replicate samples with similar numbers of particles, even using the multi-increment sampling approach.
Scoops Versus Coring Tool for Collection of Multi-increment Samples
Depending on the nature of the soil surface and the soil type, we collect multi-increment samples using either a soil corer (Walsh 2005) or a stainless steel scoop. With the corer, individual increments are plug-shaped, however, it is difficult not to collect a more funnel-shaped incre-ment using the scoop. We wondered whether this effect could bias sample results high because of over-representation of the top portion of the in-crement relative to the deeper potion.
To conduct a preliminary assessment of this possible effect, triplicate 25-increment samples were collected using both the corer and scoops within the 2 m zone in Lane 11 at the sports fire range at Fort Richardson, Alaska. The mean values for NG using the corer and scoops were 179 and 228 mg/kg, respectively, and the means were significantly different at the 95% confidence level. Thus, based on this initial test, it appears that the scoops may be slightly biasing the results high.

ERDC TR-08-1 8-27
0 2 4 6 8 10 300 600 900 1200 1500
Mean Concentration (mg/kg)
0
20
40
60
80%
RS
D (T
otal
Erro
r)
Figure 8-19. Total error % RSD due to field sampling and sample processing
as a function of mean concentration of NG in soil.
29 Palms Ranges
NG concentrations in triplicate field samples collected from the surface soil in the 0- to 5-m grid for Lanes 29–30 at the 5.56-mm rifle range var-ied from 23.0 to 30.0 mg/kg (mean 26.7 mg/kg, RSD 13.2%), indicating that the sample collection strategy used was adequately reproducible for characterization (Table 8-6). The measured concentration for NG in the 0- to 5-m grid for Lanes 31–32 was similar at 23.8 mg/kg. However, the measured concentrations in the grid areas beyond 5 m from the firing po-sition did not agree well between the two lanes sampled; the samples from the 31–32 grid were consistently higher than those from the 29–30 lane. For example, the NG concentration in the 5- to 10-m grid for Lanes 29–30 was 1.14 and that for Lanes 31–32 was 4.66 mg/kg. The concentration ob-tained for the sample from the 15- to 20-m grid in Lane 31–32 was 26.0 mg/kg, and this result seems quite anomalous compared to the concentra-tion of 23.8 mg/kg found in the 0- to 5-m grid in this lane. The reason for these differences is unknown, but it may be due to some firing activity that has taken place at this downrange location.

ERDC TR-08-1 8-28
Table 8-6. Concentrations of propellant-related chemicals in soils at Range 5/5A, 5.56-mm rifle range, 29 Palms, California.
Concentration (mg/kg) Range/
Lane Sample # Location* Depth (cm) Increments NG 1,3-DNG 1,2-DNG 2,4-DNT
5.66-mm rifle range Lanes 29–30
1 0–5 m 0–1 25 23.0 — — < 0.04
9 0–5 m 0–1 25 27.0 — — < 0.04
10 0–5 m 0–1 25 30.0 — — < 0.04
2 5–10 m 0–1 25 1.14 — — < 0.04
3 10–15 m 0–1 25 1.69 — — < 0.04
4 15–20 m 0–1 25 4.45 — — < 0.04
Lanes 31–32
5 0–5 m 0–1 25 23.8 — — < 0.04
6 5–10 m 0–1 25 4.66 — — < 0.04
7 10–15 m 0–1 25 7.42 — — < 0.04
8 15–20 m 0–1 25 26.0 — — < 0.04
Depth profile (Lanes 29–30)
16 2 m 0–2 1 42.3 0.29 0.32 < 0.04
15 2 m 2–6a 1 9.88 0.06 0.09 < 0.04
14 2 m 6–10a 1 0.64 < 0.04 <0.04 < 0.04
13 2 m 10–14a 1 0.11 — — < 0.04
12 2 m 14–18 1 0.12 — — < 0.04
11 2 m 18–22 1 1.30 — — < 0.04
* Distance ahead of firing line
Profile samples collected 2 m from the firing position in Lanes 29–30 in-dicated that the concentrations of NG declined rapidly below the surface. The concentrations declined from 42.3 mg/kg at the 0- to 2-cm depth to 0.11 and 0.12 mg/kg at the 10- to 14-cm and 14- to 18-cm depths. The slight increase in the lowest sample (18–22 cm) may be due to some con-tribution from soil falling from the surface as the pit was being dug, or it could be due to a soil layer that is richer in fine-grain material that would tend to sorb NG that migrated from the surface in pore water to a greater degree. This sample was the first collected and was from the bottom of the pit. We have observed this same situation at several other locations when deeper profile samples have been collected. Overall, the concentration of NG declined rapidly below the top 6 cm with the NG concentration in the increment from 6 to 10 cm being only 0.64 mg/kg, nearly a hundredfold decline relative to the surface concentration.

ERDC TR-08-1 8-29
The concentration of NG in surface samples for the 9-mm pistol range at 29 Palms was somewhat higher than that found at the rifle range (Table 8-7). The mean NG concentration in the surface soil in the 0- to 4-m grid was 120 mg/kg, declining to 79.6 in the zone from 4 to 7 m.
Table 8-7. Concentrations of propellant-related chemicals in soils at Range 2, 9-mm pistol range, 29 Palms, California.
Concentration (mg/kg)
Range Sample # Location* Depth (cm) Increments NG 2,4-DNT
9-mm pistol range
17 0–4 m 0–1 30 115 < 0.04
18 0–4 m 0–1 30 124 < 0.04
19 0–4 m 0–1 30 122 < 0.04
20 4–7 m 0–1 30 79.6 < 0.04
* Distance ahead of firing line
The third range sampled at 29 Palms was Range 113, a machine gun range. The mean concentrations of NG and 2,4-DNT in the 0- to 5-m zone be-yond the firing line was 93.3 and 0.35 mg/kg, respectively (Table 8-8). NG concentrations declined regularly as the distance away from the firing line increased with the concentration of NG in the 20- to 25-m zone at 2.46 mg/kg.
Table 8-8. Concentrations of propellant-related chemicals in soils at Range 113, machine gun range, 29 Palms, California.
Concentration (mg/kg)
Range Sample # Location* Depth (cm) Increments NG 2,4-DNT
Machine gun range
21 0–5 m 0–1 30 84.0 0.46
22 0–5 m 0–1 30 101 0.32
23 0–5 m 0–1 30 95.0 0.28
24 5–10 m 0–1 30 89.4 0.26
25 10–15 m 0–1 30 14.9 < 0.04
26 15–20 m 0–1 30 6.78 < 0.04
27 20–25 m 0–1 30 2.46 < 0.04
* Distance ahead of firing line

ERDC TR-08-1 8-30
Fort Richardson Ranges
The Oates Range at Fort Richardson is a multi-purpose machine gun range. The mean concentrations for a set of duplicate 25-increment sur-face soil samples (0 to 2.5 cm) from 3 m behind the firing line to 20 m downrange for Lanes 1 and 7 are presented in Table 8-9. The highest NG concentrations for Lanes 1 and 7 are found in the 0- and 5-m samples, 197 and 576 mg/kg, respectively. For Lane 1, the concentrations decline rap-idly and regularly with distance from the firing line; the NG concentration at 20 m was only 0.242 mg/kg. For Lane 7, the concentrations are much higher in general than for Lane 1, and although there is a general decline in concentration at distance from the firing line, there is an increase in NG concentration to 26.0 mg/kg at the 20-m distance. The reason for this in-crease is unknown. The concentration of 2,4-DNT in these samples is much lower than that for NG, but the behavior as a function of distance from the firing line is similar, although no increase in concentration at the 20-m distance was found for 2,4-DNT.
The NG concentration for a set of depth-profile samples collected 1.4 m from the firing line in Lane 7 is also presented in Table 8-8. Concentra-tions decline from 627 mg/kg at the surface regularly to 1.64 mg/kg at the 8- to 10-cm depth. However, there is a large increase in concentration at the 10- to 12-cm depth that coincides to the depth interval where several unfired bullets were recovered. It appears that this location received about 10 cm of new soil at some point in the past and the current 10-cm depth was once the soil surface. The NG concentration as a function of depth below 10 cm again declines rapidly and regularly to 0.117 mg/kg at the 20- to 22-cm depth. The concentrations of 2,4-DNT are only a factor of about 1/30th to 1/50th of the NG concentrations, but the behavior as a function of depth is simiar to that of NG.
Samples were collected at the sports firing range at Fort Richardson in a similar manner to those from the Oates Firing Range. At the sport firing range, a variety of small arms are fired. Analytical results for NG and 2,4-DNT are present in Table 8-10. The highest concentrations for NG were 202 mg/kg for the 5-m sample for Lane 13 and 206 mg/kg for the 2-m sample for Lane 11. In both lanes, the concentration of NG declines at dis-tance from the firing line, but there is no regular pattern unlike that for the Oates machine gun range. This is probably due to the firing of a variety of small arms at this range with multiple firing lines.

ERDC TR-08-1 8-31
Table 8-9. Concentrations of propellant-related chemicals in soils at Oates machine gun firing range, Fort Richardson, Alaska.
Mean concentration (mg/kg)
Lane Sample # Location* Depth (cm) Increments NG 2,4-DNT
Machine gun range
40, 42 5 m behind 0–2.5 25 6.44 0.174
35, 44 0 m 0–2.5 25 197 4.55
34, 43 5 m 0–2.5 25 95.7 2.27
39,38 10 m 0–2.5 25 14.1 0.131
41, 37 15 m 0–2.5 25 1.75 < 0.04
Lane 1
45, 36 20 m 0–2.5 25 0.242 < 0.04
58, 55 5 m behind 0–2.5 25 29.1 0.741
57, 54 0 m 0–2.5 25 516 15.5
53, 51 5 m 0–2.5 25 576 16.9
50, 56 10 m 0–2.5 25 4.66 0.831
59, 52 15 m 0–2.5 25 7.42 0.400
Lane 7
61, 60 20 m 0–2.5 25 26.0 < 0.04
Depth Profile: Lane 7
697 1.4 m 0–2 1 627 13.9
698 1.4 m 2–4 1 101 2.83
699 1.4 m 4–6 1 13.8 0.438
700 1.4 m 6–8 1 2.72 0.099
701 1.4 m 8–10 1 1.64 0.080
702 1.4 m 10–12 1 52.1 1.60
703 1.4 m 12–14 1 17.7 0.527
704 1.4 m 14–16 1 5.72 0.185
705 1.4 m 16–18 1 11.5 0.362
706 1.4 m 18–20 1 1.28 0.133
707 1.4 m 20–22 1 0.117 < 0.04
* Distance ahead of firing line

ERDC TR-08-1 8-32
Table 8-10. Concentrations of propellant-related chemicals in soils at the sports firing range, Fort Richardson, Alaska.
Mean concentration (mg/kg)
Lane Sample # Location* Depth (cm) Increments NG 2,4-DNT
9 3 m behind 0–2.5 25 36.9 0.716
18 0 m 0–2.5 25 23.3 0.416
8 2 m 0–2.5 25 21.3 0.330
12 5 m 0–2.5 25 202 4.36
10 10 m 0–2.5 25 11.2 0.200
16 15 m 0–2.5 25 7.54 0.058
15 20 m 0–2.5 25 9.68 0.054
11 25 m 0–2.5 25 11.0 0.050
Lane 13
13 30 m 0–2.5 25 36.9 0.518
28 3 m behind 0–2.5 25 28.4 0.446
26 0 m 0–2.5 25 22.3 0.332
23 2 m 0–2.5 25 206 3.20
22 5 m 0–2.5 25 196 3.74
33 10 m 0–2.5 25 7.07 0.100
32 15 m 0–2.5 25 6.31 0.042
31 20 m 0–2.5 25 14.3 < 0.04
30 25 m 0–2.5 25 18.3 0.100
Lane 11
24 30 m 0–2.5 25 10.1 0.150
Depth Profile: Lane 11
Hammer corer samples
665 2 m 0–2 1 231 2.23
666 2 m 2–4 1 137 2.56
668 2 m 4–6 1 16.6 0.311
671 2 m 6–8 1 5.97 0.101
670 2 m 8–10 1 1.31 < 0.04
664 2 m 10–15 1 1.41 < 0.04
667 2 m 15–20 1 1.41 < 0.04
662 2 m 20–25 1 0.241 < 0.04
669 2 m 25–30 1 0.101 < 0.04
663 2 m 30–35 1 0.302 < 0.04
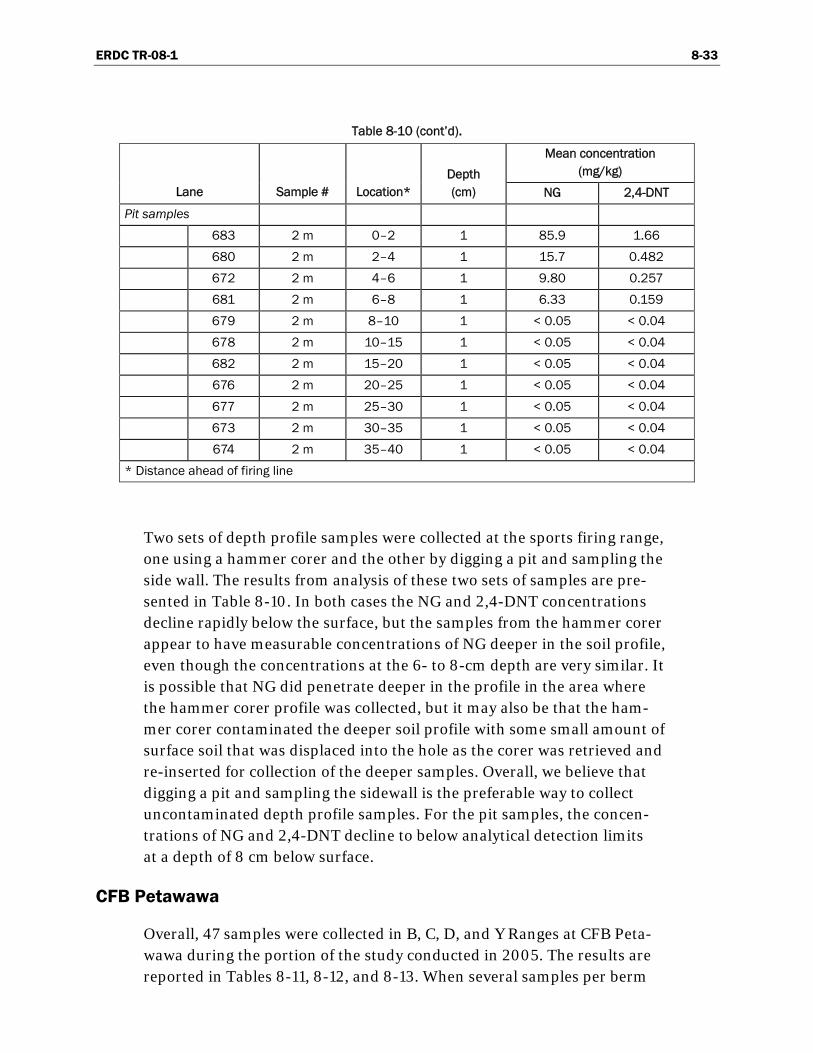
ERDC TR-08-1 8-33
Table 8-10 (cont’d).
Mean concentration (mg/kg)
Lane Sample # Location* Depth (cm) NG 2,4-DNT
Pit samples
683 2 m 0–2 1 85.9 1.66
680 2 m 2–4 1 15.7 0.482
672 2 m 4–6 1 9.80 0.257
681 2 m 6–8 1 6.33 0.159
679 2 m 8–10 1 < 0.05 < 0.04
678 2 m 10–15 1 < 0.05 < 0.04
682 2 m 15–20 1 < 0.05 < 0.04
676 2 m 20–25 1 < 0.05 < 0.04
677 2 m 25–30 1 < 0.05 < 0.04
673 2 m 30–35 1 < 0.05 < 0.04
674 2 m 35–40 1 < 0.05 < 0.04
* Distance ahead of firing line
Two sets of depth profile samples were collected at the sports firing range, one using a hammer corer and the other by digging a pit and sampling the side wall. The results from analysis of these two sets of samples are pre-sented in Table 8-10. In both cases the NG and 2,4-DNT concentrations decline rapidly below the surface, but the samples from the hammer corer appear to have measurable concentrations of NG deeper in the soil profile, even though the concentrations at the 6- to 8-cm depth are very similar. It is possible that NG did penetrate deeper in the profile in the area where the hammer corer profile was collected, but it may also be that the ham-mer corer contaminated the deeper soil profile with some small amount of surface soil that was displaced into the hole as the corer was retrieved and re-inserted for collection of the deeper samples. Overall, we believe that digging a pit and sampling the sidewall is the preferable way to collect uncontaminated depth profile samples. For the pit samples, the concen-trations of NG and 2,4-DNT decline to below analytical detection limits at a depth of 8 cm below surface.
CFB Petawawa
Overall, 47 samples were collected in B, C, D, and Y Ranges at CFB Peta-wawa during the portion of the study conducted in 2005. The results are reported in Tables 8-11, 8-12, and 8-13. When several samples per berm
ERDC TR-08-1 8-34
were taken around groups of lanes, the average concentrations, standard deviations, and % RSD on the whole length of a given berm were calcu-lated; these are also reported in Tables 8-11 to 8-13. The results all show similar trends. NG was detected in all samples, while 2,4-DNT was found in 40 samples (85%). NG was detected at levels varying from 0.3 to 62.4 mg/kg. The concentrations of 2,4-DNT were an order of magnitude lower, going from undetected to 0.6 mg/kg. The highest values for NG were al-ways at the berm closest to the targets, with a mean between 11 and 15 mg/kg. Except for the 200-m berm at C Range (Table 8-13), the mean con-centrations were usually one order of magnitude lower (between 1.6 and 6.9 mg/kg) for all the other berms that were sampled.
Significant variations (between 27 and 104% RSD) in the concentration of propellant residues were observed between lanes of the same berm. This is probably the result of a more intensive or recent use of some of the lanes. And lastly, concentrations of NG detected at Y Range for the 30-lane sam-ples of the 100-, 200-, and 300-m berms were 62, 37, and 23 mg/kg, re-spectively (Table 8-11). These values are much higher than the correspond-ing mean of 12.3, 3.11, and 2.58 mg/kg for the five-lanes samples of the same berms. This is probably due to variations in sampling distances from the firing point. Indeed, the 30-lane samples were collected either directly on the berm or on the side of the berm facing the targets, while the five-lanes samples were built by taking 30 increments on the berm, on the side of the berm, and up to 2 m in the flat area in front of the berm. The sam-pling area was thus larger for the five-lanes samples. This indicates that concentrations are dropping rapidly after the firing point.
Two pistol ranges, Q and E, were also sampled in 2005; results are shown in Table 8-14. At Q Range, the firing area was sampled at distances rang-ing from 0 to 40 m from the farthest firing line. NG was detected in all 12 samples, and 2,4-DNT in eight samples (67%). NG concentrations ranged from 4.5 to 28.8 mg/kg, but there was no major change in concentration at the various sampling distances, indicating that firing occurs at all dis-tances from the targets. The overall mean of 16.8 mg/kg was just slightly higher than those of the 100-m berm of rifle ranges (between 11 and 15 mg/kg; Tables 8-11 to 8-13). The concentrations of 2,4-DNT were much lower than NG, ranging from < 0.04 to 0.084 mg/kg.
In 2006, Y Range was sampled again (Table 8-11). In this case 50-incre-ment samples were collected by groups of five lanes at the 200- and 300-
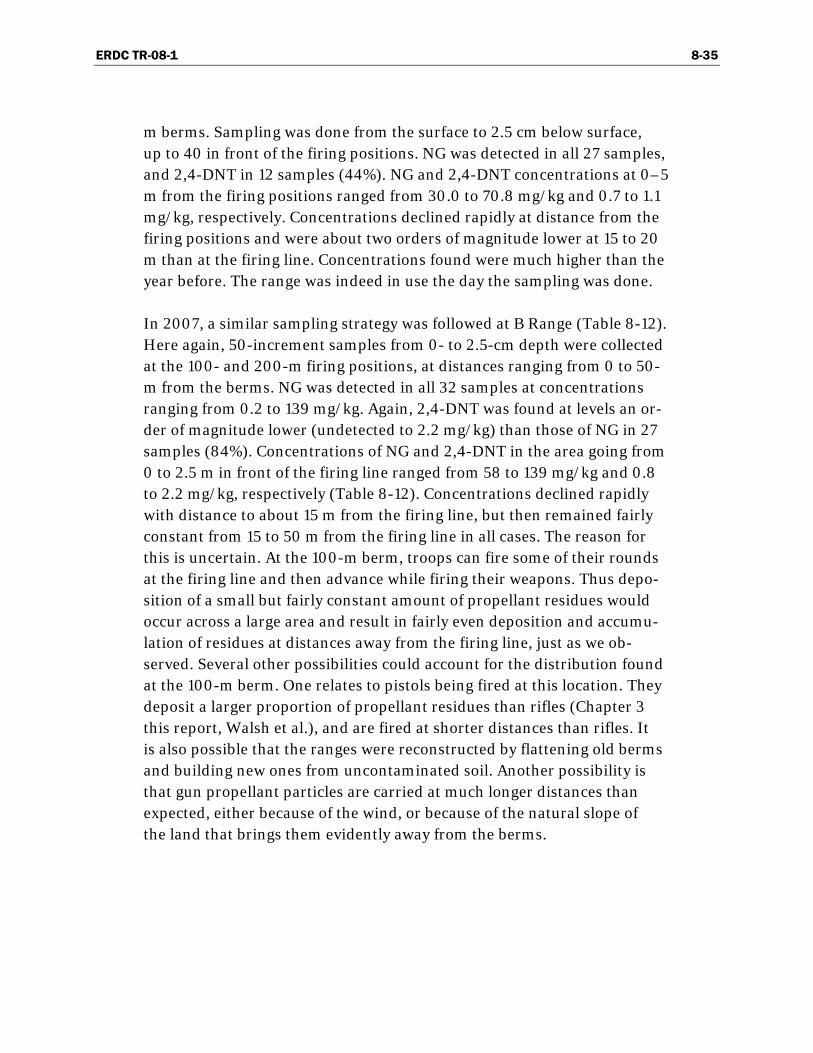
ERDC TR-08-1 8-35
m berms. Sampling was done from the surface to 2.5 cm below surface, up to 40 in front of the firing positions. NG was detected in all 27 samples, and 2,4-DNT in 12 samples (44%). NG and 2,4-DNT concentrations at 0–5 m from the firing positions ranged from 30.0 to 70.8 mg/kg and 0.7 to 1.1 mg/kg, respectively. Concentrations declined rapidly at distance from the firing positions and were about two orders of magnitude lower at 15 to 20 m than at the firing line. Concentrations found were much higher than the year before. The range was indeed in use the day the sampling was done.
In 2007, a similar sampling strategy was followed at B Range (Table 8-12). Here again, 50-increment samples from 0- to 2.5-cm depth were collected at the 100- and 200-m firing positions, at distances ranging from 0 to 50-m from the berms. NG was detected in all 32 samples at concentrations ranging from 0.2 to 139 mg/kg. Again, 2,4-DNT was found at levels an or-der of magnitude lower (undetected to 2.2 mg/kg) than those of NG in 27 samples (84%). Concentrations of NG and 2,4-DNT in the area going from 0 to 2.5 m in front of the firing line ranged from 58 to 139 mg/kg and 0.8 to 2.2 mg/kg, respectively (Table 8-12). Concentrations declined rapidly with distance to about 15 m from the firing line, but then remained fairly constant from 15 to 50 m from the firing line in all cases. The reason for this is uncertain. At the 100-m berm, troops can fire some of their rounds at the firing line and then advance while firing their weapons. Thus depo-sition of a small but fairly constant amount of propellant residues would occur across a large area and result in fairly even deposition and accumu-lation of residues at distances away from the firing line, just as we ob-served. Several other possibilities could account for the distribution found at the 100-m berm. One relates to pistols being fired at this location. They deposit a larger proportion of propellant residues than rifles (Chapter 3 this report, Walsh et al.), and are fired at shorter distances than rifles. It is also possible that the ranges were reconstructed by flattening old berms and building new ones from uncontaminated soil. Another possibility is that gun propellant particles are carried at much longer distances than expected, either because of the wind, or because of the natural slope of the land that brings them evidently away from the berms.

ERDC TR-08-1 8-36
Table 8-11. Concentrations of propellant-related chemicals in soils at Y Range, used for rifle training, CFB Petawawa, 2005 and 2006. Location column indicates distance from firing line.
Concentration (mg/kg)
100-yd firing line
200-yd firing line
300-yd firing line
Lane Location Depth (cm) Increments NG 2,4-DNT NG 2,4-DNT NG 2,4-DNT
Sampled 2005
Lanes 0–5 0–2.5 m 0–2 30 22.9 0.31
Lanes 6–10 0–2.5 m 0–2 30 29.3 0.43
Lanes 11–15 0–2.5 m 0–2 30 9.05 0.15
Lanes 16–20 0–2.5 m 0–2 30 7.29 0.13
Lanes 21–25 0–2.5 m 0–2 30 3.32 nd
Lanes 26–30 0–2.5 m 0–2 30 2.07 nd
Mean Lanes 1–30 12.3 0.17
Std. Dev. Lanes 1–30 10.2 0.16
% RSD Lanes 1–30 82.7 92.0
Lanes 0–10 0–2.5 m 0–2.5 30 7.38 0.23 6.40 0.28
Lanes 11–20 0–2.5 m 0–2.5 30 1.09 nd 1.88 nd
Lanes 21–30 0–2.5 m 0–2.5 30 0.51 nd 0.33 nd
Mean Lanes 1–30 2.99 0.08 2.87 0.09
Std. Dev. Lanes 1–30 3.11 0.11 2.58 0.13
% RSD Lanes 1–30 104 141 89.7 141
Lanes 0–30 0–2.5 m 0–2.5 30 37.4 0.57 22.5 0.57
0–1 m 0–1 70–80 62.4 0.63
Sampled 2006
Lanes 30–26 0–5 m 0–2.5 50 50.4 0.922 46.6 1.06
5–10 m 0–2.5 50 17.7 0.488 9.68 0.254
10–15 m 0–2.5 50 2.36 < 0.04 1.09 < 0.04
15–20 m 0–2.5 50 0.594 < 0.04
20–25 m 0–2.5 50 0.464 < 0.04
25–30 m 0–2.5 50 0.316 < 0.04
30–40 m 0–2.5 50 0.316 < 0.04
Lanes 25–21 0–5 m 0–2.5 50 48.8 0.888 34.1 0.788
5–10 m 0–2.5 50 15.3 0.366 5.11 0.154
10–15 m 0–2.5 50 1.98 0.044 1.43 < 0.04
15–20 m 0–2.5 50 0.442 < 0.04
20–25 m 0–2.5 50 0.500 < 0.04
25–30 m 0–2.5 50 0.232 < 0.04
30–40 m 0–2.5 50 0.146 < 0.04

ERDC TR-08-1 8-37
Table 8-11 (cont’d). Concentrations of propellant-related chemicals in soils at Y Range, used for rifle training, CFB Petawawa, 2005 and 2006. Location column indicates distance from firing line.
Concentration (mg/kg)
100-yd firing line
200-yd firing line
300-yd firing line
Lane Location Depth (cm) Increments NG 2,4-DNT NG 2,4-DNT NG 2,4-DNT
Sampled 2006 (cont’d)
Lanes 20–16 0–5 m 0–2.5 50 30.0 0.548
5–10 m 0–2.5 50 13.6 0.246
10–15 m 0–2.5 50 1.51 < 0.04
15–20 m 0–2.5 50 0.308 < 0.04
20–25 m 0–2.5 50 0.426 0.040
25–30 m 0–2.5 50 0.280 < 0.04
30–40 m 0–2.5 50 0.172 < 0.04
Depth profile 1 m 0–2 1 70.8 0.702
Lane 25 1 m 2–4 1 59.3 1.21
1 m 4–6 1 35.4 1.20
1 m 6–8 1 22.2 0.633
1 m 8–10 1 22.2 0.609
1 m 10–15 1 1.52 0.085
1 m 15–20 1 0.309 < 0.04
1 m 20–25 1 < 0.10 < 0.04
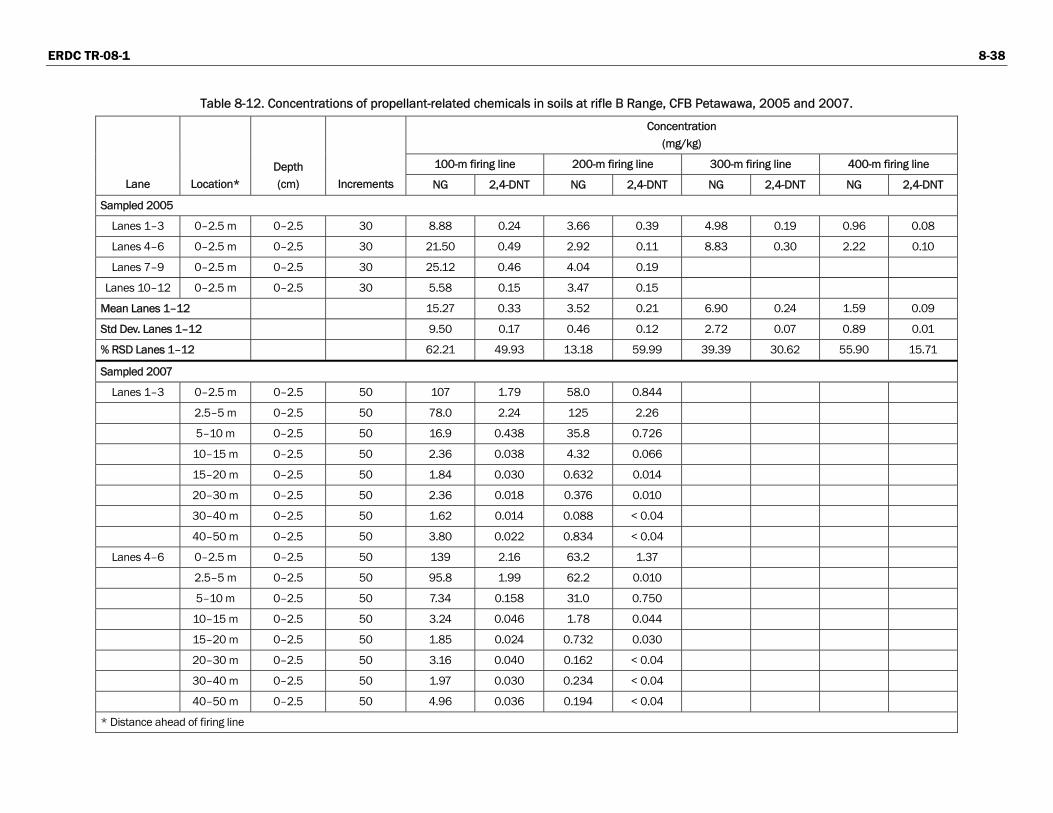
ERDC TR-08-1 8-38
Table 8-12. Concentrations of propellant-related chemicals in soils at rifle B Range, CFB Petawawa, 2005 and 2007.
Concentration (mg/kg)
100-m firing line 200-m firing line 300-m firing line 400-m firing line
Lane Location* Depth (cm) Increments NG 2,4-DNT NG 2,4-DNT NG 2,4-DNT NG 2,4-DNT
Sampled 2005
Lanes 1–3 0–2.5 m 0–2.5 30 8.88 0.24 3.66 0.39 4.98 0.19 0.96 0.08
Lanes 4–6 0–2.5 m 0–2.5 30 21.50 0.49 2.92 0.11 8.83 0.30 2.22 0.10
Lanes 7–9 0–2.5 m 0–2.5 30 25.12 0.46 4.04 0.19
Lanes 10–12 0–2.5 m 0–2.5 30 5.58 0.15 3.47 0.15
Mean Lanes 1–12 15.27 0.33 3.52 0.21 6.90 0.24 1.59 0.09
Std Dev. Lanes 1–12 9.50 0.17 0.46 0.12 2.72 0.07 0.89 0.01
% RSD Lanes 1–12 62.21 49.93 13.18 59.99 39.39 30.62 55.90 15.71
Sampled 2007
Lanes 1–3 0–2.5 m 0–2.5 50 107 1.79 58.0 0.844
2.5–5 m 0–2.5 50 78.0 2.24 125 2.26
5–10 m 0–2.5 50 16.9 0.438 35.8 0.726
10–15 m 0–2.5 50 2.36 0.038 4.32 0.066
15–20 m 0–2.5 50 1.84 0.030 0.632 0.014
20–30 m 0–2.5 50 2.36 0.018 0.376 0.010
30–40 m 0–2.5 50 1.62 0.014 0.088 < 0.04
40–50 m 0–2.5 50 3.80 0.022 0.834 < 0.04
Lanes 4–6 0–2.5 m 0–2.5 50 139 2.16 63.2 1.37
2.5–5 m 0–2.5 50 95.8 1.99 62.2 0.010
5–10 m 0–2.5 50 7.34 0.158 31.0 0.750
10–15 m 0–2.5 50 3.24 0.046 1.78 0.044
15–20 m 0–2.5 50 1.85 0.024 0.732 0.030
20–30 m 0–2.5 50 3.16 0.040 0.162 < 0.04
30–40 m 0–2.5 50 1.97 0.030 0.234 < 0.04
40–50 m 0–2.5 50 4.96 0.036 0.194 < 0.04
* Distance ahead of firing line

ERDC TR-08-1 8-39
Table 8-13. Concentrations of propellant-related chemicals in soils at rifle C and D Ranges, CFB Petawawa, 2006.
Concentration (mg/kg)
100-m firing line 200-m firing line 300-m firing line
Lane Location* Depth (cm) Increments NG 2,4-DNT NG 2,4-DNT NG 2,4-DNT
C Range
Lanes 1–3 0–2.5 m 0–2.5 30 13.39 0.28 1.46 0.04
Lanes 4–6 0–2.5 m 0–2.5 30 19.71 0.31 23.16 0.36
Lanes 7–9 0–2.5 m 0–2.5 30 5.48 0.21 11.01 0.34
Lanes 10–12 0–2.5 m 0–2.5 30 14.39 0.24 8.98 0.31
Mean Lanes 1–12 13.24 0.26 11.15 0.26
Std. Dev. Lanes 1–12 5.87 0.04 8.99 0.15
% RSD Lanes 1–12 44.4 17.1 80.7 58.1
D Range
Lanes 1–3 0–2.5 m 0–2.5 30 16.58 0.32 5.02 0.15 4.43 0.16
Lanes 4–6 0–2.5 m 0–2.5 30 18.15 0.32 6.82 0.25 7.57 0.17
Lanes 7–9 0–2.5 m 0–2.5 30 10.72 0.33 7.86 0.25 1.10 0.06
Lanes 10–12 0–2.5 m 0–2.5 30 2.38 0.08 4.23 0.09 0.31 Nd**
Mean Lanes 1–12 11.96 0.26 5.98 0.18 3.35 0.10
Std. Dev. Lanes 1–12 7.14 0.12 1.65 0.08 3.33 0.08
% RSD Lanes 1–12 59.7 47.0 27.7 41.2 99.5 85.6
* Distance ahead of firing line ** Nd = not detected
In 2006, samples were collected in a depth profile at Y Range 1 m in front of Lane 25 of the 100-m berm. Results indicated that the NG and 2,4-DNT concentrations did not decline greatly from the surface (70.8 and 0.7 mg/kg) to 10 cm below surface (22.2 and 0.6 mg/kg), but declined rapidly to less than 0.01 and less than 0.04 mg/kg, respectively, at 20 to 25 cm below surface (Table 8-11). This could indicate that the surface (0 to 10 cm) may have been disturbed or that fill was brought in at some time in the recent past at this range.
CFB/ASU Wainwright
Four small arms ranges were sampled at CFB/ASU Wainwright in 2005. One of them, Range 4, is a 9-mm pistol range. Records indicate 18,500 rounds of 9-mm ammunition were fired in 2001 and 2002 and that the range was inactive in 2003 and 2004. A set of three 50-increment samples was collected from 0- to 2-cm depth, one at each of the three Range 4 fir-

ERDC TR-08-1 8-40
ing positions (Table 8-15). At two of the positions, the NG concentrations were 22.7 and 39.9 mg/kg. At the third position, closest to the targets, the NG concentration was only 0.6 mg/kg. Clearly, much less training is con-ducted at this position. The 2,4-DNT concentration was much lower than that for NG in all cases, and just above analytical detection limits in two of the three positions.
Table 8-14. Concentrations of propellant-related chemicals in soils at pistol Q and E Ranges, CFB Petawawa, October 2005.
Concentration (mg/kg)
Range/Lane Location* Depth (cm) Increments NG 2,4-DNT
Q Range
0–5 m 0–2.5 50 18.3 0.084
5–10 m 0–2.5 50 17.2 0.044
10–15 m 0–2.5 50 28.8 0.056
15–20 m 0–2.5 50 25.8 < 0.04
20–30 m 0–2.5 50 9.20 < 0.04
Lane A
30–40 m 0–2.5 50 4.54 < 0.04
0–5 m 0–2.5 50 16.7 0.064
5–10 m 0–2.5 50 22.6 0.076
10–15 m 0–2.5 50 13.5 0.048
15–20 m 0–2.5 50 22.4 0.062
20–30 m 0–2.5 50 4.48 < 0.04
Lane B
30–40 m 0–2.5 50 18.3 0.084
Overall mean 16.8 0.04
E Range
25-m firing point Lanes 0–5 0–2.5 30 2.51 < 0.04
Lanes 6–10 0–2.5 30 2.76 < 0.04
Lanes 11–15 0–2.5 30 35.90 0.13
Overall mean 13.72
50-m firing point Lanes 0–5 0–2.5 30 1.92 0.09
Lanes 6–10 0–2.5 30 0.76 < 0.04
Lanes 11–15 0–2.5 30 2.47 < 0.04
Overall mean 1.71
* Distance ahead of firing line
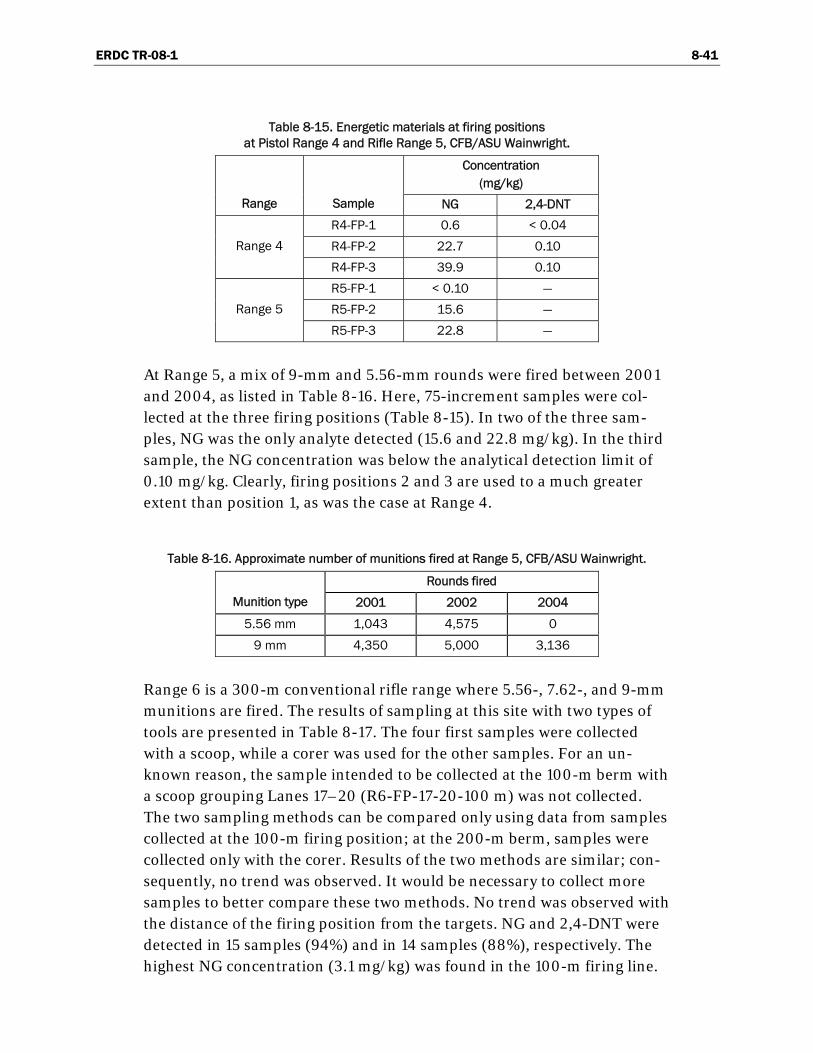
ERDC TR-08-1 8-41
Table 8-15. Energetic materials at firing positions at Pistol Range 4 and Rifle Range 5, CFB/ASU Wainwright.
Concentration (mg/kg)
Range Sample NG 2,4-DNT
R4-FP-1 0.6 < 0.04
R4-FP-2 22.7 0.10 Range 4
R4-FP-3 39.9 0.10
R5-FP-1 < 0.10 —
R5-FP-2 15.6 — Range 5
R5-FP-3 22.8 —
At Range 5, a mix of 9-mm and 5.56-mm rounds were fired between 2001 and 2004, as listed in Table 8-16. Here, 75-increment samples were col-lected at the three firing positions (Table 8-15). In two of the three sam-ples, NG was the only analyte detected (15.6 and 22.8 mg/kg). In the third sample, the NG concentration was below the analytical detection limit of 0.10 mg/kg. Clearly, firing positions 2 and 3 are used to a much greater extent than position 1, as was the case at Range 4.
Table 8-16. Approximate number of munitions fired at Range 5, CFB/ASU Wainwright.
Rounds fired
Munition type 2001 2002 2004
5.56 mm 1,043 4,575 0
9 mm 4,350 5,000 3,136
Range 6 is a 300-m conventional rifle range where 5.56-, 7.62-, and 9-mm munitions are fired. The results of sampling at this site with two types of tools are presented in Table 8-17. The four first samples were collected with a scoop, while a corer was used for the other samples. For an un-known reason, the sample intended to be collected at the 100-m berm with a scoop grouping Lanes 17–20 (R6-FP-17-20-100 m) was not collected. The two sampling methods can be compared only using data from samples collected at the 100-m firing position; at the 200-m berm, samples were collected only with the corer. Results of the two methods are similar; con-sequently, no trend was observed. It would be necessary to collect more samples to better compare these two methods. No trend was observed with the distance of the firing position from the targets. NG and 2,4-DNT were detected in 15 samples (94%) and in 14 samples (88%), respectively. The highest NG concentration (3.1 mg/kg) was found in the 100-m firing line.

ERDC TR-08-1 8-42
Table 8-17. Energetic materials at firing positions in Rifle Range 6, CFB/ASU Wainwright.
Concentration (mg/kg)
Sample Collection method NG 2,4-DNT
R6-FP-1-4-100 m scoop 0.5 0.1
R6-FP-5-8-100 m 3.1 nd*
R6-FP-9-12-100 m 0.7 0.1
R6-FP-13-16-100 m 0.4 0.1
R6-FP-1-4-100 m corer 1.3 0.1
R6-FP-5-8-100 m 0.1 nd
R6-FP-9-12-100 m 0.5 0.1
R6-FP-13-16-100 m 0.3 0.2
R6-FP-17-20-100 m 0.3 0.4
R6-FP-1-4-200 m n.d. 0.1
R6-FP-5-8-200 m 0.5 0.1
R6-FP-9-12-200 m 0.2 0.3
R6-FP-13-16-200 m 0.4 0.7
R6-FP-17-20-200 m 0.2 0.2
R6-FP-1-20-200 m (40 cores) 1 0.2 0.1
R6-FP-1-20-200 m (40 cores) 2 0.3 0.1
* nd: Not detected
Range 9, a 30-yd zeroing range, has just a single firing line. The site was inactive between 2001 and 2003; in 2004, approximately 2000 9-mm bul-lets were fired. It is not possible to observe a trend with the distance from targets based on the results (Table 8-18). However, as with the other ranges, NG was detected in all samples with a maximum concentration of 7.4 mg/kg.
Table 8-18: Energetic materials at firing positions at Zeroing Range 9, CFB/ASU Wainwright.
Concentration (mg/kg)
Sample NG 2,4-DNT
R9-FP-1-4 3.9 nd*
R9-FP-5-8 7.4 0.1
R9-FP-9-12 3.8 nd
R9-FP-13-16 1.0 nd
R9-FP-13-16 DUP 3.1 nd
R9-FP-17-20 1.4 0
R9-FP-21-24 2.6 nd
* nd: Not detected

ERDC TR-08-1 8-43
Discussion
9-mm Pistol Ranges
Overall, four 9-mm pistol ranges have been sampled as a portion of the SERDP ER-1481 (29 Palms, CFB Petawawa, and CFB/ASU Wainwright). Concentrations in surface soils at the firing points ranged from about 0.8 to 120 mg/kg. The highest concentrations were measured at the 29 Palms range in a zone from 0 to 4 m from the firing line, but the samples at this range were collected only from the 0- to 1-cm depth. Because deposition of propellant residues is at the surface as particles of burnt and unburned propellant (Hewitt et al. 2007), including deeper soils in the sample largely dilutes residues from near the surface with soil containing much lower concentrations. The concentrations from CFB Petawawa and CFB/ ASU Wainwright are lower, but the samples were collected from 0- to 2.5-cm depth and hence were probably diluted with much lower concentration soils below the 1-cm depth. Other possibilities include a larger use of 29 Palms as compared to CFB Petawawa and CFB/ASU Wainwright. Concen-trations of 2,4-DNT were much lower than NG, reaching up to 0.13 mg/kg.
We estimated the mass of NG present from firing 9-mm pistols at the 29 Palms pistol range. This was done by first estimating the mass of soil pre-sent in the two zones that we sampled. Zone 1 was 4 m by 40 m and 1 cm deep or 1.6 × 106 cm3. Zone 2 was 3 m by 40 m and 1 cm deep or 1.2 × 106 cm3. If we use a soil density of 1.7 g/cm3, we estimate the mass of soil in the two zones to be 2,720 and 2,040 kg, respectively. Multiplying each soil mass by the concentration measured for NG in each zone (120 and 79.6 mg/kg) gives a total estimated mass of NG in the soil at this range of 489 g. Walsh et al. (Chapter 3 this report, 2007) estimated the mass of NG de-posited per round for 9-mm pistols at 2.1 mg per round fired. If we assume that all of the residue from firing was deposited in the sampled area, there were no losses due to degradation processes, and the residue remained in the top 1 cm of soil, we can estimate the total number of rounds fired on this range. This was done by dividing the estimated total mass present by the mass deposited per round, or about 233,000 rounds fired.
The same exercise was performed for Q Range in CFB Petawawa; in this case the calculated number of rounds fired was 48,000, which corre-

ERDC TR-08-1 8-44
sponds, according to historic data, to 20% of the rounds fired during the year preceding the sampling event in this range. This could indicate an underestimation of the quantity of residues per round and/or of the area in which residues are deposited, or this could simply indicate that the rate of degradation/leaching of NG in the environment is very fast.
5.56-mm Rifle Ranges
Seven 5.56-mm rifle ranges have been sampled as a part of ER-1481. These include six where the data are reported here (Range 5/5A at 29 Palms, Y, B, C, and D Ranges at CFB Petawawa, Range 5 at CFB/ASU Wainwright) and one range (Range 93 at Fort Lewis) that was reported on earlier (Jen-kins et al. 2007).
Concentrations of NG in surface soils varied considerably at these sites from undetected at Y Range in CFB Petawawa to over 500 mg/kg at Range 93 at Fort Lewis in the area from 0 to 5 m from the firing line. The concen-trations tend to be lower in CFB Petawawa and CFB/ASU Wainwright be-cause Canadian small arms ranges use three to six firing lines instead of always using the same firing line, as is done in the United States. The con-centrations drop off on average to about 30% at the 5- to 10-m distance from the firing line. Samples were collected only at distances beyond 10 m at B and Y Ranges at CFB Petawawa, and in this case the concentrations at the 10- to 15-m distance were further reduced to only about 3% of that in the 0- to 5-m zone. These results are in agreement with those found during depositional studies for the 5.56-mm rifle by Walsh et al. (2007, Chapter 3 in this report) and Brochu et al. (2007).
Multi-Purpose Machine Gun Ranges
Three multi-purpose machine gun ranges were sampled as a portion of this research effort. Three types of machine guns are fired at these ranges: the.50 caliber (12.7 mm), 7.62 mm, and 5.56 mm. Results from Range 93Z at Fort Lewis were reported elsewhere (Jenkins et al. 2007). The results for Range 113 at 29 Palms and the Oates Range at Fort Richardson are re-ported here. Overall, the three ranges appear to have received very differ-ent levels of usage because the mean concentrations of NG obtained for surface soils samples were about 9 mg/kg at the 0- to 5-m distance in one case, about 90 mg/kg at another, and about 350 mg/kg at the third. The concentrations at the 5- to 10-m distance for these ranges did not drop off as quickly as found for the pistol and rifle ranges. In two of the three
ERDC TR-08-1 8-45
ranges, the NG concentrations in the 5- to 10-m zones were nearly as high as that in the 0- to 5-m zones. Beyond 10 m, though, concentrations were much lower, ranging from about 3 to 16% of that found within the 0- to 5-m zone. The increased depositional distance found at these ranges com-pared with the pistol and rifle ranges is consistent with results from depo-sitional studies by Walsh et al. (2007, Chapter 3 in this report). Walsh found that residues from the .50-caliber machine gun were dispersed at greater distance from the firing line than those from the 9-mm pistols and 5.56-mm rifles. Residue deposition was detected as far as 10 m from the firing line for the 9-mm pistol and 5.56-mm rifle, but not at 20 m. For the .50-caliber machine gun, however, residues were detected as far as 40 m from the firing line, although the percent of the total mass that was depos-ited beyond 20 m was quite small.
Soil Profile Samples
Soil profile samples were collected at some of these ranges to determine the sampling depth required to adequately characterize the source zones at these small arms ranges. Depth samples can also provide some informa-tion about penetration of chemicals downward in the profile, but for NG, the estimated soil/water partition coefficients obtained by Dontsova et al. (Chapter 5 in Jenkins et al. 2007) were only 0.08 and 0.17 cm3g–1. These estimates, however, are about an order of magnitude lower than soil/water partition coefficients estimated by Speitel et al. (2002) for sandy soils at Massachusetts Military Reservation. Lysimeter samples would be useful to directly assess the question of whether NG is leaching downward in pore water.
Profile samples were collected at depth at five ranges. These include Range 15 at Yakima Training Center (Jenkins et al. 2007) and four ranges re-ported here. In all cases, NG was the target analyte detected at highest concentrations in soil samples. Concentrations of 2,4-DNT were also gen-erally detected in these profile samples, but usually at concentrations about one to two orders of magnitude lower.

ERDC TR-08-1 8-46
Figure 8-20. Plot of NG concentration vs. depth for soil profile samples collected at small arms ranges.
Figure 8-20 is a plot of the concentration of NG in the profile samples, normalized to the surface concentration for the five locations where profile samples were collected. Except for the samples from Petawawa, the rela-tive concentrations below the 5-cm depth were always less than 10% of that at the surface, and it would be unnecessary to sample below 5 cm when sampling to assess the source zone mass or concentration. At Peta-wawa, much higher normalized NG concentrations were found to a depth of 10 cm than at the other sites. The reason for this is unclear, but will be further investigated in a subsequent field experiment.
Similarly, Figure 8-21 plots the 2,4-DNT concentrations as a function of depth, normalized to the surface concentration. As found for NG, the rela-tive concentration of 2,4-DNT below a 5-cm depth was less than 10% of the surface concentration for all profiles except that from Petawawa.

ERDC TR-08-1 8-47
Figure 8-21. Plot of 2,4-DNT concentration vs. depth for soil profile samples collected at small arms ranges.
Comparison of Data with Human Health and Ecotoxicological Criteria
The concentrations of propellant residues detected were compared to the human health and ecotoxicological criteria developed specifically for mili-tary training by the Biotechnology Research Institute (Robidoux et al. 2006). The exposure scenarios were based on soldiers spending an aver-age of 100 days in the field per year, which is typical for training officers in Canada. The government of Canada is considering the possibility of making these criteria official for DND. For now they can be used only as guidelines to assess the potential level of risk for a specific situation. These criteria are shown in Table 8-19. The Military Training Soil Quality Guide-lines have been designed specifically for the protection of human health (MTSQGHH), the protection of groundwater as a source of drinking water (MTSQGGW), the protection of environment (MTSQGE), or the protection of aquatic life in case of resurgence of groundwater (MTSQGAL).

ERDC TR-08-1 8-48
Table 8-19. Military Training Soil Quality Guidelines (MTSQG) for the Protection of Human Health and Environment.
Concentration (mg/kg)
Human Health Environment
Compound MTSQGHH MTSQGGW MTSQGE MTSQGAL
2,4-DNT 0.14 0.01 8.5 130
NG 2500 7.8 65 2.4
MTSQGHH .... Protection of Human Health MTSQGGW.... Protection of Groundwater as a Source of Drinking Water MTSQGE ....... Protection of Environment MTSQGAL ..... Protection of Aquatic Life in case of Resurgence of Groundwater
For NG, all detected concentrations were well below the human health preliminary soil quality guidelines (MTSQGHH) of 2,500 mg/kg. This find-ing is important because the soldiers are in direct contact with the soil, often even lying on it. However, some NG values at all the ranges studied exceed the MTSQGAL (2.4 mg/kg), the MTSQGGW (7.8 mg/kg), and even the MTSQGE (65 mg/kg). Concentrations of 2,4-DNT, although much lower than those of NG, sometimes exceeded some of the thresholds. In most ranges, some values exceeded MTSQGGW of 0.01 mg/kg. In rifle ranges, the MTSQGHH of 0.14 mg/kg was also exceeded, and in machine gun ranges, the MTSQGE of 14 mg/kg was exceeded. 2,4-DNT is much more toxic than NG and can have an adverse effect at much lower concen-tration.

ERDC TR-08-1 8-49
References
Brochu, S., E. Diaz, S. Thiboutot, G. Ampleman, A. Marois, A. Gagnon, A.D. Hewitt, S.R. Bigl, M.E. Walsh, M.R. Walsh, K. Bjella, C. Ramsey, and S. Taylor (2006) Assessment of 100 years of military training in Canada: The case of Canadian Force Base Petawawa. Chapter 3 in Distribution and Fate of Energetics on DoD Test and Training Ranges: Interim Report 6. US Army Engineer Research and Development Center, Vicksburg, Mississippi, ERDC Technical Report TR-06-12.
Diaz, E., S. Brochu, S. Thiboutot, G. Ampleman, A. Marois, and A. Gagnon (2006) Assessment of the contamination by energetic materials and metals in soil and biomass at Western Area Training Center (WATC) in Wainwright, Alberta (Phase 1). Chapter 4 in Distribution and Fate of Energetics on DoD Test and Training Ranges: Interim Report 6. US Army Engineer Research and Development Center, Vicksburg, Mississippi, ERDC Technical Report TR-06-12.
Hewitt, A.D., T.F. Jenkins, M.E. Walsh, M.R. Walsh, S.R. Bigl, and C.A. Ramsey (2007) Protocols for collection of surface soil samples at military training and testing ranges for the characterization of energetic munition constituents. US Army Engineer Research and Development Center, Cold Regions Research and Engineering Laboratory, Hanover, New Hampshire, ERDC/CRREL Technical Report TR-07-10.
Jenkins, T.F., J. Pennington, G. Ampleman, S. Thiboutot, M.R. Walsh, E. Diaz, K. Dontsova, A. Hewitt, M.E. Walsh, S. Bigl, S. Taylor, D. MacMillan, J. Clausen, D. Lambert, N. Perron, M. Lapointe, S. Brochu, M. Brassard, R. Stowe, R. Farinaccio, A. Gagnon, A. Marois, D. Gilbert, D. Faucher, S. Yost, C. Hayes, C. Ramsey, R. Rachow, J. Zufelt, C. Collins, A. Gelvin, and S. Saari (2007) Characterization and fate of gun and rocket propellant residues on testing and training ranges: Interim report. US Army Engineer Research and Development Center, Cold Regions Research and Engineering Laboratory, Hanover, New Hampshire, ERDC Technical Report TR-07-1.
Robidoux, P.Y., B. Lachance, L. Didillon, F.-O. Dion, and G.I. Sunahara (2006) Development of Ecological and Human Health Preliminary Soil Quality Guide-lines for Energetic Materials to Ensure Training Sustainability of Canadian Forces. National Research Council Canada, Biotechnology Research Institute, Montreal, Canada, NRC #45936.
Speitel, G.E., H. Yamamoto, R.L. Autenrieth, and T. McDonald (2002) Laboratory Fate and Transport Studies of High Explosives at the Massachusetts Military Reserva-tion: Final Report. University of Texas at Austin and Texas A&M University.
Thiboutot, S., G. Ampleman, S. Brochu, R. Martel, G. Sunahara, J. Hawari, S. Nicklin, A. Provatas, J. Pennington, T. Jenkins, and A. Hewitt (2003) Protocol for Energetic Materials—Contaminated Sites Characterization. Proceedings of the 28th TTCP Meeting, WTP4, KTA 4-28, Final report, Vol. II, Valcartier, Québec, Canada, available at www.em-guidelines.org.

ERDC TR-08-1 8-50
Walsh, M.E., C.M. Collins, A.D. Hewitt, M.R. Walsh, T.F. Jenkins, J. Stark, A. Gelvin, T.S. Douglas, N. Perron, D. Lambert, R. Bailey, and K. Myers (2004) Range characterization studies at Donnelly Training Area, Alaska: 2001 and 2002. US Army Engineer Research and Development Center, Cold Regions Research and Engineering Laboratory, Hanover, New Hampshire, ERDC/CRREL Technical Report TR-04-3.
Walsh, M.E., C.A. Ramsey, S. Taylor, A.D. Hewitt, K. Bjella, and C.M. Collins (2007) Subsampling variance for 2,4-DNT in firing point soils. Soil and Sediment Contamination: An International Journal, 16: 459–472.
Walsh, M.R. (2004) Field sampling tools for explosives residues developed at CRREL. US Army Engineer Research and Development Center, Cold Regions Research and Engineering Laboratory, Hanover, New Hampshire, ERDC/CRREL Technical Note TN-04-1.
Walsh, M.R. (2007) Explosives residues resulting from the detonation of common mili-tary munitions: 2002–2006. US Army Engineer Research and Development Center, Cold Regions Research and Engineering Laboratory, Hanover, New Hampshire, ERDC/CRREL Technical Report TR-07-2.
Walsh, M.R., S. Taylor, M.E. Walsh, S. Bigl, K. Bjella, T. Douglas, A. Gelvin, D. Lambert, N. Perron, and S. Saari (2005a) Residues from live fire detonations of 155-mm howitzer rounds. US Army Engineer Research and Development Center, Cold Regions Research and Engineering Laboratory, Hanover, New Hampshire, ERDC/CRREL Technical Report TR-05-14.
Walsh, M.R., M.E. Walsh, C.M. Collins, S.P. Saari, J.E. Zufelt, A.B. Gelvin, and J.W. Hug (2005b) Energetic residues from live-fire detonations of 120-mm mortar rounds. US Army Engineer Research and Development Center, Cold Regions Research and Engineering Laboratory, Hanover, New Hampshire, ERDC/CRREL Techni-cal Report TR-05-15.
Walsh, M.R., M.E. Walsh, C.A. Ramsey, R.J. Rachow, J.E. Zufelt, C.M. Collins, A.B. Gelvin, N.M. Perron, and S.P. Saari (2006) Energetic residues deposition from 60-mm and 81-mm mortars. US Army Engineer Research and Development Center, Cold Regions Research and Engineering Laboratory, Hanover, New Hampshire, ERDC/CRREL Technical Report TR-06-10.
Walsh, M.R., M.E. Walsh, S.R. Bigl, N.M. Perron, D.J. Lambert, and A.D. Hewitt (2007) Propellant residue deposition from small arms munitions. US Army Engineer Research and Development Center, Cold Regions Research and Engineering Laboratory, Hanover, New Hampshire, ERDC/CRREL Technical Report TR-07-17.
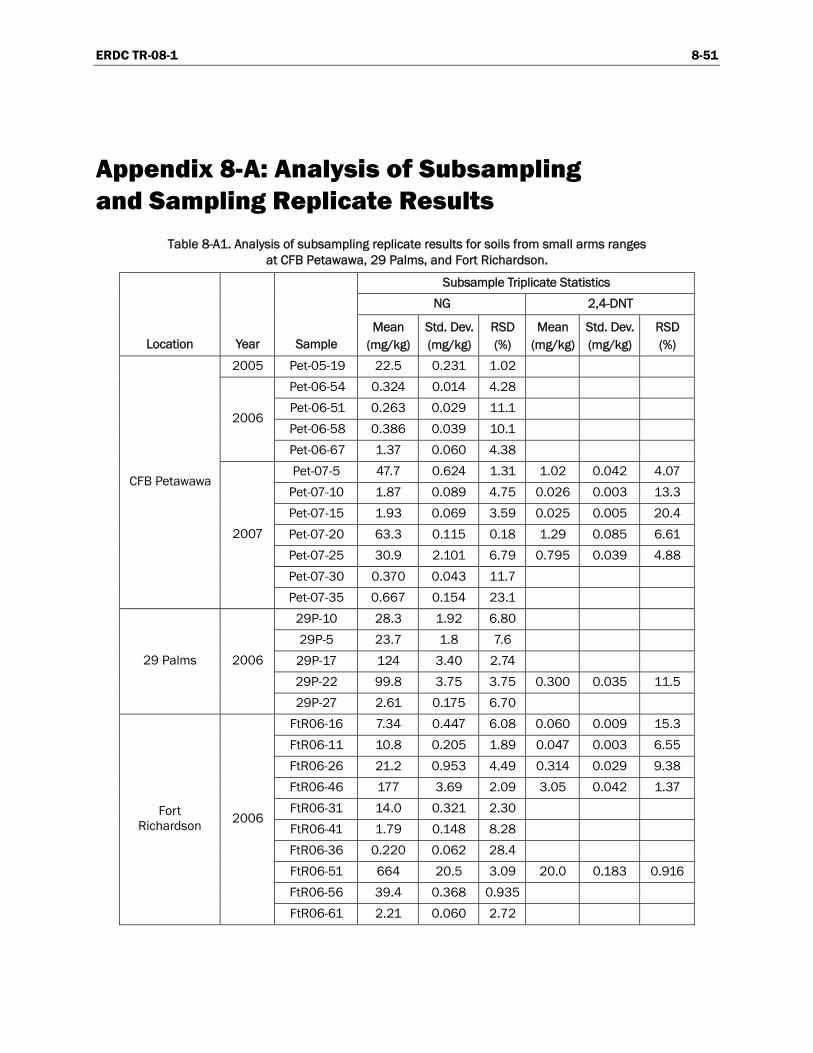
ERDC TR-08-1 8-51
Appendix 8-A: Analysis of Subsampling and Sampling Replicate Results
Table 8-A1. Analysis of subsampling replicate results for soils from small arms ranges at CFB Petawawa, 29 Palms, and Fort Richardson.
Subsample Triplicate Statistics
NG 2,4-DNT
Location Year Sample Mean
(mg/kg) Std. Dev. (mg/kg)
RSD (%)
Mean (mg/kg)
Std. Dev. (mg/kg)
RSD (%)
2005 Pet-05-19 22.5 0.231 1.02
Pet-06-54 0.324 0.014 4.28
Pet-06-51 0.263 0.029 11.1
Pet-06-58 0.386 0.039 10.1 2006
Pet-06-67 1.37 0.060 4.38
Pet-07-5 47.7 0.624 1.31 1.02 0.042 4.07
Pet-07-10 1.87 0.089 4.75 0.026 0.003 13.3
Pet-07-15 1.93 0.069 3.59 0.025 0.005 20.4
Pet-07-20 63.3 0.115 0.18 1.29 0.085 6.61
Pet-07-25 30.9 2.101 6.79 0.795 0.039 4.88
Pet-07-30 0.370 0.043 11.7
CFB Petawawa
2007
Pet-07-35 0.667 0.154 23.1
29P-10 28.3 1.92 6.80
29P-5 23.7 1.8 7.6
29P-17 124 3.40 2.74
29P-22 99.8 3.75 3.75 0.300 0.035 11.5
29 Palms 2006
29P-27 2.61 0.175 6.70
FtR06-16 7.34 0.447 6.08 0.060 0.009 15.3
FtR06-11 10.8 0.205 1.89 0.047 0.003 6.55
FtR06-26 21.2 0.953 4.49 0.314 0.029 9.38
FtR06-46 177 3.69 2.09 3.05 0.042 1.37
FtR06-31 14.0 0.321 2.30
FtR06-41 1.79 0.148 8.28
FtR06-36 0.220 0.062 28.4
FtR06-51 664 20.5 3.09 20.0 0.183 0.916
FtR06-56 39.4 0.368 0.935
Fort Richardson 2006
FtR06-61 2.21 0.060 2.72
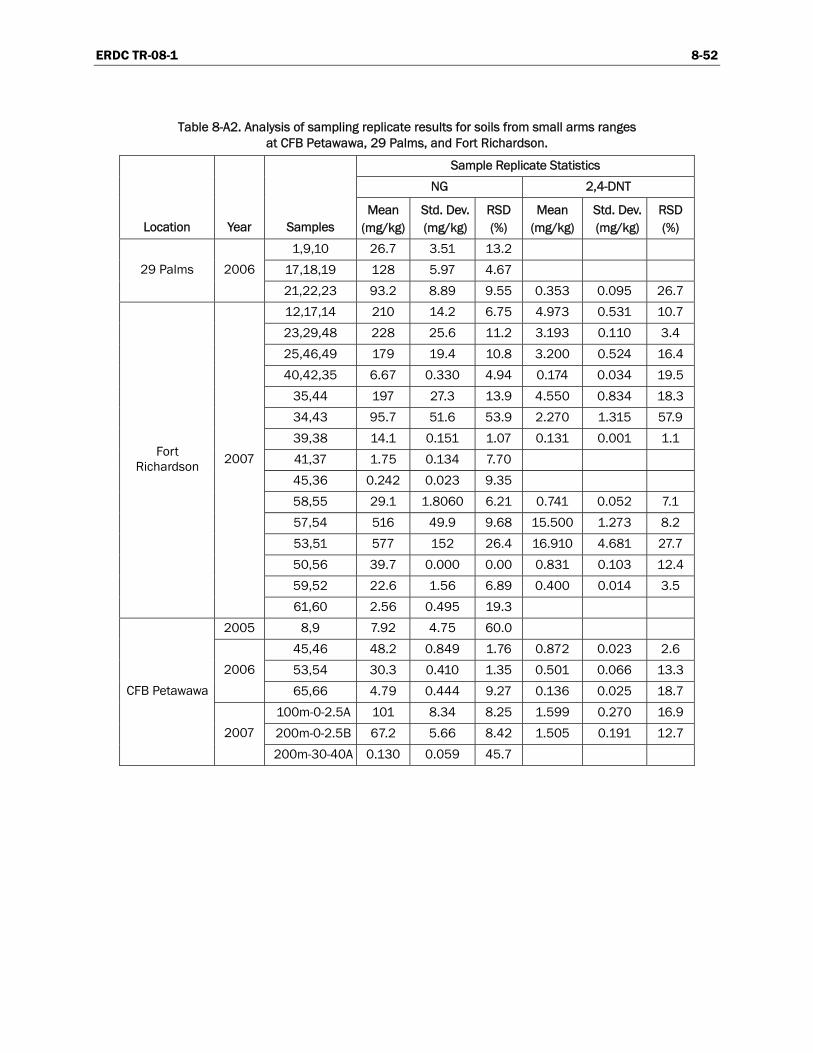
ERDC TR-08-1 8-52
Table 8-A2. Analysis of sampling replicate results for soils from small arms ranges at CFB Petawawa, 29 Palms, and Fort Richardson.
Sample Replicate Statistics
NG 2,4-DNT
Location Year Samples Mean
(mg/kg) Std. Dev. (mg/kg)
RSD (%)
Mean (mg/kg)
Std. Dev. (mg/kg)
RSD (%)
1,9,10 26.7 3.51 13.2
17,18,19 128 5.97 4.67 29 Palms 2006
21,22,23 93.2 8.89 9.55 0.353 0.095 26.7
12,17,14 210 14.2 6.75 4.973 0.531 10.7
23,29,48 228 25.6 11.2 3.193 0.110 3.4
25,46,49 179 19.4 10.8 3.200 0.524 16.4
40,42,35 6.67 0.330 4.94 0.174 0.034 19.5
35,44 197 27.3 13.9 4.550 0.834 18.3
34,43 95.7 51.6 53.9 2.270 1.315 57.9
39,38 14.1 0.151 1.07 0.131 0.001 1.1
41,37 1.75 0.134 7.70
45,36 0.242 0.023 9.35
58,55 29.1 1.8060 6.21 0.741 0.052 7.1
57,54 516 49.9 9.68 15.500 1.273 8.2
53,51 577 152 26.4 16.910 4.681 27.7
50,56 39.7 0.000 0.00 0.831 0.103 12.4
59,52 22.6 1.56 6.89 0.400 0.014 3.5
Fort Richardson 2007
61,60 2.56 0.495 19.3
2005 8,9 7.92 4.75 60.0
45,46 48.2 0.849 1.76 0.872 0.023 2.6
53,54 30.3 0.410 1.35 0.501 0.066 13.3 2006
65,66 4.79 0.444 9.27 0.136 0.025 18.7
100m-0-2.5A 101 8.34 8.25 1.599 0.270 16.9
200m-0-2.5B 67.2 5.66 8.42 1.505 0.191 12.7
CFB Petawawa
2007
200m-30-40A 0.130 0.059 45.7

ERDC TR-08-1 9-1
— Chapter 9 —
Propellant Residues in Surface Soils and Groundwater at Firing Positions at
Canadian Force Base Petawawa, Ontario
RICHARD MARTEL, GUILLAUME COMEAU, SYLVIE BROCHU, AND ALAN D. HEWITT
Abstract
Military training activities lead to the deposition of significant amounts of gun propellant residues at firing positions. These residues have the poten-tial to leach into the soil and reach groundwater. Wells were installed at Canadian Force Base Petawawa at various firing points used for artillery, mortar, machine guns, and anti-tank and small arms weapons. The con-tent of nitroglycerin, 2,4-dinitrotoluene, and perchlorates in groundwater was analyzed and compared to the concentration of gun propellant resi-dues at the surface of the soil. Results show that, although concentrations of NG as high as 3000 mg/kg are detected in anti-tank ranges, almost no energetic residues were detected in groundwater. This could be due to deg-radation of propellant residues before reaching groundwater, to strong binding to the soil, or in some cases to well screens installed too deep in the aquifer for contaminants staying at the surface of the groundwater table. It is recommended that the next sampling campaign include the analysis of NG metabolites. Perchlorates were detected in all but one loca-tion at concentrations below 3.9 μg/L, which is well below Health Can-ada’s guidance of 6 μg/L for drinking water.
ERDC TR-08-1 9-2
Introduction
Over the past three years, Defence Research and Development Canada – Valcartier (DRDC Valcartier), Québec, QC, and l’Institut National de la Recherche Scientifique (INRS-ETE, Québec, QC) have joined their exper-tise to characterize the Canadian Force Base (CFB) Petawawa. As part of this regional environmental study, some specific locations have been in-vestigated to better understand the environmental fate of propellant resi-dues at firing positions.
Many types of gun propellant have been developed to meet the various needs of all caliber ammunition. Many of them are single-base, with nitro-cellulose (NC) as the major component (85–98%). The remaining con-stituents are 2,4-dinitrotoluene (2,4-DNT), which constitutes 8 to 10% of the gun propellant formulation, and small amounts of dibutylphthalate, diphenylamine, lead carbonate, and potassium sulphate that will act as plasticizers, deterrent, and stabilizers and reduce the hygroscoposcity of the formulation, the bore erosion, and the flash.
Double-base gun propellants are also commonly used. They generally have a higher energy due to the presence of nitroglycerin (NG) in addition to NC. The proportions of NC and NG in double-base propellant vary from 40 to 80% and from 10 to 40%, respectively. Other constituents are also added, for the same purpose as for single-base propellant. Thus com-pounds such as diethlyphthalate, diphenylamine, ethylcentralite, barium and potassium nitrate, potassium perchlorate, lead stearate, potassium sulphate, carbon black, and graphite can be found in many gun propellant formulations in small and variable amounts. Double-base propellants do not usually contain 2,4-DNT.
For the purpose of this work, efforts were focused on major propellant residues, such as NG and 2,4-DNT. Although present in large quantities, NC will not be part of this study, because its insolubility in water makes it unavailable for the environment and unable to leach to groundwater. Per-chlorate, although present at a maximum of 8% in M7 gun propellant, will also be looked at, because of its large solubility in water that makes it ex-tremely labile in the environment, and because of its low threshold associ-ated with its high toxicity. No efforts have been made yet toward the other

ERDC TR-08-1 9-3
compounds constituting gun propellant formulations. Albeit in minor quantities, these constituents will have to be studied in the future to ensure that their toxicity and bioavailability do not pose a threat to the groundwater or the environment.
The objective of this report is to present the relation between training type (artillery/mortar, anti-tank, and small arms) and these propellant residues concentrations in surface soils as well as in groundwater at the firing posi-tion. Table 9-1 shows all wells that were installed at different firing points; their drilling logs can be found in Appendix 9-A.

ERDC TR-08-1 9-4
Table 9-1. Well information at firing positions at CFB Petawawa.
Well ID Installing
year Training type
Well depth from
ground surface
(m)
Depth to groundwater
(m)
Water height
above top of screen
(m) Lithology at screen level
GW-6-8 (d) 2005 Artillery 8.79 2.00 4.54 Fractured rock
GW-6-8 (s) 2005 Artillery 4.27 1.77 1.00 Fine sand and boulders
GW-6-9 (d) 2005 Artillery 9.23 1.88 5.10 Fractured rock
GW-6-9 (s) 2005 Artillery 4.27 2.01 0.76 Fractured rock
GW-7-2 2004 Mortar 4.60 0.86 2.24 Sand, fine to medium
grained
GW-8-17 2007 Anti-tank 14.45 4.89 7.31 Fractured rock-red/black
granite
GW-A-7 2007 Anti-tank 8.08 1.76 4.07 Fractured rock-red/black
granite
GW-DF-15 2007
Artillery, Mortar
(Hotel Tower) 9.93 7.99 0.44 Sand, medium to coarse
grained, with trace of gravel
GW-DF-16 2007
Artillery, Mortar
(Delta Tower) 9.10 2.67 4.93 Not analyzed yet
GW-DF-20 2007
Artillery, Mortar
(Hotel Tower) 11.67 7.96 2.21 Sand, medium to coarse grain, with trace of gravel
GW-DF-6 2004
Artillery, Mortar
(Hotel Tower) 10.20 7.95 0.75 Sand, medium to coarse grain, with trace of gravel
GW-DF-8 2004
Artillery, Mortar
(Juliet Tower) 10.16 7.36 1.30
Sand, fine to medium grain, becoming medium to coarse grain below 10 m, trace of
gravel
GW-DF-9-12 2005 Artillery
(Juliet Tower) 11.95 8.24 2.21 Sand, fine to medium grain
GW-DF-9-15 2005 Artillery
(Juliet Tower) 15 0 13.5 Sand, fine to medium grain
GW-N-2 2004 Small arms 8.5 5.655 1.345 Sand, fine to medium grain
GW-N-4-11 2005 Small arms 10.6 5.55 3.55 Sand, fine to medium grain
GW-N-4-12.8 2005 Small arms 12.3 5.66 5.14 Sand, fine to medium grain
GW-N-4-15.8 2005 Small arms 15.1 5.58 8.02 Sand, fine to medium grain

ERDC TR-08-1 9-5
Background of Study Area
Location
CFB Petawawa is located 165 km to the northwest of Ottawa on the west side of the Ottawa River, Ontario (Fig. 9-1). The range covers approxi-mately 300 km² and is just south of Algonquin Park.
Figure 9-1. Location map of CFB Petawawa, Ontario.

ERDC TR-08-1 9-6
Historical Settings and Current Land Use
Military activities in Petawawa started in 1905 with the training of A and B Batteries of the Royal Canadian Horse Artillery, the infantry, and the cav-alry. During World War I, the base was used as a training site for all Cana-dian artillery units. This training became more important during World War II, with one engineering unit and two artillery units. After World War II, CFB Petawawa became a training site for regular army and some militia units. Nowadays, the infantry, militia, and cadets train on a regular basis with small-, medium-, and large-caliber ammunition (Department of Na-tional Defence 2007).
Environmental Settings
Bedrock Geology
The bedrock of CFB Petawawa is part of the central gneiss belt of the Grenville Province of the Canadian Shield (Martel and al. 2005). This bed-rock mostly shows in the western part of the base and controls the overall topography. It consists mainly of Mesopoterozoic gneisses (0.9 to 1.6 Ga) derived from the metamorphism of felsic igneous rocks (tonalite, grano-diorite, monzonite, granite, and syenite.). The fractures are omnipresent and no specific trend in direction and dip seems to appear from the struc-tural geology field study.
Surficial Geology
A thin layer of till is covering the bedrock, especially in the northern part. The eastern side of the base is characterized by an increase of deposit thickness that can reach up to 30 m and is composed mainly of sand with glacial/fluvioglacial or aeolian origins.

ERDC TR-08-1 9-7
Field and Laboratory Strategies
Sample Collection
Groundwater Sampling
Most wells were sampled with the low-flow technique (Fig. 9-2). With this technique, the water is pumped at a very low flow rate, i.e., from 0.1 to 0.5 L/min. The advantages to pump groundwater at a low flow are as follows:
• Minimization of well disturbance in aquifer leading to a reduction of water turbidity, fine particles removing, and variability of ana-lytical results, especially metals.
• Production of more representative analytical results due to minimal drawdown that reduces the water income from above the screen.
• Reduction of purge/labor time in most cases due to lightweight equipment and dedicated tubing. Moreover, the groundwater is purged until physicochemical parameters (temperature, pH, con-ductivity, dissolved oxygen) are stabilized, thereby reducing purge time before sampling compared to other procedures.
To prevent cross contamination of wells, dedicated tubing was installed in each well. Prior to each rinsing cycle by distilled water, all equipment in these wells was washed with hydrochloric acid (HCl 10% v/v) and acetone (99% v/v) in order to remove metals and organic compounds such as en-ergetic materials. Sampling bottles and equipments were also placed on a piece of disposable canvas to prevent their contamination by surface soils. With the low-flow technique, groundwater samples do not usually require filtration. However, to eliminate micro-organisms that could degrade per-chlorate, perchlorate samples were filtered on the field with the Waterra inline disposable 0.45-μm filter. For the same reasons, approximately 2 g of sodium bisulfate was added to groundwater samples for energetic mate-rial analysis (Thiboutot et al. 2003). All bottles collected during the day were kept cold with icepacks in coolers. At the end of the day, these bottles were transferred into refrigerators and were sent to the appropriate labo-ratory within three days for perchlorate and one week for energetics.

ERDC TR-08-1 9-8
Figure 9-2. Groundwater sampling of well GW-A-7 near anti-tank firing position 4 in Alpha Range.
Soil Sampling
Sampling strategies were designed on site, depending on the landscape, visual observation of the area, and specific activity and setting of the train-ing area. The surface sampling areas were judgmentally chosen based on the military training activities and knowledge of where residue concentra-tions were likely to accumulate.
Most of the surface samples were collected using a sampling strategy where 25 or more increments of the top 2.5 cm were obtained with stainless steel scoops. Between sampling locations, the scoops were cleaned by rinsing with water followed by acetone, then wiped dry with clean paper towels. Surface samples were mostly sand and small pebbles; however, mosses and grasses were also included in a few locations. All of the samples were stored in polyethylene bags, refrigerated, and stored in the dark as soon as possible.
Profile samples were also collected in some locations. Usually the pits were dug with shovels to a specific depth, then discrete samples were scratched from the walls of the pit at systematic depth intervals with stainless-steel
ERDC TR-08-1 9-9
scoops. The collection of samples always began near the bottom the pit to avoid contamination from soil particles falling from the surface.
Chemical Parameters and Analytical Methods
Perchlorate in water was analyzed from 2004 to 2006 by the National Research Institute of Environment Canada (Burlington, Ontario, Canada) using ionic chromatography electrospray ionization mass spectrometry (IC/ESI/MS/MS) with a detection limit of 0.011 μg/L and a quantitation limit of 0.05 μg/L. In 2007, perchlorate analysis was done by Maxxam Analytical Inc (Mississauga, Ontario, Canada) by liquid chromatography electrospray ionization mass spectrometry using method #CAM SOP-00451 adapted from reference method 331.0 published by the Environ-mental Protection Agency (EPA) in 2005.
Energetic materials in soil and groundwater were analyzed either by high performance liquid chromatography (HPLC) according to SW 846 EPA Method 8330b (EPA 2006) by DRDC Valcartier. Selected samples were also sent to the Cold Region Research Engineering Laboratory (CRREL, Hanover, New Hampshire) for analysis by gas chromatography following SW 846 EPA Method 8095 (EPA 2000). Although all the suite of analytes reported in the method were analyzed, only octahydro-1,3,5,7-tetranitro-1,3,5,7-tetrazocine (HMX), hexahydro-1,3,5-trinitro-1,3,5-triazine (RDX), 2,4,6-trinitrotoluene (TNT), 2,6-dinitrotoluene (2,6-DNT), nitroglycerin (NG), and 2,4-DNT are reported here.
The energetics in groundwater samples were concentrated by filtering ap-proximately 500 mL of water through a Porapak RDX Sep-Pak cartridge (Waters Corporation, Mississauga, Ontario) and then eluting the cartridge with acetonitrile (Thiboutot et al. 2003). The samples were then filtered and injected directly on the HPLC.
Soil samples were air-dried in the dark, acetone-homogenized, dried again, and then sieved through a # 25 mesh following the method de-scribed in Thiboutot et al. (2003). An 8-g subsample was then removed for extraction. The 8-g subsamples were extracted using a sonication process with acetonitrile and analyzed by HPLC using EPA Method 8330. Some of the samples were pre-concentrated in order to obtain a lower detection limit: a 2-mL extract was evaporated to dryness in a Zymark evaporator (model TurboVap LV). This operation allows quantifying the concentra-tions of residues that are around detection limits and that could only be

ERDC TR-08-1 9-10
reported otherwise as “traces.” In-house studies of this process done on 26 multi-contaminated soil samples analyzed in duplicate indicate no loss of residues due to evaporation. However, a variation of the measured concen-trations with and without Zymark was observed, with a mean %RSD of 15% for NG and 12% for 2,4-DNT. The use of the Zymark evaporator al-lowed the quantification of gun propellant residues below the usual detec-tion limits for two samples out of 52 for NG and 37 samples out of 52 for 2,4-DNT (unpublished results).
The Zymark residue was then redissolved with 0.5 mL of acetonitrile and 0.5 mL of water. This solution was directly injected in an HPLC Agilent HP 1100, equipped with a degasser G1322A, a quaternary pump model G1311A, an autosampler G1313A, and a UV diode array detector model G1315A monitoring at 210, 220, and 254 mm (Agilent Technologies, Mis-sissauga, Ontario, Canada). The injection volume was 20 μL and the col-umn used was a Supelcosil LC-8 column 25 cm × 3 mm × 5 μm (Sigma-Aldrich Canada, Oakville, Ontario) eluted with 15:85 isopropanol/water (v/v) at a flow rate of 0.75 mL/min. The column temperature was main-tained to 25°C during the analysis.
The GC-ECD analysis of acetonitrile SPE extracts was performed by auto injection (HP 7683 series) of a 1-μL aliquot directly into a HP 6890 heated (250°C) purged packed import containing a deactivated Restek Uniliner. Primary separation was performed on a 6-m- × 0.53-mm-ID fused-silica column, with a 0.5-μm film thickness of 5% (phenyl) methylsiloxane (RTX-5, Restek). The GC oven was programmed as follows: 100°C for 2 min, 10°C/min ramp to 250°C. Hydrogen was the carrier gas and the inlet pressure was 0.85 psi. The temperature of the μECD detector was held at 280°C and the flow of the nitrogen makeup gas was 60 mL/min. For confirmation analysis the RTX-TNT2 column 6-m × 0.53-mm ID with a 1.5-μm film thickness was used. The GC oven for this column was pro-grammed as follows: 130°C for 1 min, 10°C/min ramp to 160°C, 30°C/min ramp to 270°C. The carrier gas was hydrogen at an inlet pressure of 1.6 psi. The μECD was heated to 310°C and the flow of the nitrogen makeup gas was 60 mL/min. All extracts were first analyzed by HPLC (Method 8330B) prior to analysis by GC-ECD.
Samples Quality Control
For each sampling campaign, 15% of the total water samples collected was duplicated for a quality control. Additional replications of analysis were

ERDC TR-08-1 9-11
made by laboratories as part of their own quality assurance and quality control standards. Some energetic materials samples were also duplicated for an inter-laboratory control. In addition, field blanks and trip blanks were included in the sampling strategy to make sure that contamination was not inadvertently introduced in samples by the laboratory’s distilled water or during the transport or field manipulations.

ERDC TR-08-1 9-12
Results and Discussion
All soil and groundwater analytical results discussed in this section can be found respectively in Appendix 9-B and Appendix 9-C. An alphanumerical code was assigned to all tables in appendixes. For example, Table 9-B1 refers to the first table in Appendix 9-B. More details on the type of soil, sampling strategies, and well construction, as well as detailed results are provided in Brochu et al. (2004) and Martel et al. (2005).
Anti-tank Firing Positions
Alpha Range (Area A)
Alpha Range is located in Area A and covers approximately 0.25 km2. It has the form of a long corridor 250 m × 1 km. This range is bisected by a service road, equally splitting a firing point berm and the impact range. Alpha Range has five firing bays and a misfire pit, located on the left side of the firing point (see Figure 9-3). Each firing position consists of a wooden wall cut into a gravel manmade berm. Bays 1, 2, and 3 are desig-nated for machine gun training, and Bays 4 and 5 are for anti-armor weapon training. Running parallel behind the berm was another service road bordered on the backside by a dense growth of small trees and bushes. Another road runs through the impact area, in which several tanks serve as targets.
From 1998 to 2006, 1.5 M small arms rounds were fired at this range, of which 28% were 5.56 mm, 45% were 7.62 mm, and 25% were for machine gun training. In addition, 5600 were M72 anti-tank rockets, and 1150 40-mm grenades.
In 2004, soil samples were taken up to 7.5 m behind each firing bay, in a 30-m2 area. Bays 4 and 5, used for anti-tank rockets, were the most con-taminated with NG at 1410 mg/kg and 1070 mg/kg, respectively (Table 9-B1). It was the same case in 2005’s soil sampling campaign when NG concentrations reached 778 mg/kg and 3100 mg/kg for Bays 4 and 5, respectively.
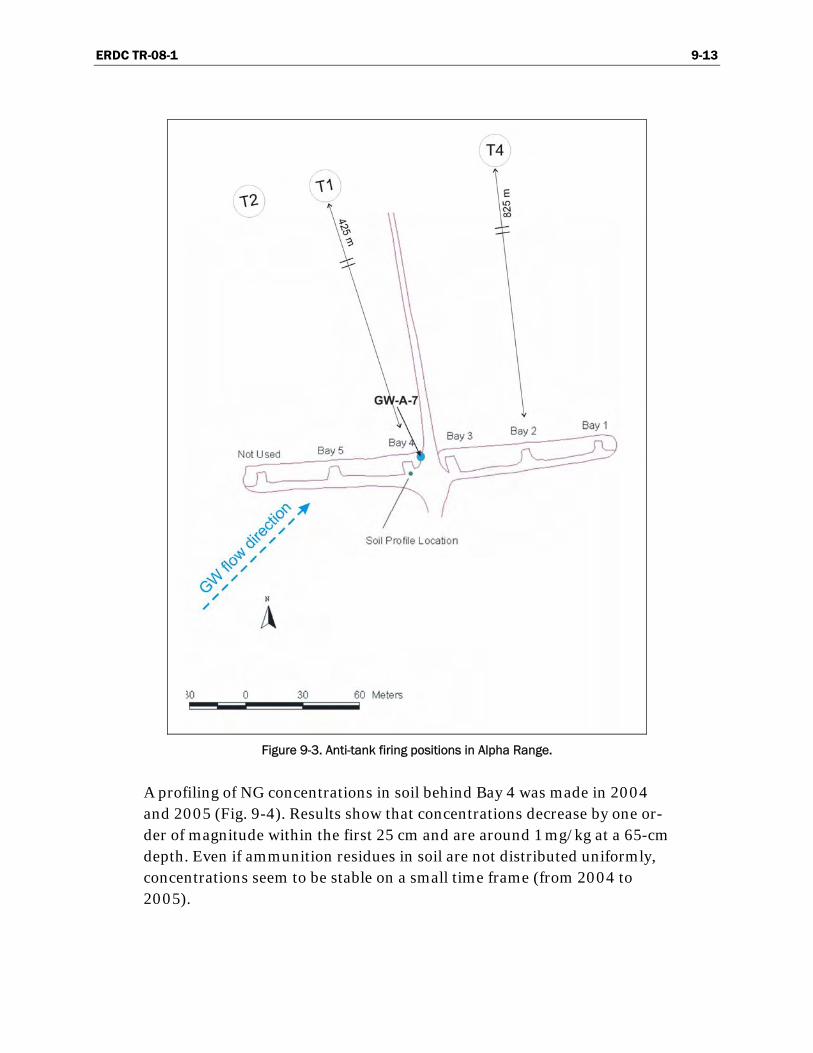
ERDC TR-08-1 9-13
Figure 9-3. Anti-tank firing positions in Alpha Range.
A profiling of NG concentrations in soil behind Bay 4 was made in 2004 and 2005 (Fig. 9-4). Results show that concentrations decrease by one or-der of magnitude within the first 25 cm and are around 1 mg/kg at a 65-cm depth. Even if ammunition residues in soil are not distributed uniformly, concentrations seem to be stable on a small time frame (from 2004 to 2005).

ERDC TR-08-1 9-14
1
10
100
1000
10000
0 5 10 15 20 25 30 35 40 45 50 55 60 65 70
Sample depth (cm)
NG
con
cent
ratio
n (p
pm)
2004
2005
Figure 9-4. Profiling of NG concentration in soil behind firing bay 4, Alpha Range.
In 2005, soil samples were also collected up to 5 m in front of each bay. NG was found at 112 and 104 mg/kg for Bays 4 and 5, respectively. 2,4-DNT is much less concentrated in soil than NG. Moreover, 2,4-DNT is more concentrated in soil in front of the bays than in the back (Appendix 9-B). For example, 2.88 mg/kg and 1.24 mg/kg of 2,4-DNT were found in front of Bays 4 and 5, but was not detected behind them.
A composite sample at Bays 4 and 5 was taken in October 2006 for per-chlorate analysis. The soil was taken in the first 1 to 2 cm over a total area of 25 m2. The sample was sieved to remove soil particles greater than 5 mm in diameter. Analytical results show 53 μg/kg of perchlorate.
Well GW-A-7, installed in the fractured rock, is located approximately 5 m downgradient of Bay 4 and has a water table depth at 1.8 m below the ground surface. The groundwater samples taken at midscreen at approxi-mately 5 m below the water table show perchlorate concentrations of 0.29 and 0.41 μg/L in spring and summer 2007, respectively (Table 9-C1). Neither NG nor 2,4-DNT were detected at that depth during the spring 2007 groundwater sampling campaign (Table 9-C2). The presence of per-chlorate can be explained by the fact that the 66-mm rockets are made with M7 propellant containing a maximum concentration of 8% of per-chlorate, with approximately 56% NC and 34% NG.
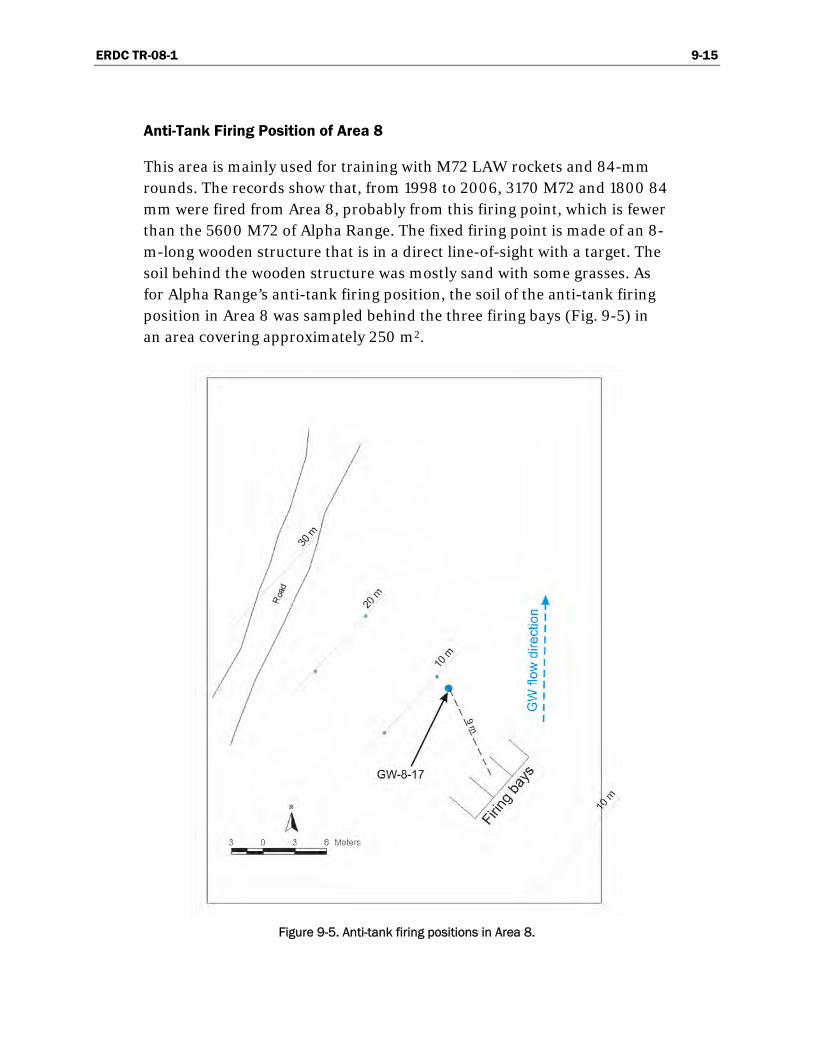
ERDC TR-08-1 9-15
Anti-Tank Firing Position of Area 8
This area is mainly used for training with M72 LAW rockets and 84-mm rounds. The records show that, from 1998 to 2006, 3170 M72 and 1800 84 mm were fired from Area 8, probably from this firing point, which is fewer than the 5600 M72 of Alpha Range. The fixed firing point is made of an 8-m-long wooden structure that is in a direct line-of-sight with a target. The soil behind the wooden structure was mostly sand with some grasses. As for Alpha Range’s anti-tank firing position, the soil of the anti-tank firing position in Area 8 was sampled behind the three firing bays (Fig. 9-5) in an area covering approximately 250 m2.
Figure 9-5. Anti-tank firing positions in Area 8.
ERDC TR-08-1 9-16
In 2004, a mean of 2245 mg/kg of NG was found from 0 to 10 m behind bays. Three samples were also taken from 10 to 20 m behind the bays and concentrations decreased approximately one order of magnitude to a mean of 380 mg/kg of NG. 2,4-DNT was analyzed and a mean concen-tration of 1.4 mg/kg was detected at that 10- to 20-m distance.
In 2005, samples were collected up to 30 m behind the firing bays and up to 10 m in front of them. NG concentrations were 1570 mg/kg in the 0- to 10-m area behind the firing point, while 228 mg/kg and 8 mg/kg were found in the 10- to 20- and 20- to 30-m area behind the bay, respectively. The presence of 2,4-DNT was detected in only one composite sample in the 10- to 20-m area behind, at 0.46 mg/kg. Moreover, surface soils col-lected in front of firing bays were composed of 17.61 mg/kg of NG and 0.11 mg/kg of 2,4-DNT.
In groundwater samples from well GW-8-17, neither NG nor 2,4-DNT was detected during spring and summer 2007 field campaigns (Table 9-C2). This well is located in the fractured bedrock where the water table depth is at 5 m and the sample was taken at an average depth of 8 m below the water table. However, as for the Alpha Range anti-tank firing positions, perchlorate was found in these two campaigns at 0.46 and 0.24 μg/L, re-spectively. As for Alpha Range, the presence of perchlorate in groundwater is probably related to the composition of M72 propellant, containing a maximum of 8% perchlorate.
Artillery/Mortar Firing Positions
The six following subsections include results at different artillery firing positions: Juliet Tower, Hotel Tower, Delta Tower, Area 6, Area 7, and Excalibur Pad (Area 8).
At the three firing positions within Area 2, Juliet, Hotel, and Delta Towers, approximately 5.8 M rounds were fired from 1998 to 2006. Of these, more than 95% were small arm bullets (5.56 mm, 7.62 mm, and 9 mm). The re-maining rounds were mostly 25-mm cartridges (68%) and a wide variety (nearly 60 different types) of munitions of medium (60 mm, 81 mm) and large caliber (105 mm, 155 mm) as well as grenades, anti-tank rockets, and missiles. The main firing points in Area 2 are Juliet, Hotel, and Delta Tow-ers, from which probably were fired most of the above-mentioned muni-tions.

ERDC TR-08-1 9-17
Juliet Tower
At Juliet tower, there are three firing pads: the main (FP1), the secondary (FP2), and the old pad (FP3) (Fig. 9-6). In 2004, composite samples were collected at the main pad at specific distances up to 30 m and 15 m, re-spectively, in front of and behind it. At this time, NG was found at the firing point and behind it, while 2,4-DNT was present only in front of the same firing point. Specifically, NG was present at 2.3 mg/kg from 0 to 10 m behind the firing point. 2,4-DNT and 2,6-DNT were detected in front of and behind the firing pad at concentrations less than 1 mg/kg.
Soils at Bunkers 1 and 2 were sampled inside, outside at 0 to 3 m, and up to approximately 10 m behind the bunkers. Bunker 1 shows higher concen-trations than Bunker 2 with the following energetic materials: 8 mg/kg of NG, 3 mg/kg of 2,4-DNT, and traces of 2,6-DNT. NG and 2,4-DNT con-centrations behind Bunker 2 reached a maximum of 5 and 2 mg/kg, re-spectively. In 2005, the outside (0 to 2m) of Bunker 1 was resampled and contained 9 mg/kg of NG. However, no DNT was detected.
In 2005, four composite samples were taken directly on the main firing pad, divided into four equal areas. The front of the firing pad was divided into two equal areas, and 12 composite samples were collected at specific distances from the firing pad. One composite sample was taken behind the length of the firing pad. As demonstrated (Table 9-B5), the maximum NG concentrations in soil samples at the firing position and up to 40 m in front of it were 371 and 252 mg/kg, respectively. 2,4-DNT was present in front of and behind the firing pad at concentrations less than 1 mg/kg.
Three wells were installed near the Juliet Tower firing pads: GW-DF-8, which is upgradient of the main firing pad, and GW-DF-9-12m and GW-DF-9-15m, which are downgradient (Fig. 9-6). Twelve m and 15 m are the multilevel well depth of GW-DF-9, which was respectively sampled at 3 and 6 m below the water table. These wells are approximately 120 m downgradient from the main firing position. All wells are surrounded by medium to coarse sand at screen depth. The well depth of GW-DF-8 is 10 m and water samples were taken approximately 2 m below the water table.

ERDC TR-08-1 9-18
Figure 9-6. Artillery firing positions at Juliet Tower, Area 2.
Except for the spring 2007 campaign, perchlorate was found at GW-DF-8 since its installation in 2004 at a maximum level of 0.5 ug/L (Table 9-C1). For GW-DF-9-12m, perchlorate analysis shows increasing concentrations from 0.6 ug/L (2005) to 4 ug/L (2007). The only groundwater sample taken in well GW-DF-9-15m contained perchlorate at 0.4 ug/L, which is slightly lower than the one taken in GW-DF-9-12m. Neither NG nor 2,4-DNT were detected between 2004 and 2007 for these wells (Table 9-C2). In addition, groundwater sampled in GW-DF-8 shows decreasing amounts of HMX (from 6 ug/L to not detected) and RDX (from 4 ug/L to not de-tected), which seems to be related to the artillery impact area located up-gradient.
ERDC TR-08-1 9-19
Hotel Tower
The soil in front of the firing pad of Hotel Tower was sampled in 2004 in a 250-m2 area at distances up to 30 m. Maximum concentrations in NG were observed at the 10- to 15-m interval with a concentration of 200 mg/kg (Table 9-B6). Also, smaller concentrations in the order of 40 mg/ kg were detected within 10 m from the pad and at a distance of 30 m. An average concentration of 18 mg/kg of 2,4-DNT was also recorded in this area, but 2,6-DNT was detected at much lower concentrations (0.4 mg/ kg). In 2005, the same exercise of soil sampling was done, but within 40 m in front of the pad and within 5 m behind the pad. The NG and 2,4-DNT concentrations detected were in the same range of values as those of 2004 for the short and the long distances, but were the third for the 10- to 20-m interval. Data show that the soil behind the pad also may be contaminated with NG and 2,4-DNT.
GW-DF-6 well is located within the soil contamination plume in front of the firing position (Fig. 9-7). The water table is at 8-m depth and the mid-dle of the well screen is installed in the sand aquifer 1.5 m below the water table. No NG, 2,4-DNT, or 2,6-DNT were detected in four groundwater samples taken between the fall of 2004 and spring 2007. Also, perchlorate was detected at very low levels close to quantification limit (0.2 ug/L) in fall 2004 and 2005 and summer 2006, but not detected at all in spring and summer 2007. However, HMX (4–15 ug/L) and RDX (1–2 ug/L) were detected; these are not related to propellant residues, but probably to an old anti-tank impact area located 1500 m upgradient.
GW-DF-15 and GW-DF-20 were installed to delineate the perchlorate plume in groundwater. Both wells were located on each side of well GW-DF-6. During the 2007 spring campaign Neither perchlorate neither ener-getic materials were detected in these wells or in well GW-DF-6.
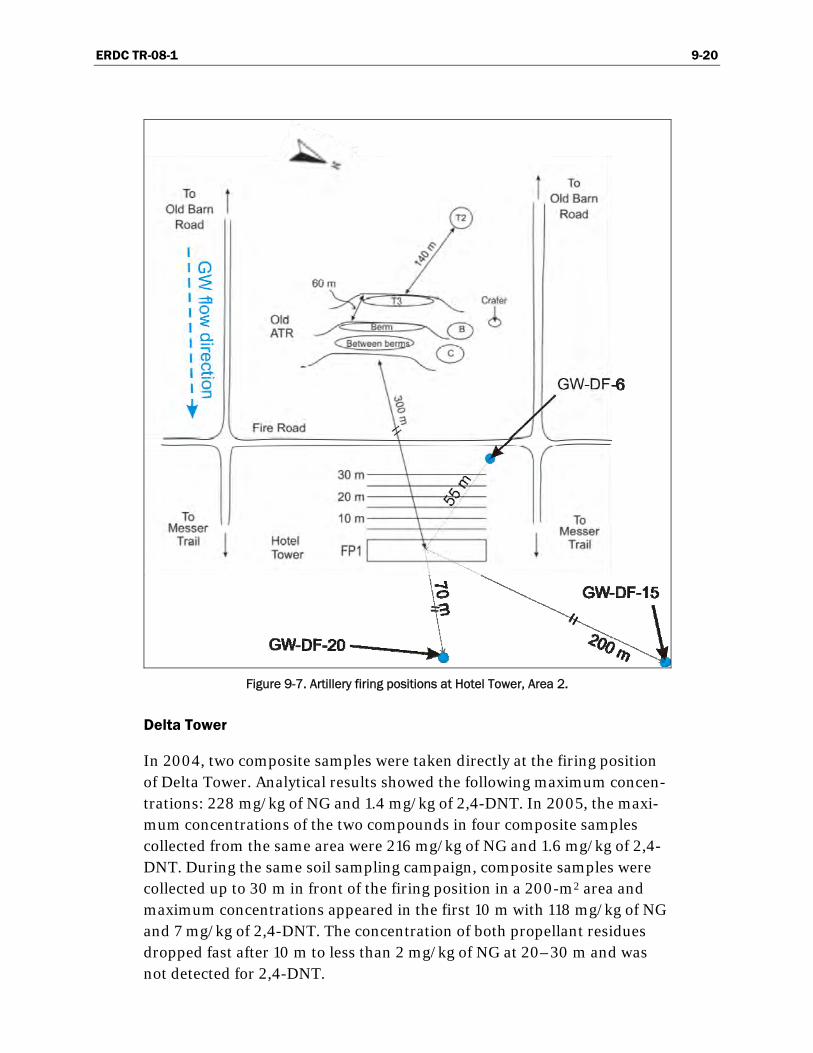
ERDC TR-08-1 9-20
Figure 9-7. Artillery firing positions at Hotel Tower, Area 2.
Delta Tower
In 2004, two composite samples were taken directly at the firing position of Delta Tower. Analytical results showed the following maximum concen-trations: 228 mg/kg of NG and 1.4 mg/kg of 2,4-DNT. In 2005, the maxi-mum concentrations of the two compounds in four composite samples collected from the same area were 216 mg/kg of NG and 1.6 mg/kg of 2,4-DNT. During the same soil sampling campaign, composite samples were collected up to 30 m in front of the firing position in a 200-m2 area and maximum concentrations appeared in the first 10 m with 118 mg/kg of NG and 7 mg/kg of 2,4-DNT. The concentration of both propellant residues dropped fast after 10 m to less than 2 mg/kg of NG at 20–30 m and was not detected for 2,4-DNT.

ERDC TR-08-1 9-21
The nearest well installed around Delta tower is GW-DF-16, which is ap-proximately 500 m upgradient of the firing pad. No propellant residues were detected at this well during the two campaigns since its installation in May 2007. A well should be installed directly at Delta Tower to verify the environmental impacts of that firing position on the groundwater quality.
Area 6
This 20-km2 range is mainly used as a battlerun for artillery, light armored vehicles, and, in the past, tanks. Typically, moving units fire from the road with either rifles or machine guns, on targets randomly distributed in the area. As for Area 2, more than 97% of the 2 M rounds fired from this range were small arms bullets (5.56 mm, 7.62 mm, and 9 mm). The remaining rounds comprised mainly 25-mm cartridges (70%) and a large collection of medium- and large-caliber ammunition, including 81 mm, 105 mm, 155 mm, grenades, and anti-tank rockets.
Since units can fire from anywhere, no fixed firing positions occur in the range. However, some firing points are more frequently used than others. Two of these common firing positions, 6M and 6L, were characterized in 2005. These firing positions are mainly used for artillery training and are separated from each other by 2.5 km. Both were sampled in 2005 directly at the firing point and the front of 6M was investigated from 0 to 35 m. Soil samples at firing position 6L did not result in any detected propellant residues. Firing position 6M samples results showed small amounts of NG (0.5 mg/kg) only between 5 to 10 m in front of the firing point while 2,4-DNT was detected from 10 to 30 m at very low levels, i.e., under 0.05 mg/kg. Other energetic materials (HMX and RDX) were detected at very low levels at the firing position and at 30 m but are not related to propel-lants.
Two multi-level wells were installed downgradient of each firing position. Wells GW-6-8 and GW-6-9 are respectively related to firing point 6L and 6M. The assignations (s) and (d) were attributed to the shallow and the deep well at each site. Both shallow wells’ bottoms are located at 4.3-m depth and both deep wells are around 9-m depth. Only GW-6-8 (s) is in-stalled in the till deposit, which has low water permeability compared to sand deposits in Area 2 (Juliet, Hotel, and Delta Towers). The three other wells are in the fractured bedrock underlying the till between 2-m and 5-m depth.

ERDC TR-08-1 9-22
From 2006 and 2007 groundwater analytical results, no energetic materi-als were detected in the four wells because of the very low concentrations found in the surface soil combined with the low permeability of the till. On the other hand, the high solubility of perchlorate in water permits its per-colation across the till deposit to reach the groundwater and to be detected in both monitoring multi-level wells. Perchlorate is a little more concen-trated under the firing position 6M, i.e., into GW-6-9 (s) and GW-6-9 (d). Over three years (fall 2005, summer 2006, and fall 2007) of groundwater sampling, perchlorate concentrations increase at least a factor of 4 (Table 9-C1). However, this observation could also be related only to sampling seasons, assuming that larger amounts of water, which sweep perchlorate, reach the groundwater table during spring due to snow melting. Be that as it may, perchlorate levels in wells GW-6-8 (s&d) and GW-6-9 (s&d) were respectively around 0.2 and 0.6 μg/L in spring 2007.
Area 7
Area 7, located on the western part of the base, serves mainly as an impact area for long-range firing exercises and as ricochet zones for UXO produc-ing ammunition. The site covers more than 30 km2 and is characterized by the presence of many hills, lakes, and marshes. More than 90% of the rounds fired from 1998 to 2007 were small arms (5.56 mm, 7.62 mm, 9 mm); the rest were either 155 mm (37%), 81 mm (22%), 105 mm (9%), or 40-mm grenades (9%). As with Area 6, there are no fixed firing positions in Area 7, but some locations are more commonly used than others for training. One such firing position, located in a sand pit at the southwestern part of Area 7 near the intersection of Paquette Road and Survey Lake Road, was investigated for groundwater quality, with one well (GW-7-2) installed in 2004 at a 4.6-m depth. Water level in this well is 0.9, which means that 2.24 m of water is above the top of screen. This well was sam-pled each year since 2004 and showed only 0.05 μg/L of perchlorate in 2006. No soil samples were taken at this location.
Excalibur Pad (Area 8)
Excalibur Pad is located on a rock outcrop in the southeastern part of Area 8. Soil samples at this artillery firing position were collected only in 2005 up to 15 m behind the firing point and up to 5 m in front of it. Results showed that maximal NG and 2,4-DNT concentrations (4 mg/kg and 23 mg/kg, respectively) occurred in front of the firing point (Table 9-B9). The concentrations were much lower behind the pad, with NG and 2,4-DNT

ERDC TR-08-1 9-23
levels at 2.5 and 6.8 mg/kg, respectively. A small quantity of 2,6-DNT (less than 0.5 mg/kg) was found at the firing point. No well has been installed yet at Excalibur Pad.
Small Arms Firing Positions
Y Range is a 12-lane 600-yard rifle range typical of Canadian small arms ranges, which typically include five to six firing lines with a berm at each 100-m distance from the target area, one stop butt with wooden targets to prevent bullets from going farther, and one berm supporting moving mechanical targets between the stop butt and the firing points. Soldiers usually fire at fixed positions on the berms. The only exception to this is at the 100-m berm, where firing can be closer to the targets. Any of a variety of small-caliber rifles, machine guns, or pistols (up to .50 cal) can be fired on these ranges. Y Range is definitely the more intensively used rifle range of CFB-Petawawa, with nearly 5.2 M rounds fired in 10 years. The most common munitions fired at the rifle ranges are 5.56 mm, 7.62 mm, and 9 mm, accounting for more than 95% of the rounds fired. Of these, more than 85% are 5.56 mm, and less than 2% are from machine guns.
Y Range was sampled twice, in 2005 and 2006. In 2005 the concentration of propellant residues on the 100-, 200-, and 300-yard firing berm was assessed. A more thorough investigation was conducted in 2006 to evalu-ate the extent of contamination both up to 40 m in front of the 200- and 300-yard firing berms. Details are reported in Jenkins et al. (Chapter 8, this report).
Results show that a mean concentration of NG of 12 mg/kg was detected at the first firing berm; the concentration at the 200- and 300-yard berm was lower, around 3 mg/kg. A maximum concentration of 71 mg/kg was reached at the 200-yard berm. NG was also detected up to 40 m in front of the firing point; concentrations decreased sharply, however, after the first 15 m. Mean concentrations of 2,4-DNT, around 0.1 to 0.2 mg/kg, were much lower. Up to 1 mg/kg was found at the 300-yard berm.
In groundwater samples from well GW-N-2, located at the 100-yard firing berm, neither NG nor 2,4-DNT were detected during the four sampling campaigns from 2004 to 2007. However, perchlorate was detected at a maximum concentration of 0.12 ug/L during fall 2005 and close to the quantification limit (0.04 ug/L) in summer 2006. The groundwater sam-
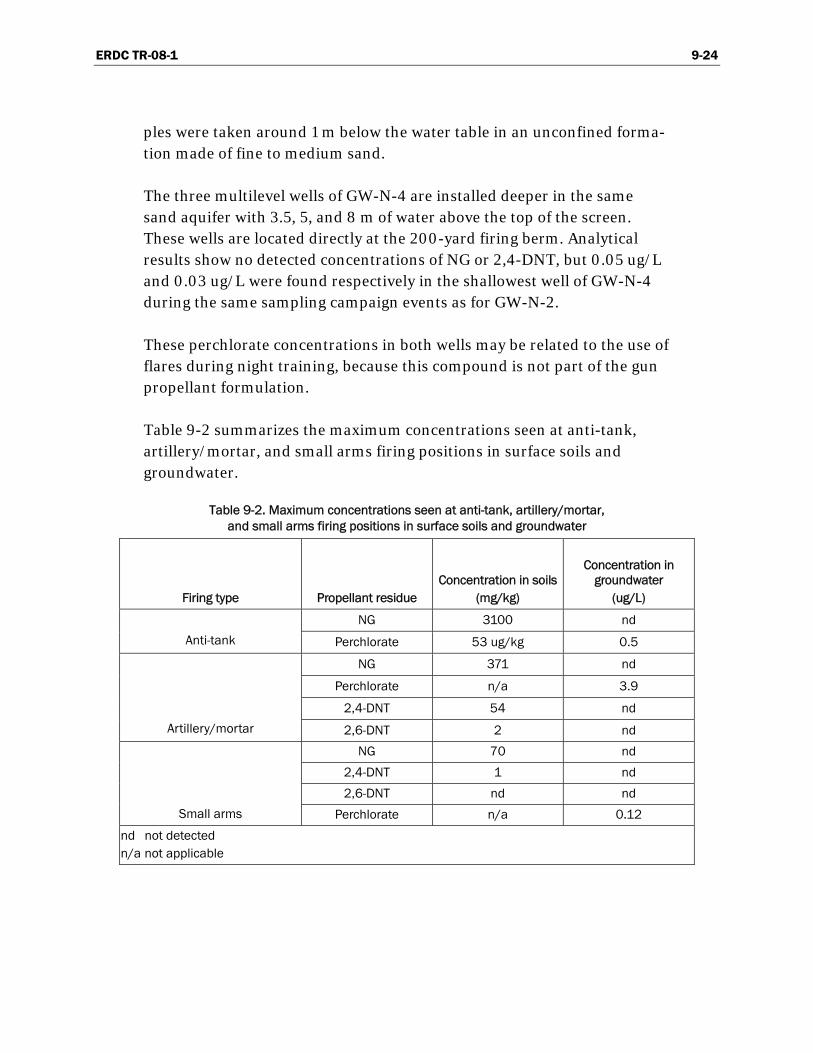
ERDC TR-08-1 9-24
ples were taken around 1 m below the water table in an unconfined forma-tion made of fine to medium sand.
The three multilevel wells of GW-N-4 are installed deeper in the same sand aquifer with 3.5, 5, and 8 m of water above the top of the screen. These wells are located directly at the 200-yard firing berm. Analytical results show no detected concentrations of NG or 2,4-DNT, but 0.05 ug/L and 0.03 ug/L were found respectively in the shallowest well of GW-N-4 during the same sampling campaign events as for GW-N-2.
These perchlorate concentrations in both wells may be related to the use of flares during night training, because this compound is not part of the gun propellant formulation.
Table 9-2 summarizes the maximum concentrations seen at anti-tank, artillery/mortar, and small arms firing positions in surface soils and groundwater.
Table 9-2. Maximum concentrations seen at anti-tank, artillery/mortar, and small arms firing positions in surface soils and groundwater
Firing type Propellant residue Concentration in soils
(mg/kg)
Concentration in groundwater
(ug/L)
NG 3100 nd
Anti-tank Perchlorate 53 ug/kg 0.5
NG 371 nd
Perchlorate n/a 3.9
2,4-DNT 54 nd
Artillery/mortar 2,6-DNT 2 nd
NG 70 nd
2,4-DNT 1 nd
2,6-DNT nd nd
Small arms Perchlorate n/a 0.12
nd not detected n/a not applicable

ERDC TR-08-1 9-25
Conclusion
Small arms, artillery, and anti-tank firing exercises have been part of daily training at CFB Petawawa for a century. According to soil and ground-water sampling, we can assume that these activities have a perceptible impact on soil and groundwater quality. Overall, anti-tank firing exercises lead to higher NG concentrations in soil, with 3100 mg/kg and 2245 mg/kg of NG as maximum concentrations at Alpha range and Area 8 firing bays, respectively. When NG was present at these levels, analytical results derived from a soil profile showed that this energetic compound concen-tration decreases to less than 1 mg/kg within the first 65 cm. As observed for all other anti-tank ranges, the concentration of NG was higher behind the firing position than in front of it, as opposed to artillery firing posi-tions. NG levels seen in surface soils at artillery firing sites were all less than 400 mg/kg. Almost no propellant residues were found at both artil-lery firing positions in Area 6, probably due to the runoff potential of the bedrock compared to the one found in Area 2 where sand is predominant. The concentrations of NG in the small arms range were below 70 mg/kg.
The concentrations of 2,4-DNT and 2,6-DNT are higher at artillery than at anti-tank and small arms firing positions. This was expected because anti-tank rockets, made of double-base propellant, do not contain DNT. Even if most DNT concentrations at artillery firing point are less than 1 mg/kg, maximum value has been 53.5 mg/kg at Hotel Tower, where 2,4-DNT lev-els were particularly higher. 2,6-DNT was found at a maximum concentra-tion of 2 mg/kg at Hotel Tower, but was normally less than 0.5 mg/kg. The low concentrations of 2,6-DNT were expected since this product is a by-product of the production of 2,4-DNT.
With the exception of perchlorates, no energetic materials related to pro-pellant residues were found in groundwater for all types of soils and firing positions. The contaminants either degrade before reaching groundwater or bind to the soil content, as does TNT. This last hypothesis is very plau-sible for 2,4-DNT, due to its similarity of structure with TNT. For NG, me-tabolites have been identified, but a method of analysis was not available until recently. Future groundwater analysis at firing points should incor-porate the analysis of NG metabolites. Another possibility for the absence of detection of contaminants in groundwater is that, if they remain on the

ERDC TR-08-1 9-26
surface of groundwater, they are not caught by some of the wells that are far below the water table, such as GW-8-17 with 8 m. Perchlorate easily reaches the groundwater because of its very high solubility. The higher concentration was found in summer 2007 at Juliet Tower with 4 ug/L.
Besides their massive use in rocket motors and some gun propellants, per-chlorates can be related to various dry training activities, such as illumi-nating flares, photoflash, delay mixtures, simulators, colored flames, etc. Although this type of activity uses very small amounts of perchlorates as compared to rockets, the occurrence is more widespread on the military training area. There is thus more risk of producing small point source con-tamination all over the place, as was observed in CFB Petawawa. However, no evidence of susceptibility of different soil type or training type was found that could facilitate the problematic perchlorate into groundwater. More groundwater sampling field campaigns will help to confirm the per-chlorate detection. Shallow wells are needed downgradient of the studied firing pads and positions to see if propellant residues other than perchlo-rates can be detected in groundwater.

ERDC TR-08-1 9-27
References
Brochu, S., E. Diaz, S. Thiboutot, G. Ampleman, A. Marois, A. Gagnon, A.D. Hewitt, S.R. Bigl, M.E. Walsh, M.R. Walsh, K. Bjella, C. Ramsey, and S. Taylor (2006) Assessment of 100 years of military training in Canada: The case of Canadian Force Base Petawawa, Chapter 3. In Distribution and Fate of Energetics on DoD Test and Training Ranges: Interim Report 6. US Army Engineer Research and Development Center, Vicksburg, Mississippi, Technical Report ERDC TR-06-12.
Department of National Defence, Government of Canada (2007) Canadian Force Base Petawawa: The Training Ground of the Warriors (http://www.army.dnd.ca/ CFB_PETAWAWA/index-en.html).
Google (2007) Google Maps Web (http://maps.google.ca/maps).
Health Canada (2006) Perchlorate and Human Health. Health Products and Food Branch, Health Canada.(http://www.hc-sc.gc.ca/ewh-semt/pubs/water-eau/perchlorate_e.html)
Martel, R., V. Nadeau, M. Ross, V. Cloutier, L. Trépanier, L. Ait-Ssi, J. Lewis, U. Gabriel, S. Brochu, G. Ampleman, S. Thiboutot, and E. Diaz (2005) Groundwater and surface water study for potential contamination by energetic materials, metals and related compounds at the Canadian force base Petawawa (Ontario) – Phase I Report. Research Report No R-842. Québec. 80 p. December.
Thiboutot, S., G. Ampleman, S. Brochu, R. Martel, G. Sunahara, J. Hawari, S. Nicklin, A. Provatas, J. Pennington, T. Jenkins, and A. Hewitt (2003) Protocol for Ener-getic Materials-Contaminated Sites Characterization. In Proceedings of the 28th TTCP Meeting, WTP4, KTA 4-28, Final report, Vol. II, Valcartier, Québec, Canada, February 2003 (www.em-guidelines.org).
US EPA (2000) Explosives by Gas Chromatography. US Environmental Protection Agency, SW 846 US EPA Method 8095 (http://www.epa.gov/epaoswer/ hazwaste/test/pdfs/8095.pdf).
US EPA (2005) Determination of Perchlorate in Drinking Water by Liquid Chroma-tography Electrospray Ionization Mass Spectrometry. US Environmental Protection Agency, EPA Method 331.0 (http://www.epa.gov/safewater/ methods/pdfs/met331_0.pdf).
US EPA (2006) Nitroaromatics, Nitramines, and Nitrate Esters by High Performance Liquid Chromatography (HPLC). US Environmental Protection Agency, SW 846 US EPA Method 8330b (http://www.epa.gov/epaoswer/hazwaste/test/pdfs/ 8330b.pdf).

ERDC TR-08-1 9-28
Appendix 9-A: Drilling Logs

ERDC TR-08-1 9-29
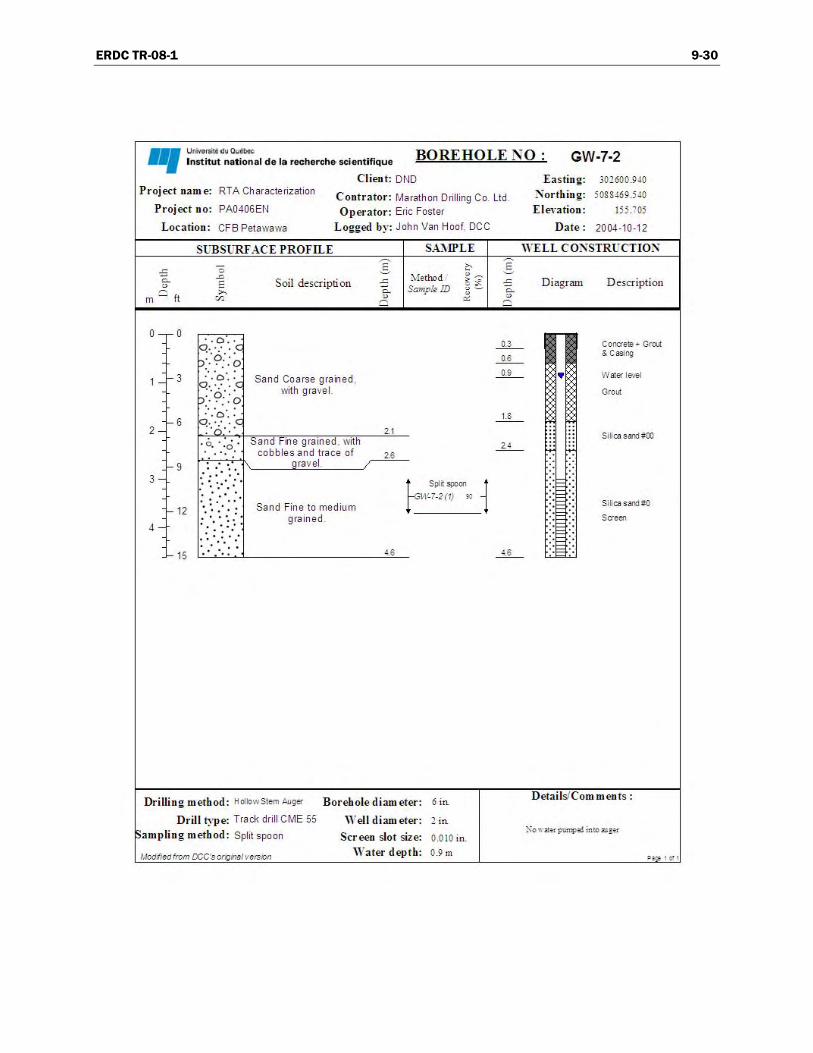
ERDC TR-08-1 9-30

ERDC TR-08-1 9-31

ERDC TR-08-1 9-32
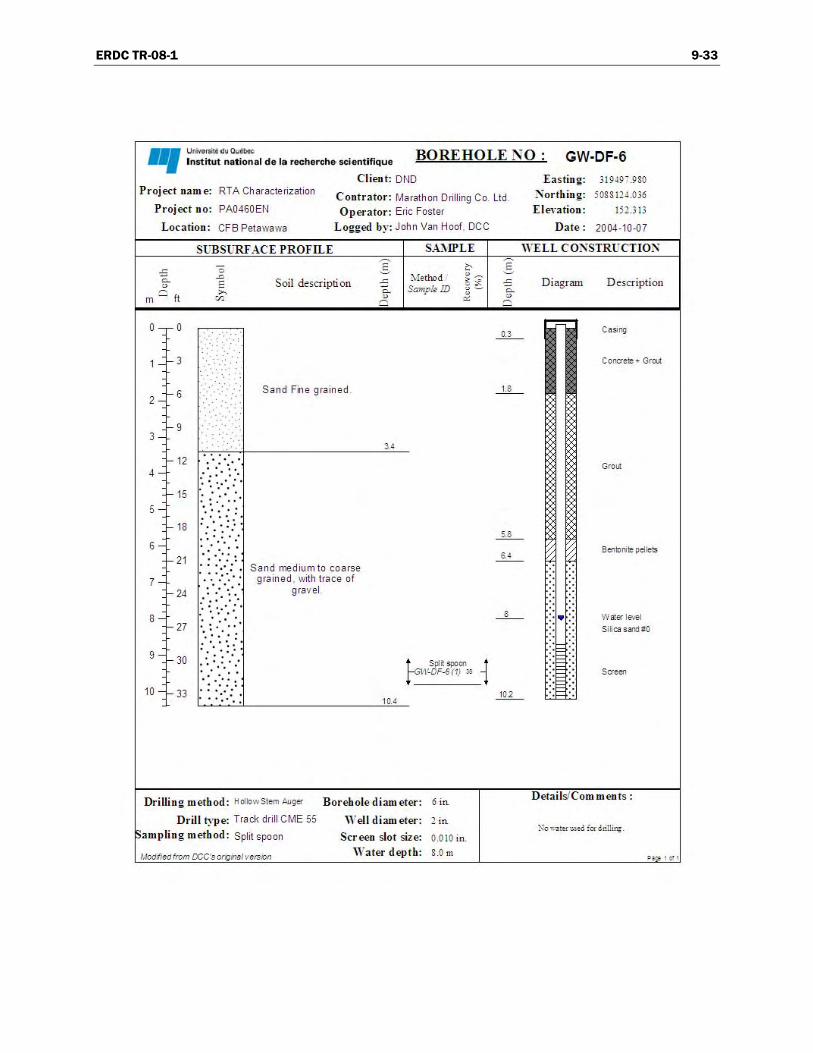
ERDC TR-08-1 9-33

ERDC TR-08-1 9-34

ERDC TR-08-1 9-35
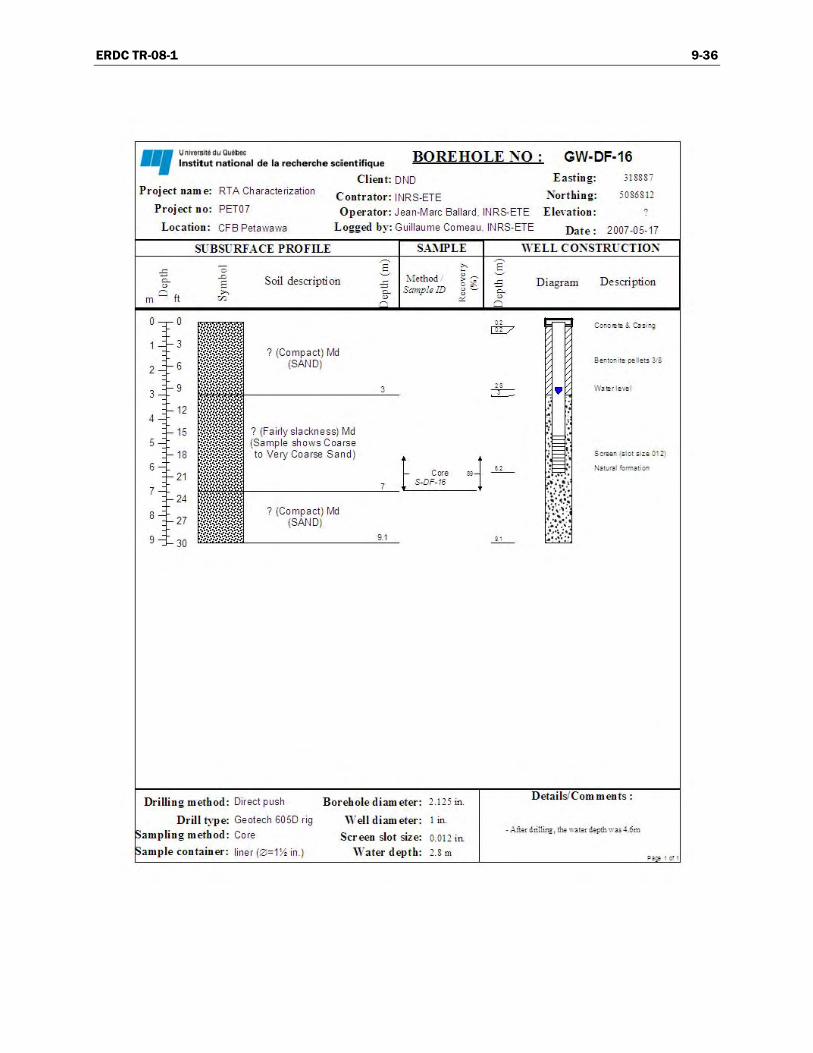
ERDC TR-08-1 9-36

ERDC TR-08-1 9-37

ERDC TR-08-1 9-38
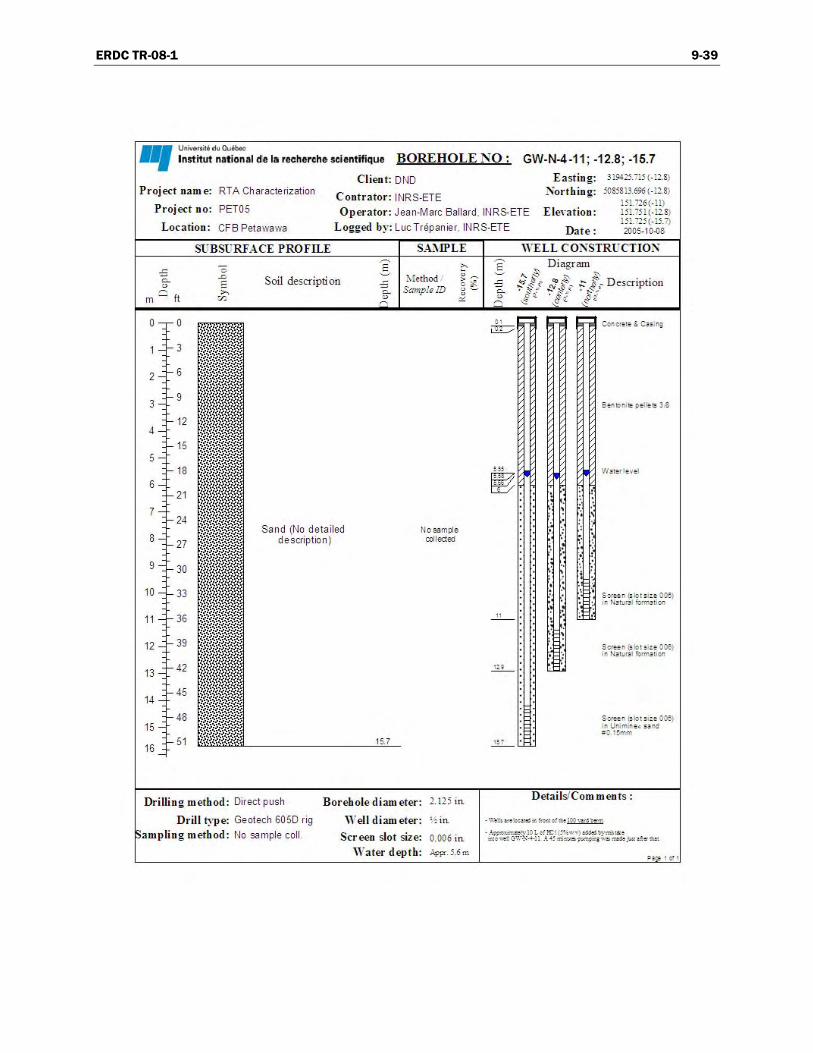
ERDC TR-08-1 9-39

ERDC TR-08-1 9-40
Appendix 9-B: Soil Sampling Results Table 9-B1. Soil sampling results for anti-tank firing positions in Alpha range (2004).
GPS Position
Sample ID Sample description Y X NG
(mg/kg) 2,4-DNT (mg/kg)
2004: One composite sample collected behind each firing bay (0–7.5 m)
Firing Point
PET-50 Bay 1 5095600 315650 105 <d
PET-51 Bay 2 5095600 315600 402 0.24
PET-52 Bay 3 5095600 315560 366 <d
PET-53 Bay 4 5095600 315540 1410 <d
PET-54 Bay 5 5095600 315500 1070 <d
Profiling, behind Bay 4
PET-58 0–5 cm 5095600 315540 1050 <d
PET-59 5–10 cm 5095600 315540 206 <d
PET-60 10–15 cm 5095600 315540 870 <d
PET-61 15–20 cm 5095600 315540 334 <d
PET-62 20–25 cm 5095600 315540 19.5 <d
PET-63 25–30 cm 5095600 315540 4.7 <d
PET-64 30–35 cm 5095600 315540 27.8 <d
PET-65 35–40 cm 5095600 315540 136 <d
PET-66 40–45 cm 5095600 315540 55.6 <d
PET-67 45–50 cm 5095600 315540 10.2 <d
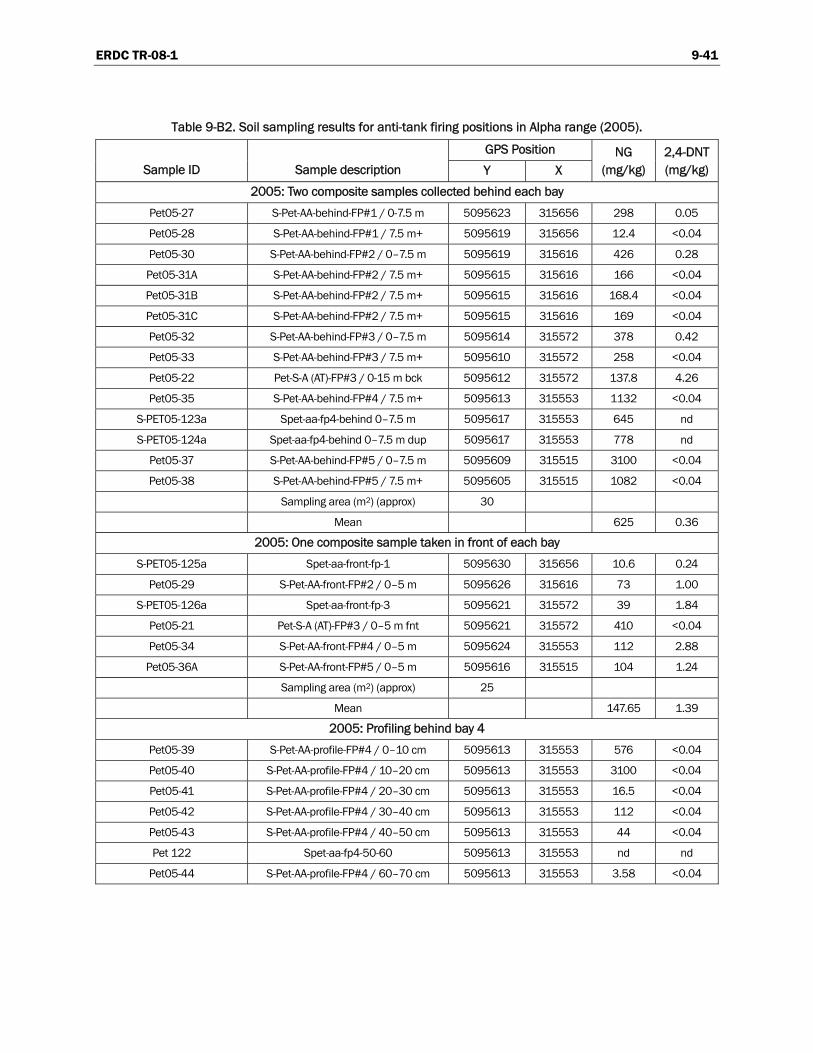
ERDC TR-08-1 9-41
Table 9-B2. Soil sampling results for anti-tank firing positions in Alpha range (2005).
GPS Position
Sample ID Sample description Y X NG
(mg/kg) 2,4-DNT (mg/kg)
2005: Two composite samples collected behind each bay
Pet05-27 S-Pet-AA-behind-FP#1 / 0-7.5 m 5095623 315656 298 0.05
Pet05-28 S-Pet-AA-behind-FP#1 / 7.5 m+ 5095619 315656 12.4 <0.04
Pet05-30 S-Pet-AA-behind-FP#2 / 0–7.5 m 5095619 315616 426 0.28
Pet05-31A S-Pet-AA-behind-FP#2 / 7.5 m+ 5095615 315616 166 <0.04
Pet05-31B S-Pet-AA-behind-FP#2 / 7.5 m+ 5095615 315616 168.4 <0.04
Pet05-31C S-Pet-AA-behind-FP#2 / 7.5 m+ 5095615 315616 169 <0.04
Pet05-32 S-Pet-AA-behind-FP#3 / 0–7.5 m 5095614 315572 378 0.42
Pet05-33 S-Pet-AA-behind-FP#3 / 7.5 m+ 5095610 315572 258 <0.04
Pet05-22 Pet-S-A (AT)-FP#3 / 0-15 m bck 5095612 315572 137.8 4.26
Pet05-35 S-Pet-AA-behind-FP#4 / 7.5 m+ 5095613 315553 1132 <0.04
S-PET05-123a Spet-aa-fp4-behind 0–7.5 m 5095617 315553 645 nd
S-PET05-124a Spet-aa-fp4-behind 0–7.5 m dup 5095617 315553 778 nd
Pet05-37 S-Pet-AA-behind-FP#5 / 0–7.5 m 5095609 315515 3100 <0.04
Pet05-38 S-Pet-AA-behind-FP#5 / 7.5 m+ 5095605 315515 1082 <0.04
Sampling area (m2) (approx) 30
Mean 625 0.36
2005: One composite sample taken in front of each bay
S-PET05-125a Spet-aa-front-fp-1 5095630 315656 10.6 0.24
Pet05-29 S-Pet-AA-front-FP#2 / 0–5 m 5095626 315616 73 1.00
S-PET05-126a Spet-aa-front-fp-3 5095621 315572 39 1.84
Pet05-21 Pet-S-A (AT)-FP#3 / 0–5 m fnt 5095621 315572 410 <0.04
Pet05-34 S-Pet-AA-front-FP#4 / 0–5 m 5095624 315553 112 2.88
Pet05-36A S-Pet-AA-front-FP#5 / 0–5 m 5095616 315515 104 1.24
Sampling area (m2) (approx) 25
Mean 147.65 1.39
2005: Profiling behind bay 4
Pet05-39 S-Pet-AA-profile-FP#4 / 0–10 cm 5095613 315553 576 <0.04
Pet05-40 S-Pet-AA-profile-FP#4 / 10–20 cm 5095613 315553 3100 <0.04
Pet05-41 S-Pet-AA-profile-FP#4 / 20–30 cm 5095613 315553 16.5 <0.04
Pet05-42 S-Pet-AA-profile-FP#4 / 30–40 cm 5095613 315553 112 <0.04
Pet05-43 S-Pet-AA-profile-FP#4 / 40–50 cm 5095613 315553 44 <0.04
Pet 122 Spet-aa-fp4-50-60 5095613 315553 nd nd
Pet05-44 S-Pet-AA-profile-FP#4 / 60–70 cm 5095613 315553 3.58 <0.04
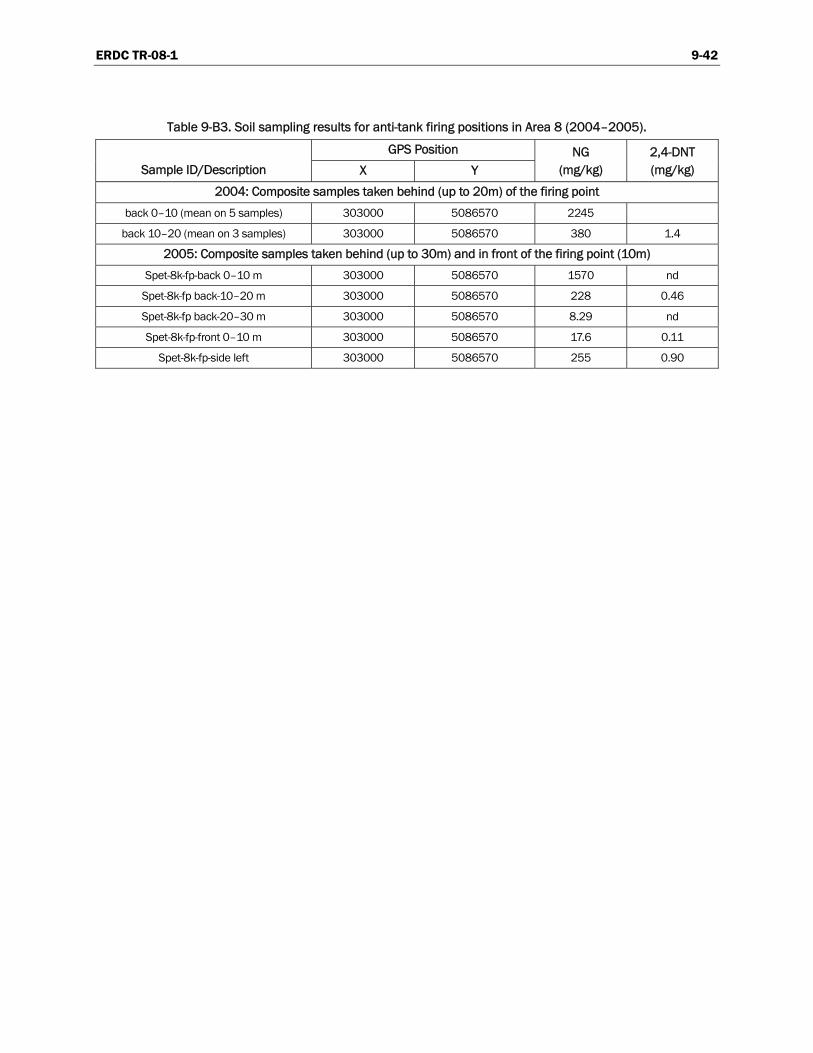
ERDC TR-08-1 9-42
Table 9-B3. Soil sampling results for anti-tank firing positions in Area 8 (2004–2005).
GPS Position
Sample ID/Description X Y NG
(mg/kg) 2,4-DNT (mg/kg)
2004: Composite samples taken behind (up to 20m) of the firing point
back 0–10 (mean on 5 samples) 303000 5086570 2245
back 10–20 (mean on 3 samples) 303000 5086570 380 1.4
2005: Composite samples taken behind (up to 30m) and in front of the firing point (10m)
Spet-8k-fp-back 0–10 m 303000 5086570 1570 nd
Spet-8k-fp back-10–20 m 303000 5086570 228 0.46
Spet-8k-fp back-20–30 m 303000 5086570 8.29 nd
Spet-8k-fp-front 0–10 m 303000 5086570 17.6 0.11
Spet-8k-fp-side left 303000 5086570 255 0.90

ERDC TR-08-1 9-43
Table 9-B4. Soil sampling results for artillery firing position at Juliet Tower in Area 2 (2004).
Sample HMX
(mg/kg) RDX
(mg/kg) TNT
(mg/kg) Tetryl
(mg/kg) NG
(mg/kg) 2,4-DNT (mg/kg)
2,6-DNT (mg/kg)
2004: Composite samples were collected at specific distances up to 30 m in front of the firing pad and behind the firing area, up to 15 m
Firing Point
PET-36** <d <d <d <d 2.90 0.70 <d
PET-37 <d <d <d <d 2.38 0.41 0.011
PET-38 <d <d <d <d 1.88 0.71 <d
S-JT-FP1-0-5m (FRONT) <d <d <d <d <d 0.56 0.43
S-JT-FP1-5-10m (FRONT) <d <d <d <d <d 0.45 0.17
S-JT-FP1-5-10 (FRONT-DUP) <d <d <d <d <d 0.79 0.37
S-JT-FP1-10-15m (FRONT) 0.20 2.21 0.06 0.02 <d 0.54 0.70
S-JT-FP1-15-20m (FRONT) <d <d <d <d <d 0.24 0.23
S-JT-FP1-20-25m (FRONT) <d <d <d <d <d 0.17 0.13
S-JT-FP1-25-30m (FRONT) <d <d <d <d <d 0.06 0.79
S-JT-FP1-0-10m (BACK) <d <d <d <d 2.30 <d <d
S-JT-FP1-10-15m (BACK)) <d <d <d <d 2.18 <d <d
2004: Composite samples were collected at secondardy firing pad located in the impact area, in front of the main firing pad.
Secondary Firing Points
S-JT-FP2-MOAC <d <d <d <d <d 1.68 0.07
S-JT-FP3 GAUCHE <d <d <d <d <d <d <d
S-JT-FP3-DROITE <d <d <d <d <d <d <d
S-JT-FP3-FRONT1 <d <d <d <d <d <d <d
S-JT-FP3-TARGET IN FRONT 0.06 <d <d <d <d <d <d
2004: Composite samples were collected at 2 bunkers.
Bunker 1
S-JT-B1 <d <d <d <d <d 2.57 0.31
PET-39 - Inside <d <d <d <d 5.47 0.53 <d
PET-40 - Inside <d <d <d <d 3.61 0.28 0.0068
PET-41 - Outside 0-3m <d <d <d <d 6.01 0.66 <d
PET-42** - Behind wide <d <d <d <d 8.36 0.36 <d
PET-43 - Behind wide <d <d <d <d 6.09 0.27 <d
Bunker 2
S-JT-B2 0.10 0.71 <d <d <d 1.58 <d
PET-44 - Inside <d <d <d <d 0.57 <d <d
PET-45 - Inside <d <d <d <d 0.58 <d <d
PET-46 - Outside 0-3m <d <d <d <d 0.74 <d <d
PET-47 - Outside 0-3m <d <d <d <d 0.76 <d <d
PET-48 A - Behind wide <d <d <d <d 4.7 <d <d
PET-49 A - Behind wide <d <d <d <d 2.9 0.08 <d
S-JT-B3 - Bunker 3 <d <d <d <d <d <d <d
S-JT-B5 - Bunker 5 <d <d <d <d <d <d <d
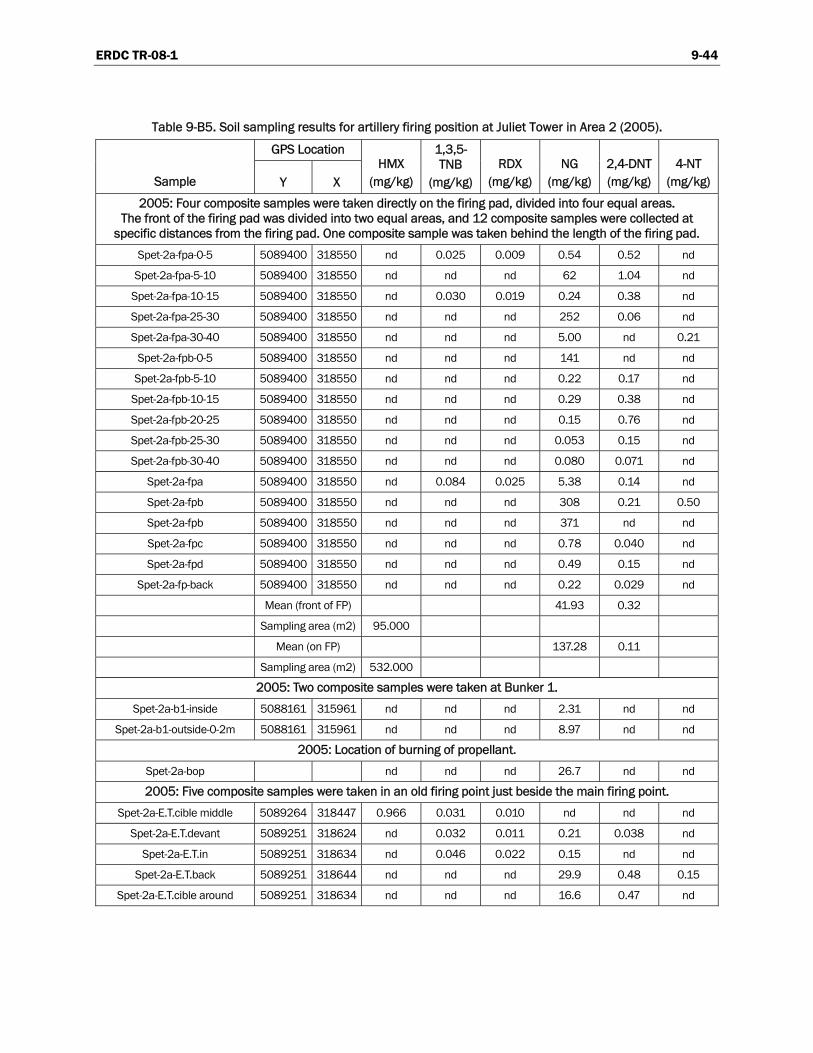
ERDC TR-08-1 9-44
Table 9-B5. Soil sampling results for artillery firing position at Juliet Tower in Area 2 (2005).
GPS Location
Sample Y X HMX
(mg/kg)
1,3,5-TNB
(mg/kg) RDX
(mg/kg) NG
(mg/kg) 2,4-DNT (mg/kg)
4-NT (mg/kg)
2005: Four composite samples were taken directly on the firing pad, divided into four equal areas. The front of the firing pad was divided into two equal areas, and 12 composite samples were collected at
specific distances from the firing pad. One composite sample was taken behind the length of the firing pad.
Spet-2a-fpa-0-5 5089400 318550 nd 0.025 0.009 0.54 0.52 nd
Spet-2a-fpa-5-10 5089400 318550 nd nd nd 62 1.04 nd
Spet-2a-fpa-10-15 5089400 318550 nd 0.030 0.019 0.24 0.38 nd
Spet-2a-fpa-25-30 5089400 318550 nd nd nd 252 0.06 nd
Spet-2a-fpa-30-40 5089400 318550 nd nd nd 5.00 nd 0.21
Spet-2a-fpb-0-5 5089400 318550 nd nd nd 141 nd nd
Spet-2a-fpb-5-10 5089400 318550 nd nd nd 0.22 0.17 nd
Spet-2a-fpb-10-15 5089400 318550 nd nd nd 0.29 0.38 nd
Spet-2a-fpb-20-25 5089400 318550 nd nd nd 0.15 0.76 nd
Spet-2a-fpb-25-30 5089400 318550 nd nd nd 0.053 0.15 nd
Spet-2a-fpb-30-40 5089400 318550 nd nd nd 0.080 0.071 nd
Spet-2a-fpa 5089400 318550 nd 0.084 0.025 5.38 0.14 nd
Spet-2a-fpb 5089400 318550 nd nd nd 308 0.21 0.50
Spet-2a-fpb 5089400 318550 nd nd nd 371 nd nd
Spet-2a-fpc 5089400 318550 nd nd nd 0.78 0.040 nd
Spet-2a-fpd 5089400 318550 nd nd nd 0.49 0.15 nd
Spet-2a-fp-back 5089400 318550 nd nd nd 0.22 0.029 nd
Mean (front of FP) 41.93 0.32
Sampling area (m2) 95.000
Mean (on FP) 137.28 0.11
Sampling area (m2) 532.000
2005: Two composite samples were taken at Bunker 1.
Spet-2a-b1-inside 5088161 315961 nd nd nd 2.31 nd nd
Spet-2a-b1-outside-0-2m 5088161 315961 nd nd nd 8.97 nd nd
2005: Location of burning of propellant.
Spet-2a-bop nd nd nd 26.7 nd nd
2005: Five composite samples were taken in an old firing point just beside the main firing point.
Spet-2a-E.T.cible middle 5089264 318447 0.966 0.031 0.010 nd nd nd
Spet-2a-E.T.devant 5089251 318624 nd 0.032 0.011 0.21 0.038 nd
Spet-2a-E.T.in 5089251 318634 nd 0.046 0.022 0.15 nd nd
Spet-2a-E.T.back 5089251 318644 nd nd nd 29.9 0.48 0.15
Spet-2a-E.T.cible around 5089251 318634 nd nd nd 16.6 0.47 nd

ERDC TR-08-1 9-45
Table 9-B6. Soil sampling results for Artillery firing position at Hotel Tower, Area 2 (2004/2005/2006).
GPS Location NG 2,4-DNT 2,6-DNT
Sample ID/Description X Y mg/kg mg/kg mg/kg
2004: Four composite samples were taken in front of the firing pad.
Firing Point
PET-19 319525 5088100 38.8 4.12 <d
PET-20 43.0 5.32 <d
PET-21 48.3 5.67 0.21
PET-22 43.7 5.24 0.19
Mean 43.5 5.1 0.2
Std Dev 3.9 0.7 0.1
2004: Composite samples taken at specific distances up to 30 m in front of the firing pad
S-HT-FP-0-5M 44.4 5.80 <d
S-HT-FP-5-10M 29.9 2.41 <d
S-HT-FP-10-15M 199 45.1 1.42
S-HT-FP-15-20M 130 53.5 2.06
S-HT-FP-20-25M 123 19.1 <d
S-HT-FP-25-30M 40.8 4.79 <d
Overall mean 88.2 18.4 0.41
Std Dev 67.2 22.3 0.92
2005: Composite samples taken at specific distances up to 40 m in front of the firing point and up to 5 m behind the firing point
S-Pet-HT-FP / 0-5m 319525 5088100 49 4.18 0.16
S-Pet-HT-FP / 5-10m 319525 5088100 69.1 7.79 0.26
S-Pet-HT-FP / 10-15m 319525 5088100 85.2 13 0.42
S-Pet-HT-FP / 15-20m 319525 5088100 80.8 8.54 0.24
S-Pet-HT-FP / 20-25m 319525 5088100 43.2 8.96 0.27
S-Pet-HT-FP / 25-30m 319525 5088100 40.2 6.42 0.19
S-Pet-HT-FP / 30-35m 319525 5088100 38.3 4.92 <0.08
S-Pet-HT-FP / 35-40m 319525 5088100 35.8 6.28 <0.08
S-Pet-HT-FP / 0-5m back 319525 5088100 55.2 2.24 <0.08
Mean 55.20 6.93 0.17
Sampling area (m2) 250
Mean contamination/m2 2.890 0.363 0.009
2006: Pit was dug just in front of the firing point and samples were collected each 10 cm up to 40 cm.
S-PET06-HT-PIT-0-10 cm 1.25 0.64
S-PET06-HT-PIT-10-20 cm n.d. n.d.
S-PET06-HT-PIT-20-30 cm n.d. n.d.
S-PET06-HT-PIT-30-40 cm n.d. n.d.
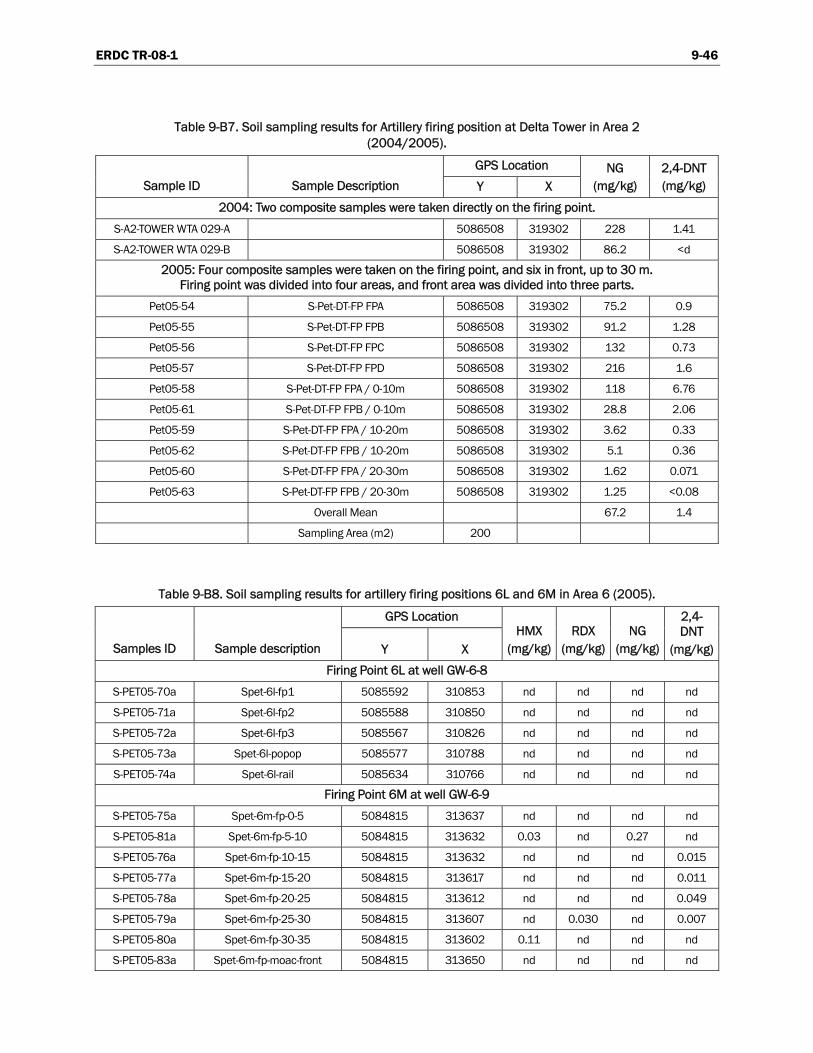
ERDC TR-08-1 9-46
Table 9-B7. Soil sampling results for Artillery firing position at Delta Tower in Area 2 (2004/2005).
GPS Location
Sample ID Sample Description Y X NG
(mg/kg) 2,4-DNT (mg/kg)
2004: Two composite samples were taken directly on the firing point.
S-A2-TOWER WTA 029-A 5086508 319302 228 1.41
S-A2-TOWER WTA 029-B 5086508 319302 86.2 <d
2005: Four composite samples were taken on the firing point, and six in front, up to 30 m. Firing point was divided into four areas, and front area was divided into three parts.
Pet05-54 S-Pet-DT-FP FPA 5086508 319302 75.2 0.9
Pet05-55 S-Pet-DT-FP FPB 5086508 319302 91.2 1.28
Pet05-56 S-Pet-DT-FP FPC 5086508 319302 132 0.73
Pet05-57 S-Pet-DT-FP FPD 5086508 319302 216 1.6
Pet05-58 S-Pet-DT-FP FPA / 0-10m 5086508 319302 118 6.76
Pet05-61 S-Pet-DT-FP FPB / 0-10m 5086508 319302 28.8 2.06
Pet05-59 S-Pet-DT-FP FPA / 10-20m 5086508 319302 3.62 0.33
Pet05-62 S-Pet-DT-FP FPB / 10-20m 5086508 319302 5.1 0.36
Pet05-60 S-Pet-DT-FP FPA / 20-30m 5086508 319302 1.62 0.071
Pet05-63 S-Pet-DT-FP FPB / 20-30m 5086508 319302 1.25 <0.08
Overall Mean 67.2 1.4
Sampling Area (m2) 200
Table 9-B8. Soil sampling results for artillery firing positions 6L and 6M in Area 6 (2005).
GPS Location
Samples ID Sample description Y X HMX
(mg/kg) RDX
(mg/kg) NG
(mg/kg)
2,4-DNT
(mg/kg)
Firing Point 6L at well GW-6-8
S-PET05-70a Spet-6l-fp1 5085592 310853 nd nd nd nd
S-PET05-71a Spet-6l-fp2 5085588 310850 nd nd nd nd
S-PET05-72a Spet-6l-fp3 5085567 310826 nd nd nd nd
S-PET05-73a Spet-6l-popop 5085577 310788 nd nd nd nd
S-PET05-74a Spet-6l-rail 5085634 310766 nd nd nd nd
Firing Point 6M at well GW-6-9
S-PET05-75a Spet-6m-fp-0-5 5084815 313637 nd nd nd nd
S-PET05-81a Spet-6m-fp-5-10 5084815 313632 0.03 nd 0.27 nd
S-PET05-76a Spet-6m-fp-10-15 5084815 313632 nd nd nd 0.015
S-PET05-77a Spet-6m-fp-15-20 5084815 313617 nd nd nd 0.011
S-PET05-78a Spet-6m-fp-20-25 5084815 313612 nd nd nd 0.049
S-PET05-79a Spet-6m-fp-25-30 5084815 313607 nd 0.030 nd 0.007
S-PET05-80a Spet-6m-fp-30-35 5084815 313602 0.11 nd nd nd
S-PET05-83a Spet-6m-fp-moac-front 5084815 313650 nd nd nd nd

ERDC TR-08-1 9-47
Table 9-B9. Soil sampling results for artillery firing positions at Excalibur pad, Area 8 (2005).
GPS Location
Samples ID Sample description X Y NG
(mg/kg) 2,4-DNT (mg/kg)
2,6-DNT (mg/kg)
S-PET05-228a Spet-excalibur-fp-A-back 0-5 307200 5084100 2.48 1.81 0.05
S-PET05-230a Spet-excalibur-fp-A-back 5-10 307200 5084100 1.11 1.61 nd
S-PET05-229a Spet-excalibur-fp-A-back 10-15 307200 5084100 0.66 0.31 nd
S-PET05-232a Spet-excalibur-fp-B-back 0-5 307200 5084100 1.26 6.77 nd
S-PET05-234a Spet-excalibur-fp-B-back 5-10 307200 5084100 0.88 1.77 nd
S-PET05-233a Spet-excalibur-fp-B-back 10-15 307200 5084100 1.78 0.62 nd
S-PET05-231a Spet-excalibur-fp-A-front 0-5 307200 5084100 3.99 1.11 nd
S-PET05-236a Spet-excalibur-fp-B-front 0-5 307200 5084100 3.36 22.7 0.44
Sampling area (m2) 100
Mean 1.82 4.26

ERDC TR-08-1 9-48
Table 9-B10. Soil sampling results for Y small arms range (2005 and 2006). Location column indicates distance from firing line.
Concentration (mg/kg)
100-m firing line 200-m firing line 300-m firing line
Lane Location Depth (cm) Increments NG 2,4-DNT NG
2,4-DNT NG 2,4-DNT
Sampled 2005
Lanes 0–5 0–2.5m 0–2 30 22.89 0.31
Lanes 6–10 0–2.5m 0–2 30 29.34 0.43
Lanes 11–15 0–2.5m 0–2 30 9.05 0.15
Lanes 16–20 0–2.5m 0–2 30 7.29 0.13
Lanes 21–25 0–2.5m 0–2 30 3.32 nd
Lanes 26–30 0–2.5m 0–2 30 2.07 nd
Mean lanes 1–30 12.33 0.17
Std. Dev. Lanes 1–30 10.19 0.16
%RSD lanes 1–30 82.7 92.0
Lanes 0–10 0–2.5m 0–2.5 30 7.38 0.23 6.40 0.28
Lanes 11–20 0–2.5m 0–2.5 30 1.09 nd 1.88 nd
Lanes 21–30 0–2.5m 0–2.5 30 0.51 nd 0.33 nd
Mean lanes 1–30 2.99 0.08 2.87 0.09
Std. Dev. Lanes 1–30 3.11 0.11 2.58 0.13
%RSD lanes 1–30 103.9 141.4 89.7 141.4
0–2.5m 0–2.5 30 37.4 0.57 22.5 0.57 Lanes 0–30
0–1m 0–1 70–80 62.4 0.63

ERDC TR-08-1 9-49
Table 9-B10 (cont’d).
Concentration (mg/kg)
100-m firing line 200-m firing line 300-m firing line
Lane Location Depth (cm) Increments NG 2,4-DNT NG
2,4-DNT NG 2,4-DNT
Sampled 2006
0–5m 0–2.5 50 50.4 0.922 46.6 1.06
5–10m 0–2.5 50 17.7 0.488 9.68 0.254
10–15m 0–2.5 50 2.36 <0.04 1.09 <0.04
15–20m 0–2.5 50 0.594 <0.04
20–25m 0–2.5 50 0.464 <0.04
25–30m 0–2.5 50 0.316 <0.04
Lanes 30–26 30–40m 0–2.5 50 0.316 <0.04
0–5m 0–2.5 50 48.8 0.888 34.1 0.788
5–10m 0–2.5 50 15.3 0.366 5.11 0.154
10–15m 0–2.5 50 1.98 0.044 1.43 <0.04
15–20m 0–2.5 50 0.442 <0.04
20–25m 0–2.5 50 0.500 <0.04
25–30m 0–2.5 50 0.232 <0.04
Lanes 25–21 30–40m 0–2.5 50 0.146 <0.04
0–5m 0–2.5 50 30.0 0.548
5–10m 0–2.5 50 13.6 0.246
10–15m 0–2.5 50 1.51 <0.04
15–20m 0–2.5 50 0.308 <0.04
20–25m 0–2.5 50 0.426 0.040
25–30m 0–2.5 50 0.280 <0.04
Lanes 20–16
30–40m 0–2.5 50 0.172 <0.04
Depth profile 1-m 0–2 1 70.8 0.702
Lane 25 1-m 2–4 1 59.3 1.21
1-m 4–6 1 35.4 1.20
1-m 6–8 1 22.2 0.633
1-m 8–10 1 22.2 0.609
1-m 10–15 1 1.52 0.085
1-m 15–20 1 0.309 <0.04
1-m 20–25 1 <0.10 <0.04
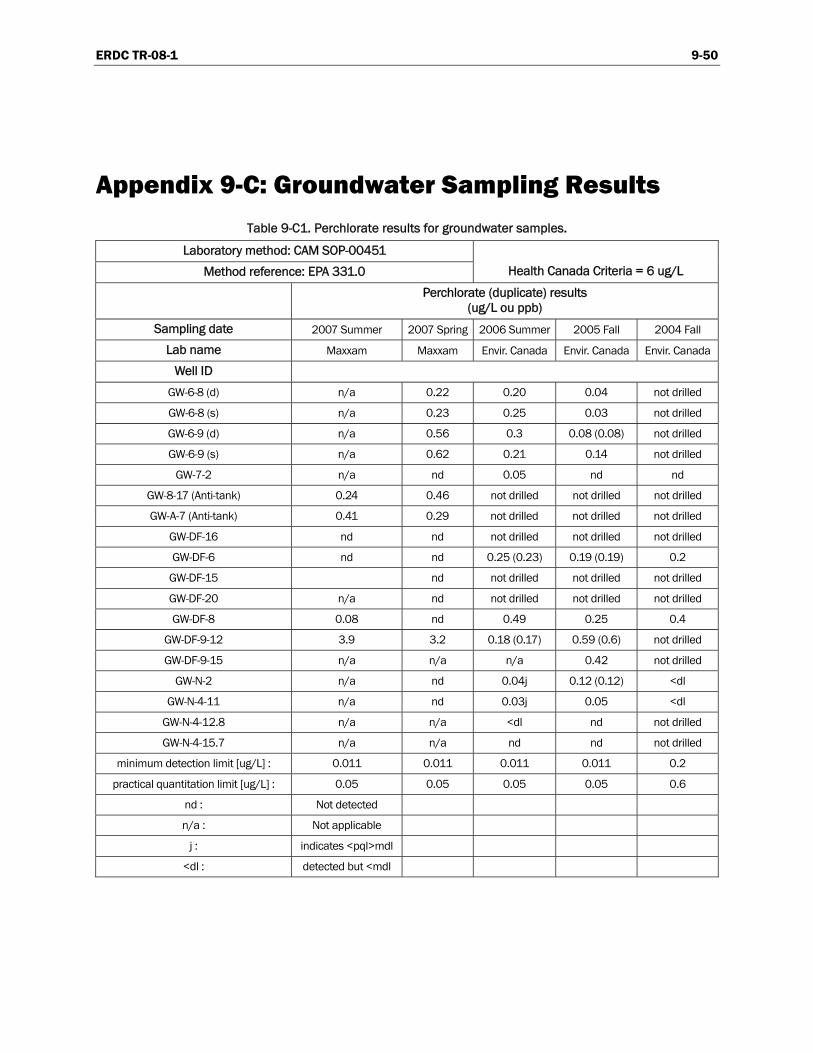
ERDC TR-08-1 9-50
Appendix 9-C: Groundwater Sampling Results Table 9-C1. Perchlorate results for groundwater samples.
Laboratory method: CAM SOP-00451
Method reference: EPA 331.0 Health Canada Criteria = 6 ug/L
Perchlorate (duplicate) results
(ug/L ou ppb)
Sampling date 2007 Summer 2007 Spring 2006 Summer 2005 Fall 2004 Fall
Lab name Maxxam Maxxam Envir. Canada Envir. Canada Envir. Canada
Well ID
GW-6-8 (d) n/a 0.22 0.20 0.04 not drilled
GW-6-8 (s) n/a 0.23 0.25 0.03 not drilled
GW-6-9 (d) n/a 0.56 0.3 0.08 (0.08) not drilled
GW-6-9 (s) n/a 0.62 0.21 0.14 not drilled
GW-7-2 n/a nd 0.05 nd nd
GW-8-17 (Anti-tank) 0.24 0.46 not drilled not drilled not drilled
GW-A-7 (Anti-tank) 0.41 0.29 not drilled not drilled not drilled
GW-DF-16 nd nd not drilled not drilled not drilled
GW-DF-6 nd nd 0.25 (0.23) 0.19 (0.19) 0.2
GW-DF-15 nd not drilled not drilled not drilled
GW-DF-20 n/a nd not drilled not drilled not drilled
GW-DF-8 0.08 nd 0.49 0.25 0.4
GW-DF-9-12 3.9 3.2 0.18 (0.17) 0.59 (0.6) not drilled
GW-DF-9-15 n/a n/a n/a 0.42 not drilled
GW-N-2 n/a nd 0.04j 0.12 (0.12) <dl
GW-N-4-11 n/a nd 0.03j 0.05 <dl
GW-N-4-12.8 n/a n/a <dl nd not drilled
GW-N-4-15.7 n/a n/a nd nd not drilled
minimum detection limit [ug/L] : 0.011 0.011 0.011 0.011 0.2
practical quantitation limit [ug/L] : 0.05 0.05 0.05 0.05 0.6
nd : Not detected
n/a : Not applicable
j : indicates <pql>mdl
<dl : detected but <mdl

ERDC TR-08-1 9-51
Table 9-C2. Energetic materials results for groundwater samples.
HMX 1,3,5-TNB RDX 1,3-DNB TNT TETRYL NG 2,4-DNT 2,6-DNT 2-A-DNT 4-A-DNT 2+4-NITRO 3-NITRO
Well ID Sampling date (ppb)
2007 Spring nd nd nd nd nd nd nd nd nd nd nd nd nd
2006 Summer nd nd nd nd nd nd nd nd nd nd nd nd nd GW-7-2
2004 Fall nd nd nd nd nd nd nd nd nd nd nd nd nd
GW-8-17 2007 Spring nd nd nd nd nd nd nd nd nd nd nd nd nd
GW-A-7 2007 Spring nd nd nd nd nd nd nd nd nd nd nd nd nd
2007 Spring 3.98 nd nd nd nd nd nd nd nd nd nd nd nd
2006 Fall 5.0 nd 0.9 n/a nd n/a nd nd nd nd nd n/a n/a
2006 Fall (dupl.) 4.8 nd 1.0 n/a nd n/a nd nd nd nd nd n/a n/a
2006 Summer nd nd nd nd nd nd nd nd nd nd nd nd nd
GW-DF-6
2004 Fall 15.91 nd 2.21 nd nd nd nd nd nd nd nd nd nd
GW-DF-15 2007 Spring nd nd nd nd nd nd nd nd nd nd nd nd nd
GW-DF-20 2007 Spring nd nd nd nd nd nd nd nd nd nd nd nd nd
2007 Spring nd nd nd nd nd nd nd nd nd nd nd nd nd
2006 Fall 1.36 nd 1.67 n/a nd n/a nd nd nd nd nd n/a n/a
2006 Summer nd nd 3.90 nd nd nd nd nd nd nd nd nd nd GW-DF-8
2004 Fall 5.70 nd 4.42 nd nd nd nd nd nd nd nd nd nd
2007 Spring nd nd nd nd nd nd nd nd nd nd nd nd nd GW-DF-16
2007 Spring (dupl.) 5.93 nd nd nd nd nd nd nd nd nd nd nd nd
2007 Spring nd nd nd nd nd nd nd nd nd nd nd nd nd GW-6-8 (d)
2006 Summer nd nd nd nd nd nd nd nd nd nd nd nd nd
2007 Spring nd nd nd nd nd nd nd nd nd nd nd nd nd GW-6-8 (s)
2006 Summer nd nd nd nd nd nd nd nd nd nd nd nd nd
2007 Spring nd nd nd nd nd nd nd nd nd nd nd nd nd GW-6-9 (d)
2006 Summer nd nd nd nd nd nd nd nd nd nd nd nd nd
nd Not detected (detection limit = 1 ppb) n/a Not applicable
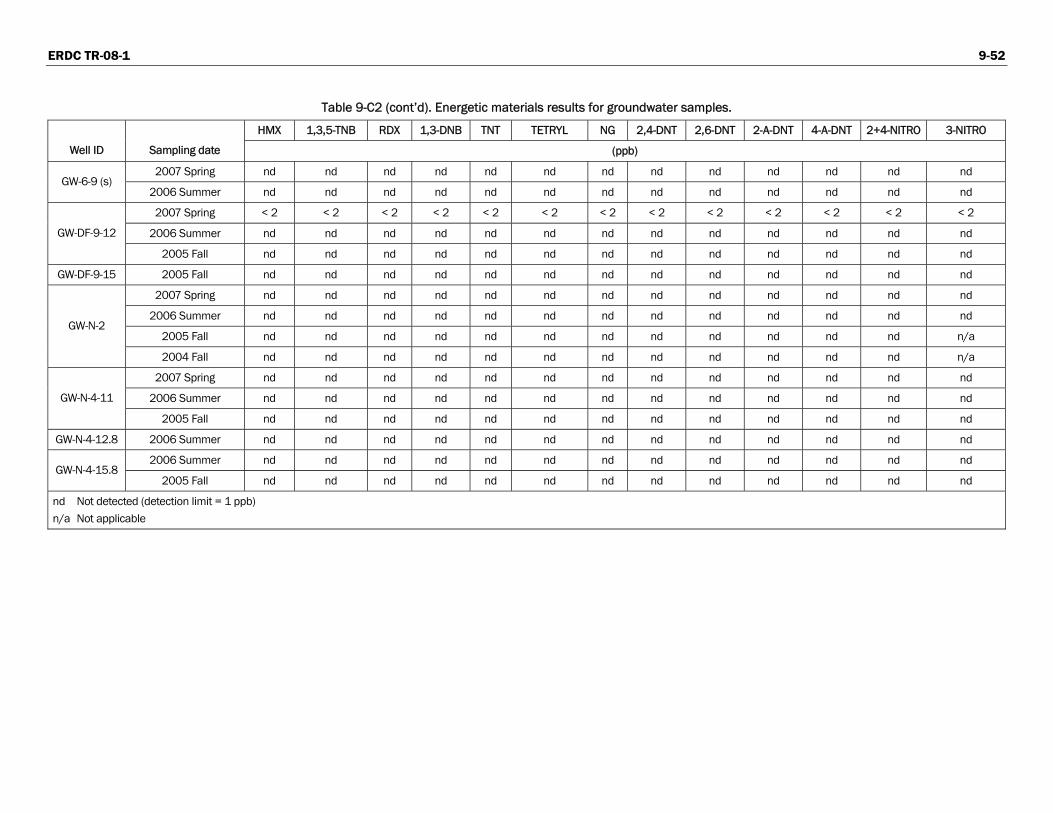
ERDC TR-08-1 9-52
Table 9-C2 (cont’d). Energetic materials results for groundwater samples.
HMX 1,3,5-TNB RDX 1,3-DNB TNT TETRYL NG 2,4-DNT 2,6-DNT 2-A-DNT 4-A-DNT 2+4-NITRO 3-NITRO
Well ID Sampling date (ppb)
2007 Spring nd nd nd nd nd nd nd nd nd nd nd nd nd GW-6-9 (s)
2006 Summer nd nd nd nd nd nd nd nd nd nd nd nd nd
2007 Spring < 2 < 2 < 2 < 2 < 2 < 2 < 2 < 2 < 2 < 2 < 2 < 2 < 2
2006 Summer nd nd nd nd nd nd nd nd nd nd nd nd nd GW-DF-9-12
2005 Fall nd nd nd nd nd nd nd nd nd nd nd nd nd
GW-DF-9-15 2005 Fall nd nd nd nd nd nd nd nd nd nd nd nd nd
2007 Spring nd nd nd nd nd nd nd nd nd nd nd nd nd
2006 Summer nd nd nd nd nd nd nd nd nd nd nd nd nd
2005 Fall nd nd nd nd nd nd nd nd nd nd nd nd n/a GW-N-2
2004 Fall nd nd nd nd nd nd nd nd nd nd nd nd n/a
2007 Spring nd nd nd nd nd nd nd nd nd nd nd nd nd
2006 Summer nd nd nd nd nd nd nd nd nd nd nd nd nd GW-N-4-11
2005 Fall nd nd nd nd nd nd nd nd nd nd nd nd nd
GW-N-4-12.8 2006 Summer nd nd nd nd nd nd nd nd nd nd nd nd nd
2006 Summer nd nd nd nd nd nd nd nd nd nd nd nd nd GW-N-4-15.8
2005 Fall nd nd nd nd nd nd nd nd nd nd nd nd nd
nd Not detected (detection limit = 1 ppb) n/a Not applicable
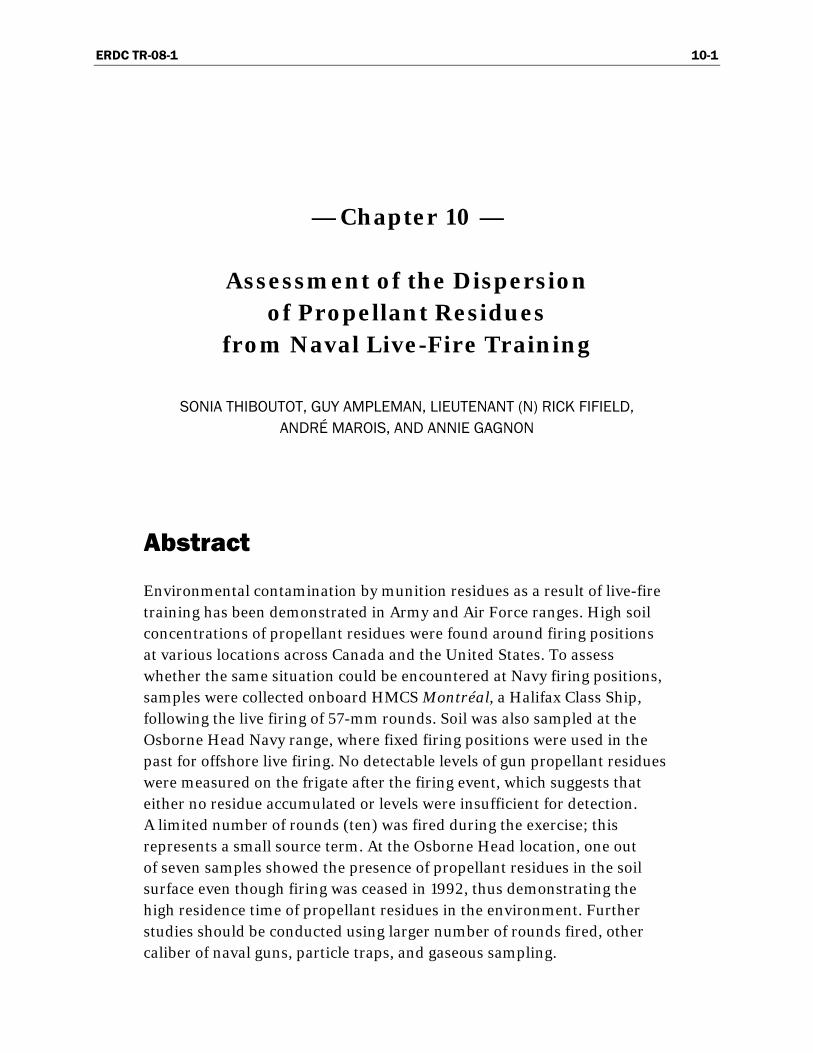
ERDC TR-08-1 10-1
— Chapter 10 —
Assessment of the Dispersion of Propellant Residues
from Naval Live-Fire Training
SONIA THIBOUTOT, GUY AMPLEMAN, LIEUTENANT (N) RICK FIFIELD, ANDRÉ MAROIS, AND ANNIE GAGNON
Abstract
Environmental contamination by munition residues as a result of live-fire training has been demonstrated in Army and Air Force ranges. High soil concentrations of propellant residues were found around firing positions at various locations across Canada and the United States. To assess whether the same situation could be encountered at Navy firing positions, samples were collected onboard HMCS Montréal, a Halifax Class Ship, following the live firing of 57-mm rounds. Soil was also sampled at the Osborne Head Navy range, where fixed firing positions were used in the past for offshore live firing. No detectable levels of gun propellant residues were measured on the frigate after the firing event, which suggests that either no residue accumulated or levels were insufficient for detection. A limited number of rounds (ten) was fired during the exercise; this represents a small source term. At the Osborne Head location, one out of seven samples showed the presence of propellant residues in the soil surface even though firing was ceased in 1992, thus demonstrating the high residence time of propellant residues in the environment. Further studies should be conducted using larger number of rounds fired, other caliber of naval guns, particle traps, and gaseous sampling.

ERDC TR-08-1 10-2
Executive Summary
This study is part of a larger effort undertaken in the context of sustaining operational military activities. The Canadian Forces need to be informed about the potential environmental and human health impacts of activities such as live firing, detonation of unexploded ordnance, and surplus ammunition. This is critical to ensure that such activities can be conducted on a sustainable basis. In the past, many efforts were devoted to the characterization of energetic materials contamination at live-fire ranges. At the firing positions, the propellant is ignited to propel the projectile toward the impact zone. Based on past field characterizations, it was noted that gun propellant residues were present near firing locations, reaching up to 10,000 mg/kg of gun propellant constituents dispersed in the sur-face soils. Most of our past efforts were dedicated to Army or Air Force live-fire training; no study was devoted to the Navy live-fire training. It was deemed imperative to verify if gun propellant residues were deposited in the firing area on Canadian Navy vessels, and if these residues could accumulate in the workplace. The propellant and technology used in Naval munitions is comparable to that used in Army munitions, so it was pos-tulated that unburned particles could be ejected during Navy live-fire training. This preliminary study was set up with the main objective of identifying and quantifying solid residues that result from live firing of a representative ammunition used by the Navy, the 57-mm Blind Loaded Plug (BLP) Naval ammunition. Research was also conducted to determine if land-based fixed firing offshore positions are still in use in Canada for training and proving Naval weapons. Our research showed that offshore live firing had not been conducted in Canada since the early 90s. All live-fire training is conducted at sea, using mostly practice rounds. A site formerly used for offshore firing was identified in Dartmouth at the Osborne Head Navy range, which was decommissioned for live firing in 1992. Access was provided to DRDC, and soil samples were collected to verify if propellant residues would be detectable after more than 13 years of inactivity. The results obtained showed no detectable levels of residues after the firing of ten rounds on the ship, and low levels were detected in one of the samples collected at Osborne Head. Further studies should be conducted to confirm our results with the 57-mm gun and other munitions used by the Navy. These should include particle traps for capturing solid particles more efficiently and analyzing of gaseous emissions.

ERDC TR-08-1 10-3
Acknowledgements
The authors of this chapter thank LCdr Érik Tremblay, DRDC Valcartier Navy Liaison Officer, for his help in finding the pertinent points of contact within the Navy. LCdr Jim Dziarski, Maritime Staff Environmental Officer from National Headquarters, also helped in establishing contacts between DRDC scientists and the Maritime Forces Atlantic personnel. Lt(N) Seana Routledge, N37-11 Configuration Management Officer and Mr. Kyle Penney, Formation Safety and Environment Maritime Forces Atlantic, have been instrumental in establishing contacts with HMCS Montréal’s Combat Systems Engineering department and for getting access to the Osborne Head site. LS Couch, PO2 Walker, and LS Tibbo are acknowl-edged for their full support and for performing the sampling for DRDC before and after the firing event. Ms. Thérèse Gamache from DRDC Valcartier is acknowledged for the stabilizer analysis. Finally, the funding program SERDP is greatly acknowledged for the financial support of this study.

ERDC TR-08-1 10-4
Introduction
The environmental impacts of live-fire military training have been scru-tinized over the last few years. Sampling campaigns were performed in military training ranges in Canada, the United States, and Sweden, and have demonstrated the accumulation of measurable levels of explosives residues at target locations, and of gun propellant residues at firing positions (FP) [1–11]. More specifically, 2, 4-dinitrotoluene (DNT), 2,6-DNT, and nitroglycerin (NG) were detected near artillery, mortar, antitank, and tank firing points at concentrations up to ten thousands of milligrams per kilogram of soil [3]. Studies were conducted to measure the accumulation of gun propellant residues from specific artillery and mortars live-fire events to better evaluate the source terms of each activity [12, 13] and studies are ongoing with other weapons. The work accom-plished up to now was performed mostly in Army training ranges, and a major study was also conducted in an Air Force training range [14].
No study has been dedicated up to now on the accumulation of energetic residues near Naval firing positions. The aim of this study was to conduct sampling onboard a Halifax Class Ship to measure the potential accumula-tion of propellant residues upon live firing, and to sample Canadian Naval land-based fixed firing positions to assess the soil contamination in their vicinity.
Our first discussions with Navy representatives seemed to indicate that the probability of contact of Navy personnel with propellant residues was very low. They explained that no one is allowed on the upper deck in the vicini-ty of the weapon during firing, but with permission, a technician may be required to investigate the weapon after a wait time of two minutes. This wait time is to surpass the “hang fire” time of a round and allow the dis-persion of the gun plume. Personnel proceeding to the mount are properly clothed with anti-flash gear and other personal safety equipment; there-fore, they would not come into direct contact of any possible solid residue during their rapid inspection.
In parallel, research on the locations of land-based fixed Navy positions across Canada has led to the conclusion that such sites no longer exist

ERDC TR-08-1 10-5
there. At the present time, only open-sea live firing is conducted, using mostly practice rounds. The only site that was identified by DRDC Valcartier Navy Liaison Officer and by the Maritime Staff Environmental Officer was the former Osborne Head Point Naval Facility range near Dartmouth. This site was used until the early 90s for offshore live-fire training. Access was requested to sample the soils around the old fixed firing positions through the Formation Safety and Environment Maritime Forces Atlantic. Limited access was granted to DRDC Valcartier scientists because other trials were conducted that day, but it was sufficient to allow the collection of a few representative soil samples.
The objective of the present study was to monitor the potential presence of Naval gun propellant residues in a Canadian frigate following live-fire training of Navy 57-mm ammunition and on the surface soil in the vicinity of naval fixed firing positions. This chapter presents the results obtained following sampling conducted in the fall of 2006 and was sponsored by the Strategic Environmental R&D Progam (SERDP), project ER-1481.

ERDC TR-08-1 10-6
Experimental Methods
Naval Munitions and Propellants
The most commonly used Canadian naval ammunitions are the 20-, 40-, 57-, and 76-mm Naval guns [15–18]. The 20-mm gun is propelled by the WC859 double-base propellant, the 40-mm gun by the NC1066 propel-lant, the 57-mm by a mixture of NC1066 and NC1081 propellants 50% w/w, and the 76-mm gun by the M6 +2 propellant. Tables 10-1 through 10-4 present the chemical compositions of the corresponding propelling charges. These propellants are based on a matrix of nitrocellulose (NC) in which other energetic compounds, such as dinitrotoluenes (DNT) or nitro-glycerin (NG), are added. They are plasticized by using either phtalates or DNT or a mix of both, and are stabilized using either diphenylamine (DPA) or ethyl centralite (EC). A few other compounds might be added as catalysts or oxidizers. It is well known that nitrate ester-based propellants decompose, forming nitrogen oxides as the degradation products. To in-hibit further decomposition, stabilizers are added and react with nitrogen oxides, and finally non-catalytic products are formed, so autocatalytic decomposition is minimized. In this way, chemical stability of propellant increases, and the content of stabilizer decreases with time, to form nitroso or nitro derivatives, or stabilizer daughter products [19, 20].
Table 10-1. Chemical composition of WC859 propelling charge, 20-mm gun.
Ingredient
Percentage
w/w (%)
NC 77
NG 10
DNT 1
DPA 1
Dibutylphthalate 7
Sodium sulfate 0.5
Graphite 0.5
Tin dioxide 1
Calcium carbonate 1
Potassium sulfate 1

ERDC TR-08-1 10-7
Table 10-2. Chemical composition of NC1066 propelling charge, 40-mm gun and 57-mm gun.
Ingredient
Percentage
w/w (%)
NC 90.6
DPA 1.0
Diamylphthalate 6.6
Potassium sulfate 1.3
Tin powder 0.2
Lead monoxide 0.2
Carbon black 0.1
Table 10-3. Chemical composition of NC1281 propelling charge, 57-mm gun.
Ingredient
Percentage
w/w (%)
NC 94
Centralite 2
Dibutylphthalate 2
Potassium bitartrate 1.6
Tin powder 0.2
Lead monoxide 0.2
Table 10-4. Chemical composition of the M6 +2 propelling charge, 76-mm gun.
Ingredient
Percentage
w/w (%)
NC 86
DNT 10
Dibutylphthalate 3
DPA 1
Most of the compounds used in gun propellants might represent both environmental and human health concerns if projected as unreacted products upon firing. 2,4 DNT and 2,6-DNT have been identified as potential carcinogens by several environmental authorities [21, 22]. NG, as well as DPA and EC and their daughter products, are toxic to humans . Therefore, their potential accumulation inside a Naval environment should be monitored.

ERDC TR-08-1 10-8
HMCS Montréal
HMCS Montréal (Fig. 10-1) is the seventh Halifax Class Ship, built by St-John Shipbuilding Limited.
Figure 10-1. HMCS Montréal.
Her construction began in 1991, and she was commissioned in 1994. Her armament includes a collection of tactical and defensive weapons and sensors. The primary anti-submarine weapon is the torpedo. The surface-to-surface armament includes radars that provide long-range surface and air surveillance. Her main anti-surface gun is the Bofor 57-mm automatic gun. The visit of the frigate with the engineers demonstrated that there was a potential for the accumulation of residues in the vicinity of the gun mount and below it, in the area of the57-mm magazine and the weapon workshop, where technicians are located during firing. The sampling was conducted by Naval weapons technicians onboard HMCS Montréal, since it was not possible for DRDC team to be onboard while the firing took place, during HMCS Montréal’s next exercises at sea.
A meeting was held the morning of 27 September 2006 at the Halifax Dockyard, onboard HMCS Montréal. DRDC scientists presented their project to the Combat Systems Engineering staff, and explained the rational for sampling after a firing event to verify whether gun propellant

ERDC TR-08-1 10-9
residues accumulate in their environment. A tour of HMCS Montréal was done and the firing procedure was described in detail by the Naval Weapons Technicians. The 57-mm gun is located on the forecastle of the ship (Fig. 10-2). During firing, nobody is allowed on deck, and the firing is conducted from the operations room, located in the front portion of the ship, below and aft of the gun. An automatic hoist system loads the muni-tions into the gun (Fig. 10-3). If the automatic loading system jams, the Naval weapons technicians have to unload it manually to resume. Around the gun, there is a closed circular area called a ceberal, where empty muni-tion shells accumulate. Regular maintenance includes cleaning of the in-side of the gun, such as the barrel, breech block, and rammer after each firing event. The visit highlighted the fact that propellant residues have the potential to accumulate in the frigate, through the back blast of the gun plume following the hoist that leads into the 57-mm magazine. The weapons workshop is located near the hoist, and gun smoke reaches it when firing occurs, as mentioned by the Naval weapons technicians. So, even though minimal, there is a potential exposure to the Naval weapons technician personnel to any projected particles or gaseous emissions upon live-fire training.
Figure 10-2. Outside of the gun mount.

ERDC TR-08-1 10-10
Figure 10-3. Inside of the gun mount.
Sampling Strategy
The strategy consisted of sampling vertical and horizontal surfaces wherever gun propellant residues were suspected to accumulate after live-fire training. Sample locations were decided upon in discussions between DRDC and the Combat Systems Engineering staff, during the tour of the frigate. Locations for sampling were quite limited, due to the high space constraints that prevail on a frigate. Samples were collected inside and outside the frigate, around the gun, within it, and immediately below it, both in the weapons workshop area and the weapon magazine. DRDC scientists brought with them empty glass jars and cotton swabs that were used to swipe the delineated surfaces. Ethanol was used to wet the cotton swabs to improve the adhesion of potential particles in the wiped areas. Areas of known dimensions were delineated with masking tape before firing. Table 10-5 presents the locations where samples were collected.
Samples A, B, and C were located inside the gun, directly on the firing cassettes (A), on the inside walls of the gun (B), and in front of the inside of the gun on the electric power panel (C). Figure 10-4 illustrates one example of sampling area A.
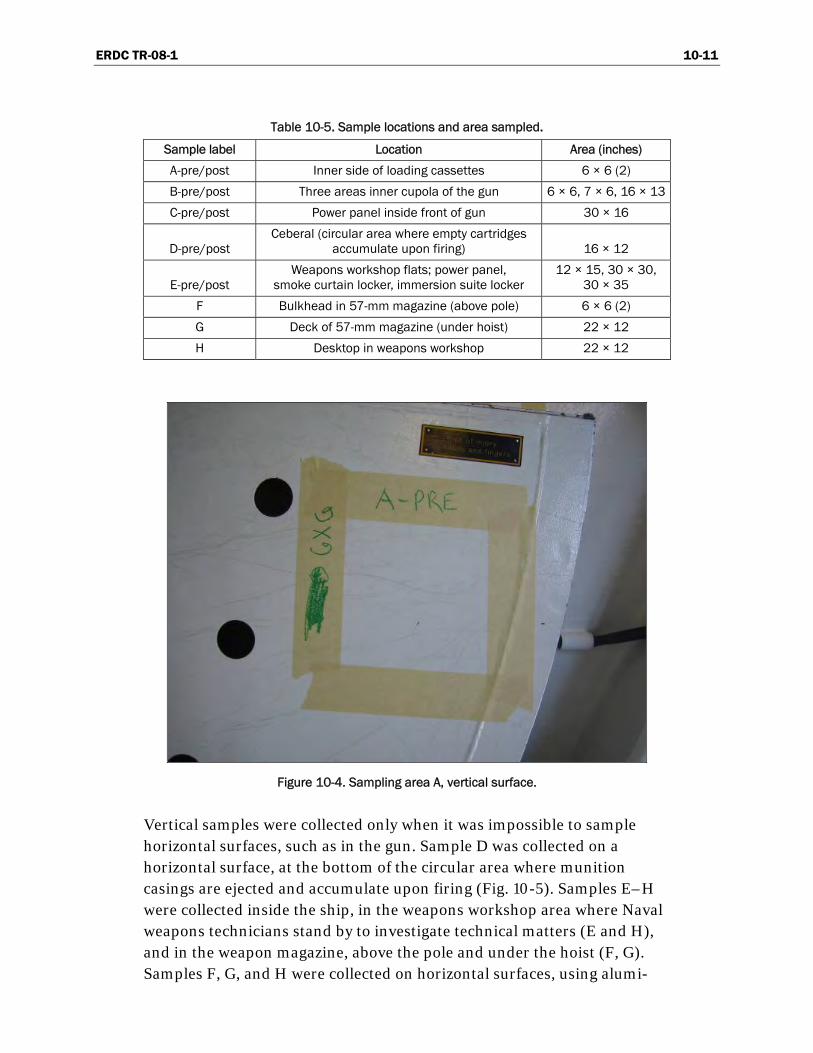
ERDC TR-08-1 10-11
Table 10-5. Sample locations and area sampled.
Sample label Location Area (inches)
A-pre/post Inner side of loading cassettes 6 × 6 (2)
B-pre/post Three areas inner cupola of the gun 6 × 6, 7 × 6, 16 × 13
C-pre/post Power panel inside front of gun 30 × 16
D-pre/post Ceberal (circular area where empty cartridges
accumulate upon firing) 16 × 12
E-pre/post Weapons workshop flats; power panel,
smoke curtain locker, immersion suite locker 12 × 15, 30 × 30,
30 × 35
F Bulkhead in 57-mm magazine (above pole) 6 × 6 (2)
G Deck of 57-mm magazine (under hoist) 22 × 12
H Desktop in weapons workshop 22 × 12
Figure 10-4. Sampling area A, vertical surface.
Vertical samples were collected only when it was impossible to sample horizontal surfaces, such as in the gun. Sample D was collected on a horizontal surface, at the bottom of the circular area where munition casings are ejected and accumulate upon firing (Fig. 10-5). Samples E–H were collected inside the ship, in the weapons workshop area where Naval weapons technicians stand by to investigate technical matters (E and H), and in the weapon magazine, above the pole and under the hoist (F, G). Samples F, G, and H were collected on horizontal surfaces, using alumi-

ERDC TR-08-1 10-12
num foil that was placed directly under the hoist in the 57-mm magazine and on a desk in the weapons workshop. Foil was carefully folded and placed in glass jars after firing (Fig. 10-6). Samples A–E were collected using cotton swabs wetted with ethanol and the surfaces were swiped before (pre) and after firing (post). Samples F–H were collected using aluminum foil.
For samples A, B, E, and F, all surfaces were either swiped or covered with aluminum foils and samples were combined in the same jars. Between two and seven cotton swipes were used per sample, depending on the area sample and the number of surfaces sampled.
Figure 10-5. Sampling area D, horizontal surface.
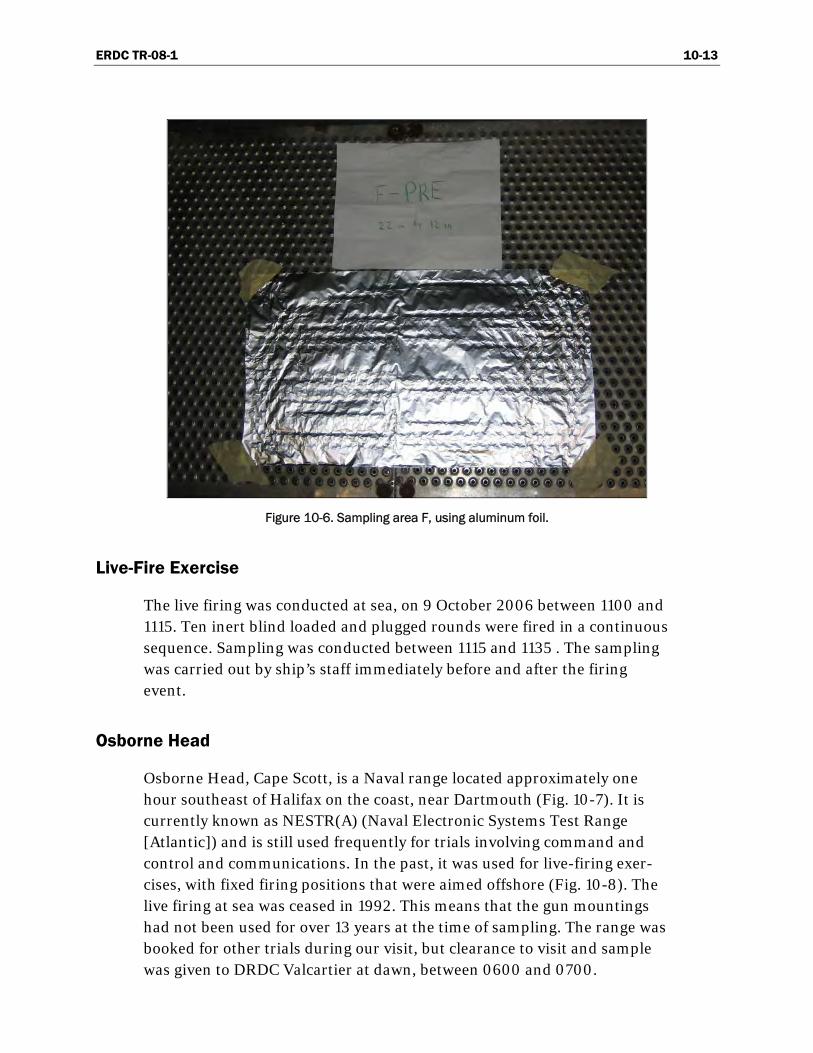
ERDC TR-08-1 10-13
Figure 10-6. Sampling area F, using aluminum foil.
Live-Fire Exercise
The live firing was conducted at sea, on 9 October 2006 between 1100 and 1115. Ten inert blind loaded and plugged rounds were fired in a continuous sequence. Sampling was conducted between 1115 and 1135 . The sampling was carried out by ship’s staff immediately before and after the firing event.
Osborne Head
Osborne Head, Cape Scott, is a Naval range located approximately one hour southeast of Halifax on the coast, near Dartmouth (Fig. 10-7). It is currently known as NESTR(A) (Naval Electronic Systems Test Range [Atlantic]) and is still used frequently for trials involving command and control and communications. In the past, it was used for live-firing exer-cises, with fixed firing positions that were aimed offshore (Fig. 10-8). The live firing at sea was ceased in 1992. This means that the gun mountings had not been used for over 13 years at the time of sampling. The range was booked for other trials during our visit, but clearance to visit and sample was given to DRDC Valcartier at dawn, between 0600 and 0700.
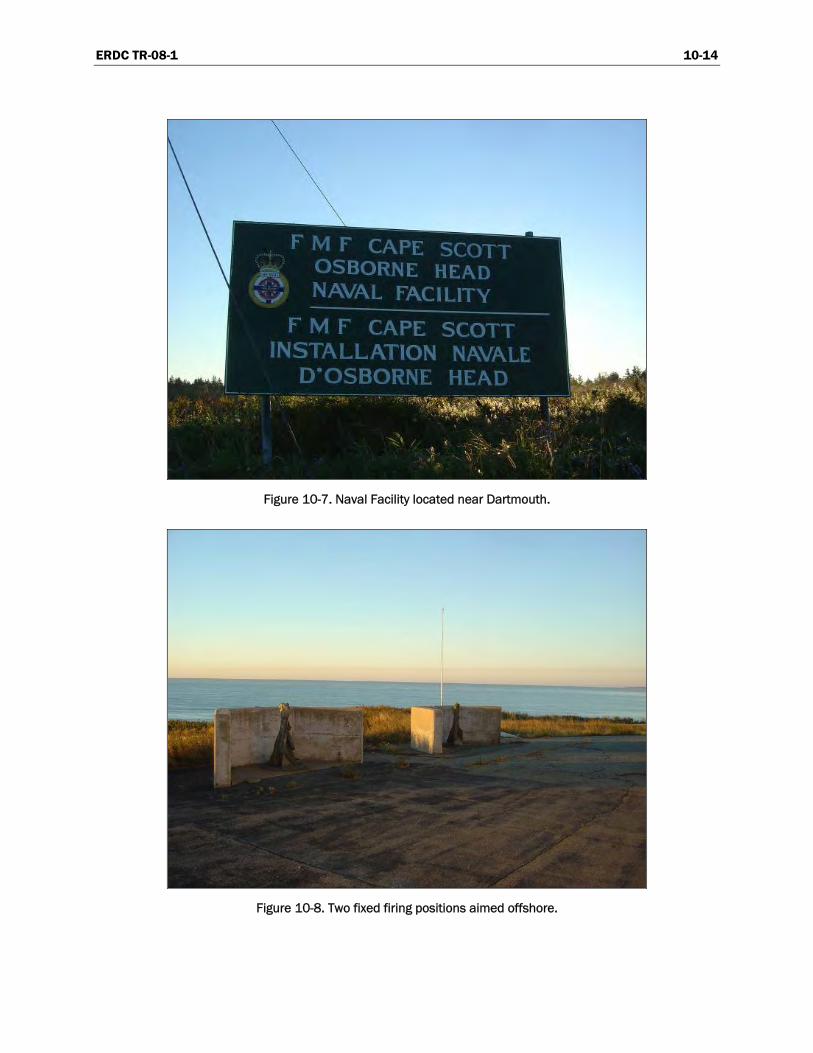
ERDC TR-08-1 10-14
Figure 10-7. Naval Facility located near Dartmouth.
Figure 10-8. Two fixed firing positions aimed offshore.
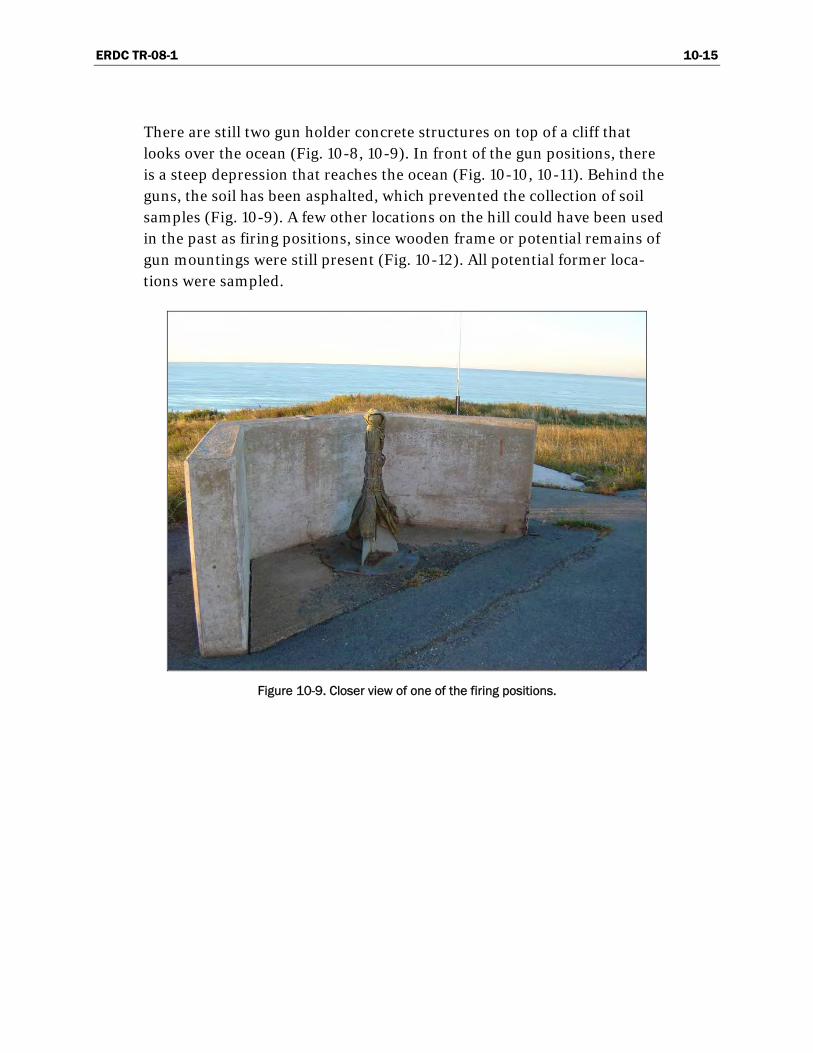
ERDC TR-08-1 10-15
There are still two gun holder concrete structures on top of a cliff that looks over the ocean (Fig. 10-8, 10-9). In front of the gun positions, there is a steep depression that reaches the ocean (Fig. 10-10, 10-11). Behind the guns, the soil has been asphalted, which prevented the collection of soil samples (Fig. 10-9). A few other locations on the hill could have been used in the past as firing positions, since wooden frame or potential remains of gun mountings were still present (Fig. 10-12). All potential former loca-tions were sampled.
Figure 10-9. Closer view of one of the firing positions.

ERDC TR-08-1 10-16
Figure 10-10. Cliff in front of the fixed firing positions.
Figure 10-11. Upper view of the firing positions from the cliff.
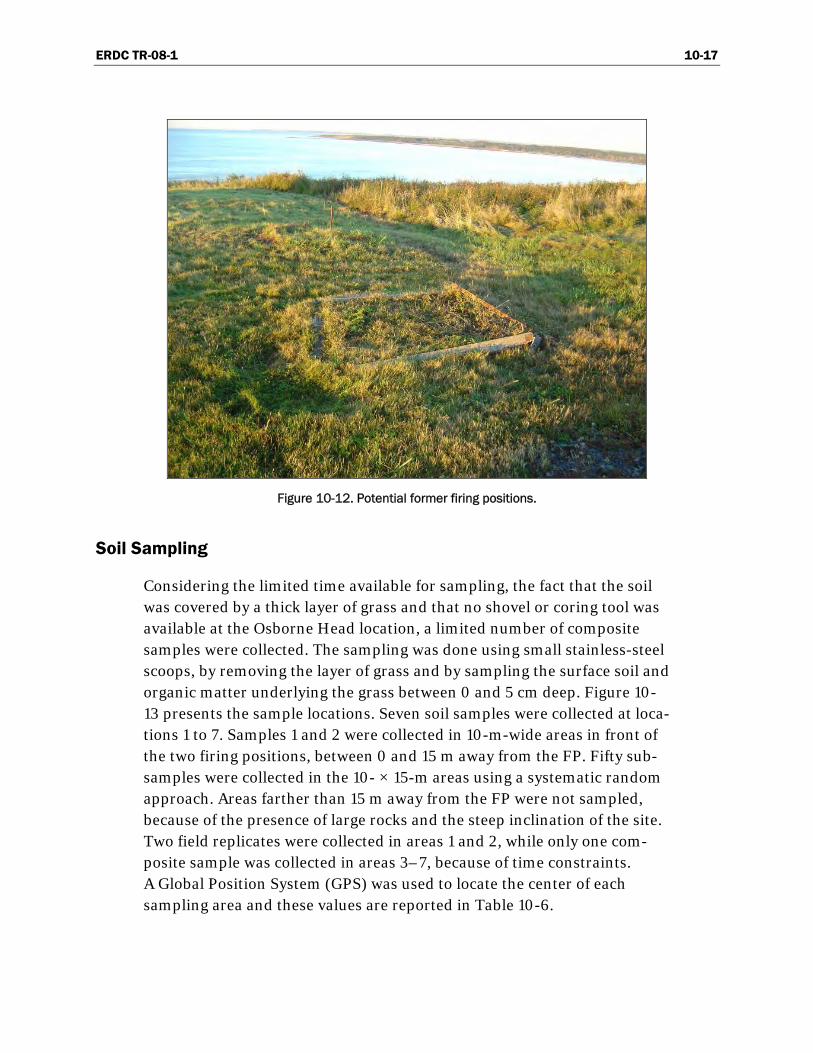
ERDC TR-08-1 10-17
Figure 10-12. Potential former firing positions.
Soil Sampling
Considering the limited time available for sampling, the fact that the soil was covered by a thick layer of grass and that no shovel or coring tool was available at the Osborne Head location, a limited number of composite samples were collected. The sampling was done using small stainless-steel scoops, by removing the layer of grass and by sampling the surface soil and organic matter underlying the grass between 0 and 5 cm deep. Figure 10-13 presents the sample locations. Seven soil samples were collected at loca-tions 1 to 7. Samples 1 and 2 were collected in 10-m-wide areas in front of the two firing positions, between 0 and 15 m away from the FP. Fifty sub-samples were collected in the 10- × 15-m areas using a systematic random approach. Areas farther than 15 m away from the FP were not sampled, because of the presence of large rocks and the steep inclination of the site. Two field replicates were collected in areas 1 and 2, while only one com-posite sample was collected in areas 3–7, because of time constraints. A Global Position System (GPS) was used to locate the center of each sampling area and these values are reported in Table 10-6.
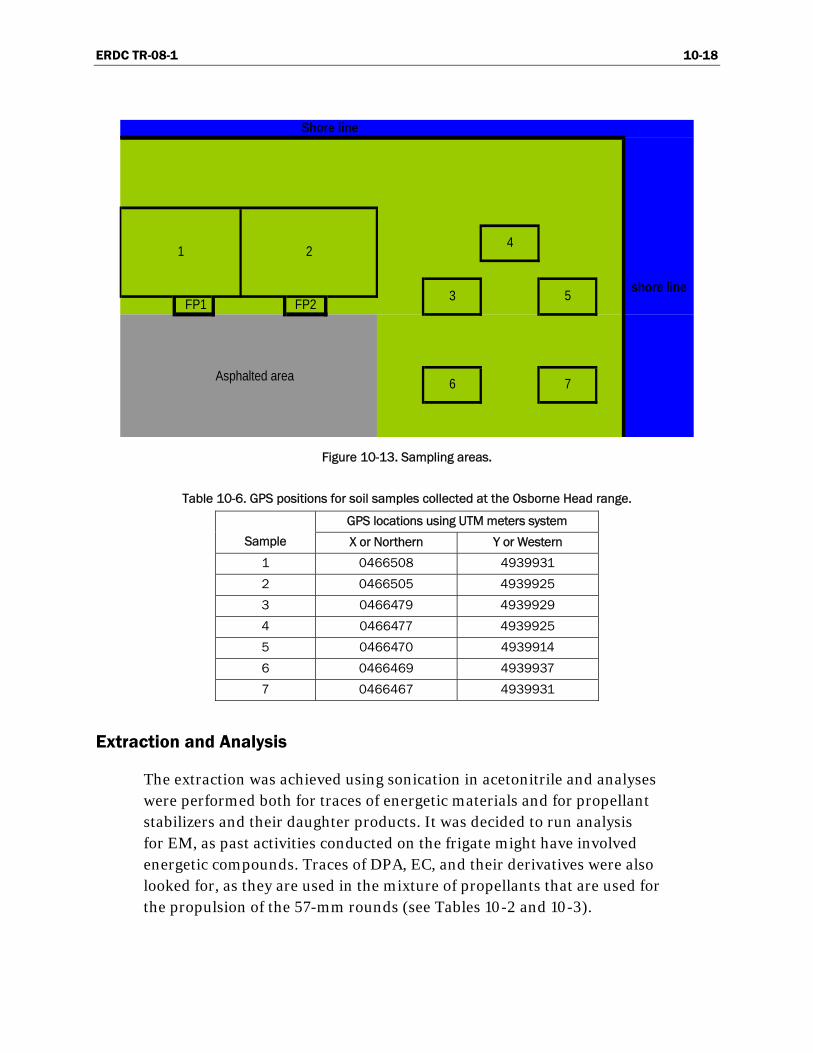
ERDC TR-08-1 10-18
FP1 FP2 5
6 7
shore line
1 2
Asphalted area
Shore line
3
4
Figure 10-13. Sampling areas.
Table 10-6. GPS positions for soil samples collected at the Osborne Head range.
GPS locations using UTM meters system
Sample X or Northern Y or Western
1 0466508 4939931
2 0466505 4939925
3 0466479 4939929
4 0466477 4939925
5 0466470 4939914
6 0466469 4939937
7 0466467 4939931
Extraction and Analysis
The extraction was achieved using sonication in acetonitrile and analyses were performed both for traces of energetic materials and for propellant stabilizers and their daughter products. It was decided to run analysis for EM, as past activities conducted on the frigate might have involved energetic compounds. Traces of DPA, EC, and their derivatives were also looked for, as they are used in the mixture of propellants that are used for the propulsion of the 57-mm rounds (see Tables 10-2 and 10-3).
ERDC TR-08-1 10-19
Extraction
Wipes from the HMCS Montréal
Volumes of between 100 and 200 mL of acetonitrile were added to each 250-mL amber sample bottle. This was enough to cover the wipes or aluminum foils and allow a freestanding solution. The sample bottles were placed on a wrist-action shaker table for one hour, then transferred to an ultrasonic bath for 18 hours. Extracts were concentrated to final volumes varying between 1 and 2 mL, using a Zymarck system. Finally, a quantity of the final solution (between 700 and 800 μL) was transferred with an Eppendorf pipet into a 3-mL Luer-Lok syringe fitted with a 0.45-μm filter. The resulting solution was filtered into a 2-mL amber vial.
Soil Samples from Fixed Firing Positions
Soil samples were kept in the dark and in the cold using a cooler and were brought back to DRDC Valcartier the day after their collection. They were homogenized using an acetone slurry and extracted using the standard procedure for soil samples (Refs 2–4, 8). Extracts were concentrated using a Zymark system to improve the detection of analytes.
Analysis
Explosives
Wipes and soil extracts were analyzed using Reverse-Phase High-Performance Liquid Chromatography (RP-HPLC), HP model 1100 equipped with a diode array detector (DAD). The DAD was monitoring at 210, 220, and 254 nm. The column used was a Supelcosil LC-8 column 25 cm × 3 mm × 5 μm eluted with 15:85 isopropanol/water (v/v) at a flow rate of 0.75 mL/min. The detection limit achieved was 0.1 mg/L.
Stabilizers
Wipes extracts were analyzed using an HPLC method developed at DRDC Valcartier [20]. An ultraviolet (UV) wavelength of 254 nm was used to analyze DPA, EC, and the derivatives NNODPA and 2-NDPA, whereas the UV wavelength of 425 nm was used to analyze the 4-NDPA. The components were separated by a Gemini C18 column (5 μm, 250 × 4.6

ERDC TR-08-1 10-20
mm); the mobile phase consisted of a 65/35 mixture of acetonitrile/water with a flow rate of 1 mL/min. Using the pre-concentration, a detection limit of 0.05 mg/L was achieved.

ERDC TR-08-1 10-21
Results and Discussion
57-mm Live Firing
After the live firing of ten 57-mm practice rounds, all the surfaces sampled showed no visual traces of any residues. It was confirmed later that no traces of either energetic materials or stabilizers were detected. Consid-ering the surface area sampled, the pre-concentration method used, and the detection limits of the HPLC method, it would have been possible to detect quantity as low as 0.1 µg of analyte. However, the limited number of rounds fired (10) represented a small source term that might explain the non-detection of gun propellant residues. Also, most of the surfaces sampled were non adhesive vertical surfaces due to space and surface constraints on the frigate, and the probability of accumulation on such surfaces was negligible. Samples D, F, G, and H were collected on hori-zontal surfaces where the probability of accumulation of residues was higher. None of these four samples showed any traces of any of the analytes.
Former Osborne Head Navy Firing Positions
Out of the seven composite soil samples collected, only one showed the presence of energetic materials. Results are presented in Table 10-7. 2,4-DNT was detected at low levels in the two field replicates of sample # 2, located in front of one of the concrete old firing positions. There is a good reproducibility in the two values, indicating that the sampling approach led to a representative and valid result. No 2,6-DNT was detected in either sample. 2,6-DNT is present in military-grade 2,4-DNT as an impurity, in general between 2 and 10% by weight. The low levels of 2,4-DNT meas-ured might explain why its co-contaminant was not detected. The area where 2,4-DNT was detected is where most firing should have been con-ducted in the past for fixed firing exercises.

ERDC TR-08-1 10-22
Table 10-7. Results, soil samples collected at the Osborne Head range.
Sample Lab #
2,4-DNT
(mg/kg)
Osborne Head 1 Hal-1 nd
Osborne Head 1-dup Hal-1b nd
Osborne Head 2 Hal-2 1.33
Osborne Head 2-dup Hal-2b 1.18
Osborne Head 3 Hal-3 nd
Osborne Head 4 Hal-4 nd
Osborne Head 5 Hal-5 nd
Osborne Head 6 Hal-6 nd
Osborne Head 7 Hal-7 nd
Osborne Head BG-1 Hal-8 nd
Osborne Head BG-2 Hal-9 nd
Other Compounds and Impacts on the User
This study focused on energetic material and stabilizer residues and their daughter products. However, some other compounds, such as sulphur and lead, which are present in a few propelling charges and in the percussion primer, could potentially affect the environment or human health. These analytes were not included in this study since very low levels of propellant residues were expected, and therefore non detectable levels were antici-pated. Moreover, this study was done following the firing of the 57-mm rounds, propelled by a propellant using only NC as the energetic material. Other Navy munitions involve propellants based on either 2,4 DNT or NG with NC, and these latter products could be dispersed in the firing environments.
Another aspect that was not covered in our study was the capture and analysis of the gaseous emissions during gun firing. The live-firing gaseous plumes might contain combustion by-products that could have adverse human health or environmental impacts. Future studies should involve the collection of the gaseous emissions of live-fire training, especially in the weapon workshop area where Naval Weapons Technicians are located during firing, and in the weapons magazine, where most of the gun plume accumulated upon firing.

ERDC TR-08-1 10-23
Recommendations and Conclusion
The goal of this study was to characterize live-firing residues that might be dispersed at Naval FP, both on a Canadian frigate and in formerly used land-based fixed firing positions. No detectable levels of energetic materi-als or propellant stabilizers were detected onboard HMCS Montréal after the live firing of ten 57-mm rounds. Nitrocellulose was not analyzed, con-sidering that it is not toxic. These preliminary results showed that, in the conditions used for our trial, no detectable levels of contaminants were found in the vicinity of the 57-mm gun onboard.
The sampling onboard a frigate represents a challenge since the space on a ship is very limited and sampling locations are not obvious to identify. Also, having scientists attend a live-fire event onboard is either difficult or not possible, since the live firing is conducted at sea, along with many other tasks conducted at sea for long time periods. This is why the sampling was conducted by HMCS Montréal’s Combat Systems Engi-neering Department staff for DRDC. It is recommended for future trials to sample after live-firing events of larger number of rounds. This would improve the probability of detection of residues and would confirm the results obtained in the present study. It is also recommended to sample in live-firing events involving other calibers fired by the Navy, such as the 20-mm or the 76-mm guns, since their propelling charges involve other ener-getic compounds, such as NG or DNT.
In recent trials conducted by DRDC Valcartier, particle traps consisting of aluminum containers were used to improve the collection of firing resi-dues. Future trials should involve the use of these particle traps, which would improve the probability of catching solid particles. Also, the live-firing gaseous emissions should be monitored to verify whether the Naval Weapons Technicians could be exposed to adverse gun propellant combus-tion by-products in their workplace area.
The sampling of former land-based fixed firing positions at Osborne Head demonstrated that, in one location, detectable levels of 2,4-DNT were still present even after 13 years of inactivity. The contaminated area was limited, but it proved that the live firing of Navy rounds can lead to the

ERDC TR-08-1 10-24
accumulation of gun propellant residues in the environment. Their resi-dence time in the environment is very long, mostly because the NC matrix prevents the degradation and/or dissolution of the embedded 2,4-DNT.
This study is considered preliminary, since due to time, space, and logistic constraints, a limited number of samples were collected. These prelimi-nary results indicated that the levels of contaminants were very low in old land-based fixed firing positions and that the firing of ten 57-mm rounds did not lead to the accumulation of detectable levels of contaminants in the vicinity of the firing position onboard HMCS Montréal.
It was demonstrated that solid and gaseous propellant residues may have the potential to accumulate in the proximity of the gun inside the vessels, considering that it is a closed environment, and therefore, further studies are recommended.
It was found that there are no other land-based fixed firing positions in Canada, so no efforts have to be dedicated toward their characterization. The Osborne Head results confirmed that Navy firing also leads to the accumulation of 2,4-DNT in the environment, so efforts should be pursued in future live-fire training onboard Navy vessels to confirm the results of the present study and to measure the depositions of particles and gaseous by-products in larger live-fire events.

ERDC TR-08-1 10-25
References
1. Pennington, J.C., T.F. Jenkins, G. Ampleman, S. Thiboutot, A.D. Hewitt, S. Brochu, J. Robb, E. Diaz, J. Lewis, H. Colby, R. Martel, K. Poe, K. Groff, K.L. Bjella, C.A. Ramsey, C.A. Hayes, S. Yost, A. Marois, A. Gagnon, B. Silverblatt, T. Crutcher, K. Harriz, K. Heisen, S.R. Bigl, T.E. Berry, Jr., J. Muzzin, D.J. Lambert, M.J. Bishop, B. Rice, M. Wojtas, M.E. Walsh, M.R. Walsh, and S. Taylor (2006) Distribution and Fate of Energetics on DoD Test and Training Ranges: Interim Report 6. US Army Engineer Research and Development Center, Vicksburg, Mississippi, Technical Report ERDC TR-06-12.
2. Jenkins, T.F., A.D. Hewitt, C.L. Grant, S. Thiboutot, G. Ampleman, M.E. Walsh, T.A. Ranney, C.A. Ramsey, A.J. Palazzo, and J.C. Pennington (2006) Identity and Distribution of Residues of Energetic Compounds at Army Live-Fire Training Ranges. Chemosphere, 63, 1280–1290.
3. Thiboutot, S., G. Ampleman, A. Marois, A. Gagnon, M. Bouchard, A. Hewitt, T. Jenkins, M. Walsh, K. Bjella, C. Ramsey, and T.A. Ranney (2004) Environmental Conditions of Surface Soils, CFB Gagetown Training Area: Delineation of the Presence of Munitions Related Residues (Phase III, Final Report). DRDC Valcartier TR 2004-205, Unclassified.
4. Jenkins, T.F., J.C. Pennington, T.A. Ranney, T.E. Berry, P.H. Miyares, M.E. Walsh, A.D. Hewitt, N. Perron, L.V. Parker, C.A. Hayes, and E. Wahlgren (2001) Characterization of Explosives Contamination at Military Firing Ranges. US Army Cold Regions Research and Engineering Laboratory, Cold Regions Research and Engineering Laboratory, Hanover, New Hampshire, Technical Report ERDC TR-01-5.
5. Marois, A., A. Gagnon, S. Thiboutot, G. Ampleman, et M. Bouchard (2004) Caractérisation des sols de surface et de la biomasse dans les secteurs d’entraînement, base des Forces canadiennes, Valcartier. RDDC Valcartier TR 2004-206, Non classifié.
6. Walsh, M.R., M.E. Walsh, C.A. Ramsey, and T.F Jenkins (2005) An Examination of Protocols for the Collection of Munitions-Derived Explosives Residues on Snow-Covered Ice. US Army Engineer Research and Development Center, Cold Regions Research and Engineering Laboratory, Hanover, New Hampshire, Technical Report ERDC/CRREL TR 05-8.
7. Wingfors, H., C. Edlund, L. Hägglund, A. Walejj, J. Sjöström, R.M. Karlsson, P. Leffler, U. Qvarfort, M. Ahlberg, S. Thiboutot, G. Ampleman, R. Martel, W. Duvalois, A. Creemers, and N. Van Ham (2006) Evaluation of the Contamination by Explosives and Metals in Soils at The Älvdalen Shooting Range. Part II: Results and Discussion. FOI- R-1877-SE.
ERDC TR-08-1 10-26
8. Ampleman, G., S. Thiboutot, J. Lewis, A. Marois, A. Gagnon, M. Bouchard, R. Martel, R. Lefebvre, C. Gauthier, J.M. Ballard, T. Jenkins, T. Ranney, and J. Pennington (2003) Evaluation of the Impacts of Live Fire Training at CFB Shilo (Final Report). DRDC Valcartier, TR 2003-066.
9. Hewitt, A.D., T.F. Jenkins, C.A. Ramsey, K.L. Bjella, T.A. Ranney, and M.R. Walsh, M.E. Walsh, C.A. Ramsey, R.J. Rachow, J.E. Zufelt, C.M. Collins, A.B. Gelvin, N.M. Perron, and S.P. Saari (2006) Energetic Residues Deposition from 60-mm and 81-mm Mortars. US Army Engineer Research and Development Center, Cold Regions Research and Engineering Laboratory, Hanover, New Hampshire, Technical Report ERDC/CRREL TR-06-10.
10. Walsh, M.E., C.A. Ramsey, C.M. Collins, A.D. Hewitt, M.R. Walsh, K.L. Bjella, D.J. Lambert, and N.M. Perron (2005) Collection Methods and Laboratory Processing of Samples from Donnelly Training Area Firing Points, Alaska, 2003. US Army Engineer Research and Development Center, Cold Regions Research and Engineering Laboratory, Hanover, New Hampshire, Technical Report ERDC/CRREL 05-6.
11. Ampleman, G., S. Thiboutot, R. Martel, C. Edlund, R.M. Karlsson, M. Alhberg, J. Sjöström, U. Qvarfort, K. Bladfält, N. Van Ham, and W. Duvalois (2005) Evaluation of the Contamination by Explosives and Metals in Soils at the Älvdalen Shooting Range Part 1: Investigation Strategies and Sampling. FOI Report 1619-SE.
12. Dubé, P., S. Thiboutot, G. Ampleman, A. Marois, and M. Bouchard (2006) Prelimi-nary Assessment of the Dispersion of Propellant Residues from the Static Live Firing of 105 MM Howitzer. DRDC Valcartier TM 2005-284.
13. Walsh, M.R., M.E. Walsh, C.A. Ramsey, R.J. Rachow, J.E. Zufelt, C.M. Collins, A.B. Gelvin, N.M. Perron, and. S.P. Saari (2006) Energetic Residues Deposition from 60-mm and 81-mm Mortars. US Army Engineer Research and Development Center, Cold Regions Research and Engineering Laboratory, Hanover, New Hampshire, Technical Report ERDC/CRREL TR-06-10.
14. Ampleman, G., S. Thiboutot, J. Lewis, A. Marois, A. Gagnon, M. Bouchard, T.F. Jenkins, T.A. Ranney, and J.C. Pennington (2004) Evaluation of the Contami-nation by Explosives and Metals in Soils, Vegetation, Surface Water and Sedi-ment at Cold Lake Air Weapons Range (CLAWR), Alberta, Phase II, Final Report. DRDC Valcartier TR 2004-204.
15. Cartridges for 20 Millimetre M61 Series Gun, Close-in Weapon System (CIWS), C-74-305-RAA/TA-000, 1994.
16. Ammunition for 40 mm L60 Gun, C-74-310-CAO/TA-000, 1999.
17. Ammunition for 57-mm Gun, C-74-310-EAO/TA-000, 1999.
18. Ammunition for 76-mm Gun/62 Super-Rapid Naval Gun, C-74-315-LAO/TA-000, 2001.
19. Miszczak, M., and J. Bladek (2004) Quantitative Measurement of Propellant Stabilizers with TLC and Liquid-Crystalline Method of Visualization. Propellants, Explosives and Pyrotechnics, Vol. 18, p. 29.

ERDC TR-08-1 10-27
20. Lussier, L.S., H. Gagnon, and M.A. Bohn (2000) On the Chemical Reactions of Diphenylamine and Its Derivatives with Nitrogen Dioxide at Normal Storage Temperature Conditions. Propellants, Explosives and Pyrotechnics, Vol. 25, p. 177.
21. Etnier, E. (1987) Water Quality Criteria for 2,4-Dinitrotoluene and 2,6-Dinitrotoluene. Final Report, Oak Ridge, Tennessee. ORNL-6312.
22. Agency for Toxic Substances and Disease Registry, (1999), CAS#121-14-2 and 606-20-2.
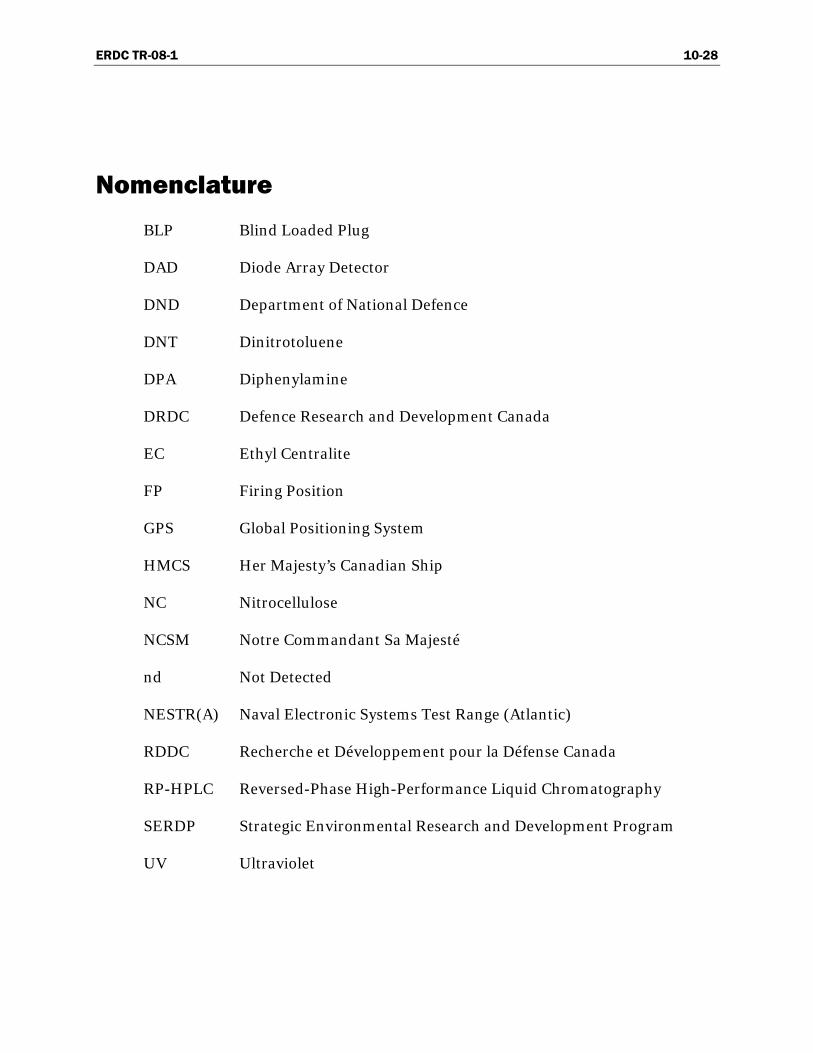
ERDC TR-08-1 10-28
Nomenclature
BLP Blind Loaded Plug
DAD Diode Array Detector
DND Department of National Defence
DNT Dinitrotoluene
DPA Diphenylamine
DRDC Defence Research and Development Canada
EC Ethyl Centralite
FP Firing Position
GPS Global Positioning System
HMCS Her Majesty’s Canadian Ship
NC Nitrocellulose
NCSM Notre Commandant Sa Majesté
nd Not Detected
NESTR(A) Naval Electronic Systems Test Range (Atlantic)
RDDC Recherche et Développement pour la Défense Canada
RP-HPLC Reversed-Phase High-Performance Liquid Chromatography
SERDP Strategic Environmental Research and Development Program
UV Ultraviolet

ERDC TR-08-1 11-1
— Chapter 11 —
Characterization of Air Emissions from Artillery Live Firing of LG1 Mark II
105-mm and M777 155-mm Howitzers
ISABELLE POULIN, EMMANUELA DIAZ, AND BERNADETTE QUÉMERAIS
Abstract
Military training is essential to ensure the readiness of our troops for po-tential missions. There is a growing interest from Department of National Defence leaders and the general population to evaluate the impacts of training on the environment. During the last 10 years, characterization protocols have been developed to assess the energetic materials contami-nation in soil, biomass, and water. Recently, efforts were focused on firing positions where soil and biomass have shown gun propellant residues, such as 2,4-dinitrotoluene (2,4-DNT) and nitroglycerin (NG). Propellant residues accumulate at the firing position, indicating that they must be present in the emission plume released upon firing. In order to complete the studies on the impacts of military activities, it was judged imperative to characterize the air quality during live firing. The combustion of propel-lants might lead to the gaseous dispersion of energetic materials and of other by-products, such as toxic gases and particulate matter (PM).
This chapter describes the work done at DRDC Valcartier in collaboration with DRDC Toronto to study the impacts of live-firing activities on air quality. During live-firing training exercises in Canadian Forces Base (CFB) Valcartier in November 2006 and January 2007, the airborne par-ticles and/or gaseous compounds emitted at the muzzle of two different guns, i.e., the LG1 Mark II 105-mm and the M777 155-mm howitzers, were studied. The different sampling strategies, analysis of samples, and results

ERDC TR-08-1 11-2
obtained are presented. Samples were collected for particulate matter, hy-drogen cyanide, polycyclic aromatic hydrocarbons (PAHs), dinitrotoluene compounds, benzene, toluene, ethylbenzene and xylenes, metals, alde-hydes, nitric acid, nitric oxide, nitrogen dioxide, hydrogen sulphide, and sulphur dioxide. Particulate matter was collected on monitoring cassettes and analyzed by a scanning electron microscope equipped with an energy dispersive X-ray spectrometer. The gaseous compounds were sampled us-ing sorbent tubes.
For both guns, results showed that particulate matter covers a wide range of sizes, with a high concentration of fine particulates (diameter < 2.5 µm). As the aim of this work was to characterize the particulate matter and to collect gases in the emission plume, the sampling setups were located downwind within the smoke plume as close as possible to the guns, con-sidering safety and access limitation. The inlets of the sampling material were not placed in the breathing zone of the military personnel and the sampling was not done according to the standard procedures for exposure assessment, thus it is important to note that the concentration of particu-late matter calculated is not representative of the exposure of the artillery personnel, and comparison with the guidelines is tentative and is meant to estimate possible rather than actual risks. For both studies, the PM con-centrations were found to be higher than the recommended environmental standards and formaldehyde was detected during the trial with the M777 155-mm howitzer. For all substances, it is recommended that further in-vestigations of air concentrations be made to properly assess the soldiers’ personal exposure.

ERDC TR-08-1 11-3
Introduction
Defence Research and Development Canada - Valcartier (DRDC Valcar-tier) is committed to sustainable training for the Canadian military activi-ties. DRDC Valcartier has been involved during the last years in a large characterization program of the major army training ranges [1–10] in order to evaluate the impacts of the dispersion of ammunition residues. These impacts are now well documented and understood. Many types of soil, biomass, and water samples were collected. Recently, efforts were focused on firing positions, where detectable levels of gun propellant resi-dues, such as 2,4-dinitrotoluene (2,4-DNT) and nitroglycerin (NG) were found [11–13]. Since propellant residues accumulate at the firing positions, it indicates that they are present in the gaseous plume released upon fir-ing, before being deposited and sampled. In order to completely assess the impacts of military activities, it was judged imperative to evaluate the air quality during exercises, as not only energetic material, but other prod-ucts, such as toxic gases, may be emitted at the firing position.
In the late 1990s, the USAEC (United States Army Environmental Center) initiated a program to identify the emissions resulting from range opera-tions that involve weapons firing, smoke and pyrotechnic devices, and ex-ploding ordnance, and to assess the environmental and health impacts re-sulting from their use. The work, conducted with the EPA (Environmental Protection Agency), used different munitions test facilities (at US Army Aberdeen Test Center [14]), such as test chambers, blast spheres, and bangboxes, to sample and analyze emitted products. The results of these tests led to the calculation of emission factors that were published in the USEPA Compilation of Air Pollutant Emission Factors (AP-42)[15].
Researchers have already begun to study some of the emissions caused by diverse military activities. In a report published by Harding Lawson Asso-ciates [16], they proposed to sample and assess the air quality during the removal activities of unexploded ordnance and explosives (UXO) at the closed Fort Ord (California, USA). These removal activities consist of first burning a localized area to remove vegetation from the firing ranges, thus allowing subsequent cleanup of unexploded munitions on the firing ranges by activities such as open detonation. Burning of the vegetation may result in incidental explosion of some UXO. Concerns about possible adverse
ERDC TR-08-1 11-4
health effects from inhalation of the smoke from these prescribed burns prompted the Army to undertake an extensive air monitoring evaluation during the burning to quantify potential air contaminants and concentra-tions in the surrounding communities. The target analytes in this study were semi-volatile organic compounds (SVOCs) and volatile organic com-pounds (VOCs), energetic materials, and metals in the form of airborne particles (PM: particulate matter). Several contaminants were detected [17], among them, aluminum and acrolein were detected above their re-spective health comparison value. Particulate matter of diameter < 10 µm (PM10, the category of PM that enters the respiratory tract and can travel to the lungs) was also detected at a concentration above the health com-parison value.
Spicer and collaborators [18] studied the air emissions from different mu-nitions used on range at the point of discharge and at the point of impact. Many compounds such as polycyclic aromatic hydrocarbons (PAHs), met-als, and VOCs were selected for measurement. Benzene and formaldehyde were among the compounds detected.
The emissions of different pollutants (gases and PM) during live-firing ac-tivities and controlled burning operations were studied at the Kakua Mili-tary Reservation [19-20]. Among the VOCs detected, acetone, dichloro-methane, and toluene were the most frequently detected. For particulate metals, aluminum, barium, chromium, magnesium, nickel, lead, and zinc were detected. In the sulphur gases category, only carbonyl sulphide was observed. Fine particulate matter (≤ 2.5 µm in diameter, PM2.5) and coarse particulate matter (≤ 10 µm in diameter, PM10) were detected at concen-trations below the national ambient air quality standards in North Amer-ica [21]. Although they were expected, the following compounds were not detected: SVOCs, explosives and energetic compounds, chlorinated herbi-cides, dioxins and furans, and cyanide.
Two years ago, DRDC Valcartier began to assess the dispersion of gun residues at firing points during a 105-mm howitzer live-firing exercise [22]. Residues of nitrocellulose fibers collected in front of the gun muzzle showed measurable amounts of 2,4-DNT [22].
After discussions with the gunners, DRDC Valcartier researchers felt that the gunners may be affected by the gaseous emissions produced by gun firings. In addition, the researchers were concerned about the size of the

ERDC TR-08-1 11-5
particles emitted during gun firing. It was then decided to characterize the gaseous emissions, as well as the particle size distribution and composi-tion during live artillery gun firing. Since researchers at DRDC Valcartier did not have the capability to perform gas sampling and analysis, they ini-tiated a joint project with DRDC Toronto researchers, who are specialized in occupational health. The Deployable Health Hazards Assessment Team (DHHAT) at DRDC Toronto has the capacity to perform air measurements for a variety of substances using sorbent tubes, filters, or direct reading instruments.
In September 2006, DRDC Valcartier studied the particles and gaseous emissions from firing the 105-mm howitzer artillery gun C3 in a closed vessel and in the open atmosphere at the Munitions Experimental Test Centre (METC) in Nicolet, Quebec, and demonstrated that propellant resi-dues are deposited into the environment following gun firing [23]. Chapter 7 by G. Ampleman in this SERDP report describes this trial. Samples were also analyzed for hydrogen cyanide, nitroaromatic compounds, dinitro-toluene compounds, benzene, ethyl benzene, toluene and xylenes, nitrogen oxides and sulphur dioxide, and particulate matter, including size distribu-tion. Results showed that the atmospheric emissions contain toxic com-pounds; it was therefore decided to further investigate atmospheric emis-sions due to live gun firing.
As the chemical and thermodynamic properties of the combustion of pro-pellant depends on the chemical composition of the propellant, the charge, and the weapon used, different gaseous and particulate matter emissions are expected for the different guns. Also, as gases and particulate matter may be transported long distances, depending on weather conditions, it is important to have a better knowledge of the chemical composition of the plume. In the case of measuring quantities of potentially toxic gases, fur-ther studies may be needed to assess whether the military personnel are exposed to health risks. Exposure to PM may also be of potential risk and is of high interest.
The objective of this work was to characterize the airborne particulate matter emitted at the muzzle of two widely used guns, namely the LG1 Mark II 105-mm and the M777 155-mm howitzers during live-firing activi-ties. The gaseous emissions at the muzzle of the M777 155-mm gun were also studied. The gases emitted at the muzzle of the LG1 Mark II 105-mm were not studied as no sampling material for gases was available at the
ERDC TR-08-1 11-6
time of the trial. Although it is possible that the products emitted in the air during firing activities come into contact with the people, the assessment of military personal exposure to diverse contaminants does not fall within the competence of DRDC Valcartier and it was not assessed for any of the exercises.
The intent of this work was to develop a better understanding of the parti-cles and gaseous emissions and also to lead to the development of solu-tions to mitigate the potential impacts on the environment. Furthermore, it is of great interest to DRDC Valcartier to understand the combustion of propellants during live firing since they are developing the weapons of the future. The information gathered by this experiment will serve to assist in the development of better formulations of energetic materials. This work was co-funded by the Sustain Trust from Defence Research and Develop-ment Canada (DRDC) and by the Strategic Environmental Research and Development Program (SERDP) of the United States through project ER-1481.

ERDC TR-08-1 11-7
Experimental Methods
The atmospheric emissions (particulate matter and/or gases) from two distinct types of weapons were studied. The first weapon studied was the LG1 Mark II 105-mm howitzer, the second was the M777 155-mm howit-zer. Both trials were held at Canadian Force Base (CFB) Valcartier, in No-vember 2006 (LG1 Mark II 105-mm howitzer) and in January 2007 (M777 155-mm howitzer). DRDC Valcartier was responsible for coordinating with the artillery unit and sampling and analysis of the particulate matter and energetic materials. DRDC Toronto was in charge of gaseous compounds sampling and analysis for the 155-mm exercise. Airborne particles were collected using monitoring cassettes and a cascade impactor. Gaseous compounds were collected with sorbent tubes. This section describes the weapons and the live-fire exercises, followed by the parameters and sam-pling methods used during the trials. Finally, the analytical methods are presented.
Weapons Description and Propellants Composition
LG1 Mark II 105-mm Howitzer
Canadian Forces are using three types of 105-mm howitzers: C1, C3, and LG1 Mark II, the latter being used during this study and shown in Figure 11-1 [2423]. These three howitzers can be used for direct or indirect fire and can be elevated at high angles to reach targets hidden from flat trajec-tory guns.
The LG1 Mark II [25] is a light (1500 kg) howitzer manufactured by GIAT of France, and is fitted with a 30-caliber progressive right-hand twist bar-rel (1:20 increasing to 1:18). The barrel has 32 grooves and is fitted with a muzzle brake. The weapon can be reconfigured for towing by reversing and locking the barrel, and is light enough for tactical air lift by medium transport helicopter or for air dropping as a complete unit during rapid deployments and operations. The LG1 Mark II is manually operated, singly loaded, has a semi-automatic vertical sliding breech block, and fires both standard (M67 charge) and extended range ammunition. Maximum range is 11.2 km with high explosive (HE) M1 and 18.5 km with HE C132 ex-tended range.
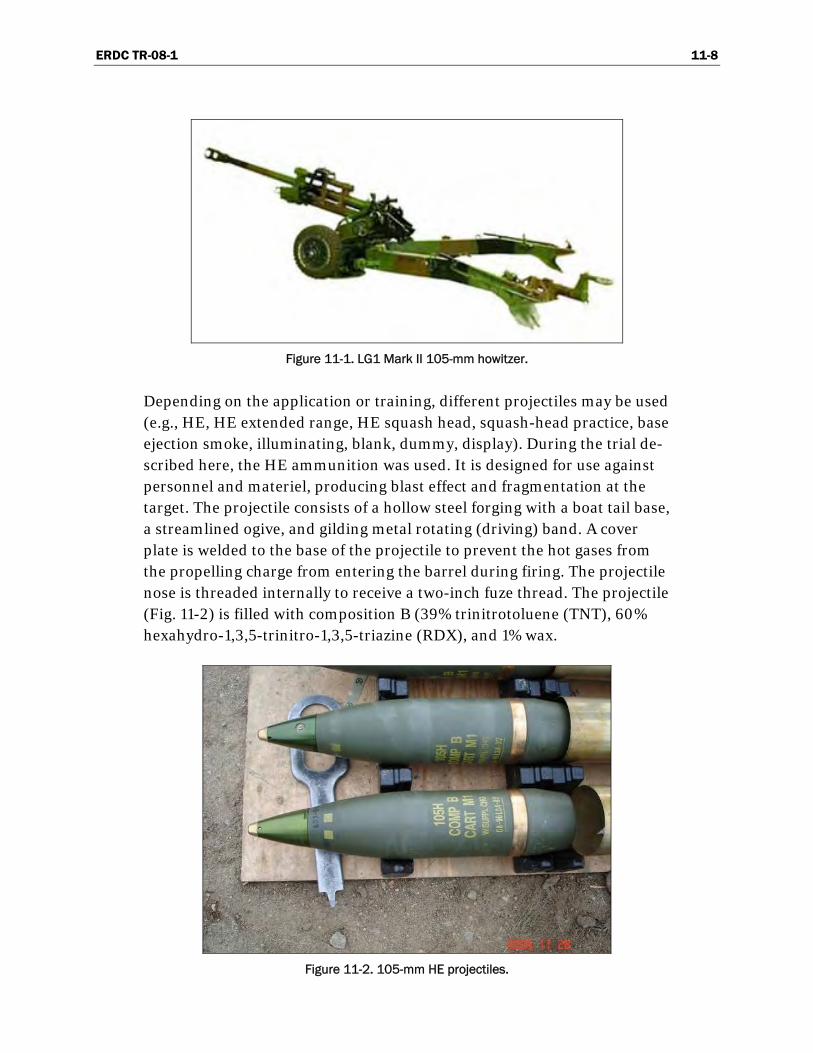
ERDC TR-08-1 11-8
Figure 11-1. LG1 Mark II 105-mm howitzer.
Depending on the application or training, different projectiles may be used (e.g., HE, HE extended range, HE squash head, squash-head practice, base ejection smoke, illuminating, blank, dummy, display). During the trial de-scribed here, the HE ammunition was used. It is designed for use against personnel and materiel, producing blast effect and fragmentation at the target. The projectile consists of a hollow steel forging with a boat tail base, a streamlined ogive, and gilding metal rotating (driving) band. A cover plate is welded to the base of the projectile to prevent the hot gases from the propelling charge from entering the barrel during firing. The projectile nose is threaded internally to receive a two-inch fuze thread. The projectile (Fig. 11-2) is filled with composition B (39% trinitrotoluene (TNT), 60% hexahydro-1,3,5-trinitro-1,3,5-triazine (RDX), and 1% wax.
Figure 11-2. 105-mm HE projectiles.

ERDC TR-08-1 11-9
Figure 11-3. M67 propelling charges (105 mm).
During this trial, the HE ammunition was fired downrange with an M67 charge, shown in Figure 11-3, which consists of approximately 1.28 kg of

ERDC TR-08-1 11-10
M1 single-base propellant, divided into seven increment charges, as shown in Table 11-1. That allows the withdrawal of one or more bags to adjust the charge depending on the position of the target. The propellant for each charge increment is loaded into a polyester-viscose rayon cloth bag marked with the increment (charge) number and the lot number of the enclosed propellant. Charges 1 and 2 use 0.38-mm (FNH.015 inch) single-perforation type-II propellant for quick burning. Charges 3 to 7 use 0.71-mm (FNH.025 inch) multi-perforated (seven hole) type-I propellant for slower burning. The amount of explosive in each bag for an HE, M1 projec-tile is shown in Table 11-2. Note that Charge 5 incorporates a piece of lead foil 114 mm × 198 mm × 0.05 mm as a decoppering agent.
Table 11-1. M1 propellant composition.
Constituents Proportions
(%)
Nitrocellulose 85 ± 2
2,4-DNT 10 ± 2
Dibutylphthalate 5 ± 1
Diphenylamine (added) 0.9 ± 1.2
Potassium sulphate (added) 1 ± 0.3
Moisture 0.6 ± 0.2
Residual solvent 0.7 maximum
Total volatiles 1.5 maximum
Table 11-2. Propelling charge M67.
Charge Mass of propellant
(kg)
1 0.245
2 0.040
3 0.072
4 0.110
5 0.114
6 0.260
7 0.406
One of the major problems related with the propellant charges in bags is that the unused bags have to be destroyed on site. This is done by burning the bags on the ground and this procedure has been proven to be a source

ERDC TR-08-1 11-11
of pollution. This is being investigated at DRDC Valcartier by Diaz et al. and a report will soon be published.
M777 155-mm Howitzer
The 155-mm M777 howitzer (Fig. 11-4) [26] is a lightweight (4208 kg) towed system adopted by the Canadian Forces in November 2005, replac-ing the former self-propelled, tracked M109-series medium howitzer. It is US-built, has optimized, digitized fire control, and is highly mobile and air-transportable. The 39-caliber 155-mm barrel has a 19 L chamber, which can accept all US and NATO standard 155-mm projectiles and charges (including modular charge artillery system [MACS], which will not be described here), as well as new families of precision munitions. This type of gun has a minimal range of 2.6 km and a maximal range of 30 km.
Figure 11-4. M777 155-mm howitzer.
The 155-mm ammunition consists of the projectile, fuze, propelling charge, and primer. All components are stored and issued separately (except for certain packs of propelling charges that include their primers). Depending on the application or training, different projectiles may be used, as HE, illuminating, or dummy. The propelling charges used during this exercise come in increments (bags) to provide overlaps in range coverage and the range of firing is dictated by the number of bags used. Unlike the 105-mm ammunition, the 155-mm does not have a lead foil in-side any bags. The propellant used is the M1 and the projectile (Fig. 11-5) is filled with composition B. All the charges are loaded to permit the with-drawal of the increments bags without disturbing the base charge.

ERDC TR-08-1 11-12
Figure 11-5. 155-mm HE projectiles.
Figure 11-6. Emissions at the muzzle of the gun of the M777 155-mm howitzer.
As the aim of this work is to sample the airborne particles in the plume created at the muzzle of the gun following firing, as shown in Figure 11-6, the type of projectile used is of no interest in our case—only the type of
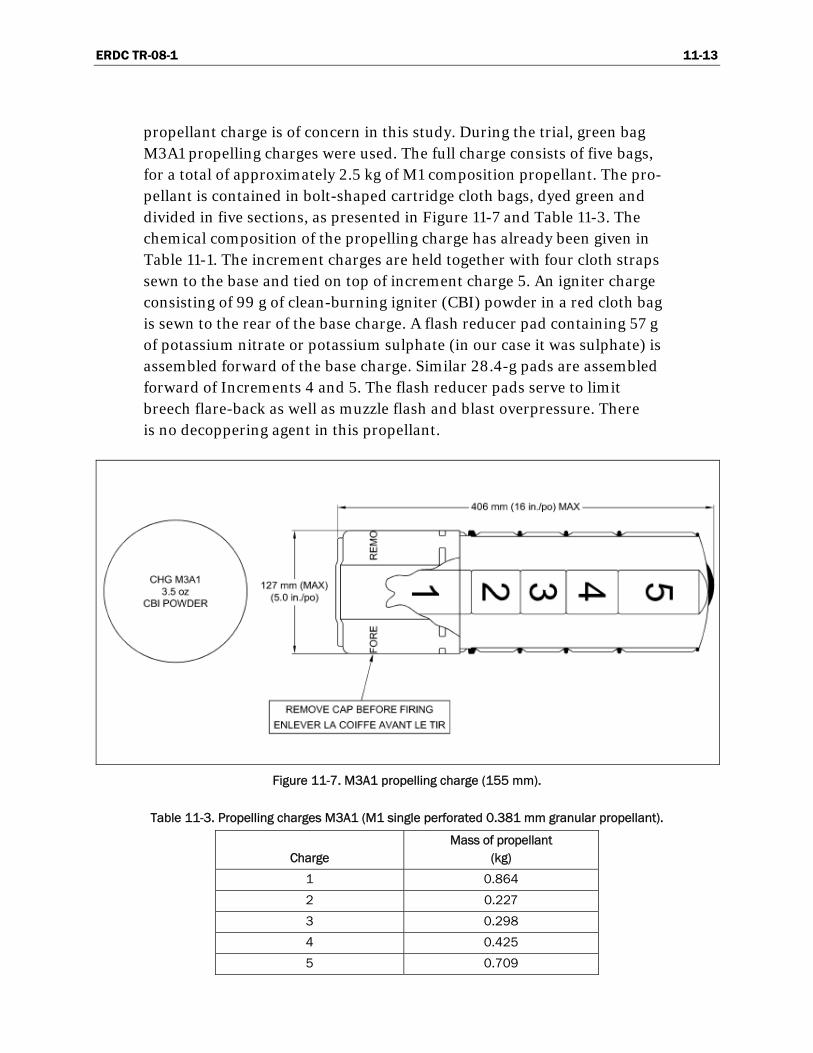
ERDC TR-08-1 11-13
propellant charge is of concern in this study. During the trial, green bag M3A1 propelling charges were used. The full charge consists of five bags, for a total of approximately 2.5 kg of M1 composition propellant. The pro-pellant is contained in bolt-shaped cartridge cloth bags, dyed green and divided in five sections, as presented in Figure 11-7 and Table 11-3. The chemical composition of the propelling charge has already been given in Table 11-1. The increment charges are held together with four cloth straps sewn to the base and tied on top of increment charge 5. An igniter charge consisting of 99 g of clean-burning igniter (CBI) powder in a red cloth bag is sewn to the rear of the base charge. A flash reducer pad containing 57 g of potassium nitrate or potassium sulphate (in our case it was sulphate) is assembled forward of the base charge. Similar 28.4-g pads are assembled forward of Increments 4 and 5. The flash reducer pads serve to limit breech flare-back as well as muzzle flash and blast overpressure. There is no decoppering agent in this propellant.
Figure 11-7. M3A1 propelling charge (155 mm).
Table 11-3. Propelling charges M3A1 (M1 single perforated 0.381 mm granular propellant).
Charge Mass of propellant
(kg)
1 0.864
2 0.227
3 0.298
4 0.425
5 0.709

ERDC TR-08-1 11-14
As presented earlier, one of the major problems related with the regular propelling charges in bags is that the unused bags have to be destroyed on site. This is not an issue with the modular MACS charges.
Exercise Descriptions and Field Sampling Setups
LG1 Mark II 105-mm Howitzer
The trial with the LG1 Mark II 105-mm howitzer was conducted at CFB Valcartier on 28 November 2006 in training sector #14. The artillery setup included three howitzers disposed as shown in Figure 11-8 with their re-spective position as obtained with the Global Positioning System (GPS). When the sampling team arrived on site, the guns were already installed and firing. Gunners were placed as shown in Figure 11-9. As the military exercise began early in the morning, the total amount of ammunition available for firing was unknown, but during the sampling, 23 rounds were fired. The sampling media were all placed on the same table to facilitate moving them from one position to another.
Weather data were taken directly on site; the average temperature was 1.4°C and wind speed was about 4.6 km/h, with changing direction. Aver-age humidity was 41% and atmospheric pressure was 101.29 kPa.
In order to optimize sample collection, the sampling setup was placed downwind within the smoke plume as near as possible to the gun, consid-ering safety and access limitation. The two monitoring cassettes, the cas-cade impactor, and the pumps were placed and secured on a table. After firing five rounds, the best position to place it was evaluated by looking at the direction of the plume (Fig. 11-10). As the wind changed during the ex-ercise, the sampling station was moved three times to optimize the collec-tion (Fig. 11-11).
The information on the propelling charge used for each round shot is not available, but according to the discussions with the gunners, the majority were fired at Charge 6. It is important to note that the pumps were turned on and off many times during the day of the trial, in order to sample the air only during the firing periods (see Table 11-4 for the sampling dura-tion). The calculation of the particles concentration was not the average for an eight-hour period. If the pumps were turned on just before the be-ginning of the exercise and turned off at the very end, the sampling time would have been approximately 215 minutes.
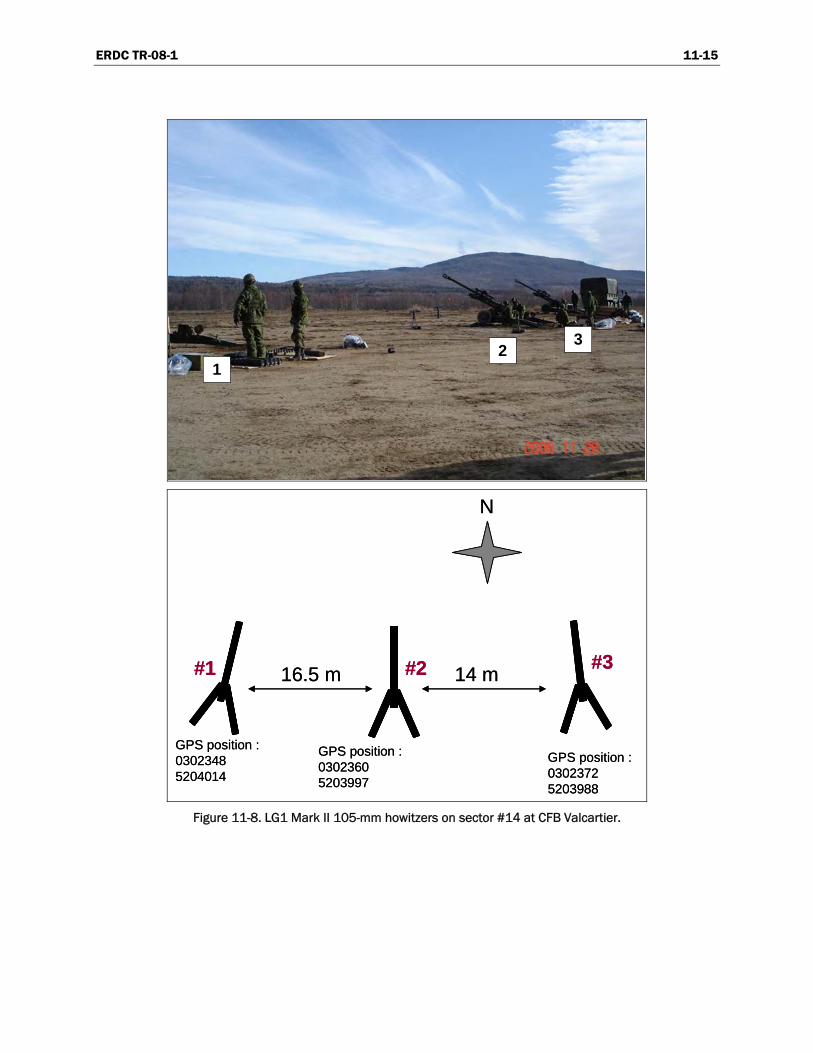
ERDC TR-08-1 11-15
12
3
12
3
GPS position : 03023605203997
16.5 m 14 m
GPS position : 03023485204014
GPS position : 03023725203988
#1 #2 #3
N
GPS position : 03023605203997
16.5 m 14 m
GPS position : 03023485204014
GPS position : 03023725203988
#1 #2 #3
N
Figure 11-8. LG1 Mark II 105-mm howitzers on sector #14 at CFB Valcartier.
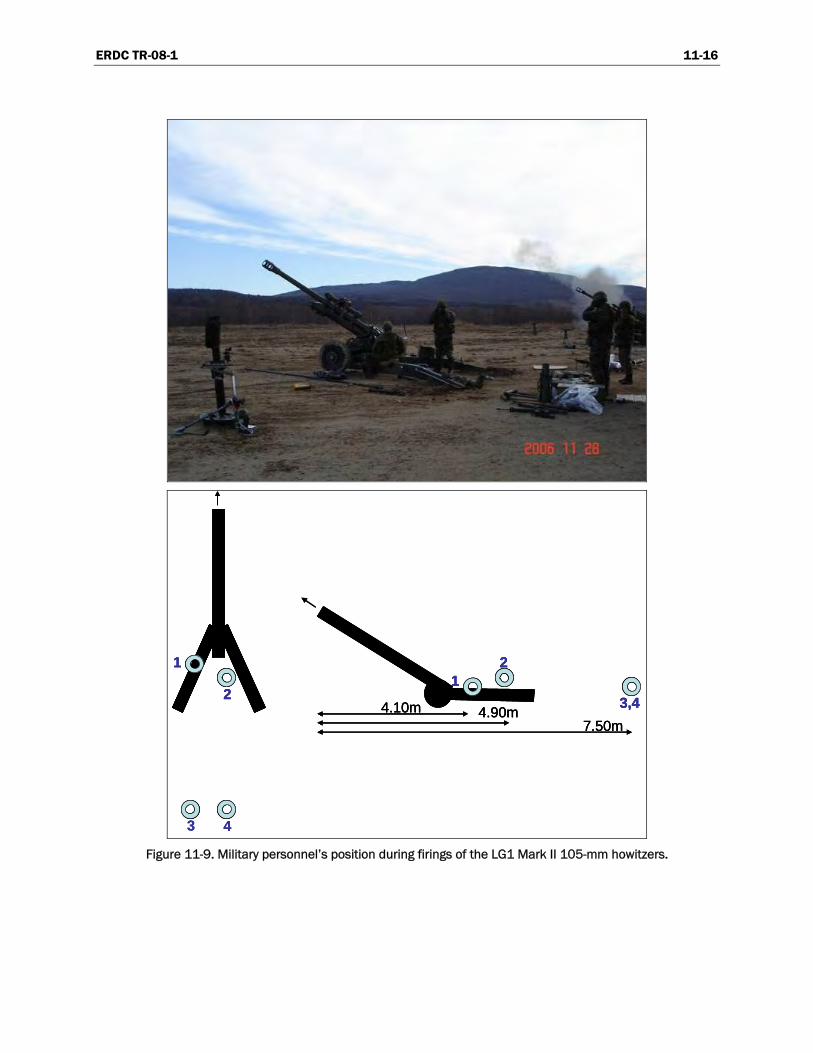
ERDC TR-08-1 11-16
3 4
1
21
2
3,44.10m 4.90m7.50m
3 4
1
21
2
3,44.10m 4.90m7.50m
1
21
2
3,44.10m 4.90m7.50m
Figure 11-9. Military personnel’s position during firings of the LG1 Mark II 105-mm howitzers.

ERDC TR-08-1 11-17
Figure 11-10. Plume created after the firing of the LG1 Mark II 105-mm howitzer.
GPS position : 03023485204014
GPS position : 03023605203997
16.5 m 14 m
GPS position: 03023725203988
#1 #2 #3
14.3mGPS position : 03023495203984
GPS position : 03023405204017
Table
GPS position : 03023425204003
6.5 m
Position C
Table
Position A
TablePosition B
5.5m
GPS position : 03023485204014
GPS position : 03023605203997
16.5 m 14 m
GPS position: 03023725203988
#1 #2 #3
14.3mGPS position : 03023495203984
GPS position : 03023405204017
Table
GPS position : 03023425204003
6.5 m
Position C
Table
Position A
TablePosition B
5.5m
Figure 11-11. Table setup for the firings of the LG1 Mark II 105-mm howitzers.
Even though the particulates are believed to be stable over time at various temperatures, the cascade impactor and monitoring cassettes were cov-ered after sampling, set in an upright position in a cooler, and kept at 4°C until analysis. Sampling conditions are summarized in Table 11-4.
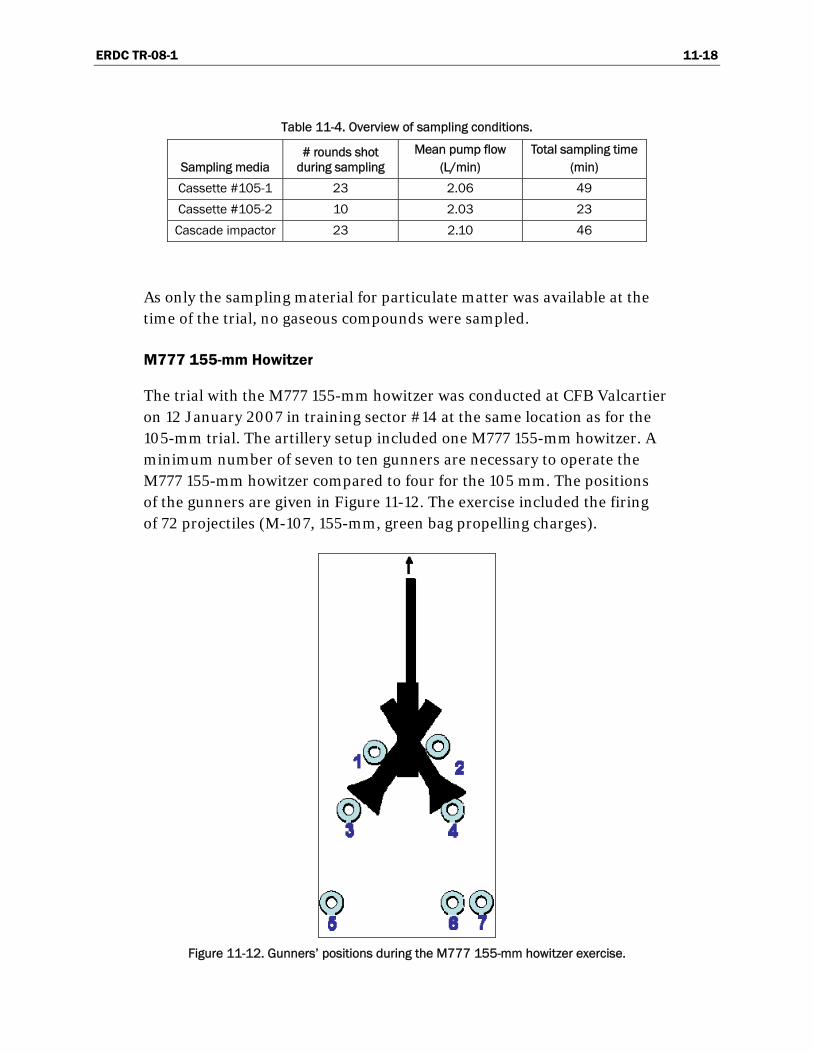
ERDC TR-08-1 11-18
Table 11-4. Overview of sampling conditions.
Sampling media # rounds shot
during sampling Mean pump flow
(L/min) Total sampling time
(min)
Cassette #105-1 23 2.06 49
Cassette #105-2 10 2.03 23
Cascade impactor 23 2.10 46
As only the sampling material for particulate matter was available at the time of the trial, no gaseous compounds were sampled.
M777 155-mm Howitzer
The trial with the M777 155-mm howitzer was conducted at CFB Valcartier on 12 January 2007 in training sector #14 at the same location as for the 105-mm trial. The artillery setup included one M777 155-mm howitzer. A minimum number of seven to ten gunners are necessary to operate the M777 155-mm howitzer compared to four for the 105 mm. The positions of the gunners are given in Figure 11-12. The exercise included the firing of 72 projectiles (M-107, 155-mm, green bag propelling charges).
Figure 11-12. Gunners’ positions during the M777 155-mm howitzer exercise.

ERDC TR-08-1 11-19
Weather data were taken directly on site; average temperature was –3°C and wind speed was very low, almost absent. Light snow was present for the entire sampling period.
Two sampling stations were prepared, each equipped with all the sampling pumps and media. In order to optimize sample collection, the two sam-pling setups had to be placed downwind within the smoke plume as near as possible to the gun, considering safety and access limitation. Because of the blast effect, it was imperative to position the sampling tables at a cer-tain distance from the gun. In addition, the tables could not be in the way of the gunners operating the gun. As we only had one cascade impactor, it was put on the nearest position from the gun on Sampling Station #1. As it was snowing, all the pumps were protected from the snow by putting them in plastic bags with the media outside of the bag and pointing toward the gun. One table was located on the left side of the gun at approximately 8 m from the gun, and the second one was located in the firing direction at ap-proximately 22 m from the gun (Fig. 11-13). Once the sampling setup was installed, as there was no wind, it was kept in place during the entire exer-cise.
27’ (8.2 m)
72’(21.9 m)
Station #2
Station #1
27’ (8.2 m)
72’(21.9 m)
Station #2
Station #1
Figure 11-13. Table setup for the M777 155-mm howitzer firings.

ERDC TR-08-1 11-20
All the rounds were fired at Charge 4, except three rounds that were fired at Charge 5. For this trial, the pumps were started just before the begin-ning of the firings and stopped at the end of the 72 rounds. This decision was taken after having sampled the particles for the LG1 Mark II 105-mm howitzer in November, where, as mentioned earlier, the pumps were stopped between each firing activity. By doing so, it was possible to collect the particles that were in suspension when the gun was not firing. Total sampling time was 170 minutes. After sampling, impactor and monitoring cassettes were closed hermetically and brought back to the lab in coolers. Samples for gas analysis were kept refrigerated and sent to the Clayton Group Services Inc. (Novi, Michigan and Atlanta, Georgia) laboratory for analysis. All other analyses were done by DRDC Valcartier. Pump flows for particles sampling are presented in Table 11-5.
Table 11-5. Pump flows for particles sampling.
Sampling media Mean pump flow
(L/min)
Cassette #155-1 (Station #1) 3.95
Cassette #155-2 (Station #2) 3.95
Cascade impactor 1.96
Parameters and Sampling Methods
Based on the previous trial in Nicolet [23] and on a study done in the United States on ammunition [27], it was decided to sample for the follow-ing parameters: PM, hydrogen cyanide, dinitrotoluene compounds, ben-zene, toluene, ethyl benzene and xylenes, nitrogen oxide, nitric oxide, sul-phur dioxide, nitric acid, hydrogen sulphide, PAHs, metals, and aldehydes. Two different sampling strategies for particulate matter were used during the trials. Monitoring cassettes were chosen to collect the total PM of size > 0.8 µm, and a cascade impactor was utilized to obtain the PM size distri-bution. As stated earlier, the gaseous emissions were not sampled during the LG1 Mark II 105-mm howitzer.
Total Particulate Matter
Total particulates were collected using a method derived from NIOSH method 0500 [28]. The suggested air monitoring filter was replaced by three-piece air monitoring cassettes, 37-mm assembled with a 0.8-µm GN-4 Metricel membrane (PALL Life Science) (Fig. 11-14a). The air pumps
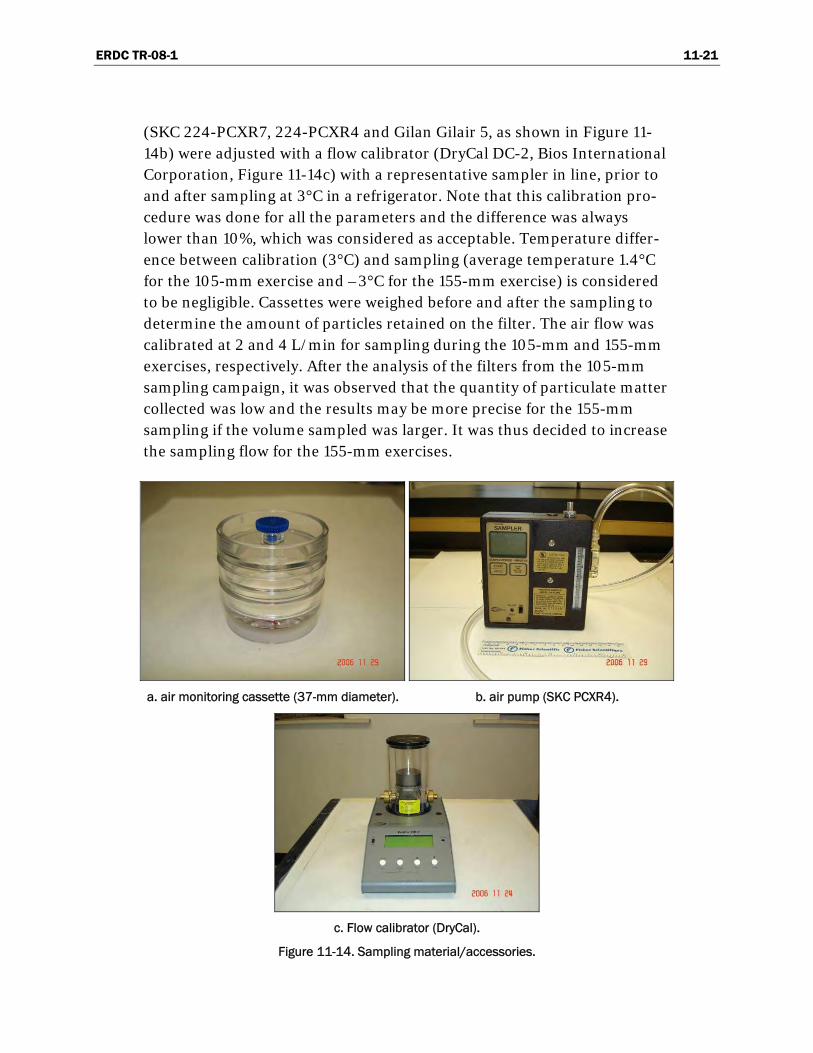
ERDC TR-08-1 11-21
(SKC 224-PCXR7, 224-PCXR4 and Gilan Gilair 5, as shown in Figure 11-14b) were adjusted with a flow calibrator (DryCal DC-2, Bios International Corporation, Figure 11-14c) with a representative sampler in line, prior to and after sampling at 3°C in a refrigerator. Note that this calibration pro-cedure was done for all the parameters and the difference was always lower than 10%, which was considered as acceptable. Temperature differ-ence between calibration (3°C) and sampling (average temperature 1.4°C for the 105-mm exercise and –3°C for the 155-mm exercise) is considered to be negligible. Cassettes were weighed before and after the sampling to determine the amount of particles retained on the filter. The air flow was calibrated at 2 and 4 L/min for sampling during the 105-mm and 155-mm exercises, respectively. After the analysis of the filters from the 105-mm sampling campaign, it was observed that the quantity of particulate matter collected was low and the results may be more precise for the 155-mm sampling if the volume sampled was larger. It was thus decided to increase the sampling flow for the 155-mm exercises.
a. air monitoring cassette (37-mm diameter). b. air pump (SKC PCXR4).
c. Flow calibrator (DryCal).
Figure 11-14. Sampling material/accessories.
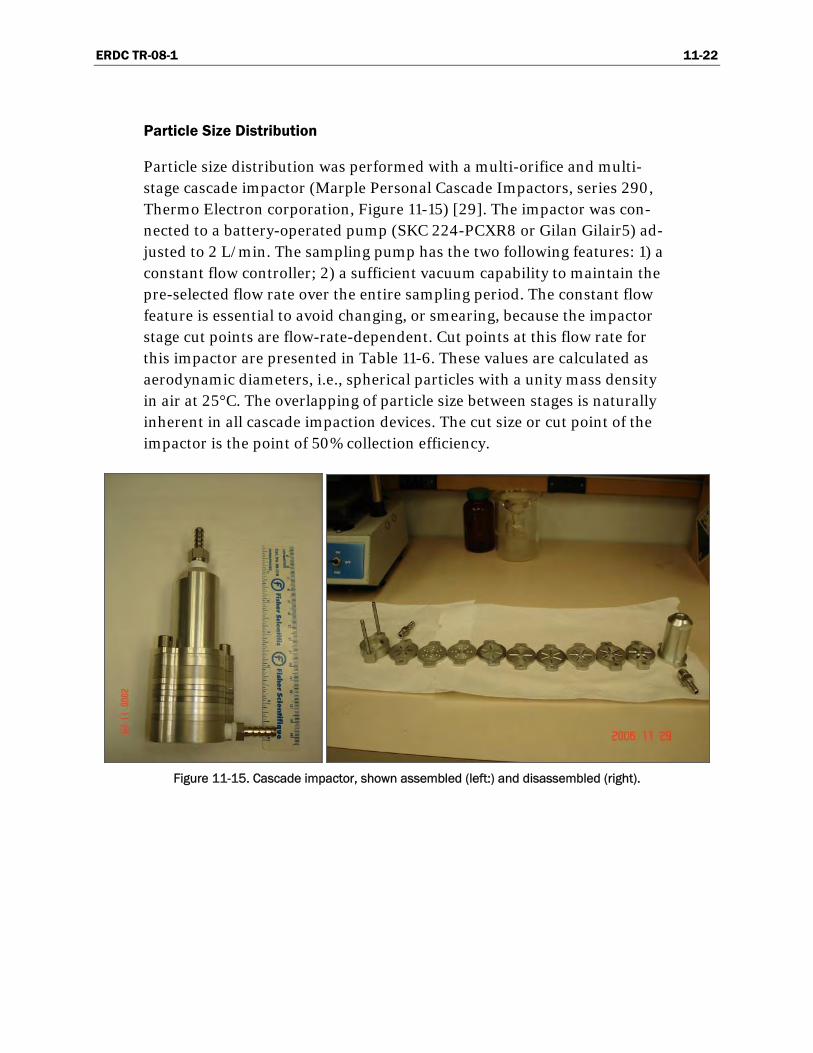
ERDC TR-08-1 11-22
Particle Size Distribution
Particle size distribution was performed with a multi-orifice and multi-stage cascade impactor (Marple Personal Cascade Impactors, series 290, Thermo Electron corporation, Figure 11-15) [29]. The impactor was con-nected to a battery-operated pump (SKC 224-PCXR8 or Gilan Gilair5) ad-justed to 2 L/min. The sampling pump has the two following features: 1) a constant flow controller; 2) a sufficient vacuum capability to maintain the pre-selected flow rate over the entire sampling period. The constant flow feature is essential to avoid changing, or smearing, because the impactor stage cut points are flow-rate-dependent. Cut points at this flow rate for this impactor are presented in Table 11-6. These values are calculated as aerodynamic diameters, i.e., spherical particles with a unity mass density in air at 25°C. The overlapping of particle size between stages is naturally inherent in all cascade impaction devices. The cut size or cut point of the impactor is the point of 50% collection efficiency.
Figure 11-15. Cascade impactor, shown assembled (left:) and disassembled (right).

ERDC TR-08-1 11-23
Table 11-6. Cut points for each stage of the cascade impactor [29].
Impactor stage Cut points
(µm)
1 21.3
2 14.8
3 9.8
4 6
5 3.5
6 1.55
7 0.93
8 0.52
Final stage (backup filter) 0 (plain filter)
Note: Flow rate at 2 L/min
Each pump is connected to the sampling material (cassette, impactor) with Tygon tubing (internal diameter ¼ inch). Figure 11-16 shows the tables used for sampling during the 105- and 155-mm exercises, respectively. In the case of the 105-mm exercise, only one sampling station was used, and in the case of the 155-mm exercise, two sampling stations were installed.
a. 105-mm exercise.
Figure 11-16. Sampling stations.

ERDC TR-08-1 11-24
b. 155-mm exercise.
Figure 11-16 (cont’d). Sampling stations.
Gaseous Compounds
Hydrogen Cyanide
Particulate and gaseous hydrogen cyanide samples were collected and ana-lyzed according to NIOSH method 7904 [28]. Particulate samples were collected on a 0.8-µm PVC membrane and gaseous samples were collected using a bubbler filled with 15 mL of a 0.1 N KOH solution. We used a Gi-lair5 sampling pump set at a flow rate of 1 L/min. Immediately after sam-pling, the KOH solution was transferred into a glass vial to be sent for analysis. Analysis was performed using an ion-specific electrode.
Dinitrotoluene Compounds
Samples were collected and analyzed for 2,4-DNT and 2,6-DNT using a modified OSHA method 44 [30–31]. Briefly, samples were collected using Tenax sorbent tubes. After extraction with acetonitrile, samples were ana-lyzed by high-pressure liquid chromatography with an ultraviolet detector (HPLC/UV), based on method EPA 8330b [32]. Analyses were performed with a HPLC Agilent HP 1100 equipped with a degasser G1322A, a quater-nary pump model G1311A, an autosampler G1313A, and a UV diode array

ERDC TR-08-1 11-25
detector model G1315A monitoring at 250 nm (2,4-DNT) and 205 nm (2,6-DNT). The injection volume was 20 μL and the column was a Supel-cosil LC-8 (25 cm × 3-mm × 5 μm) eluted with 15:85 isopropanol/water (v/v) at a flow rate of 0.75 mL/min. The column temperature was main-tained at 25° C during the analysis. Standards and solvents were diluted 1:1, acetonitrile to water (0.5 mL Acn /0.5 mL water). The sampling pump was a Gilair5 set at a flow rate of 1 L/min.
Benzene, Toluene, Ethyl Benzene and Xylenes
Samples were collected and analyzed using OSHA method 7 [30]. Samples were collected on a charcoal sorbent tube. After extraction by CS2, samples were analyzed using a GC/FID. Samples were analyzed for benzene, tolu-ene, ethyl benzene, and total xylenes. The sampling pump was a LSF-113 low-flow sampling pump from Sensidyne operating at a flow rate of 0.2 L/min.
Nitric Oxide and Nitrogen Dioxide
Nitric oxide (NO) and nitrogen dioxide (NO2) were analyzed using OSHA ID-190 [30]. The collection apparatus consists of two glass tubes filled with a triethanolamine-impregnated sieve separated by a tube containing an oxidizer. Nitrogen dioxide is retained on the first triethanolamine tube while nitric oxide passes through the oxidizer, is oxidized to nitrogen diox-ide, and is then retained on the second triethanolamine tube. After extrac-tion using a triethanolamine solution, the sample is analyzed as nitrite by ion chromatography. Samples were collected using LFS-113 low-flow sam-pling pumps from Sensidyne. The pumps were calibrated at 0.025 L/min.
Sulphur Dioxide
Samples were collected and analyzed according to OSHA method ID-200 [30]. The sulphur dioxide is retained on a glass tube filled with impreg-nated activated beaded carbon. The sample is desorbed using a sodium hydroxide solution that contains approximately 1% of hydrogen peroxide. The sample is analyzed as sulphate by ion chromatography. Samples were collected using LSF-113 sampling pumps set at 0.1 L/min.
Hydrogen Sulphide
Samples were collected and analyzed using NIOSH method 6013 [28]. Hydrogen sulphide is collected on a tube filled with coconut shell charcoal.

ERDC TR-08-1 11-26
After extraction with a solution of NH4OH and H2O2, an aliquot of the sample is analyzed as sulphate by ion chromatography. Samples were col-lected using Gilair5 sampling pumps set at 1.5 L/min.
Nitric Oxide
Samples were collected and analyzed using NIOSH method 7903 [28]. Ni-tric acid is collected on a tube filled with washed silica gel. After extraction with NaHCO3 and Na2CO3, the sample is analyzed as the anions (F–, Cl–, PO43–, Br–, NO3–, SO42–) by ion chromatography. Samples were collected using Gilair5 sampling pumps set at 0.5 L/min.
Polycyclic Aromatic Hydrocarbons (PAHs)
Samples were collected and analyzed using NIOSH method 5506 [28]. Particulate PAHs are collected on a 37-mm PTFE filter (2-µm pores) while gaseous PAHs are collected on a tube filled with HAD-2 resin. After extrac-tion of both particulate and gaseous samples with acetonitrile, PAH com-pounds are analyzed by HPLC equipped with a fluorescence/ultraviolet detector (fluorescence/UV). Samples were collected using Gilair5 sampling pumps set at 2 L/min. The list of gaseous and particulate PAHs analyzed by this method is given in Table 11-7.
Table 11-7. Polycyclic aromatic hydrocarbons analyzed in this study.
Acenaphthene Acenaphthylene
Anthracene Benzo(a)anthracene
Benzo(a)pyrene Benzo(b)fluoranthene
Benzo(e)pyrene Benzo(g,h,i)perylene
Benzo(k)fluoranthene Chrysene
Dibenzo(a,h)anthracene Fluoranthene
Fluorene Indeno(1,2,3-cd)pyrene
Naphthalene Phenanthrene
Pyrene

ERDC TR-08-1 11-27
Metals
Samples were collected and analyzed using NIOSH method 7300 [28]. Metals are collected on a 5-µm polyvinyl chloride membrane (PVC). After extraction with HNO3 and HClO4, the metals were analyzed by inductively coupled argon plasma atomic emission spectroscopy (ICP-AES). Samples were collected using Gilair5 sampling pumps set at 4 L/min. This method allowed for the determination of approximately 30 metals. However, some of them, such as calcium or sodium, were not of interest as they would not be toxic at airborne concentrations. The list of metals of interest is given in Table 11-8.
Table 11-8. Metals analyzed in this study.
Aluminum Arsenic
Cadmium Chromium
Cobalt Copper
Iron Lead
Manganese Nickel
Tin Titanium
Vanadium Zinc
Aldehydes
Samples were collected and analyzed using United States Environmental Protection Agency (US EPA) method TO-11A [33]. Aldehydes were col-lected on a tube filled with silica gel impregnated with 2,4-dinitrophenyl-hydrazine (DNPH). After extraction with acetonitrile, the DNPH deriva-tives were analyzed by HPLC equipped with a UV detector. Samples were collected using LSF-113 sampling pumps set at 0.5 L/min. The aldehydes analyzed by this method are listed in Table 11-9.

ERDC TR-08-1 11-28
Table 11-9. Aldehydes analyzed in this study.
2-Butanone Acetaldehyde
Acetone Benzaldehyde Butyraldehyde
Crotonaldehyde Formaldehyde Hexaldehyde Methacrolein
O,m,p-Tolualdehyde Pentanal (Valeraldehyde)
Propionaldehyde (Propanal)
Analytical Methods for Airborne Particles Characterization
Filters were weighed with a Mettler Toledo weighing scales AT400 (max weight 405 g, precision 0.1 mg) before and after sampling in order to de-termine the mass collected during the exercise. Knowing the volume of air sampled, this allowed the calculation of the airborne particles concentra-tion.
Particle size distribution, morphology, and chemical composition was studied by scanning electron microscopy (SEM). A portion of each filter and impaction substrate was analyzed with a JEOL JSM-840A microscope equipped with a NORAN energy dispersive X-ray spectrometer. In the case of the monitoring cassettes filters, SEM micrographs were taken at two different positions on the filter: 1) close to the center of the filter (blue arrow in Figure 11-17) and 2) close to the edge of the filter (red arrow in Figure 11-17). Figure 11-18 shows a clean monitoring cassette filter at a magnification of 5000×. The filter is a three-dimensional network of dis-organized fibers and their ends look like small bubbles. The manufacturer ensures an effective pore diameter of 0.8 µm. A brand new substrate from the cascade impactor was also analyzed by SEM, and the micrographs are shown in Figure 11-19 at different magnifications. The blank substrate looks like woven fibers.
Two imaging modes were used : 1) the secondary electron imaging mode (SE), which yields an image with a three-dimensional appearance (unless otherwise noted, the micrographs presented were obtained using this mode) and 2) the backscattered electron imaging mode (BEI), which yields
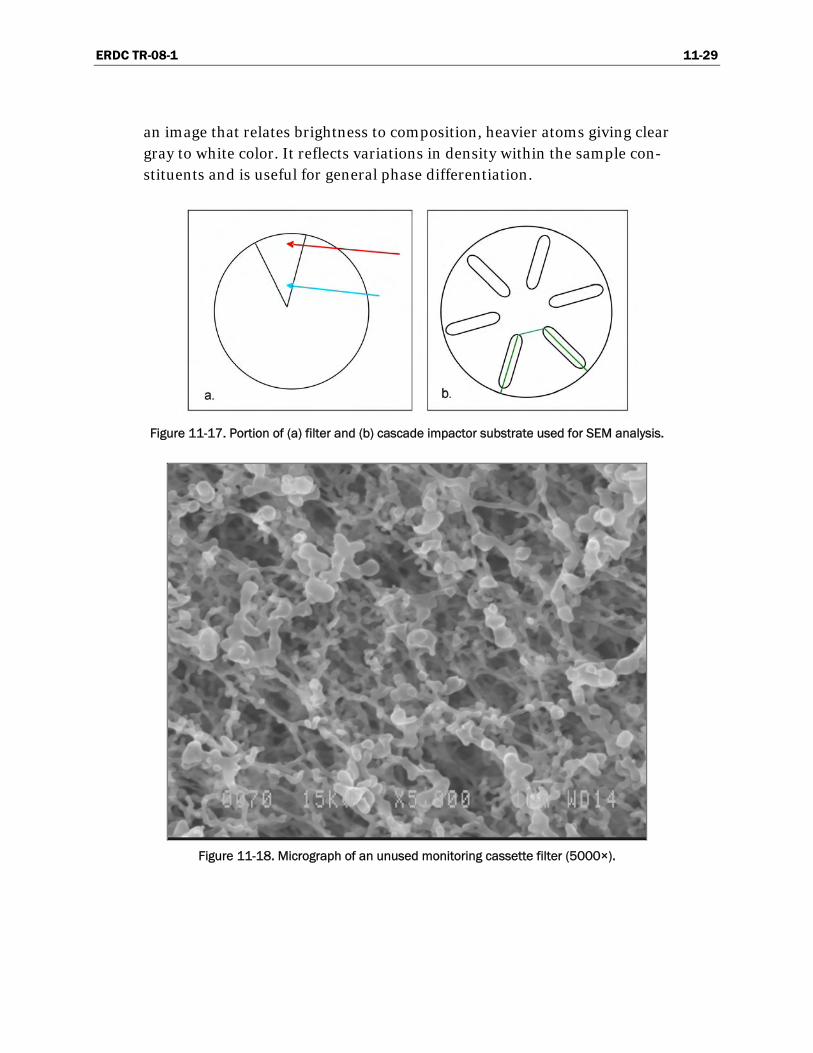
ERDC TR-08-1 11-29
an image that relates brightness to composition, heavier atoms giving clear gray to white color. It reflects variations in density within the sample con-stituents and is useful for general phase differentiation.
Figure 11-17. Portion of (a) filter and (b) cascade impactor substrate used for SEM analysis.
Figure 11-18. Micrograph of an unused monitoring cassette filter (5000×).

ERDC TR-08-1 11-30
a. 5,000×.
b. 500×.
c. 50×.
Figure 11-19. Micrographs of a blank cascade impactor substrate at various magnifications.

ERDC TR-08-1 11-31
The energy dispersive X-ray (EDX) spectrometer coupled to the micro-scope allows the qualitative determination of the chemical composition of the sample. Signals are obtained for elements ranging from C to U, the en-ergy of N being absorbed by a window in the microscope. No information on the oxidation state of the element is obtained. We cannot determine, for example, if carbon on the filter is organic or inorganic. A typical EDX spectrum is shown in Figure 11-20. Since the sample is coated with a layer of Au-Pd, we detect the characteristic X-rays of these elements in the EDX spectrum. The sample holder contributes a small amount to the Cu and Zn signals on some spectra. The list of the elements present will be given in the results section.
Figure 11-20. Typical EDX spectrum of particulate matter analysis.
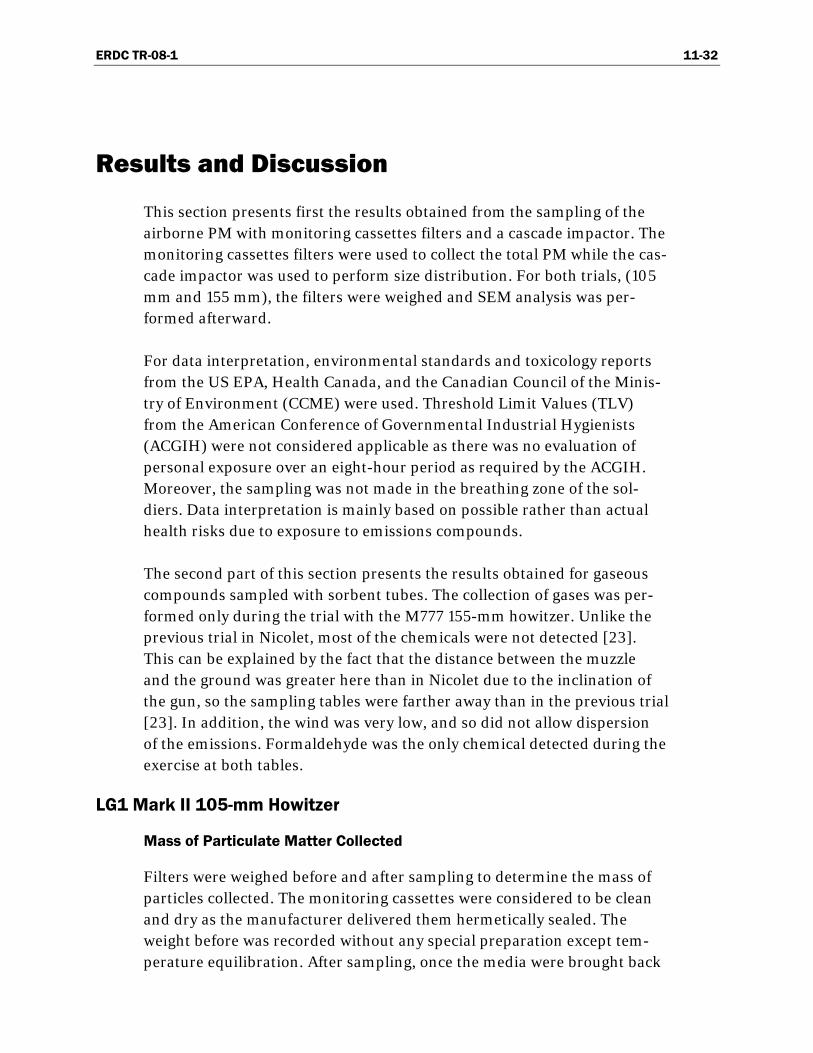
ERDC TR-08-1 11-32
Results and Discussion
This section presents first the results obtained from the sampling of the airborne PM with monitoring cassettes filters and a cascade impactor. The monitoring cassettes filters were used to collect the total PM while the cas-cade impactor was used to perform size distribution. For both trials, (105 mm and 155 mm), the filters were weighed and SEM analysis was per-formed afterward.
For data interpretation, environmental standards and toxicology reports from the US EPA, Health Canada, and the Canadian Council of the Minis-try of Environment (CCME) were used. Threshold Limit Values (TLV) from the American Conference of Governmental Industrial Hygienists (ACGIH) were not considered applicable as there was no evaluation of personal exposure over an eight-hour period as required by the ACGIH. Moreover, the sampling was not made in the breathing zone of the sol-diers. Data interpretation is mainly based on possible rather than actual health risks due to exposure to emissions compounds.
The second part of this section presents the results obtained for gaseous compounds sampled with sorbent tubes. The collection of gases was per-formed only during the trial with the M777 155-mm howitzer. Unlike the previous trial in Nicolet, most of the chemicals were not detected [23]. This can be explained by the fact that the distance between the muzzle and the ground was greater here than in Nicolet due to the inclination of the gun, so the sampling tables were farther away than in the previous trial [23]. In addition, the wind was very low, and so did not allow dispersion of the emissions. Formaldehyde was the only chemical detected during the exercise at both tables.
LG1 Mark II 105-mm Howitzer
Mass of Particulate Matter Collected
Filters were weighed before and after sampling to determine the mass of particles collected. The monitoring cassettes were considered to be clean and dry as the manufacturer delivered them hermetically sealed. The weight before was recorded without any special preparation except tem-perature equilibration. After sampling, once the media were brought back
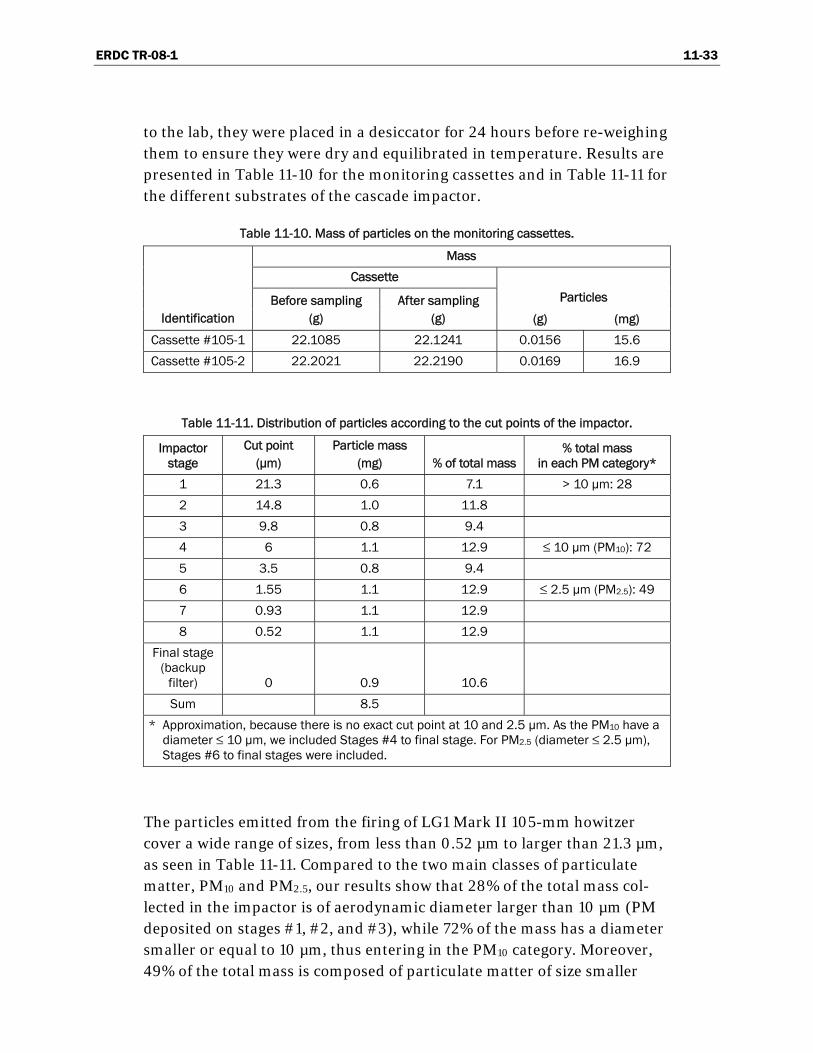
ERDC TR-08-1 11-33
to the lab, they were placed in a desiccator for 24 hours before re-weighing them to ensure they were dry and equilibrated in temperature. Results are presented in Table 11-10 for the monitoring cassettes and in Table 11-11 for the different substrates of the cascade impactor.
Table 11-10. Mass of particles on the monitoring cassettes.
Mass
Cassette
Particles
Identification Before sampling
(g) After sampling
(g) (g) (mg)
Cassette #105-1 22.1085 22.1241 0.0156 15.6
Cassette #105-2 22.2021 22.2190 0.0169 16.9
Table 11-11. Distribution of particles according to the cut points of the impactor.
Impactor stage
Cut point (µm)
Particle mass (mg) % of total mass
% total mass in each PM category*
1 21.3 0.6 7.1 > 10 µm: 28
2 14.8 1.0 11.8
3 9.8 0.8 9.4
4 6 1.1 12.9 ≤ 10 μm (PM10): 72
5 3.5 0.8 9.4
6 1.55 1.1 12.9 ≤ 2.5 μm (PM2.5): 49
7 0.93 1.1 12.9
8 0.52 1.1 12.9
Final stage (backup
filter) 0 0.9 10.6
Sum 8.5
* Approximation, because there is no exact cut point at 10 and 2.5 µm. As the PM10 have a diameter ≤ 10 µm, we included Stages #4 to final stage. For PM2.5 (diameter ≤ 2.5 µm), Stages #6 to final stages were included.
The particles emitted from the firing of LG1 Mark II 105-mm howitzer cover a wide range of sizes, from less than 0.52 µm to larger than 21.3 µm, as seen in Table 11-11. Compared to the two main classes of particulate matter, PM10 and PM2.5, our results show that 28% of the total mass col-lected in the impactor is of aerodynamic diameter larger than 10 µm (PM deposited on stages #1, #2, and #3), while 72% of the mass has a diameter smaller or equal to 10 µm, thus entering in the PM10 category. Moreover, 49% of the total mass is composed of particulate matter of size smaller

ERDC TR-08-1 11-34
than 2.5 µm (PM2.5). Stages #6 to final stage were included in the latter category.
As seen on Table 11-4, the pump duration and the number of rounds fired during sampling are the same for Cassette #105-1 and the cascade impac-tor, and their flow rate was almost the same. However, results (Tables 11-10 and 11-11) show that there is more mass deposited on the monitoring cassette #105-1 than on the cascade impactor. Results also show that the mass of particles was almost the same for both monitoring cassettes (Table 11-10), which is surprising because 23 rounds were fired while air was pumped through Cassette #105-1 whereas only 10 rounds were fired for Cassette #105-2 (Table 11-4). More mass was deposited on Cassette #105-2 even though it pumped for a shorter time. Both cassettes were located on the same table, at a distance less than 50 cm from each other. It is difficult to determine the reasons for this discrepancy. The clogging of the monitor-ing cassette or the sampling tube of material is not considered as a possi-ble cause for the difference in mass collected as the inlets were clean at the end of sampling period. It is possible that there was some residual humid-ity in the filter after sampling. It may also be possible that particles are not dispersed uniformly in the cloud, but further studies are needed to con-firm this assumption.
Despite the difference in mass sampled, the particle concentration in the plume was calculated, results being presented in Table 11-12. The concen-tration for the real sampling time, meaning the duration presented in Table 11-4 and the extrapolated value if we had not stopped the pumps during the firing sequence, was also calculated. As discussed earlier, if the pumps were started at the beginning of the exercise and stopped at its end, the sampling duration would have been approximately 215 min. If it was supposed that there are no particle emissions between the firings, the overall result of increasing the sampling time is a dilution of the calculated concentration, as the mass of particles would be the same, but the volume would be higher. The levels of exposure are usually presented as a mean over an eight-hour or a 24-hour period, not over a short exposure dura-tion. The values calculated are difficult to compare with the air quality guidelines because the latter are normalized on a 24-hour exposure dura-tion.

ERDC TR-08-1 11-35
Table 11-12. Calculated total particle concentration in the plume.
Particle concentration (mg/m3)
Sampling media Actual sampling time Extrapolated value
for 215 min of sampling
Cascade impactor 88 19
Monitoring cassette #105-1 150 35
Monitoring cassette #105-2 360 39
The simplest calculation of the concentration of the particulate matter over a 24-hour period, taking into account the same mass of PM, leads to a value between approximately 3 and 6 mg/m3. Those values still exceed the air quality guidelines presented in Table 11-13, which are 120 µg/m3 for total suspended particles for a 24-hour period. The other guidelines are 35 µg/m3 (24-hour) for PM2.5 and 150 µg/m3 for PM10. As stated earlier, as the sampling was not done in the breathing zone of the soldier and not ac-cording to the standard protocols, the direct comparisons with health cri-teria are tentative and will be used to estimate possible rather than actual risk. Since the particle concentrations exceed all the criteria, this may indi-cate a possible health concern for military personnel around the guns, but further investigation is clearly needed in order to assess the health risks. Background measurement should also be included in future trials.
Table 11-13. Recommendations for particulate matter concentration in ambient air.
Particle size US EPA [21]
(mg/m3) Health Canada [34]
(mg/m3) CCME [35] (mg/m3)
PM101 0.15
PM2.52 0.015
PM2.53 0.035 0.03
TSP4 0.07
TSP5 0.12
TSP6 0.40 1 Particulate Matter < 10 µm, 24-hour standard 2 Particulate Matter < 2.5 µm, annual standard 3 Particulate Matter < 2.5 µm, 24-hour standard 4 Total Suspended Particulate, annual standard, maximum acceptable level 5 Total Suspended Particulate, 24-hour standard, maximum acceptable level 6 Total Suspended Particulate, 24-hour standard, maximum tolerable level

ERDC TR-08-1 11-36
As one could expect from the previous results, the calculated particle con-centration varies a lot from one position in the smoke plume to another. This study is a first step in the study of particulate matter emissions from the live firing of the LG1 Mark II 105-mm howitzer. Another sampling campaign has to be performed in order to verify those results. The next campaign should also include the sampling of gaseous compounds present in the plume. In order to have more information on the chemical and morphological properties of the particles collected, the monitoring cas-settes filters and the substrate of the different stages of the cascade impac-tor were analyzed by SEM. The results of these analysis will be presented next.
With these results, it is impossible to calculate the contribution of emitted material from each round fired. One of the limitations of the actual trial is that the three LG1 Mark II 105-mm howitzers were firing at the same time, and the distribution of the particulate matter collected on the filters may be modified because of the overlapping of the plumes of the different how-itzers. For example, the large particles, having a higher inertia, are able to travel larger distances than fine particles. The rounds fired far from the monitoring cassettes may thus account for a disproportional number of large particles compared to the fine. Also, the total quantity of particles collected for each round is more likely higher for rounds fired closer to the cassettes. For the next campaign, it is suggested, if possible, to use only one howitzer. Also, since the plume dilutes quickly with distance from the source and the concentration is more likely uneven, many cassettes should be placed at different positions in the plume to better determine the mass emitted from each round fired.
Scanning Electron Microscopy
We analyzed particles emitted from firing the LG1 Mark II 105-mm howit-zer by SEM. As the intake of the monitoring cassettes is small compared to the diameter of the filter, our first objective was to determine whether the deposition of the particles was homogeneous on the filter. By observing particles at different positions on the filter, we concluded that there is no difference between the center and the edge of the filter. We also imaged the different stages of the cascade impactor with the SEM.
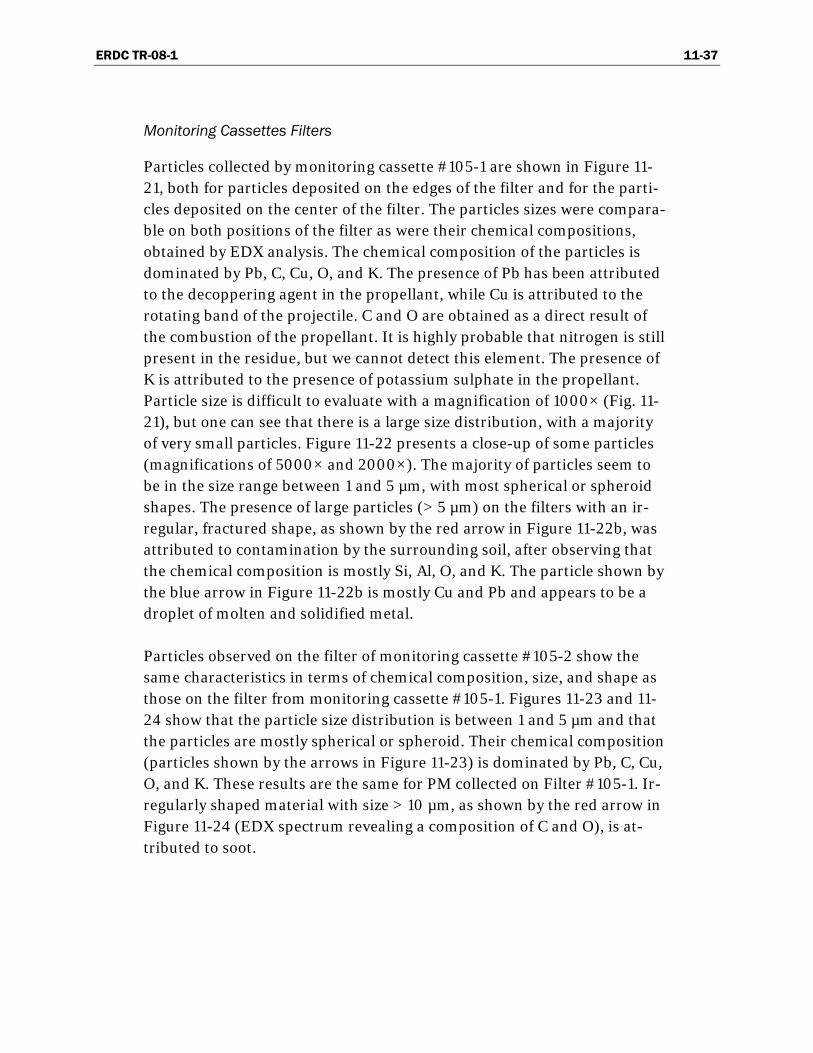
ERDC TR-08-1 11-37
Monitoring Cassettes Filters
Particles collected by monitoring cassette #105-1 are shown in Figure 11-21, both for particles deposited on the edges of the filter and for the parti-cles deposited on the center of the filter. The particles sizes were compara-ble on both positions of the filter as were their chemical compositions, obtained by EDX analysis. The chemical composition of the particles is dominated by Pb, C, Cu, O, and K. The presence of Pb has been attributed to the decoppering agent in the propellant, while Cu is attributed to the rotating band of the projectile. C and O are obtained as a direct result of the combustion of the propellant. It is highly probable that nitrogen is still present in the residue, but we cannot detect this element. The presence of K is attributed to the presence of potassium sulphate in the propellant. Particle size is difficult to evaluate with a magnification of 1000× (Fig. 11-21), but one can see that there is a large size distribution, with a majority of very small particles. Figure 11-22 presents a close-up of some particles (magnifications of 5000× and 2000×). The majority of particles seem to be in the size range between 1 and 5 µm, with most spherical or spheroid shapes. The presence of large particles (> 5 µm) on the filters with an ir-regular, fractured shape, as shown by the red arrow in Figure 11-22b, was attributed to contamination by the surrounding soil, after observing that the chemical composition is mostly Si, Al, O, and K. The particle shown by the blue arrow in Figure 11-22b is mostly Cu and Pb and appears to be a droplet of molten and solidified metal.
Particles observed on the filter of monitoring cassette #105-2 show the same characteristics in terms of chemical composition, size, and shape as those on the filter from monitoring cassette #105-1. Figures 11-23 and 11-24 show that the particle size distribution is between 1 and 5 µm and that the particles are mostly spherical or spheroid. Their chemical composition (particles shown by the arrows in Figure 11-23) is dominated by Pb, C, Cu, O, and K. These results are the same for PM collected on Filter #105-1. Ir-regularly shaped material with size > 10 µm, as shown by the red arrow in Figure 11-24 (EDX spectrum revealing a composition of C and O), is at-tributed to soot.

ERDC TR-08-1 11-38
a. Edge of filter.
Figure 11-21. Micrographs of particles collected on monitoring filter #105-1. Imaging modes and magnifications: SE 1,000× (top); BEI 1,000× (bottom).

ERDC TR-08-1 11-39
b. Center of filter.
Figure 11-21 (cont’d).

ERDC TR-08-1 11-40
a. Magnification: 5,000×.
b. Magnification: 2,000×.
Figure 11-22. Micrographs of particles collected at different positions on monitoring filter #105-1.
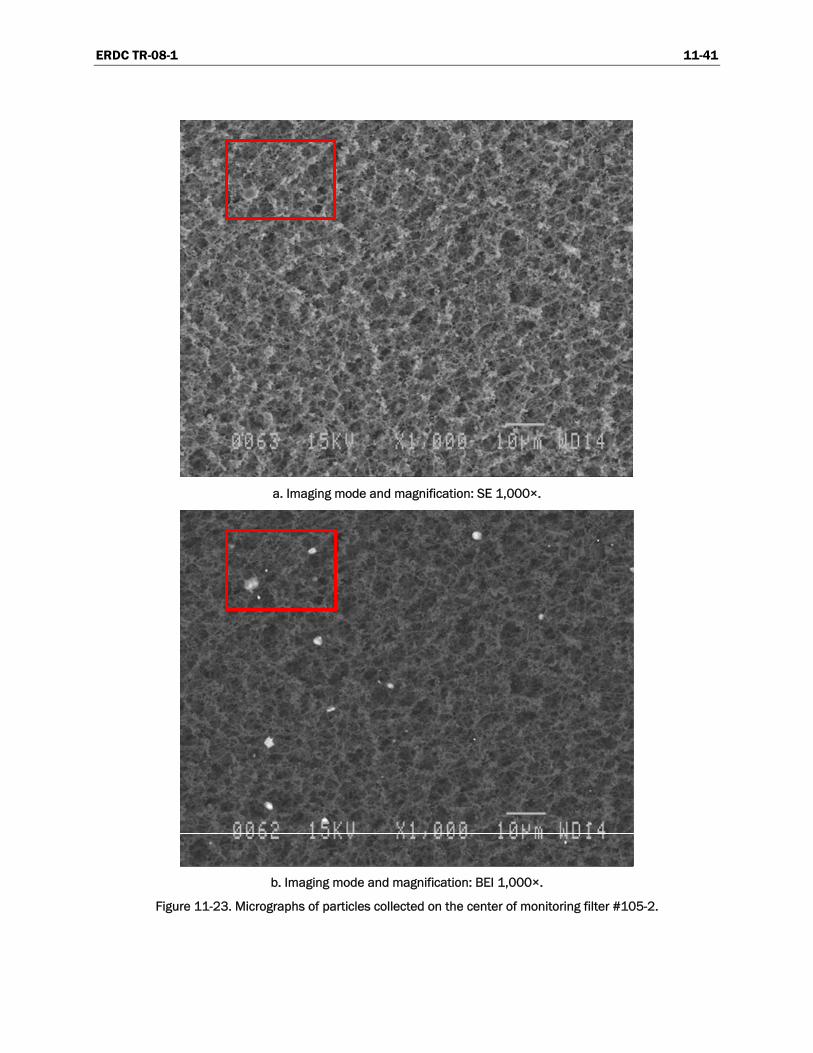
ERDC TR-08-1 11-41
a. Imaging mode and magnification: SE 1,000×.
b. Imaging mode and magnification: BEI 1,000×.
Figure 11-23. Micrographs of particles collected on the center of monitoring filter #105-2.

ERDC TR-08-1 11-42
c. Imaging mode and magnification: SE 5,000× (magnification of the red-squared section).
d. Imaging mode and magnification: BEI 5,000×.
Figure 11-23 (cont’d). Micrographs of particles collected on the center of monitoring filter #105-2.
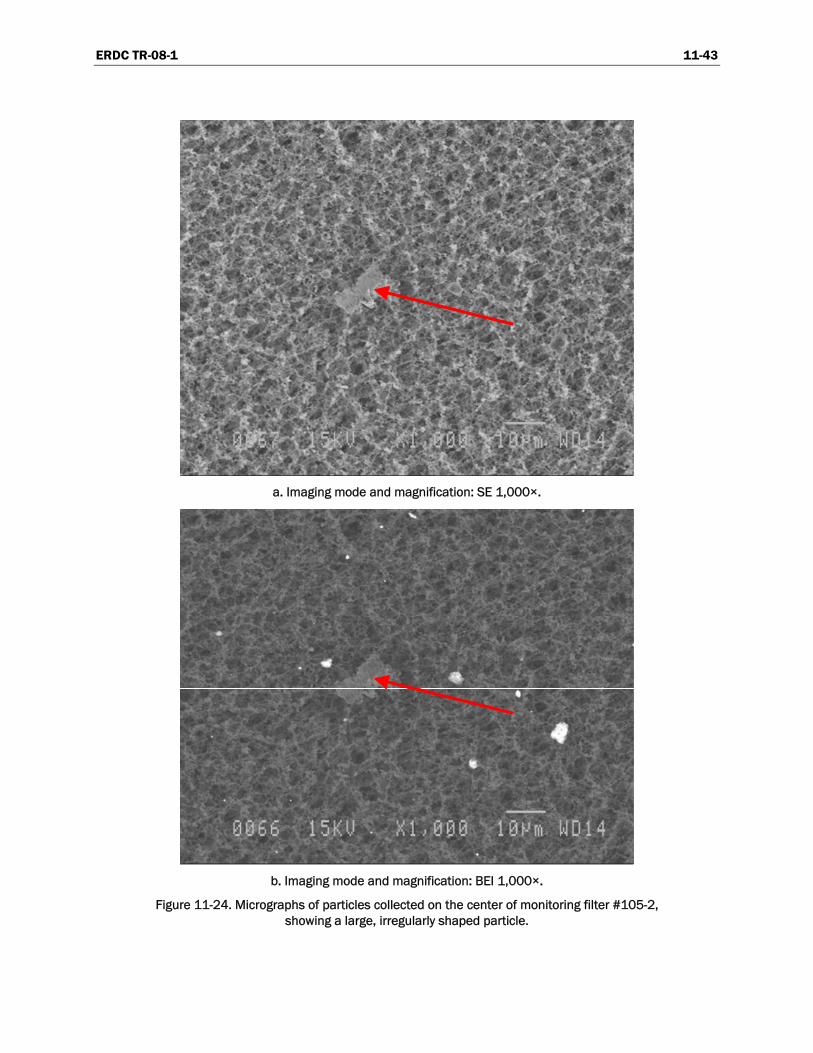
ERDC TR-08-1 11-43
a. Imaging mode and magnification: SE 1,000×.
b. Imaging mode and magnification: BEI 1,000×.
Figure 11-24. Micrographs of particles collected on the center of monitoring filter #105-2, showing a large, irregularly shaped particle.

ERDC TR-08-1 11-44
Cascade Impactor
In addition to collecting particles on monitoring cassettes, size segregation was also performed with a cascade impactor. The substrate of each stage of the impactor was imaged by SEM to determine the relation between the particle size and chemical composition.
The SEM showed no particles on the substrates of Stages #1 and #2 of the cascade impactor. However, many particles were seen on the substrate of Stage #3, as shown in Figure 11-25. The chemical composition of these particles was mainly Fe, O, and C. Even though the aerodynamic cut point of Stage #3 is 9.8 µm, particles shown in Figure 11-25 seem to have a di-ameter closer to 1 µm. The morphology of these particles is completely dif-ferent from the particles deposited on the monitoring filters. They seem to have reacted with the substrate, or been embedded in the substrate. One possible explanation for this phenomenon is that there was either a physi-cal reaction, as the condensation of a vapour-phase compound on the sub-strate, or a chemical reaction, as oxidation, with the substrate. One other explanation, which we think is less probable, is that the exposure to the electron beam in the SEM system may have altered the sample, as shown by the breaking in the substrate in Figure 11-25a. It is also possible that a combination of those reactions occurred. When comparing this sample to the other substrates (Stages #4 to #8), one can easily notice the important difference in morphology. The other substrates exhibit almost round parti-cles, either individually separated or in clusters.
Many particles were found on the substrate of Stage #4 of the impactor, as shown in Figure 11-26. Particles morphology is almost round and size is lower than the theoretical cut point (6 µm). They seem to be simply depos-ited on the substrate, not embedded as are the particles of Stage #3. Chemical composition of the particles is mostly Pb, C, O, and Cu, with some particles composed of Si and Mg.
A high concentration of particles was collected on the substrate of Stage #5 (Fig. 11-27). Particles travelling in the lower stages of the cascade impactor (#5 to #8) have acquired a high velocity and have momentum. They im-pact on the substrate without being deviated. The concentration of parti-cles allowed the observation of a clear mark that follows the shape of the slot of the stage above, as seen in Figure 11-27a. Again, particle size seems to be smaller than the theoretical aerodynamic diameter. Some clusters of particles can be seen. We cannot determine if the cluster was formed in the

ERDC TR-08-1 11-45
plume before its entrance in the impactor or if the cluster was created after the collision of two or more particles on the substrate. Both assumptions are possible because the cut point is at 50% collection efficiency. The ana-lyzed particles have the same composition, mostly Pb, with C, O, and Cu.
a. Magnification: 3,000×.
b. Magnification: 10,000×.
Figure 11-25. Micrographs of the substrate of Stage #3 of the cascade impactor (105-mm trial).
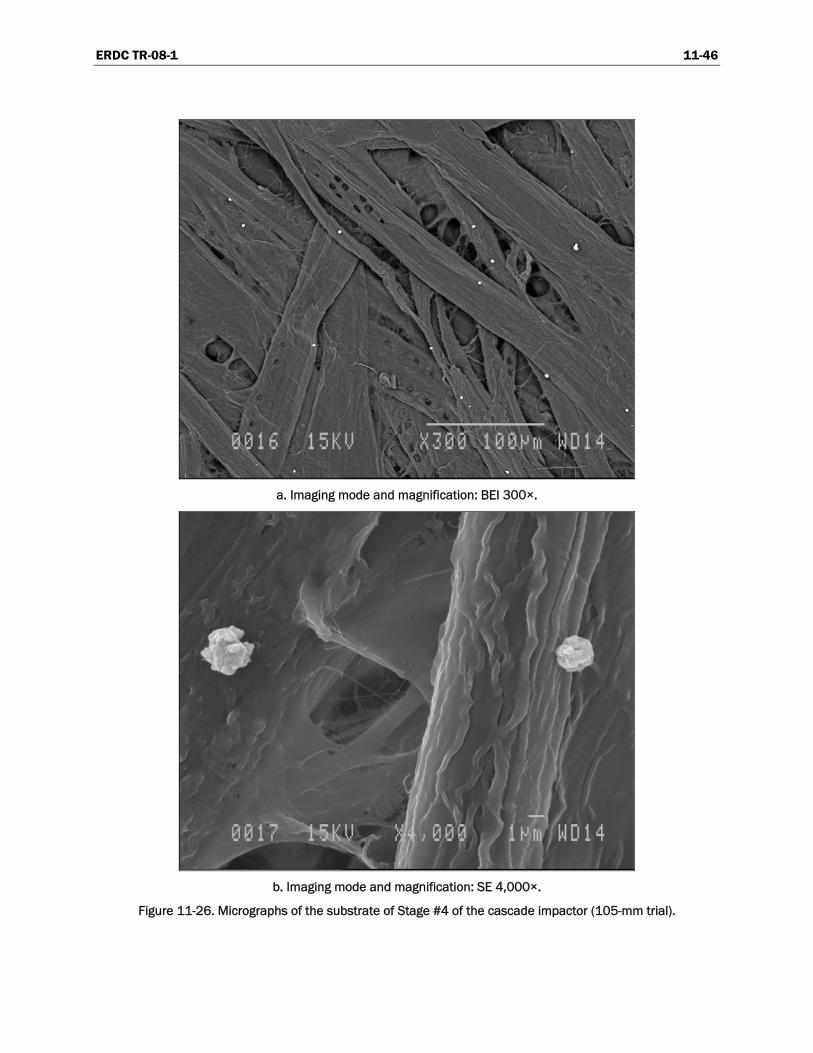
ERDC TR-08-1 11-46
a. Imaging mode and magnification: BEI 300×.
b. Imaging mode and magnification: SE 4,000×.
Figure 11-26. Micrographs of the substrate of Stage #4 of the cascade impactor (105-mm trial).

ERDC TR-08-1 11-47
c. Imaging mode and magnification: BE 20,000×.
Figure 11-26 (cont’d).
a. Magnification: 50×.
Figure 11-27. Micrographs of the substrate of Stage #5 of the cascade impactor (105-mm trial).
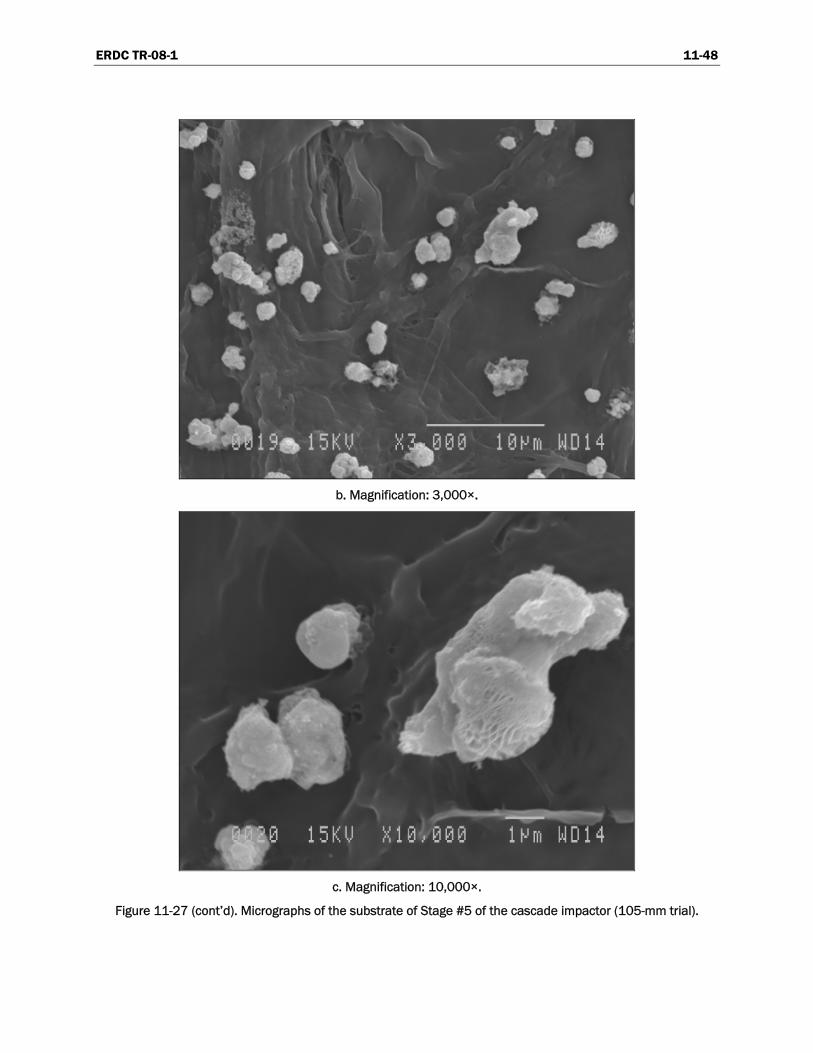
ERDC TR-08-1 11-48
b. Magnification: 3,000×.
c. Magnification: 10,000×.
Figure 11-27 (cont’d). Micrographs of the substrate of Stage #5 of the cascade impactor (105-mm trial).
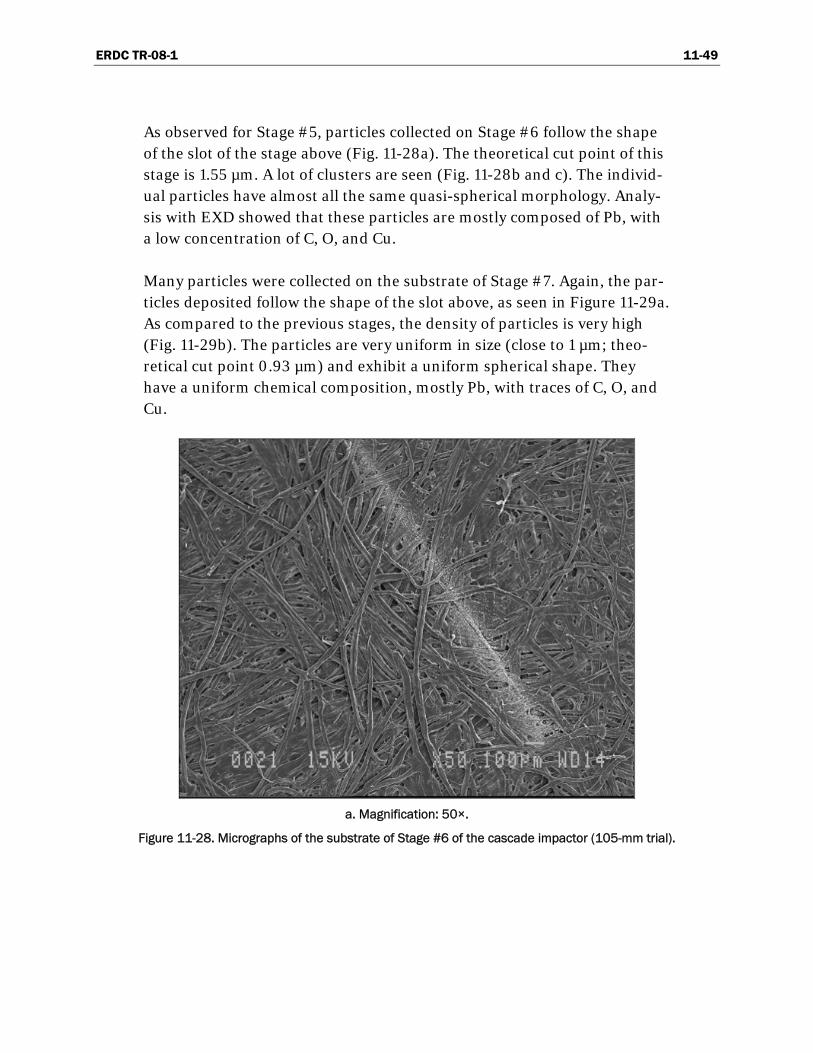
ERDC TR-08-1 11-49
As observed for Stage #5, particles collected on Stage #6 follow the shape of the slot of the stage above (Fig. 11-28a). The theoretical cut point of this stage is 1.55 µm. A lot of clusters are seen (Fig. 11-28b and c). The individ-ual particles have almost all the same quasi-spherical morphology. Analy-sis with EXD showed that these particles are mostly composed of Pb, with a low concentration of C, O, and Cu.
Many particles were collected on the substrate of Stage #7. Again, the par-ticles deposited follow the shape of the slot above, as seen in Figure 11-29a. As compared to the previous stages, the density of particles is very high (Fig. 11-29b). The particles are very uniform in size (close to 1 µm; theo-retical cut point 0.93 µm) and exhibit a uniform spherical shape. They have a uniform chemical composition, mostly Pb, with traces of C, O, and Cu.
a. Magnification: 50×.
Figure 11-28. Micrographs of the substrate of Stage #6 of the cascade impactor (105-mm trial).

ERDC TR-08-1 11-50
b. Magnification: 3,000×.
c. Magnification: 10,000×.
Figure 11-28 (cont’d). Micrographs of the substrate of Stage #6 of the cascade impactor (105-mm trial).

ERDC TR-08-1 11-51
a. Magnification: 50×.
b. Magnification: 3,000×.
Figure 11-29. Micrographs of the substrate of Stage #7 of the cascade impactor (105-mm trial).

ERDC TR-08-1 11-52
c. Magnification: 10,000×.
Figure 11-29 (cont’d). Micrographs of the substrate of Stage #7 of the cascade impactor (105-mm trial).
A large population of particles are deposited on the substrate of Stage #8 of the impactor (Fig. 11-30). Most of the particles have a size smaller than 0.5 µm for individual particles and a spherical shape. Because of the high concentration of particles localized below the jet orifices of Stage #8, par-ticles have more or less coalesced. Chemical composition of these particles is mainly Pb and Cu, with C and O.
The final filter of the cascade impactor was analyzed by SEM and no parti-cles were observed.
M777 155-mm Howitzer
Mass of Particulate Matter Collected
Filters were weighed before and after sampling to determine the mass of particles collected. Tables 11-14 and 11-15 present the results obtained for PM collected with the monitoring cassettes and the cascade impactor, re-spectively. Different masses of particles were collected depending on the location of the sampling station: 2.3 mg were collected for Station #1 (8.2 m on the left side of the gun) and and 3.1 mg for Station #2 (21.9 m in front of the gun, in the firing direction). Sampling time was 170 min for

ERDC TR-08-1 11-53
both cassettes, thus giving a sampled volume of approximately 0.67 m3 of air for both monitoring cassettes. The concentration of particles seems to be larger for the Station #2 area (in front of the muzzle), 4.6 mg/m3 as compared to 3.4 mg/m3 for the Station #1 area (side of the gun).
a. Magnification: 50×.
b. Magnification: 3,000×.
Figure 11-30. Micrographs of the substrate of Stage #8 of the cascade impactor (105-mm trial).

ERDC TR-08-1 11-54
c. Magnification: 10,000×.
Figure 11-30 (cont’d). Micrographs of the substrate of Stage #8 of the cascade impactor (105-mm trial).
Table 11-14. Mass of particles on the monitoring cassettes.
Mass
Cassette
Particles
Identification Before sampling
(g) After sampling
(g) (g) (mg)
#155-1 (Station #1) 22.1175 22.1198 0.0023 2.3
#155-2 (Station #2) 22.0785 22.0816 0.0031 3.1

ERDC TR-08-1 11-55
Table 11-15. Distribution of particles according to the cut points of the impactor.
Impactor stage
Cut point (µm)
Particles mass (mg) % of total mass
% of total mass in each PM category*
1 21.3 0.6 10.2 >10 µm: 37
2 14.8 0.9 15.2
3 9.8 0.7 11.9
4 6 0.8 13.5 ≤ 10 μm (PM10): 63
5 3.5 0.7 11.9
6 1.55 1.1 18.6 ≤ 2.5 μm (PM2.5): 37
7 0.93 0.4 6.8
8 0.52 0.3 5.1
Final stage (back-up
filter) 0 0.4 6.8
Sum 5.9
* Approximation, because there is no exact cut point at 10 and 2.5 µm. As the PM10 have a diameter ≤ 10 µm, we included Stages #4 to final stage. For PM2.5 (diameter ≤ 2.5 µm), Stages #6 to final stages were included.
Particulate matter emitted during the live firing of the M777 155-mm how-itzer covers a wide range of diameters, as seen in Table 11-15. Results show that 37% of the total mass collected in the impactor is of aerodynamic di-ameter larger than 10 µm; 63% of the mass is composed of PM10, and of the latter, 37% of the total mass is composed of PM2.5.
Particle concentrations determined at the two sampling stations (see Fig-ure 11-13) are shown in Table 11-16 and are 3.4 and 4.6 mg/m3. The higher concentration found at Station #2 is likely due to the fact that this table was located directly in the line of fire in front of the muzzle while Sta-tion#1 was on the left side of the gun.
Table 11-16. Calculated total particles concentration in the plume.
Sampling media Concentration
(mg/m3)
Cascade impactor 18
Monitoring cassette #155-1 (Station #1) 3.4
Monitoring cassette #155-2 (Station #2) 4.6

ERDC TR-08-1 11-56
The particulate matter concentration over the sampling time is higher than the air quality guidelines (Table 11-13), but as for the trial with the 105-mm howitzer, it is important to note that the sampling was not done ac-cording to the standard protocol, i.e., not over an eight-hour period and not in the breathing zone of the soldiers, so comparison with the guide-lines is tentative and is meant to estimate possible rather than actual risks.
During the trial, gaseous emissions were observed at the muzzle immedi-ately after firing and at the breech each time the gunner opened it to insert a new round. Fewer emissions were observed at the opening of the breech than at the muzzle location, which would explain the lower concentration at the left side of the gun. In addition, wind was low and gaseous emissions did not disperse that day.
The size distribution of particles is given in Table 11-15 and recommenda-tions from Health Canada, the US EPA, and the CCME are given in Table 11-13. Approximately a third of the particles on Station#1 have a size lower than 3.5 µm, and approximately 63% are smaller than 10 µm. These results are similar to the ones observed in the previous study [23].
Fine particles are considered to be the most hazardous [35]. Particles under 4 µm are known to be deposited in the gas-exchange region of the lungs [36]. Health effects related to chronic exposure to fine particles in-clude cardiac-related and respiratory effects [37].
Considering the percentage of particles in each category (determined with the cascade impactor), in this study, the concentration of particles under 3.5 µm at Station#1 is approximately 1.2 mg/m3. This is about thirty times higher than the recommended 24-hour standard for PM2.5 from the US EPA. It is recommended that specialists in occupational health perform further investigation on the personal exposure of particles. It is also rec-ommended to use a cascade impactor with a PM2.5 cut point, the same as the environmental standard.
Scanning Electron Microscopy
Monitoring Cassettes Filters
The filter from the monitoring cassette placed on Station #1 (Filter #155-1) was analyzed by SEM. The micrograph shown in Figure 11-31a was taken close to the center of the filter; that in Figure 11-31b was taken close to the

ERDC TR-08-1 11-57
edge. When compared to the blank filter (Fig. 11-18), there is only a small difference, which is the presence of particles around 1 μm with a very nar-row size distribution, all spherical in shape, with a very regular chemical composition, mostly C and O.
a. Center of the filter.
b. Edge of the filter.
Figure 11-31. Micrographs of different positions of Filter #155-1 (Station #1) (5000x).

ERDC TR-08-1 11-58
Particles deposited on Filter #155-2 (Station #2) were observed by SEM. Figure 11-32a shows material close to the center of the cassette at different magnifications. The particles are unsymmetrical and irregular and the in-terstices in the filter seem to be filled. The deposited material covers large areas on the filter (more than 10 μm in length). This material is composed mostly of K, C, and O. K is attributed to the presence of K2SO4 in the pro-pellant primer. It is surprising that S was not seen on the EDX spectra. One explanation for the absence of S in the particles is that it may have been transformed into a gaseous product or may not have been present in sufficient concentration on the particles to be detected by the instrument.
Material with the same structure is found on the edges of the filter (Fig. 11-32b). The only difference with particles close to the inlet is the presence of S with K, C, and O. It is believed that the material on Filter #155-2 (Station #2) is K2SO4 and soot. Energetic compounds may be present in the filter, but with SEM and EDX it is not possible to be sure. The analysis of the fil-ter by the EPA Method 8330 [32] by HPLC was not considered as the filter is soluble in acetonitrile and this will most probably damage the column.
Cascade Impactor
A high concentration of particles was collected in the cascade impactor. Results are presented in Table 11-15. The total mass in the impactor is 5.9 mg, thus giving a particle concentration of 18 mg/m3. The impactor was placed on Station #1, and there is a major difference in particle concentra-tion with the monitoring cassette placed on the same station, which is 3.4 mg/m3. This difference may be a result of the cumulative errors on the mass measurement. Actually, there is an uncertainty related with the measurement of the mass. There may be a small overestimation of the masses deposited on the filters, and when making the addition, the total mass is overestimated. Also, as presented earlier, there may be an irregu-lar dispersion of particles in clouds.
The substrates from the different stages of the cascade impactor were analyzed by SEM. No particles were seen on the Stage #1 to #6 substrates. However, the filter from Stage #7 (Fig. 11-33) shows particles deposited in the shape of the impactor slot. The deposition is more or less uniform on the circle. Two kinds of materials are present on the filter, one being more like a layer deposited on the filters (the background in Figure 11-33b), and particles more circular on the upper layer (Fig. 11-33c). A condensation of the material is a possible explanation for the deposition of material in the
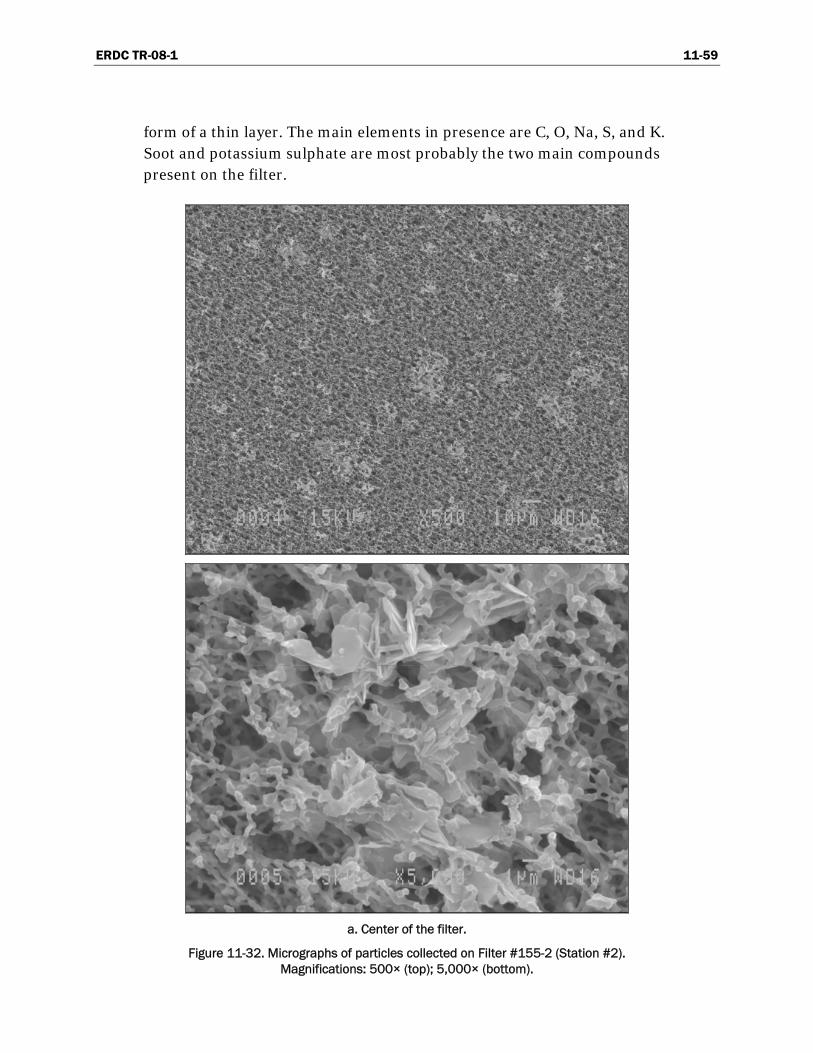
ERDC TR-08-1 11-59
form of a thin layer. The main elements in presence are C, O, Na, S, and K. Soot and potassium sulphate are most probably the two main compounds present on the filter.
a. Center of the filter.
Figure 11-32. Micrographs of particles collected on Filter #155-2 (Station #2). Magnifications: 500× (top); 5,000× (bottom).

ERDC TR-08-1 11-60
b. Edge of the filter.
Figure 11-32 (cont’d). Micrographs of particles collected on Filter #155-2 (Station #2). Magnifications: 500× (top); 5,000× (bottom).
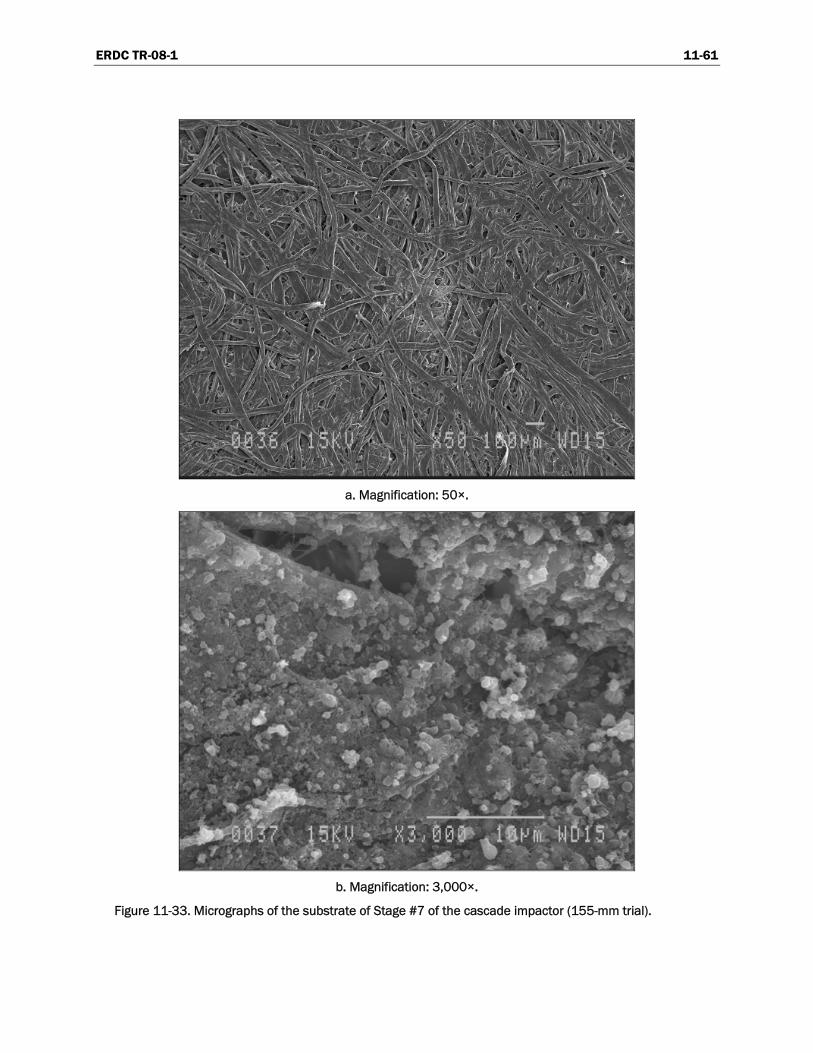
ERDC TR-08-1 11-61
a. Magnification: 50×.
b. Magnification: 3,000×.
Figure 11-33. Micrographs of the substrate of Stage #7 of the cascade impactor (155-mm trial).

ERDC TR-08-1 11-62
c. Magnification: 10,000×.
Figure 11-33 (cont’d). Micrographs of the substrate of Stage #7 of the cascade impactor (155-mm trial).
The substrate from Stage #8 of the cascade impactor also has particles de-posited according to the design of the impactor slot (i.e., white line in the center of Figure 11-34a). At a higher magnification (Fig. 11-34b and c), the particles seem to be embedded in the fibers of the substrate. There is no individual round particle. It seems that there are two different particle compositions, one being Fe and O (more probably iron oxide), and the other mostly C. Soot is more probably the main composition of the resi-due. It may have condensed from the gaseous phase to a solid phase on the filter.
The final stage (plain filter, last stage), had no deposited material. The amount of material determined by the weighing of the filter is 0.4 mg (corresponding to 6.8% of the total mass), and the absence of material determined by SEM supports the assumption stated earlier that there is an overestimation of the mass deposited inside the cascade impactor. It is believed that the results obtained with the microscope are more reliable than the weighing of the filters. This assumption is valid for both the trials described here.
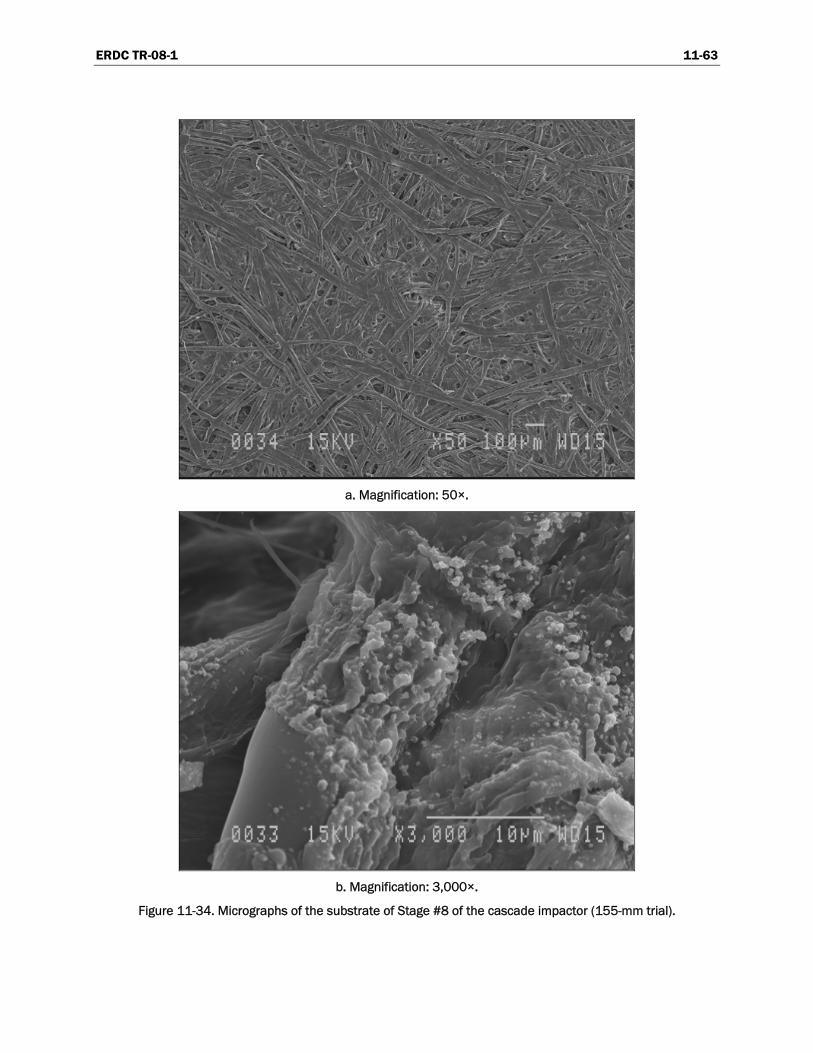
ERDC TR-08-1 11-63
a. Magnification: 50×.
b. Magnification: 3,000×.
Figure 11-34. Micrographs of the substrate of Stage #8 of the cascade impactor (155-mm trial).

ERDC TR-08-1 11-64
c. Magnification: 10,000×.
Figure 11-34 (cont’d). Micrographs of the substrate of Stage #8 of the cascade impactor (155-mm trial).
Gaseous Compounds
Results for the pumps calibration are shown in Table 11-17 for each type of substance. The last column shows the difference between pre- and post-sampling. For all parameters, the difference between pre- and post-sampling is always lower than 10%, which is considered acceptable. Aver-age pump flow was used for further calculations.
Formaldehyde
The only compound detected during this study was formaldehyde. Results are shown in Table 11-18. The US EPA does not have any Reference Con-centration (RfC) for chronic inhalation exposure [38]. The RfC is “an esti-mate (with uncertainty spanning perhaps an order of magnitude) of a con-tinuous inhalation exposure to the human population (including sensitive subgroups) that is likely to be without an appreciable risk of deleterious effects during a lifetime” [39].
Formaldehyde is known to cause irritation of the mucosa in the eyes and upper airways [40]. Formaldehyde is also considered a probable carcino-genic by the US EPA [39]. Excess of nasopharyngeal cancers and lung can-

ERDC TR-08-1 11-65
cers have been observed in workers exposed to formaldehyde [39]. For-maldehyde can be found in combustion products such as diesel exhaust and cigarette smoke [40].
Table 11-17. Pump calibration for each type of substance.
Parameter Sampling
station Pre-flow
(mL/min) Post-flow (mL/min)
Average (mL/min)
Difference (%)
PAHs 1 1978 1955 1966.5 0.58
PAHs 2 2080 2105 2092.5 0.6
Cyanide 1 1086 1079 1082.5 0.32
Cyanide 2 1039 1058 1048.5 0.91
Metals 1 4072 4073 4072.5 0.01
Metals 2 3984 4003 3993.5 0.24
2,4-DNT 1 1075 1096 1085.5 0.97
2,4-DNT 2 1047 1062 1054.5 0.71
Benzene/ toluene 1 211.6 207.8 209.7 0.91
Benzene/ toluene 2 210.5 206.1 208.3 1.06
Aldehydes 1 499.8 483.4 491.6 1.67
Aldehydes 2 511.3 481.6 496.45 2.99
HNO3 1 501.6 477.9 489.75 2.42
HNO3 2 502.3 475.7 489 2.72
H2S 1 1532 1477 1504.5 1.83
H2S 2 1509 1603 1556 3.02
SO2 1 105.9 129.3 117.6 9.95
SO2 2 100.1 115.4 107.75 7.1
NO/NO2 1 26.8 26.5 26.65 0.56
NO/NO2 2 27.6 26.3 26.95 2.41
Table 11-18. Concentrations of formaldehyde for each sampling location.
Sampling station Formaldehyde
(µg/m3)
#1 7.1
#2 3.6
Contrarily to particles, formaldehyde concentration at Station#1 was twice higher than concentration at Station#2 (Table 11-18). Station#1 was closer to the gun than Station#2, which could explain this result. It is possible

ERDC TR-08-1 11-66
that dispersion of gases is different than dispersion of particles. However, Station#1 was located between the gun and the trucks. As it was cold that day, the truck drivers left their trucks running during the exercise. It is therefore possible that part of the formaldehyde detected at Station#1 was coming from diesel exhausts from the trucks. It will be difficult to avoid vehicle emissions in future trials, even in warmer conditions, since the military personnel keep some engines turning in case of an emergency.
According to the US EPA, a formaldehyde concentration of 8 µg/m3 gives a carcinogenic risk level of 1 in 10,000 [39]. This level is similar to the for-maldehyde concentration observed at Station#1 and in the same order of magnitude as the formaldehyde concentration observed at Station#2, but the sampling was not done using the protocols for health assessment. Also, since the soldiers are not exposed on a daily basis for a lifetime, their risk is likely far lower than the EPA estimates and likely no more than the risk of the general population. However, some soldiers are working quite close to the gun and it would be prudent to conduct personal sampling to com-pare their exposure to occupational standards. It is highly recommended to perform further investigation on formaldehyde exposure.
Dinitrotoluene Compounds
No energetic compounds were detected during the live firing of the sev-enty-two 155-mm rounds with the M777 howitzer. There are two possible explanations for this fact. First, it is possible that the sampling of the ener-getic compounds with the Tenax tube is not appropriate for this sampling. Imagine, for example, that the residual energetic materials emitted at the muzzle of the gun are in the form of particles instead of being in the gase-ous form; it is possible that those particles fall directly to the ground and do not enter the sorbent tube. In previous trials done at METC Nicolet described in [23] and in Chapter 7 of this report, any energetic materials were detected inside the muffler when using Charge 4, and very low con-centrations were detected using Charge 6 with the use of sorbent tubes during the firing of 105-mm rounds. This setup should have optimized the collection of gases. Witness plates placed on the floor of the muffler were wiped and 2,4-DNT was determined. This supports the assumption about the emission of energetic materials in the form of solid particles and not in the gaseous phase. Other live firings done in open atmosphere were sampled for the same compounds and again, no energetic material was de-tected in the gaseous plume. Wipes of witness plates placed on the ground were found to be contaminated with 2,4-DNT. Again, this supports the as-
ERDC TR-08-1 11-67
sumption that 2,4-DNT is emitted in the form of solid particles. It is im-portant to note that the trial done at METC Nicolet include the firings of rounds at Charges 4 and 6. The combustion of a low quantity of propellant is more likely to be incomplete because of the lower pressure and tempera-ture created in the gun. This observation was also made by Ampleman et al., in a trial involving the live firing of a 105-mm tank, this trial being pre-sented in Chapter 6 of this report. In this trial, particle traps were put on the ground during the live firing of a 105-mm tank and were analyzed for energetic material. The traps were found to be free from energetic mate-rial. One possible explanation for this fact is that the rounds used were fired at full charge (3.0 to 6.0 kg of propellant depending on the type of round used) and it is believed that the combustion becomes more com-plete somewhere between 840 and 3000 g of propellant in the gun cham-ber for 105-mm guns.
In the case of the live firing of the 155-mm rounds described in this report, the charge used is mainly 4 (three rounds fired at complete charge, charge 5). The amount of propellant is 1.814 kg for Charge 4, and 2.523 kg for Charge 5. Even though it is not possible to compare directly the combus-tion of the propellant in the 105-mm guns and in the 155-mm guns, it is likely that a cleaner combustion occurs when the propellant charge is high. The cleaner combustion resulting from the increased pressure and tem-perature buildup in the gun with a large quantity of propellant will have to be further investigated, either in the case of the 105-mm or the 155-mm rounds. During this trial, no detectable concentrations of 2,4-DNT were found in the gaseous phase and we believe that even if another sampling method was used, the same result would have been obtained.

ERDC TR-08-1 11-68
Conclusion
This chapter presents the characterization of the particulate matter emit-ted during the live firing of the LG1 Mark II 105-mm and the M777 155-mm howitzers. During the 155-mm exercise, some gaseous samples were also collected. Particulate matter was collected on monitoring cassettes and on the substrates of a cascade impactor. Gaseous compounds were collected using sorbent tubes. The position of the sampling media was chosen considering safety limitations and weather conditions. The inlets of the sampling material were placed downwind in the trajectory of the plume.
For the LG1 Mark II 105-mm howitzer, particle size distribution is mostly between 1 to 5 µm, with 49% of the particles of size < 2.5 µm. Smaller par-ticles are spherical or spheroidal while larger particles are irregular and fractured. Chemical composition of small particles is mostly Pb and Cu. To our knowledge, the only source of Pb is the piece of lead foil in propelling charge #5. Cu is deposited inside the gun by the rotating band of the pro-jectile. Pb acts as a decoppering agent and forms a fragile alloy with Cu, which breaks easily. It is thus normal to find both metals in the same par-ticles. Large particles seem to be either soot or dust from soil.
For the M777 155-mm howitzer, particulate matter collected on the filters present different characteristics depending on the collection position. The monitoring cassette placed close to the gun (8.2 m on the left side of the gun) collected very small particles, all around 1 µm, spherical, and com-posed of carbon and oxygen. The cassette placed in the firing direction (21.9 m in front of the gun) collected particles that are asymmetrical and irregular with interstices in the filter filled with the material. Material cov-ers large areas on the filter (more than 10 μm in length). This material is probably K2SO4. Results obtained with the cascade impactor (placed on the sampling station on the left-hand side of the gun) show that the parti-cles have coalesced on the filter. According to the weights of the filters, 37% of the total mass is composed of particulate matter less than 2.5 µm (PM2.5).
Results for particles were in agreement with results found in the previous study, that live gun firing produces mainly particles under 10 µm [23]. As
ERDC TR-08-1 11-69
the aim of this work was to characterize the particulate matter and to col-lect gases in the emission plume, the inlets of the sampling material were not placed in the breathing zone of the military personnel and the sam-pling was not done according to the standard procedures for exposure as-sessment, thus it is important to note that the concentration of particulate matter calculated is thus not representative of the exposure of the artillery personnel, and comparison with the guidelines is tentative and is meant to estimate possible rather than actual risks. For both cases, the total particu-late matter concentration is higher than the guidelines. Lead is present in the airborne PM created during the firing of the LG1 Mark II 105-mm and a high concentration of very fine PM (1 µm) was observed.
The study of the gaseous emissions of the M777 155-mm howitzer was performed following work on the C3 105-mm howitzer done at Nicolet, Quebec. In the first study it was recommended to add metals, PAHs, alde-hydes, nitric acid, and H2S to the list of substances evaluated. In total, 72 rounds were fired and samples were collected continuously during three hours. Samples collected during this study showed detectable concentra-tions for particles and formaldehyde.
The main difference between the 105-mm and the 155-mm howitzer par-ticulate matter emissions is that lead is found in PM of the 105 mm. For both howitzers, very small particles (PM2.5) were found in an important concentration. For both studies, it is recommended that specialists in oc-cupational health assess the exposure of military personnel.
ERDC TR-08-1 11-70
References
1. Thiboutot, S., G. Ampleman, A. Marois, A. Gagnon, M. Bouchard, A. Hewitt, T. Jen-kins, M. Walsh, K. Bjella, C. Ramsey, and T.A. Ranney (2004) Environmental Conditions of Surface Soils, CFB Gagetown Training Area: Delineation of the Presence of Munitions Related Residues (Phase III, Final Report). DRDC Valcartier TR 2004-205, Unclassified.
2. Marois, A., A. Gagnon, S. Thiboutot, G. Ampleman, et M. Bouchard (2004) Carac-térisation des sols de surface et de la biomasse dans les secteurs d’entraînement, base des Forces canadiennes, Valcartier. RDDC Valcartier TR 2004-206, Non classifié.
3. Thiboutot, S., G. Ampleman, A. Gagnon, A. Marois, T.F. Jenkins, M.E. Walsh, P.G. Thorne, and T.A. Ranney (1998) Characterization of Anti-tank Firing Ranges at CFB Valcartier, WATC Wainwright and CFAD Dundurn. DREV-R-9809, Unclassified.
4. Brochu, S., E. Diaz, S. Thiboutot, G. Ampleman, A.D. Hewitt, S.R. Bigl, M. Walsh, K. Bjella, T. Ranney, M. Walsh, S. Taylor, C. Ramsey, D. Lambert, and N. Perron (2005) Assessment of 100 Years of Military Training in Canada: The Case of Canadian Force Base Petawawa; Chapter 3, Distribution and Fate of Energetics on DoD Test and Training Ranges: Report 6. US Army Engineer Research and Development Center, Environmental Laboratory, Vicksburg, Mississippi, Tech-nical Report ERDC TR-06-12.
5. Diaz, E., S. Brochu, S. Thiboutot, G. Ampleman, A. Marois, and A. Gagnon (2005) Assessment of Contamination by Energetic Materials and Metals in Soils and Biomasses at Western Area Training Center (WATC) in Wainwright, Alberta (Phase I); Chapter 4, Distribution and Fate of Energetics on DoD Test and Training Ranges: Report 6. US Army Engineer Research and Development Center, Environmental Laboratory, Vicksburg, Mississippi, Technical Report ERDC TR-06-12.
6. Ampleman, G., S. Thiboutot, J. Lewis, A. Marois, A. Gagnon, M. Bouchard, T.F. Jenkins, T.A. Ranney, and J.C. Pennington (2004) Evaluation of the Con-tamination by Explosives and Metals in Soils, Vegetation, Surface Water and Sediment at Cold Lake Air Weapons Range (CLAWR), Alberta, Phase II, Final report. DRDC Valcartier TR 2004-204.
7. Thiboutot, S., G. Ampleman, A. Marois, A. Gagnon, M. Bouchard, A. Hewitt, T.F. Jenkins, M. Walsh, K. Bjella, C. Ramsey, and T.A. Ranney (2004) Environmental Conditions of Surface Soils, CFB Gagetown Training Area: Delineation of the Presence of Munitions Related Residues (Phase III, Final Report). DRDC Valcartier TR 2004-205.
8. Ampleman, G., S. Thiboutot, J. Lewis, A. Marois, A. Gagnon, M. Bouchard, R. Martel, R. Lefebvre, C. Gauthier, J.M. Ballard, T. Jenkins, T. Ranney, and J. Pennington (2003) Evaluation of the Impacts of Live-Fire Training at CFB Shilo (Final Report). DRDC Valcartier TR 2003-066.

ERDC TR-08-1 11-71
9. Thiboutot, S., G. Ampleman, A. Gagnon, and A. Marois (2000) Characterization of an Unexploded Ordnance Contaminated Range (Tracadie Range) for Potential Con-tamination by Energetic Materials. DREV Report TR-2000-102.
10. Ampleman, G., S. Thiboutot, S. Désilets, A. Gagnon, and A. Marois (2000) Evaluation of the Soils Contamination by Explosives at CFB Chilliwack and CFAD Rocky Point. DREV Report TR-2000-103.
11. Jenkins, T.F., J.C. Pennington, T.A. Ranney, T.E. Berry, Jr., P.H. Miyares, M.E. Walsh, A.D. Hewitt, N. Perron, L.V. Parker, C.A. Hayes, and Major E. Wahlgren (2001) Characterization of Explosives Contamination at Military Firing Ranges. US Army Engineer Research and Development Center, Cold Regions Research and Engineering Laboratory, Hanover, New Hampshire, Technical Report ERDC TR-01-05.
12. Walsh, M.E., C.M. Collins, C.H. Racine, T.F. Jenkins, A.B. Gelvin, and T.A. Ranney (2001) Sampling for Explosives Residues at Fort Greely, Alaska: Reconnaissance Visit July 2000. US Army Engineer Research and Development Center, Cold Regions Research and Engineering Laboratory, Hanover, New Hampshire, Technical Report ERDC/CRREL-01-15.
13. Jenkins, T.F., A.D. Hewitt, C.L. Grant, S. Thiboutot, G. Ampleman, M.E. Walsh, T.A. Ranney, C.A. Ramsey, A.J. Palazzo, and J.C. Pennington (2006) Identity and distribution of residues of energetic Compounds at Army Live-Fire Training Ranges. Chemosphere, 63, 1280.
14. http://www.atc.army.mil/
15. Bach, J.C., B.E. Conway, S.B. Mulligan, K.A. Watts (2006) US Army Environmental Center’s Development of AP-42 Emission Factors for Munition Use, 15th Inter-national Emission Inventory Conference, “Reinventing Inventories—New Ideas in New Orleans,” New Orleans, Louisiana.
16. Harding Lawson Associates, Douglas E. Cover et al. (1999) Investigation of Toxic Air Contaminants Released from Incidental Detonation of Ordnance and Explosives During Prescribed Burning of Vegetation at the Former Fort Ord, California.
17. Federal Facilities Assessment Branch (2005) Health Consultation, Former Fort Ord Site (a/k/a Fort Ord) Marina, Montery County, California, Public Health Evalua-tion of October 2003, Prescribed Burn EPA Facility ID : CA7210020676.
18. C.W. Spicer, M.W. Holdren, T. Wisbith, J. Satola, R. Mangaraj, K. Cowen, D.W. Joseph, W.R. Bolt, J.C. Bach, R.J. Cramer, J.L. Szabo, A.J. Sedlacek, B.T. Jobson, and M.L. Alexander (2004) Air Emissions of Toxic Release Inventory Chemicals from Munitions Use on Ranges. In Proceedings of the Sustainable Range Man-agement Conference, New Orleans, January 2004.
19. G.A. Floyd, J.E. King, and R. Roenbeck (2004) Measurements of Air Emissions from Munitions During Live-Fire Exercises. In Proceedings of the Sustainable Range Management Conference, New Orleans, January 2004.
20. Tetra Tech, Inc. (2005) Air Sampling and Analysis Investigation Report, Supporting the Environmental Impact Statement on Military Training Activities, Makua Military Reservation, Oahu, Hawaii. TC K838-0403.

ERDC TR-08-1 11-72
21. United States Environmental Protection Agency, National Ambient Air Quality Standards, http://www.epa.gov/air/criteria.html.
22. Dubé, P., S. Thiboutot, G. Ampleman, A. Marois, and M. Bouchard (2006) Prelimi-nary Assessment of the Dispersion of Propellant Residues from the Static Live Firing of 105-mm Howitzer, DRDC Valcartier TM 2005-284.
23. Quémerais, B., L. Melanson, L., G. Ampleman, S. Thiboutot, E. Diaz, and I. Poulin (2007) Characterization of atmospheric emissions during live gun firing at the muffler installation in Nicolet, Lac St. Pierre, Canada: Test on Howitzer 105 mm. DRDC Toronto TR 2007-060, Draft.
24. http://www.army.forces.gc.ca/lf/francais/2_display.asp?product=67
25. National Defense Canada (2004) Technical information—Ammunition and Explo-sives: Ammunition for 105 mm Howitzer”, C-74-315-H00/TA-000.
26. National Defense Canada (2006) Technical information—Ammunition and Explo-sives: Ammunition for 155 mm Howitzer. C-74-320-BA0/TA-000, Canada.
27. United States Environmental Protection Agency (2006) Background document—Report on revisions to 5th edition AP-42 Chapter 15: Ordnance detonation. http://www.epa.gov/ttn/chief/ap42/ch15/index.html
28. DHHS (NIOSH) Publication 94-113 (1994) NIOSH Manual of Analytical Methods (NMAM), 4th ed., 1st Supplement Publication 96-135, 2nd Supplement Publica-tion 98-119, 3rd Supplement 2003-154, P.C. Schlecht and P.F. O’Connor, Eds., http://www.cdc.gov/niosh/nmam
29. Thermo Electron Corporation (2003) Instruction Manual, Series 290 Marple Personal Cascade Impactors.
30. OSHA (2007) Index of sampling and analytical methods. http://www.osha.gov/dts/sltc/methods/toc.html
31. Bishop, R.W., T.A. Ayers, and D.S. Rinehart (1981) The use of a solid sorbent as a collection medium for TNT and RDX vapors. American Industrial Hygiene Association Journal, 42, 586–589.
32. United States Environmental Protection Agency (2006) Tests Method for Nitroaromatics, Nitramines and Nitrate Esters by High Performance Liquid Chromatography (HPLC). http://www.epa.gov/epaoswer/hazwaste/test/pdfs/8330b.pdf
33. United States Environmental Protection Agency A (2007) Air Toxic Methods—TO Compendium, http://www.epa.gov/ttn/amtic/airtox.html.
34. Health Canada (2006) Regulations Related to Health and Air Quality, http://www.hc-sc.gc.ca/ewh-semt/air/out-ext/reg_e.html.
35. Canadian Council of Ministers of the Environment (2000) Canada-wide standards for particulate matter (PM) and ozone, Quebec City.

ERDC TR-08-1 11-73
36. American Conference of Governmental Industrial Hygienists (2006) Threshold Limit Values for Chemical Substances and Physical Agents & Biological Exposure Indices.
37. United States Environmental Protection Agency (2004) Air Quality Criteria for Particulate Matter. Vol. I and II, Office of Research Development.
38. United States Environmental Protection Agency (2007) Integrated Risk Information System—Formaldehyde, http://www.epa.gov/iris/subst/0419.htm.
39. United States Environmental Protection Agency (2007) Integrated Risk Information System—Glossary of terms, http://www.epa.gov/iriswebp/iris/gloss8.htm.
40. World Health Organization (1989) International Program on Chemical Safety—Environmental Health Criteria 89: Formaldehyde, http://www.inchem.org/documents/ehc/ehc/ehc89.htm.

THIS PAGE IS INTENTIONALLY BLANK.

ERDC TR-08-1 12-1
— Chapter 12 —
Dissolution and Transport of Nitroglycerin, Nitroguanidine,
and Ethyl Centralite from M9 and M30 Propellants in Soil
KATERINA DONTSOVA, MARK A.CHAPPELL, JIRI ŠIMUNEK, AND JUDITH C. PENNINGTON
Abstract
Detections of propellant components, most commonly nitroglycerin (NG), on military training grounds necessitate careful evaluation of the potential fate of these compounds in the environment. This study evaluated dissolu-tion of several NG-containing propellant formulations and transport of propellant constituents through soils. Dissolution and transport of NG, nitroguanidine (NQ), and ethyl centralite (EC) from double- and triple-base propellants, M9 (40% NG and 0.75% EC), and M30 (22.5% NG, 47% NQ, and 1.5% EC) were studied. Saturated column experiments were con-ducted using several soils, including Plymouth sand (mesic, coated Typic Quartzipsamments) and Adler silt (coarse-silty, mixed, superactive, ther-mic Fluvaquentic Eutrudepts). Previous studies addressed solution-phase transport of these compounds in the same soils. In this study, it was found that in M9 experiments, NG had the greatest dissolution rate and resulted in the greatest outflow concentrations, up to 400 mg L–1. M30 propellant with larger particle size and lower NG content had lower outflow concen-trations. Mass balance calculations indicated that up to 26% of NG was removed from M9 propellant within three days. Dissolution rates de-creased with time for all energetics, but increased again after flow inter-ruption for NG. Transport process descriptors obtained in these experi-

ERDC TR-08-1 12-2
ments, including adsorption coefficients and dissolution rates, can be used in environmental transport models and/or in environmental and human health risk assessments.

ERDC TR-08-1 12-3
Introduction
Background
Extensive studies of explosive and propellant contamination on US train-ing ranges (Jenkins et al. 2006, 2007) indicate that, while most of the total acreage at the ranges has undetectable levels of energetic residues, there is propellant contamination present in some areas. Generally, propellant constituents are found close to firing points, where they are dispersed dur-ing live-fire training as small particles, fibers, and slivers (Jenkins et al. 2006). Intact propellant grains can be found at demolition areas, originat-ing from kickout during an open burning, or sometimes when explosive ordnance disposal (EOD) troops improperly detonate rather than burn unused propellants. Also, on antitank rocket ranges, pieces of propellant are often visible on the soil surface in the area around the targets, in im-pact area soil samples, and between firing points and impact areas, be-cause rockets are propelled all the way to target and propellants can still be present when these rockets detonate or rupture upon impact. Nitro-glycerin and 2,4-dinitrotoluene (DNT) are the most common propellant constituents detected on the ranges. On antitank rocket ranges, high NG concentrations (up to the low percent level) are found in soil behind the firing line as a result of the backblast from this weapon (Jenkins et al. 2006). Studies by Jenkins et al. (2007) showed that nitroglycerin was the most frequently encountered energetic compound in the samples collected at firing points of different types of army training ranges, including two antitank rocket ranges, a 155-mm howitzer firing point, areas where 40-mm rifle grenades were fired, an 81-mm mortar firing point, and several small arms firing points.
Common propellant constituents such as 2,4-DNT, NG, and NQ are typi-cally imbedded in a nitrocellulose (NC) matrix. Single-base propellants (a name indicating the number of oxidizer components in the propellant formulation) consist of NC with 2,4-DNT; double-base propellants contain two oxidizer compounds, NG and NC; triple-base propellants contain NG, NQ, and NC. Nitrocellulose is a fibrous, highly flammable, yet nonvolatile, white solid. NC is insoluble in water and is extremely resistant to biologi-cal degradation, contributing to its very low potential as a hazard to hu-man health (Boudeau 1993). The exceptional stability of NC arises from its

ERDC TR-08-1 12-4
chemical structure, which consists of β-1→4 linked glucose units contain-ing derivatized nitrate esters. Nitroglycerin is a glycerol ester that serves both as an oxidizer and a gelatinizing agent in double- and triple-base propellants. Nitroguanidine, a nitramine compound, is an oxidizer in triple-base propellants, and reduces flash and flame temperature as well as bore erosion (Defense Ammunition Center 2003). Ethyl centralite, or diethyldiphenylurea, is added to double- and triple-base propellant com-positions as a stabilizer that also moderates burning rate and reduces flash, flame temperature, and bore erosion (Defense Ammunition Center 2003). Molecular and structural formulas, as well as some of the chemical properties for NG, NQ, and EC, are presented in Table 12-1.
Table 12-1. Formulas and properties of nitroglycerin (NG), nitroguanidine (NQ), and ethyl centralite (EC).
Molecular formula Nitroglycerin
H5N3O9 Nitroguanidine
CH4N4O2 Ethyl centralite
C17H20N2O
Structural formula
N C N
O
C2H5 C2H5
N C N
O
C2H5 C2H5 Molecular weight, g mol–1 227.09 104.07 268.35
CAS number 55-63-0 556-88-7 85-98-3
Alternative names 1,2,3-propanetriol
trinitrate 1-nitroguanidine
picrite
centralite I sym-diethyldiphenylurea N,N'-diethylcarbanilide
Both NG and NQ are readily soluble in water, while EC has low solubility. Reported NG solubility in water ranges between 1.25 and 1.95 g L–1, and NQ solubility is between 2.6 and 5 g L–1, as summarized by Mirecki et al. (2006). Pennington et al. (2004) determined EC solubility to be 23 mg L–1 at 24 degrees Celsius.
In addition to being the most widely distributed propellant, NG is also the most toxic among the different propellant compounds commonly studied. NG affects the cardiovascular system, blood, and nervous system in hu-mans and animals (Hathaway et al. 1991). The oral median lethal dose (LD50) in rats is 105 mg kg–1 (NIOSH 1991). Ethyl centralite (EC) is less toxic with oral rat LD50 of 2750 mg kg–1. NQ was found to be nontoxic in

ERDC TR-08-1 12-5
rats up to 1000 mg kg–1 day–1; the LD50 in female mice is 4345 mg kg–1 (Hiatt et al. 1988).
Nitroguanidine can be biotransformed in aquatic environments under both aerobic and anaerobic conditions (Kaplan et al. 1982), but requires the presence of nutrients or organic carbon (Adrian 1996). In soil environ-ments, studies indicate low sorption and degradation for NQ. Mulherin et al. (2005) reported half-life decay estimates for nitroguanidine of 7.5 to 56 days, depending on the soil type, while Pennington et al. (2004) observed no measurable degradation, with adsorption (partitioning) coefficients (kd) between 0.15 and 0.43 cm3 g–1 in batch studies. Column transport studies also showed limited potential for NQ degradation, with adsorption coefficients ranging from 0 to 0.14 cm3 g–1 (Dontsova et al. 2006). Log of NQ adsorption coefficient values normalized for soil organic carbon con-tent (Koc) were similar between the two previously mentioned studies: 1.25–2.12 for Pennington et al. (2004) and 1.83–2.22 for Dontsova et al. (2006).
For EC, Mirecki et al. (2006) proposed that the typically high octanol–water partitioning coefficient (Kow), such as 4.2 (Wentsel et al. 1979), is in-dicative of the solutes’ strongly hydrophobic behavior in the environment. This hypothesis was supported by batch sorption studies (Pennington et al. 2004) showing strong partitioning of ethyl centralite to soils (kd values between 3.03 and 9.15 cm3 g–1). They observed no EC degradation in soil suspensions.
While NQ and EC are chemically stable and resist biological degradation, NG may be readily degraded and even mineralized in solution and in soils (Brannon et al. 2002, Dontsova et al. 2007, Mirecki et al. 2006, Penning-ton et al. 2002, Yost 2004). Yost (2004) recorded NG half-life between 19.6 to 46.2 h under aerobic conditions and 1.4 to 6.1 h under anaerobic conditions in soil suspensions, with total NG mineralized to CO2 ranging from 7 to 41.5%—the greatest NG mineralization occurring in soils col-lected from surface layers (possessing the highest organic matter content). Pennington et al. (2002) reported NG half-lives ranging between 335 h and 7.3 h for sediment with low organic carbon and soils with high clay content, respectively (Pennington et al. 2002). NG half-lives in column transport experiments (Dontsova et al. 2007) ranged between 33.8 and 88.1 h. Similar to Yost (2004), more NG was mineralized to CO2 in soils with higher organic matter content. Since NG exhibits relatively low ad-
ERDC TR-08-1 12-6
sorption coefficients, 0.08 to 0.17 cm3 g–1 (Dontsova et al. 2007), NG is ex-pected to be highly mobile in soil if the solute is not degraded. Average Koc values (2.25 cm3 g–1) reported by Dontsova et al. (2007) were similar to the values reported in the scientific literature, e.g., 2.77 cm3 g–1 (Spanggord et al. 1980).
Previous studies investigating the fate of dissolved propellants NG and NQ were performed under SERDP project ER-1481, “Characterization and Fate of Gun and Rocket Propellant Residues on Testing and Training Ranges” (Dontsova et al. 2007). However, such work may not be directly representative of the fate of these materials in soils because these propel-lant materials are typically introduced as solid particles (Jenkins et al. 2006). Therefore, the actual release of propellant constituents into the soil solution phase as controlled by the dissolution kinetics of the propellant formulation components will be evaluated.
This approach has been successfully employed to describe the release of energetics in soils. For example, column mobility studies have shown that the explosive formulation, Composition B, exhibits a relatively constant dissolution rate, giving a relatively constant rate of outflow of explosive constituents with time (Dontsova et al. 2006, Morley et al. 2006). On the other hand, propellant dissolution decreases with time of leaching (Dontsova et al. unpublished, Hewitt and Bigl 2005, Mirecki et al. 2006). Recent studies also investigated dissolution of NG and 2,4-DNT from soils contaminated with M7 and M1 propellant formulations, respectively (Hewitt and Bigl 2005). Whereas Composition B particles decrease in size when they release TNT, RDX, and HMX, the nitrocellulose matrix in pro-pellant formulations restricts water penetration into the propellant grains and diffusion of propellant constituents into soil solution, thus decreasing dissolution rates.
This study focuses on dissolution of NG, NQ, and EC from the double- and triple-base propellants, M9 and M30. Both of these propellants contain NG, which presents a particular environmental concern because of its wide distribution on military installations and human and mammalian toxicity.
ERDC TR-08-1 12-7
Objectives
1. To describe dissolution of solid propellant formulations, M9 and M30, and characterize transport of dissolved propellant components, NG, NQ, and EC, through the soil.
2. To develop process descriptors (dissolution rates, soil-to-water partition coefficients, degradation rates) needed to model transport and to assess environmental or public health risk.
Approach
In order to achieve this objective, flux-controlled saturated column ex-periments were conducted for two soils. These soils exhibited different transport potentials for propellant constituents based on the differences in basic soil properties. Two solid-phase propellant formulations, M9 and M30, were placed on the surface of columns packed with soil. The columns were leached with a simple salt solution and the release of propellant con-stituents (NG, NQ, and EC) was measured in column effluent. A conserva-tive tracer (3H2O) was used to distinguish between solute mobility due to purely physical processes (i.e., convection, dispersion and diffusion) and mobility due to chemical processes (i.e., sorption). Also, stopped-flow experiments were performed to emphasize the contribution of kinetic processes (transformation/mineralization, adsorption, solvent diffusion into propellants grains) under stationary flow conditions. Total amount of propellant constituents released from the pellets was estimated by mass balance calculations. Breakthrough curves (BTCs) were analyzed using the water flow and solute transport parameter estimation code, HYDRUS-1D (Šimunek et al. 2005), which was modified to account for solid-phase dissolution. Obtained transport parameters are suitable for incorporation into environmental and human health risk assessment models.

ERDC TR-08-1 12-8
Materials and Methods
Propellants
The two propellant formulations used in this study, M9 and M30 (Fig. 12-1), were obtained from US ARDEC TACOM (Picatinny Arsenal, New Jer-sey). M9 is used by the Army in 40-mm grenades and in 60- and 81-mm mortar rounds, while M30 is used in heavier artillery, such as 90-mm artillery projectiles, 105- and 155-mm howitzer rounds, and 8-inch gun projectiles.
a. M30.
Figure 12-1. Propellants tested in this study (Defense Ammunition Center 2003).

ERDC TR-08-1 12-9
b. M9.
Figure 12-1 (cont’d).
The M30 propellant used in this study consisted of a seven-hole perforated cylinder 2.2 cm in length and 1.05 cm in diameter. M30 is composed of 28 ± 1.3% nitrocellulose, 22.5 ± 1% NG, 47 ± 1% NQ, and 1.5 ± 0.1% EC, with graphite added (0.15%) as a glaze. M30 propellants can also contain small quantities of cryolite (sodium aluminum fluoride), potassium sulfate, and potassium nitrate (Defense Ammunition Center 2003). M9 propellant is produced as small (about 1 mm in diameter) flakes. M9 consists of 57.75 ± 1.5% nitrocellulose, 40 ± 1.5% NG, 1.5 ± 0.25% potassium nitrate, 0.75 ± 0.1% EC, and up to 0.4% graphite (Defense Ammunition Center 2003).
Soils
The two soils selected for this study, used previously in SERDP project ER-1481 (Dontsova et al. 2007), were a Plymouth sand (mesic, coated Typic Quartzipsamments), collected in Barnstable county, Massachusetts, in the Massachusetts Military Reservation, and an Adler silt (coarse-silty, mixed, superactive, thermic Fluvaquentic Eutrudepts), collected in Warren county, Mississippi. Soils were prepared by air-drying and then passing through a 2-mm sieve. Soils were analyzed for cation exchange capacity (CEC) using NaAc method (US EPA 1986a) and organic matter (OM) by

ERDC TR-08-1 12-10
Walkley-Black method. Particle size analysis by the hydrometer method (Gee and Or 2002) and soil pH determination in 1:1 soil/water slurry were also performed. Both soils had low CEC, low OM content (Table 12-2), and high saturated hydraulic conductivity.
Table 12-2. Physical and chemical properties of test soils (Dontsova et al. 2007).
Particle size (g kg–1)
CEC*
(cmolc kg–1) OM** (g kg–1) Sand Silt Clay pH
Adler silt 16.6 5 125 833 42 7.9
Plymouth sand 4.4 8.5 933 58 8 5.2
* Cation Exchange Capacity ** Organic matter
Saturated Experiments: Continuous and Stopped-Flow Experiments
Soils were packed into stainless-steel columns 17 cm in length and 10.16 cm in diameter (Dontsova et al. 2006, Jenkins et al. 2007). An average bulk density was 1.73 ± 0.02 g cm–3 for the Plymouth sand and 1.37 ± 0.01 g cm–3 for the Adler silt. Soils were first saturated from the bottom for 20 hours. Column pore volume (PV) was calculated from the volume of solu-tion necessary to saturate the column. Then flow of 0.005 M CaBr2 back-ground solution was started using a Fisherbrand Low-Flow Peristaltic Pump (Fisher Scientific, Houston, Texas). Top-to-bottom direction was selected to ease placement of explosives. No evidence of air entrapment was observed. Solution flux was 0.86 ± 0.05 cm h–1 (representing ap-proximately 1/5 average one-year rainfall intensity in eastern United States) (National Weather Service Eastern Region Headquarters). After flow rate reached steady state, flow was stopped and approximately 10 g (three pellets for M30) of propellant was placed on the soil surface. Pro-pellant grains were positioned between two layers of fabric to facilitate removal of undissolved material at end of the experiment. The initial mass of propellant added to the columns is listed in Table 12-3. Afterward, the columns were eluted with the background CaBr2 solution spiked with triti-ated water (3H2O) (specific activity = 2.18 mCi mmol–1 with 1.239 × 10⁻⁶ % 3H2O in solution) to serve as a conservative tracer to determine longitudi-nal dispersivity (λ) and to validate estimates of pore volume. Column elu-ate was collected in 40-mL amber glass vials using an automated Universal fraction collector (Eldex Laboratories, Inc., Napa, California). After leach-ing the columns with approx. 7 to 8 PV for Adler soil and 10 to 11 PV for
ERDC TR-08-1 12-11
Plymouth soil (about 5.5 L of solution) of the background solution, the remaining propellant particles were removed, and the columns were then leached with a 0.005 M CaBr2 solution (without the tritiated water tracer) for another 11 to 17 PV (depending on the soil). Presence of desorption phase in the experiments allowed us to positively distinguish between sol-ute retardation due to adsorption and possible delay in dissolution due to behavior of propellant matrix. During stopped-flow experiments, column leaching was interrupted for a 24-h period. For each soil/propellant com-bination, one uninterrupted and one interrupted flow experiment was con-ducted. A pair of experiments conducted with the same propellant and soil (with and without flow interruption) was used as replicates for statistical analysis of transport parameter estimates. Tritium activity was measured in every third collected sample (approximately every 0.1 L of collected eluate) by liquid scintillation counting using a Tri-Carb 2500TX Liquid Scintillation Analyzer (PerkinElmer Life and Analytical Sciences, Boston, Massachusetts). Approximately 20 of the collected elution samples for each experiment were analyzed for NG, NQ, and EC. NG was analyzed by high-performance liquid chromatography (HPLC) using SW846 Method 8332 (USEPA 1996) (detection limit of 0.050 mg L–1). NQ was analyzed by HPLC using the method described in USACE Special Report 89-35 (Walsh 1989) (detection limit of 0.050 mg L–1). EC samples were solvent ex-changed to hexane and analyzed by gas chromatography/mass spectrome-try (GC/MS) using selected ion monitoring, SW846 Method 8270c (detec-tion limit 0.025 mg L–1) (USEPA 1986b). At the end of the experiment, soil samples were collected at three points in the column: bottom, middle, and top. Soil samples for EC analysis were extracted with 75% methylene chlo-ride/25% acetone by method 3545a (USEPA 2007). The NQ was extracted with water and the NG with acetonitrile. Detection limits for propellant analysis in soils were 0.02 mg kg–1 for EC, 0.5 mg kg–1 for NG, and 0.75 mg kg–1 for NQ.
Numerical Analysis and Parameter Estimation
Numerical analysis of experiments was performed using the HYDRUS-1D code for simulating the one-dimensional movement of water, heat, and multiple solutes in variably saturated porous media (Šimunek et al. 2005). Transport of 3H2O tracer was described using the convection–dispersion equation for constant water content, flux density, and dispersion coeffi-cient:
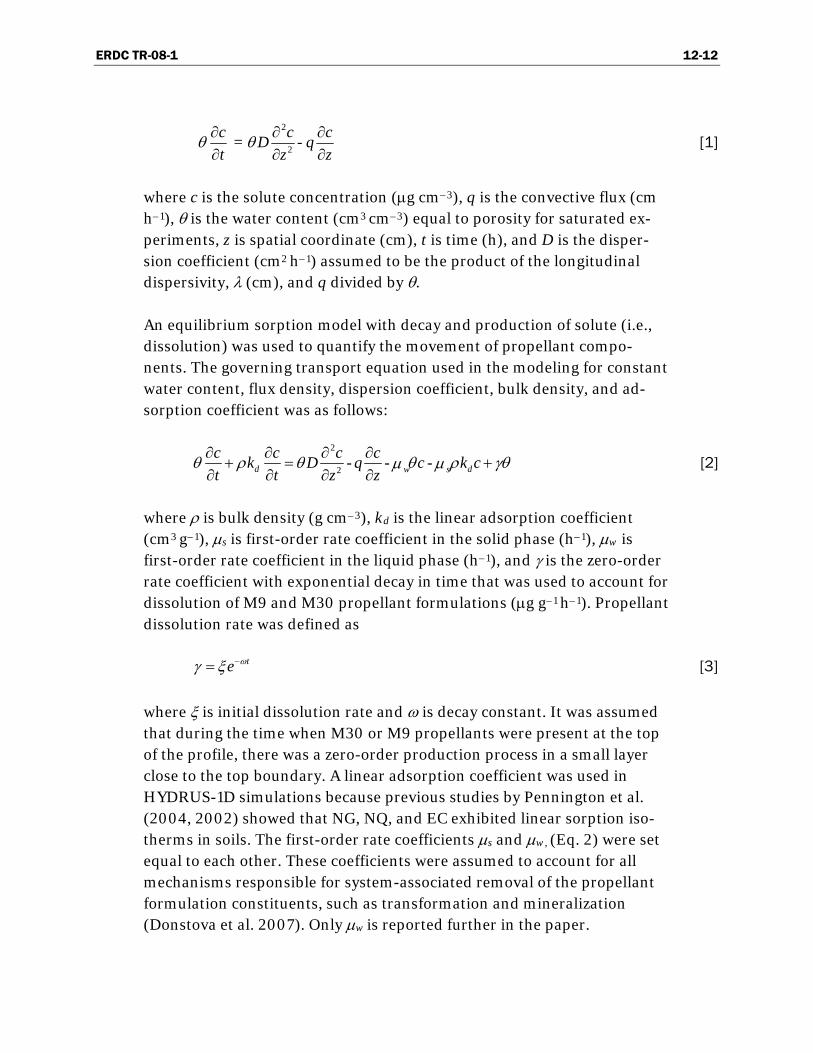
ERDC TR-08-1 12-12
2
2 = - c c cD qt z z
θ θ∂ ∂ ∂∂ ∂ ∂
[1]
where c is the solute concentration (μg cm–3), q is the convective flux (cm h–1), θ is the water content (cm3 cm–3) equal to porosity for saturated ex-periments, z is spatial coordinate (cm), t is time (h), and D is the disper-sion coefficient (cm2 h–1) assumed to be the product of the longitudinal dispersivity, λ (cm), and q divided by θ.
An equilibrium sorption model with decay and production of solute (i.e., dissolution) was used to quantify the movement of propellant compo-nents. The governing transport equation used in the modeling for constant water content, flux density, dispersion coefficient, bulk density, and ad-sorption coefficient was as follows:
2
2 - - -d dw sc c c ck D q c k ct t z z
θ ρ θ θ ρ γθμ μ∂ ∂ ∂ ∂
+ = +∂ ∂ ∂ ∂
[2]
where ρ is bulk density (g cm–3), kd is the linear adsorption coefficient (cm3 g–1), μs is first-order rate coefficient in the solid phase (h–1), μw is first-order rate coefficient in the liquid phase (h–1), and γ is the zero-order rate coefficient with exponential decay in time that was used to account for dissolution of M9 and M30 propellant formulations (μg g–1 h–1). Propellant dissolution rate was defined as
te ωγ ξ −= [3]
where ξ is initial dissolution rate and ω is decay constant. It was assumed that during the time when M30 or M9 propellants were present at the top of the profile, there was a zero-order production process in a small layer close to the top boundary. A linear adsorption coefficient was used in HYDRUS-1D simulations because previous studies by Pennington et al. (2004, 2002) showed that NG, NQ, and EC exhibited linear sorption iso-therms in soils. The first-order rate coefficients μs and μw, (Eq. 2) were set equal to each other. These coefficients were assumed to account for all mechanisms responsible for system-associated removal of the propellant formulation constituents, such as transformation and mineralization (Donstova et al. 2007). Only μw is reported further in the paper.

ERDC TR-08-1 12-13
The numerical analysis was carried out as follows: First, BTCs for the triti-ated water conservative tracer were used to estimate soil column longitu-dinal dispersivity, λ (cm). Second, propellant constituents BTCs were then analyzed using the chemical equilibrium model with the longitudinal dis-persivity fixed at the previously determined value from the corresponding tracer. The following parameters were estimated for propellants: an ad-sorption coefficient, kd (g–1 cm3) and two parameters characterizing disso-lution, ξ (μg g–1 h–1) and ω (h–1). Degradation was assumed to be the same as that observed for the soils with liquid phase propellants (Dontsova et al. 2007). Specifically, degradation rate for NG was set at 0.008 h–1 in Ply-mouth soil, and 0.021 h–1 in Adler soil. EC and NQ degradation rates for both soils were assumed to be zero.
Mass-balance calculations were performed for the 3H2O radiotracer and HPLC results (Table 12-3) by integrating each BTC. For NG, degradation was taken into account. The accuracy of mass-balance estimates was evaluated using the recovery of tritiated water as a conservative tracer.
The R2 values and confidence intervals for fitted parameters were obtained by analyzing correspondence between measured and fitted breakthrough concentrations and behavior of the objective function around its mini-mum, respectively (Šimunek and Hopmans 2002). Parameter estimates were considered significant if they were different from zero (confidence intervals did not intersect with zero). For comparison between treatments, differences were considered significant when greater than the sum of standard errors of the means multiplied by 1.96 (for 95% probability).

ERDC TR-08-1 12-14
Table 12-3. Initial mass of M9 and M30 propellants and recovery of nitroglycerin (NG), nitroguanidine (NQ), ethyl centralite (EC), and 3H20 tracer. CF = continuous flow, SF = stopped flow.
Recovery (mg) % Recovery
NG NQ EC 3H20 NG NQ EC
Treatment Initial mass
(g) Soln. Soln.
+ deg* Soil
Soln. + deg + soil Soln. Soln. Soil
Soln. + soil Soln. Soln.
Soln. + deg.
Soln. + deg + soil Soln. Soln.
Soln. + soil
M30
Adler CF 10.8240 15.5 21.0 — 21.0 11.7 3.94 0.15 4.09 99.53 0.64 0.86 0.86 0.23 2.43 2.52
Adler SF 11.0079 34.3 46.4 — 46.4 18.6 4.10 0.15 4.25 100.21 1.38 1.87 1.87 0.36 2.48 2.58
Plymouth CF 10.8820 24.1 26.8 — 26.8 13.4 2.76 0.82 3.58 101.22 0.99 1.10 1.10 0.26 1.69 2.19
Plymouth SF 9.7537 14.2 15.7 — 15.7 8.4 2.64 0.64 3.28 98.37 0.65 0.72 0.72 0.18 1.80 2.24
Average 22.0 27.5 — 27.5 13.0 3.36 0.44 3.80 99.83 0.91 1.14 1.14 0.26 2.10 2.38
Std. error** 4.6 6.7 — 6.7 2.1 0.38 0.17 0.23 0.60 0.18 0.26 0.26 0.04 0.21 0.10
M9
Adler CF 10.0426 596.9 807.7 — 807.7 — 0.91 0.14 1.05 97.75 14.86 20.11 20.11 — 1.21 1.39
Adler SF 9.9971 170.7 231.0 — 231.0 — 0.23 0.20 0.43 98.96 4.27 5.78 5.78 — 0.31 0.57
Plymouth CF 10.0069 924.5 1027.2 2.0 1029.2 — 1.35 0.87 2.22 98.10 23.10 25.66 25.71 — 1.80 2.96
Plymouth SF 10.1119 526.5 585.0 2.1 587.1 — 0.57 1.45 2.02 99.82 13.02 14.46 14.68 — 0.75 2.66
Average 554.7 662.7 — 663.8 — 0.77 0.66 1.43 98.66 13.81 16.50 16.57 — 1.02 1.90
Std. error 154.6 169.9 — 170.2 — 0.24 0.31 0.42 0.46 3.86 4.24 4.24 — 0.32 0.56
* Soln.+deg. = Calculated recovery of NG from propellants taking into account NG degradation in the column (26.1% in Adler soil and 10% in Plymouth soil). ** n = 4.
ERDC TR-08-1 12-15
Results
Conservative Tracer
HYDRUS-1D inverse solution option was used to analyze breakthrough of the conservative tracer, tritiated water. This allowed for the determination of longitudinal dispersivity, λ, a combined measure of dispersion and dif-fusion forces contributing to the total movement of solute. Column dis-persivity was about an order of magnitude larger in the Plymouth soil (0.069 ± 0.002 cm in M30 experiments and 0.117 ± 0.001 cm in M9 ex-periments) than in Adler soil (0.788 ± 0.002 cm in M30 experiments and 1.354 ± 0.610 cm in M9 experiments) (Table 12-4), most likely due to dif-ferences in texture. Determined dispersivity values for both soils were small, as generally observed in short repacked columns. HYDRUS-1D simulations adequately described tritiated water BTC by the convection–dispersion model (R2 values were all above 0.99), indicating that sources of physical non-equilibrium negligibly contributed to solute movement. Similar results were obtained for tritiated water movement in the stopped-flow experiments as well—effluent concentrations of 3H2O were similar be-fore and after column flow was interrupted. Mass balance estimates (Table 12-3) indicated that 99.2 ± 0.4 % of added 3H2O was recovered in outflow. Conservative tracer breakthroughs are plotted on Figures 12-2 through 12-5 as hollow triangles. The tritiated water breakthroughs were also used to verify pore volume estimates obtained during the presaturation phase of preparing the soil columns. Pore volume estimated before experiment (521 ± 15 mL for Plymouth soil and 713 ± 12 mL for Adler soil) agreed with pore volume from 3H20 breakthrough.

ERDC TR-08-1 12-16
Table 12-4. Solute transport parameters obtained by HYDRUS-1D for saturated flow experiments with 3H2O, nitroglycerin (NG), nitroguanidine (NQ), and ethyl centralite (EC) eluting from M30 and M9 propellants in Adler and Plymouth soils. CF = continuous flow, SF = stopped flow.
Water flow parameters Solute transport parameters
PV1, 2 λ R2 ω ξ kd R2
Treatment ml cm h–1 μg g–1 h–1 cm3 g–1
NG 0.023 ± 0.002 64.89 ± 4.69 0.155 ± 0.007 0.967
NQ 0.053 ± 0.004 80.07 ± 3.38 0.046 ± 0.004 0.986 Adler CF 719 0.070 ± 0.0063 0.996
EC 0.060 ± 0.003 23.62 ± 0.87 1.352 ± 0.011 0.997
NG 0.005 ± 0.001 65.80 ± 0.98 0.089 ± 0.003 0.979
NQ 0.037 ± 0.008 77.26 ± 8.70 0.021 ± 0.016 0.911 Adler SF 733 0.067 ± 0.004 0.998
EC 0.056 ± 0.004 20.08 ± 1.43 1.360 ± 0.024 0.984
NG 0.011 ± 0.001 59.55 ± 2.87 0.178 ± 0.014 0.985
NQ 0.033 ± 0.003 60.85 ± 3.19 0.036 ± 0.009 0.980 Plymouth CF 546 0.791 ± 0.000 0.997
EC 0.022 ± 0.005 8.07 ± 1.22 0.505 ± 0.063 0.868
NG 0.027 ± 0.001 46.73 ± 1.36 0.218 ± 0.021 0.942
NQ 0.064 ± 0.006 69.35 ± 5.02 0.101 ± 0.015 0.979
M30
Plymouth SF 546 0.784 ± 0.000 0.995
EC 0.050 ± 0.005 14.38 ± 1.13 0.870 ± 0.041 0.988
NG 0.023 ± 0.004 2707.97 ± 234.26 0.073 ± 0.015 0.906 Adler CF 678 0.116 ± 0.003 0.992
EC 0.005 ± 0.007 1.60 ± 0.38 3.202 ± 0.161 0.895
NG 0.000 ± 0.002 295.27 ± 20.87 0.136 ± 0.044 0.807 Adler SF 722 0.119 ± 0.005 0.998
EC 0.041 ± 0.008 1.11 ± 0.18 4.251 ± 0.100 0.966
NG NA4 2157.00 ± NA4 0.100 ± NA4 0.400 Plymouth CF 489 0.744 ± 0.001 0.995
EC 0.024 ± 0.023 4.22 ± 2.49 2.021 ± 0.347 0.843
NG 0.008 ± 0.002 1173.16 ± 87.21 0.165 ± 0.029 0.958
M9
Plymouth SF 502 1.964 ± 0.000 0.997 EC 0.024 ± NA4 1.09 ± NA4 2.000 ± NA4 0.315
1 PV = pore volume; λ = longitudinal dispersivity; ξ = initial dissolution rate; ω = dissolution rate decay constant; kd = adsorption coefficient 2 PV was determined during saturation, λ was estimated from 3H2O breakthrough, and ξ, ω, and kd were estimated from propellant breakthrough curves.
First-order rate coefficient for dissolved phase, or degradation rate (μw) for NG was set at 0.008 h–1 in Plymouth soil and 0.021 h–1 in Adler soil. EC and NQ degradation rates for both soils were assumed to be zero (Dontsova et al. 2007).
3 Estimated value and standard error that describes confidence in an estimated parameter, determined internally by HYDRUS-1D. 4 NA = Non-applicable due to manual fit of parameters.
ERDC TR-08-1 12-17
Solid Propellants
M30
Leaching of soil column containing M30 propellant particles for three days resulted in removal (on average) of approximately 1.14% of NG, 0.26% of NQ, and 2.38% of EC (Table 12-3). Breakthrough curves (Fig. 12-2 and 12-3) were similar between the two runs for each soil (with and without flow interruption). Delay in breakthrough indicated greater adsorption of NG compared to NQ, with EC experiencing greatest retardation. After initial breakthrough, outflow concentrations of all three studied solutes de-creased, indicating decrease in dissolution rate. Outflow concentrations were considerably lower than solubilities for these compounds (about 1.6 g L–1 for NG, 3.8 g L–1 for NQ, and 23 mg L–1 for EC) (Mirecki et al. 2006, Pennington et al. 2004), indicating that dissolution rate, rather than solu-bility, controlled release of propellants from the formulations.
In the stopped-flow (SF) experiments, concentrations of both NQ and EC did not change over the 24-hour time period between the moment solution flow was stopped and then resumed. This behavior suggests that the 24-hour time period was not sufficient to generate measurable differences in sorption or degradation for NQ and EC, in agreement with previous stud-ies (Dontsova et al. 2007, Pennington et al. 2004). On the other hand, NG outflow concentrations decreased after SF—a behavior that may be attrib-uted to in-situ degradation processes (i.e., transformation, mineralization) that were observed in solution-phase transport studies (Dontsova et al. 2007). While chemical non-equilibrium processes can also contribute to concentration decrease during flow interruption, and chemical non-equilibrium was observed for liquid phase NG (Dontsova et al. 2007), lim-ited tailing after removal of propellants from soils indicated that kinetic sorption was not affecting NG fate in soils.
After column solution leaching was resumed, we observed an immediate increase in outflow concentration for NG, but not for EC or NQ. This in-crease is explained by continued release of NG from M30 pellets while flow is stopped. In the presence of nitrocellulose matrix, dissolution of propellants from M30 pellets depended on the rate of diffusion of propel-lant constituents from pellet interior. For NQ, which had faster decay in dissolution rate and no increase in concentration upon flow resumption, this indicates low diffusion rate, while for NG, slower decay and increase in concentration indicate faster diffusion.
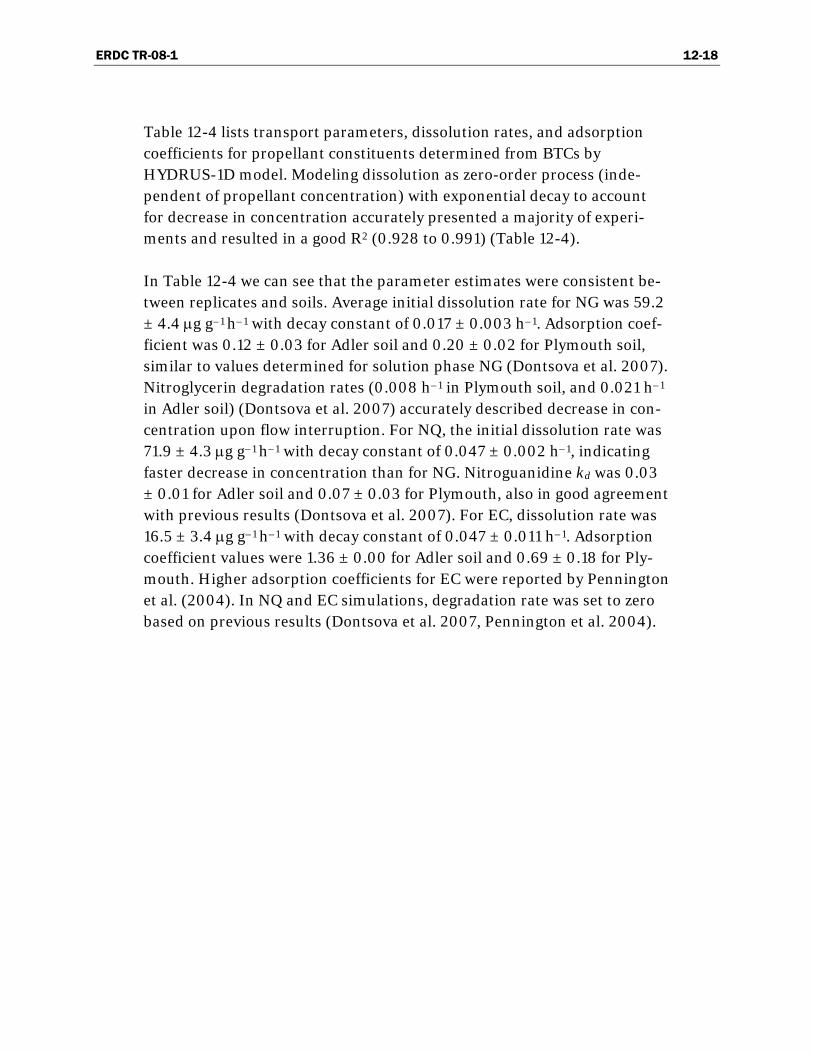
ERDC TR-08-1 12-18
Table 12-4 lists transport parameters, dissolution rates, and adsorption coefficients for propellant constituents determined from BTCs by HYDRUS-1D model. Modeling dissolution as zero-order process (inde-pendent of propellant concentration) with exponential decay to account for decrease in concentration accurately presented a majority of experi-ments and resulted in a good R2 (0.928 to 0.991) (Table 12-4).
In Table 12-4 we can see that the parameter estimates were consistent be-tween replicates and soils. Average initial dissolution rate for NG was 59.2 ± 4.4 μg g–1 h–1 with decay constant of 0.017 ± 0.003 h–1. Adsorption coef-ficient was 0.12 ± 0.03 for Adler soil and 0.20 ± 0.02 for Plymouth soil, similar to values determined for solution phase NG (Dontsova et al. 2007). Nitroglycerin degradation rates (0.008 h–1 in Plymouth soil, and 0.021 h–1 in Adler soil) (Dontsova et al. 2007) accurately described decrease in con-centration upon flow interruption. For NQ, the initial dissolution rate was 71.9 ± 4.3 μg g–1 h–1 with decay constant of 0.047 ± 0.002 h–1, indicating faster decrease in concentration than for NG. Nitroguanidine kd was 0.03 ± 0.01 for Adler soil and 0.07 ± 0.03 for Plymouth, also in good agreement with previous results (Dontsova et al. 2007). For EC, dissolution rate was 16.5 ± 3.4 μg g–1 h–1 with decay constant of 0.047 ± 0.011 h–1. Adsorption coefficient values were 1.36 ± 0.00 for Adler soil and 0.69 ± 0.18 for Ply-mouth. Higher adsorption coefficients for EC were reported by Pennington et al. (2004). In NQ and EC simulations, degradation rate was set to zero based on previous results (Dontsova et al. 2007, Pennington et al. 2004).

ERDC TR-08-1 12-19
M30 Adler CF
0
2
4
6
8
10
12
0 2 4 6 8 10 12 14 16
Pore volumes
Pro
pella
nt, m
g L
-1
0
0.2
0.4
0.6
0.8
1
1.2
3 H2O
C/C
0
NGNQEC3H2O
M30 Adler SF
0
2
4
6
8
10
12
0 2 4 6 8 10 12 14 16
Pore volumes
Pro
pella
nt, m
g L
-1
0
0.2
0.4
0.6
0.8
1
1.2
3 H2O
C/C
0
NGNQEC3H2O
Figure 12-2. Breakthrough curves for nitroglycerin (NG), nitroguanidine (NQ), and ethyl centralite (EC) from M30 propellant, and tritiated water in Adler silt under continuous-flow (CF, top) and stopped-flow (SF, bottom) conditions. Grey vertical lines indicate time points when flow was stopped and propellants removed. Each figure represents one experiment.
Propellant grains
removed
Propellant grains
removed
Flow stopped

ERDC TR-08-1 12-20
M30 Plymouth CF
0
2
4
6
8
10
12
0 2 4 6 8 10 12 14 16
Pore volumes
Pro
pella
nt, m
g L
-1
0
0.2
0.4
0.6
0.8
1
1.2
3 H2O
C/C
0
NGNQEC3H2O
M30 Plymouth SF
0
2
4
6
8
10
12
0 2 4 6 8 10 12 14 16
Pore volumes
Prop
ella
nt, m
g L
-1
0
0.2
0.4
0.6
0.8
1
1.2
3 H 2O
C/C
0
NGNQEC3H2O
Figure 12-3. Breakthrough curves for nitroglycerin (NG), nitroguanidine (NQ), and ethyl centralite (EC) from M30 propellant, and tritiated water in Plymouth sand under continuous-flow (CF, top) and stopped-flow (SF, bottom) conditions. Grey vertical lines indicate time points when flow was stopped and propellants removed. Each figure represents one experiment.
Propellant grains
removed
Flow stopped
Propellant grains
removed

ERDC TR-08-1 12-21
Similar to observations by Mirecki et al. (2006), no morphological changes to M30 pellets, including size, shape, and surface appearance, were ob-served over the course of the test. The only change was shinier surface of graphite coating, compared to new propellant grains. Mirecki et al. (2006) observed greater release of propellants in nine days from M30 pellets dur-ing batch-stirred dissolution studies (about 13% NG, 2.6% NQ, and 8.4% EC). In spite of the fact that NQ makes up the highest proportion of M30 mass (47% NQ vs. 22.5% NG) and has higher solubility than NG, Mirecki et al. (2006) observed that NQ was released at a slower rate than NG. In current study, EC, despite low concentration in the propellant formula-tion, was most easily released. Amount of EC leached from M30 propellant (3.80 g on average) was lower than NG (27.48 g) and NQ (13.03 g), but it represented a larger fraction of total available EC in a pellet. It is impor-tant to note, however, that total effluent concentrations of the propellant constituents measured in this study were lower than those reported by Mirecki et al. (2006), who studied propellant dissolution using continu-ously stirred systems. We assume that continuous stirring may have in-creased the dissolution kinetics of the propellant formulations because of scouring of the particle surfaces.
Analysis of soil samples collected in top, middle, and bottom sections of the columns confirmed complete elution of NQ and NG in all experiments (Table 12-5). Ethyl centralite was present in all columns at the end of the experiment, consistent with continued measured elution. Amount meas-ured constituted a significant part of total EC dissolved from propellants (Table 12-3).
M9
Breakthrough curves of M9 propellant constituents had some of the same patterns that were observed for M30 propellant, but they also exhibited many differences (Fig. 12-4 and 12-5). Outflow concentrations and recov-ery of propellant constituents were considerably greater. Highest observed NG concentration was greater than 400 mg L–1, while in M30 propellant, concentration did not exceed 8 mg L–1. Breakthrough curves were not con-sistent and did not replicate well. Peak concentrations varied between the replicates by a factor of 5. Mass balance calculations indicated that 663.8 g of NG (24 times greater than in M30) and 1.43 g of EC (2.7 times less than in M30) (Table 12-3) were released from M9 propellant in soil columns. Greater NG release can be explained by greater NG content in the particles (40% vs. 22.5% in M30). Smaller particle size, and therefore greater avail-
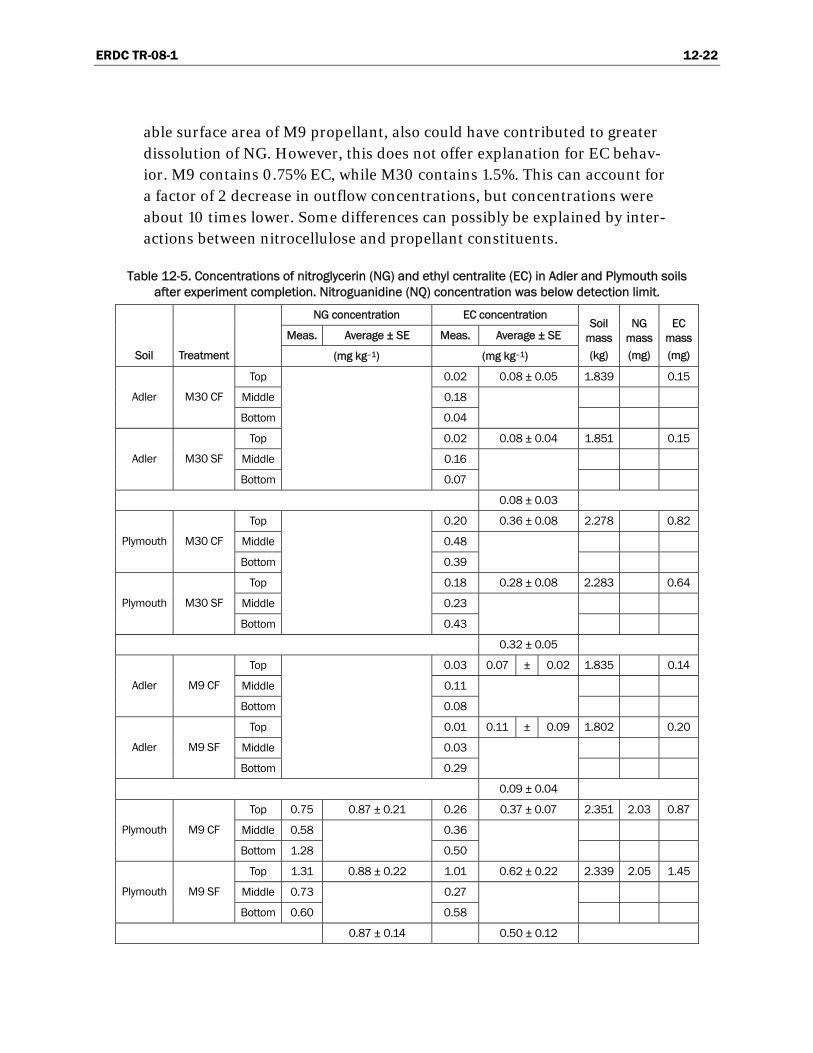
ERDC TR-08-1 12-22
able surface area of M9 propellant, also could have contributed to greater dissolution of NG. However, this does not offer explanation for EC behav-ior. M9 contains 0.75% EC, while M30 contains 1.5%. This can account for a factor of 2 decrease in outflow concentrations, but concentrations were about 10 times lower. Some differences can possibly be explained by inter-actions between nitrocellulose and propellant constituents.
Table 12-5. Concentrations of nitroglycerin (NG) and ethyl centralite (EC) in Adler and Plymouth soils after experiment completion. Nitroguanidine (NQ) concentration was below detection limit.
NG concentration EC concentration
Meas. Average ± SE Meas. Average ± SE
Soil Treatment (mg kg–1) (mg kg–1)
Soil mass (kg)
NG mass (mg)
EC mass (mg)
Top 0.02 0.08 ± 0.05 1.839 0.15
Middle 0.18 Adler M30 CF
Bottom 0.04
Top 0.02 0.08 ± 0.04 1.851 0.15
Middle 0.16 Adler M30 SF
Bottom 0.07
0.08 ± 0.03
Top 0.20 0.36 ± 0.08 2.278 0.82
Middle 0.48 Plymouth M30 CF
Bottom 0.39
Top 0.18 0.28 ± 0.08 2.283 0.64
Middle 0.23 Plymouth M30 SF
Bottom 0.43
0.32 ± 0.05
Top 0.03 0.07 ± 0.02 1.835 0.14
Middle 0.11 Adler M9 CF
Bottom 0.08
Top 0.01 0.11 ± 0.09 1.802 0.20
Middle 0.03 Adler M9 SF
Bottom 0.29
0.09 ± 0.04
Top 0.75 0.87 ± 0.21 0.26 0.37 ± 0.07 2.351 2.03 0.87
Middle 0.58 0.36 Plymouth M9 CF
Bottom 1.28 0.50
Top 1.31 0.88 ± 0.22 1.01 0.62 ± 0.22 2.339 2.05 1.45
Middle 0.73 0.27 Plymouth M9 SF
Bottom 0.60 0.58
0.87 ± 0.14 0.50 ± 0.12
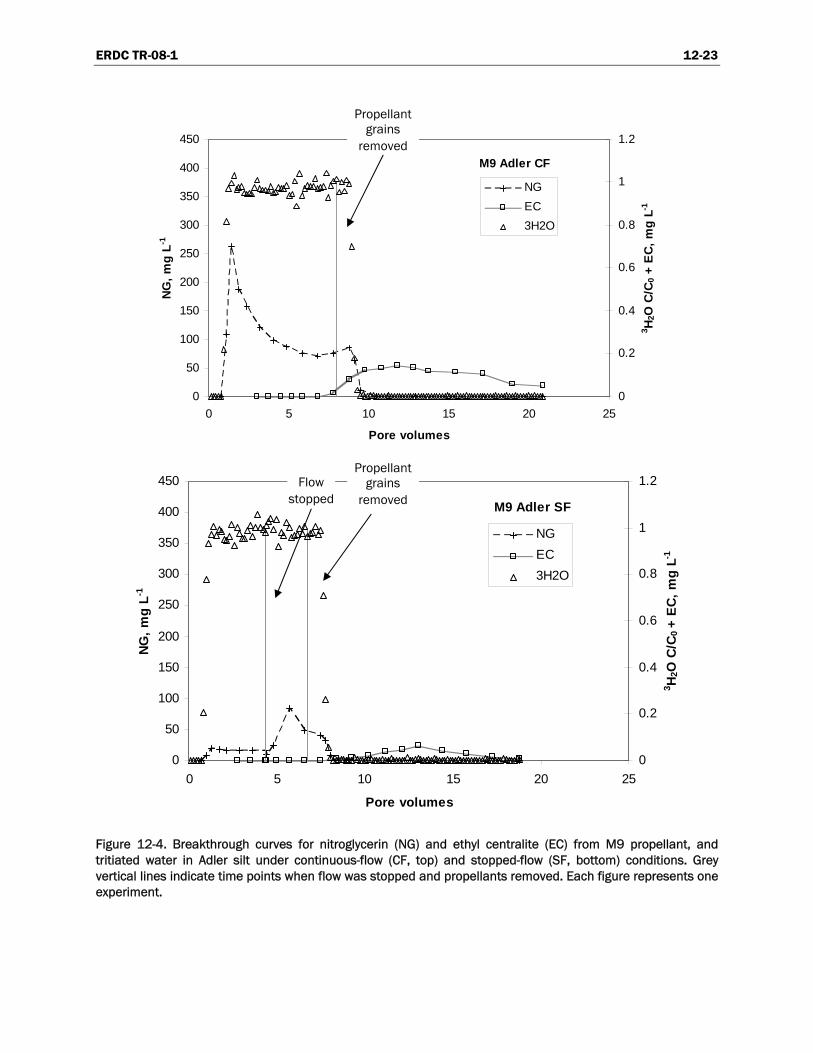
ERDC TR-08-1 12-23
M9 Adler CF
0
50
100
150
200
250
300
350
400
450
0 5 10 15 20 25
Pore volumes
NG, m
g L-1
0
0.2
0.4
0.6
0.8
1
1.2
3 H 2O
C/C
0 + E
C, m
g L-1
NGEC3H2O
M9 Adler SF
0
50
100
150
200
250
300
350
400
450
0 5 10 15 20 25
Pore volumes
NG, m
g L-1
0
0.2
0.4
0.6
0.8
1
1.2
3 H2O
C/C
0 +
EC, m
g L-1
NGEC3H2O
Figure 12-4. Breakthrough curves for nitroglycerin (NG) and ethyl centralite (EC) from M9 propellant, and tritiated water in Adler silt under continuous-flow (CF, top) and stopped-flow (SF, bottom) conditions. Grey vertical lines indicate time points when flow was stopped and propellants removed. Each figure represents one experiment.
Propellant grains
removed
Propellant grains
removed Flow
stopped
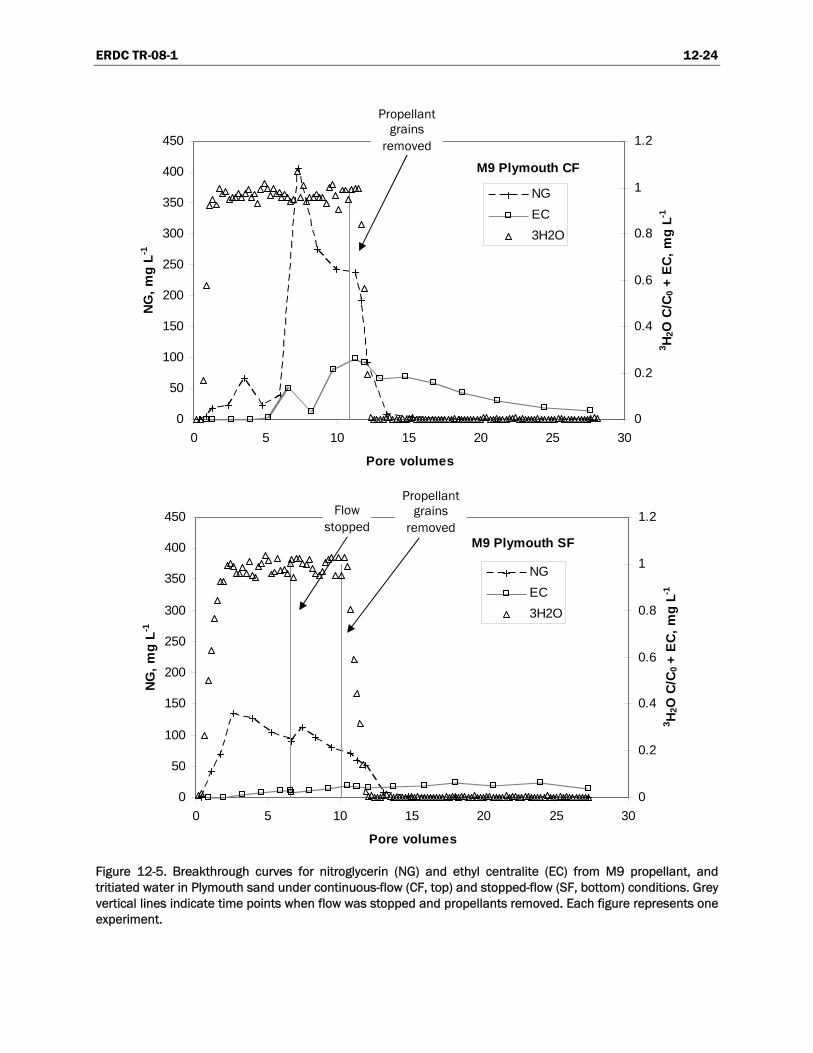
ERDC TR-08-1 12-24
M9 Plymouth CF
0
50
100
150
200
250
300
350
400
450
0 5 10 15 20 25 30
Pore volumes
NG
, mg
L-1
0
0.2
0.4
0.6
0.8
1
1.2
3 H2O
C/C
0 +
EC, m
g L-1
NGEC3H2O
M9 Plymouth SF
0
50
100
150
200
250
300
350
400
450
0 5 10 15 20 25 30
Pore volumes
NG
, mg
L-1
0
0.2
0.4
0.6
0.8
1
1.2
3 H 2O
C/C
0 +
EC, m
g L-1
NGEC3H2O
Figure 12-5. Breakthrough curves for nitroglycerin (NG) and ethyl centralite (EC) from M9 propellant, and tritiated water in Plymouth sand under continuous-flow (CF, top) and stopped-flow (SF, bottom) conditions. Grey vertical lines indicate time points when flow was stopped and propellants removed. Each figure represents one experiment.
Propellant grains
removed
Propellant grains
removed Flow
stopped

ERDC TR-08-1 12-25
At the same time, some of the trends observed in M30 experiments could be seen in M9 runs as well. Generally, outflow concentration decreased in time. Concentration of NG initially decreased after flow interruption, fol-lowed by increase, similarly to M30, indicating that the same mechanisms are governing M9 and M30 dissolution. Ethyl centralite experienced greater retardation than NG when originating from both M9 and M30.
Parameter estimates for all M9 breakthrough curves were obtained, but the irregular shape of the curves reduced the accuracy of our estimates (R2 between 0.580 and 0.931). Average dissolution rate for NG was 1583 ± 534 μg g–1 h–1, much greater than for M30 propellant, with decay constant of 0.008 ± 0.004 h–1. Adsorption coefficient estimates, on the other hand, were more consistent; kd was 0.11 ± 0.03 for Adler soil and 0.13 ± 0.03 for Plymouth soil, similar to M30 and solution phase estimates (Dontsova et al. 2007). For EC, dissolution rate was 2.0 ± 0.7 μg g–1 h–1 with decay con-stant of 0.024 ± 0.000 h–1. Adsorption coefficient values were 3.72 ± 0.53 for Adler soil and 2.01 ± 0.01 for Plymouth. Adsorption coefficients were higher than in M30, possibly due to lower solution concentrations, though Pennington et al. (2004) reported linear sorption for EC.
Soil NG concentration was below detection limit of 0.5 mg kg–1 for Adler soil, but NG was detected in Plymouth soil (Table 12-5). This agrees with detectable concentrations still present in elutriate when experiments were finished. However, soil (0.87 ± 0.14 mg kg–1) and solution (0.152 ± 0.038 mg L–1) concentrations were low relative to concentrations observed at the peak of breaththrough and solution concentrations continued to decrease rapidly. A considerable amount of EC was retained in the columns; about 43% of total EC dissolved from the particles. This amount was larger for SF experiments, indicating that EC breakthrough was not complete.
Mirecki et al. (2006) observed fast initial dissolution of M9 propellant in batch studies, up to 600 mg L–1 NG, followed by slower dissolution, when concentration did not change. Sharp dissolution peak followed by decrease in dissolution rate observed for both propellants in this study was also re-ported for propellant contaminated soils (Hewitt and Bigl 2005) and M1 single-base propellant pellets (Dontsova et al. unpublished). This is ex-plained by slow diffusion of propellant constituents from the pellet inte-rior. As propellants are contaminating soils as particles and fibers, it is also valid for contaminated soils. Different rates of decrease in dissolution rate between propellant constituents may reflect differences in diffusion rates.

ERDC TR-08-1 12-26
Conclusions
Saturated flow experiments, conducted at ERDC to evaluate dissolution of nitroglycerin, nitroguanidine, and ethyl centralite from M9 and M30 pro-pellants, indicated that solid propellant formulations can be a significant source of energetic compounds. Up to 26% of NG present in M9 propellant and up to 1.9% in M30 propellant was released in three days. After initial breakthrough, outflow concentrations of all three studied solutes de-creased, indicating decrease in dissolution rate, possibly due to restrictions imposed by the nitrocellulose matrix.
Delay in breakthrough indicated greater adsorption of NG compared to NQ, with EC experiencing greatest retardation. Nitroguanidine experi-enced little adsorption and no degradation, and therefore would have high mobility in soils. However, slow diffusion of NQ from propellant composi-tions would tend to decrease its release. Previous work (Pennington et al. 2004) showed that EC exhibited no degradation, but greater adsorption than other propellant constituents. Their conclusions were confirmed in this study. EC had greatest retardation. Also, release of EC from propellant formulations was low, with concentrations not exceeding 2 mg L–1. NG was released in greatest concentrations from propellants. In combination with its toxicity and low affinity for soils, this presents the greatest environ-mental challenge.
ERDC TR-08-1 12-27
References
Adrian, N.R. (1996) The biodegradation of propellants M31A1E1 and NOSIH-AA2 in compost, soil slurries, and liquid cultures. US Army Construction Engineering Research Laboratories, Champaign, Illinois, Technical Report 96/83.
Boudeau, D.T. (1993) Military energetic materials: Explosives and propellants, p. 205–357 in The Soldier and the Industrial Base (D.P. Deeter and J.C. Gaydos, Ed.). Occupational health—Office of the Surgeon General, Walter Reed Medical Center, Washington, DC.
Brannon, J.M., C.B. Price, S. Yost, and C. Hayes (2002) The fate of nitroglycerine, RDX transformation products, and TNT impurities. Soil & Sediment Contamination 11:385–391.
Defense Ammunition Center, USA (2003) Propellant Management Guide. Logistics Review and Technical Assistance Office, McAlester, Oklahoma.
Dontsova, K.M., C. Hayes, J. Šimunek, J.C. Pennington, and C.W. Williford (Unpublished) Transport of 2,4-DNT and M1 propellant in soils.
Dontsova, K.M., S.L. Yost, J. Šimunek, J.C. Pennington, and C.W. Williford (2006) Dissolution and transport of TNT, RDX, and Composition B in saturated soil columns. Journal of Environmental Quality 35:2043–2054.
Dontsova, K.M., J.C. Pennington, S. Yost, and C. Hayes (2007) Transport of Nitroglycer-in, Nitroguanidine and Diphenylamine in Soils Characterization and Fate of Gun and Rocket Propellant Residues on Testing and Training Ranges: Interim Report 1. US Army Engineer Research and Development Center, Vicksburg, Mississippi, Technical Report TR-07-1.
Gee, G.W., and D. Or (2002) Particle-size analysis, p. 255–294 in Methods of Soil Analysis. Part 4. Physical Methods (J.H. Dane and G. Clarke Topp, Ed.). Soil Science Society of America, Madison, Wisconsin.
Hathaway, G.J., N.H. Proctor, J.P. Hughes, and M.L. Fischman. (1991) Proctor and Hughes' Chemical Hazards of the Workplace, 3rd ed. New York: Van Nostrand Reinhold.
Hewitt, A.D., and S.R. Bigl (2005) Elution of Energetic Compounds from Propellant and Composition B Residues. US Army Engineer Research and Development Center, Cold Regions Research and Engineering Laboratory, Hanover, New Hampshire, Technical Report ERDC/CRREL TR-05-13.
Hiatt, G.F., S.K. Sano, C.R. Wheeler, and D.W. Korte, Jr. (1988) Acute Oral Toxicity of Nitroguanidine in Mice: Final Report. 26 September–7 November 84. Letterman Army Institute of Research, San Francisco, California.
ERDC TR-08-1 12-28
Jenkins, T.F., A.D. Hewitt, C.L. Grant, S. Thiboutot, G. Ampleman, M.E. Walsh, T.A. Ranney, C.A. Ramsey, A.J. Palazzo, and J.C. Pennington (2006) Identity and distribution of residues of energetic compounds at army live-fire training ranges. Chemosphere 63:1280–1290.
Jenkins, T.F., J.C. Pennington, G. Ampleman, S. Thiboutot, M.R. Walsh, E. Diaz, K.M. Dontsova, A.D. Hewitt, M.E. Walsh, S.R. Bigl, S. Taylor, D.K. MacMillan, J.L. Clausen, D. Lambert, N.M. Perron, M.C. Lapointe, S. Brochu, M. Brassard, R. Stowe, R. Farinaccio, A. Gagnon, A. Marois, D. Gilbert, D. Faucher, S. Yost, C. Hayes, C.A. Ramsey, R.J. Rachow, J.E. Zufelt, C.M. Collins, A.B. Gelvin, and S.P. Saari (2007) Characterization and Fate of Gun and Rocket Propellant Residues on Testing and Training Ranges: Interim Report 1. US Army Engineer Research and Development Center, Cold Regions Research and Engineering Laboratory, Hanover, New Hampshire, Technical Report TR-07-1.
Kaplan, D.L., J.H. Cornell, and A.M. Kaplan. (1982) Decomposition of nitroguanidine. Environmental Science and Technology 16:488–492.
Mirecki, J.E., B. Porter, and C.A. Weiss (2006) Environmental Transport and Fate Pro-cess Descriptors for Propellant Compounds. US Army Engineer Research and Development Center, Environmental Laboratory, Vicksburg, Mississippi, Tech-nical Report ERDC/EL TR-06-7.
Morley, M.C., H. Yamamoto, J. Speitel, E. Gerald, and J. Clausen (2006) Dissolution kinetics of high explosives particles in a saturated sandy soil. Journal of Contaminant Hydrology 85:141–158.
Mulherin, N.D., T.F. Jenkins, and M.E. Walsh (2005) Stability of Nitroguanidine in Moist, Unsaturated Soils. Engineer Research and Development Center, Cold Regions Research and Engineering Laboratory, Hanover, New Hampshire, Technical Report ERDC/CRREL TR-05-2.
National Weather Service Eastern Region Headquarters. Rainfall maps http://www.erh.noaa.gov/er/hq/.
NIOSH (1991) Registry of toxic effects of chemical substances: Nitroglycerin. US Depart-ment of Health and Human Services, Public Health Service, Centers for Disease Control, National Institute for Occupational Safety and Health, Division of Standards Development and Technology Transfer, Technical Information Branch, Cincinnati, Ohio.
Pennington, J.C., T.F. Jenkins, G. Ampleman, S. Thiboutot, J.M. Brannon, J. Lynch, T.A. Ranney, J.A. Stark, M.E. Walsh, J. Lewis, C.A. Hayes, J.E. Mirecki, A.D. Hewitt, N. Perron, D. Lambert, J. Clausen, and J.J. Delfino (2002) Distribution and Fate of Energetics on DoD Test and Training Ranges: Interim Report 2. US Army Engineer Research and Development Center, Vicksburg, Mississippi, Technical Report ERDC TR-02-8.
Pennington, J.C., T.F. Jenkins, G. Ampleman, and S. Thiboutot (2004) Distribution and Fate of Energetics on DoD Test and Training Ranges: Interim Report 4. US Army Engineer Research and Development Center, Technical Report ERDC TR-04-4.

ERDC TR-08-1 12-29
Šimunek, J., and J.W. Hopmans (2002) Parameter Optimization and Nonlinear Fitting, p. 139–157 in Methods of Soil Analysis, Part 1, Physical Methods, Third Edition (J.H. Dane and G.C. Topp, Ed.). SSSA, Madison, Wisconsin.
Šimunek, J., M.T. van Genuchten, and M. Šejna (2005) The HYDRUS-1D software pack-age for simulating the one-dimensional movement of water, heat, and multiple solutes in variably saturated media. Version 3.0. Department of Environmental Sciences, University of California Riverside, Riverside, California.
Spanggord, R.J., T. Mill, T.-W. Chou, J.H. Smith, and S. Lee (1980) Environmental fate studies on certain munitions wastewater constituents: Final report, phase II—Laboratory studies. SRI International, Menlo Park, California.
US Environmental Protection Agency (1986a) SW846 Method 9081. Cation-Exchange Capacity of Soils (Sodium Acetate). SW846, Method 9081. Office of Solid Waste and Emergency Response, Washington, DC.
US Environmental Protection Agency (1986b) SW846 Method 8270c. Semivolatile Organic Compounds by Gas Chromatography/Mass Spectrometry (GC/MS). SW846, Method 8270c. Office of Solid Waste and Emergency Response, Washington, DC.
US Environmental Protection Agency (1996) SW846 Method 8332. Nitroglycerine by High Performance Liquid Chromatography. Office of Solid Waste and Emergency Response, Washington, DC.
Walsh, M.E. (1989) Analytical Methods for Determining Nitroguanidine in Soil and Water. US Army Cold Regions Research and Engineering Laboratory, Hanover, New Hampshire, Special Report 89-35.
Wentsel, R.S., W.E. Jones III, W.H. Fitzpatrick, and J.F. Kitchens (1979) Problem definition study: Ethyl centralite. Final Report. Atlantic Research Corporation, Alexandria, Virginia.
Yost, S. (2004) Effects of redox potential and pH on the fate of nitroglycerin in a surface and aquifer soil. MS Thesis, Louisiana State University, Baton Rouge, Louisiana.

ERDC TR-08-1 12-30
Nomenclature
γ Zero-order rate coefficient with exponential time decay to account for dissolution of propellant (μg g–1 h–1)
ξ Initial dissolution rate (μg g–1 h–1)
θ Water content (cm3 cm–3)
λ Longitudinal dispersivity (cm)
μs First-order rate coefficient in the solid phase (h–1)
μw First-order rate coefficient in the liquid phase (h–1)
ρ Bulk density (g cm–3)
ω Dissolution rate decay constant (h–1).
BTC Breakthrough curve
c Solute concentration (μg cm–3)
CEC Cation Exchange Capacity
CF Continuous flow
D Dispersion coefficient (cm2 h–1)
DNT Dinitrotoluene
EC Ethyl Centralite (diethyl diphenyl urea)
EOD Explosive Ordnance Disposal
EPA Environmental Protection Agency
GC/MS Gas Chromatography/Mass Spectrometry
HPLC High-Performance Liquid Chromatography
kd Adsorption coefficient (cm3 g–1)

ERDC TR-08-1 12-31
Koc Adsorption coefficient normalized for soil organic carbon content
Kow Octanol–water partitioning coefficient
LD50 Median lethal dose
NC Nitrocellulose
NG Nitroglycerin
NQ Nitroguanidine
OM Organic matter
PV Pore Volume
q Convective flux (cm h–1)
SERDP Strategic Environmental Research and Development Program
SF Stopped flow
t Time (h)
z Spatial coordinate (cm)

THIS PAGE IS INTENTIONALLY BLANK.

ERDC TR-08-1 13-1
— Chapter 13 —
Estimating Perchlorate Deposition from the Firing of a MLRS Rocket
THOMAS F. JENKINS, ALAN D. HEWITT, SUSAN R. BIGL, DENNIS J. LAMBERT, AND JUDITH C. PENNINGTON
Abstract
Multi-increment soil samples were collected behind the firing point and along a sled track before and after launching a single Multiple Launch Rocket System (MLRS) rocket. The objective was to estimate the deposi-tion of propellant-related components during the firing activity. Soil sam-ples were ground and extracted with water, and the extracts were analyzed for the perchlorate ion using Ion Chromatography (Method 314.0) and LC/EIS/MS (Method 331.0). Measurements of perchlorate in the surface soils collected prior to and after the MLRS launch showed no statistically significant increase in concentration. However, we were able to calculate an estimate that the amount of perchlorate deposited was less than 1.6 g.

ERDC TR-08-1 13-2
Introduction
Over the past several years, a series of experiments has been conducted to estimate the deposition of energetic compounds from the firing of various types of Army munitions systems. The initial research concerned the depo-sition of unconsumed explosives residues from high-order detonations of warheads from artillery and mortar rounds (Jenkins et al. 2002a; Hewitt et al. 2003, 2005; Walsh et al. 2005 a,b,c, 2006). Pennington et al. (2005) estimated the mass of explosives residues from low-order detonations of various munitions. More recently, work has been directed at estimating the amount of propellant residues deposited at the firing points from the firing of various army guns and mortars, to include 60-, 81-, and 120-mm mortars, 105-mm and 155-mm howitzers, and small arms (M.E. Walsh et al. 2004; M.R. Walsh et al. 2005 b,c, 2006, 2007).
Other studies have shown that residue accumulation is significant at ranges where 66-mm M-72 rockets are fired (Jenkins et al. 2002b, 2004; Thiboutot et al. 2003). These results indicate that most of the residues are deposited behind the firing line, rather than between the firing line and the target. Currently, only Thiboutot et al. (2007) have reported an esti-mate of the total mass deposited from firing a large rocket motor. They studied the deposition of perchlorate from static firing of 15 Mk58 rocket motors. This motor is used in the AIM-7 Rocket that has been used by the Canadian and US Air Forces for many years. While each Mk58 motor con-tains 47 kg of ammonium perchlorate, they estimate that only about 2 mg of perchlorate was deposited as particulate material for each motor that was fired.
The propellant for the MLRS rocket is 98.2 kg (216.5 lb) of Arcadene 360B with 630 g of WC818. The Arcadene 360B is composed of ammonium per-chlorate, aluminum powder, hydroxy-terminated polybutadiene (HTPB), dioctyl adipate, iron oxide, and less than a percent of several other non-energetic compounds. The rocket contains 67.8 kg of ammonium perchlo-rate or 57.4 kg of perchlorate. WC818 is composed of mostly nitrocellulose (NC), with smaller amounts of nitroglycerin, dibutylphthalate, calcium carbonate, and less than a percent of several other non-energetic com-pounds.

ERDC TR-08-1 13-3
Objective
The objective of this research is to estimate the mass of perchlorate depos-ited when an MLRS rocket is fired. Under normal firing conditions, the residue would be deposited over a very large area as the rocket ascends. In this study, the rocket propels a sled along a rail that is approximately 1 m above the ground, and residue deposition presumably occurs over a much smaller surface area.

ERDC TR-08-1 13-4
Methods
This study was conducted on 12 and 13 April 2006 at the sled track on Range C-74 at Eglin Air Force Base, Florida. Because propellant residues may have been deposited at the sled track during previous firing activities, surface soil samples were collected before and after the MLRS rocket was fired, so we could estimate the amount deposited by difference.
Surface Soil Sampling
A diagram of the sampling design at the Eglin AFB sled track is shown in Figure 13-1. Forty-six surface soil samples were collected up to 50 m be-hind the firing line and along the first 274 m (900 ft) of the sled track. Along the track, samples were collected on both sides of the track in 45.6-m (150-ft) intervals, at a distance of 0 to 10 m from the edge of the track. Half of the samples were collected the day prior to firing the MLRS rocket and the other half were collected within three hours after the MLRS rocket was fired. At this facility, the rocket sled is propelled along the 610-m (2000-ft) sled track. Based on information provided by the test site engi-neer, the rocket motor was operational along the entire portion of the track that was sampled. No rain occurred throughout the two days we sampled.
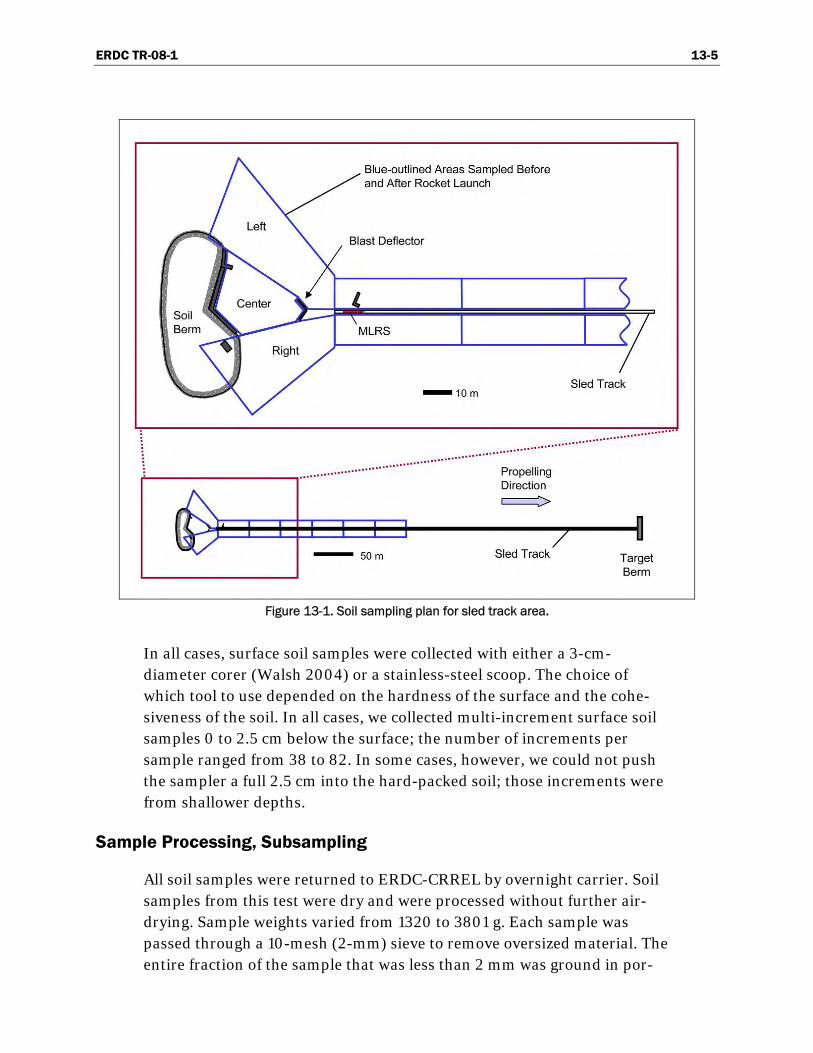
ERDC TR-08-1 13-5
Figure 13-1. Soil sampling plan for sled track area.
In all cases, surface soil samples were collected with either a 3-cm-diameter corer (Walsh 2004) or a stainless-steel scoop. The choice of which tool to use depended on the hardness of the surface and the cohe-siveness of the soil. In all cases, we collected multi-increment surface soil samples 0 to 2.5 cm below the surface; the number of increments per sample ranged from 38 to 82. In some cases, however, we could not push the sampler a full 2.5 cm into the hard-packed soil; those increments were from shallower depths.
Sample Processing, Subsampling
All soil samples were returned to ERDC-CRREL by overnight carrier. Soil samples from this test were dry and were processed without further air-drying. Sample weights varied from 1320 to 3801 g. Each sample was passed through a 10-mesh (2-mm) sieve to remove oversized material. The entire fraction of the sample that was less than 2 mm was ground in por-

ERDC TR-08-1 13-6
tions that did not exceed 600 g using a Lab TechEssa LM2 (LabTech Essa Pty. Ltd., Bassendean, WA, Australia) puck-mill grinder. Each portion was ground five times for 60 seconds, reducing the particle size of the material to a flour-like consistency (< 70 µm). After all the portions for a given sample were ground, the portions were combined and mixed thoroughly, and spread to form a 1-cm-thick layer. Subsamples were obtained by col-lecting 30 increments randomly from the entire thickness of the pulverized material.
Soil Sample Extraction and Analysis for Perchlorate at CRREL
Extract Analysis for Perchlorate Ion: A 10.0-g portion of each soil was ex-tracted with 100 mL of reagent-grade water from a Milli Q, reagent-grade water system (Millipore Corp.) for 18 hours on a platform shaker. All aqueous extracts were passed through a 0.45-µm Millex-HV filter unit (Millipore Corp.) and perchlorate was determined at CRREL using ion chromatography using suppressed conductivity detection according to the general procedures outlined in EPA Method 314.0 (USEPA 1999). The analytical detection limit for Method 314.0 in our laboratory is 10 µg/kg. Because none of the samples were determined to have perchlorate concen-tration above this value, portions of a few soil samples were sent to the ERDC-EL laboratory in Omaha for Method 314.0 analysis using equip-ment with a lower detection limit (1.0 µg/kg). An additional subset of samples was sent to a commercial laboratory for LC/ESI/MS according to Method 331.0 (US EPA 2005).
Soil Sample Extraction and Analysis for Perchlorate at a Commercial Laboratory
All chemicals, reagents, and solvents were obtained from Fisher Scientific (Pittsburgh, Pennsylvania) unless otherwise noted. Perchlorate standard was purchased from AccuStandard (New Haven, Connecticut). Isotopically enriched NaCl18O4 was purchased from Sigma-Aldrich (Milwaukee, Wis-consin) and used as the internal standard. Air-dried, sieved, and ground soil samples were extracted using 1 g of sample per 10 mL of ultra-pure water, vortexed, sonicated for 10 minutes, vortexed again, and centrifuged. The samples were passed through Dionex Ba, Ag, and H OnGuard II car-tridges. Samples were analyzed as specified in Method 331.0 (US EPA 2005). A Thermo Electron Corporation (Waltham, Massachusetts) TSQ Quantum Discovery Max triple quadrupole mass spectrometer with elec-
ERDC TR-08-1 13-7
trospray ionization operated in negative ion mode was used for liquid chromatography/tandem mass spectrometry (LC/MS/MS) detection of perchlorate. The high-performance liquid chromatography (HPLC) system consisted of Thermo Electron Corporation Surveyor pumps, a Dionex AS21 column (2.0 × 250 mm), and an isocratic 200-mM methylamine (Sigma-Aldrich) mobile phase at a flow rate of 0.35 mL/min. Injection volume was 1 µL. The LC flow was diverted from the mass spectrometer until just be-fore elution of the perchlorate to avoid fouling of the spray needle and to minimize interferences. Acetonitrile, dilute hydrochloric acid, and/or 2M methylamine were used to regenerate the column. The qualitative and quantitative determinations were based on selected reaction monitoring of the ions of m/z 99 (35ClO4¯) and m/z 101 (37ClO4¯) to form the ions of m/z 83 and m/z 85, respectively, through the loss of an oxygen atom. The re-porting limit for this analysis was 1.0 µg/kg.
QA/QC
Triplicate field samples were collected in four of the 15 sampling areas both before and after the MLRS rocket was launched. After soils were sieved and ground, triplicate laboratory subsamples were extracted and analyzed for every fifth sample at ERDC-CRREL. Unfortunately, this QA/QC step could not be used to access the uncertainty associated with subsampling since we were unable to detect perchlorate.
Blank sand was ground and subsampled, and separate portions were ex-tracted and analyzed for perchlorate. Separate portions of ground blank soil were also spiked with known concentrations of perchlorate and ex-tracted and analyzed.

ERDC TR-08-1 13-8
Results and Discussion
Results of analysis of soil samples collected before and after the rocket was fired are presented in Table 13-1. We suspected that the largest mass of propellant would be deposited behind the firing position, as had been found for smaller, shoulder-fired rockets (Jenkins et al. 2004). For that reason, we collected triplicate field samples on the left and right side of the deflector structure behind the firing point (Fig. 13-1 and 13-2). The mean concentrations in soil on the left side of the deflector before and after the firing of the MLRS were 6.0 µg/kg and 5.9 µg/kg, respectively. Similarly, the mean concentrations on the right side of the deflector were < 1.0 µg/kg and 2.3 µg/kg, respectively. In neither case was the soil concentration after firing significantly different from the concentration before firing at the 95% confidence level. The perchlorate concentrations before and after the rocket firing in the center behind the deflector were < 1.0 µg/kg and 1.3 µg/kg, respectively.
Soil samples were also collected along the sled track at distances from 0 to 274 m ahead of the firing point both before and after the rocket fired (Table 13-1). Eighteen samples were analyzed from those collected. The mean concentration for the nine samples collected before the firing was <1.0 µg/kg and the mean concentration for the nine samples collected after the firing was also < 1.0 µg/kg. Thus, we were not able to detect a significant increase in the perchlorate concentration either behind the firing line or along the sled track after a single MLRS rocket was fired.

ERDC TR-08-1 13-9
Table 13-1. Concentration of perchlorate in surface soils (0–2.5 cm) at Eglin AFB sled track before and after MLRS rocket firing. Samples consist of 38 to 60 increments.
Perchlorate Concentration (µg/kg)
Location Before After
Position Side Distance CRREL* EL†/Other CRREL† EL†/Other Difference
Rep 1 < 10 6.3† < 10 6.8†
Rep 2 < 10 5.9 < 10 4.9 0–46 m
Rep 3 < 10 5.7 < 10 5.9 Left
mean < 10 6.0 < 10 5.9 –0.1
Center 0–46 m < 10 < 1.0† < 10 1.3† > 0.3
Rep 1 < 10 1.0 < 10 1.0
Rep 2 < 10 < 1.0 < 10 1.5 0–46 m
Rep 3 < 10 < 1.0† < 10 4.3†
Behind
Right
mean < 10 < 1.0 < 10 2.3 > 1.3
Rep 1 < 10 < 1.0 < 10 < 1.0 0–46 m
Rep 2 < 10 < 1.0 < 10 < 1.0 Right
mean < 10 < 1.0 < 10 < 1.0 ND
Rep 1 < 10 1.1 < 10 < 1.0 0–46 m
Rep 2 < 10 < 1.0 < 10 < 1.0 Left
mean < 10 < 1.0 < 10 < 1.0 ND
Right 46–92 m < 10 < 1.0 < 10 < 1.0 ND
Left 92–137 m < 10 1.4 < 10 3.5 2.1
Right 137–183 m < 10 < 1.0 < 10 < 1.0 ND
Left 183–229 m < 10 < 1.0 < 10 1.2 > 0.2
Ahead
Right 229–274 m < 10 < 1.0 < 10 < 0.1 ND
* Ion chromatography method. † Data from EL-Omaha - Ion chromatography; other results from contractor laboratory - LC/EIS/MS method.

ERDC TR-08-1 13-10
Figure 13-2. Blast deflector positioned at the start of the sled track (foreground).
Even though the amount of perchlorate deposited from this rocket was too low to measure, we can estimate the mass of perchlorate that would have had to be deposited for us to measure a significant increase in concentra-tion. We made this estimate by calculating the surface area from which soil samples were collected, multiplying by the 2.5-cm depth sampled to com-pute the volume of soil in this zone, and multiplying by an estimate of the bulk density of soil (1.7 g/cm3). The total mass of soil was estimated at 3.31 × 10⁵ kg. Because the total area of deposition is probably greater than the area we sampled, we multiplied this mass by 2. If deposition from the rocket raised the perchlorate concentration in the soil within this zone by 1 µg/kg, the mass deposited would be 662 mg. Pooling the standard devia-tions of the data sets that had three measured values above the analytical reporting limit before or after the rocket was fired, we can estimate an average total measurement uncertainty of 1.2 µg/kg. Thus, to measure a significant concentration increase at the 95% confidence level, the soil concentration would have to be raised by 2.4 µg/kg. Thus, the amount of perchlorate deposition would have to have been at least 1.6 g to be de-tected. Because we were not able to detect a significant increase in concen-tration in this experiment at the 95% confidence level, we can assume that the deposition of perchlorate was less than 1.6 g. Because the rocket ini-tially contains 57.4 kg of perchlorate, at least 99.997% of the perchlorate is destroyed during firing. Thiboutot et al. 2007 estimated that only 2 mg was deposited when an Mk58 rocket motor that contains 47 kg of ammo-nium perchlorate was fired. Our findings are consistent with their esti-mate; however, our values are more uncertain because we were not able to measure any significant perchlorate deposition.

ERDC TR-08-1 13-11
Conclusion
The firing of one MLRS rocket did not increase the perchlorate concentra-tion in the soil at the Eglin sled track above background levels. The effi-cient burning of the rocket motor appears to destroy at least 99.997% of the perchlorate in the motor. This result is consistent with that found by the Canadians for the AIM-7 missile test (Thiboutot et al. 2007).

ERDC TR-08-1 13-12
References
Hewitt, A.D., T.F. Jenkins, T.A. Ranney, J.A. Stark, M.E. Walsh, S. Taylor, M.R. Walsh, D.J. Lambert, N.M. Perron, N.H. Collins, and R. Karn (2003) Estimates for Explosives Residue from the Detonation of Army Munitions. US Army Engineer Research and Development Center, Cold Regions Research and Engineering Laboratory, Hanover, New Hampshire, Technical Report ERDC/CRREL TR-03-16.
Hewitt, A.D., T.F. Jenkins, M.E. Walsh, M.R. Walsh, S. Taylor (2005) RDX and TNT Residues from live-fire and blow-in-place detonations. Chemosphere 61: 888–894.
Jenkins, T.F., M.E. Walsh, P.H. Miyares, A.D. Hewitt, N.H. Collins, and T.A. Ranney (2002a) Evaluation of the use of snow-covered ranges to estimate the explosives residues that result from high-order detonations of army munitions. Thermo-chimica Acta, 384: 173–185.
Jenkins, T.F., J.C. Pennington, T.A. Ranney, J.A. Stark, M.E. Walsh, C.A. Hayes, J.E. Mirecki, A.D. Hewitt, N.M. Perron, and D. Lambert (2002b) Characterization of Explosives Contamination at Military Firing Ranges: Yakima Training Center, WA, and Camp Guernsey, WY. Chapter 2 in Pennington et al. (2002) Distribution and Fate of Energetics on DoD Test and Training Ranges: Interim Report 2. US Army Engineer Research and Development Center, Vicksburg, Mississippi, Technical Report ERDC TR 02-8.
Jenkins, T.F., T.A. Ranney, A.D. Hewitt, M.E. Walsh, and K.L. Bjella (2004) Represen-tative sampling for energetic compounds at an antitank firing range. US Army Engineer Research and Development Center, Cold Regions Research and Engineering Laboratory, Hanover, New Hampshire, Technical Report ERDC/ CRREL TR-04-7.
Pennington, J.C., T.F. Jenkins, S. Thiboutot, G. Ampleman, J. Clausen, A. Hewitt, J. Lewis, M.R. Walsh, M.E. Walsh, T. Ranney, B. Silverblatt, A. Marois, A. Gagnon, P. Brousseau, J. Zufelt, K. Poe, M. Bouchard, R. Martel, D. Walker, C. Ramsey, C. Hayes, S. Yost, K. Bjella, L. Trepanier, T. Berry, D. Lambert, P. Dubé, and N. Perron (2005) Distribution and Fate of Energetics on DoD Test and Training Ranges: Interim Report 5. US Army Engineer Research and Development Center, Vicksburg, Mississippi, Technical Report ERDC TR-05-2.
Thiboutot, S., G. Ampleman, M.C. Faucher, J. Lewis, A. Marois, R. Martel, J.M. Ballard, S. Downe, T. Jenkins, A. Hewitt (2003) Environmental Conditions of Surface Soils and Biomass Prevailing in the Training Area at CFB Gagetown, New Brunswick. DRDC Valcartier Technical Report 2003-152.

ERDC TR-08-1 13-13
Thiboutot, S., G. Ampleman, M. Lapointe, S. Brochu, M. Brassard, R. Stowe, R. Farinaccio, A. Gagnon, and A. Marois (2007) Chapter 6. Dispersion of Ammonium Perchlorate Following the Static Firing of Mk58 Rocket Motors in Jenkins et al. (2007) Characterization and Fate of Gun and Rocket Propellant Residues on Testing and Training Ranges: Interim Report 1. US Army Engineer Research and Development Center, Cold Regions Research and Engineering Laboratory, Hanover, New Hampshire, Technical Report ERDC TR-07-1.
US Environmental Protection Agency (1995) Method 331.0: Determination of Perchlorate in Drinking Water by Liquid Chromatography Electrospray Ionization Mass Spectrometry (LC/ESI/MS).
US Environmental Protection Agency (1999) Method 314.0: Determination of Perchlorate in Drinking Water Using Ion Chromatography.
Walsh, M.E., C.M. Collins, A.D. Hewitt, M.R. Walsh, T.F. Jenkins, J. Stark, A. Gelvin, T.S. Douglas, N. Perron, D. Lambert, R. Bailey, and K. Myers (2004) Range Charac-terization Studies at Donnelly Training Area, Alaska: 2001 and 2002. US Army Engineer Research and Development Center, Cold Regions Research and Engineering Laboratory, Hanover, New Hampshire, Technical Report ERDC/ CRREL TR-04-3.
Walsh, M.R. (2004) Field Sampling Tools for Explosives Residues Developed at CRREL. US Army Cold Regions Research and Engineering Laboratory, Hanover, New Hampshire, Technical Report ERDC/CRREL TN-04-1.
Walsh M.R, M.E. Walsh, C.A. Ramsey, and T.F. Jenkins (2005a) An Examination of Protocols for the Collection of Munitions-Derived Explosives Residues on Snow-Covered Ice. US Army Engineer Research and Development Center, Cold Regions Research and Engineering Laboratory, Hanover, New Hampshire, Technical Report ERDC/CRREL TR-05-08.
Walsh M.R, S. Taylor, M.E. Walsh, S.R. Bigl, K. Bjella, T.A. Douglas, A.B. Gelvin, D.J. Lambert, N.M. Perron, and S.P. Saari (2005b) Residues from Live Fire Detona-tions of 155-mm Howitzer Rounds. US Army Engineer Research and Develop-ment Center, Cold Regions Research and Engineering Laboratory, Hanover, New Hampshire, Technical Report ERDC/CRREL TR-05-14.
Walsh M.R, M.E. Walsh, C.M. Collins, S.P. Saari, J.E. Zufelt, A.B. Gelvin, and J.W. Hug (2005c) Energetic Residues from Live-Fire Detonations of 120-mm Mortar Rounds. US Army Engineer Research and Development Center, Cold Regions Research and Engineering Laboratory, Hanover, New Hampshire, Technical Report ERDC/CRREL TR-05-15.
Walsh, M.R., M.E. Walsh, C.A. Ramsey, R.J. Rachow, J.E. Zufelt, C.M. Collins, A.B. Gelvin, N.M. Perron, and S.P. Saari (2006) Energetic Residues Deposition from 60-mm and 81-mm Mortars. US Army Engineer Research and Development Center, Cold Regions Research and Engineering Laboratory, Hanover, New Hampshire, Technical Report ERDC/CRREL TR-06-10.
Walsh, M.R., M.E. Walsh, S.R. Bigl, N.M. Perron, D.J. Lambert, and A.D. Hewitt (2007) Propellant Residue Deposition from Small Arms Munitions. US Army Engineer Research and Development Center, Cold Regions Research and Engineering Laboratory, Hanover, New Hampshire, Technical Report ERDC/CRREL TR-07-17.

THIS PAGE IS INTENTIONALLY BLANK.
ERDC TR-08-1 14-1
— Chapter 14 —
Summary and Conclusions
THOMAS F. JENKINS, SUSAN R. BIGL, AND JUDITH C. PENNINGTON
Deposition
Physical Nature of Residues
The physical nature of propellant residues determines how quickly ener-getic compounds are leached from the residues. Understanding the form of the residues is important for developing effective sampling, sample processing, and subsampling procedures to provide reliable estimates of residue concentrations near firing points. The major form of deposition is particles from guns and rockets. These particles are the source of energetic compounds such as NG and 2,4-DNT found in training range soils near firing locations.
Through microscopic examination of propellant residues, we found that the shape of the original propellant grain and the presence or absence of holes (made to control the burn rate) dictate the form of the residue. Resi-dues are composed of discrete particles of burned and unburned fibers or pieces that mimic the original shape of the propellant grains, along with fragments of the ammunition packing materials and soot. In large-caliber munitions, the quantity of residue deposited can vary depending on the charge amount used for firing a particular round.
Artillery
155-mm Howitzer
M.R. Walsh et al. (2005a) recovered residue from firing of the single-base (NC) M1 propellant included in an M3A1 propelling charge. The residue
ERDC TR-08-1 14-2
that settled on aluminum trays laid on the snow surface within 15 m of the muzzle included round, clear particles composed of potassium and sulfur that dissolve in acetone (stabilizer or binder component), some metal fragments and beads, pieces of fabric from the propellant bags, and black particles that are aggregates of metal and soot. The unfired propellant grains were long, thin (1.5-mm diameter) cylinders with a single hole through the center. They appear to burn completely, leaving primarily inert components.
Samples were also collected by Jenkins et al. (2007) from a fixed firing po-sition at Fort Lewis, Washington, where a training unit had fired a 155-mm M198 howitzer through the overnight hours. The M3A1 propellant formu-lation was also utilized in this exercise and the residue was similar in char-acter. Scanning electron images of the round clear particles showed they are layered like an onion, and X-ray analyses indicate they contain traces of potassium and sulfur, probably potassium sulfate, which is used in the Composition 3 formulation of the M1 propellant. In none of the 155-mm residues collected by ERDC-CRREL have we identified particles that con-tain 2,4-DNT (Chapter 2).
Airborne particulate matter was also sampled in the emission plume from live-fire testing of a 155-mm M777 howitzer using monitoring cassette fil-ters and a cascade impactor (Chapter 11). Here again the propelling charge M3A1 was used, which employs the single-base M1 propellant. The parti-cles recovered ranged widely in diameter (from < 0.5 to > 21.2 μm). Scan-ning electron microscopy and X-ray spectrometry (SEM/EDS) found that their character depended on positioning of the collection device relative to the gun. To the side near the gun were very small (~ 1 μm) spherical parti-cles, composed of carbon and oxygen. Ahead of the gun in the direction of fire were irregular, unsymmetrical particles (up to > 10 μm) that fill the interstices of the filter and that are believed to be potassium sulfate and soot. Energetic compounds were not evaluated because the filter would be dissolved in the sample preparation process and damage the HPLC com-ponents.
105-mm Howitzer
Samples of residue from firing of 105-mm howitzers were collected on trays as part of a live-fire exercise in 2002 (Walsh et al. 2004). The M67 propelling charge, which uses the single-base M1 propellant, is a combina-tion of the quick-burning type-II formulation that has thin one-hole cylin-

ERDC TR-08-1 14-3
ders similar to those used in the 155-mm propellant and the slower-burning type-I formulation with larger diameter cylindrical-shaped grains having seven internal holes. Microscopic analysis of the resulting residue found a large percentage (~15% of mass) being deposited as unburned slivers of the original seven-hole type-I propellant grains that are en-trained with 2,4-DNT (Walsh et al. 2007, Chapter 2).
Chapters 7 and 11 describe two recent efforts to collect and analyze propel-lant residue from 105-mm howitzers. A 105-mm C3 howitzer was used to fire a C-60 squash-head practice round both inside and outside a muffler chamber (Chapter 7). These tests used the previously described single-base M67 propelling charge to fire the projectile at two different charge increment levels. Emissions were sampled by collecting particles on wit-ness plates and by using a pump system to collect airborne particulates on filters. The mass of 2,4-DNT deposited on the plates, relative to the origi-nal mass in the propelling charge, was higher (0.39%) when firing short distances than for long distances (0.23%). In the outdoor testing, the posi-tions where gunners stand received higher concentrations of 2,4-DNT than positions in front of the gun. Results of the airborne particulate sam-pling indicated that the pumps worked well in the muffler, but appeared to be undersized for the outdoor sampling. As with the 2,4-DNT results, the bulk mass of airborne particles collected on the filters was greater at the lower charge level relative to the higher charge amount. Scanning electron microscope images show that about 80% of the airborne particles collected indoors and 90% of those collected outdoors were smaller than 4 μm; similarly, about 98% and 100% were smaller than 10 μm.
Poulin et al. (Chapter 11) also studied firing position residues emitted from outdoor firing of a 105-mm howitzer. This test used the lightweight LG1 Mark II 105-mm howitzer, also firing the M67 propelling charge, with a majority of the rounds using the long-distance charge level. In this case, only airborne particulate matter was collected using two techniques. Gase-ous and particulate emissions were pumped through both filters and a cascade impactor that separated the particles into nine size fractions. The particle sizes collected on the cascade impactor covered a wide range, from less than 0.5 μm to greater than 21.2 μm. Percentages of total mass for particles with sizes equal to or less than 2.5 μm and 10 μm were 49 and 72%, respectively. Particles recovered on cassette filters and on the cas-cade impactor were analyzed with SEM/EDS. Most of the particles exam-ined ranged from 1 to 5 μm. Smaller particles, primarily spherical in shape,
ERDC TR-08-1 14-4
were mostly composed of lead and copper. The lead source is hypothesized to be a piece of lead foil in propelling charge #5, which is included to in-hibit the rotating band of the projectile from depositing copper inside the gun. The larger particles seen in the samples were irregular and fractured and seem to be either soot or dust from soil.
Mortars
Taylor et al. (Chapter 2) studied residues from three different-sized mortar systems that propel their projectiles with either double-base propellant formulations (M45, M9) that include both NC and NG or with a type of single-base formulation containing NC alone without other energetic com-pounds (M10). The microscopic analysis was an additional component of studies designed to quantify propellant deposition and accumulation.
120-mm Mortar
Residues from firing M933 120-mm mortar rounds were collected on alu-minum trays during a live-fire exercise (M.R. Walsh et al. 2005b). The M230 propelling charge for this munition uses M45 double-base propel-lant, which has short, cylindrical-shaped grains with a center hole. The re-covered residue consisted of rings or crescent-shaped pieces of propellant that result from incomplete burning.
81-mm and 60-mm Mortars
Walsh et al. (2006) sampled propellant residue after 60-mm and 81-mm mortars were fired. The 60-mm HE (M888) and 81-mm HE (M374A3) rounds were fired using a combination of M9 and M10 propellants; the 81-mm illumination round (M301A3) used only M10 propellant. Neither the M9 propellant grains (short cylinders 1.5 mm in diameter by 0.5 mm long) nor the M10 propellant flakes (1-mm-diameter disks about 250 µm thick) have a central hole. They burn from the outside inward, producing resi-dues that are smaller versions of the original grain.
Antitank Rockets
M-72 LAW and AT-4 Rockets
Residues were collected during the firing of seven Light Antitank Weapon (LAW) rockets and two AT-4 rockets (Jenkins et al. 2007). The LAW rocket uses strips of double-base M7 propellant in its propelling charge.
ERDC TR-08-1 14-5
Two particle types found in the residues were suspected of coming from the propellant—long, thin fibers (0.02 cm by 1.0 cm long) and smaller, irregular shaped, red-colored, subangular particles (10 to 60 μm). Analysis by RP-HPLC-UV of acetonitrile extracts prepared from both particle types revealed that the fibers contained NG and RDX; the red particles con-tained small amounts of RDX and TNT, but no NG.
Residues from the AT-4 rocket, which uses strips of double-base AK13204 propellant, also had two types of solids most likely derived from the pro-pellant—one being long, thin fibers similar in size to the LAW rocket fibers and the other being white, 0.1- to 0.4-cm subangular platelets that were probably NC. Both types were found to contain NG.
84-mm Carl Gustav Rocket
Thiboutot et al. (Chapter 4) studied residues from firing the 84-mm Carl Gustav rocket at the CFB Valcartier, Quebec, training area in February 2007. The propellant charge of this rocket utilizes the double-base AKB 204/0 propellant configured in strips (15 by 167 mm). Particle size, distri-bution, and type varied greatly with distance and location both forward and rearward of the firing point (FP). Rearward, particle size varied from fine dust near the FP to large particles, up to 2-cm size 40 m away. The distribution was quite homogeneous near the FP and highly heterogeneous farther away. The fine particles suffer air resistance (drag) and fall rapidly on the soil surface, while larger particles have more inertia and less fric-tion surface and therefore fly longer paths and are projected at greater dis-tances. In front of the firing line, particles were observed only at the 5-m location.
Particles ahead of the FP were thin, with a glassy appearance. Analysis by solid-state attenuated total reflectance (ATR) Fourier Transformed Infra Red (FTIR) spectra determined that they were NC. Particles rearward con-sisted, for the first 10 m, of particles smaller than 1 mm with a mix of the thin, glassy NC pieces and chunks of pale yellow particles found by ATR-FTIR to be pieces of the flame-retardant thermoplastic used to cap the back end of the rocket assembly. At –15 m, particles had the same distribu-tion, quantity, and appearance, with a mixture of solid pale yellow parti-cles up to 1.5-mm length and thin glassy ones. At the –20-m position, traps caught larger yellow particles varying from 0.2- to 1-cm diameter and larger glassy particles as well. Traps farther away (–30 m and –40 m)

ERDC TR-08-1 14-6
caught large yellow and white plastic (polypropylene) particles up to 2 cm long, but no thin glassy particles.
Small Arms
Taylor et al. (Chapter 2) examined small arms propellants and fired resi-dues collected on witness plates during the live-fire deposition testing. The unfired W-series double-base propellants studied typically have disk-shaped grains with no central hole and produce residues that are smaller versions of the original grain. In the residues examined, unconsumed amounts of NG ranged from 4 to 9% of the total mass. Faucher et al. (Chapter 5) collected airborne particles expelled from firing of small arms weapons using monitoring cassettes positioned near the muzzle and above the firing chamber. Upon examining the particles collected on the filters with SEM techniques, they found most were smaller than 1 μm and were composed of metal, mainly lead or copper.
9-mm Pistol
Chapter 2 describes unfired propellant and fired residues produced by M9 9-mm pistols. The unfired grains of WPR289 propellant are coated in graphite and contain ~15% NG. Individual unfired grains are shiny and silvery, often have faceted sides, and are typically 2.5 mm in diameter and 1 mm thick. The fired propellants are yellow in color and vary both in size and shape—from irregular-shaped pieces 0.2 to 0.3 mm across to long lin-ear pieces 0.5 mm wide by 2 mm long. An analyzed sample of the residue contained about 9% NG by weight.
Chapter 5 describes airborne particulates collected during firing of the Browning 9-mm pistol using rounds with WPR289 propellant. Their SEM analysis found a mix of large and small particles. The larger particles (sized between 3 and 10 µm) look irregular and fractured, are composed mainly of carbon, and therefore are believed to be soot. The smaller parti-cles (> 3 µm) are almost exclusively composed of lead. They are most likely produced by melted and then solidified metal.
7.62-mm Machine Gun
Taylor et al. (Chapter 2) analyzed the WC 846 propellant used to fire the M60 7.62-mm machine gun and found it contained about 10.2% NG. The metallic grey, graphite-coated grains are also 1-mm-thick disks about 2.5

ERDC TR-08-1 14-7
mm in diameter. The residues were much smaller than the original grain, generally less than 1 mm in diameter, and shiny white to brown in color. Particle shapes were either irregular or small disks similar to the original grains. The amount of NG found in the extracted sample was about 4% of the total residue mass.
Faucher et al. (Chapter 5) sampled airborne particulates from a 7.62-mm C6 machine gun using C21/C19 ball link ammunition and CMR 100 pro-pellant. In this case, the upper monitoring cassette was placed inside an enclosure bag to optimize sample collection. Particle size distribution ranged from around 100 nm to 5 µm. As with the 9-mm residues, the lar-ger, irregular flaky particles are mostly carbon and oxygen, and thus are believed to be soot. The small particles (< 3 µm) are mostly spherical and bright on the backscatter SEM images, indicating high atomic number compositions-metals. Indeed, energy dispersive X-ray analysis revealed that the particles at the muzzle end position are composed mainly of cop-per; at the upper position, they are mostly lead. The lead is probably com-ing from the primer and the foil in the primer that was probably vaporized during the firing. The presence of copper is attributed to the erosion of the cartridge inside the gun.
5.56-mm Rifle
The propellant fired from the M16 5.56-mm rifle examined by Taylor et al. (Chapter 2) was the WC 844 formulation that contains ~11% NG, also in a grain with a graphite coating. Typical grain size was again 2.5 mm in di-ameter and 1 mm thick. The unfired grains are shiny and black, whereas the fired propellants are white to yellow in color. Particle shapes were ei-ther small and irregularly shaped (~ 0.4 to 0.6 mm) or disks similar to the original grains (up to about 1.3 mm diameter). In this case, the measured NG mass in the residue was about 7% of the total.
Particulate sampling of 5.56-mm caliber weapon conducted by Faucher et al. (Chapter 5) was performed using the C7 automatic rifle using C77 ball rounds with PRB SS 109 propellant. A weapon enclosure bag was used to optimize sample collection at the upper receiver. A comparatively low number of particles were retrieved from the muzzle end. As with the other weapons, some particles are irregular, with a size > 5 µm, but this time the morphology does not seem to be flaky. Particles smaller than 5 µm seem to be mostly < 1 μm in size, spherical in shape, with metallic chemical com-

ERDC TR-08-1 14-8
position (mostly Cu, but Al, Ba, Sb, and S were among other elements found).
Four types of particles were deposited on the upper cassette filter: 1) spherical, 2) fractured, irregular, and flaky, 3) irregular and fluffy, and 4) aggregates. The spherical particles are mostly the smaller particles (diame-ter < 0.5 µm), composed of heavy elements, mainly Pb, Sb, and Cu. The irregular, fractured, and flaky particles have a diameter between 5 and 10 µm. They are composed of C and O, thus probably soot. The two other types are related, in the sense that the irregular fluffy particles (diameter between 1 and 3 µm) seem to have coalesced to form the large aggregates (diameter up to 10 µm). These particles are composed of many elements: Cu, Ca, S, O, and C.
.50-caliber Machine Gun
Taylor et al. (Chapter 2) examined propellant residue from firing an M2HB .50-caliber (12.7-mm) machine gun. The WC 860 propellant util-ized in the M33 rounds fired contains ~ 9.5% NG in a graphite-coated grain. These grains are shiny, black, > 1 mm thick, and about 2.5 mm in diameter. The residues are smaller, white to brown in color, somewhat rounded, and generally less than 1.5 mm in diameter. The compound NG accounts for about 6% of the residue mass, compared with about 10% in the unfired grains.
Mass of Energetic Residues Deposited for Various Types of Munitions
A series of experiments was conducted to estimate the mass of energetic propellant residues deposited when rounds are fired at various types of firing points. Because of potential problems with the presence of residues from past firing activities, the difficulty in identifying the footprint of resi-due deposition on soil, and the need to collect large surface area samples to make these measurements, many of these studies were conducted at snow-covered ranges (Walsh et al. 2005a, 2005b, 2006, 2007, Chapter 3). Another approach was used in several additional studies where particle collection pans were used to collect residues as they were deposited during firing activities (Chapters 4 through 7, Thiboutot et al. 2007, Diaz et al. 2007, Jenkins et al. 2007, M.R. Walsh et al. 2005a). The results of these tests are summarized in Table 14-1 and discussed below.

ERDC TR-08-1 14-9
Table 14-1. Mass of NG or 2,4-DNT deposited per round fired for various weapon systems.
Weapon system Propellant Constituent Rounds
fired Residues/round
(mg) Reference
Howitzers
105 mm M1-I & II DNT 71 34 Walsh et al. 2004
105 mm M1 DNT 22 3 – 10† Chapter 7*
155 mm M1 DNT 60 1.2 M.R. Walsh et al.
2005a
Mortars
60 mm M9 (Ignition cartridge) NG 25 0.088 Walsh et al. 2006
81 mm M9 (Ignition
cartridge, HE) NG 40 19 “
81 mm M9 (Illum) NG 61 1,000 “
120 mm M45 NG 40 350 M.R. Walsh et al.
2005b
Shoulder-fired rocket
84 mm AKB 204/0 NG 39 20,000 Chapter 4
Tank
Leopard, 105 mm M1/M6 DNT 79 < 1.6 Chapter 6
Small Arms
5.56-mm Rifle WC844 NG 100 1.8 Chapter 3
5.56-mm MG WC844 NG 200 1.3 Chapter 3 7.62-mm MG WC 846 NG 100 1.5 Chapter 3 9-mm Pistol WPR289 NG 100 2.1 Chapter 3
12.7-mm MG (.50 caliber)
WC860 & WC857 NG 195 11 Chapter 3
* Chapter in this report † Amounts depended on the charge level (distance being targeted).
Artillery
Two types of artillery weapon systems were studied—105-mm and 155-mm howitzers. Initial studies were conducted by Marianne Walsh and co-workers under sponsorship of the US Army Garrison Alaska and concen-trated on 105-mm firing points at Fort Greely. The concentrations of 2,4-DNT were measured in soil samples collected downrange of 105-mm gun positions (Walsh et al. 2004, 2005). Michael Walsh et al. (2007) estimated a mass of 34 mg of 2,4-DNT deposited per round fired (at charge level 4) from the snow sample results reported in Walsh et al. 2004 (Table 14-1). Residue deposition was primarily within 30 m of the firing positions.
ERDC TR-08-1 14-10
In a more recent study reported in Chapter 7 of this report, Ampleman et al. collected residues from firing a 105-mm howitzer in an enclosed muf-fler loaded at two charge levels⎯high distance (charge 6) and low distance (charge 4). They found a higher percentage of deposited residue (likely due to less efficient burning) at the lower charge level. The mass of 2,4-DNT deposited per round fired at charge level 6 was between 16 and 193 mg and between 135 and 182 mg at charge level 4). When the 105-mm howitzer was fired outdoors nearby the muffler facility, windy conditions con-founded the collected residue results. The highest amounts, collected in the windward direction, ranged from 0.4 to 3 mg and from 0.9 to 10 mg when firing at the high- and low-charge levels, respectively.
A study was also conducted on propellant deposition from the firing of 155-m howitzers. This study was conducted on a snow-covered range at Fort Greely, Alaska. Walsh et al. (2005a) estimated a mass deposit of 1.2 mg of 2,4-DNT per round fired for 155-mm howitzers firing M1 propellant (M3A1 single bag with 5 charges). Deposition occurred primarily within 30 m of the firing positions. This very low deposition mass has been con-firmed in a number of studies, including a study reported by Jenkins et al. (2007) in which collection pans were deployed downrange and soil sam-ples were collected from an area where a large number of 155-mm rounds had been fired the previous night (charge level unknown). No measurable 2,4-DNT or NG was detected in either the pans or soil samples collected downrange of the muzzle.
Mortars
Two studies have been completed to estimate the mass of propellant resi-dues deposited from the firing of mortars. In the first study, a total of 40 120-mm mortar rounds was fired using M45 propellant containing nitro-cellulose and nitroglycerin. Walsh et al. (2005b) estimated that about 350 mg of NG was deposited per round fired when using 2 rings (charges). Most of the residue deposition was within 35 m of the firing point.
In the second study, samples were collected after the firing of 60-mm and 81-mm mortars. The M204 propellant charge for the 60-mm mortar rounds does not contain either NG or 2,4-DNT, but the ignition cartridge for this weapon does contain a small amount of NG. After the firing of 25 rounds, it was estimated that about 0.65% of the original mass of NG in the ignition charge, or about 0.088 mg, was deposited per round fired for

ERDC TR-08-1 14-11
the 60-mm mortars (Walsh et al. 2006). Most of the deposition occurred within about 12 m of the firing point.
Similarly, the M10 propellant for high explosive 81-mm mortar rounds is primarily NC and does not contain either NG or 2,4-DNT, but as with the 60-mm mortar rounds, the 81-mm mortar round does have NG in the igni-tion cartridge. After the firing of 40 rounds, Walsh et al. (2006) estimated that about 19 mg of NG was deposited per round fired, or about 0.65% of the NG present in the ignition cartridge.
Illumination 81-mm mortar rounds are fired using M9 propellant that contains NC and NG. After the firing of 61 rounds, Walsh et al. (2006) es-timated that about 1000 mg of NG was deposited per round fired (using five M185 charges per round). Most of the NG was deposited within 15 m of the firing position.
Tanks
Ampleman et al. (Chapter 6) conducted a study to estimate the mass of propellant residues deposited from the firing of Leopard tanks equipped with 105-mm main tank guns. A number of particle traps were deployed from 5 to 50 m from the firing line, and after 79 rounds were fired, no de-tectable NG was found. The authors caution that the sampling method employed using pans was not adequate, and they suggest repeating these experiments using an improved sampling strategy.
Small Arms
A set of small arms propellant deposition studies was conducted at Camp Ethan Allen, Vermont, on snow-covered ranges (Walsh et al. 2007). Five small arms weapons systems were tested: 5.56-mm rifle, 5.56-mm ma-chine gun, 7.62-mm machine gun, 9-mm pistol, and .50-cal machine gun. After firing between 100 and 200 rounds of these weapons (Table 14-1), the mass of NG deposition for these systems was estimated from snow samples collected downrange of the firing positions. The mass of residue deposited ranged from 1.3 to 11 mg NG per round fired (Walsh et al. 2007). A much smaller amount of 2,4-DNT was also deposited for the 7.62-mm machine gun. For all the weapons except the .50-cal machine gun, the propellant deposition was from 0 to 20 m from the firing positions. For the .50-cal machine gun, detectable residues were found as far as 40 m

ERDC TR-08-1 14-12
from the firing positions. Over 99% of the residues were found within five to 20 m of the firing points.
Shoulder-Fired Antitank Rockets
A study on the residue deposition from the firing of 84-mm Carl Gustav antitank rockets is provided by Thiboutot et al. in Chapter 4. The authors estimate that 14% of the propellant charge of the rockets is deposited, and that their experiments might actually underestimate the percent depos-ited. For the Carl Gustav rocket, this amounts to as much as 19 g of NG de-posited per round fired. There have been no experiments conducted with the 66-mm M72 LAW rockets or the AT-4 rockets, but soil sampling ex-periments at ranges where these rockets were fired indicate that large masses of NG are deposited for these rounds as well (Jenkins et al. 2004).
Missile Motors
An experiment was reported by Thiboutot et al. (2007) where the mass of ammonium perchlorate deposited from the static firing of Mk58 rocket motors from the AIM-7 Sparrow Missile was estimated. Residues were col-lected using witness plates and aqueous traps. The authors estimate that only about 2 mg of perchlorate are deposited per Mk58 motor fired.
A similar experiment was conducted at the sled track at Eglin Air Force Base (Chapter 13). Soil samples were collected before and after the firing of an MLRS rocket. The results indicated that there was no significant in-crease in perchlorate concentrations for soil collected behind and along the sled track due to the firing of the missile, thus the mass of perchlorate deposited was small.
ERDC TR-08-1 14-13
Accumulation of Residues at Firing Points for Various Weapons
A number of field studies have been conducted to assess the accumulation of propellant residues at munition firing points. These have included stud-ies at artillery, mortar, tank, antitank rocket, 40-mm grenade, and small arms firing ranges. Below is a discussion of results for soil samples col-lected at various firing point areas.
Artillery, Mortar, and Tank Firing Points
At present, the large-caliber weapons fired to the greatest extent at artil-lery and mortar ranges in the United States and Canada are 105-mm and 155-mm howitzers, and 60-mm, 81-mm, and 120-mm mortars. The pro-pellants for all of these weapons contain nitrocellulose; some also contain nitroglycerin, dinitrotoluene (mainly the 2,4-DNT isomer), and nitrogua-nidine (NQ).
Table 14-2 provides a summary of the results that have been obtained for soil samples collected at firing points for artillery, mortar, and one 120-mm tank firing range. In some cases, the information obtained from the installation indicated that only one type of weapon was typically fired at the sampling location and the results are placed under a heading appro-priate for that location. In others, it appeared that several different weap-ons were fired from this location. In that case, the results are placed under a heading of “Mixed.” The data in this table came from a series of studies conducted by ERDC, DRDC Valcartier, the US Army Center for Health Promotion and Preventive Medicine (CHPPM) on contract to the US Army Environmental Center, US Army Garrison Alaska, and AMEC at the Mas-sachusetts Military Reservation.
As has been noted in the deposition summary, the propellant used for 105-mm howitzers is single base containing 2,4-DNT. Soil samples collected at the two 105-mm-only firing points indicate that 2,4-DNT concentrations in surface soils can accumulate to levels of 32 to 240 mg/kg. The actual concentrations measured for a given range depend on the number of rounds fired, the depth of soil collected, and the position sampled relative to the position of the weapons. It should be mentioned that soil depth
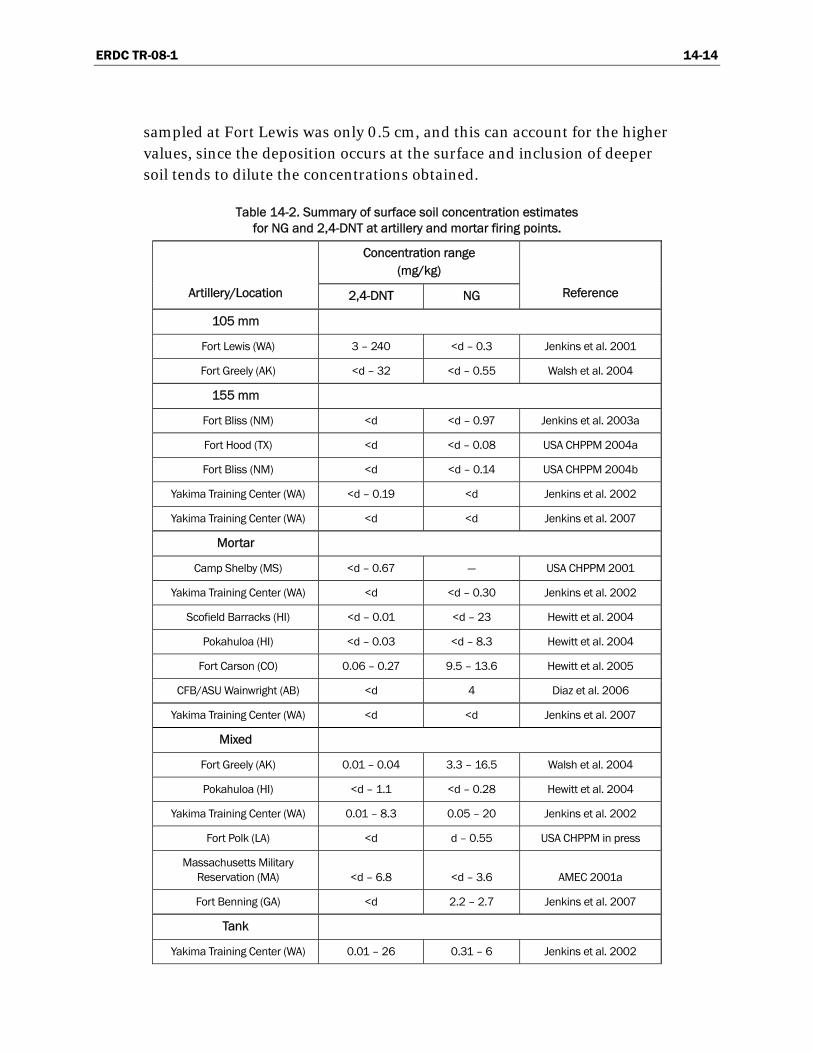
ERDC TR-08-1 14-14
sampled at Fort Lewis was only 0.5 cm, and this can account for the higher values, since the deposition occurs at the surface and inclusion of deeper soil tends to dilute the concentrations obtained.
Table 14-2. Summary of surface soil concentration estimates for NG and 2,4-DNT at artillery and mortar firing points.
Concentration range (mg/kg)
Artillery/Location 2,4-DNT NG Reference
105 mm
Fort Lewis (WA) 3 – 240 <d – 0.3 Jenkins et al. 2001
Fort Greely (AK) <d – 32 <d – 0.55 Walsh et al. 2004
155 mm
Fort Bliss (NM) <d <d – 0.97 Jenkins et al. 2003a
Fort Hood (TX) <d <d – 0.08 USA CHPPM 2004a
Fort Bliss (NM) <d <d – 0.14 USA CHPPM 2004b
Yakima Training Center (WA) <d – 0.19 <d Jenkins et al. 2002
Yakima Training Center (WA) <d <d Jenkins et al. 2007
Mortar
Camp Shelby (MS) <d – 0.67 — USA CHPPM 2001
Yakima Training Center (WA) <d <d – 0.30 Jenkins et al. 2002
Scofield Barracks (HI) <d – 0.01 <d – 23 Hewitt et al. 2004
Pokahuloa (HI) <d – 0.03 <d – 8.3 Hewitt et al. 2004
Fort Carson (CO) 0.06 – 0.27 9.5 – 13.6 Hewitt et al. 2005
CFB/ASU Wainwright (AB) <d 4 Diaz et al. 2006
Yakima Training Center (WA) <d <d Jenkins et al. 2007
Mixed
Fort Greely (AK) 0.01 – 0.04 3.3 – 16.5 Walsh et al. 2004
Pokahuloa (HI) <d – 1.1 <d – 0.28 Hewitt et al. 2004
Yakima Training Center (WA) 0.01 – 8.3 0.05 – 20 Jenkins et al. 2002
Fort Polk (LA) <d d – 0.55 USA CHPPM in press
Massachusetts Military Reservation (MA) <d – 6.8 <d – 3.6 AMEC 2001a
Fort Benning (GA) <d 2.2 – 2.7 Jenkins et al. 2007
Tank
Yakima Training Center (WA) 0.01 – 26 0.31 – 6 Jenkins et al. 2002

ERDC TR-08-1 14-15
The 2,4-DNT concentrations for most soil samples collected at 155-mm firing points were below an estimated analytical detection limit of 0.01 mg/kg. The results are much lower than those found for 105-mm firing points; this is consistent with the much lower estimate for 2,4-DNT depo-sition per round for the 155-mm compared with the 105-mm (Table 14-2).
The concentrations of NG in soils at both types of firing points were de-tectable but always less than 1 mg/kg. The source of NG for these areas is unknown because neither single-base propellant contains NG. Some pro-pellant for the 155-mm is triple base containing NG, but this propellant is used only for long-range firing. Most of the training ranges in the United States are not large enough for this type of firing activity.
One tank firing position was sampled at Yakima Training Center. For this range, both 2,4-DNT and NG were found to have accumulated in surface soils to a maximum of 26 and 6 mg/k, respectively. The major weapon fired at this location is the 120 mm firing sabot rounds.
Antitank Rocket Firing Ranges
The major munitions fired at antitank rocket ranges in the United States and Canada are the 66-mm M72 LAW rocket, the 84-mm AT4 (US), and the 84-mm Carl Gustav (Canada). Practice versions of these munitions are also fired at these ranges.
The propellant for these munitions is double base containing NC and NG as the two energetic components. Soil samples have been collected at anti-tank rocket ranges at a number of US and Canadian installations, both ahead of the firing line (between the firing line and the targets), and be-hind the firing line.
Generally, only NG is detected in soil samples at these ranges (Table 14-3). Concentrations in surface soils ahead of the firing line range from the de-tection limit of about 0.01 mg/kg to 5 mg/k between the firing line and the targets, although a concentration as high as 101 mg/kg was detected at CFB/ASU Wainwright (Table 14-3). Concentrations behind the firing line, however, are considerably higher, generally ranging into the hundred or thousands of mg/kg. Elevated concentrations of NG have been detected as far as 50 m behind the firing lines at these ranges. Of all the different types of firing points sampled, the NG concentrations behind the firing line at these ranges are by far the highest encountered.
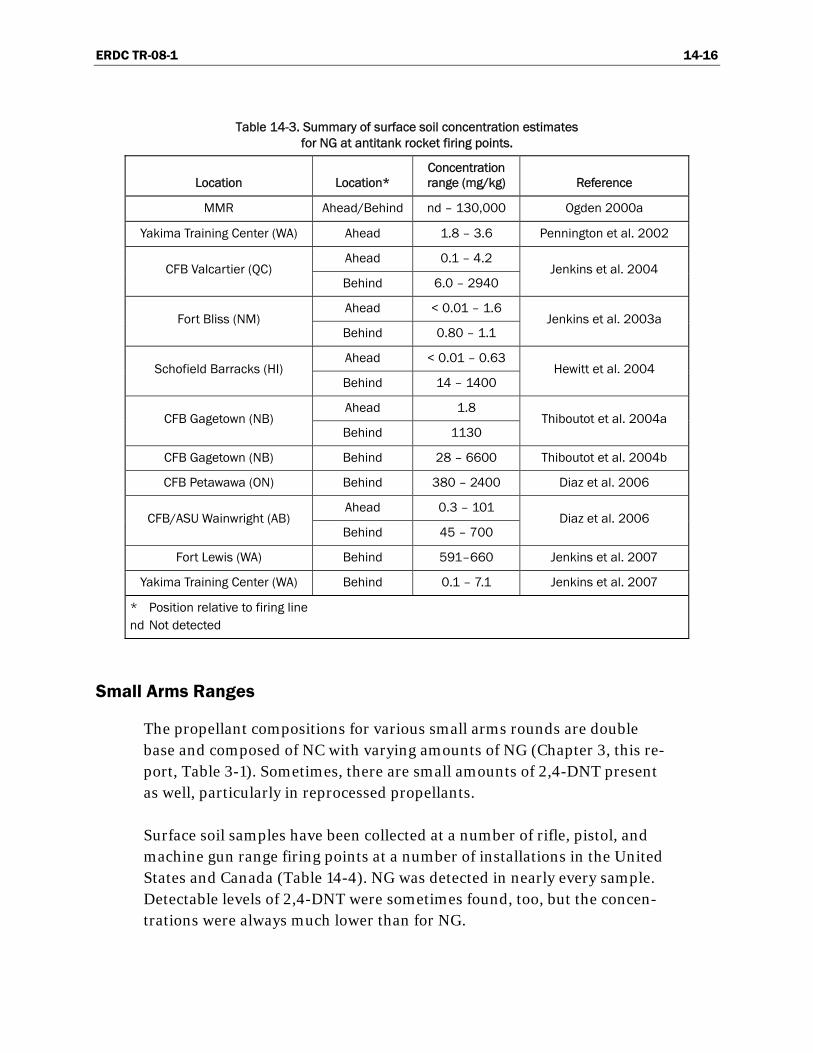
ERDC TR-08-1 14-16
Table 14-3. Summary of surface soil concentration estimates for NG at antitank rocket firing points.
Location Location* Concentration range (mg/kg) Reference
MMR Ahead/Behind nd – 130,000 Ogden 2000a
Yakima Training Center (WA) Ahead 1.8 – 3.6 Pennington et al. 2002
Ahead 0.1 – 4.2 CFB Valcartier (QC)
Behind 6.0 – 2940 Jenkins et al. 2004
Ahead < 0.01 – 1.6 Fort Bliss (NM)
Behind 0.80 – 1.1 Jenkins et al. 2003a
Ahead < 0.01 – 0.63 Schofield Barracks (HI)
Behind 14 – 1400 Hewitt et al. 2004
Ahead 1.8 CFB Gagetown (NB)
Behind 1130 Thiboutot et al. 2004a
CFB Gagetown (NB) Behind 28 – 6600 Thiboutot et al. 2004b
CFB Petawawa (ON) Behind 380 – 2400 Diaz et al. 2006
Ahead 0.3 – 101 CFB/ASU Wainwright (AB)
Behind 45 – 700 Diaz et al. 2006
Fort Lewis (WA) Behind 591–660 Jenkins et al. 2007
Yakima Training Center (WA) Behind 0.1 – 7.1 Jenkins et al. 2007
* Position relative to firing line nd Not detected
Small Arms Ranges
The propellant compositions for various small arms rounds are double base and composed of NC with varying amounts of NG (Chapter 3, this re-port, Table 3-1). Sometimes, there are small amounts of 2,4-DNT present as well, particularly in reprocessed propellants.
Surface soil samples have been collected at a number of rifle, pistol, and machine gun range firing points at a number of installations in the United States and Canada (Table 14-4). NG was detected in nearly every sample. Detectable levels of 2,4-DNT were sometimes found, too, but the concen-trations were always much lower than for NG.

ERDC TR-08-1 14-17
Table 14-4. Summary of surface soil concentration estimates for NG and 2,4-DNT at small arms range firing points.
Concentration range (mg/kg)
Range/Location 2,4-DNT NG Reference
Rifle ranges
MMR <0.01–1.5 <0.02–70 Clausen 2008
Fort Lewis (WA) <0.01–4.0 276–504 Jenkins et al. 2007
29 Palms (CA) <0.04 1.1–30 Chapter 8
CFB/ASU Wainwright (AB) Not reported 0.3–53 Diaz et al. 2006
CFB Petawawa (ON) 2005* <0.05–0.43 2.1–29
CFB Petawawa (ON) 2006* <0.05–1.2 0.15–50
CFB Petawawa (ON) 2005** 0.1–0.5 1.0–25
CFB Petawawa (ON) 2007** 0.01–2.2 1.6–107
CFB Petawawa (ON) 2006† < 0.05–0.4 0.3–23
Chapter 9
CFB/ASU Wainwright (AL) <0.05–0.7 <0.05–3.1 Chapter 8
Pistol ranges
29 Palms (CA) <0.04 80–124
CFB Petawawa (ON) 2005 < 0.04–0.13 0.8–36
CFB/ASU Wainwright (AB) <0.04–0.1 < 0.1–40
Chapter 8
CFB/ASU Wainwright (AB) Not reported 7 Diaz et al. 2006
Machine gun ranges
Fort Lewis (WA) <0.01–0.09 1.2–10.7 Jenkins et al. 2007
29 Palms (CA) <0.04–0.46 2.5–95
Fort Richardson (AK) <0.04–17 0.24–576 Chapter 8
Machine gun ranges
Yakima Training Area (WA) <d 85 Jenkins et al. 2007
Fort Richardson (AK) <0.04–4.34 6.3–206
CFB/ASU Wainwright (AB) <0.05–0.1 1.0–7.4 Chapter 8
Mounted
Yakima Training Area (WA) <d 0.07–2.0 Jenkins et al. 2007
* Y Range at Petawawa ** B Range at Petawawa † C and D Ranges at Petawawa

ERDC TR-08-1 14-18
At rifle ranges in the United States, 5.56-mm rounds are predominantly fired. In Canada, both 5.56-mm and 7.62-mm rounds are fired at these ranges. The maximum concentrations of NG at these ranges varied from 3.1 to 504 mg/kg. Only the antitank rocket ranges had higher concentra-tions of residues among all the firing point areas that have been sampled. As was pointed out by Walsh et al. (2007), the major deposition of propel-lant residues for 5.56 rifles occurs within 8 m of the firing point, and thus relatively high NG concentrations are not expected to be found beyond 10 m for fixed firing points, depending on predominant wind direction. The concentrations of 2,4-DNT were much lower, with maximum values of only 0.4 to 4 mg/kg. At some Canadian small arms ranges, the troops practice firing small arms as they walk toward the targets, and in this case, the propellant residues can be distributed farther downrange of the firing points.
Four 9-mm pistol range firing points have been sampled as well. NG con-centrations at these ranges are similar to those at the rifle ranges. Maxi-mum concentrations ranged from 7 to 124 mg/kg. Machine gun ranges have similar concentrations of NG present in surface soils, but the areas of residue accumulation are expected to extend farther from the firing points, perhaps as far as 40 m.
Several mixed firing points were sampled. At these ranges various small arms are fired to include sporting arms such as shotguns. The concentra-tions for both NG and 2,4-DNT found in surface soils were very similar to those found at rifle and pistol ranges.
One firing point was sampled where vehicle-mounted small arms are fired. The concentrations of NG ranged from 0.07 to 2.0 mg/kg while 2,4-DNT was not detected at this range.
ERDC TR-08-1 14-19
Fate and Transport of Propellant-Related Compounds
From the results presented in the deposition chapters and the amounts of residues that have shown to accumulate at the various types of firing point areas, it is clear that substantial amounts of propellant residues are depos-ited and will be present at these ranges in the future. But what is the likeli-hood that these residues can migrate from these locations to offsite recep-tors via groundwater or surface water? This is clearly a function of fate and transport mechanisms that control their mobility and rate of degradation.
The major chemical in gun propellants, including shoulder-fired antitank rockets, is nitrocellulose. Other constituents are added to the nitrocellu-lose to control the physical nature of the propellant, the burning rate, and its long-term stability. Nitrocellulose is composed of polymerized cellulose chains of various lengths in which the hydroxyl functions have been mostly replaced by nitrate ester functions. It is insoluble in aqueous solution and thus will not dissolve in precipitation. However, the added constituents such as NG, 2,4-DNT, NQ, diphenyl amine, and ethyl centralite will leach from the polymeric material at rates related to their individual solubilities.
From research conducted by Walsh et al. (2004), Taylor et al. (Chapter 2), Thiboutot (Chapter 4), Faucher et al. (Chapter 5), Ampleman et al. (Chap-ters 6 and 7), and Poulin (Chapter 11), it appears that the major portion of propellant residues deposited at firing point areas is as particles varying in size from smaller than 0.5 μm to fibers around 5 cm long. Deposition oc-curs onto the soil surface, resulting in a source zone for potential offsite migration. Propellant residues remain at the surface unless the soil is dis-turbed. A possible source of disturbance is use of an artillery system with a blade that digs into the ground (< 1 m) to limit howitzer movement upon firing. Otherwise, physical disturbance at firing point areas is primarily from vehicle traffic or from periodic re-grading or resurfacing with new material.
For transport of these propellant components offsite, either the intact pro-pellant residues or constituents that have leached from the propellant formulations must move through the soil profile to an underground aqui-fer or via some overland flow mechanism to a surface water body. The lat-

ERDC TR-08-1 14-20
ter is not the focus of this SERDP-funded project and is being studied at the Environmental Laboratory of ERDC. While the downward transport of small particles of propellant cannot be ruled out at present, we think that the most likely mechanism for migration of propellant chemicals to groundwater is by dissolution from the solid propellant residues, followed by downward movement in saturated or unsaturated flow of precipitation through the soil profile. With respect to leaching of constituents from propellant residues, some initial research on the rate of dissolution of NG and 2,4-DNT from several types of propellant formulations has been con-ducted by Taylor and co-workers at CRREL (Taylor personal communica-tion).
Once dissolved, these constituents are present in the total soil water (pore water and more tightly bound water) and can interact with various soil components and become sorbed, largely to soil organic matter or to cation exchange sites. The degree with which this occurs for various chemicals at equilibrium is referred to as the partition coefficient. When the relation-ship between the concentration on the soil and in water phases is linear with respect to total concentration, the partition coefficient can be repre-sented as
q = Kd C (1)
where q is the soil phase (soil) concentration in mg/kg, Kd is the partition coefficient (L/kg), and C is the solution phase (total soil water) concentra-tion (mg/L). As the values of Kd increase, the chemical resides mostly on the solid phase and the transport in downward moving pore water is re-tarded.
These constituents can also react chemically or biochemically in solution (or possibly while sorbed to the solid phase), thereby reducing their con-centrations. The rate of degradation when the chemical is mineralized or transformation (when the chemical is not mineralized but only modified) is a kinetic property and is generally related to the concentration of the constituent in solution. Often, the rate of loss of the constituent is first order relative to concentration of the constituent in the soil water, and the rate of loss from the aqueous phase can be described as
dc/dt = –k c (2)

ERDC TR-08-1 14-21
where c is the concentration of the specific chemical in solution, t is time, and k is the first-order reaction rate constant. Integrating this equation gives
ln (C/C0) = k t (3)
where C0 is the concentration of the chemical at time 0. When the concen-tration (C) is half of the initial concentration (C0), the equation becomes
t 1/2 = 0.693/k (4)
where t1/2 is the half-life of the chemical in the soil water. Thus the half-life of a chemical in the soil water for first-order processes can be predicted if the reaction rate constant is known.
Thus, if Kd and the first-order rate constant, k, are known, the fate of the chemical in the soil system can be modeled. Of course, both Kd and k vary for various soils, but laboratory experiments have been conducted to pro-vide estimates of these parameters for several test soils.
Batch sorption experiments conducted by Brannon et al. (2002, 2004) and Pennington et al. (1999, 2001) for reagent-grade propellant-related chemi-cals including NG used shake flask tests and a soil suspension to estimate Kd. Typically, only the solution phase was measured after an equilibration time and the solid phase concentration was estimated by difference, as-suming no degradation had occurred. Similar sorption experiments were conducted to estimate k, but the concentrations were measured as a func-tion of time. The Kd and t1/2 values obtained for NG using this approach are shown in Table 14-5 along with results from similar experiments con-ducted by Speitel et al. (2002).
Several laboratory experiments were conducted by Miyares and Jenkins (2000), Jenkins et al. (2003b), and Mulherin et al. (2005) to estimate the half-lives for 2,4-DNT, NG, and NQ, respectively, in several soils. These experiments were conducted by adding aqueous solutions of the chemicals of interest into sets of moist, unsaturated soils and sacrificing replicates at various times to measure the amount of the chemical remaining. Half-lives were estimated from the decay curves (Tables 14-5 and 14-6).
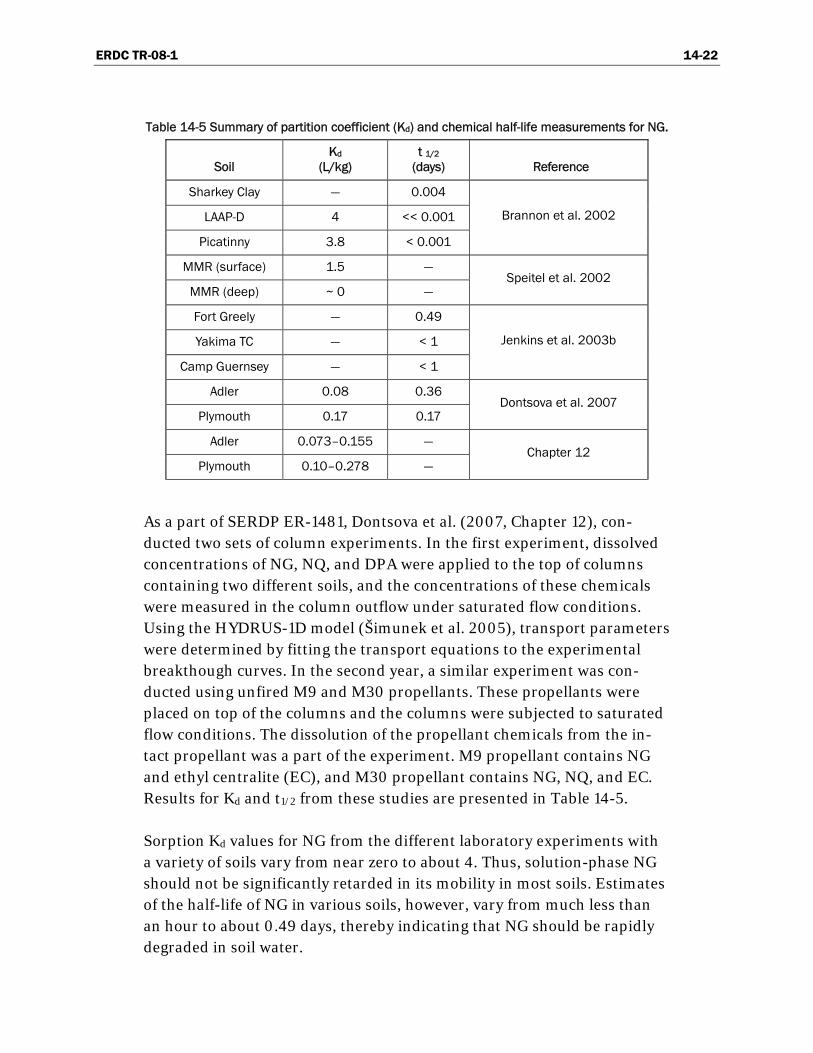
ERDC TR-08-1 14-22
Table 14-5 Summary of partition coefficient (Kd) and chemical half-life measurements for NG.
Soil Kd
(L/kg) t 1/2
(days) Reference
Sharkey Clay — 0.004
LAAP-D 4 << 0.001
Picatinny 3.8 < 0.001
Brannon et al. 2002
MMR (surface) 1.5 —
MMR (deep) ~ 0 — Speitel et al. 2002
Fort Greely — 0.49
Yakima TC — < 1
Camp Guernsey — < 1
Jenkins et al. 2003b
Adler 0.08 0.36
Plymouth 0.17 0.17 Dontsova et al. 2007
Adler 0.073–0.155 —
Plymouth 0.10–0.278 — Chapter 12
As a part of SERDP ER-1481, Dontsova et al. (2007, Chapter 12), con-ducted two sets of column experiments. In the first experiment, dissolved concentrations of NG, NQ, and DPA were applied to the top of columns containing two different soils, and the concentrations of these chemicals were measured in the column outflow under saturated flow conditions. Using the HYDRUS-1D model (Šimunek et al. 2005), transport parameters were determined by fitting the transport equations to the experimental breakthough curves. In the second year, a similar experiment was con-ducted using unfired M9 and M30 propellants. These propellants were placed on top of the columns and the columns were subjected to saturated flow conditions. The dissolution of the propellant chemicals from the in-tact propellant was a part of the experiment. M9 propellant contains NG and ethyl centralite (EC), and M30 propellant contains NG, NQ, and EC. Results for Kd and t1/2 from these studies are presented in Table 14-5.
Sorption Kd values for NG from the different laboratory experiments with a variety of soils vary from near zero to about 4. Thus, solution-phase NG should not be significantly retarded in its mobility in most soils. Estimates of the half-life of NG in various soils, however, vary from much less than an hour to about 0.49 days, thereby indicating that NG should be rapidly degraded in soil water.

ERDC TR-08-1 14-23
All observations from field profile sampling so far reveal that NG has penetrated only a few meters into the shallow surface soil, but this is mostly in soils behind the firing line at antitank firing ranges (Ogden 2000a, Thiboutot et al. 2004a, Diaz et al. 2006, Clausen 2008, Hewitt 2008). The NG concentrations in surface soils at these ranges are the high-est observed anywhere, and the areas behind the firing lines are often a gravelly vehicle parking area that is normally unvegetated or only partially vegetated. Thus, in these areas, we would predict much less soil microbial activity and hence much slower degradation rates than would be present in more vegetated areas and in our test soils. Even so, a removal activity of the gravel pad at rocket range at MMR indicated no NG deeper than 1.2 m below the surface (Ogden 2000b), even though the concentration in the surface soil was 130,000 mg/kg (Ogden 2000a).
Extensive groundwater sampling at MMR shows the presence of RDX and a few other energetic compounds, yet no confirmed hits for NG have been found in the thousands of groundwater samples analyzed from this site (Clausen 2008). Monitoring wells are located immediately downgradient of the firing positions for small arms, demolition areas, and an antitank rocket range. Similarly, HMX and RDX have been found in groundwater at the antitank firing range at CFB Valcartier, but NG was not detected (Martel 2008). Thus, in the field, it appears that the degradation rate of NG must be rapid because it is not found in groundwater in spite of the lack of substantial retardation in most soils.
Sorption partition coefficients were also determined for 2,4-DNT by Pen-nington et al. (1999, 2001). Values for three test soils varied from 0.67 to 12.5 (Table 14-6), the low values obtained for deep aquifer soils and the higher value for a surface soil. Yamamoto et al. (2004) report sorption values of 3.3 for surface soils and 0.22 for deeper soil. These Kd values are several orders of magnitude higher than RDX and HMX, the only muni-tions-related compounds that have been shown to migrate from training ranges.
Pennington et al. (1999, 2001) also estimated the half-life for 2,4-DNT. For one surface soil under aerobic conditions, the half-life was so short it could not be estimated, but for two aquifer soils under anaerobic condi-tions, the half-lives were estimated at 330 and 1400 days. Miyares and Jenkins (2000) estimated half-lives for 2,4-DNT in four test soils held un-der aerobic conditions. Values ranged from 1.5 days for a clayey soil, 50
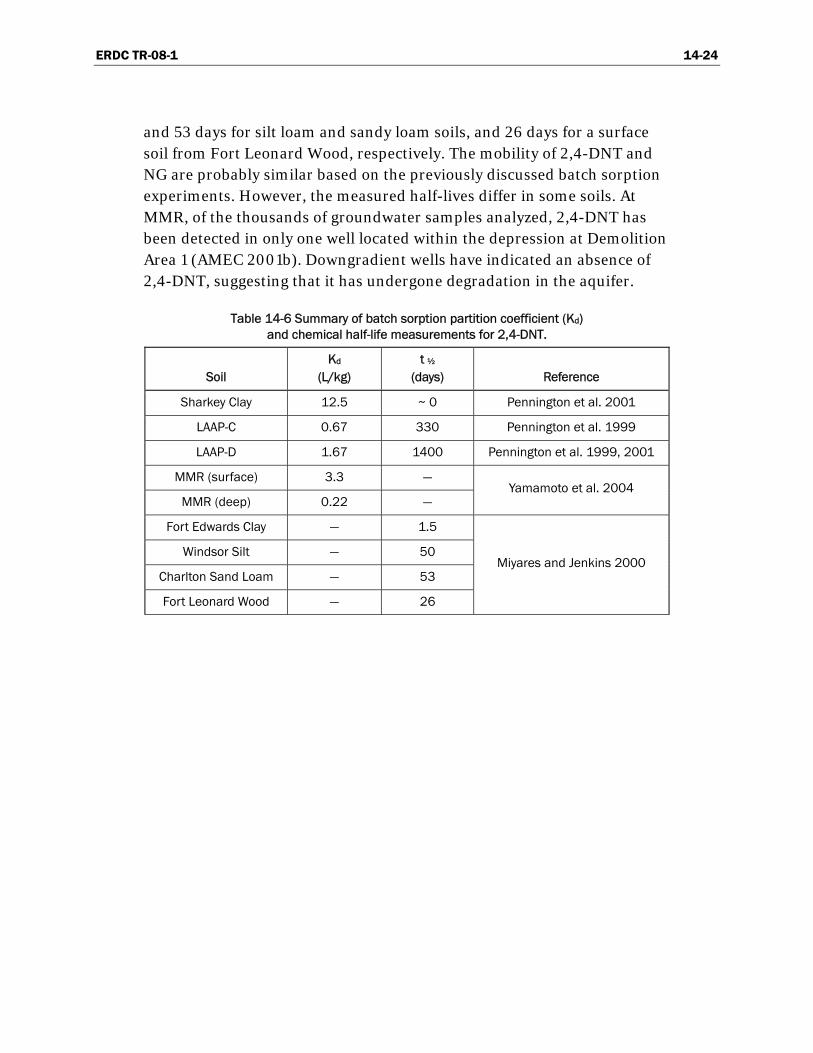
ERDC TR-08-1 14-24
and 53 days for silt loam and sandy loam soils, and 26 days for a surface soil from Fort Leonard Wood, respectively. The mobility of 2,4-DNT and NG are probably similar based on the previously discussed batch sorption experiments. However, the measured half-lives differ in some soils. At MMR, of the thousands of groundwater samples analyzed, 2,4-DNT has been detected in only one well located within the depression at Demolition Area 1 (AMEC 2001b). Downgradient wells have indicated an absence of 2,4-DNT, suggesting that it has undergone degradation in the aquifer.
Table 14-6 Summary of batch sorption partition coefficient (Kd) and chemical half-life measurements for 2,4-DNT.
Soil Kd
(L/kg) t ½
(days) Reference
Sharkey Clay 12.5 ~ 0 Pennington et al. 2001
LAAP-C 0.67 330 Pennington et al. 1999
LAAP-D 1.67 1400 Pennington et al. 1999, 2001
MMR (surface) 3.3 —
MMR (deep) 0.22 — Yamamoto et al. 2004
Fort Edwards Clay — 1.5
Windsor Silt — 50
Charlton Sand Loam — 53
Fort Leonard Wood — 26
Miyares and Jenkins 2000
ERDC TR-08-1 14-25
Recommendations for Additional Research
Results from SERDP ER-1155 demonstrated that the major sources of deposition of explosives residues on active impact areas are the occasional low-order or partial detonations that occur when projectiles do not func-tion properly. Thus, just knowing the number of detonations that occur is insufficient to estimate the mass of residues deposited without a way to estimate the number that have detonated low-order.
For propellant residue deposition, however, the amount of residues of energetic compounds deposited on a per-round-fired basis has been ob-tained for a variety of weapon systems (Table 14-1). Thus, it is now possi-ble to estimate the total mass of propellant residues deposited at a given range solely from the numbers of various munitions fired at that range. There are a few important munition items for which these estimates have not been obtained or for which the estimates are not considered adequate. These include LAW (66-mm M72) and AT4 rockets, Javelin missiles, and tank rounds. It is critical that deposition rates for the shoulder-fired rock-ets and missiles be obtained because preliminary deposition data and resi-dues characterization for several firing points indicate that significant quantities of energetic compounds remain after firing these weapons. Other areas of consideration yet to be fully investigated include the effect of varying the charge size for artillery, the residues resulting from the newer modular artillery propellant charges, and the residues from the fir-ing of grenades such as the 40-mm Mk 19 grenade. As mentioned earlier, some of the deposition tests should be repeated to verify that the data we have collected are repeatable.
Related to firing points, burn points are an area that we have started inves-tigating as a potential source of energetic residues. Following artillery and mortar training exercises, excess propellant is disposed of either at fixed disposal sites (burn points), sometimes consisting of a small structure, or expediently (on the ground). Preliminary data indicate that percent-levels of energetics may remain after expedient disposal, and higher levels still if the disposal is not carried out properly. Burn points are a further concen-tration of the energetic residues stream that will need to be studied to en-able a holistic assessment of the environmental impact of range activities.

ERDC TR-08-1 14-26
The major form of deposition for propellant residues from guns and shoulder-fired rockets is as particles and fibers of nitrocellulose containing other energetic compounds, burn rate modifiers, and stabilizers imbibed within or coating the outside of the nitrocellulose. Because nitrocellulose is insoluble in precipitation, the rate of dissolution of other constituents from the nitrocellulose matrix controls the rate in which these components become available in the environment for transport or degradation. Some initial studies with a few propellants have been conducted by Taylor, Clausen, and co-workers at ERDC-CRREL. We recommend that a survey of the most widely used propellants in the inventory be conducted, and that experiments be conducted with each of these propellant formulations to determine the rate of release of energetic compounds and other added constituents such as stabilizers. If possible, these experiments should be conducted with propellant residues gathered from firing activities rather than intact unfired propellant.
There appear to be widely divergent values for Kd for NG and 2,4-DNT re-ported for various soils. The reason for these divergent values is likely a function of the specific soil chemistry and physical properties. We recom-mend that batch sorption and desorption studies be conducted with soils from a variety of military installations and that factors such as soil pH, mineral content, grain size, organic matter content, cation exchange ca-pacity, etc., be explored. These studies should include both sorption and desorption experiments with reagent-grade NG and DNT, as well as with fired and unfired propellant. The batch studies should be complemented with a few column sorption and desorption experiments, since Kd values are often underestimated with batch experiments.
At present, it does not appear that NG is major issue with regard to off-site migration from firing point areas. However, substantial propellant resi-dues containing NG are deposited at small arms and shoulder-fired anti-tank ranges. The mechanisms that control the fate of NG in soil, once it has eluted from the propellant matrix, are unknown. They may include microbial degradation or chemical hydrolysis, but information on the deg-radation rate of the various operating mechanisms is necessary to enable creation of modeling algorithms to predict the stability of NG under vary-ing environmental conditions. Therefore, we recommend studies that are focused on transformation (hydrolysis, aerobic biodegradation, and photo-degradation) be conducted.

ERDC TR-08-1 14-27
Although secondary compounds such as stabilizers and plasticizers were not specifically addressed in this work, they are present in the propellant and introduced to the environment. Concentrations of these compounds in soil, once they have eluted from the propellant matrices, is largely un-known for the various types of propellants and ranges. Ogden (2000c) found compounds or their breakdown products (di-n-butyl phthalate, di-ethyl phthalate, and N-nitrosodiphenylamine) were accumulating in soils at MMR gun and mortar positions. CRREL has a large inventory of soils collected from a variety of installations and range types that could be ana-lyzed for these components, once reliable analytical methods have been established.
While metals such as antimony, barium, and lead were not a major part of this study, they are also constituents present in the propellant and are ma-terials of interest to regulators. Again, archived soils collected at a variety of installations and ranges are available at ERDC-CRREL to address these issues.

ERDC TR-08-1 14-28
References
AMEC (2001a) Revised Draft IAGWSP Technical Team Memorandum 01-14, Gun and Mortar Firing Positions, Volume I of II for the Camp Edwards Impact Area Groundwater Quality Study, Massachusetts Military Reservation, Cape Cod, Massachusetts (MMR-4342). AMEC Earth and Environmental, Inc., Westford, Massachusetts.
AMEC (2001b) Final IAGWSP Technical Team Memorandum 01-2, Demo 1 Groundwater Report for the Camp Edwards Impact Area Groundwater Quality Study, Massa-chusetts Military Reservation, Cape Cod, Massachusetts (MMR-3444), April 2001. AMEC Earth and Environmental, Inc., Westford, Massachusetts.
Brannon, J.M., C.B. Price, S. Yost, and C. Hayes (2002) The fate of nitroglycerine, RDX transformation products, and TNT impurities. Soil and Sediment Contamina-tion, 11:385–391.
Brannon, J., C. Price, S. Yost, C. Hayes, J. Mirecki, and B. Porter (2004) Fate and trans-port parameters for firing range residues. Chapter 9 in Distribution and Fate of Energetics on DoD Test and Training Ranges: Interim Report 4. US Army Engineer Research and Development Center, Vicksburg, Mississippi, Technical Report ERDC TR-04-4.
Clausen, J.L. (2008) Personal communication, 3 March 2008.
Diaz, E., S. Brochu, S. Thiboutot, G. Ampleman, A. Marois, and A. Gagnon (2006) Assess-ment of the contamination by energetic materials and metals in soil and biomass at Western Area Training Center (WATC) in Wainwright, Alberta (Phase I). Chapter 4 in Distribution and Fate of Energetics on DoD Test and Training Ranges: Interim Report 6. US Army Engineer Research and Development Center, Vicksburg, Mississippi, Technical Report ERDC TR-06-12.
Diaz, E., S. Thiboutot, G. Ampleman, D. Gilbert, D. Faucher, A. Marois, and A. Gagnon (2007) Assessment of gun propellant residues dispersed by LG1 Mark II and C3 105-mm howitzers from static artillery firings. Chapter 4 in Characterization and Fate of Gun and Rocket Propellant Residues on Testing and Training Ranges: Interim Report 1. US Army Engineer Research and Development Center, Vicks-burg, Mississippi, Technical Report ERDC TR-07-1.
Dontsova, K.M., J.C. Pennington, S. Yost, and C. Hayes (2007) Transport of Nitro-glycerin, Nitroguanidine, and Diphenylamine in Soils. Chapter 5 in Charac-terization and Fate of Gun and Rocket Propellant Residues on Testing and Training Ranges: Interim Report 1. US Army Engineer Research and Develop-ment Center, Vicksburg, Mississippi, Technical Report ERDC TR-07-1.
Hewitt, A.D. (2008) Personal communication, 1 February 2008.
ERDC TR-08-1 14-29
Hewitt, A.D., T.F. Jenkins, T. Ranney, D. Lambert, and N. Perron (2004) Characteri-zation of energetic residues at military firing ranges: Schofield Barracks and Pohakuloa Training Area. Chapter 3 in Distribution and Fate of Energetics on DoD Test and Training Ranges: Interim Report 4. US Army Engineer Research and Development Center, Cold Regions Research and Engineering Laboratory, Hanover, New Hampshire, Technical Report ERDC TR-04-4.
Hewitt, A.D., T.F. Jenkins, C.A. Ramsey, K.L. Bjella, T.A. Ranney, and N.M. Perron (2005) Estimating Energetic Residue Loading on Military Artillery Ranges: Large Decision Units. US Army Engineer Research and Development Center, Hanover, New Hampshire, Technical Report ERDC/CRREL TR-05-7.
Jenkins, T., J. Pennington, T. Ranney, T. Berry, Jr., P. Miyares, M.E. Walsh, A. Hewitt, N. Perron, L. Parker, C. Hayes, and G. Wahlgren (2001) Characterization of Explosives Contamination at Military Firing Ranges. US Army Engineer Research and Development Center, Cold Regions Research and Engineering Laboratory, Hanover, New Hampshire, Technical Report ERDC TR-01-5.
Jenkins, T.F., J. Pennington, T. Ranney, J. Stark, M.E. Walsh, C. Hayes, J. Mirecki, A. Hewitt, N. Perron, and D. Lambert (2002) Characterization of explosives contamination at military firing ranges: Yakima Training Center, WA, and Camp Guernsey, WY. Chapter 2 in Distribution and Fate of Energetics on DoD Test and Training Ranges: Interim Report 2. US Army Engineer Research and Develop-ment Center, Cold Regions Research and Engineering Laboratory, Hanover, New Hampshire, Technical Report ERDC TR-03-2.
Jenkins, T.F., A. Hewitt, J. Stark, D. Lambert, N. Perron, T. Ranney, and J. Pennington (2003a) Site characterization research at the Dona Ana Range, Fort Bliss, New Mexico. Chapter 2 in Distribution and Fate of Energetics on DoD Test and Training Ranges: Interim Report 3. US Army Engineer Research and Develop-ment Center, Cold Regions Research and Engineering Laboratory, Hanover, New Hampshire, Technical Report ERDC TR-03-2.
Jenkins, T.F., C. Bartolini, and T.A. Ranney (2003b) Stability of CL-20, TNAZ, HMX, RDX, NG, and PETN in Moist, Unsaturated Soil. US Army Engineer Research and Development Center, Cold Regions Research and Engineering Laboratory, Hanover, New Hampshire, Technical Report ERDC/CRREL TR-03-7.
Jenkins, T., T. Ranney, A. Hewitt, M. Walsh, and K. Bjella (2004) Representative Sampling for Energetic Compounds at an Antitank Firing Range. US Army Engineer Research and Development Center, Cold Regions Research and Engineering Laboratory, Hanover, New Hampshire, Technical Report ERDC/CRREL TR-04-7.
Jenkins, T., A. Hewitt, S. Bigl, S. Taylor, D. Lambert, D. MacMillan, J. Clausen, and N. Perron (2007) Sampling of various types of firing point areas for propellant resi-dues as several Army installations. Chapter 3 in Characterization and Fate of Gun and Rocket Propellant Residues on Testing and Training Ranges: Interim Report 1. US Army Engineer Research and Development Center, Cold Regions Research and Engineering Laboratory, Hanover, New Hampshire, Technical Report ERDC TR-07-1.
Martel, R. (2008) Personal communication, 1 February 2008.

ERDC TR-08-1 14-30
Miyares, P.H., and T.F. Jenkins (2000) Estimating the Half-Lives of Key Components of the Chemical Vapor Signature of Land Mines. US Army Engineer Research and Development Center, Cold Regions Research and Engineering Laboratory, Hanover, New Hampshire, Technical Report ERDC/CRREL TR-00-17.
Mulherin, N.D., T.F. Jenkins, M.E. Walsh (2005) Stability of Nitroguanidine in Moist, Unsaturated Soils. US Army Engineer Research and Development Center, Cold Regions Research and Engineering Laboratory, Hanover, New Hampshire, Technical Report ERDC/CRREL TR-05-2.
Ogden (2000a) Final IAGS Technical Team Memorandum 99-1 KD & U Ranges for the Camp Edwards Impact Area Groundwater Quality Study, Massachusetts Military Reservation Cape Cod, Massachusetts (MMR-1903). Report prepared for the National Guard Bureau. Ogden Environmental and Energy Services, Westford, Massachusetts.
Ogden (2000b) Final Phase I Initial Site Investigation Report KD Range, RTN 4-15033 for the Camp Edwards Impact Area Groundwater Quality Study, Massachusetts Military Reservation Cape Cod, Massachusetts (MMR-2384). Ogden Environ-mental and Energy Services, Westford, Massachusetts.
Ogden (2000c) Draft IAGS Technical Team Memorandum 00-3, Evaluation of Gun and Mortar Firing Positions Volume I and II for the Camp Edwards Impact Area Groundwater Quality Study, Massachusetts Military Reservation Cape Cod, Massachusetts (MMR-2016). Ogden Environmental and Energy Services, Westford, Massachusetts.
Pennington, J.C., D. Gunnison, D.W. Harrelson, J.M. Brannon, M. Zakikhani, T. Jenkins, J. Clarke, C. Hayes, T. Myers, E. Perkins, D. Ringelberg, D. Townsend, H. Fred-rickson, and J. May (1999) Natural Attenuation of Explosives in Soil and Water Systems at Department of Defense Sites: Interim Report. US Army Environ-mental Laboratory, Vicksburg, Mississippi, Technical Report TR EL-99-8.
Pennington, J.C., T.F. Jenkins, J.M. Brannon, J. Lynch, T. Ranney, T. Berry Jr., C. Hayes, P. Miyares, M. Walsh, A. Hewitt, N. Perron, and J. Delfino. (2001) Distribution and Fate of Energetics on DoD Test and Training Ranges: Interim Report 1. US Army Engineer Research and Development Center, Vicksburg, Mississippi, Technical Report ERDC-TR-01-13.
Šimunek, J., M.T. van Genuchten, and M. Šejna (2005) The HYDRUS-1D Software Package for Simulating the One-Dimensional Movement of Water, Heat, and Multiple Solutes in Variably Saturated Media. Version 3.0. Department of Environmental Sciences, University of California Riverside, Riverside, California.
Speitel, G.E., H. Yamamoto, R.L. Autenrieth, and T. McDonald (2002) Laboratory Fate and Transport Studies of High Explosives at the Massachusetts Military Reserva-tion. Final Report. University of Texas at Austin and Texas A&M University. Report prepared for J. Clausen, AMEC, Inc., Westford, Massachusetts.
ERDC TR-08-1 14-31
Thiboutot, S., G. Ampleman, J. Lewis, M. Faucher, R. Martel, J. Ballard, S. Downe, T. Jenkins, and A. Hewitt (2004a) environmental conditions of surface soils and biomass prevailing in the training area at CFB Gagetown, New Brunswick. Chapter 4 in Distribution and Fate of Energetics on DoD Test and Training Ranges: Interim Report 4. US Army Engineer Research and Development Center, Vicksburg, Mississippi, Technical Report ERDC TR-04-4.
Thiboutot, S., G. Ampleman, A. Marois, A. Gagnon, M. Bouchard, A. Hewitt, T. Jenkins, M. Walsh, K. Bjella, C. Ramsey, and T.A. Ranney (2004b) Environmental Con-ditions of Surface Soils, CFB Gagetown Training Area: Delineation of the Presence of Munitions-Related Residues (Phase III, Final Report). Defence Research and Development Canada - Valcartier, Québec, Québec, Technical Report DRDC Valcartier TR 2004-205.
Thiboutot, S., G. Ampleman, M. Lapointe, S Brochu, M. Brassard, M. Stowe, R. Farinaccio, A. Gagnon, and A. Marois (2007) Dispersion of ammonium perchlo-rate following the static firing of Mk58 rocket motors. Chapter 6 in Characteriza-tion and Fate of Gun and Rocket Propellant Residues on Testing and Training Ranges: Interim Report 1. US Army Engineer Research and Development Center, Vicksburg, Mississippi, Technical Report ERDC TR-07-1.
USACHPPM (2001) Training Range Site Characterization and Risk Screening, Camp Shelby, Mississippi, 7–23 September 1999. US Army Center for Health Pro-motion and Preventive Medicine, Aberdeen Proving Ground, Maryland. Final Geohydrologic Study No. 38-EH-6807-02.
USACHPPM (2004a) Directorate of Laboratory Sciences (DLS) Final Analytical Report, Fort Hood (Regional Range Study) Program 37 – Subjono 6872. US Army Center for Health Promotion and Preventive Medicine, Aberdeen Proving Ground, Maryland. Report Serial No. 04E0521-1.
USACHPPM (2004b) Training Range Site Characterization and Risk Screening, Regional Range Study, Dona Ana Range, Fort Bliss, Texas, May 2002. US Army Center for Health Promotion and Preventive Medicine, Aberdeen Proving Ground, Mary-land. Geohydrologic Study No. 38-EH-6807-02.
USACHPPM (in press) Training Range Site Characterization and Risk Assessment, Regional Range Study, Redleg Impact Area, Fort Polk, Louisiana, March 2005. US Army Center for Health Promotion and Preventive Medicine, Aberdeen Proving Ground, Maryland. Project No. 38-EH-00M2-04.
Walsh, M.E., C. Ramsey, C. Collins, A. Hewitt, M.R.Walsh, K. Bjella, D. Lambert, and N. Perron (2005) Collection Methods and Laboratory Processing of Samples from Donnelly Training Area Firing Points, Alaska, 2003. US Army Engineer Research and Development Center, Cold Regions Research and Engineering Laboratory, Hanover, New Hampshire, Technical Report ERDC/CRREL TR-05-6.
Walsh, M.E., C.M. Collins, A.D. Hewitt, M.R. Walsh, T.F. Jenkins, J. Stark, A. Gelvin, T.S. Douglas, N. Perron, D. Lambert, R. Bailey, and K. Myers (2004) Range Characterization Studies at Donnelly Training Area, Alaska: 2001 and 2002. US Army Engineer Research and Development Center, Cold Regions Research and Engineering Laboratory, Hanover, New Hampshire, ERDC/CRREL TR-04-3.
ERDC TR-08-1 14-32
Walsh, M.R., S. Taylor, M.E. Walsh, S. Bigl, K. Bjella, T. Douglas, A. Gelvin, D. Lambert, N. Perron, and S. Saari (2005a) Residues from Live Fire Detonations of 155-mm Howitzer Rounds. US Army Engineer Research and Development Center, Cold Regions Research and Engineering Laboratory, Hanover, New Hampshire, Technical Report ERDC/CRREL TR-05-14.
Walsh, M.R., M.E. Walsh, C.M. Collins, S.P. Saari, J.E. Zufelt, A.B. Gelvin, and J.W. Hug (2005b) Energetic Residues from Live-Fire Detonations of 120-mm Mortar Rounds. US Army Engineer Research and Development Center, Cold Regions Research and Engineering Laboratory, Hanover, New Hampshire, Technical Report ERDC/CRREL TR-05-15.
Walsh, M.R., M.E. Walsh, C.A. Ramsey, R.J. Rachow, J.E. Zufelt, C.M. Collins, A.B. Gelvin, N.M. Perron, and S.P. Saari (2006) Energetic Residues Deposition from 60-mm and 81-mm Mortars. US Army Engineer Research and Development Center, Cold Regions Research and Engineering Laboratory, Hanover, New Hampshire, Technical Report ERDC/CRREL TR-06-10.
Walsh, M.R., M.E. Walsh, S.R. Bigl, N.M. Perron, D.J. Lambert, and A.D. Hewitt (2007) Propellant Residue Deposition from Small Arms Munitions. US Army Engineer Research and Development Center, Cold Regions Research and Engineering Laboratory, Hanover, New Hampshire, Technical Report ERDC/CRREL TR-07-17.
Yamamoto, H., M.C. Morley, G.E. Speitel, and J. Clausen (2004) Fate and Transport of High Explosives in a Sandy Soil: Adsorption and Desorption. Soil and Sediment Contamination, 13: 361–379.

ERDC TR-08-1 A-1
— Appendix A —
Bibliography of ER-1481 Publications
Referred journal articles
Jenkins, T.F., A.D. Hewitt, M.E. Walsh, T.A. Ranney, C.A. Ramsey, C.L. Grant, and K.L. Bjella (2005) Representative Sampling for Energetic Compounds at Military Training Ranges. Journal of Environmental Forensics 6: 45-55.
Jenkins, T.F., A.D. Hewitt, M.E. Walsh, C.L. Grant, and C.A. Ramsey (2005) Comment on “Data Representativeness for Risk Assessment” by Rosemary Mattuck et al. 2005. Journal of Environmental Forensics 6: 325.
Jenkins, T.F. A.D. Hewitt, C.L. Grant, S. Thiboutot, G. Ampleman, M.E. Walsh, T.A. Ranney, C.A. Ramsey, A. Palazzo, J.C. Pennington (2006) Identity and Distribution of Residues of Energetic Compounds at Army Live-Fire Training Ranges. Chemosphere 63: 1280-1290.
Ramsey, C.A. and A.D. Hewitt (2005) A Methodology for Assessing Sample Representativeness. Journal of Environmental Forensics 6: 71-76.
Walsh, M.E., C.A. Ramsey, S. Taylor, A.D. Hewitt, K. Bjella, and C.M. Collins (2007) Subsampling Variance for 2,4-DNT in Firing Point Soils. Soil and Sediment Contamination 16: 459-472.
Government documents
Hewitt, A.D., T.F. Jenkins, T.F., C.A. Ramsey, K.L. Bjella, T.A. Ranney, and N. Perron (2005) Estimating Energetic Residue Loading on Military Artillery Ranges: Large Decision Units. US Army Engineer Research and Development Center, Cold Regions Research and Engineering Laboratory, Hanover, New Hampshire, ERDC/CRREL TR-05-7.
Hewitt, A.D., T.F. Jenkins, M.E. Walsh, M.R. Walsh, C.A. Ramsey, and S.R. Bigl (2007) Protocols for Collection and Surface Soil Samples at Military Training and Testing Ranges for the Characterization of Energetic Munitions Constituents. US Army Engineer Research and Development Center, Cold Regions Research and Engineering Laboratory, Hanover, New Hampshire, Technical Report ERDC/CRREL TR-07-10.

ERDC TR-08-1 A-2
Jenkins, T.F., T.A. Ranney, A.D. Hewitt, M.E. Walsh, K.L. Bjella (2004) Representative Sampling for Energetic Compounds at an Antitank Firing Range. US Army Engineer Research and Development Center, Cold Regions Research and Engineering Laboratory, Hanover, New Hampshire, Technical Report ERDC/CRREL TR 04-7.
Jenkins, T.F., S. Thiboutot, G. Ampleman, A.D. Hewitt, and J.C. Pennington (2005) Identity and Distribution of Residues of Energetic Compounds at Military Live-Fire Training Ranges. US Army Engineer Research and Development Center, Cold Regions Research and Engineering Laboratory, Hanover, New Hampshire, Technical Report ERDC TR-05-10.
Jenkins, T.F., A.D. Hewitt, C.A. Ramsey, K.L. Bjella, S.R. Bigl, and D.J. Lambert (2006) Sampling Studies at an Air Force Live-Fire Bombing Range Impact Area. US Army Engineer Research and Development Center, Cold Regions Research and Engineering Laboratory, Hanover, New Hampshire, Technical Report ERDC/CRREL TR-06-2.
Jenkins, T.F., J.C. Pennington et al (2007) Characterization and Fate of Gun and Rocket Propellant Residues on Testing and Training Ranges Interim Report 1. US Army Engineer Research and Development Center, Cold Regions Research and Engineering Laboratory, Hanover, New Hampshire, Technical Report ERDC TR-07-1.
Jenkins, T.F., G. Ampleman, S. Thiboutot, S.R. Bigl et al. (2008) Characterization and Fate of Gun and Rocket Propellant Residues on Testing and Training Ranges. Final Report. US Army Engineer Research and Development Center, Cold Regions Research and Engineering Laboratory, Hanover, New Hampshire, Technical Report ERDC TR-08-1.
Walsh, M.R., M.E. Walsh, C.M. Collins, S.P. Saari, J.E. Zufelt, A.B. Gelvin, and J.W. Hug (2005) Energetic residues from Live-fire detonations of 120-mm mortar rounds. US Army Engineer Research and Development Center, Cold Regions Research and Engineering Laboratory, Hanover, New Hampshire, Technical Report ERDC/CRREL TR-05-15.
Walsh, M.E. and D.J. Lambert (2006) Extraction kinetics of energetic compounds from training range and army ammunition plant soils: Platform shaker versus sonic bath methods. US Army Engineer Research and Development Center, Cold Regions Research and Engineering Laboratory, Hanover, New Hampshire, Technical Report ERDC/CRREL TR-06-6.
Walsh, M.R., M.E. Walsh, C.A. Ramsey, R.J. Rachow, J.E. Zufelt, C.M. Collins, A.B. Gelvin, N.M. Perron and S.P. Saari (2006) Energetic Residues Deposition from 60-mm and 81-mm Mortars. US Army Engineer Research and Development Center, Cold Regions Research and Engineering Laboratory, Hanover, New Hampshire, Technical Report ERDC/CRREL TR-06-10.
Conference presentations
Ampleman, G (2007) Study of Propellant Residues and Gases Emitted During 105-mm Howitzer Live Firing at the Muffler Installation in Nicolet, Lac St-Pierre, Canada. Partners in Environmental Technology Technical Symposium and Workshop, Washington, D.C., December 4-6, 2007.
ERDC TR-08-1 A-3
Brochu, S., G. Ampleman, S. Thiboutot, A. Hewitt, and J. Clausen (2006) Environmental Impact of Military Training at CFB Petawawa, Ontario, Canada. SERDP/ESTCP Symposium, Washington, DC, November 28-30, 2006.
Dontsova, K (2007) Dissolution and Transport of M9 and M30 Propellants in Soil Columns. Partners in Environmental Technology Technical Symposium and Workshop, Washington, D.C., December 4-6, 2007.
Hewitt, A.D., M.E. Walsh, and T.F. Jenkins (2007) Method 8330B: Analysis of Energetic Compounds from DoD Training Ranges. Louisville District, Corps of Engineers, Chemistry Conference. Louisville, Kentucky.
Hewitt, A.D (2007) Recent Advances for Characterizing Residues of Energetic Residues on Military Training Ranges. Partners in Environmental Technology Technical Symposium and Workshop, Washington, D.C., December 4-6, 2007.
Hewitt, A.D (2007) EPA Method 8330B: Data Quality Impact on the Characterization of Energetic Residues on Military Training Ranges. Partners in Environmental Technology Technical Symposium and Workshop, Washington, D.C., December 4-6, 2007.
Jenkins, T.F., A.D. Hewitt, and M.E. Walsh (2007) Representative Sampling for Energetic Compounds at Military Training Ranges. SETAC Symposium, Milwaukee, Wisconsin, 11-15 November 2007.
Jenkins, T.F. and A.D. Hewitt (2007) SW846-Method 8330B: What it is and Why it is Needed? EPA Region 6 QA Symposium, Dallas, Texas.
Jenkins, T.F., A.D. Hewitt, M.R. Walsh, and M.E. Walsh (2007) Energetic Constituents on Military Training Ranges: Deposition, Accumulation, Characterization. NATO Meeting, Sofia, Bulgaria.
Jenkins, T.F., A.D. Hewitt, M.R. Walsh, M.E. Walsh, R. Bailey, S. Bigl, and D. Lambert (2007) Accumulation of Propellant Residues at Small Arms Firing Points. Partners in Environmental Technology Technical Symposium and Workshop, Washington, D.C., December 4-6, 2007.
Jenkins, T.F (2007) Distribution and Fate of Propellant Compounds on Military Training Ranges: Summary of SERDP ER-1481. Partners in Environmental Technology Technical Symposium and Workshop, Washington, D.C., December 4-6, 2007.
Jenkins, T.F., A.D. Hewitt, M.E. Walsh, S. Taylor, and J. Pennington (2006) Nature and Distribution of Energetic Compounds at Army Training Ranges. Proceedings of the 2006 JSEM Conference, Denver, Colorado. March 2006.
Jenkins, T.F (2006) Chemical Residues of Energetic Materials on DoD Training Ranges. EPA Region 6 Explosives Workshop. Dallas, TX, September 19-21; Austin, TX, September 26-28, 2006.
Jenkins, T.F (2006) Sampling and Analytical Considerations for the Determination of Residues of Energetic Compounds in Soil, EPA Region 6 Quality Assurance Conference, Dallas, Texas, October 16-19, 2006.

ERDC TR-08-1 A-4
Penfold, L., M. Dymerski, and A.D. Hewitt (2007) Comparison Study of Analysis for Energetic Residues in Soil by HPLC/MS and HPLC/UV. SERDP/ESTCP Symposium, Washington, DC, November 28-30, 2007.
Poulin, I (2007) Artillery Live Firing: A Study of the Particulate Matter Emissions at the Muzzle of LG1 Mark II 105-mm and M777 155-mm Howiters. Partners in Environmental Technology Technical Symposium and Workshop, Washington, D.C., December 4-6, 2007.
Thiboutot, S., G. Ampleman, E. Diaz, E., Brochu, R. Martel, J. Lewis, J. Hawari, G. Sunahara, P.Y. Robidoux, J.C. Pennington, T.F. Jenkins, A.D. Hewitt, M.E. Walsh, and M.R. Walsh (2006) Towards Sustainable Military Training Ranges: Canadian Perspective, Proceedings of the 2006 JSEM Conference, Denver, Colorado, March 2006.
Thiboutot, S (2007) Energetic Residue Deposition from 84-mm Carl Gustav Antitank Live Firing. Partners in Environmental Technology Technical Symposium and Workshop, Washington, D.C., December 4-6, 2007.
Walsh, M.E., S. Taylor, C.A. Ramsey, M.R. Walsh, A.D. Hewitt, T.F. Jenkins, and C.M. Collins (2006) Artillery and Infantry Firing Point Residues: What , Where, and How Much? UXO Countermine Forum 2006, Las Vegas, Nevada, July 10-14, 2006.
Walsh, M.R., M.E. Walsh, C.A. Ramsey, S. Taylor, and C.M. Collins (2006) Firing Points, A Potential Source of Range Residues. UXO Countermine Forum 2006, Las Vegas, Nevada, July 10-14, 2006.
Walsh, M.R (2007) Energetic Residue Mass Deposition Resulting from Live-Firing of Military Munitions. Partners in Environmental Technology Technical Symposium and Workshop, Washington, D.C., December 4-6, 2007.

REPORT DOCUMENTATION PAGE Form Approved
OMB No. 0704-0188 Public reporting burden for this collection of information is estimated to average 1 hour per response, including the time for reviewing instructions, searching existing data sources, gathering and maintaining the data needed, and completing and reviewing this collection of information. Send comments regarding this burden estimate or any other aspect of this collection of information, including suggestions for reducing this burden to Department of Defense, Washington Headquarters Services, Directorate for Information Operations and Reports (0704-0188), 1215 Jefferson Davis Highway, Suite 1204, Arlington, VA 22202-4302. Respondents should be aware that notwithstanding any other provision of law, no person shall be subject to any penalty for failing to comply with a collection of information if it does not display a currently valid OMB control number. PLEASE DO NOT RETURN YOUR FORM TO THE ABOVE ADDRESS.
1. REPORT DATE (DD-MM-YYYY) January 2008
2. REPORT TYPE Technical Report
3. DATES COVERED (From - To)
5a. CONTRACT NUMBER
5b. GRANT NUMBER
4. TITLE AND SUBTITLE
Characterization and Fate of Gun and Rocket Propellant Residues on Testing and Training Ranges: Final Report
5c. PROGRAM ELEMENT NUMBER
5d. PROJECT NUMBER
5e. TASK NUMBER
6. AUTHOR(S) Thomas F. Jenkins, Guy Ampleman, Sonia Thiboutot, Susan R. Bigl, Susan Taylor, Michael R. Walsh, Dominic Faucher, Richard Martel, Isabelle Poulin, Katerina M. Dontsova, Marianne E. Walsh, Sylvie Brochu, Alan D. Hewitt, Guillaume Comeau, Emmanuela Diaz, Mark A. Chappell, Jennifer L. Fadden, André Marois, Lieutenant (N) Rick Fifield, Bernadette Quémerais, Jiri Šimunek, Nancy M. Perron, Annie Gagnon, Thérèse Gamache, Judith C. Pennington, Victoria Moors, Dennis J. Lambert, Major Denis Gilbert, Ronald N. Bailey, Vincent Tanguay, Charles A. Ramsey, Larry Melanson, and Marie-Claude Lapointe
5f. WORK UNIT NUMBER
7. PERFORMING ORGANIZATION NAME(S) AND ADDRESS(ES) 8. PERFORMING ORGANIZATION REPORT NUMBER
US Army Engineer Research and Development Center Cold Regions Research and Engineering Laboratory 72 Lyme Road Hanover, New Hampshire 03755-1290
ERDC TR-08-1
9. SPONSORING / MONITORING AGENCY NAME(S) AND ADDRESS(ES) 10. SPONSOR/MONITOR’S ACRONYM(S)
SERDP 11. SPONSOR/MONITOR’S REPORT NUMBER(S)
Strategic Environmental Research and Development Program Arlington, Virginia 22203
12. DISTRIBUTION / AVAILABILITY STATEMENT Approved for public release; distribution is unlimited. Available from NTIS, Springfield, Virginia 22161. 13. SUPPLEMENTARY NOTES
14. ABSTRACT
Over the past two years, the U.S. Army Engineer Research and Development Center and the Defence R&D Canada Valcartier have partnered to develop an improved understanding of the distribution and fate of propellant residues on military training ranges in SERDP Project ER-1481. As a portion of this work, field studies have been conducted to estimate the mass of propellant residues deposited per round fired from various munitions. This research included artillery, mortars, small arms, shoulder-fired rockets, and several large mis-siles. Particles of the propellant residues deposited have been collected and studied, and initial experiments conducted to measure the rate of release of nitroglycerin (NG) and 2,4-dinitrotoluene (DNT) after deposition. Field studies have been conducted at a number of U.S. and Canadian installations to determine the mass and distribution of residue accumulation from different types of munitions. Depth profiling has been accomplished to document the depth to which these residues have penetrated the shallow subsoil. Laboratory column studies have been conducted with NG, nitroguanidine, and diphenylamine to document transport rates for solution phase propellant constituents and develop process descriptors for use in mathematical models to enable prediction of fate and transport for these con-stituents. Subsequent column studies have utilized intact propellants. The major accomplishments from these field and laboratory studies are presented.
15. SUBJECT TERMS 2,4-DNT, Air emissions, Antitank, Artillery, Deposition, Dinitrotoluene, Diphenylamine, Gases, MLRS rocket, Mortar, Naval, Nitroglycerin, Nitroguanidine, Particles, Perchlorate, Propellants, Residues, Small arms, Soils, Tank, Training ranges, Transport 16. SECURITY CLASSIFICATION OF: 17. LIMITATION
OF ABSTRACT 18. NUMBER OF PAGES
19a. NAME OF RESPONSIBLE PERSON
a. REPORT
U b. ABSTRACT
U c. THIS PAGE
U U 598 19b. TELEPHONE NUMBER (include area code)
Standard Form 298 (Rev. 8-98) Prescribed by ANSI Std. 239.18