Auditory cortical projections to the cochlear nucleus in guinea pigs
14
Auditory cortical projections to the cochlear nucleus in guinea pigs Brett R. Schofield * , Diana L. Coomes Department of Anatomical Sciences and Neurobiology, University of Louisville, 500 S. Preston Street, Louisville, KY 40202, USA Received 29 March 2004; accepted 4 August 2004 Available online 7 October 2004 Abstract We used anterograde tracing techniques to examine projections from auditory cortex to the cochlear nucleus in guinea pigs. Fol- lowing injection of dextrans into the temporal cortex, labeled axons were present bilaterally in the cochlear nucleus. The distribution of boutons within the cochlear nucleus was similar on the two sides. The majority of boutons was usually located on the ipsilateral side. Most of the boutons were located in the granule cell areas, where many small boutons and a few larger, mossy-type endings were labeled. Additional small, labeled boutons were found in all layers of the dorsal cochlear nucleus, with the majority located in the fusiform cell layer. Labeled boutons were also present in the ventral cochlear nucleus, where they were located in the small cell cap as well as magnocellular parts of both posteroventral and anteroventral cochlear nucleus. Similar results were obtained with injections restricted to primary auditory cortex or to the dorsocaudal auditory field. The results illustrate direct cortical projections to the cochlear nucleus that are likely to modulate the activity in a number of ascending auditory pathways. Ó 2004 Elsevier B.V. All rights reserved. Keywords: Descending pathways; Efferent; Olivocochlear; Auditory system 1. Introduction The auditory cortex has long been recognized as the source of large descending projections to both the thal- amus and midbrain, where the projections can modify the responses of subcortical cells to acoustic stimuli (re- viewed by Huffman and Henson, 1990). Recent work in rats has demonstrated significant cortical projections to auditory nuclei located below the midbrain, specifically to the cochlear nucleus, superior olivary complex and areas associated with the nuclei of the lateral lemniscus (Feliciano et al., 1995; Weedman and Ryugo, 1996a,b; Mulders and Robertson, 2000; Doucet et al., 2002). This work has led to the conclusion that auditory cortex can directly contact subcollicular auditory circuits, and pre- sumably modify auditory processing even at these very early stages of the ascending auditory pathways. The present study focuses on the cortical projections to the first station in the central auditory pathways, the 0378-5955/$ - see front matter Ó 2004 Elsevier B.V. All rights reserved. doi:10.1016/j.heares.2004.08.003 Abbreviations: AC, auditory cortex; A1, primary auditory cortex, Wallace et al. (2000, 2002); CN, cochlear nucleus; cap, small cell cap; cnr, cochlear nerve root; d, deep layer of the DCN; DC, dorsocaudal auditory cortex, Wallace et al. (2000, 2002); DCB, dorsocaudal belt (of auditory cortex), Wallace et al. (2000, 2002); DCN, dorsal cochlear nucleus; DRB, dorsorostral belt (of auditory cortex), Wallace et al. (2000, 2002); f, fusiform cell layer of DCN; g, granule cell area; icp, inferior cerebellar peduncle; lam, lamina region of granule cell area; m, molecular layer of the DCN; mcp, middle cerebellar peduncle; oca, octopus cell area of the VCN; rh, rhinal sulcus; S, small field (of au- ditory cortex), Wallace et al. (2000, 2002); sca, spherical cell area of VCN; str, striatum; T, transition zone (of auditory cortex), Wallace et al. (2000, 2002); tb, trapezoid body; VCB, ventrocaudal belt (of auditory cortex), Wallace et al. (2000, 2002); VCN, ventral cochlear nucleus; Vest, vestibular nuclei; vn, vestibular nerve; VRB, ventroros- tral belt (of auditory cortex), Wallace et al. (2000, 2002); Vtr, spinal trigeminal tract; wm, subcortical white matter * Corresponding author. Tel.: +1 502 852 5686; fax: +1 502 852 6228. E-mail address: [email protected] (B.R. Schofield). www.elsevier.com/locate/heares Hearing Research 199 (2005) 89–102
Transcript of Auditory cortical projections to the cochlear nucleus in guinea pigs

www.elsevier.com/locate/heares
Hearing Research 199 (2005) 89–102
Auditory cortical projections to the cochlear nucleus in guinea pigs
Brett R. Schofield *, Diana L. Coomes
Department of Anatomical Sciences and Neurobiology, University of Louisville, 500 S. Preston Street, Louisville, KY 40202, USA
Received 29 March 2004; accepted 4 August 2004
Available online 7 October 2004
Abstract
We used anterograde tracing techniques to examine projections from auditory cortex to the cochlear nucleus in guinea pigs. Fol-
lowing injection of dextrans into the temporal cortex, labeled axons were present bilaterally in the cochlear nucleus. The distribution
of boutons within the cochlear nucleus was similar on the two sides. The majority of boutons was usually located on the ipsilateral
side. Most of the boutons were located in the granule cell areas, where many small boutons and a few larger, mossy-type endings
were labeled. Additional small, labeled boutons were found in all layers of the dorsal cochlear nucleus, with the majority located in
the fusiform cell layer. Labeled boutons were also present in the ventral cochlear nucleus, where they were located in the small cell
cap as well as magnocellular parts of both posteroventral and anteroventral cochlear nucleus. Similar results were obtained with
injections restricted to primary auditory cortex or to the dorsocaudal auditory field. The results illustrate direct cortical projections
to the cochlear nucleus that are likely to modulate the activity in a number of ascending auditory pathways.
� 2004 Elsevier B.V. All rights reserved.
Keywords: Descending pathways; Efferent; Olivocochlear; Auditory system
0378-5955/$ - see front matter � 2004 Elsevier B.V. All rights reserved.
doi:10.1016/j.heares.2004.08.003
Abbreviations: AC, auditory cortex; A1, primary auditory cortex,
Wallace et al. (2000, 2002); CN, cochlear nucleus; cap, small cell cap;
cnr, cochlear nerve root; d, deep layer of the DCN; DC, dorsocaudal
auditory cortex, Wallace et al. (2000, 2002); DCB, dorsocaudal belt (of
auditory cortex), Wallace et al. (2000, 2002); DCN, dorsal cochlear
nucleus; DRB, dorsorostral belt (of auditory cortex), Wallace et al.
(2000, 2002); f, fusiform cell layer of DCN; g, granule cell area; icp,
inferior cerebellar peduncle; lam, lamina region of granule cell area; m,
molecular layer of the DCN; mcp, middle cerebellar peduncle; oca,
octopus cell area of the VCN; rh, rhinal sulcus; S, small field (of au-
ditory cortex), Wallace et al. (2000, 2002); sca, spherical cell area of
VCN; str, striatum; T, transition zone (of auditory cortex), Wallace
et al. (2000, 2002); tb, trapezoid body; VCB, ventrocaudal belt (of
auditory cortex), Wallace et al. (2000, 2002); VCN, ventral cochlear
nucleus; Vest, vestibular nuclei; vn, vestibular nerve; VRB, ventroros-
tral belt (of auditory cortex), Wallace et al. (2000, 2002); Vtr, spinal
trigeminal tract; wm, subcortical white matter* Corresponding author. Tel.: +1 502 852 5686; fax: +1 502 852
6228.
E-mail address: [email protected] (B.R. Schofield).
1. Introduction
The auditory cortex has long been recognized as the
source of large descending projections to both the thal-
amus and midbrain, where the projections can modify
the responses of subcortical cells to acoustic stimuli (re-viewed by Huffman and Henson, 1990). Recent work in
rats has demonstrated significant cortical projections to
auditory nuclei located below the midbrain, specifically
to the cochlear nucleus, superior olivary complex and
areas associated with the nuclei of the lateral lemniscus
(Feliciano et al., 1995; Weedman and Ryugo, 1996a,b;
Mulders and Robertson, 2000; Doucet et al., 2002). This
work has led to the conclusion that auditory cortex candirectly contact subcollicular auditory circuits, and pre-
sumably modify auditory processing even at these very
early stages of the ascending auditory pathways.
The present study focuses on the cortical projections
to the first station in the central auditory pathways, the

90 B.R. Schofield, D.L. Coomes / Hearing Research 199 (2005) 89–102
cochlear nuclei (CN). In rats, the cortical projections to
the CN originate from primary auditory cortex and ter-
minate in the granule cell areas, where they contact
granule cell dendrites (Weedman and Ryugo, 1996a).
The granule cells project to fusiform cells of the dorsal
cochlear nucleus (DCN), which project in turn to theinferior colliculus. Thus, cortical projections to the CN
are likely to affect ascending projections from the DCN.
Recent studies suggest that the cortical projection to
the CN may be more extensive in guinea pigs than in rats
(Schofield et al., 2001; Jacomme et al., 2003). Specifically,
the cells of origin are greater in number and have a wider
range of soma sizes in guinea pigs. The projections in rats
may arise only from primary auditory cortex (A1),whereas those in guinea pigs arise from at least two areas
(A1 and the dorsocaudal field). Further, the pathway ter-
minates not only in granule cell areas (similar to rats),
but also in additional areas of the dorsal and ventral
CN (Schofield et al., 2001; Jacomme et al., 2003). These
latter projections could allow cortical axons to influence
CN cell types other than granule cells, and thus to mod-
ulate activity in additional ascending pathways. The pur-pose of the present study was to examine the cortical
projections in guinea pigs and to characterize their distri-
bution and axon morphology in both the ipsilateral and
contralateral CN. We made small injections in some
cases (as done in previous studies) and large injections
in other cases in order to gain an overview of the entire
pathway. The results clarify some differences between
rats and guinea pigs, and suggest that other (apparent)differences are the result of small injection sites.
2. Materials and methods
2.1. Surgery
Experiments were performed on 24 Hartley guineapigs obtained from Charles River Labs (Wilmington,
MA). All procedures were completed in accordance with
the University of Louisville Institutional Animal Care
and Use Committee and the NIH Guidelines. Details
of the surgery were the same as described previously
(e.g., Schofield, 2001). Briefly, the animal was anesthe-
tized with halothane (3.5–4.0% for induction; 2.25–
3.0% for maintenance) in a mixture of oxygen andnitrous oxide. Atropine sulfate was administered (0.08
mg/kg, i.m.) to reduce bronchial secretions, and oph-
thalmic ointment was applied to the eyes to prevent dry-
ing of the cornea. The scalp was shaved and disinfected
with polyhydroxydine solution (Solvay Veterinary, Inc.,
Princeton, NJ). The animal was then placed in a stereo-
taxic frame modified for gas anesthesia. Body tempera-
ture was maintained with a feedback-controlledheating pad. The scalp was incised and the wound mar-
gins were injected with 0.25% bupivacaine, a long-last-
ing local anesthetic (Sensorcaine, Astra Pharmaceutical
Products, Westborough, MA). A dental drill was used
to open the skull over temporal cortex. Following injec-
tion of the tracer (described below), the craniotomy was
covered with Gelfoam (Harvard Bioscience, Inc., Hollis-
ton, MA) and the skin was sutured. The animal was thenreturned to its cage and monitored until it regained the
ability to stand normally. It was then given food and
water and returned to the animal facility.
Three anatomical tracers were used: biotinylated dex-
tran (BDA, 10k MW, Molecular Probes, Eugene, OR),
FluoroRuby (FR, tetramethyl rhodamine dextran, 10k
MW, Molecular Probes, Eugene, OR), and fluorescein
dextran (FD, 10k MW, Molecular Probes, Eugene,OR). All tracers were dissolved in saline (10% weight/
volume). Each tracer was injected with a 10 ll Hamilton
syringe dedicated to use with that tracer. The pseudosyl-
vian sulcus and skull landmarks provided guides for the
location of auditory cortical areas in the guinea pig
(Wallace et al., 2000). Ten animals received injections
into the left cortex, thirteen received injections into the
right cortex, and one received injections of FR andFD on opposite sides. Seven of the animals with injec-
tions into one side received injections of FR and FD
into different locations.
Two different strategies were used to inject tracer over
a wide cortical area. In the first approach, several pene-
trations were made parallel to the surface of temporal
cortex. The insertion point was chosen by eye so that
the needle passed into the deep layers of temporal cortex.The needle was inserted �3.5 mm, where an injection of
0.15 ll was made. Additional injections were made at
multiple points as the needle was withdrawn. The se-
quence was repeated for a total of 3–5 penetrations that
extended over most of temporal cortex. In some cases,
two or more additional sites were injected more dorsally.
For the second approach, the syringe was mounted
orthogonal to the cortical surface. The needle was theninserted 1.8 mm, where 0.15 ll tracer was injected. Mul-
tiple injections (up to 37), spaced �0.5–0.7 mm apart,
were made over a large expanse of temporal cortex.
Tracers were injected into individual cortical areas in
several animals. One animal received 3 closely spaced
injections (0.15 ll each) of FD into the dorsocaudal
auditory field. Two other animals received injections
confined to primary auditory cortex (A1). One of theseanimals received a pair of closely-spaced FR injections
and the other animal received separate injections of
FR and FD, thus yielding three experiments to analyze
A1 projections. For these cases, each injection was 0.15–
0.2 ll in volume.
2.2. Perfusion and processing
Five to 19 days after surgery, the animal was sacri-
ficed by inhalation of carbon dioxide (10 min) or by

B.R. Schofield, D.L. Coomes / Hearing Research 199 (2005) 89–102 91
overdose with sodium pentobarbital (440 mg/kg, i.p.).
Following cessation of breathing and loss of corneal
and withdrawal reflexes, the animal was perfused
through the aorta with Tyrode�s solution (�100 ml) fol-
lowed by fixative. Most cases were processed for light
microscopy, for which the fixative was 300–500 ml 4%paraformaldehyde in phosphate buffer (PB; 0.1 M, pH
7.4) followed by a similar volume of 4% paraformalde-
hyde with 10% sucrose in PB. The brain was removed
and stored overnight at 4 �C in the same fixative with
30% sucrose. One case (GP360) was perfused as de-
scribed above except the fixative was 2% paraformalde-
hyde plus 2% glutaraldehyde. In cases with injections of
fluorescent tracers, the cortical surface was photo-graphed before sectioning to document the location of
the injection site (described below). Brains were cut on
a Vibratome or were frozen and cut on a sliding micro-
tome. In most cases, the cortex was cut in the transverse
plane and the brainstem was cut in the sagittal plane. In
a few cases, the entire brain was sectioned in either the
transverse or horizontal planes. All sections were 50
lm thick. Sections were collected in six series.
2.2.1. Processing of BDA
In cases with BDA injections, alternate sections (3 of
the 6 series) were treated with avidin-biotin-peroxidase
and then stained with diaminobenzidine enhanced with
nickel ammonium sulfate (Adams, 1981). The sections
were then mounted on gelatin-coated slides and air-
dried. One or more series was counterstained with thio-nin for identification of cytoarchitectonic boundaries,
and then all slides were cleared and coverslipped with
DPX (Aldrich Chemical Co., St. Louis, MO).
2.2.2. Processing of fluorescent tracers
In a few cases, all the sections were mounted in serial
order on gelatin-coated slides. More often, 3 evenly-
spaced series were mounted for fluorescence and afourth series was mounted for thionin staining. All sec-
tions were air-dried overnight. Sections for fluorescence
were coverslipped with DPX. Other sections were
stained with thionin, cleared, and coverslipped. In some
cases, the fluorescent tracers were converted to a perma-
nent label by staining overnight with a biotinylated anti-
body (biotinylated goat-antirhodamine or biotinylated
goat-antifluorescein, Vector Laboratories, Burlingame,CA); mixed 1:1000 in 0.01 M phosphate buffer, pH
7.4, 0.9% NaCl plus 1% normal goat serum, then proc-
essed with ABC and diaminobenzidine as described
above for BDA.
2.3. Data analysis and photography
The distribution of labeled boutons was plotted inevery sixth section through the CN with a Zeiss Axio-
plan microscope and Neurolucida reconstruction system
(MicroBrightField, Williston, VT). Subdivisions of the
CN were identified according to Hackney et al. (1990).
Subregions of the granule cell area were identified by
comparison with those described in rats (Mugnaini
et al., 1980). In order to illustrate axonal morphology,
labeled axons were drawn with a camera lucida attachedto the microscope.
In most cases with fluorescent injections, a surface
picture of the cortical injection site was obtained prior
to sectioning the brain. Three separate images were ob-
tained. First, a digital camera (Magnafire, Optronics)
with a 50 mm macro lens was mounted on a copy stand
and used to photograph temporal cortex and a millime-
ter scale under incident light. The brain was then re-pho-tographed through an Axioskop microscope, using a
2.5· objective and a 0.5· adaptor for the Magnafire
camera. One image was obtained with epifluorescence,
and another image was obtained with incident light.
The last image included the millimeter scale, which per-
mitted accurate scaling of the microscopic and macro-
scopic images. The images were aligned with Adobe
Photoshop on a Macintosh G4 computer. We then dig-itized a map of the guinea pig auditory cortical areas
(Wallace et al., 2002) and used Photoshop to overlay
the map onto the photograph of the injection site. The
pseudosylvian and rhinal sulci were used to align the
images. For presentation in black and white, the fluores-
cence image was converted to grayscale and the contrast
was inverted such that the fluorescence appeared black.
Photographs of labeled axons were taken with theAxioskop and Magnafire camera. Adobe Photoshop
was used to adjust contrast and brightness and to add
labels. In some cases, color images were converted to
grayscale and the contrast was inverted to improve vis-
ibility of the labeled structures.
3. Results
All three tracers – FluoroRuby, fluorescein dextran
and biotinylated dextran – gave qualitatively similar re-
sults, though the two fluorescent tracers generally labe-
led more axons. The injections in any given case
typically covered only a portion of temporal cortex
(Fig. 1). The injections typically involved cortical layers
II–V, with layers I and VI included to variable degrees.The injections never extended into the subjacent white
matter (Fig. 1(c)). Across cases, the location varied such
that projections from most or all of the auditory cortical
areas were included (except, perhaps, the most rostro-
dorsal regions). We did not detect any differences related
to the side of injection. In the following section, we de-
scribe the course, distribution and morphology of axons
labeled by large injections into multiple auditory corticalareas. We then briefly describe the results of a few cases
with injections confined to a single area.

Fig. 1. Photomicrographs showing a representative injection site in temporal cortex. (a) Surface view of FluoroRuby injection in case GP346 (see
Section 2 for description of figure production). The contrast of fluorescence image was inverted, making the fluorescence appear black, to enhance
visibility of the injection. Outlines indicate the auditory cortical areas defined by Wallace et al. (2000, 2002). Scale bar = 1 mm. Dorsal is up; rostral is
to the left. (b) Outlines showing identity of auditory cortical areas. See list of abbreviations. (c) Fluorescence photomicrograph of a transverse section
through an injection of FluoroRuby in right temporal cortex, case GP324. Scale bar = 0.5 mm; dorsal is up; lateral is right.
92 B.R. Schofield, D.L. Coomes / Hearing Research 199 (2005) 89–102
3.1. Course of axons into the CN
On the side ipsilateral to the cortical injection, labeled
axons entered the CN by two routes, similar to those de-
scribed in rats (Feliciano et al., 1995). The majority of
axons entered the CN rostrally at the subpeduncular
part of the granule cell area. The axons coursed caudally
within the granule cell area or traveled more superfi-cially in the DCN. A small number of axons entered
the CN via the ventral acoustic stria/trapezoid body.
On the side contralateral to the cortical injection,
labeled fibers entered the CN by the same routes de-
scribed above, although there was not such a predomi-
nance of fibers in the subpeduncular route.
3.2. Distribution of boutons
The distribution of labeled boutons is illustrated for
one case (Figs. 2 and 3). In this and other cases with
large injections, the majority of boutons were located
on the ipsilateral side. In two cases with the largest
amount of CN labeling overall, we compared the num-
ber of boutons in the plots on the ipsilateral and contra-
lateral sides. The ipsilateral/contralateral ratios in thesecase were 2.3 (case GP360; 22,552 total boutons) and 3.4
(case GP367; 2307 total boutons). While the boutons
differed in number, they were distributed over similar
areas on the two sides in each of the cases. Smaller injec-
tions labeled fewer boutons in the CN but the distribu-
tion was similar to that following larger injections.
However, the relative amount of labeling on the two
sides was much more variable. At one extreme, boutonswere labeled only on the ipsilateral side. In a few cases
with small injection sites, the contralateral side con-
tained the majority of boutons. We never observed a
case in which boutons were present only contralaterally.
There was no apparent correlation between the location
of the injection site and the laterality of the label.
Within the CN, the majority of boutons were located
in the granule cell area. Some of the axons extended to
the caudal tip of the CN, which often contained a dense
collection of labeled boutons (Fig. 2, sections 22 and 25;
Fig. 3, sections 38 and 41). The DCN contained addi-tional boutons in all layers; these were often concen-
trated in the fusiform cell or deep layers. In most
cases, boutons were also present in the ventral cochlear
nucleus (VCN). A common area of concentration was
the small cell cap, which is located in the dorsal margin
of the VCN, subjacent to the granule cell area. In the
remainder of the VCN, boutons were most numerous
in regions that contain multipolar cells and globularbushy cells, less numerous in the spherical cell area
(which contains both spherical bushy cells and multipo-
lar cells), and very rare in the octopus cell area.
3.3. Morphology
Most axons in the granule cell area were thin and had
small en passant and terminal boutons (Fig. 4). A fewaxons were thicker and gave rise to larger endings
(Fig. 4(b)), similar to the mossy endings described for
cortical projections to the CN in rats (Weedman and
Ryugo, 1996a). These endings were observed only in
the granule cell regions. The axons often coursed rostro-
caudally in the sagittal plane (Fig. 5(a), arrowheads).
Equally long stretches of axon were not observed in
transverse sections, suggesting that individual axonsmay innervate a region elongated in the sagittal plane.
As described above, a minority of axons entered the
CN ventrally from the trapezoid body (ventral acoustic

Fig. 2. Plot showing the distribution of labeled cortical boutons in the cochlear nucleus ipsilateral to an injection of FluoroRuby into left temporal
cortex. Each labeled bouton is indicated by a black dot. Parasagittal sections; dorsal is up, rostral is to the right. Sections are numbered from lateral
to medial and are spaced 150 lm apart. Case GP360. Scale bar = 1 mm. See list of abbreviations.
B.R. Schofield, D.L. Coomes / Hearing Research 199 (2005) 89–102 93
stria) (Fig. 5(a), arrows). These axons could be traced as
far as the small cell cap of the VCN (described below).
The trajectory of the axons at the border of the small cell
cap and the granule cell area suggested that some axons
may enter the granule cell area from this ventral route,
but axon reconstruction would be necessary to confirmthis point.
In the DCN, small endings were present in all layers
(Figs. 6 and 7). In addition, large endings similar to
those in the granule cell area were present in the fusi-
form cell layer (Fig. 7(d), asterisks). Throughout the
DCN, most of the boutons were located in the neuropil
(i.e., not obviously associated with Nissl-stained cell
bodies), although some boutons appeared to be in closecontact with fusiform cell bodies. Some axons could be
traced across the layers (Fig. 7(c) and (d), arrows), pro-
viding boutons to two (or occasionally all three) of the
layers.
In the VCN, most of the boutons were small (Fig. 8)
and were located in the neuropil (i.e., not obviously
associated with Nissl-stained cell bodies). As shown
above (Fig. 5(b)), axons were often present in the small
cell cap. Outside the cap, some axons in the VCN fol-
lowed a trajectory that paralleled the eighth nerve fibers,suggesting that the cortical axons may respect the tono-
topic organization of this area (Fig. 8(a)).
3.4. Injections into individual cortical areas
In order to determine whether individual cortical
areas project to the CN, we made small injections into
primary auditory cortex (A1) or the dorsocaudal field(DC). Fig. 9 shows the results from a case with an injec-
tion restricted to A1. In this case, and others with
presumptive injections in A1, the ventral division of
the medial geniculate nucleus contained labeled cells

Fig. 3. Plot showing the distribution of labeled cortical boutons in the cochlear nucleus contralateral to an injection of FluoroRuby into temporal
cortex. Each labeled bouton is indicated by a black dot. Parasagittal sections; dorsal is up, rostral is to the right. Sections are numbered from lateral
to medial and are spaced 150 lm apart. Case GP360. Scale bar = 1 mm. See list of abbreviations.
94 B.R. Schofield, D.L. Coomes / Hearing Research 199 (2005) 89–102
restricted primarily to the caudal half of the nucleus.
This pattern of labeling is consistent with an injection
in A1 (Redies et al., 1989b). The number of labeled bou-
tons in the CN was smaller than that following large
injections but the distribution was similar. The two
other experiments with injections confined to A1 pro-
duced similar results.
In one animal, we made an injection restricted to areaDC (Fig. 10). Retrogradely labeled cells in the ventral
medial geniculate were located in the rostral part of
the nucleus, confirming an injection in DC (Redies
et al., 1989b). In this case, labeled boutons were found
ipsilaterally in the granule cell area as well as other parts
of the DCN and VCN. Labeled boutons were not
observed in the contralateral CN in this case.
4. Discussion
The present study is the first to assess the cortical pro-
jections to the CN as revealed by large injections in tem-
poral cortex. The results illustrate that auditory cortex
projects bilaterally to the CN in guinea pigs. The projec-
tions originate from cells in cortical areas A1 and DC.
The majority of axons terminate in the granule cell
areas, with additional terminations in much of the ven-
tral CN and in all layers of the dorsal CN. In the follow-
ing section, we discuss technical issues relevant to our
interpretation of the data. We compare our findings to
previous studies and then consider some of the func-tional implications of this pathway.
The tracers used here can be transported bidirection-
ally, and one must consider the possibility that an axon
is labeled by retrograde transport from the injection site
to a cell body in another region, and then anterogradely
down another branch of the axon. Such collateral labe-
ling would not represent a projection from cells in the
injection site. It is very unlikely that such a mechanismcan account for the labeled axons in the CN in the pre-
sent experiments. Such an event would require that indi-
vidual cells send axon collaterals to both the injection
site – i.e., temporal cortex – and the CN. Our cortical
injections routinely labeled cells in brainstem nuclei
(e.g., raphe nuclei) associated with broad modulation
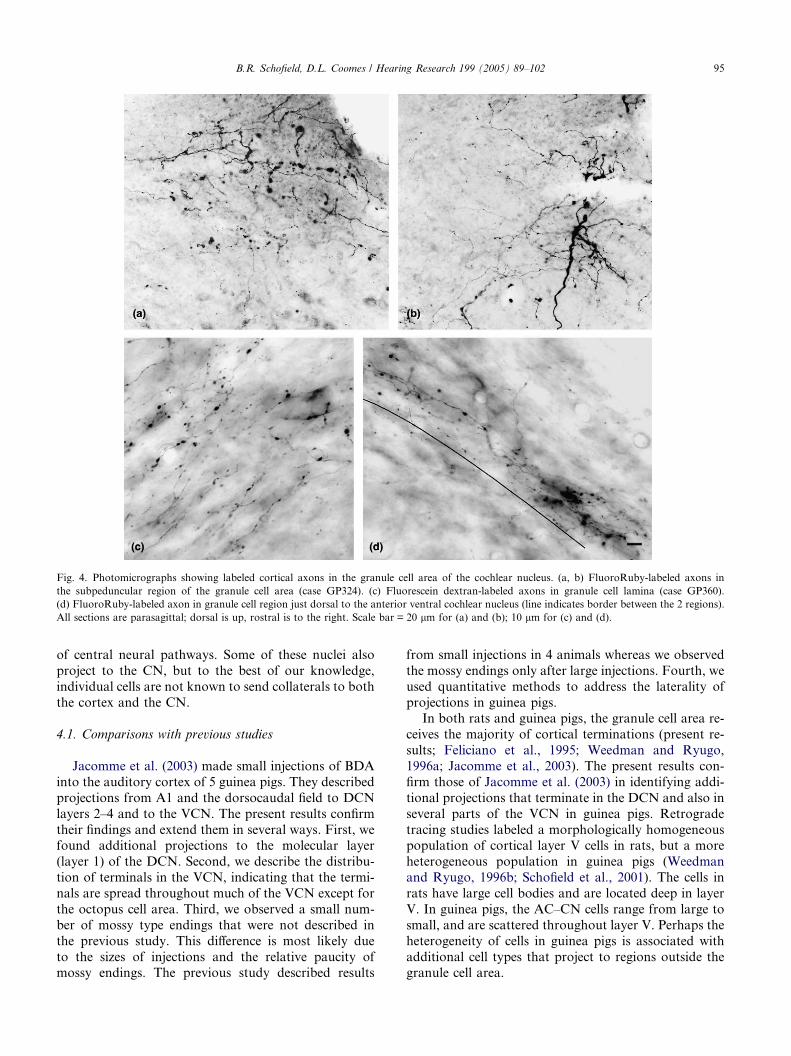
Fig. 4. Photomicrographs showing labeled cortical axons in the granule cell area of the cochlear nucleus. (a, b) FluoroRuby-labeled axons in
the subpeduncular region of the granule cell area (case GP324). (c) Fluorescein dextran-labeled axons in granule cell lamina (case GP360).
(d) FluoroRuby-labeled axon in granule cell region just dorsal to the anterior ventral cochlear nucleus (line indicates border between the 2 regions).
All sections are parasagittal; dorsal is up, rostral is to the right. Scale bar = 20 lm for (a) and (b); 10 lm for (c) and (d).
B.R. Schofield, D.L. Coomes / Hearing Research 199 (2005) 89–102 95
of central neural pathways. Some of these nuclei also
project to the CN, but to the best of our knowledge,
individual cells are not known to send collaterals to both
the cortex and the CN.
4.1. Comparisons with previous studies
Jacomme et al. (2003) made small injections of BDA
into the auditory cortex of 5 guinea pigs. They described
projections from A1 and the dorsocaudal field to DCN
layers 2–4 and to the VCN. The present results confirm
their findings and extend them in several ways. First, wefound additional projections to the molecular layer
(layer 1) of the DCN. Second, we describe the distribu-
tion of terminals in the VCN, indicating that the termi-
nals are spread throughout much of the VCN except for
the octopus cell area. Third, we observed a small num-
ber of mossy type endings that were not described in
the previous study. This difference is most likely due
to the sizes of injections and the relative paucity ofmossy endings. The previous study described results
from small injections in 4 animals whereas we observed
the mossy endings only after large injections. Fourth, we
used quantitative methods to address the laterality of
projections in guinea pigs.In both rats and guinea pigs, the granule cell area re-
ceives the majority of cortical terminations (present re-
sults; Feliciano et al., 1995; Weedman and Ryugo,
1996a; Jacomme et al., 2003). The present results con-
firm those of Jacomme et al. (2003) in identifying addi-
tional projections that terminate in the DCN and also in
several parts of the VCN in guinea pigs. Retrograde
tracing studies labeled a morphologically homogeneouspopulation of cortical layer V cells in rats, but a more
heterogeneous population in guinea pigs (Weedman
and Ryugo, 1996b; Schofield et al., 2001). The cells in
rats have large cell bodies and are located deep in layer
V. In guinea pigs, the AC–CN cells range from large to
small, and are scattered throughout layer V. Perhaps the
heterogeneity of cells in guinea pigs is associated with
additional cell types that project to regions outside thegranule cell area.

Fig. 5. (a) Low magnification camera lucida drawing showing the course of labeled cortical axons within the cochlear nucleus. Some axons enter
rostrally and travel caudally through the granule cell area (arrowheads); other axons (arrows) enter the cochlear nucleus ventrally from the trapezoid
body. Box shows location of drawing in (b). (b) High magnification drawings of labeled axons and boutons in the granule cell area and small cell cap.
Parasagittal sections; dorsal is up, rostral is to the right. Scale bar = 1 mm for (a); 50 lm for (b). See list of abbreviations.
96 B.R. Schofield, D.L. Coomes / Hearing Research 199 (2005) 89–102
A second possibility to explain the differences betweenrats and guinea pigs is a difference in experimental meth-
ods. Feliciano et al. (1995) used PHA-L and biotinylated
dextran, and Weedman and Ryugo (1996a) used biotin-
ylated dextran. The present study also used dextrans
(labeled with biotin or fluorescent markers), suggesting
that the differences are unlikely to be explained by the
tracers. However, other variables, such as transport time
or histological processing, cannot be ruled out as asource of variation. Future experiments will be needed
to discriminate among these possibilities and to identify
the pattern of projections in other species.
4.2. Laterality of projections
The number of labeled boutons in the ipsilateral vs.
the contralateral CN varied from case to case, particu-
larly with the smaller injections. The ipsilateral side of-ten but not always contained the majority of labeled
boutons. A similar result has been described in rats
(Feliciano et al., 1995). Neither study identified a corre-
lation between laterality of projections and the location
of the injection site. In four animals that received re-
stricted injections of BDA into auditory cortex, Jaco-
mme et al. (2003) observed a predominance of
ipsilateral projections in two animals and exclusivelyipsilateral projections in two other animals. The
authors suggested that the laterality of projections
might be related to frequency, with contralateral pro-
jections associated only with low frequency cortical
areas. Our own data (including those obtained with ret-
rograde tracers; Schofield et al., 2001), do not rule out
a frequency bias in the projections, but suggest that
high frequency cortical areas do project to the CN.

Fig. 6. Photomicrographs showing labeled cortical axons in the dorsal cochlear nucleus. (a)–(c) Axons in the molecular layer. Some of the boutons
(arrows) are located close to the surface of the nucleus, which is visible at the upper left of panels (a) and (b). (d) Axons in the fusiform cell layer.
(e) Axons in the deep layer. All panels: Case GP360; FluoroRuby-labeled axons. Parasagittal sections; dorsal is up, rostral is to the right. Scale
bar = 10 lm.
B.R. Schofield, D.L. Coomes / Hearing Research 199 (2005) 89–102 97
An alternate explanation for differences in laterality of
the projections is that cells that project to one side or
the other are segregated in cortex, such that some injec-
tions include more ipsilaterally-projecting cells while
others include more contralaterally-projecting ones.
Preliminary data, from cases in which we injected dif-
ferent tracers into left and right CN, suggest that ipsi-
laterally-projecting cells are spread relatively evenlyacross temporal cortex whereas the contralaterally-pro-
jecting cells are more clustered (unpublished observa-
tions). Thus, some regions are dominated by
ipsilaterally projecting cells whereas other areas have
a mixture of cells projecting to either side. Large injec-
tions would include ‘‘mixed’’ zones as well as ‘‘ipsilat-
eral only’’ zones, and would label more axons in the
ipsilateral CN. This is consistent with our quantitativefindings that large injections labeled �2–4 times as
many boutons on the ipsilateral side. Small injections
could range from ipsilateral only (as seen in our case
GP371), to a mixed laterality. The potential significance
of mixed versus ipsilateral-only zones may be related to
specific physiological properties of cells that are ar-
ranged in patches in cortex (e.g., Read et al., 2002).
For example, the cortex has segregated zones of cells
that are excited by either ear and cells that are excited
by the contralateral ear and inhibited by the ipsilateral
ear. Perhaps these zones have different patterns of pro-
jections to the CN.
4.3. Origins from different cortical areas
There is now evidence from both anterograde and
retrograde tracing studies in rats and guinea pigs show-
ing projections from A1 to the CN (Feliciano et al.,
1995; Weedman and Ryugo, 1996a,b; Jacomme et al.,
2003; present study). The dorsocaudal auditory field
(DC) also projects to the CN in guinea pigs. AreasA1 and DC have different response properties (Redies
et al., 1989a; Rutkowski et al., 2000; Wallace et al.,
2000, 2002), so we predict that their projections to
the CN serve different functions. Weedman and Ryugo
(1996b) identified area Te1 as the source of projections
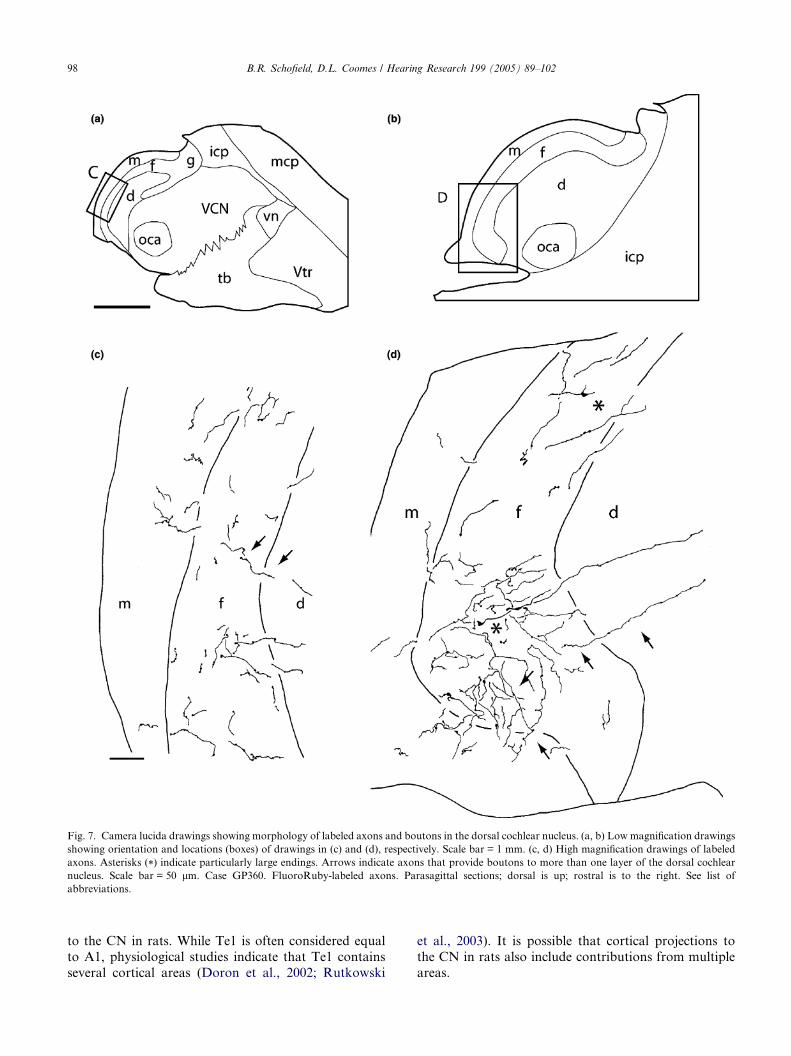
Fig. 7. Camera lucida drawings showing morphology of labeled axons and boutons in the dorsal cochlear nucleus. (a, b) Low magnification drawings
showing orientation and locations (boxes) of drawings in (c) and (d), respectively. Scale bar = 1 mm. (c, d) High magnification drawings of labeled
axons. Asterisks (*) indicate particularly large endings. Arrows indicate axons that provide boutons to more than one layer of the dorsal cochlear
nucleus. Scale bar = 50 lm. Case GP360. FluoroRuby-labeled axons. Parasagittal sections; dorsal is up; rostral is to the right. See list of
abbreviations.
98 B.R. Schofield, D.L. Coomes / Hearing Research 199 (2005) 89–102
to the CN in rats. While Te1 is often considered equal
to A1, physiological studies indicate that Te1 contains
several cortical areas (Doron et al., 2002; Rutkowski
et al., 2003). It is possible that cortical projections to
the CN in rats also include contributions from multiple
areas.

Fig. 8. Photomicrographs of labeled cortical axons in the ventral cochlear nucleus. (a) Labeled axons in the posteroventral cochlear nucleus. The
axon is aligned parallel to the fascicles formed by the auditory nerve fibers (lines). (b) Labeled axons in the anteroventral cochlear nucleus. Scale
bar = 5 lm for (a), 10 lm for (b).
B.R. Schofield, D.L. Coomes / Hearing Research 199 (2005) 89–102 99
4.4. Functional implications
It will be important in future studies to confirm that
the boutons described here are in fact associated with
synapses and, if so, to identify their postsynaptic targets.
Ultrastructural studies in rats suggest that the AC–CN
terminals are excitatory and that they terminate selec-
tively on granule cell dendrites (Weedman and Ryugo,1996a). While the targets of cortical axons have not been
identified in guinea pigs, the predominance of boutons
in the granule cell areas suggests that granule cells
may be targets in guinea pigs as well as in rats. The gran-
ule cells project directly and indirectly to fusiform cells
in the DCN, which project in turn to the inferior collicu-
lus (reviewed by Oertel and Golding, 1997; Young and
Davis, 2002). The cortical projections are thus in a posi-tion to affect intrinsic CN circuits that could in turn af-
fect the large ascending projection from the DCN to the
IC.
The functions of the smaller cortical projections to
the molecular and deep layers of the DCN are more dif-
ficult to surmise because their cellular targets have not
yet been identified. However, it seems reasonable to pre-
dict that they too will modify activity in the ascendingpathway from the DCN to the inferior colliculus. Inter-
estingly, some axons appeared to provide boutons to
multiple layers in the DCN. Fusiform cells have their
cell body located in the fusiform cell layer and dendrites
that invade the molecular and deep layers. It is conceiv-
able then, that fusiform cells are the targets of many of
the cortical axons. Alternatively, the molecular and deep
layers contain several other cell types, any of whichcould be targeted by the cortical projections.
The present results also demonstrate a cortical pro-
jection to the small cell cap of the VCN. The small cell
cap has numerous properties distinguishing it from the
magnocellular portion of the VCN and associating it
with olivocochlear circuits. Medial olivocochlear cells
send axon branches to outer hair cells in the cochlea
and to the small cell cap (Brown et al., 1988b; Benson
and Brown, 1990). The cap also receives primary affer-
ent input different from that which reaches the magno-
cellular VCN (Brown et al., 1988a; Liberman, 1991;Liberman, 1993). The cap thus appears to integrate
ascending and descending information associated with
the medial olivocochlear system. Furthermore, the cap
is a source of projections to medial olivocochlear cells
(Ye et al., 2000). The present results indicate that the
small cell cap could also integrate cortical inputs, which
may thus contribute to the proposed functions of the
cap and olivocochlear circuits in cochlear gain controland intensity coding (e.g., Kim et al., 1995; Ye et al.,
2000).
Cortical axons also terminate in other parts of the
VCN. These regions do not contain granule cells, indi-
cating that if these cells are targets of cortical projec-
tions in guinea pigs they cannot be the only targets. It
is interesting that some cortical axons in the VCN paral-
lel the course of the auditory nerve fibers, suggestingthat they terminate in a frequency-specific manner.
The distribution of cortical boutons suggests that the
targets are multipolar cells or globular bushy cells.
Globular bushy cells project to a variety of brainstem
targets and appear to be particularly important for bin-
aural processing. Multipolar cells are a heterogeneous
group, and participate in many different projections,
including direct projections to the inferior colliculus,ventral nucleus of the lateral lemniscus, various perioli-
vary nuclei, and the contralateral cochlear nucleus
(Schofield and Cant, 1996a,b, 1997; Doucet and Ryugo,

Fig. 9. Plot showing the distribution of labeled cortical boutons in the cochlear nucleus after an injection of FluoroRuby restricted to area A1 of
right temporal cortex. (a) Line drawing depicting a surface view of the cortical areas as defined by Wallace et al. (2002) and the location of the
injection site (black area). (b, c) Plots showing the distribution of labeled boutons in the cochlear nucleus ipsilateral (b) and contralateral (c) to the
injection. Each labeled bouton is indicated by a black triangle. Transverse sections. Sections in (b) progress from caudal (left) to rostral (right);
sections in (c) progress from rostral to caudal. Distance between sections can be calculated by multiplying the difference between section numbers
(lower left of each section) by 50 lm. Scale bars = 1 mm. See list of abbreviations.
100 B.R. Schofield, D.L. Coomes / Hearing Research 199 (2005) 89–102
1997, 2003; Alibardi, 1998a,b; Cant and Benson, 2003).
At least some of these projections arise from different
populations of multipolar cells (Cant, 1982; Wenthold,
1987; Schofield and Cant, 1996b; Doucet and Ryugo,
1997, 2003); clearly, understanding the role of cortical
projections will require that the target cells and theirprojections be identified.
4.5. Parallel descending pathways to the CN
The role of direct cortical projections to the CN must
be considered in the context of other descending path-
ways by which higher levels of the auditory system could
affect the CN. Such pathways include descending projec-
tions from the inferior colliculus and the superior oli-
vary complex, each of which receive projections from
the higher centers, including auditory cortex (e.g., Felic-
iano et al., 1995).We propose that the different pathways to the CN
serve different functions. Several types of evidence sup-
port this hypothesis. First, the different pathways have
distinct patterns of termination in the CN, suggesting
that they may affect different CN circuits. As dis-
cussed above, the AC–CN projections frequently con-

(a)
(b)
DCB
VCB
VRB
DRB
SA1
T
DC
Dorsal
Rostral
Dorsal
Rostral
3
15
9
GP371
g
g
vn
m
m
f
f
d
d
VCN
VCN
tb
icp
Vtr
Vtr
mcp
tb
cnr
Fig. 10. Plot showing the distribution of labeled cortical boutons in
the cochlear nucleus after an injection of FluoroRuby into area DC of
left temporal cortex. (a) Line drawing depicting a surface view of the
cortical areas as defined by Wallace et al. (2002) and the location of the
injection site (black area). (b) Plots showing the distribution of labeled
boutons in the cochlear nucleus ipsilateral to the injection. Each
labeled bouton is indicated by a black triangle. Parasagittal sections.
Sections progress from lateral (top) to medial (bottom). Distance
between sections can be calculated by multiplying the difference
between section numbers (lower left of each section) by 50 lm. Scale
bars = 1 mm. See list of abbreviations.
B.R. Schofield, D.L. Coomes / Hearing Research 199 (2005) 89–102 101
tact granule cells and other cell types in both the DCN
and VCN (at least in guinea pigs). In contrast, projec-
tions from the inferior colliculus terminate only in the
DCN (reviewed by Saldana, 1993). Unlike the corticalprojections, the collicular projections terminate rela-
tively evenly throughout the DCN layers. Finally, the
superior olivary complex terminates throughout the
CN, with relatively heavy projections to all areas (re-
viewed by Spangler and Warr, 1991).
Second, some of the descending projections are prob-
ably excitatory while others are inhibitory. Projections
from the cortex and the inferior colliculus are assumedto be excitatory. Jacomme et al. (2003) described 2 units
in the dorsal CN that were excited by stimulation of ipsi-
lateral auditory cortex, although they could not deter-
mine if the effect was monosynaptic. In contrast,
projections from the superior olivary complex appear
to use a variety of neurotransmitters, including GABA,
glycine, and acetylcholine. These projections probably
exert inhibitory as well as excitatory effects (reviewed
by Helfert and Aschoff, 1997).
Recent studies have implicated descending pathwaysin a wide range of functions, including selective atten-
tion, intensity coding, frequency selectivity, differential
gating of sensory information, sound localization,
adjustment of dynamic range, modulation of temporal
processing, discrimination of speech sounds, and plastic-
ity in functional organization of subcortical structures
(reviewed by Huffman and Henson, 1990; Spangler
and Warr, 1991; Rouiller, 1997; Suga and Ma, 2003).Associating any particular descending pathway with a
particular function will require additional information
on the synaptic organization, neurotransmitters and
physiology of the descending pathways.
Acknowledgement
Special thanks to Mr. Arkadiusz Slusarczyk for ex-
pert technical assistance. This work was supported by
grants NIH DC04391 and DC05277.
References
Adams, J.C., 1981. Heavy metal intensification of DAB-based HRP
reaction product. J. Histochem. Cytochem. 29, 775.
Alibardi, L., 1998a. Ultrastructural and immunocytochemical charac-
terization of commissural neurons in the ventral cochlear nucleus
of the rat. Anat. Anz. 180, 427–438.
Alibardi, L., 1998b. Ultrastructural and immunocytochemical charac-
terization of neurons in the rat ventral cochlear nucleus projecting
to the inferior colliculus. Anat. Anz. 180, 415–426.
Benson, T.E., Brown, M.C., 1990. Synapses formed by olivocochlear
axon branches in the mouse cochlear nucleus. J. Comp. Neurol.
295, 52–70.
Brown, M.C., Berglund, A.M., Kiang, N.Y.S., Ryugo, D.K., 1988a.
Central trajectories of type II spiral ganglion neurons. J. Comp.
Neurol. 278, 581–590.
Brown, M.C., Liberman, M.C., Benson, T.E., Ryugo, D.K., 1988b.
Brainstem branches from olivocochlear axons in cats and rodents.
J. Comp. Neurol. 278, 591–603.
Cant, N.B., 1982. Identification of cell types in the anteroventral
cochlear nucleus that project to the inferior colliculus. Neurosci.
Lett. 32, 241–246.
Cant, N.B., Benson, C.G., 2003. Parallel auditory pathways: projec-
tion patterns of the different neuronal populations in the dorsal and
ventral cochlear nuclei. Brain Res. Bull. 60, 457–474.
Doron, N.N., Ledoux, J.E., Semple, M.N., 2002. Redefining the
tonotopic core of rat auditory cortex: physiological evidence for a
posterior field. J. Comp. Neurol. 453, 345–360.
Doucet, J.R., Ryugo, D.K., 1997. Projections from the ventral
cochlear nucleus to the dorsal cochlear nucleus in rats. J. Comp.
Neurol. 385, 245–264.
Doucet, J.R., Ryugo, D.K., 2003. Axonal pathways to the lateral
superior olive labeled with biotinylated dextran amine injections in
the dorsal cochlear nucleus of rats. J. Comp. Neurol. 461, 452–465.

102 B.R. Schofield, D.L. Coomes / Hearing Research 199 (2005) 89–102
Doucet, J.R., Rose, L., Ryugo, D.K., 2002. The cellular origin of
corticofugal projections to the superior olivary complex in the rat.
Brain Res. 925, 28–41.
Feliciano, M., Saldana, E., Mugnaini, E., 1995. Direct projections
from the rat primary auditory neocortex to nucleus sagulum,
paralemniscal regions, superior olivary complex and cochlear
nuclei. Auditory Neurosci. 1, 287–308.
Hackney, C.M.,Osen, K.K., Kolston, J., 1990. Anatomyof the cochlear
nuclear complex of guinea pig. Anat. Embryol. 182, 123–149.
Helfert, R.H., Aschoff, A., 1997. Superior olivary complex and nuclei of
the lateral lemniscus. In: Ehret, G., Romand, R. (Eds.), The Central
Auditory System. Oxford University Press, NewYork, pp. 193–258.
Huffman, R.F., Henson Jr., O.W., 1990. The descending auditory
pathway and acousticomotor systems: Connections with the
inferior colliculus. Brain Res. Rev. 15, 295–323.
Jacomme, A.V., Nodal, F.R., Bajo, V.M., Manunta, Y., Edeline, J.M.,
Babalian, A., Rouiller, E.M., 2003. The projection from auditory
cortex to cochlear nucleus in guinea pigs: an in vivo anatomical and
in vitro electrophysiological study. Exp. Brain Res. 153, 467–476.
Kim, D.O., Parham,K., Zhao, H., Ghoshal, S., 1995. The olivocochlear
feedback gain control subsystem: ascending input from the small cell
cap of the cochlear nucleus. In: Flock, A., Ottoson, D., Ulfendahl,
M. (Eds.), Active Hearing. Pergamon, Oxford, pp. 31–51.
Liberman, M.C., 1991. Central projections of auditory-nerve fibers of
differing spontaneous rate. I. Anteroventral cochlear nucleus. J.
Comp. Neurol. 313, 240–258.
Liberman, M.C., 1993. Central projections of auditory nerve fibers of
differing spontaneous rate. II. Posteroventral and dorsal cochlear
nuclei. J. Comp. Neurol. 327, 17–36.
Mugnaini, E., Warr, W.B., Osen, K.K., 1980. Distribution and light
microscopic features of granule cells in the cochlear nuclei of cat,
rat, and mouse. J. Comp. Neurol. 191, 581–606.
Mulders, W.H., Robertson, D., 2000. Evidence for direct cortical
innervation of medial olivocochlear neurones in rats. Hear. Res.
144, 65–72.
Oertel, D., Golding, N.L., 1997. Circuits of the dorsal cochlear
nucleus. In: Syka, J. (Ed.), Acoustical signal processing in the
central auditory system. Plenum Press, New York, pp. 127–138.
Read, H.L., Winer, J.A., Schreiner, C.E., 2002. Functional architec-
ture of auditory cortex. Curr. Opin. Neurobiol. 12, 433–440.
Redies, H., Brandner, S., Creutzfeldt, O.D., 1989a. Anatomy of the
auditory thalamocortical system of the guinea pig. J. Comp.
Neurol. 282, 489–511.
Redies, H., Sieben, U., Creutzfeldt, O.D., 1989b. Functional subdivi-
sions in the auditory cortex of the guinea pig. J. Comp. Neurol.
282, 473–488.
Rouiller, E.M., 1997. Functional organization of the auditory path-
ways. In: Ehret, G., Romand, R. (Eds.), The Central Auditory
System, First ed. Oxford University Press, New York, pp. 3–96.
Rutkowski, R.G., Miasnikov, A.A., Weinberger, N.M., 2003. Char-
acteristics of multiple physiological fields within the anatomical
core of rat auditory cortex. Hear. Res. 181, 116–130.
Rutkowski, R.G., Wallace, M.N., Shackleton, T.M., Palmer, A.R.,
2000. Organization of binaural interactions in the primary and
dorsocaudal fields of the guinea pig auditory cortex. Hear. Res.
145, 177–189.
Saldana, E., 1993. Descending projections from the inferior colliculus
to the cochlear nucleus in mammals. In: Merchan, M.A., Juiz, J.,
Godfrey, D., Mugnaini, E. (Eds.), The Mammalian Cochlear
Nuclei: Organization and Function. Plenum Press, New York, pp.
153–165.
Schofield, B.R., 2001. Origins of projections from the inferior
colliculus to the cochlear nucleus in guinea pigs. J. Comp. Neurol.
429, 206–220.
Schofield, B.R., Cant, N.B., 1996a. Origins and targets of commissural
connections between the cochlear nuclei in guinea pigs. J. Comp.
Neurol. 375, 128–146.
Schofield, B.R., Cant, N.B., 1996b. Projections from the ventral
cochlear nucleus to the inferior colliculus and the contralateral
cochlear nucleus in guinea pigs. Hear. Res. 102, 1–14.
Schofield, B.R., Cant, N.B., 1997. Ventral nucleus of the lateral
lemniscus in guinea pigs: cytoarchitecture and inputs from the
cochlear nucleus. J. Comp. Neurol. 379, 363–385.
Schofield, B.R., Coomes, D.L., Abel, M., Schofield, R.M., 2001.
Projections from the auditory cortex to the cochlear nucleus in
guinea pigs. Assoc. Res. Otolaryngol. 24, 44.
Spangler, K.M., Warr, W.B., 1991. The descending auditory system.
In: Altschuler, R.A., Bobbin, R.P., Clopton, B.M., Hoffman, D.W.
(Eds.), Neurobiology of Hearing: The Central Auditory System.
Raven Press, New York, pp. 27–45.
Suga, N., Ma, X., 2003. Multiparametric corticofugal modulation and
plasticity in the auditory system. Nat. Rev. Neurosci. 4, 783–794.
Wallace, M.N., Rutkowski, R.G., Palmer, A.R., 2000. Identification
and localization of auditory areas in guinea pig cortex. Exp. Brain
Res. 132, 445–456.
Wallace, M.N., Rutkowski, R.G., Palmer, A.R., 2002. Interconnec-
tions of auditory areas in the guinea pig neocortex. Exp. Brain Res.
143, 106–119.
Weedman, D.L., Ryugo, D.K., 1996a. Projections from auditory
cortex to the cochlear nucleus in rats: synapses on granule cell
dendrites. J. Comp. Neurol. 371, 311–324.
Weedman, D.L., Ryugo, D.K., 1996b. Pyramidal cells in primary
auditory cortex project to cochlear nucleus in rat. Brain Res. 706,
97–102.
Wenthold, R.J., 1987. Evidence for a glycinergic pathway connecting
the two cochlear nuclei: an immunocytochemical and retrograde
transport study. Brain Res. 415, 183–187.
Ye, Y., Machado, D.G., Kim, D.O., 2000. Projection of the marginal
shell of the anteroventral cochlear nucleus to olivocochlear neurons
in the cat. J. Comp. Neurol. 420, 137–148.
Young, E.D., Davis, K.A., 2002. Circuitry and function of the dorsal
cochlear nucleus. In: Oertel, D., Fay, R.R., Popper, A.N. (Eds.),
Integrative Functions in the Mammalian Auditory Pathway.
Springer-Verlag, New York, pp. 160–206.