Additive Manufacturing Technologies in Restoration - Cubic ...
Upload
khangminh22Category
view
5download
0
econstorMake Your Publications Visible.
A Service of
zbwLeibniz-InformationszentrumWirtschaftLeibniz Information Centrefor Economics
Heinen, J. Jakob; Hoberg, Kai
Article — Published Version
Assessing the potential of additive manufacturing forthe provision of spare parts
Journal of Operations Management
Provided in Cooperation with:John Wiley & Sons
Suggested Citation: Heinen, J. Jakob; Hoberg, Kai (2019) : Assessing the potential of additivemanufacturing for the provision of spare parts, Journal of Operations Management, ISSN1873-1317, Wiley Periodicals, Inc., Boston, USA, Vol. 65, Iss. 8, pp. 810-826,http://dx.doi.org/10.1002/joom.1054
This Version is available at:http://hdl.handle.net/10419/230133
Standard-Nutzungsbedingungen:
Die Dokumente auf EconStor dürfen zu eigenen wissenschaftlichenZwecken und zum Privatgebrauch gespeichert und kopiert werden.
Sie dürfen die Dokumente nicht für öffentliche oder kommerzielleZwecke vervielfältigen, öffentlich ausstellen, öffentlich zugänglichmachen, vertreiben oder anderweitig nutzen.
Sofern die Verfasser die Dokumente unter Open-Content-Lizenzen(insbesondere CC-Lizenzen) zur Verfügung gestellt haben sollten,gelten abweichend von diesen Nutzungsbedingungen die in der dortgenannten Lizenz gewährten Nutzungsrechte.
Terms of use:
Documents in EconStor may be saved and copied for yourpersonal and scholarly purposes.
You are not to copy documents for public or commercialpurposes, to exhibit the documents publicly, to make thempublicly available on the internet, or to distribute or otherwiseuse the documents in public.
If the documents have been made available under an OpenContent Licence (especially Creative Commons Licences), youmay exercise further usage rights as specified in the indicatedlicence.
http://creativecommons.org/licenses/by/4.0/
www.econstor.eu
T E CHN I C A L NO T E
Assessing the potential of additive manufacturing for theprovision of spare parts
J. Jakob Heinen | Kai Hoberg
Kühne Logistics University, Hamburg,Germany
CorrespondenceKai Hoberg, Kühne Logistics University,Großer Grasbrook 17, 20457 Hamburg,Germany.Email: [email protected].
Funding informationOpen access funding enabled and organizedby Projekt DEAL.
Handling Editors: Jan Holmström,Matthias Holweg, Benn Lawson, Frits Pil,and Stephan Wagner
AbstractSpare parts are a particularly interesting application for switching production
from traditional manufacturing (TM) to additive manufacturing (AM). Research
assessing AM has primarily addressed cost models centering on the production
process or the operations management of separate spare parts. By combining case
study, modeling, and design science elements, we adopt a holistic perspective and
develop a design to examine the systematic leverage of AM in spare parts opera-
tions. Contextually grounded in problems faced by a leading material handling
equipment manufacturer that is challenged by common characteristics of after-sales
operations, we engage with practice to propose a portfolio level analysis examining
the switchover share from TM to AM. Using a data set of 53,457 spare parts over
9 years, we find that up to 8% of stock keeping units (SKUs) and 2% of total units
supplied could be produced using AM, even if unit production costs are four times
those of TM. This result is driven by low demand, high fixed costs, and minimum
order quantities in TM. Finally, we present the evaluation by the case company's
management and highlight five areas of opportunity and challenge.
KEYWORD S
3D printing, additive manufacturing, portfolio level analysis, spare parts management, switchover
share
1 | INTRODUCTION
Production and management of spare parts are among the mostpromising applications of additive manufacturing (AM, com-monly called three-dimensional printing [3DP] in an industrialsetting), and these AM applications are progressively beingadopted across different industrial domains (Müller &Karevska, 2016). Daimler, Volvo Construction Equipment,and Deutsche Bahn are a few prominent examples of compa-nies that have already produced their first spare parts using AMtechnology (Daimler, 2017; Deutsche Bahn, 2018; Volvo,2018). With the technological advancement of AM, research
has identified the potential that this technology holds for newsupply chain solutions around spare parts operations (Walter,Holmström, & Yrjölä, 2004). Reducing costly inventories bysystematically shifting spare parts to flexible AM production isviewed as a key advantage in the application of AM for spareparts (D'Aveni, 2018; Holmström & Gutowski, 2017; Khajavi,Holmström, & Partanen, 2018).
In reality, firms frequently manage large portfolios ofspare parts that often consist of tens of thousands of individ-ual stock keeping units (SKUs) (Guvenir & Erel, 1998; vanWingerden, Basten, Dekker, & Rustenburg, 2014). Thisportfolio complexity makes the detailed analysis of each part
Received: 15 May 2017 Revised: 23 July 2019 Accepted: 29 July 2019
DOI: 10.1002/joom.1054
This is an open access article under the terms of the Creative Commons Attribution License, which permits use, distribution and reproduction in any medium, provided the originalwork is properly cited.© 2019 The Authors. Journal of Operations Management published by Wiley Periodicals, Inc. on behalf of The Association for Supply Chain Management (APICS).
810 J Oper Manag. 2019;65:810–826.wileyonlinelibrary.com/journal/joom
infeasible for obtaining systematic insights into the overallAM potential. Given the growing strategic importance ofspare parts and after-sales operations in many firms (Cohen,Agrawal, & Agrawal, 2006; Cohen & Lee, 1990; Dennis &Kambil, 2003; Kastalli & Van Looy, 2013), practitionersoften would like to attain an initial understanding of howmany spare parts candidates could be potentially shifted toAM in their specific settings. In fact, a possible lever couldbe generated from a comparatively small share of slow-moving spare parts that are crucial to a firm's after-salesstrategy but that tie up significant financial and operationalresources. Reducing the risk for excessive inventory levelsand obsolescence resulting from, for instance, a lack ofdemand or changes in part design and specifications canoffer great potential for reducing inventory costs withoutchanging existing after-sales strategies (Holmström &Gutowski, 2017). Here, it would be important to learn howmany total units supplied would switchover from traditionalmanufacturing (TM) to AM. Such insights would help man-agers prioritize their AM efforts, understand future require-ments for AM capabilities building, and plan their overalloperations strategy for introducing AM (Roca, Vaishnav,Mendonca, & Morgan, 2017).
The motivation for our research came from a leadingmaterial handling equipment manufacturer that informed usof the challenges it faced when selecting potential spareparts for AM. Although the company was aware of the manyopportunities that AM promises for spare parts operations,the company found it difficult to identify and quantify theoverall potential of AM. Redesign benefits such as weightreduction and customization do not play a role in the spareparts portfolio of the company. Hence, the company was lessinterested in individual part identification and more inter-ested in a systematic perspective of AM along the spare partssupply chain. Leveraging elements of design scienceresearch, we address the challenge of the case company byexploring and evaluating an initial solution (Holmström,Ketokivi, & Hameri, 2009; van Aken, Chandrasekaran, &Halman, 2016). The overarching objective is to evaluatehow the company can benefit from a one-for-one replenish-ment solution for spare parts by a switchover from TM toAM. Furthermore, we leverage design science to interactwith practice and gain knowledge on the operational factorsassociated with the proposed switchover from TM to AM.
Other assessments currently presented in the literaturefocus on the feasibility of using AM for certain part groupsbased on various characteristics such as size, material, esti-mated processing time, performance improvements, and eco-nomic aspects (Conner et al., 2014; Klahn, Bastian, &Meboldt, 2015; Lindemann, Reiher, Jahnke, & Koch, 2015;Westerweel, Basten, & van Houtum, 2018). However, thechallenges of supporting strategic decisions based on a large
number of parts are generally ignored. By contrast, weexamine the share of SKUs and parts that would be econom-ical to switchover from TM to AM, as AM cost premiumchanges. Conceptually, the switchover share of the portfoliois closely related to the switchover quantity for individualparts proposed by Khajavi, Deng, Holmström, Puukko, andPartanen (2018). Whereas the switchover quantity specifiesthe demand level when a part is economical to switchover,the switchover share specifies the share of SKUs that areeconomical to shift to AM as production- and inventory-related costs change. Grounded in established concepts andmodels of inventory management, we aim to assess theleverage that AM exerts on manufacturing an entire spareparts portfolio. Using a large empirical data set, we find thathigh real-world order quantities that go along with very low-demand rates result in high inventory levels forTM. Switching manufacturing to AM enables a significantsupply chain cost reduction for these parts. For the casecompany, we also find evidence for cost-efficiency leverage.While 8% of SKUs would be produced using AM, only 2%of total units supplied would be manufactured using AMtechnology, if AM unit production costs had a 300% costpremium (i.e., four times the cost) compared to that forTM. However, this switchover can reduce overall systemcosts by 6.4%.
The remainder of this article is structured as follows. InSection 2, we provide the research context, including anintroduction of the case company and an outline of ourresearch process. In Section 3, we use empirical data to ana-lyze the potential leverage of AM in the spare parts supplychain of the case company. In Section 4, we evaluate ourresults, and in Section 5, we discuss our contribution.
2 | RESEARCH CONTEXT
The research was carried out in close cooperation with aleading material handling equipment manufacturer interestedin assessing the AM potential for after-sales operations. Byengaging with practice, we identify challenges and require-ments of the case company's spare parts operations andexplore a possible solution for the adoption of AM. In addi-tion to focus group discussions and expert interviews, wecollect data and documents provided by the case company toobtain a complete picture of the after-sales business. Table 1provides an overview of the field problem highlighting somestatements from our discussion.
After-sales services offer the company significant valuecreation potential. Compared to its peers, the company'sclearly stated objective is to achieve leading customer ser-vice in the after-sales business. Distributing more than330,000 spare parts per month, it achieves a delivery readi-ness of greater than 95% and delivery punctuality of 99.9%
HEINEN AND HOBERG 811
and utilizes after-sales service as a lever for competitive dif-ferentiation. In fact, in many industries, the importance ofafter-sales markets has increased with a rising installed basethat has become much larger than markets for new equip-ment (Cohen et al., 2006). Cross-industry estimates indicatethat 30% or more of total revenues are accounted for inafter-sales services (Bundschuh & Dezvane, 2003). Similarto the case company, an increasing number of companiesrecognize the strategic importance and value that after-salesservices offer (Wagner, Jönke, & Eisingerich, 2012).
However, this service objective results in an after-salesstrategy with high costs. Due to its growing installed baseacross the globe, more diversified product portfolios, cus-tomer requirements for short downtimes, and increasing sup-ply chain complexity, the case company is faced withtremendous challenges in equipping its after-sales serviceswith the required spare parts. The original equipment manu-facturer's (OEM) current strategy to counter these difficultiesis to operate a centralized spare parts system storing morethan 60,000 SKUs supplying four regional warehouses with
TABLE 1 Field problem
Problem Statement Stakeholder
After-sales strategy with high costs “In general, we stock parts to offer service 10–15 years after seriesproduction.”
Category manager
“The premium standard is extremely high due to the continuous,direct sales. […] we prefer to have a part too much in stockinstead of somehow losing availability.”
Vice president
“Depending on the region, we achieve an annual inventoryturnover rate of less than 1 to 2.”
Director supply chain
High minimum order quantities “Parts that do not move at all need to be scrapped once per year.” Category manager
“Sometimes, it is the mold cavity. In one run, the supplier makes10 parts. There is no way that he can cut out only one part.”
Category manager
“And then, there is also the fact that we require special materials(with a minimum order quantity from the supplier). Now, thesupplier lets the machine run for 10 min, and then, you have totake 100. Once the material is heated, it cannot be usedanyway.”
Category manager
“When we have a fast-turning part, we try to fill at least one cagepallet in the warehouse.”
Category manager
Limited experience with on-demandproduction
“In house, we have a so-called 'short-path assembly' for certainhoses and chains. Those parts are produced just in time.”
Director supply chain
“Only for volume requirements higher than 10 do we transfer suchparts as a stock item in the warehouse.”
Director supply chain
“We made make or buy decisions years ago, and at that time, weclearly opted to buy.”
Category manager
Limited expertise with AM “Our highest potential for 3D printing lies in inventory andlogistics. We do not aim for better performing or customizedparts.”
Category manager
“We have conducted a test for 11 selected plastic spare parts forwhich the required tooling was missing.”
Category manager
“The materials we received in the quote differed from the currentmaterial. PA12 was the given alternative in nearly all cases.”
Category manager
“Serial production is difficult because 3D printing is expensive andvery slow. However, this is state of the art today and is changingrapidly.”
Vice president
“It costs 59 cents per part today if I order 50 pieces. For 3Dprinting, I would otherwise have to pay 100 euros for a singlepart. Even if I throw away 49 pieces, it is cheaper to opt for thecurrent option.”
Category manager
812 HEINEN AND HOBERG
a considerably smaller selection of SKUs, and more than5,000 service technicians in the field. Relying mostly onspare parts sourced from external suppliers, in-house produc-tion is limited to less than 5% of the total portfolio. Again,this situation is common across OEMs and is supported byWagner and Lindemann (2008), who find that the majorityof spare parts—more than 60% on average—are sourcedfrom external suppliers and that 40% are sourced in-housefrom the firm's own production line.
By sourcing from suppliers that utilize TM and requiringspecific materials that offer scale advantages for larger pur-chases, the company is exposed to high minimum orderquantities for its parts. As a consequence, orders arrive inbatches and increase inventory levels well above demandrequirements. This results in spare parts stocks that coverdemand over a long horizon. Ultimately, a considerableshare of spare parts remains as residua that virtually do notmove at all and, in the most unfavorable case, are scrappedat some stage.
Besides minimum order quantities, the high dependencyon external suppliers goes along with limited experiencewith on-demand production. For only a very small numberof customized spare parts (i.e., hoses and chains), the casecompany has incorporated on-demand production as a so-called “short-path assembly.” Since the variety of these cus-tomized parts is great and internal production is feasible, in-house production is utilized to avoid costly batch productionand increased inventory requirements. It is this advantageabove all that could offer potential to introduce AM alongthe company's after-sales operations.
Despite the opportunity, the company currently has lim-ited experience with AM. Existing trials with AM serviceproviders have revealed that cost comparisons that focuspurely on production costs result in cost disadvantages forAM. In addition, managers of the case company highlightedtechnological challenges like slower production speeds andlimited material availability.
By comparison, the challenges identified along the spareparts operations of the case company are common to OEMs insectors where products are expensive and used for a long time.High-capital equipment such as aging aircraft are often ser-viced long after production of the aircraft has stopped(Li, Dekker, Heij, & Hekimo, 2016). Asset-intensive engineer-ing industries require the control of a wide and highly variablespare parts assortment (Suomala, Sievak, & Paranko, 2002;Wagner & Lindemann, 2008). Customer-oriented industrieslike auto manufacturers are faced with reduced product lifecycles and the highest service standards (Cohen & Lee, 1990;Dennis &Kambil, 2003).
Building on the insights gained by expert interviews andoperations data, we develop a solution proposal for the intro-duction of AM, and for the analysis of switchover in the case
company. Switchover analysis, proposed by Khajavi,Partanen, Holmström, and Tuomi (2015) for product intro-duction, is here adapted for guiding managers in assessingthe potential for AM in their spare parts portfolio as AMtechnology improves. To ensure constant practitioner input,we involve experts from the case company throughout theresearch process. In addition to framing and scoping theproblem, we draw on their expertise to evaluate the designof our proposed solution and provide practical insights onthe consequences of introducing one-for-one replenishmentin spare parts operations.
In designing the solution, we combine elements of designscience, modeling, and case study research to identify a solu-tion for a situation in which an implementation seems verylikely only in the foreseeable future. As a result, we draw ondesign science, which explicitly focuses on improving prac-tices and discovering designs to create solutions that do notyet exist (Holmström et al., 2009). In fact, providing anintervention with a new technology in a practical context isnoted as a key criterion for using design science in the oper-ations management domain (van Aken et al., 2016). Follow-ing a problem-centered approach (Peffers, Tuunanen,Rothenberger, & Chatterjee, 2007), we ground our proposeddesign in the context of the case company to develop knowl-edge that facilitates valid and reliable solutions within thefield problem (van Aken, 2004). To this end, we not onlyutilize quantitative operations data but also interact withpractitioners to gain an understanding of resulting opera-tional factors (Browning & de Treville, 2018).
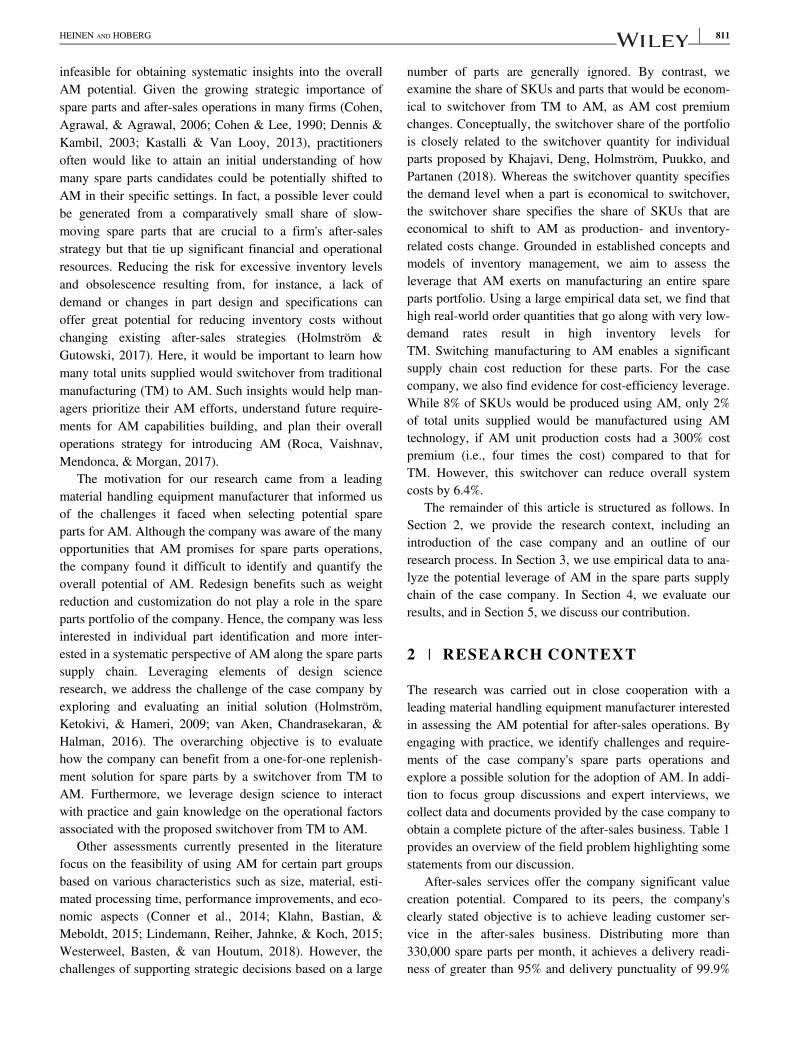
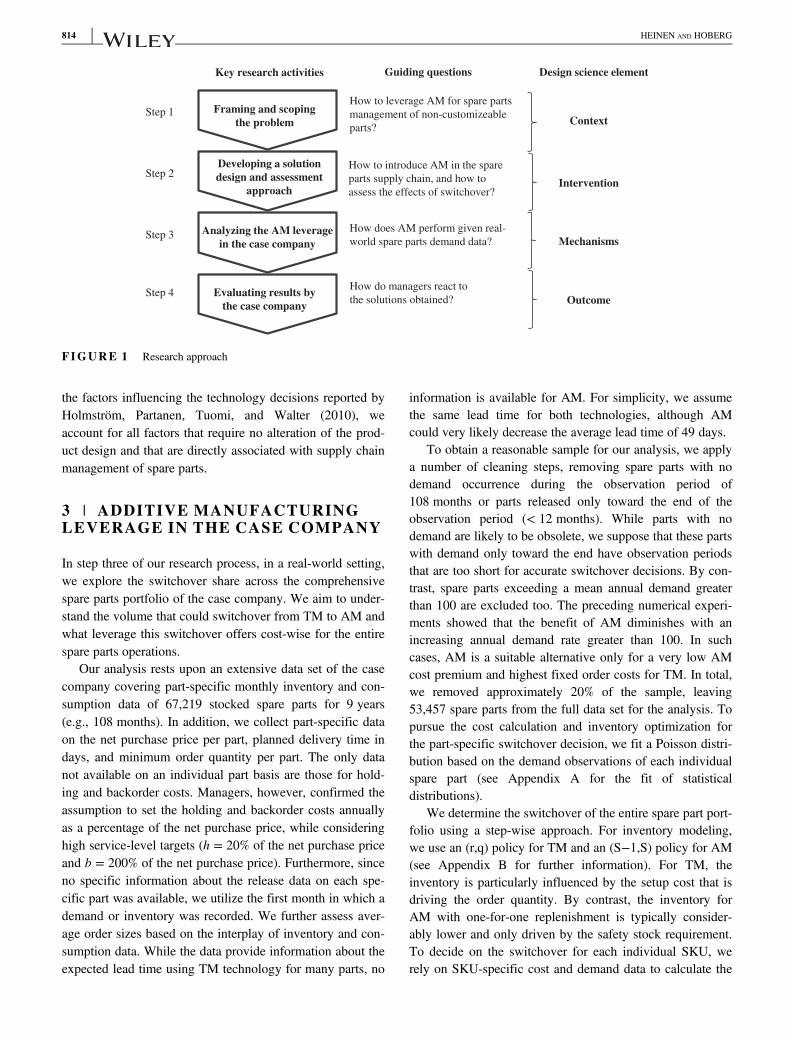
As shown in Figure 1, we follow the context-interven-tion-mechanism-outcome (CIMO) logic (Denyer, Tran-field, & van Aken, 2008; Kaipia, Holmström, Småros, &Rajala, 2017). After framing the problem in the context ofthe case company and designing the intervention—consisting of a proposition for one-for-one replenishmentand the assessment of switchover share in the portfolio—weinvestigate the mechanisms of one-for-one replenishmentutilizing spare parts data from the case company. Finally, weevaluate the outcome from an operational perspective andreview the proposed intervention with company experts.Although design science remains a relatively novel researchstrategy across the operations management community, ithas become increasingly popular to “address field problemsand exploit promising opportunities” (van Aken et al.,2016). Operationalized on a tactical level by commonmethods for data gathering and analysis (van Aken et al.,2016), we utilize established concepts of operations manage-ment to explore a switchover from TM to AM on a portfoliolevel of spare parts operations.
Forming the basis of the analysis, we leverage readilyaccessible supply chain operations information includingdemand, inventory, and supply chain cost data. Reviewing
HEINEN AND HOBERG 813
the factors influencing the technology decisions reported byHolmström, Partanen, Tuomi, and Walter (2010), weaccount for all factors that require no alteration of the prod-uct design and that are directly associated with supply chainmanagement of spare parts.
3 | ADDITIVE MANUFACTURINGLEVERAGE IN THE CASE COMPANY
In step three of our research process, in a real-world setting,we explore the switchover share across the comprehensivespare parts portfolio of the case company. We aim to under-stand the volume that could switchover from TM to AM andwhat leverage this switchover offers cost-wise for the entirespare parts operations.
Our analysis rests upon an extensive data set of the casecompany covering part-specific monthly inventory and con-sumption data of 67,219 stocked spare parts for 9 years(e.g., 108 months). In addition, we collect part-specific dataon the net purchase price per part, planned delivery time indays, and minimum order quantity per part. The only datanot available on an individual part basis are those for hold-ing and backorder costs. Managers, however, confirmed theassumption to set the holding and backorder costs annuallyas a percentage of the net purchase price, while consideringhigh service-level targets (h = 20% of the net purchase priceand b = 200% of the net purchase price). Furthermore, sinceno specific information about the release data on each spe-cific part was available, we utilize the first month in which ademand or inventory was recorded. We further assess aver-age order sizes based on the interplay of inventory and con-sumption data. While the data provide information about theexpected lead time using TM technology for many parts, no
information is available for AM. For simplicity, we assumethe same lead time for both technologies, although AMcould very likely decrease the average lead time of 49 days.
To obtain a reasonable sample for our analysis, we applya number of cleaning steps, removing spare parts with nodemand occurrence during the observation period of108 months or parts released only toward the end of theobservation period (< 12 months). While parts with nodemand are likely to be obsolete, we suppose that these partswith demand only toward the end have observation periodsthat are too short for accurate switchover decisions. By con-trast, spare parts exceeding a mean annual demand greaterthan 100 are excluded too. The preceding numerical experi-ments showed that the benefit of AM diminishes with anincreasing annual demand rate greater than 100. In suchcases, AM is a suitable alternative only for a very low AMcost premium and highest fixed order costs for TM. In total,we removed approximately 20% of the sample, leaving53,457 spare parts from the full data set for the analysis. Topursue the cost calculation and inventory optimization forthe part-specific switchover decision, we fit a Poisson distri-bution based on the demand observations of each individualspare part (see Appendix A for the fit of statisticaldistributions).
We determine the switchover of the entire spare part port-folio using a step-wise approach. For inventory modeling,we use an (r,q) policy for TM and an (S−1,S) policy for AM(see Appendix B for further information). For TM, theinventory is particularly influenced by the setup cost that isdriving the order quantity. By contrast, the inventory forAM with one-for-one replenishment is typically consider-ably lower and only driven by the safety stock requirement.To decide on the switchover for each individual SKU, werely on SKU-specific cost and demand data to calculate the
Step 1 Framing and scopingthe problem
Developing a solution design and assessment
approach
Step 2
Step 3
Evaluating results bythe case company
Step 4
Key research activities Guiding questions
How to leverage AM for spare parts
management of non-customizeable
parts?
How does AM perform given real-
world spare parts demand data?
How to introduce AM in the spare
parts supply chain, and how to
assess the effects of switchover?
Design science element
Context
Intervention
Mechanisms
OutcomeHow do managers react to
the solutions obtained?
Analyzing the AM leveragein the case company
FIGURE 1 Research approach
814 HEINEN AND HOBERG
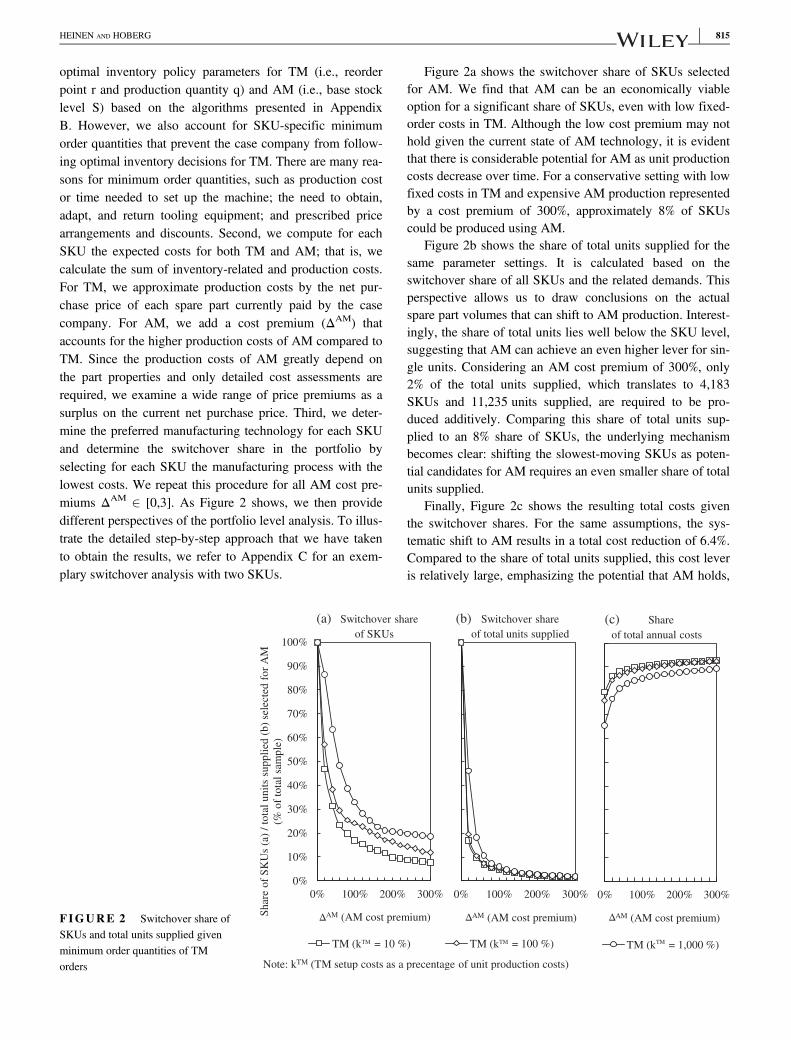
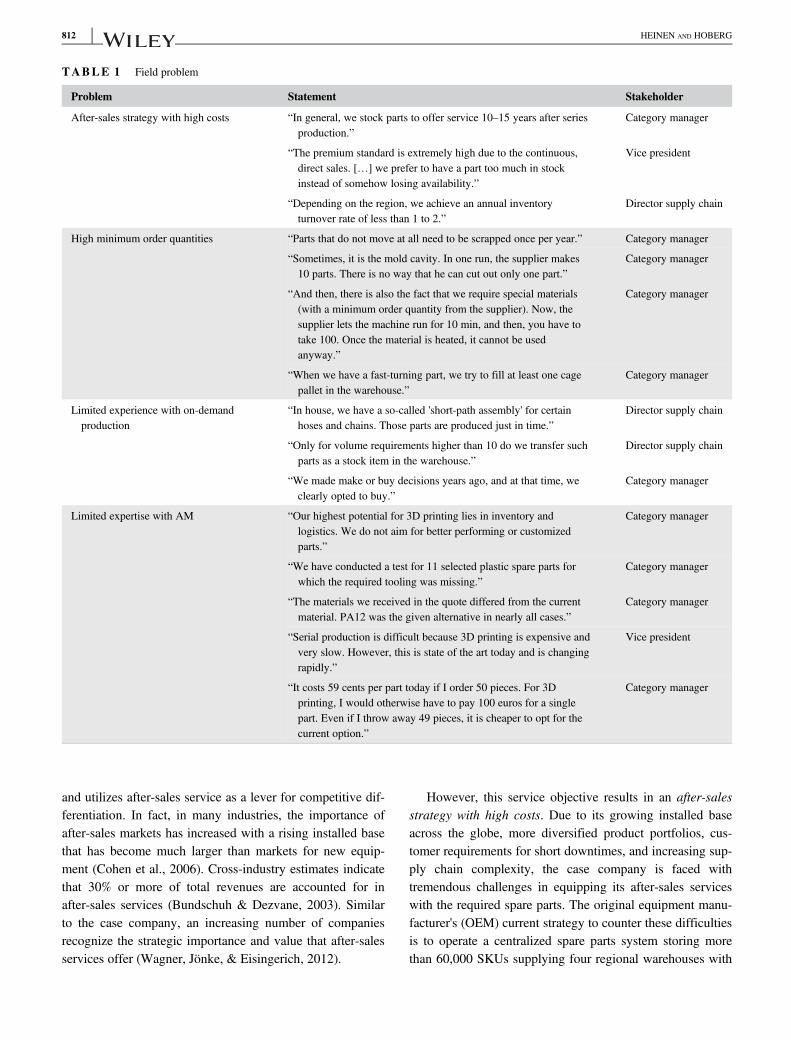
optimal inventory policy parameters for TM (i.e., reorderpoint r and production quantity q) and AM (i.e., base stocklevel S) based on the algorithms presented in AppendixB. However, we also account for SKU-specific minimumorder quantities that prevent the case company from follow-ing optimal inventory decisions for TM. There are many rea-sons for minimum order quantities, such as production costor time needed to set up the machine; the need to obtain,adapt, and return tooling equipment; and prescribed pricearrangements and discounts. Second, we compute for eachSKU the expected costs for both TM and AM; that is, wecalculate the sum of inventory-related and production costs.For TM, we approximate production costs by the net pur-chase price of each spare part currently paid by the casecompany. For AM, we add a cost premium (ΔAM) thataccounts for the higher production costs of AM compared toTM. Since the production costs of AM greatly depend onthe part properties and only detailed cost assessments arerequired, we examine a wide range of price premiums as asurplus on the current net purchase price. Third, we deter-mine the preferred manufacturing technology for each SKUand determine the switchover share in the portfolio byselecting for each SKU the manufacturing process with thelowest costs. We repeat this procedure for all AM cost pre-miums ΔAM 2 [0,3]. As Figure 2 shows, we then providedifferent perspectives of the portfolio level analysis. To illus-trate the detailed step-by-step approach that we have takento obtain the results, we refer to Appendix C for an exem-plary switchover analysis with two SKUs.
Figure 2a shows the switchover share of SKUs selectedfor AM. We find that AM can be an economically viableoption for a significant share of SKUs, even with low fixed-order costs in TM. Although the low cost premium may nothold given the current state of AM technology, it is evidentthat there is considerable potential for AM as unit productioncosts decrease over time. For a conservative setting with lowfixed costs in TM and expensive AM production representedby a cost premium of 300%, approximately 8% of SKUscould be produced using AM.
Figure 2b shows the share of total units supplied for thesame parameter settings. It is calculated based on theswitchover share of all SKUs and the related demands. Thisperspective allows us to draw conclusions on the actualspare part volumes that can shift to AM production. Interest-ingly, the share of total units lies well below the SKU level,suggesting that AM can achieve an even higher lever for sin-gle units. Considering an AM cost premium of 300%, only2% of the total units supplied, which translates to 4,183SKUs and 11,235 units supplied, are required to be pro-duced additively. Comparing this share of total units sup-plied to an 8% share of SKUs, the underlying mechanismbecomes clear: shifting the slowest-moving SKUs as poten-tial candidates for AM requires an even smaller share of totalunits supplied.
Finally, Figure 2c shows the resulting total costs giventhe switchover shares. For the same assumptions, the sys-tematic shift to AM results in a total cost reduction of 6.4%.Compared to the share of total units supplied, this cost leveris relatively large, emphasizing the potential that AM holds,
0%
10%
20%
30%
40%
50%
60%
70%
80%
90%
100%
0% 100% 200% 300%
Shar
e o
f S
KU
s (a
) /
tota
l u
nit
s su
pp
lied
(b
) se
lect
ed f
or
AM
(% o
f to
tal
sam
ple
)
AM (AM cost premium)
TM (k = 10 %) TM (k = 100 %)
0% 100% 200% 300%
AM (AM cost premium)
TM (k = 1,000 %)
(a) Switchover share
of SKUs
(b) Switchover share
of total units supplied
Note: kTM (TM setup costs as a precentage of unit production costs)
0% 100% 200% 300%
AM (AM cost premium)
(c) Share
of total annual costs
Δ Δ Δ
TM TM TM
FIGURE 2 Switchover share ofSKUs and total units supplied givenminimum order quantities of TMorders
HEINEN AND HOBERG 815
even if only a small share of supplied units switches. Theleverage is particularly interesting because, from a produc-tion process point of view, AM is characterized by a highdegree of flexibility. The technology allows, on the onehand, for a straightforward shift between SKUs without timeconsuming and costly production changeovers between mul-tiple builds and, on the other hand, for parallel production ofindividual parts in a single build (Baumers, Dickens, Tuck, &Hague, 2016; Khajavi, Holmström, & Partanen, 2018). Forfull utilization of the technology, a parallel build of individ-ual products reduces the problem of excess capacity for dis-tinct builds (Baumers, Beltrametti, Gasparre, & Hague,2017). Finally, comparing less conservative estimates offixed costs as well as less expensive AM production, theshare of total units shifted to AM and the respective costlever increase substantially.
4 | EVALUATION
In the concluding step of our research process, we evaluateour proposed solution design. First, we present limitationsand simplifications of our design and highlight how thesefactors bias the switchover from TM to AM. Second, weevaluate operational factors based on direct discussions withrepresentatives of the case company.
While our approach assumes the production of unit sizesof one in a single production run, AM unfolds its greatestpotential if the utilization of the machine is maximized by theparallel printing of different parts in a single build (Baumers,Tuck, Wildman, Ashcroft, & Hague, 2011; Holweg, 2015).The cost advantage of AM increases if multiple parts arepacked in one build (Khajavi, Holmström, & Partanen, 2018)and build packing should be considered in ΔAM.
Furthermore, the design initiates with the assumption thata digital model of the spare part exists or can be easilyobtained. However, in practice, the design file may beunavailable (since it is the intellectual property of the sup-plier), nonexistent (as is often the case for obsolete spareparts), or insufficient (like in the case of 2D drawings)(Chekurov, Metsä-Kortelainen, Salmi, Roda, & Jussila,2018). In addition, new products require various productdevelopment activities, for example, master data, performancetesting, and validation (Krishnan & Ulrich, 2001). This is par-ticularly the case for a shift to AM during the product lifecycle. Neglecting product design underestimates the costs ofAM and, consequently, biases the switchover to AM.
Closely related, we consider constant part performance andexclude potential AM performance benefits enabled by a changein the part design. One prominent lever for AM to offset higherproduction costs relative to TM consists of design optimizationsfor function, as well as additional functions (Holmström et al.,2010) or lightweight constructions (Wagner & Walton, 2016).
Neglecting potential performance benefits from changing partdesigns biases the switchover to TM.
When summarizing the effects of simplifications on thetechnology decision, it becomes evident that biases influencethe production switchover in both directions. We leave theseaspects explicitly open for future research to examine the rel-evance and magnitude of each impact. As an example,Knofius, van der Heijden, and Zijm (2018) only recentlypresent a detailed operational assessment of spare parts froman OEM indicating that higher cost savings for AM arealready available. In use cases where lead time reductions,lower inventory-related costs, and tooling redundancy canbe achieved, investments in AM should be encouragedsooner rather than later.
Since the case company has so far struggled to identifypotential levers to introduce AM within its spare parts opera-tions, we jointly developed a solution to switchover slow-moving spare parts from TM to AM. We additionallywanted to understand the pragmatic validity of our results byfocusing on the effectiveness and analyzing the causes of thesolution design (van Aken et al., 2016). In terms of the pro-posed design, we are interested in the evaluation of theswitchover by the intended users (Hevner, March, Park, &Ram, 2004). Therefore, we presented our results to managersand experts (at all hierarchical levels) from the case com-pany. In particular, we discussed the proposed solutiondesign, as well as the findings and their implications for theorganization. The case company generally agreed with theoperations strategy opportunities around one-for-one replen-ishment with AM (see Table 2). However, certain potential
TABLE 2 Operations strategy opportunities and challenges
Opportunities Challenges
One-for-one replenishment Digitalization of physical designs
• Avoidance of minimum orderquantities
• Limited availability of digitalfiles for existing spare parts
• Portfolio level switchover ofpart candidates from TM toAM
• Missing strategy to digitizeparts inventory
After-sales strategy Organizational setup
• Potential to reconsider givenservice requirements
• Expertise in new equipmentdepartment is needed fortechnical release of digital spareparts
• Support toward an emergingtrend of distributed storagewith reduced inventories anddirect replenishment
Warehouse operations
• Increases in goods receiptefforts and related transactioncosts
• Storage bins are for large batchsizes
816 HEINEN AND HOBERG
implementation challenges around the digitalization ofdesigns, the organizational setup around technical drawings,and warehouse operations were highlighted.
In general, the one-for-one replenishment solution waswell received by the case company, as AM seems to offer aviable alternative to current TM, especially with further tech-nological advances. In particular, managers were eager toavoid minimum order quantities that relate to multiple yearsof demand. The VP After Sales highlighted that “[…] thesum makes a difference, of course! If I will be able to saveon a five-digit number of different spare parts in the futureby such a solution, this is surely an interesting option.”
In addition, the proposed design facilitated a discussionof the overall after-sales strategy. The assumption of alwaysfollowing a make-to-stock production strategy became aninteresting point of discussion: managers raised the alterna-tive that the current 48-hour-availability policy could beeased for very slow-moving parts that could alternatively beprinted on demand. Relaxing the high service level restric-tion would accordingly even increase the impact of the AMsolution design. Similarly, further discussion developedaround the current spare parts distribution strategy. Althoughthe current network is highly centralized, the companyrecently introduced warehouses in Europe and Asia. Thecentral warehouse continues to hold the largest volume tocover demand for the next 6 months, while regional ware-houses cover only the inventories for immediate demand. Amanager emphasized: “If you produce and store [parts] inthe regional warehouse, you do not have to store them cen-trally. Or you store them only in the central warehouse andperhaps even manufacture [regionally] directly; then, wedon't need it in the regional warehouse.”
Apart from strategic opportunities to leverage AM for thecase company's after-sales operations, discussions also pointto operational challenges and organizational complexity. Asstated above, a critical point identified as a challenge inimplementing AM is the digitalization of physical designs.At this point, the company lacks essential requirements tointroduce AM: a large share of spare parts is not digitalized.“We don't have so many 3D drawings. Of course, that'sincreasing now. But the older ones, where now the tools arebroken, there are no 3D drawings.” So far, the company hasnot decided on a clear way forward to digitize its spare partsportfolio as a whole. However, the analysis triggered interestin this issue, and a status quo analysis is being conducted toquantify the current availability of digital files.
Additionally, in the case company's organizational setup,technical know-how is present mostly in the new-equipmentbusiness and not within the spare parts business. If technicaldrawings are missing, close collaboration with colleaguesfrom the development and engineering departments isrequired, leading to delays and potential conflicts between
the different stakeholders. As the vice president stated,“What I do not know is how we should handle the issue oftechnical release […] When changing suppliers, I often havethe problem of the technical release by the new equipmentbusiness unit.” However, the management stated that theoverall process is subject to review.
In addition to complications in digitizing spare partsinventories, there were also concerns raised with regard tothe operational efficiency of warehouse operations whenreducing order sizes to one. Goods receipt of spare parts isexclusively conducted at the central warehouse and isaligned with the stock-taking of unit-sized packages. Lower-ing order quantities will increase the number of goodsreceipts and could cause significant increases in transactioncosts. These transaction costs, for example, due to identifica-tion, approval of quantity, and condition checks, are likelyto soar, if order sizes are reduced and cannot be covered bycurrent processes.
Another challenge relates to the current warehouse stor-age bins designed to accommodate large quantities of aSKU. In the current operational setting, smaller order sizesand allowing for lower inventory levels would not free upspace in the warehouse, as one storage bin is exclusivelyoccupied by a single SKU. The inventory managerhighlighted that “The more frequently we order, the moreboxes we occupy. Because today, we don't add anything to agiven box.” The introduced design solution would, however,allow for highly reduced inventory levels that do not matchcurrent storage bins. Even if this solution cannot be recon-ciled with the current layout, it might be possible to restruc-ture bin sizes and split the given space for usage bymultiple SKUs.
With respect to the overall design, the case companyappreciated the insights gained by systematically analyzingthe shift to AM and taking advantage of a cost-efficiencylever. Furthermore, the ease of usage and data requirementswas seen as strengths. In terms of outcomes, it was empha-sized that this strategic perspective warrants further consid-eration. As the VP After Sales concluded, “Where do I getthe most of such a solution? I would focus on low-value andless critical spare parts and go for a wide selection of parts.”In fact, practitioners received an insight that was previouslymissed in selected trial runs that merely focused on processcost comparisons. By pursuing the strategic path further tointroduce AM within its spare parts operations, the companywould like to take the next step and explore the technicalselection of parts. It is interested in understanding therequirements for identifying suitable spare parts candidates(e.g., based on available files, materials, process properties)and supplementing the strategic assessment with a techno-logical evaluation.
HEINEN AND HOBERG 817
5 | OUTLOOK
We presented an approach to explore on a portfolio level thepotential to switchover slow-moving spare parts from TM toAM. Rather than assessing the leverage of AM for individualspare parts, we focused on assessing a large empirical dataset. The results identified the possibility of a systematic shiftin spare parts manufacturing from conventional manufactur-ing processes to AM, with important implications for practi-tioners. First, we find on a portfolio level that spare partsoperations can benefit from AM and identify a leverage ofshifting slow-moving parts to AM. Only a small share of thespare parts can potentially benefit from lower inventories,fewer orders, and less transportation associated with AM ifthe unit production cost premium is high. For a cost premiumof 300%, the number of AM SKUs corresponds to 8% of theSKUs considered. Second, while the number of AM SKUs isrelatively small for high AM cost premiums, the proportion oftotal parts produced with AM is even smaller. For a cost pre-mium of 300%, only 2% of total units supplied would be man-ufactured using AM. One-for-one replenishment with AMparticularly favors SKUs with low demand rates, while SKUswith higher demand rates would still be manufactured usingTM. As a consequence, the total AM manufacturing capacityrequired to achieve the benefits is relatively low.
Moving from the individual SKU perspective to a total unitssupplied level, we emphasize for practitioners that inventoryreductions and cost savings can be relatively high, given thecomparatively small part selection. Such cost-efficiency leversare identified only if entire spare parts portfolios are examinedand large-scale shifts in production technologies are assessed.In contrast to previous analyses focusing on carefullypreselected single parts, our design moves beyond operationalaspects and is, to the best of our knowledge, the first strategicattempt to examine an overall switchover without altering prod-uct designs and significantly rearranging given supply chainoperations. The empirical application and evaluation demon-strate a paradigm present only from a systematic vantage point.Manufacturing shifts from TM to AM for only a small share ofSKUs (and an even smaller share of parts). However, this rela-tively small share does have a relevant impact on supply chaincosts. It is supported by AM with its ability to overcome mini-mum order quantities and offer more flexible replenishmentoptions, particularly for slow-moving spare parts. Not only theability to reduce the total inventory across the supply chain butalso the resulting cost-efficiency lever achieved by a relativelysmall share of parts to be shifted is crucial.
Similar cost-efficiency levers are not uncommon in opera-tions. In particular, mass customization (also seen as a promis-ing area of AM [Reeves, Tuck, & Hague, 2011; Tuck, Hague,Ruffo, Ransley, & Adams, 2008]) can benefit from the system-atic leverage of a specific manufacturing technology for a
relatively small share of parts or components. Comparing prod-uct characteristics of mass customized products to spare parts,certain commonalities are obvious, for example, high productvariety, unreliable demand forecasts, and challenges in inven-tory management (Anderson, 2004). To solve these challenges,manufacturers of mass-customized products often decide toadopt a modular product design with postponement (Su,Chang, & Ferguson, 2005). Standard components (e.g., axlesfor cars or zippers for apparel) that do not require customizationare common across all products and are mass-manufactured tocapture efficiency and economies of scale from traditional pro-duction processes (Duray, Ward, Milligan, & Berry, 2000;Holweg & Pil, 2004). Other components that enable differenti-ation (e.g., seats for cars or patches for apparel) are customizedto offer high product variety or to create individual solutionsusing highly flexible manufacturing processes (Feitzinger &Lee, 1996). In line with our AM setting, the system benefitsfrom a large number of SKUs produced in high quantities atlow costs and a much smaller number of SKUs customizedand manufactured at higher costs.
While we use empirical data and direct feedback to eval-uate our design, the design research remains in an earlystage. Following a problem-centered approach, we have sofar limited the exploration to a single case company. Theapproach has not been tested in other companies, whichlimits the generalization of the design across various applica-tion domains (van Aken et al., 2016). In framing the prob-lem, we do identify commonalities with other OEMs andfind in the literature common after-sales conditions andrequirements across industries, providing initial evidencethat the results may be transferable (Bundschuh & Dezvane,2003; Cohen & Lee, 1990; Hu, Boylan, Chen, & Labib,2018; Huiskonen, 2001; Kennedy, Patterson, & Fredendall,2002; Wagner et al., 2012; Wagner & Lindemann, 2008).Nevertheless, we leave it to future research to investigate theassessment of switchover share in other empirical settings.For example, we have identified the cost-efficiency leveragethat AM holds in shifting spare parts from TM toAM. While we model and test this production shift givenreal-world data, we have not implemented one-for-onereplenishment using AM. Although we are well aware of thegiven drawbacks, it is the urgency for new approaches thatinspired our research efforts. Currently, only a certain shareof SKUs might be technically feasible for AM. Nonetheless,future declines in machine prices, advances in material avail-ability, and increases in machine capabilities will very likelyinvolve a notable share of parts candidates (D'Aveni, 2018).
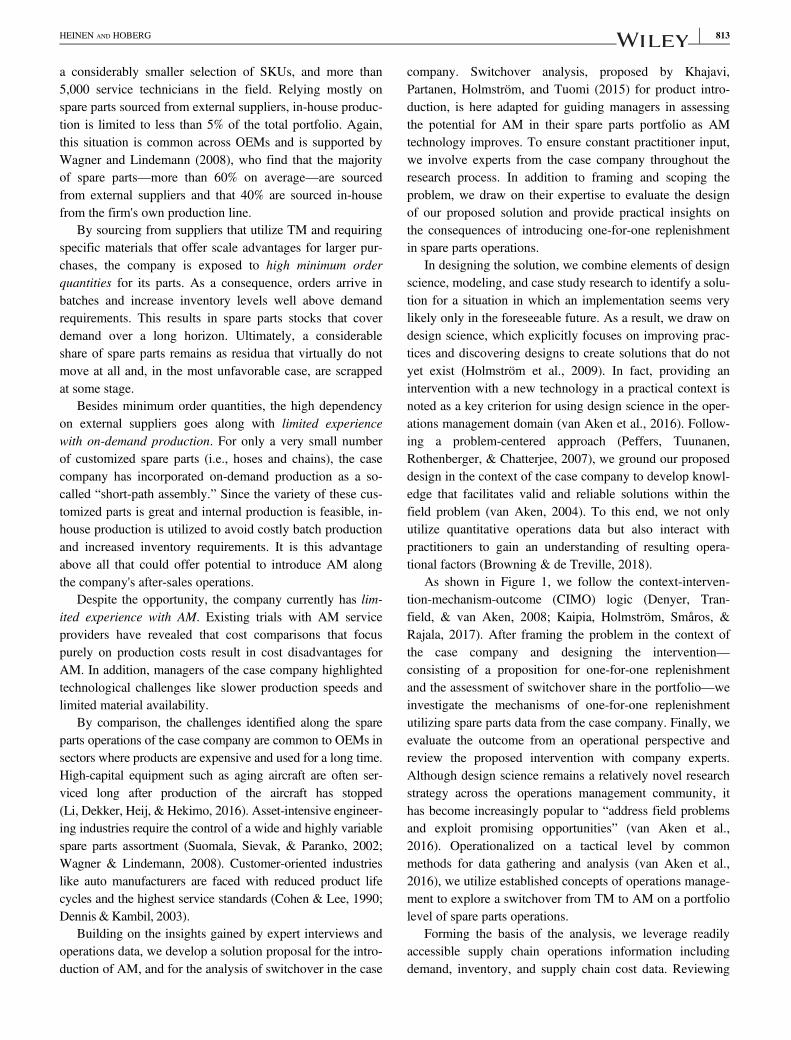
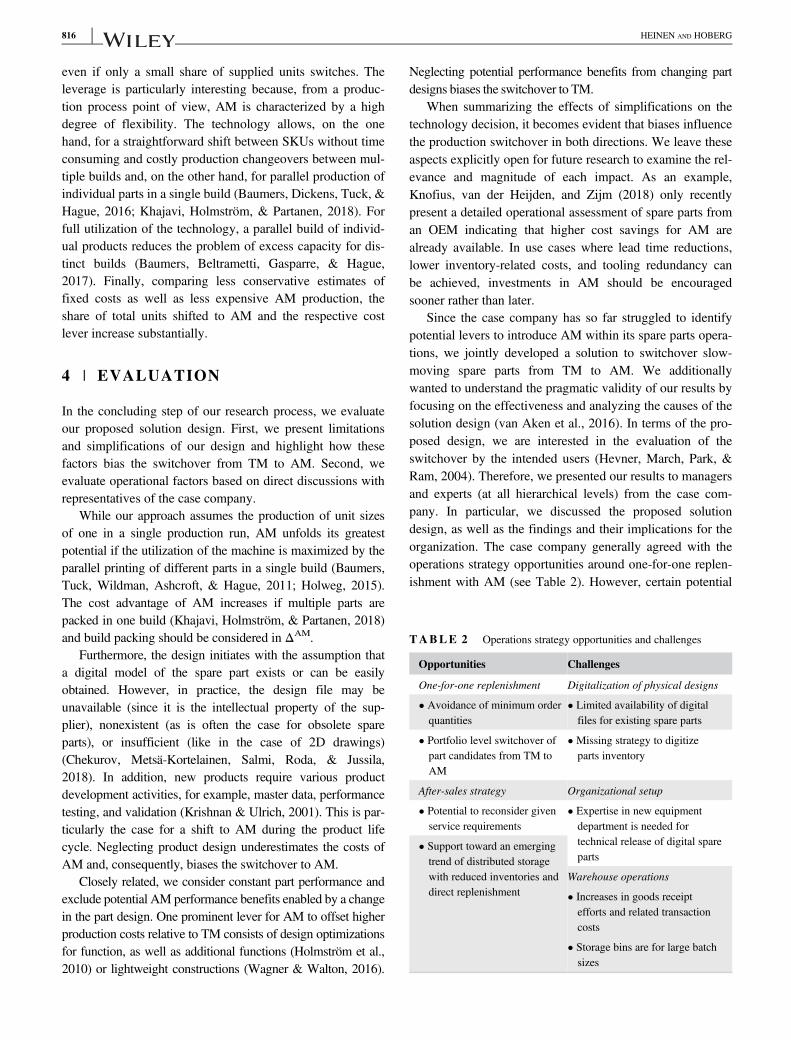
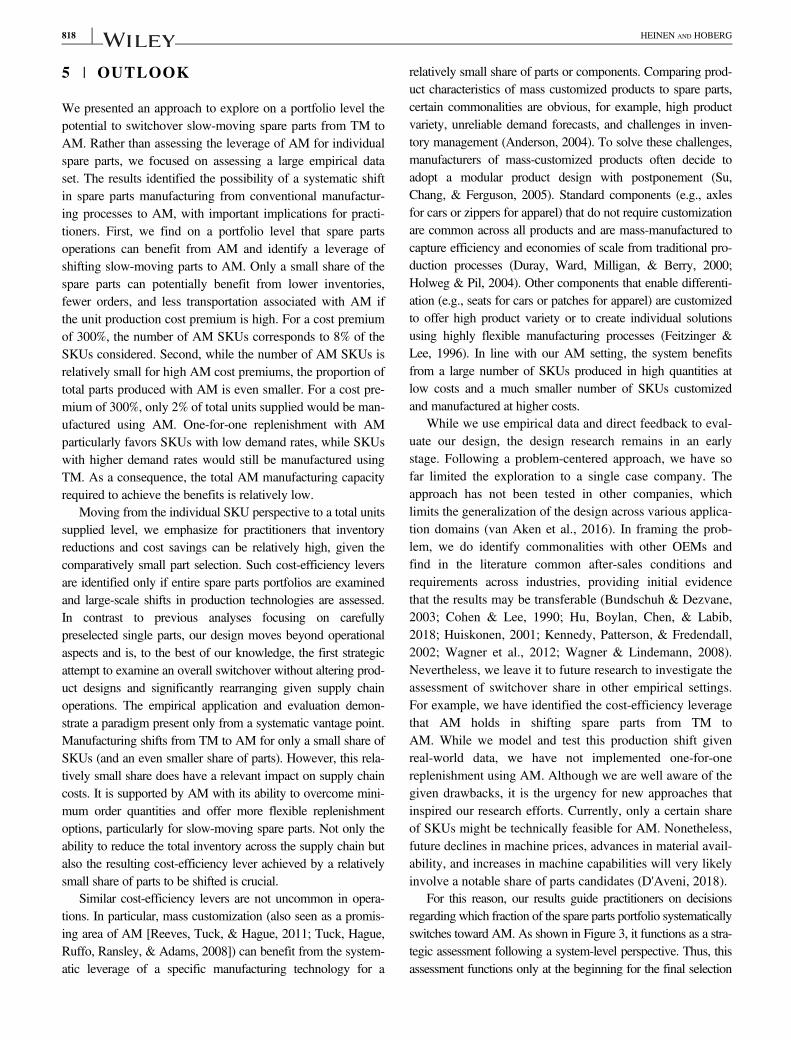
For this reason, our results guide practitioners on decisionsregarding which fraction of the spare parts portfolio systematicallyswitches toward AM. As shown in Figure 3, it functions as a stra-tegic assessment following a system-level perspective. Thus, thisassessment functions only at the beginning for the final selection
818 HEINEN AND HOBERG
of suitable part candidates. Upon this initial strategic assessment,further operational assessments that consider a wider range ofpart-specific operational and economic factors are needed. As anext step, Knofius, van der Heijden, and Zijm (2016) present asystematic ranking procedure for selecting potential parts forswitchover in a spare parts portfolio. As Jarzabkowski and Kaplan(2015) point out, such system level assessments provide usefulperspectives for facilitating strategic and operational change inpractice. Considering the unpredictability of advancements inAM, strategic assessments can then provide the basis for exploringnew possibilities and ways forward to adopt AM in spare partsoperations (Jarzabkowski & Kaplan, 2015; Whittington, 2006). Inline with these ideas, we extended our approach by a scenarioanalysis to examine the impact of the locations of warehousingand production, and find that the switchover share from TM toAM is relatively robust across centralized and decentralized sup-ply chain footprints.
In conclusion, given the continuous technological pro-gress of AM and the associated broadened areas of applica-tion, we aim to explore and understand the underlyingmechanisms of utilizing AM in spare parts operations. Tak-ing a holistic view of the entire spare parts portfolio, we pro-pose a novel area of applying AM in real-life operations.The potential for rapid implementation of one-for-onereplenishment of AM spare parts can again be illustrated by
a comparison to mass customization: within less than500 days, the entire hearing aid industry in the United Statesshifted the production of mass-customized hearing aid shellsfrom TM to AM (D'Aveni, 2015). Such short periods of timeleave no doubt that foresight and preparation for switchoveris the right approach also in after-sales operations.
ACKNOWLEDGMENTS
Open access funding enabled and organized byProjekt DEAL.
Open Access Veröffentlichung ermöglicht undorganisiert durch Projekt DEAL.
[Correction added on 15 September 2020, after first onlinepublication: Projekt Deal funding statement has been added.]
ORCID
Kai Hoberg https://orcid.org/0000-0003-2835-572X
REFERENCES
van Aken, J. E. (2004). Management research based on the paradigm ofthe design sciences: The quest for field-tested and grounded techno-logical rules. Journal of Management Studies, 41, 219–246.
Research
focus
Strategicassessment
Operational
assessment
Detailed
technological
part assessment
Detailed part
cost assessment
System level analysis for all parts Individual analysis for each specific part
Proceed
Pass
Pass
Consider general
technical aspects
and part-specific
operational and
economic factors
to systematically
select parts for
switchover from
portfolio.
As AM technology
improves, how
does a switchover
from TM to AM
affect current
constraints of after-
sales operations?
(e.g. trade-offs
between cost and
inventory levels,
obsolescence risk)
Is a current AM
technology
available to print
the specific part?
(e.g. performance,
design, durability)
Is it economically
feasible to print
the specific part
considering a
preselected AM
process?
Wait
Reject
Reject
FIGURE 3 Research classification forparts selection
HEINEN AND HOBERG 819
van Aken, J. E., Chandrasekaran, A., & Halman, J. (2016). Conductingand publishing design science research: Inaugural essay of thedesign science department of the Journal of operations manage-ment. Journal of Operations Management, 47-48, 1–8.
Anderson, D. M. (2004). Build-to-order & mass customization: Theultimate supply chain management and lean manufacturing strat-egy for low-cost on-demand production without forecasts or inven-tory. Cambria, CA: CIM Press.
Baumers, M., Beltrametti, L., Gasparre, A., & Hague, R. J. M. (2017).Informing additive manufacturing technology adoption: Total costand the impact of capacity utilisation. International Journal of Pro-duction Research, 55, 6957–6970.
Baumers, M., Dickens, P. M., Tuck, C. J., & Hague, R. J. M. (2016).The cost of additive manufacturing: Machine productivity, econo-mies of scale and technology-push. Technological Forecasting andSocial Change, 102, 193–201.
Baumers, M., Tuck, C. J., Wildman, R., Ashcroft, I., & Hague, R. J. M.(2011). Energy inputs to additive manufacturing: Does capacity uti-lization matter? Eos, 1000, 30–40.
Browning, T. R., & de Treville, S. (2018). Editorial: New develop-ments at the journal of operations management. Journal of Opera-tions Management, 64, 1–6.
Bundschuh, R. G., & Dezvane, T. M. (2003). How to make after-salesservices pay off. McKinsey Quarterly, 4, 116–127.
Chekurov, S., Metsä-Kortelainen, S., Salmi, M., Roda, I., & Jussila, A.(2018). The perceived value of additively manufactured digitalspare parts in industry: An empirical investigation. InternationalJournal of Production Economics, 205, 87–97.
Cohen, M. A., Agrawal, N., & Agrawal, V. (2006). Winning in theaftermarket. Harvard Business Review, 84, 129–138.
Cohen, M. A., & Lee, H. L. (1990). Out of touch with customer needs?Spare parts and after sales service. Sloan Management Review, 31,55–66.
Conner, B. P., Manogharan, G. P., Martof, A. N., Rodomsky, L. M.,Rodomsky, C. M., Jordan, D. C., & Limperos, J. W. (2014). Mak-ing sense of 3-D printing: Creating a map of additive manufacturingproducts and services. Additive Manufacturing, 1, 64–76.
Daimler, A. G. (2017). Premiere at Mercedes-Benz Trucks: New fromthe 3D printer: The first spare part for trucks made of metal.Retrieved from http://media.daimler.com/marsMediaSite/en/instance/ko/Premiere-at-Mercedes-Benz-Trucks-New-from-the-3D-printer-the-first-spare-part-for-trucks-made-of-metal.xhtml?oid=23666435.
D'Aveni, R. A. (2015). The 3-D printing revolution. Harvard BusinessReview, 93, 40–48.
D'Aveni, R. A. (2018). The 3-D printing playbook. Harvard BusinessReview, 96, 106–113.
Dennis, M. J., & Kambil, A. (2003). Service management: Buildingprofits after the sales. Supply Chain Management Review, 7, 42–48.
Denyer, D., Tranfield, D., & van Aken, J. E. (2008). Developing designpropositions through research synthesis. Organization Studies, 29,393–413.
Deutsche Bahn, A. G. (2018). 3D printing: Replacement on timeincreases train availability. Retrieved from https://www.deutschebahn.com/en/Digitalization/DB_Digital/productworld/3dprint-1214672.
Duray, R., Ward, P. T., Milligan, G. W., & Berry, W. L. (2000).Approaches to mass customization: Configurations and empiricalvalidation. Journal of Operations Management, 18, 605–625.
Feeney, G., & Sherbrooke, C. (1966). The (s - 1, s) inventory policyunder compound Poisson demand. Management Science, 12,391–411.
Feitzinger, E., & Lee, H. L. (1996). Mass customization at Hewlett-Packard: The power of postponement. Harvard Business Review,75, 116–121.
Gibson, I., Rosen, D., & Stucker, B. (2015). Additive manufacturingtechnologies (2nd ed.). New York, NY: Springer.
Guvenir, H. A., & Erel, E. (1998). Multicriteria inventory classificationusing a genetic algorithm. European Journal of OperationalResearch, 105, 29–37.
Hadley, G. F., & Whitin, T. M. (1963). Analysis of inventory systems.Englewood Cliffs, NJ: Prentice Hall.
Hevner, A. R., March, S. T., Park, J., & Ram, S. (2004). Design sciencein information system research. MIS Quarterly, 28, 75–105.
Holmström, J., & Gutowski, T. (2017). Additive manufacturing inoperations and supply chain management: No sustainability benefitor virtuous knock-on opportunities? Journal of Industrial Ecology,21, 21–24.
Holmström, J., Ketokivi, M., & Hameri, A. P. (2009). Bridging practiceand theory: A design science approach. Decision Sciences, 40,65–87.
Holmström, J., Partanen, J., Tuomi, J., & Walter, M. (2010). Rapidmanufacturing in the spare parts supply chain: Alternativeapproaches to capacity deployment. Journal of ManufacturingTechnology Management, 21, 687–697.
Holweg, M. (2015). The limits of 3D printing. Retrieved from https://hbr.org/2015/06/the-limits-of-3d-printing.
Holweg, M., & Pil, F. K. (2004). The second century: Reconnectingcustomer and value chain through build-to-order. Cambridge, MA:MIT Press.
Hu, Q., Boylan, J. E., Chen, H., & Labib, A. (2018). OR in spare partsmanagement: A review. European Journal of OperationalResearch, 266, 395–414.
Huiskonen, J. (2001). Maintenance spare parts logistics: Special charac-teristics and strategic choices. International Journal of ProductionEconomics, 71, 125–133.
Jarzabkowski, P., & Kaplan, S. (2015). Strategy tools-in-use: A frame-work for understanding “technologies of rationality” in practice.Strategic Management Journal, 36, 537–558.
Kaipia, R., Holmström, J., Småros, J., & Rajala, R. (2017). Informationsharing for sales and operations planning: Contextualized solutionsand mechanisms. Journal of Operations Management, 52, 15–29.
Kastalli, I. V., & Van Looy, B. (2013). Servitization: Disentangling theimpact of service business model innovation on manufacturing firmperformance. Journal of Operations Management, 31, 169–180.
Kennedy, W., Patterson, W. J., & Fredendall, L. D. (2002). An over-view of recent literature on spare parts inventories. InternationalJournal of Production Economics, 76, 201–215.
Khajavi, S. H., Deng, G., Holmström, J., Puukko, P., & Partanen, J.(2018). Selective laser melting raw material commoditization:Impact on comparative competitiveness of additive manufacturing.International Journal of Production Research, 56, 1–23.
Khajavi, S. H., Holmström, J., & Partanen, J. (2018). Additivemanufacturing in the spare parts supply chain: Hub configurationand technology maturity. Rapid Prototyping Journal, 24,1178–1192.
Khajavi, S. H., Partanen, J., Holmström, J., & Tuomi, J. (2015). Riskreduction in new product launch: A hybrid approach combining
820 HEINEN AND HOBERG
direct digital and tool-based manufacturing. Computers in Industry,74, 29–42.
Klahn, C., Bastian, L., & Meboldt, M. (2015). Design strategies for theprocess of additive manufacturing. Procedia CIRP, 36, 230–235.
Knofius, N., van der Heijden, M. C., & Zijm, W. H. M. (2016).Selecting parts for additive manufacturing in service logistics. Jour-nal of Manufacturing Technology Management, 27, 915–931.
Knofius, N., van der Heijden, M. C., & Zijm, W. H. M. (2018). Mov-ing to additive manufacturing for spare parts supply. In A. Chikán(Ed.), Book of abstracts: 20th international symposium on invento-ries (p. 62). Budapest, Hungary: International Society for InventoryResearch.
Krishnan, V., & Ulrich, K. T. (2001). Product development decisions:A review of the literature. Management Science, 47, 1–21.
Li, X., Dekker, R., Heij, C., & Hekimo, M. (2016). Assessing end-of-supply risk of spare parts using the proportional hazard model.Decision Sciences, 47, 373–394.
Lindemann, C., Reiher, T., Jahnke, U., & Koch, R. (2015). Towards asustainable and economic selection of part candidates for additivemanufacturing. Rapid Prototyping Journal, 21, 216–227.
Müller, A., & Karevska, S. (2016). How will 3D printing make yourcompany the strongest link in the value chain? EY's global 3Dprinting report 2016. Mannheim, Germany: Ernst & YoungGmbH.
Nahmias, S. (1981). Managing repairable item inventory systems: Areview. TIMS Studies in the Management Sciences, 16, 253–277.
Nahmias, S. (2009). Inventory control subject to uncertain demand. InProduction and operations analysis (6th ed., pp. 248–310). Boston,MA: McGraw-Hill.
Peffers, K., Tuunanen, T., Rothenberger, M. A., & Chatterjee, S.(2007). A design science research methodology for informationsystems research. Journal of Management Information Systems, 24,45–77.
Reeves, P., Tuck, C. J., & Hague, R. J. M. (2011). Additivemanufacturing for mass customization. In F. S. Fogliatto & G. J. C.da Silveria (Eds.), Mass customization: Engineering and managingglobal operations (pp. 275–289). London, UK: Springer.
Roca, J. B., Vaishnav, P., Mendonca, J., & Morgan, M. G. (2017). Get-ting past the hype about 3-D printing. Sloan Management Review,58, 57–62.
Schultz, C. R. (1989). Replenishment delays for expensive slow-moving items. Management Science, 35, 1454–1462.
Schultz, C. R. (1990). On the optimality of the (S - 1,S) policy. NavalResearch Logistics, 37, 715–723.
Su, J. C. P., Chang, Y. L., & Ferguson, M. (2005). Evaluation of post-ponement structures to accommodate mass customization. Journalof Operations Management, 23, 305–318.
Suomala, P., Sievak, M., & Paranko, J. (2002). The effects of customi-zation on spare part business: A case study in the metal industry.International Journal of Production Economics, 79, 57–66.
Syntetos, A. A., Babai, M. Z., & Altay, N. (2012). On the demand dis-tributions of spare parts. International Journal of ProductionResearch, 50, 2101–2117.
Syntetos, A. A., Lengu, D., & Babai, M. Z. (2013). A note on thedemand distributions of spare parts. International Journal of Pro-duction Research, 51, 6356–6358.
Tuck, C. J., Hague, R. J. M., Ruffo, M., Ransley, M., & Adams, P. (2008).Rapid manufacturing facilitated customization. International Journalof Computer IntegratedManufacturing, 21, 245–258.
Volvo, C. E. (2018). Volvo CE moves into 3D printing of parts.Retrieved from https://www.volvoce.com/global/en/news-and-events/news-and-press-releases/2018/volvo-ce-moves-into-3d-printing-of-parts/.
Wagner, S. M., Jönke, R., & Eisingerich, A. B. (2012). A strategicframework for spare parts logistics. California ManagementReview, 54, 69–92.
Wagner, S. M., & Lindemann, E. (2008). A case study-based analysisof spare parts management in the engineering industry. ProductionPlanning and Control, 19, 397–407.
Wagner, S. M., & Walton, R. O. (2016). Additive manufacturing'simpact and future in the aviation industry. Production Planning &Control, 27, 1124–1130.
Walter, M., Holmström, J., Yrjölä, H., 2004. Rapid manufacturing and itsimpact on supply chain management, in: Proceedings of the LogisticsResearch Network Annual Conference 2004, Dublin, Ireland.
Westerweel, B., Basten, R. J. I., & van Houtum, G. J. (2018). Tradi-tional or additive manufacturing? Assessing component designoptions through lifecycle cost analysis. European Journal of Oper-ational Research., 270, 570–585.
Whittington, R. (2006). Completing the practice turn in strategyresearch. Organization Studies, 27, 613–634.
van Wingerden, E., Basten, R., Dekker, R., & Rustenburg, W. (2014).More grip on inventory control through improved forecasting: Acomparative study at three companies. International Journal ofProduction Economics, 157, 220–237.
Zipkin, P. (2000). Foundations of inventory management. Singapore:McGraw-Hill Book Co.
How to cite this article: Heinen JJ, Hoberg K.Assessing the potential of additive manufacturing forthe provision of spare parts. J Oper Manag. 2019;65:810–826. https://doi.org/10.1002/joom.1054
APPENDIX A CASE STUDY INFORMATION
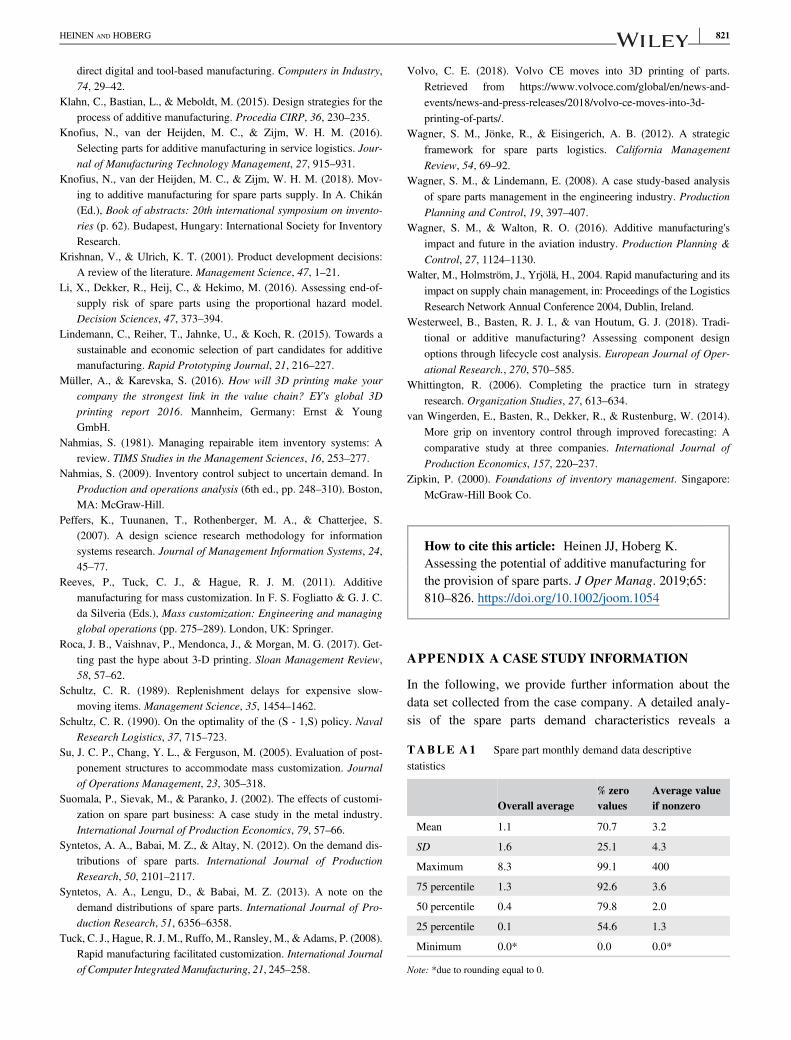
In the following, we provide further information about thedata set collected from the case company. A detailed analy-sis of the spare parts demand characteristics reveals a
TABLE A1 Spare part monthly demand data descriptivestatistics
Overall average% zerovalues
Average valueif nonzero
Mean 1.1 70.7 3.2
SD 1.6 25.1 4.3
Maximum 8.3 99.1 400
75 percentile 1.3 92.6 3.6
50 percentile 0.4 79.8 2.0
25 percentile 0.1 54.6 1.3
Minimum 0.0* 0.0 0.0*
Note: *due to rounding equal to 0.
HEINEN AND HOBERG 821
common demand pattern for spare parts. As presented inTable A1 and highlighted in Section 2, the case company ischallenged by intermittent demand with an average overallmonthly demand of 1.1. On average, in 70.7% of all months,an SKU has no demand.
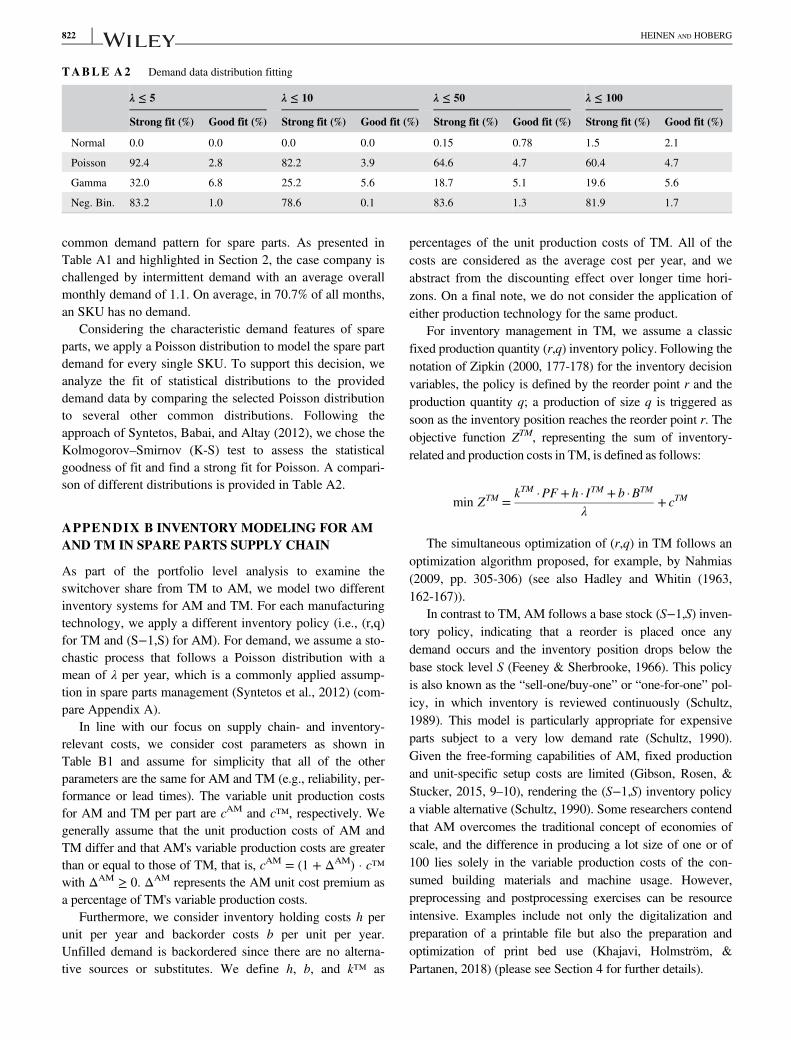
Considering the characteristic demand features of spareparts, we apply a Poisson distribution to model the spare partdemand for every single SKU. To support this decision, weanalyze the fit of statistical distributions to the provideddemand data by comparing the selected Poisson distributionto several other common distributions. Following theapproach of Syntetos, Babai, and Altay (2012), we chose theKolmogorov–Smirnov (K-S) test to assess the statisticalgoodness of fit and find a strong fit for Poisson. A compari-son of different distributions is provided in Table A2.
APPENDIX B INVENTORY MODELING FOR AMAND TM IN SPARE PARTS SUPPLY CHAIN
As part of the portfolio level analysis to examine theswitchover share from TM to AM, we model two differentinventory systems for AM and TM. For each manufacturingtechnology, we apply a different inventory policy (i.e., (r,q)for TM and (S−1,S) for AM). For demand, we assume a sto-chastic process that follows a Poisson distribution with amean of λ per year, which is a commonly applied assump-tion in spare parts management (Syntetos et al., 2012) (com-pare Appendix A).
In line with our focus on supply chain- and inventory-relevant costs, we consider cost parameters as shown inTable B1 and assume for simplicity that all of the otherparameters are the same for AM and TM (e.g., reliability, per-formance or lead times). The variable unit production costsfor AM and TM per part are cAM and c™, respectively. Wegenerally assume that the unit production costs of AM andTM differ and that AM's variable production costs are greaterthan or equal to those of TM, that is, cAM = (1 + ΔAM) � c™with ΔAM ≥ 0. ΔAM represents the AM unit cost premium asa percentage of TM's variable production costs.
Furthermore, we consider inventory holding costs h perunit per year and backorder costs b per unit per year.Unfilled demand is backordered since there are no alterna-tive sources or substitutes. We define h, b, and k™ as
percentages of the unit production costs of TM. All of thecosts are considered as the average cost per year, and weabstract from the discounting effect over longer time hori-zons. On a final note, we do not consider the application ofeither production technology for the same product.
For inventory management in TM, we assume a classicfixed production quantity (r,q) inventory policy. Following thenotation of Zipkin (2000, 177-178) for the inventory decisionvariables, the policy is defined by the reorder point r and theproduction quantity q; a production of size q is triggered assoon as the inventory position reaches the reorder point r. Theobjective function ZTM, representing the sum of inventory-related and production costs in TM, is defined as follows:
min ZTM =kTM �PF + h � ITM + b �BTM
λ+ cTM
The simultaneous optimization of (r,q) in TM follows anoptimization algorithm proposed, for example, by Nahmias(2009, pp. 305-306) (see also Hadley and Whitin (1963,162-167)).
In contrast to TM, AM follows a base stock (S−1,S) inven-tory policy, indicating that a reorder is placed once anydemand occurs and the inventory position drops below thebase stock level S (Feeney & Sherbrooke, 1966). This policyis also known as the “sell-one/buy-one” or “one-for-one” pol-icy, in which inventory is reviewed continuously (Schultz,1989). This model is particularly appropriate for expensiveparts subject to a very low demand rate (Schultz, 1990).Given the free-forming capabilities of AM, fixed productionand unit-specific setup costs are limited (Gibson, Rosen, &Stucker, 2015, 9–10), rendering the (S−1,S) inventory policya viable alternative (Schultz, 1990). Some researchers contendthat AM overcomes the traditional concept of economies ofscale, and the difference in producing a lot size of one or of100 lies solely in the variable production costs of the con-sumed building materials and machine usage. However,preprocessing and postprocessing exercises can be resourceintensive. Examples include not only the digitalization andpreparation of a printable file but also the preparation andoptimization of print bed use (Khajavi, Holmström, &Partanen, 2018) (please see Section 4 for further details).
TABLE A2 Demand data distribution fitting
λ ≤ 5 λ ≤ 10 λ ≤ 50 λ ≤ 100
Strong fit (%) Good fit (%) Strong fit (%) Good fit (%) Strong fit (%) Good fit (%) Strong fit (%) Good fit (%)
Normal 0.0 0.0 0.0 0.0 0.15 0.78 1.5 2.1
Poisson 92.4 2.8 82.2 3.9 64.6 4.7 60.4 4.7
Gamma 32.0 6.8 25.2 5.6 18.7 5.1 19.6 5.6
Neg. Bin. 83.2 1.0 78.6 0.1 83.6 1.3 81.9 1.7
822 HEINEN AND HOBERG
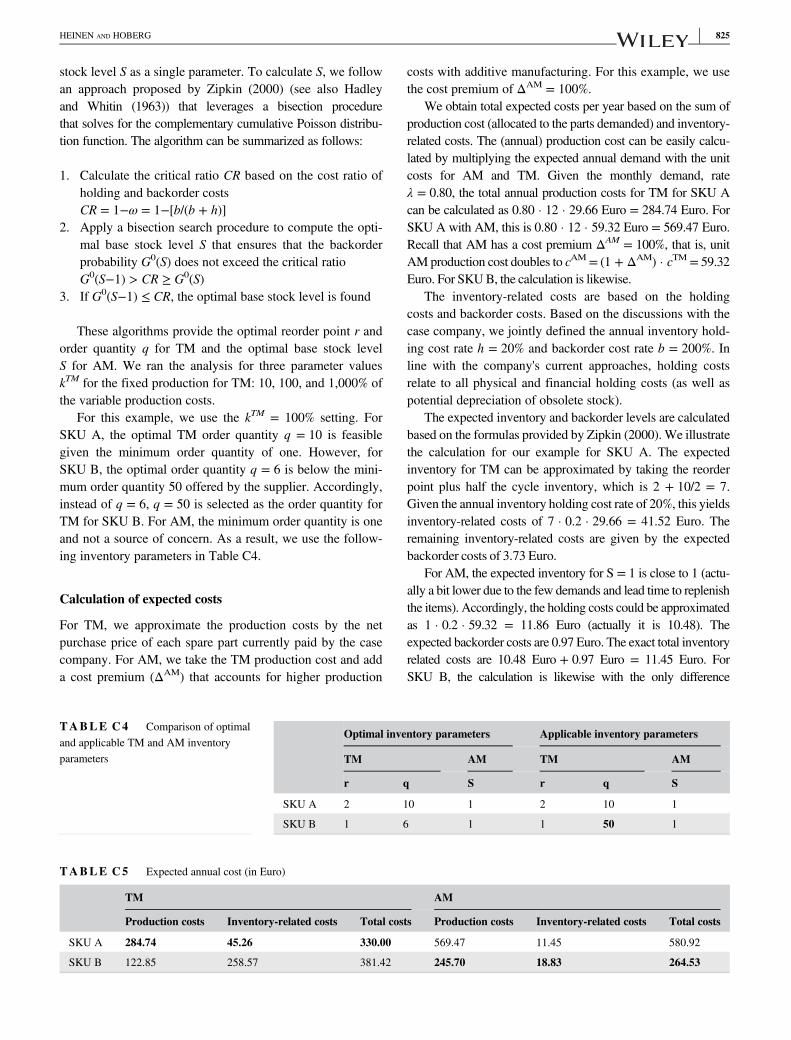
Analogous to TM, the objective is to minimize thesteady-state average cost per part produced. Accordingly,the objective function ZAM for AM is as follows:
min ZAM =h � IAM + b �BAM
λ+ cAM
To calculate S, we follow the approach proposed by Zipkin(2000, p. 447) (see also Hadley and Whitin (1963, 204-205)),which leverages a bisection procedure that solves for the com-plementary cumulative Poisson distribution function.
APPENDIX C EXEMPLARY SWITCHOVERANALYSIS FROM TM TO AM IN SPARE PARTSSUPPLY CHAIN
In the following, we outline the step-wise approach used tocalculate the costs for using TM and AM for two sampleSKUs from our full data set with 53,457 spare parts. In linewith the interest of the case company to remain confidential,we simply refer to these SKUs as SKU A and SKU B. Wefollow the steps outlined to define the switchover decisionsfor each SKU in line with the summary of the approachdescribed in Section 3.
We first present the raw data that was used to obtain theswitchover decision. Then, we estimate the demand parame-ter for each SKU using the Poisson distribution and calculatethe goodness-of-fit. Next, we calculate the optimal inventorypolicy parameters for TM and AM. Then, we use theobtained parameters to calculate the total expected costs forTM and AM. Finally, we decide on the switchover for eachSKU (based on the lowest cost) and calculate three key per-formance indicators for the sample portfolio.
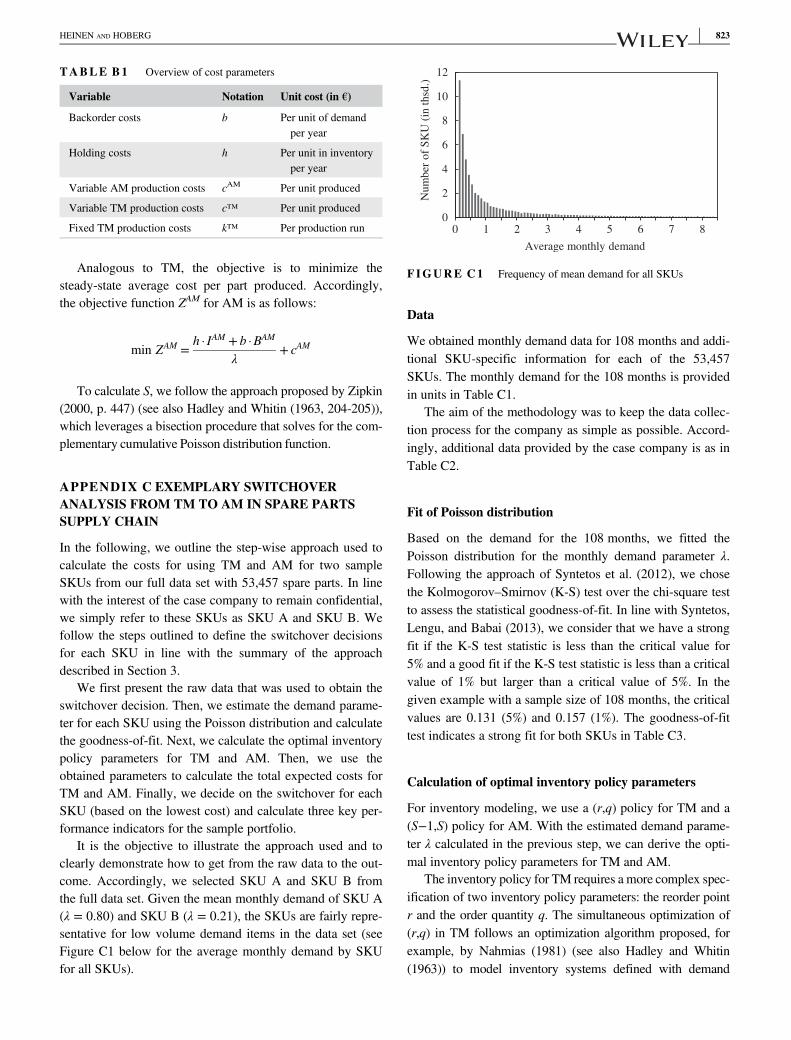
It is the objective to illustrate the approach used and toclearly demonstrate how to get from the raw data to the out-come. Accordingly, we selected SKU A and SKU B fromthe full data set. Given the mean monthly demand of SKU A(λ = 0.80) and SKU B (λ = 0.21), the SKUs are fairly repre-sentative for low volume demand items in the data set (seeFigure C1 below for the average monthly demand by SKUfor all SKUs).
Data
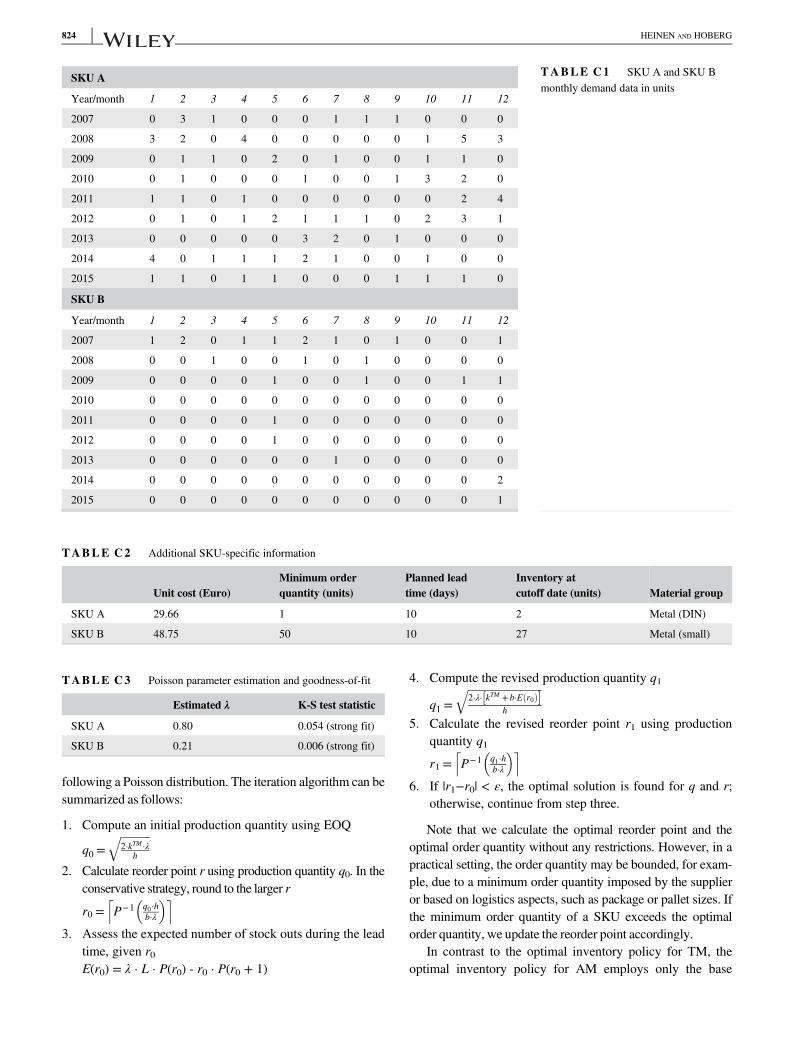
We obtained monthly demand data for 108 months and addi-tional SKU-specific information for each of the 53,457SKUs. The monthly demand for the 108 months is providedin units in Table C1.
The aim of the methodology was to keep the data collec-tion process for the company as simple as possible. Accord-ingly, additional data provided by the case company is as inTable C2.
Fit of Poisson distribution
Based on the demand for the 108 months, we fitted thePoisson distribution for the monthly demand parameter λ.Following the approach of Syntetos et al. (2012), we chosethe Kolmogorov–Smirnov (K-S) test over the chi-square testto assess the statistical goodness-of-fit. In line with Syntetos,Lengu, and Babai (2013), we consider that we have a strongfit if the K-S test statistic is less than the critical value for5% and a good fit if the K-S test statistic is less than a criticalvalue of 1% but larger than a critical value of 5%. In thegiven example with a sample size of 108 months, the criticalvalues are 0.131 (5%) and 0.157 (1%). The goodness-of-fittest indicates a strong fit for both SKUs in Table C3.
Calculation of optimal inventory policy parameters
For inventory modeling, we use a (r,q) policy for TM and a(S−1,S) policy for AM. With the estimated demand parame-ter λ calculated in the previous step, we can derive the opti-mal inventory policy parameters for TM and AM.
The inventory policy for TM requires a more complex spec-ification of two inventory policy parameters: the reorder pointr and the order quantity q. The simultaneous optimization of(r,q) in TM follows an optimization algorithm proposed, forexample, by Nahmias (1981) (see also Hadley and Whitin(1963)) to model inventory systems defined with demand
0
2
4
6
8
10
12
0 1 2 3 4 5 6 7 8
Num
ber
of
SK
U (
in t
hsd
.)
Average monthly demand
FIGURE C1 Frequency of mean demand for all SKUs
TABLE B1 Overview of cost parameters
Variable Notation Unit cost (in €)
Backorder costs b Per unit of demandper year
Holding costs h Per unit in inventoryper year
Variable AM production costs cAM Per unit produced
Variable TM production costs c™ Per unit produced
Fixed TM production costs k™ Per production run
HEINEN AND HOBERG 823
following a Poisson distribution. The iteration algorithm can besummarized as follows:
1. Compute an initial production quantity using EOQ
q0 =ffiffiffiffiffiffiffiffiffiffiffi2�kTM �λ
h
q
2. Calculate reorder point r using production quantity q0. In theconservative strategy, round to the larger r
r0 = P−1 q0�hb�λ
� �l m
3. Assess the expected number of stock outs during the leadtime, given r0E(r0) = λ � L � P(r0) - r0 � P(r0 + 1)
4. Compute the revised production quantity q1
q1 =ffiffiffiffiffiffiffiffiffiffiffiffiffiffiffiffiffiffiffiffiffiffiffiffiffiffiffi2�λ� kTM + b�E r0ð Þ½ �
h
q
5. Calculate the revised reorder point r1 using productionquantity q1
r1 = P−1 q1�hb�λ
� �l m
6. If |r1−r0| < ε, the optimal solution is found for q and r;otherwise, continue from step three.
Note that we calculate the optimal reorder point and theoptimal order quantity without any restrictions. However, in apractical setting, the order quantity may be bounded, for exam-ple, due to a minimum order quantity imposed by the supplieror based on logistics aspects, such as package or pallet sizes. Ifthe minimum order quantity of a SKU exceeds the optimalorder quantity, we update the reorder point accordingly.
In contrast to the optimal inventory policy for TM, theoptimal inventory policy for AM employs only the base
TABLE C1 SKU A and SKU Bmonthly demand data in units
SKU A
Year/month 1 2 3 4 5 6 7 8 9 10 11 12
2007 0 3 1 0 0 0 1 1 1 0 0 0
2008 3 2 0 4 0 0 0 0 0 1 5 3
2009 0 1 1 0 2 0 1 0 0 1 1 0
2010 0 1 0 0 0 1 0 0 1 3 2 0
2011 1 1 0 1 0 0 0 0 0 0 2 4
2012 0 1 0 1 2 1 1 1 0 2 3 1
2013 0 0 0 0 0 3 2 0 1 0 0 0
2014 4 0 1 1 1 2 1 0 0 1 0 0
2015 1 1 0 1 1 0 0 0 1 1 1 0
SKU B
Year/month 1 2 3 4 5 6 7 8 9 10 11 12
2007 1 2 0 1 1 2 1 0 1 0 0 1
2008 0 0 1 0 0 1 0 1 0 0 0 0
2009 0 0 0 0 1 0 0 1 0 0 1 1
2010 0 0 0 0 0 0 0 0 0 0 0 0
2011 0 0 0 0 1 0 0 0 0 0 0 0
2012 0 0 0 0 1 0 0 0 0 0 0 0
2013 0 0 0 0 0 0 1 0 0 0 0 0
2014 0 0 0 0 0 0 0 0 0 0 0 2
2015 0 0 0 0 0 0 0 0 0 0 0 1
TABLE C2 Additional SKU-specific information
Unit cost (Euro)Minimum orderquantity (units)
Planned leadtime (days)
Inventory atcutoff date (units) Material group
SKU A 29.66 1 10 2 Metal (DIN)
SKU B 48.75 50 10 27 Metal (small)
TABLE C3 Poisson parameter estimation and goodness-of-fit
Estimated λ K-S test statistic
SKU A 0.80 0.054 (strong fit)
SKU B 0.21 0.006 (strong fit)
824 HEINEN AND HOBERG
stock level S as a single parameter. To calculate S, we followan approach proposed by Zipkin (2000) (see also Hadleyand Whitin (1963)) that leverages a bisection procedurethat solves for the complementary cumulative Poisson distribu-tion function. The algorithm can be summarized as follows:
1. Calculate the critical ratio CR based on the cost ratio ofholding and backorder costsCR = 1−ω = 1−[b/(b + h)]
2. Apply a bisection search procedure to compute the opti-mal base stock level S that ensures that the backorderprobability G0(S) does not exceed the critical ratioG0(S−1) > CR ≥ G0(S)
3. If G0(S−1) ≤ CR, the optimal base stock level is found
These algorithms provide the optimal reorder point r andorder quantity q for TM and the optimal base stock levelS for AM. We ran the analysis for three parameter valueskTM for the fixed production for TM: 10, 100, and 1,000% ofthe variable production costs.
For this example, we use the kTM = 100% setting. ForSKU A, the optimal TM order quantity q = 10 is feasiblegiven the minimum order quantity of one. However, forSKU B, the optimal order quantity q = 6 is below the mini-mum order quantity 50 offered by the supplier. Accordingly,instead of q = 6, q = 50 is selected as the order quantity forTM for SKU B. For AM, the minimum order quantity is oneand not a source of concern. As a result, we use the follow-ing inventory parameters in Table C4.
Calculation of expected costs
For TM, we approximate the production costs by the netpurchase price of each spare part currently paid by the casecompany. For AM, we take the TM production cost and adda cost premium (ΔAM) that accounts for higher production
costs with additive manufacturing. For this example, we usethe cost premium of ΔAM = 100%.
We obtain total expected costs per year based on the sum ofproduction cost (allocated to the parts demanded) and inventory-related costs. The (annual) production cost can be easily calcu-lated by multiplying the expected annual demand with the unitcosts for AM and TM. Given the monthly demand, rateλ = 0.80, the total annual production costs for TM for SKU Acan be calculated as 0.80 � 12 � 29.66 Euro = 284.74 Euro. ForSKU A with AM, this is 0.80 � 12 � 59.32 Euro = 569.47 Euro.Recall that AM has a cost premium ΔAM = 100%, that is, unitAM production cost doubles to cAM= (1 + ΔAM) � cTM = 59.32Euro. For SKUB, the calculation is likewise.
The inventory-related costs are based on the holdingcosts and backorder costs. Based on the discussions with thecase company, we jointly defined the annual inventory hold-ing cost rate h = 20% and backorder cost rate b = 200%. Inline with the company's current approaches, holding costsrelate to all physical and financial holding costs (as well aspotential depreciation of obsolete stock).
The expected inventory and backorder levels are calculatedbased on the formulas provided by Zipkin (2000). We illustratethe calculation for our example for SKU A. The expectedinventory for TM can be approximated by taking the reorderpoint plus half the cycle inventory, which is 2 + 10/2 = 7.Given the annual inventory holding cost rate of 20%, this yieldsinventory-related costs of 7 � 0.2 � 29.66 = 41.52 Euro. Theremaining inventory-related costs are given by the expectedbackorder costs of 3.73 Euro.
For AM, the expected inventory for S = 1 is close to 1 (actu-ally a bit lower due to the few demands and lead time to replenishthe items). Accordingly, the holding costs could be approximatedas 1 � 0.2 � 59.32 = 11.86 Euro (actually it is 10.48). Theexpected backorder costs are 0.97 Euro. The exact total inventoryrelated costs are 10.48 Euro + 0.97 Euro = 11.45 Euro. ForSKU B, the calculation is likewise with the only difference
TABLE C4 Comparison of optimaland applicable TM and AM inventoryparameters
Optimal inventory parameters Applicable inventory parameters
TM AM TM AM
r q S r q S
SKU A 2 10 1 2 10 1
SKU B 1 6 1 1 50 1
TABLE C5 Expected annual cost (in Euro)
TM AM
Production costs Inventory-related costs Total costs Production costs Inventory-related costs Total costs
SKU A 284.74 45.26 330.00 569.47 11.45 580.92
SKU B 122.85 258.57 381.42 245.70 18.83 264.53
HEINEN AND HOBERG 825
that the expected inventory for SKU B is driven by minimumorder quantity 50. This yields an expected inventory of1 + 50/2 = 26.
The following Table C5 summarizes the expected costs.
Switchover decision
Based on the calculated expected total annual cost we caneasily decide on switchover from TM to AM. For SKU A,the switchover to AM is not beneficial for ΔAM = 100% asthe AM costs are higher than TM. For SKU B, the costs forAM are lower for ΔAM = 100%. The resulting cost savingfor SKU B is 30.6%. Both decisions taken are highlighted inbold in the table above.
To bring this switchover decision into context for thesample portfolio with only two SKUs, this results in the fol-lowing key performance indicators:
1. 50% of the SKUs are switched to AM (i.e., one out oftwo SKUs)
2. 20.79% of the total units supplied are produced with AM(i.e., given the total expected monthly demand of 0.80 +0.21 = 1.01 units)
3. Total expected cost are 83.57% compared to the priorcosts based on the switchover of SKU B to AM
If we compare these numbers to Figure 2, it would relateto one data point provided atΔAM = 100% for the kTM = 100%curve (given this small sample portfolio of two SKUs).
826 HEINEN AND HOBERG
Copyright © 2022 FDOKUMEN