
Additive manufacturing of high tensile strength steel for ...
204
This document is downloaded from DR‑NTU (https://dr.ntu.edu.sg) Nanyang Technological University, Singapore. Additive manufacturing of high tensile strength steel for offshore & marine 3D complex joint applications Wu, Wenjin 2020 Wu, W. (2020). Additive manufacturing of high tensile strength steel for offshore & marine 3D complex joint applications. Doctoral thesis, Nanyang Technological University, Singapore. https://hdl.handle.net/10356/146202 https://doi.org/10.32657/10356/146202 This work is licensed under a Creative Commons Attribution‑NonCommercial 4.0 International License (CC BY‑NC 4.0). Downloaded on 15 Jan 2022 04:30:12 SGT
-
Upload
khangminh22 -
Category
Documents
-
view
4 -
download
0
Transcript of Additive manufacturing of high tensile strength steel for ...

This document is downloaded from DR‑NTU (https://dr.ntu.edu.sg)Nanyang Technological University, Singapore.
Additive manufacturing of high tensile strengthsteel for offshore & marine 3D complex jointapplications
Wu, Wenjin
2020
Wu, W. (2020). Additive manufacturing of high tensile strength steel for offshore & marine3D complex joint applications. Doctoral thesis, Nanyang Technological University,Singapore.
https://hdl.handle.net/10356/146202
https://doi.org/10.32657/10356/146202
This work is licensed under a Creative Commons Attribution‑NonCommercial 4.0International License (CC BY‑NC 4.0).
Downloaded on 15 Jan 2022 04:30:12 SGT

ADDITIVE MANUFACTURING OF HIGH TENSILE
STRENGTH STEEL FOR OFFSHORE & MARINE 3D
COMPLEX JOINT APPLICATIONS
WU WENJIN
SCHOOL OF MECHANICAL AND AEROSPACE ENGINEERING
2020

Additive manufacturing of high tensile strength steel for offshore &
marine 3D complex joint applications
Wu Wenjin
School of Mechanical and Aerospace Engineering
A thesis submitted to the Nanyang Technological University
in partial fulfillment of the requirement for the degree of
Doctor of Philosophy
2020

1
Statement of Originality
I hereby certify that the work embodied in this thesis is the result of original research,
is free of plagiarised materials, and has not been submitted for a higher degree to any
other University or Institution.
11 Jan 2020
. . . . . . . . . . . . . . . . . . . . . . . . . . . . . . . . . . . . . . . . . . . .
Date Wu Wenjin

2
Supervisor Declaration Statement
I have reviewed the content and presentation style of this thesis and declare it is free of
plagiarism and of sufficient grammatical clarity to be examined. To the best of my
knowledge, the research and writing are those of the candidate except as
acknowledged in the Author Attribution Statement. I confirm that the investigations
were conducted in accord with the ethics policies and integrity standards of Nanyang
Technological University and that the research data are presented honestly and without
prejudice.
11 Jan 2020
. . . . . . . . . . . . . . . . . . . . . . . . . . . . . . . . . . . . . . . . . . . .
Date A/Prof Tor Shu Beng

3
Authorship Attribution Statement
Please select one of the following; *delete as appropriate:
*(A) This thesis does not contain any materials from papers published in peer-
reviewed journals or from papers accepted at conferences in which I am listed as an
author.
*(B) This thesis contains material from 2 paper(s) published in the following peer-
reviewed journal(s) / from papers accepted at conferences in which I am listed as an
author.
Chapter 3 is published as Wenjin Wu, Shu Beng Tor, Chee Kai Chua, Kah Fai Leong,
and Aziz Amirali Merchant. "Investigation on processing of ASTM A131 Eh36 high
tensile strength steel using selective laser melting." Virtual and Physical Prototyping
10, no. 4 (2015): 187-193.
The contributions of the co-authors are as follows:
• I prepared the manuscript drafts.
• All microscopy, including sample preparation, was conducted by me.
• I analysed the data.
• Prof Tor Shu Beng, Prof Chua Chee Kai, Prof Leong Kah Fai and Mr
Aziz Amirali Merchant provided guidance in directions of the work.
Chapter 4 is partially published as Wenjin Wu, Shu Beng Tor, and Aziz Amirali
Merchant. "Tensile Properties Of ASTM A131 EH36 Shipbuilding Steel Processed By
Selective Laser Melting." In the proceedings of 3rd International Conference on
Progress in Additive Manufacturing 2018. May 2018, Singapore..
The contributions of the co-authors are as follows:
• I prepared the manuscript drafts.

4
• All sample preparation and tests were conducted by me.
• I analysed the data.
• Prof Tor Shu Beng and Mr Aziz Amirali Merchant provided guidance
in directions of the work.
11 Jan 2020
. . . . . . . . . . . . . . . . . . . . . . . . . . . . . . . . . . . . . . . . . . . .
Date Wu Wenjin

5
Acknowledgements
The author wishes to express sincere gratitude and appreciation towards his
supervisor, Associate Professor Tor Shu Beng for his advice, assistance and patience
throughout his candidature. Prof Tor also provided an immense amount of guidance and
mentorship in ensuring that the author progresses in the most appropriate manner. Prof
Tor’s appointment as his supervisor contributed the most towards the author’s
completion of the research work.
The author would also like to thank Keppel Technology and Innovation (KTI),
Keppel Offshore & Marine Technology Centre (KOMtech), Energy Research Institute
at Nanyang Technological University (ERI@N) and Singapore Centre for 3D Printing
(SC3DP) for the research collaboration that led to this research opportunity. As part of
this research collaboration, the author wants to thank KTI’s industry supervisor, Dr
Miguel Angel Moya Ramirez, KOMtech’s industry supervisors, Dr Basil Lui and Mr
Aziz Merchant, ERI@N’s director Dr Narasimalu Srikanth and Professor Chua Chee
Kai for their support. In support of this research, the author also expresses gratitude
towards the support from Economic Development Board Singapore. The author also
acknowledges the research funding received from these affiliations.
The author would also like to thank the following technical and research staff,
and business associates for their assistance and guidance during his research work – Mr.
Chia Yak Khoong, Mr. Soh Beng Choon, Mr. Mack Wong, Dr Alexander Liu, Dr Zhang
Dan Qing, Dr Tan Xi Peng, Mr Sun Zhongji, Dr Sing Swee Leong, Dr An Jia, Ms Wang
Jing Jing, Mr Daniel Yeo Yin Ping, Mr Justin Ong Lu Chen. The author would also like
to express thanks to the other researchers and research students for all the assistance
rendered.
On a personal basis, the author wishes to express his heartfelt gratitude to Mr
Charles Foo, who had triggered the initial motivation for the author to embark on this
research journey. The author also shares similar gratitude to his colleagues at Keppel
Technology and Innovation, Mr Stanley Han, Mr Lee Yuan Hao, Ms Sharine Tan Ying
Jia, for their understanding and support in his research journey.
Last but not the least, the author is especially thankful to his family, loved ones,
and friends for their constant encouragement and understanding throughout the research

6
journey. Special thanks and appreciation go to the author’s wife for her support and
understanding, without which, the completion of the research will not be possible.

7
List of Publications
Throughout the course of this research, the author has written and contributed to
several publications in international peer-reviewed journals and conference papers.
Peer-Reviewed Journal Papers
1. Jingjing Wang, Wenjin Wu, Meng Zhang, Bing Wang, Xipeng Tan, Guijun Bi,
Hua Li, Shu Beng Tor, Erjia Liu. “Influence of surface porosity on fatigue life
of additively manufactured ASTM A131 EH36 steel samples.” Journal of
Materials Science and Technologies. Under review.
2. Jingjing Wang, Wenjin Wu, You Xiang Chew, Wei Jing, Xipeng Tan, Sharine
Ying Jia Tan, Yuan Hao Lee, Aziz Merchant, Shu Beng Tor, Kah Fai Leong,
Chee Kai Chua, Guijun Bi, Erjia Liu. “Robust ASTM A131 EH36 steel samples
printed in different orientations via laser aided additive manufacturing.”
Materials Science and Engineering A. Under review.
3. Jingjing Wang, Wenjin Wu, Wei Jing, Xipeng Tan, Guijun Bi, Shu Beng Tor,
Kah Fai Leong, Chee Kai Chua, Erjia Liu. “Improvement of densification and
microstructure of ASTM A131 EH36 steel samples additively manufactured via
selective laser melting with varying laser scanning speed and hatch spacing.”
Materials Science & Engineering A 746 (2019): 300-313.
4. Wenjin Wu, Shu Beng Tor, Chee Kai Chua, Kah Fai Leong, and Aziz Amirali
Merchant. "Investigation on processing of ASTM A131 Eh36 high tensile
strength steel using selective laser melting." Virtual and Physical Prototyping 10,
no. 4 (2015): 187-193.
Conference Papers
1. Wenjin Wu, Shu Beng Tor, and Aziz Amirali Merchant. "Tensile Properties Of
ASTM A131 EH36 Shipbuilding Steel Processed By Selective Laser Melting."
In the proceedings of 3rd International Conference on Progress in Additive
Manufacturing 2018. May 2018, Singapore.
2. Wenjin Wu, Shu Beng Tor, Narasimalu Srikanth, Chee Kai Chua, and Aziz
Amirali Merchant. " Introduction to Metal Additive Manufacturing and its
Challenges in Offshore & Marine." In the proceedings of 3rd Asian Wave and
Tidal Energy Conference 2016. Oct 2016, Singapore.

8
3. Wenjin Wu, Shu Beng Tor, Kah Fai Leong, Chee Kai Chua, and Aziz Amirali
Merchant. "State Of The Art Review On Selective Laser Melting Of Stainless
Steel For Future Applications In The Marine Industry." In the proceedings of
2nd International Conference on Progress in Additive Manufacturing 2016. May
2016, Singapore.
4. Wenjin Wu, Shu Beng Tor, Lui Onn Kit, Basil, and Aziz Merchant. "Study of
Additive Manufacturing in Offshore & Marine." In the proceedings of Rapid
2014. Jun 2014, Detroit.

9
Contents
Acknowledgements ........................................................................................... 5
List of Publications ........................................................................................... 7
List of Figures .................................................................................................. 14
List of Tables ................................................................................................... 19
Abstract ............................................................................................................ 21
Chapter One Introduction ............................................................................... 23
1.1 Background ......................................................................................... 23
1.2 Research Motivation and Approach .................................................... 30
1.3 Research Objectives ............................................................................ 30
1.4 Thesis Outline ..................................................................................... 31
Chapter Two Literature Review ..................................................................... 32
2.1 Materials .............................................................................................. 33
ASTM A131 Shipbuilding Material .............................................. 33
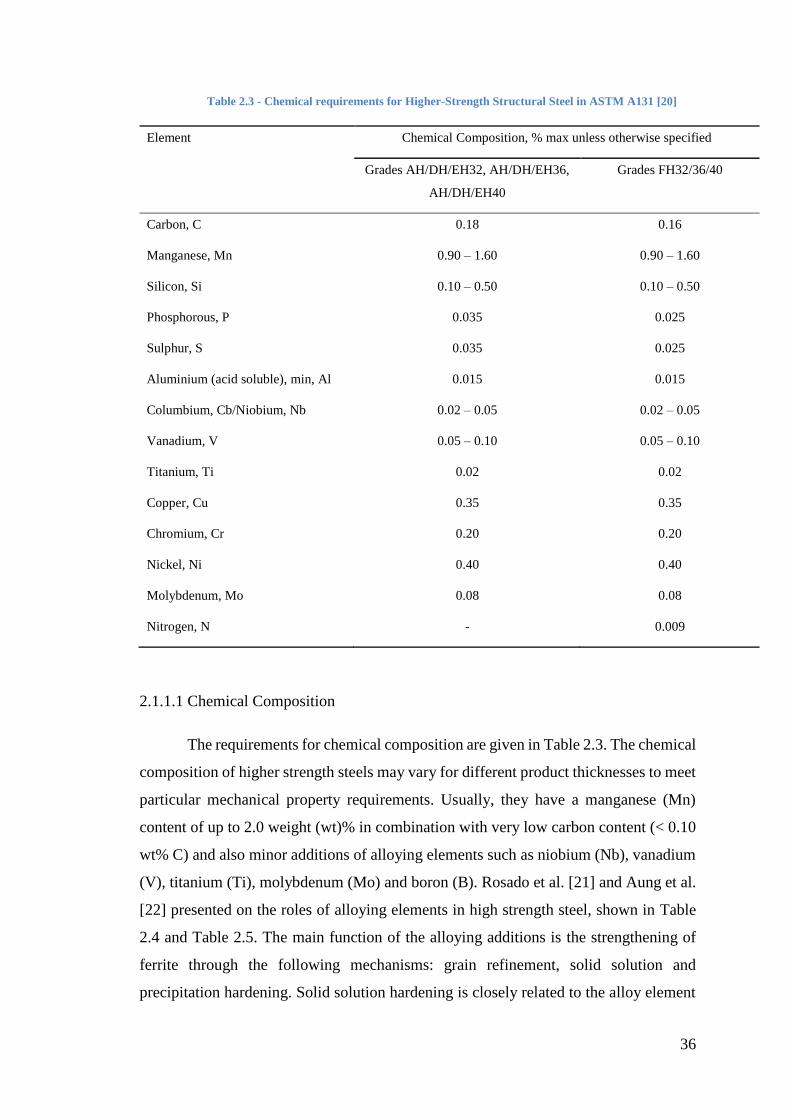
2.1.1.1 Chemical Composition ........................................................... 36
2.1.1.2 Steel Transformation .............................................................. 41
2.1.1.3 Steel Processing ...................................................................... 45
2.1.1.4 Selection of Grade of ASTM A131 Steel ............................... 48
2.2 Additive Manufacturing Technologies ................................................ 50
2.2.1 Binder Jetting ................................................................................ 54
2.2.2 Direct Energy Deposition .............................................................. 56
2.2.3 Material Extrusion ......................................................................... 58

10
2.2.4 Material Jetting .............................................................................. 61
2.2.5 Powder Bed Fusion ....................................................................... 62
2.2.5.1 Selective Laser Sintering ........................................................ 63
2.2.5.2 Selective Laser Melting .......................................................... 64
2.2.5.3 Selective Heat Sintering ......................................................... 65
2.2.5.4 Electron Beam Melting .......................................................... 65
2.2.6 Sheet Lamination........................................................................... 70
2.2.7 Vat Photopolymerisation ............................................................... 71
2.2.8 Selection of Additive Manufacturing Technology ........................ 72
2.3 Part and Material Properties in SLM of Metals .................................. 76
2.3.1 Density .......................................................................................... 77
2.3.2 Surface Quality .............................................................................. 83
2.3.3 Mechanical Properties ................................................................... 88
2.3.3.1 Toughness ............................................................................... 88
2.3.3.2 Ductility .................................................................................. 89
2.3.3.3 Tensile Strength ...................................................................... 91
2.3.3.4 Fatigue .................................................................................... 92
2.3.3.5 Hardness and Wear ................................................................. 94
2.3.4 Microstructure ............................................................................... 97
2.4 Literature Review Summary ............................................................. 107
2.5 Research Objective and Scope .......................................................... 110

11
2.6 Proposed Research Roadmap ............................................................ 112
Chapter Three Preliminary Investigations .................................................... 114
3.1 Material ............................................................................................. 114
3.2 SLM Machine and Process Parameters ............................................. 117
3.3 Results ............................................................................................... 118
3.3.1 Density Test................................................................................. 120
3.3.2 X-Ray Diffraction ....................................................................... 122
3.3.3 Light Optical Microscopy ........................................................... 123
3.3.4 Scanning Electron Microscopy ................................................... 124
3.4 Discussion ......................................................................................... 126
3.5 Conclusion ......................................................................................... 127
Chapter Four Mechanical Tests .................................................................... 129
4.1 Experimental ..................................................................................... 129
4.2 Heat Treatment .................................................................................. 132
4.3 Results ............................................................................................... 133
4.3.1 Tensile Strength........................................................................... 134
4.3.2 Elongation ................................................................................... 140
4.3.3 Charpy V-Notched Impact Toughness ........................................ 143
4.3.4 Vickers Hardness......................................................................... 148
4.4 Discussion ......................................................................................... 149
4.5 Conclusion ......................................................................................... 155

12
Chapter Five Fracture Surface Morphology ................................................. 156
5.1. Procedure ....................................................................................... 156
5.2. Results ........................................................................................... 156
5.3. Discussion ...................................................................................... 158
5.3.1 Ductility ....................................................................................... 158
5.3.2 Density and Defects .................................................................... 159
5.4. Conclusion ..................................................................................... 161
Chapter Six Microstructure Characterisation ............................................... 163
6.1. Iron-Carbon Binary Phase Diagram .............................................. 163
6.2. Experimental .................................................................................. 163
6.3. Results ........................................................................................... 164
6.4. Discussion ...................................................................................... 165
6.4.1 Effect of Heat Treatment ............................................................. 166
6.4.2 Grain Boundary Strengthening.................................................... 169
6.4.3 Transformation of Microstructure ............................................... 170
6.5. Conclusion ..................................................................................... 171
Chapter Seven Complex Joint Fabrication and Examination ....................... 173
7.1 Overview of Complex Joint .............................................................. 173
7.2 Microstructure Examination and SEM-Imaging ............................... 175
7.3 Vickers Hardness ............................................................................... 177
7.4 Discussion ......................................................................................... 178

13
7.5 Conclusion ......................................................................................... 180
Chapter Eight Conclusion & Future Work ................................................... 182
References ...................................................................................................... 185
Appendix A – List of all data ....................................................................... 196

14
List of Figures
Figure 2.1 - Iron-carbon phase diagram [25] ................................................................ 42
Figure 2.2 - Time–temperature transformation curves for (a) eutectoid, (b) hypo-
eutectoid and (c) low-alloy (e.g. Ni/Cr/Mo) steels .................................. 44
Figure 2.3 - (a) TMCP diagram for 'conventional' vs 'unconventional' processing; (b)
microstructural changes promoted by HOP [29] ..................................... 47
Figure 2.4 - Industrial-Grade Metal Additive Manufacturing Processes [35] .............. 52
Figure 2.5 - Industrial-Grade Metal Additive Manufacturing Machines [35] .............. 53
Figure 2.6 - Schematic of binder jetting process [36] ................................................... 55
Figure 2.7 - Schematic of powdered based direct energy deposition process [39] ....... 57
Figure 2.8 - Schematic of material extrusion additive manufacutring (Fused Deposition
Modelling) [43] ........................................................................................ 59
Figure 2.9 - Schematic of material jetting process (Polyjet from Objet Geometries) [36]
.................................................................................................................. 61
Figure 2.10 - Schematic of Selective Laser Sintering process [36] .............................. 64
Figure 2.11 - Schematic of Electron Beam Melting [36] .............................................. 66
Figure 2.12 - Schematic of ultrasonic additive manufacturing [36] ............................. 71
Figure 2.13 - Schematic of vat photopolymerisation [36] ............................................ 72
Figure 2.14 - Relative density (a) and optical image (b) of SLM processed SS316L
powder ...................................................................................................... 78
Figure 2.15 - Material density versus preheating temperature of powder bed ............. 79
Figure 2.16- (a) Effect of scanning strategy; (b) Different scanning strategies by Kruth
et al. [54] .................................................................................................. 80
Figure 2.17 - Four scanning strategies investigated by Jhabvala et al. [69] ................. 80
Figure 2.18 - Relative density values formed at differing island sizes in island scanning
strategy [70] ............................................................................................. 81
Figure 2.19 - Optical microscopy images of SLM produced part without re-melting [54,
66] ............................................................................................................ 82
Figure 2.20 - Optical microscopy images of SLM produced part with re-melting [54, 66]
.................................................................................................................. 83
Figure 2.21 - Surface quality enhancement with laser re-melting: (a) SLM without re-
melting (b) Laser re-molten part [54] ....................................................... 87
Figure 2.22 - SEM image of a SLM laser re-melted surface with no obvious edge-effect
[54] ........................................................................................................... 87

15
Figure 2.23 - SLM manufactured "truncheon" test part [81] ........................................ 87
Figure 2.24 - Charpy test results for SLM produced parts [54] .................................... 89
Figure 2.25 - Elongation values for SLM built SS316L from Spierings et al. [84] ...... 90
Figure 2.26 - Fatigue results of SLM process stainless steel 316L [105] ..................... 94
Figure 2.27 - Optical microscopy images showing characteristic microstructures of
SLM-processed Ti parts at different processing parameters [112] .......... 95
Figure 2.28 - Average macro hardness measured on cross-sections versus scan speed for
different layer thicknesses with 95% confidence intervals [113] ............ 97
Figure 2.29 - Micrographs after etching of cross-sections of Maraging Steel 300 from
Yasa et al. [113] ....................................................................................... 97
Figure 2.30 - MPBs on the cross section parallel to the laser scanning direction [82] . 98
Figure 2.31 - Morphology of the cross section perpendicular to the scanning direction
[82] ........................................................................................................... 99
Figure 2.32 - MPB boundary ........................................................................................ 99
Figure 2.33 - Tensile fracture morphologies of the sample fabricated along the direction
(a) perpendicular to the laser scanning direction and (b) with an angle of
60⁰ between the tensile loading direction and x-y plane [116] ................ 99
Figure 2.34 - Metallographic observation from the top view and from the side view of
SLM-fabricated iron cubes at the laser power of 100W using different laser
scanning speeds of: (a)–(b) 0.27m/s,(c)–(d) 0.33m/sand(e)–(f)
0.4m/s,respectively [90] ......................................................................... 101
Figure 2.35 - Micrographs of SLM sample showing elongated grains along build
direction [54] .......................................................................................... 102
Figure 2.36 - Frontal section of a SLM part from AISI 316L stainless steel [54] ...... 102
Figure 2.37 - SEM image of the cross-section of SLM built AISI 316L part [54] ..... 103
Figure 2.38 - Influence of scanning speed on microstructure of SLM built parts, (a) side
view, (b) front view [54] ........................................................................ 105
Figure 2.39 - Micrographs of SLM built parts: (a) front view of an increased scan
spacing, (b) influence of scan strategy on grain direction [54] .............. 105
Figure 2.40 - SEM pictures of AISI 316L stainless steel part when last layer was re-
melted 10 times, (a) low magnification, (b) high magnification [54] .... 106
Figure 3.1 - SEM image of ASTM A131 powder particles [129] .............................. 117
Figure 3.2 - SLM built test specimens [129] .............................................................. 119

16
Figure 3.3 - SLM built density cubes .......................................................................... 119
Figure 3.4 - Graph of SLM built part density vs energy density [129] ...................... 121
Figure 3.5 - XRD of EH36 (a) powder sample, (b) SLM built specimen [129] ......... 122
Figure 3.6 - XRD of quenched commercial low carbon steel [131] ........................... 123
Figure 3.7 - (a) Image of unetched SLM built specimen showing slight porosities, (b)
etched sample showing microstructure and porosity indicating incomplete
melting of powder particle [129] ............................................................ 123
Figure 3.8 - SEM images of SLM built specimen showing (a) fine grains (Zone A) vs
coarse grains (Zone B), (b) acicular martensitic structure [129] ........... 124
Figure 3.9 - High magnification SEM image of SLM built specimen showing acicular
martensitic structure ............................................................................... 125
Figure 4.1 - Dimensions of SLM built test coupons (a) tensile test coupons, (b) Charpy
test coupons ............................................................................................ 131
Figure 4.2 - SLM test coupon orientations (a) tensile test coupon, 45⁰; (b) tensile test
coupon, vertical; (c) tensile test coupon, horizontal; (d) Charpy test coupon,
notch facing up; (e) Charpy test coupon, notch facing side; (e) Charpy test
coupon, notch facing 45⁰ ........................................................................ 131
Figure 4.3 - SLM built test coupons. (a) As-built on build plate; (b) Tensile test coupons
following heat treatment; (c) Charpy test coupons following heat treatment
................................................................................................................ 134
Figure 4.4 - Graph of tensile test results (Yield Strength) for SLM built samples ..... 136
Figure 4.5 - Graph of tensile test results (Ultimate Tensile Strength) for SLM built
samples ................................................................................................... 136
Figure 4.6 - Graph of Yield Strength (XY, Machined) with error bar ........................ 137
Figure 4.7 - Graph of Yield Strength (XY, As-built) with error bar .......................... 137
Figure 4.8 - Graph of Ultimate Tensile Strength (XY, Machined) with error bar ...... 138
Figure 4.9 - Graph of Ultimate Tensile Strength (XY, As-built) with error bar ......... 138
Figure 4.10- Graph of Yield Strength (Z) with error bar ............................................ 139
Figure 4.11 - Graph of Yield Strength (45⁰) with error bar ........................................ 139
Figure 4.12- Graph of Ultimate Tensile Strength (Z) with error bar .......................... 140
Figure 4.13 - Graph of Ultimate Yield Strength (45⁰) with error bar ......................... 140
Figure 4.14 - Graph of elongation results for SLM built samples .............................. 141
Figure 4.15 - Graph of elongation results (XY, machined) with error bar ................. 142
Figure 4.16 - Graph of elongation results (XY, As-Built) with error bar ................... 142

17
Figure 4.17 - Graph of elongation results (Z) with error bar ...................................... 143
Figure 4.18 - Graph of elongation results (45⁰) with error bar ................................... 143
Figure 4.19 – Graph of Charpy test results for SLM built samples at 0⁰C ................. 145
Figure 4.20 – Graph of Charpy test results for SLM built samples at -40⁰C .............. 145
Figure 4.21 – Graph of Charpy test results (Notch Up) at 0⁰C with error bar ............ 146
Figure 4.22 – Graph of Charpy test results (Notch Side) at 0⁰C with error bar .......... 146
Figure 4.23 – Graph of Charpy test results (Notch 45⁰) at 0⁰C with error bar ............ 147
Figure 4.24 – Graph of Charpy test results (Notch Up) at -40⁰C with error bar ......... 147
Figure 4.25 – Graph of Charpy test results (Notch Side) at -40⁰C with error bar ...... 148
Figure 4.26 – Graph of Charpy test results (Notch 45⁰) at -40⁰C with error bar ........ 148
Figure 4.27 – Graph of Vickers hardness numbers (test coupons) ............................. 149
Figure 4.28 - Hardness of tempered martensite in iron-carbon (Fe-C) steel [142] ..... 151
Figure 4.29 - Schematic diagram of molten pools during SLM process: (a) single molten
pool; (b) “layer–layer” MPBs; (c) “track–track” MPBs. The arrows
represent the grain orientations. [116] ................................................... 153
Figure 4.30 - Schematic diagrams of MPBs on the stress cross sections of (a) the
horizontal and (b) vertical specimens. [116] .......................................... 154
Figure 5.1 - SEM images of tensile coupons at 50x magnification (a) no heat treatment,
(b) 205⁰C, (c) 315⁰C, (d) 425⁰C, (e) 540⁰C, (f) 650⁰C, (g) 800⁰C, (h)
reference sample ..................................................................................... 157
Figure 5.2 - SEM images of tensile coupons at 1000x magnification (a) no heat treatment,
(b) 205⁰C, (c) 315⁰C, (d) 425⁰C, (e) 540⁰C, (f) 650⁰C, (g) 800⁰C, (h)
reference sample ..................................................................................... 157
Figure 5.3 - SEM images of Charpy coupons at 50x magnification (a) no heat treatment,
(b) 205⁰C, (c) 315⁰C, (d) 425⁰C, (e) 540⁰C, (f) 650⁰C, (g) 800⁰C, (h)
reference sample ..................................................................................... 158
Figure 5.4 - SEM images of Charpy coupons at 1000x magnification (a) no heat
treatment, (b) 205⁰C, (c) 315⁰C, (d) 425⁰C, (e) 540⁰C, (f) 650⁰C, (g) 800⁰C,
(h) reference sample ............................................................................... 158
Figure 6.1 - Microstructure images showing melt pool layers (a) no heat treatment, (b)
205⁰C, (c) 315⁰C, (d) 425⁰C, (e) 540⁰C, (f) 650⁰C, (g) 800⁰C, (h) reference
sample .................................................................................................... 164
Figure 6.2 - Microstructure images (a) no heat treatment, (b) 205⁰C, (c) 315⁰C, (d) 425⁰C,
(e) 540⁰C, (f) 650⁰C, (g) 800⁰C, (h) reference sample ........................... 164

18
Figure 6.3 - Microstructure images with higher magnification (a) no heat treatment,
(b) 205⁰C, (c) 315⁰C, (d) 425⁰C, (e) 540⁰C, (f) 650⁰C, (g) 800⁰C, (h)
reference sample ..................................................................................... 165
Figure 6.4 - XRD results ............................................................................................. 165
Figure 6.5 – Effect of heat treatment causing formation of cementite (dark bands) and
ferrite (bright regions) ............................................................................ 167
Figure 6.6 – Effect of heat treatment causing spheriodisation .................................... 167
Figure 6.7 - Spheroidal carbides ................................................................................. 168
Figure 6.8 – Effect of heat treatment ending up with recrystallisation ....................... 168
Figure 6.9 - Grain boundary strengthening ................................................................. 169
Figure 6.10 - Grain size determination of SLM produced sample with 800⁰C heat
treatment ................................................................................................. 170
Figure 6.11 – Comparison of grain sizes of SLM processed sample with 800⁰C heat
treatment (left), vs TMCP produced sample (right) .............................. 171
Figure 7.1 - Photo of scaled complex joint processed by SLM .................................. 174
Figure 7.2 - Orientation of print of scaled complex joint ........................................... 174
Figure 7.3 - Section of complex joint removed for examination (shaded in blue) ..... 175
Figure 7.4 - Scaled model SEM imaging mapped to various printed faces ................ 176
Figure 7.5 - Scaled model SEM imaging with larger magnification .......................... 177
Figure 7.6 - Graph of Vickers hardness numbers (scaled model) ............................... 178
Figure 7.7 - Reference SEM images for comparison with scaled model (a) x-y plane, (b)
z plane, (c) z plane ................................................................................. 179

19
List of Tables
Table 1.1 – Typical fabrication steps for casting [14] .................................................. 27
Table 1.2 - Reduced fabrication steps after considering AM ....................................... 28
Table 2.1 - Tensile requirements for Ordinary-Strength and Higher-Strength Structural
Steel in ASTM A131 [20] ........................................................................ 34
Table 2.2 - Charpy V-notch impact requirements for Ordinary-Strength and Higher-
Strength Structural Steel in ASTM A131 [20] ......................................... 35
Table 2.3 - Chemical requirements for Higher-Strength Structural Steel in ASTM A131
[20] ........................................................................................................... 36
Table 2.4 - Major effects of alloying elements in high strength steel [21] ................... 38
Table 2.5 - Other alloying elements in high strength steel [22, 24] .............................. 39
Table 2.6 - Strategy alloying combinations to improve strength and toughness [23] .. 40
Table 2.7 - Carbon Equivalent for Higher-Strength Structural Steel Produced by TMCP
from ASTM A131 [20] ............................................................................ 41
Table 2.8 - Overview of TMCP stages, typical temperatures and features [21] ........... 48
Table 2.9 - Selection of grade of steel under ASTM A131 .......................................... 49
Table 2.10 - AM process categories ............................................................................. 50
Table 2.11 - Differences between EBM and SLM [36] ................................................ 67
Table 2.12 - Selection of AM technology to process ASTM A131 EH36 ................... 72
Table 2.13 - Comparison of various DED and PBF build rates .................................... 75
Table 2.14 - Comparison of SLM and conventional processes in terms of Charpy V-
notch toughness [54] ................................................................................ 89
Table 2.15 - Ultimate tensile strength, 0.2% offset yield strength and elongation at
failure from Riemer et al. [86] ................................................................. 90
Table 2.16 - Tensile properties of SLM processed metallic materials ......................... 92
Table 2.17 - Fatigue limits for stainless steel 316L from Riemer et al. [86] ................ 93
Table 2.18 - Chemical requirements for ASTM A131 EH36 steel ............................. 108
Table 2.19 - Tensile requirements for ASTM A131 EH36 ........................................ 108
Table 2.20 - Charpy V-notch impact requirements for ASTM A131 EH36 .............. 109
Table 2.21 - Carbon Equivalent for ASTM A131 EH36 ............................................ 109
Table 3.1 - ASTM A131 Powder Tests [129] ............................................................. 115
Table 3.2 - Elemental composition of ASTM A131 powder [129] ............................ 116
Table 3.3 - SLM process parameters (red values refer to laser scanning speed in mm/s)
[129] ....................................................................................................... 118

20
Table 3.4 - Results from density test (red values represent density in g/cm3) [129] .. 120
Table 3.5 - XRD analysis conditions .......................................................................... 122
Table 3.6 - Weldability based on Carbon Equivalent (CE) Content ........................... 126
Table 4.1 - Number of specimens for tensile and Charpy test .................................... 130
Table 4.2 - ASM International recommended temperatures for tempering of steel [140]
................................................................................................................ 133
Table 4.3 - Heat furnace details .................................................................................. 133
Table 4.4 - Table of tensile test results for SLM built samples .................................. 135
Table 4.5 - Table of elongation results for SLM built samples .................................. 141
Table 4.6 – Table of Charpy test results for SLM built samples ................................ 144
Table 4.7 – Table of Vickers hardness values for SLM built samples ....................... 149
Table 4.8 - Final test results for SLM built EH36 steel specimen (45⁰ built specimens)
................................................................................................................ 155
Table 5.1 - SEM details and parameters ..................................................................... 156
Table 5.2 - Scanning velocity of density test in colour scale ...................................... 160
Table 5.3 - Density values of density test in colour scale ........................................... 161
Table 7.1 - Table of Vickers hardness values for SLM built scaled model ................ 178

21
Abstract
Additive manufacturing (AM) technology can potentially disrupt offshore and
marine industry by effectively reducing manufacturing processes and leadtime, and
enabling new product designs. A review of existing literature has revealed limited
knowledge in using AM to process shipbuilding materials, which can otherwise enhance
existing shipbuilding manufacturing workflow. This has led to the research motivation
to establish the technical feasibility of using selective laser melting (SLM) to process
ASTM A131 EH36 shipbuilding steel.
SLM process is a widely understood AM technology that has been used
extensively to process other type of steels, for example stainless steel 316L. EH36
belongs to a class of high tensile low alloy steel which has traditionally been processed
through casting. However, knowledge on using lasers to process EH36 is largely
unknown, especially in AM applications. Using SLM to process EH36 is novel and will
solve the problem of lack of knowledge in this field. The study thus aims to further the
understanding of the mechanical properties and microstructure of SLM processed EH36.
A preliminary investigation was first carried out to establish the technical
feasibility of using SLM to process EH36. The process parameters obtained were then
used to further the investigations. Heat treatment process was applied as a possible post
processing technique. Mechanical testing was carried out to characterise its mechanical
properties. The fracture surfaces and microstructures were then studied to characterise
the material.
The results showed that EH36 can be processed using SLM without any visible
cracks. The mechanical properties of as built SLM processed EH36 exhibit very high
tensile strength, but low ductility. The ductility can be improved through tempering heat
treatment process, but at the partial sacrifice of tensile strength. Fractography analysis
also affirmed the lack of ductility in the SLM processed EH36 samples. Finally, the
microstructure showed that fine grain size and martensitic microstructure were the
primary drivers behind its high tensile strength. Tempered samples experience grain
coarsening and phase transformation to a mainly ferritic structure, which led to recovery
in its ductility but a decrease in the tensile strength. A scaled model was fabricated to
validate the results from the microstructure studies, and the findings indicate similar

22
microstructures formed. This demonstrates the repeatability of the developed process
parameters on fabrication of complex joints.
The study contributes to the scientific knowledge with regard to material and
mechanical property characterisation of SLM processed EH36. The findings from the
fractography and microstructural analysis will contribute towards building the
knowledge and facilitate future work on AM of EH36.

23
Chapter One Introduction
1.1 Background
Additive manufacturing (AM), also commonly known as 3D Printing (3DP), is
a manufacturing technique that differentiates itself from subtractive manufacturing (eg.
milling) and formative manufacturing (eg. casting) in that components are formed by
joining materials layer by layer. The American Society for Testing and Materials
(ASTM) International Standards F2792-12a defines AM as a process of joining
materials to make objects from 3D model data, usually layer upon layer [1]. The
standard also provides a structure for grouping AM machine technologies by their
process categories, namely binder jetting, directed energy deposition, material extrusion,
material jetting, powder bed fusion, sheet lamination and vat photopolymerisation.
The concept of AM started as early as 1860, where layer by layer techniques
were used to fabricate photosculpture and molds of topographical relief maps [2, 3].
Subsequently, features of modern day AM techniques could be identified from
published work in the areas of stereolithograhy, direct deposition and powder laser
sintering from 1951 to 1979, but none of these resulted in commercialisation [4]. In
1987, the first commercialised AM unit was introduced. It was based on
stereolithography process, where thin layers of ultraviolet light sensitive liquid polymer
are cured using a laser [5]. The technology then subsequently progressed rapidly within
a span of 30 years, with developments in materials, speed, build size and applications.
Benefits of AM can be categorised into two main branches – technical and
commercial. Under technical benefits, research work has shown that metal parts built
with AM can achieve excellent mechanical properties, and in many cases better than
parts built with conventional methods such as casting or forging. However, this does not

24
hold true for every metallic part built with AM. While AM produced metallic parts
usually have better tensile and hardness properties compared to conventional methods,
the impact toughness and ductility performance may be inferior. This is usually
compensated for when the parts are put through post processing, such as heat treatment,
after the AM process to recover the mechanical properties. Because of its ability to
achieve superior mechanical properties, components conventionally built using casting
or forging can now be re-designed to reduce the thickness and eventually the weight.
Another key technical benefit of AM is the enablement of complex design.
Because AM uses a layer by layer manufacturing technique, it is able to fabricate
components of complex structures that are conventionally impossible to manufacture in
one process. This enables engineers to re-think the design and achieve other benefits
such as weight saving, material reduction, topology optimisation and conformal cooling.
Engineers can also now do part consolidation where assembly parts can be re-designed
as a single component.
The industry has also realised the commercial value of AM technology. With
regard to process automation, because of part consolidation, manufacturing process lines
can now be re-designed to reduce the total number of processes and also to streamline
processes. Hence, it reduces the factory footprint and potentially reduces manpower.
With the concept of digital warehousing, the industry can also potentially reduce the
need for inventories, thus freeing up precious space resource. Many companies have
also acknowledged AM as an enabling technology that has the potential of quickly
producing the prototype in the exact size and material as the end use part, thus providing
a quick way to bring the product to market. In addition, because the technology is
additive in nature, compared against subtractive technology, wastage of material is very
much reduced, which eventually translate to cost savings for the companies.

25
With the above mentioned benefits, AM brings many advantages to the
manufacturing industry. The aerospace industry has adopted it for titanium alloy
components used in military, commercial and passenger aircrafts [6, 7]. The oil and gas
industry used it in component re-design, with one excellent case study in the fabrication
of nozzles [8-10]. The dental and medical industries have adopted it for the fabrication
of dental crowns and implants [11, 12]. However, the potential for adoption of existing
AM technologies in offshore and marine industry, while high, remains industrially
limited within the short term [13].
In shipbuilding operations of the offshore and marine industry, structural
components are usually fabricated through a series of production processes. Due to the
relatively lower levels of technology used in the manufacturing processes, there exists
an opportunity to explore advanced manufacturing technologies for shipbuilding.
The manufacturing technology in shipbuilding has evolved over the years.
Conventionally, iron fasteners and fittings were used to join the planks of wooden
vessels. When shipbuilding materials transited from wood to iron, rivets were used as
fasteners. Present day shipbuilding uses carbon or high tensile steels for ship
construction, utilising welding techniques to join the steels together.
Today, a shipbuilding process is made up of many stages. Raw metal materials
are brought into a shipyard and cut according to the desired shapes and sizes. The cut
parts are then welded to form sub components. Alternatively, these sub components may
be manufactured through casting. The sub components are then welded together to form
larger components. The larger components are then fitted and welded together to form
modules. The modules are then transported to the assembly area and joined together.

26
The machinery is then installed. Further outfitting is done and the final vessel is
completed.
During the earlier stages of shipbuilding, where materials are prepared to form
large components, many intermediate processes are required. These include
transportation, preparation of jigs and fixtures, alignment, surface preparations etc. If
AM can be adopted for the fabrication of such sub components, then the potential to
remove these processes may lead to the streamlining of shipyard production operations.
Furthermore, the manpower associated with these processes may potentially be reduced
and optimised, hence leading to improved manufacturing productivity. The facilities and
space for the originally required equipment may also be reduced. In addition, the
technology may enable engineers and naval architects the provision to re-think
component and ship design to improve overall vessel performance.
The challenges faced during the fabrication stage can be summarised into one
key point – long lead time due to the various processes and required resources involved.
For example, in the fabrication of a joint node casting, the lead time required to produce
the component may be reduced by up to 40% if AM is used in place of casting. The
summary of steps required for fabrication using casting can be seen in Table 1.1.

27
Table 1.1 – Typical fabrication steps for casting [14]
Process Time
Required (Days)
Core and Mould Making 28
Casting 1
Cooling 21
Burning Off Riser and Feeder Head 7
Initial Heat Treatment 14
Fettling, NDT, Weld Repair 49
Machining 35
Final Heat Treatment 3
Final Inspection 7
Total 165
As many of the processes are related to casting, they may not need to be
considered in AM. These include core and mould making, casting, cooling, burning off
riser and feeder head, fettling, NDT and weld repair. This essentially removes a
substantial amount of time from the manufacturing process. We can predict the total
time taken if the same component is to be fabricated using AM technology. This is
shown in Table 1.2.

28
Table 1.2 - Reduced fabrication steps after considering AM
Process Time
Required (Days)
Preparation and Fabrication 21
Removal of Part 1
Machining 35
Heat Treatment 3
Final Inspection 7
Total 67
It is assumed that the total time taken for fabrication of the component using AM
would be 21 days, and the component produced would still require the final processes
such as machining, heat treatment and final inspection. It should be highlighted that in
both cases, design of the part has not been factored into the total time taken. While time
taken for design may be significant for parts that are made only once, repeated
components may re-use the same design. Hence, it would only be fair to assume that the
time taken for design of part should not be factored into the comparison. With all these
assumptions in place, the total time taken for AM to produce the component is very
much reduced from 165 to 67 days. Furthermore, the advantages mentioned above, such
as reduction in manpower, resources required, facilities, footprint and streamlining of
the process, would provide good reasons to explore the technology.
Very recently, the technology has been identified to be used to produce metal
fuel nozzles for gas turbines, a major step towards using the technology for mass-
manufactured parts in the industry. [15, 16] However, there is still limited literature on
AM’s application in the fabrication of structural components in shipbuilding industry.

29
In order for the shipbuilding industry to adopt AM technology, there are many
challenges to overcome. The materials used in shipbuilding are specially formulated and
fabricated for the industry; hence there is a need to establish the availability of AM
materials to be used in offshore and marine industry. Due to the different operating
conditions of ships compared to other industries, there is a need to determine the
mechanical performance of parts built using AM, especially on the tensile strength and
impact toughness values.
In addition to limitations on materials, sizes of the sub components in
shipbuilding are relatively larger than typical metal parts built using AM technology;
hence there is also a need for size consideration. In [17] Wu et al. presented a review on
additive manufacturing machines and their build sizes that are relevant to the offshore
and marine industry. In the review, Wu et al. discussed about various build volumes of
AM systems, from 300 x 350 x 300 mm (x,y,z) which may satisfy the size requirement
for smaller components such as fittings and fasteners, to larger machines with build
envelope up to 800 x 400 x 500 mm (x,y,z) [18], which may be applicable for larger
components such as heat exchangers and manifolds. South African research institute the
Council for Scientific and Industrial Research’s (CSIR’s) National Laser Centre (NLC)
is also developing a large-area system, also known as the Aeroswift project, which is
able to produce components with maximum dimensions of 2 × 0.6 × 0.6 mm (x,y,z)
from metal powders [19].
Therefore, the project will identify a specific component to establish the
technical feasibility of using AM to replace current manufacturing methods, and
eventually complement the existing production process.

30
1.2 Research Motivation and Approach
The potential and technical feasibility of AM technology for offshore and marine
industry is largely unknown and unexplored. Challenges include availability of AM
materials, fabrication processes, mechanical properties of build parts, etc. It is thus
imperative to study and investigate the processes and methodologies of AM technology
suitable for offshore and marine metal parts. Based on the background provided in
section 1.1, the following approach will be used:
- Literature review of materials used in shipbuilding, current commercial AM
processes, properties of parts built using AM.
- Establish the need for research in AM of an identified shipbuilding material
based on the literature review.
- Select an appropriate AM process for the identified material.
- Conduct preliminary investigations to ascertain the feasibility of using AM to
process shipbuilding material.
- Optimise the AM process parameters.
- Characterise AM built part properties.
- Validate properties against industry requirements.
1.3 Research Objectives
The objectives of this study are to establish the technical feasibility of using
selective laser melting (SLM) to process ASTM A131 shipbuilding marine grade steel
and develop an understanding of the material characteristics of the SLM processed steel.
The study will be focussed on the characterisation of the mechanical properties and
microstructure of the SLM processed steel. This knowledge and development of
shipbuilding materials for AM are important to enable for applications for AM of
shipbuilding components.

31
1.4 Thesis Outline
- Chapter 1 introduces the background, motivation and objectives the research.
- Chapter 2 reviews the literature on ASTM A131 marine grade shipbuilding
material, including the chemical composition, traditional processing and
further justifies the selection of EH36 grade of material for the study. The
chapter then further reviews the literature on various additive manufacturing
technologies suitable for processing metallic components. The chapter
finally reviews typical material properties processed by additive
manufacturing.
- Chapter 3 describes the preliminary investigation conducted on using SLM
to process EH36 and outlines the outcome.
- Chapter 4 describes the tensile and impact tests conducted to obtain
mechanical properties of EH36. It also describes the heat treatment process
applied onto the test samples.
- Chapter 5 describes and discusses the results from the fractography analysis
on the tested samples.
- Chapter 6 describes and discusses the results from the microstructural
analysis on the tested samples.
- Chapter 7 describes and compares the results from a fabricated scaled
complex component, against the results from the mechanical test coupons.
- Chapter 8 outlines the conclusions based on the study and suggestions for
future work.

32
Chapter Two Literature Review
Literature review will be conducted on existing metallic materials used in marine
structures. The review will enable the research to streamline into an identified material
to be studied on using AM technology. Since AM is an unexplored technology in the
shipbuilding aspect of the offshore and marine industry, it is important to evaluate all
available AM processes for fabrication of metal components. Each AM process has its
strengths and limitations, hence there is no one AM process that suits all applications.
In the research study, various AM processes will be evaluated to identify the most
suitable process for fabrication of the identified shipbuilding material. One AM process
will eventually be identified and in-depth literature review on this AM process will be
carried out.
With the identified AM process, the research can then focus on developing an
optimised set of parameters to fabricate repeatable components. The choice of
component will be one that represents a huge variety of work performed in shipbuilding,
thus providing a translation of the results to the fabrication of other shipbuilding
components. Mechanical tests according to industry required standards will be
performed to ascertain that the performance of the AM produced part meets the industry
requirements.
The literature review will facilitate the technical feasibility of adopting additive
manufacturing as a fabrication technology for marine structures used in shipbuilding, to
achieve better design and improved performance. Outline of the literature review
includes:
1) To study the metallic materials conventionally used in shipbuilding
2) To identify one material for the research work

33
3) To study the commercial AM processes and evaluate their feasibility in
processing metallic materials
4) To identify a suitable AM process to process the identified material
2.1 Materials
ASTM A131 Shipbuilding Material
A131/A131M − 14: Standard Specification for Structural Steel for Ships covers
structural steel plates, shapes, bars, and rivets intended primarily for use in ship
construction [20]. Material under this specification is available as Ordinary Strength
Steel (Grades A, B, D, and E with a specified minimum yield point of 34 ksi [235 MPa]),
and Higher Strength Steel (Grades AH, DH, EH, and FH with a specified minimum
yield point of 46 ksi [315 MPa], 51 ksi [355 MPa], or 57 ksi [390 MPa]). It is further
categorised according to their tensile strength requirements by denoting the grade with
numbers behind. The corresponding numbers for minimum yield point of 315 MPa,
355MPa, and 390MPa are 32, 36 and 40 respectively (see Table 2.1). While the alphabet
“H” denotes higher strength steel, the other alphabets (A, D, E, F) denote the Charpy V-
notch impact requirements at various test temperatures. Test temperatures at “A” (except
ordinary strength steel, grade A is at 20 ⁰C and B at 0 ⁰C), “D”, “E”, and “F” are 0, -20,
-40, -60 ⁰C respectively (see Table 2.2).

34
Table 2.1 - Tensile requirements for Ordinary-Strength and Higher-Strength Structural Steel in
ASTM A131 [20]
Grade Tensile Strength, ksi
[MPa]
Yield Point,
min, ksi
[MPa]
Elongation in 8
in. [200mm],
min, %
Elongation in 2
in. [50mm],
min, %
Ordinary Strength:
A, B, D, E 58 to 75 [400 to
520]
34 [235] 21 24
Higher Strength:
AH32, DH32,
EH32, FH32
64 to 85 [440 to
590]
46 [315] 19 22
AH36, DH36,
EH36, FH36
71 to 90 [490 to
620]
51 [355] 19 22
AH40, DH40,
EH40, FH40
74 to 94 [510 to
650]
57 [390] 19 22

35
Table 2.2 - Charpy V-notch impact requirements for Ordinary-Strength and Higher-Strength
Structural Steel in ASTM A131 [20]
Grade Test Temperature,
⁰C
Average Absorbed Energy, min, J
t ≤ 50 mm t > 50mm
t ≤ 7 mm
t > 70mm
t ≤ 100mm
A 20 34 41
B 0 27 34 41
AH32 0 31 38 46
AH36 0 34 41 50
AH40 0 39 46 55
D -20 27 34 41
DH32 -20 31 38 46
DH36 -20 34 41 50
DH40 -20 39 46 55
E -40 27 34 41
EH32 -40 31 38 46
EH36 -40 34 41 50
EH40 -40 39 46 55
FH32 -60 31 38 46
FH36 -60 34 41 50
FH40 -60 39 46 55
36
Table 2.3 - Chemical requirements for Higher-Strength Structural Steel in ASTM A131 [20]
Element Chemical Composition, % max unless otherwise specified
Grades AH/DH/EH32, AH/DH/EH36,
AH/DH/EH40
Grades FH32/36/40
Carbon, C 0.18 0.16
Manganese, Mn 0.90 – 1.60 0.90 – 1.60
Silicon, Si 0.10 – 0.50 0.10 – 0.50
Phosphorous, P 0.035 0.025
Sulphur, S 0.035 0.025
Aluminium (acid soluble), min, Al 0.015 0.015
Columbium, Cb/Niobium, Nb 0.02 – 0.05 0.02 – 0.05
Vanadium, V 0.05 – 0.10 0.05 – 0.10
Titanium, Ti 0.02 0.02
Copper, Cu 0.35 0.35
Chromium, Cr 0.20 0.20
Nickel, Ni 0.40 0.40
Molybdenum, Mo 0.08 0.08
Nitrogen, N - 0.009
2.1.1.1 Chemical Composition
The requirements for chemical composition are given in Table 2.3. The chemical
composition of higher strength steels may vary for different product thicknesses to meet
particular mechanical property requirements. Usually, they have a manganese (Mn)
content of up to 2.0 weight (wt)% in combination with very low carbon content (< 0.10
wt% C) and also minor additions of alloying elements such as niobium (Nb), vanadium
(V), titanium (Ti), molybdenum (Mo) and boron (B). Rosado et al. [21] and Aung et al.
[22] presented on the roles of alloying elements in high strength steel, shown in Table
2.4 and Table 2.5. The main function of the alloying additions is the strengthening of
ferrite through the following mechanisms: grain refinement, solid solution and
precipitation hardening. Solid solution hardening is closely related to the alloy element

37
content, whilst precipitation hardening and grain refinement depend on the interaction
between chemical composition and Thermo-Mechanical Controlled Process (TMCP).
Thus, each individual element coupled with the cooling rate will determine the type and
volume fraction of phases that will form in a given steel processed under given
conditions [21].
Williams et al. presented some aspects of the advances in alloy design and
properties that have taken place for high strength steel [23]. In relation to the chemical
composition, some strategic alloy combinations extracted from his work is summarised
in Table 2.6.

38
Table 2.4 - Major effects of alloying elements in high strength steel [21]
Element (wt%) Effect and reason of adding
C
(0.03 - 0.10)
Matrix strengthening (by precipitation)
Mn
(1.6 - 2.0)
Delays austenite decomposition during accelerated cooling
process (increasing hardenability);
Substitutional strengthening effect;
Decreases ductile to brittle transition temperature;
Indispensable to obtain a fine-grained lower bainite
microstructure.
Si
(up to 0.6)
Improvement in strength (solid solution).
Nb
(0.03 - 0.06)
Reduces temperature range in which recrystallization is possible
between rolling passes;
Retard recrystallization and inhibit austenite grain growth
(improves strength and toughness by grain refinement).
Ti
(0.005 - 0.03)
Grain refinement by suppressing the coarsening of austenite grains
(TiN formation);
Strong ferrite strengthener;
Fixes the free Ni (prevent detrimental effect of Ni on
hardenability).
Ni
(0.2 - 1.0)
Improves the properties of low-carbon steels without impairing
field weldability and low temperature toughness;
In contrast to Mg and Mo, Ni tends to form less hardened
microstructural constituents detrimental to low temperature
toughness in the plate (increases fracture toughness).
V
(0.03 - 0.08)
Leads to precipitation strengthening during the tempering
treatment;
Strong ferrite strengthener.
Mo
(0.2 - 0.6)
Improves hardenability and thereby promotes the formation of the
desired lower bainite microstructure.

39
Table 2.5 - Other alloying elements in high strength steel [22, 24]
Element Effect and reason of adding
Cu Increases strength by ferrite strengthening.
Al Control of grain size.
B Improve hardenability of quenched and tempered grades.
Ca Helps to control the shape of non-metallic inclusions, thereby
improving toughness.
Cr Wear resistance, corrosion resistance and improved hardenability.
N Economically improves strength but is accompanied by drop in
notch toughness (promotes brittle cleavage fracture), hence
limited to 0.02%.

40
Table 2.6 - Strategy alloying combinations to improve strength and toughness [23]
Alloying
combination
Purpose
V+Mo+Nb To produce secondary hardening by forming carbides, nitrides
and carbonitrides
Ni+Mo Effective addition of microstructure refinement by suppressing
austenite recrystallization during controlled rolling and steel
strengthening by precipitation hardening and enhancement of
hardenability
Ni+B Synergistic improvement of hardenability
Nb+V To increase strength properties. However, steels based on this
combination may require relatively high carbon equivalent
design, which can compromise the capability for preheat-free
field welding
Mo+Nb+Ti Effective in achieving the strength requirements of high Mn
steels
A significantly finer ferrite grain size
Low temperature transformation constituents such as bainite
containing acicular carbide needles in leaner alloyed steels and
martensite/austenite in highly alloyed steels;
Enhances precipitation hardening. A synergistic benefit
attributed to Ti addition.
Equation (2.1) is known as the Carbon Equivalent (CE) formula. It calculates the
CE content to determine properties of alloy when the material (usually ferrous) contains
more than just Carbon. It is usually used in welding to determine the welding processes
required to avoid defects. It is also used in heat treatment and casting applications of
cast iron. The CE content stipulated under the ASTM A131 standards range from 0.36
to 0.42 [20]. For the whole list of CE content, please refer to Table 2.7.

41
𝐶𝑒𝑞 = 𝐶 +𝑀𝑛
6+
𝐶𝑟 + 𝑀𝑜 + 𝑉
5+
𝑁𝑖 + 𝐶𝑢
15(%) (2.1)
Table 2.7 - Carbon Equivalent for Higher-Strength Structural Steel Produced by TMCP from
ASTM A131 [20]
Grade Carbon Equivalent , max, %
Thickness (t ), mm
t ≤ 50 mm t > 50 mm
t ≤ 100 mm
AH32, DH32, EH32, FH32 0.36 0.38
AH36, DH36, EH36, FH36 0.38 0.40
AH40, DH40, EH40, FH40 0.40 0.42
2.1.1.2 Steel Transformation
An iron-carbon (Fe-C) phase diagram (see Figure 2.1) is often used for the basic
understanding of the microstructures of the steel. It illustrates the effect of dissolved
carbon in iron, and is critical for developing heat treatment regimes for large-scale
production of cast irons and steel. It describes the primary formation of allotropes of
iron, namely α-Fe (ferrite, bcc), γ-Fe (austenite, fcc) and δ-Fe (bcc), and also describes
the intermediate phase Fe3C (cementite) at the other end of the diagram.
Ae1, Ae2, Ae3 and Acm indicate the temperatures at which phase changes occur:
they are arrest points for equilibria detected during thermal analysis. Slow cooling
enables austenite with the composition 0.8% C to decompose eutectoidally at the
temperature Ae1 and form the microconstituent pearlite, a lamellar composite of soft,
ductile ferrite (initially 0.025% C) and hard, brittle cementite (6.67% C). Slow cooling
of austenite with hypo-eutectoid (<0.8% C) and hyper-eutectoid (>0.8% C)
compositions results in a microstructure of pearlite embedded in ferrite and cementite,
respectively. On the other hand, quenching of austenite from a temperature above Ae3
forms a hard metastable phase known as martensite. [25]

42
Figure 2.1 - Iron-carbon phase diagram [25]
Temperature and composition ‘windows’ for some important heat treatment
operations have been superimposed upon the phase diagram in Figure 2.1. Heating may
be carried out above or below the eutectic temperature for softening. Below the Ae1 is a
subcritical anneal which recrystallizes the ferrite but leaves the pearlite unaffected. This
process anneal is usually applied to plastically deformed materials and is the most
economical procedure. Heating above the eutectoid temperature recrystallizes the steel
and results in a completely new γ-grain structure. Depending on time and temperature a
refined grain structure can be produced with a corresponding improvement in yield
strength and properties. The steel may also be air cooled (normalized) or furnace cooled
(full annealing) to control the resultant grain size. A further heat treatment for medium-
and high-carbon steels is a spheroidizing anneal during which with time the cementite

43
plates adopt a more spherical shape to reduce their surface energy. This improves the
cold workability of the steel. [25]
In the iron–carbon system the γ-phase, austenite, which is a solid solution of
carbon in fcc iron, decomposes on cooling to give a structure known as pearlite,
composed of alternate lamellae of cementite (Fe3C) and ferrite. However, on very rapid
cooling conditions, a metastable phase called martensite, which is a supersaturated solid
solution of carbon in ferrite, is produced. The microstructure of such a transformed steel
is not homogeneous but consists of plate-like needles of martensite embedded in a
matrix of the parent austenite. Apart from martensite, another structure known as bainite
may also be formed if the formation of pearlite is avoided by cooling the austenite
rapidly through the temperature range above 550°C, and then holding the steel at some
temperature between 250°C and 550°C. A bainitic structure consists of plate-like grains
of ferrite, somewhat like the plates of martensite, inside which carbide particles can be
seen.

44
Figure 2.2 - Time–temperature transformation curves for (a) eutectoid, (b) hypo-eutectoid and (c)
low-alloy (e.g. Ni/Cr/Mo) steels
A time–temperature transformation (TTT) curve as shown in Figure 2.2 plots the
time necessary at a given temperature to transform austenite of eutectoid composition
to one of the three structures, namely pearlite (when the steel will be soft and ductile),
bainite or martensite (when the steel will be hard and brittle). From the TTT curve it can
be seen that just below the critical temperature, A1, the rate of transformation is slow

45
even though the atomic mobility must be high in this temperature range. This is because
any phase change involving nucleation and growth (e.g. the pearlite transformation) is
faced with nucleation difficulties, which arise from the necessary surface and strain
energy contributions to the nucleus. Of course, as the transformation temperature
approaches the temperature corresponding to the knee of the curve, the transformation
rate increases. The slowness of the transformation below the knee of the TTT curve,
when bainite is formed, is also readily understood, since atomic migration is slow at
these lower temperatures and the bainite transformation depends on diffusion. The lower
part of the TTT curve below about 250–300°C indicates, however, that the
transformation speeds up again and takes place exceedingly fast, even though atomic
mobility in this temperature range must be very low. For this reason, it is concluded that
the martensite transformation does not depend on the speed of migration of carbon
atoms and, consequently, it is often referred to as a diffusionless transformation. The
austenite only starts transforming to martensite when the temperature falls below a
critical temperature, usually denoted by Ms. Below Ms the percentage of austenite
transformed to martensite is indicated on the diagram by a series of horizontal lines.
Martensite, the hardening constituent in quenched steels, is formed at
temperatures below about 200°C. The regions of the austenite which have transformed
to martensite are lenticular in shape and may easily be recognized by etching or from
the distortion they produce on the polished surface of the alloy. The lenticular shape of
a martensite needle is a direct consequence of the stresses produced in the surrounding
matrix by the shear mechanism of the transformation and is exactly analogous to the
similar effect found in mechanical twinning. The strain energy associated with
martensite is tolerated because the growth of such sheared regions does not depend on
diffusion, and since the regions are coherent with the matrix they are able to spread at
great speed through the crystal. The large free energy change associated with the rapid
formation of the new phase outweighs the strain energy, so that there is a net lowering
of free energy. [26]
2.1.1.3 Steel Processing
ASTM A131 higher strength steels are conventionally fabricated through the
Thermo-Mechanical Controlled Process (TMCP). It was developed to meet the demand

46
for strength and toughness in high strength steel, through grain refinement as the most
effective metallurgical mechanism. After the steel is processed through rolling, a
cooling process, known as accelerated cooling process (AcC), is performed to meet the
higher requirements for strain based design, with respect to strain hardenability,
toughness as well as high strength [27]. Alternatively, the steel plate may first be hot
rolled and soaked (held at a temperature until the desired microstructural changes take
place) and then submitted to an inline quenching and tempering (QT) process. Such QT
treatment is performed to produce a bainite-martensite microstructure without applying
AcC process. By tempering it is possible to reduce the brittleness of martensite and
improve ductility and toughness [28].
Shinmiya et al. [29] described an improved conceptual TMCP with the addition
of an extra process known as the Online Heat-treatment Process (HOP). It was
developed in order to obtain not only high strength by transformation strengthening but
also high toughness by refinement of transformed microstructure, resulting in a
combination of high strength/high toughness steel with reduced alloying elements. The
microstructure consists of a bainitic matrix and finely dispersed martensite-austenite
constituent (MA) as second phase with a volume fraction above 7%. The process
consists of an advanced accelerated cooling device, with the purpose of reaching highest
cooling rates and an induction heating equipment for HOP, with high heating capacity
to heat thick plates up to 40 mm. This combination enabled the new ‘unconventional’
TMCP to reach a novel metallurgical controlling process that cannot be achieved by the
‘conventional’ TMCP.
Figure 2.3 illustrates a schematic TMCP diagram for ‘conventional’ and
‘unconventional’ production processes and some morphological changes in the
microstructure. In the ‘conventional’ TMCP process, the steel plate is controlled rolled,
accelerated cooled and then air-cooled. On the other hand, in the ‘unconventional’
TMCP process, the plate is rapidly reheated by the induction coils immediately after
accelerated cooling and followed by air cooling. Rosado presented an overview of the
relevant parameters of the TMCP [21], shown in Table 2.8. Figure 2.3(b) shows a
schematic explanation of the microstructural changes promoted during HOP process.
Both TMCP processes are typically performed at strictly controlled and
relatively low temperatures (i.e. between Tnr and T Ar3) in order to produce very fine

47
grains. More clearly, the last hot rolling steps are performed below the non-
recrystallization temperature (Tnr). As a result, the severely deformed (‘pancaked’)
austenite grains do not completely recrystallize, which provides a large number of
nucleation sites for the transformation of austenite to ferrite or bainite. Investigation of
AcC conditions reports that lowering both, starting and stopping temperatures promote
formation of ferrite and martensite/austenite constituents respectively [28, 29].
Figure 2.3 - (a) TMCP diagram for 'conventional' vs 'unconventional' processing; (b)
microstructural changes promoted by HOP [29]

48
Table 2.8 - Overview of TMCP stages, typical temperatures and features [21]
Processing Parameters Range Features
Rolling Reheat Temp. (⁰C) 1140 – 1180 Dissolution of precipitates;
Produce a fine, polygonal
austenitic grain;
Maintain within the range
of the Tnr;
Reduction ratio (%) 40 – 75
Finishing Temp. (⁰C) 760 – 800
AcC Start Temp. (⁰C) 730 – 760 Enhances grain refinement
of ferrite;
Prevents formation of
pearlite during cooling;
Tempering Cooling rate (⁰C/s) 20 – 50
Stop Temp. (⁰C) 150 – 400
Heat Temp. (⁰C) 600 Reduce excess hardness and
residual stresses.
2.1.1.4 Selection of Grade of ASTM A131 Steel
The ASTM A131 group of steels is specifically designed with TMCP as the
manufacturing process. The steel properties, process parameters and guidelines are thus
unique to those typically processed by TMCP. For a selection of the grade of steel under
ASTM A131 to be processed by AM, it is understood that this existing ASTM standard
is not suitable, and a different set of material properties and parameters should be
referenced. However, there is insufficient literature on AM processed ASTM A131
steels available that can be referenced for this study. Hence, a practical approach would
be to use the existing standard as-is, as a starting point to develop preliminary results
and findings, and to lay the foundation for future work, which may then include
developing an optimised set of properties and parameters for using AM to process the
steels.
There are several grades of steel under the ASTM A131 standard. When
selecting the specific grade of material for this research, it is important to consider the
scalability of the research outcome. The research findings must be easily translated to

49
other grades of materials in order to facilitate the research of the rest of the materials
under the ASTM A131 standard. In order to identify the grade of material to conduct
the research work, it is hence proposed to study the ways to categorise the various grades.
Table 2.1 shows the tensile requirements for ordinary strength and higher strength
grades of steels under the ASTM A131 standards. Since higher strength grades of steels
have higher tensile values, it is more often selected for the ship hull structural steels [30].
According to Table 2.3, the types of steels can also be categorised by their chemical
composition into two main groups, with the AH, DH and EH grades in one category,
and the FH grades in the other category. This can also be cross referenced with Table
2.2, where lower temperature tests equate to better performing impact toughness values.
However, steels with FH grades are specifically used for operating regions where
temperatures are extremely low, for example in the Northern and Artic regions, where
the materials are subjected to severe climatic conditions [31, 32]. FH grades are not
often chosen during the materials selection process because these operating regions
constitute only a minority of the global footprint [33]. Out of the remaining AH, DH
and EH, it is thus imperative to select the more stringent one, which will be the EH grade
of steel. The selection argument can thus be summarised and shown in Table 2.9.
Table 2.9 - Selection of grade of steel under ASTM A131
Minimum Yield Requirements (MPa)
Ordinary-Strength
Steel Higher-Strength Steel
235 315 355 390
Charpy V-
notch Impact
Requirements
(Average
absorbed
energy, t ≤ 50
mm, J)
20 A
(NA)
0 B
(27)
AH32
(31)
AH36
(34)
AH40
(39)
-20 D
(27)
DH32
(31)
DH36
(34)
DH40
(39)
-40 E
(27)
EH32
(31)
EH36
(34)
EH40
(39)
-60
FH32
(31)
FH36
(34)
FH40
(39)
Legend: Not Applicable

50
Eliminated based on discussion
Grades A, B, D, E, AH, DH and FH are eliminated based on the discussion above.
The final selection from the remaining grades EH32, EH36 and EH40 is then determined
by the highest strength, which then narrows it down to EH40. However, with reference
to the use of high tensile strength steel for shipbuilding, EH32 and EH36 are more
commonly used than EH40 [34]. Hence, the mechanical requirements of EH36 was
eventually identified as the benchmark properties to be referenced for this research.
2.2 Additive Manufacturing Technologies
Under the ASTM F2792 – 12a Standard Terminology for Additive
Manufacturing Technologies, the technology can be categorised by their processes into
seven main groups. Table 2.10 below shows the process categories.
Table 2.10 - AM process categories
Process Description
Binder Jetting An additive manufacturing process in which a liquid bonding
agent is selectively deposited to join powder materials.
Directed Energy
Deposition (DED)
An additive manufacturing process in which focused thermal
energy (an energy source (e.g., laser, electron beam, or
plasma arc) that is focused to melt the materials being
deposited) is used to fuse materials by melting as they are
being deposited.
Material Extrusion An additive manufacturing process in which material is
selectively dispensed through a nozzle or orifice.
Material Jetting An additive manufacturing process in which droplets of
build material are selectively deposited.
Powder Bed Fusion An additive manufacturing process in which thermal energy
selectively fuses regions of a powder bed.

51
Sheet Lamination An additive manufacturing process in which sheets of
material are bonded to form an object.
Vat
Photopolymerisation
An additive manufacturing process in which liquid
photopolymer in a vat is selectively cured by light-activated
polymerisation.
Based on commercially available data, Louis Davis, AM consultant and director
of marketing at Stone Interactive Group, has created two diagrams setting out the
various machines and processes now available in AM [35]. The diagrams show
industrial grade metal additive manufacturing processes (Figure 2.4) and machines
(Figure 2.5). Louis categories metal additive manufacturing into four main branches,
namely Powder Bed Fusion, Directed Energy Deposition, Binder Jetting and Sheet
Lamination.

52
Figure 2.4 - Industrial-Grade Metal Additive Manufacturing Processes [35]

53
Figure 2.5 - Industrial-Grade Metal Additive Manufacturing Machines [35]
Each of the technologies has their own strengths and limitations, and there is no
single technology that can suit all applications. As discussed in Chapter Error! R
eference source not found., the scope of the research project will be limited to ASTM

54
A131 EH36 high tensile strength steel. A preliminary literature review will first be
conducted to identify the suitable AM processes for EH36 material.
Regardless of which AM process, the concept of AM are similar throughout and
may be summarised as follows. The process starts with a 3D CAD model, either by
scanning a physical object or through creating a 3D model using a CAD software. The
3D CAD model is then sent to the AM machine where it will be mathematically sliced
into layers. The AM machine will then begin creating the predetermined shape layer by
layer according to the sliced data. The layers will build up to form the 3D shape required,
and at the end of the process, the object will be formed. In the following sections, brief
descriptions of each category will be discussed with relevance to producing metal
components.
2.2.1 Binder Jetting
In binder jetting, powder is selectively bonded together through deposited
binding agent, layer by layer (see Figure 2.6). The print head strategically drops binder
into the powder. The job box lowers and another layer of powder is then spread and
binder is added. The end result will be a cube of powder with the solid bonded
component inside. The part will then be removed from the cube of powder and post-
processed with an air compressor to remove any residual powder. The end product will
form a net shape 3D component, which is useful for prototyping purposes. One of the
commonly known binder jetting technology is Three-Dimensional Printing (3DP),
which was invented at MIT and has been licensed to more than five companies for
commercialization [36]. The advantages of 3DP process includes – parts are self-
supporting in the powder bed so that support structures are not needed; parts can be
arrayed in one layer and stacked in the powder bed to greatly increase the number of
parts that can be built at one time; assemblies of parts and kinematic joints can be
fabricated since loose powder can be removed between the parts.

55
Figure 2.6 - Schematic of binder jetting process [36]
In order to use binder jetting technology to produce metal parts, the completed
component may then be infiltrated with an appropriate material and sintered as an
additional post process. Hot isotropic pressing is sometimes applied to achieve the
desired mechanical properties. One example of such machine is the Ex One 3D printer.
Applications of this machine include prototypes of metal parts and some low-volume
manufacturing, as well as tooling. In the tooling area, Ex One is usually used to produce
conformal cooling in injection moulds. In conformal cooling, cooling channels are
routed close to the surfaces of the part cavity, particularly where hot spots are predicted.
Using conventional machining processes, cooling channels are drilled as straight holes.
With AM processes, however, cooling channels of virtually any shape and configuration
can be designed into tools.
However, the relative density of built parts using this method is generally poorer.
Bai et al. demonstrated using a binder jetting AM process (ExOne R2) to fabricate green
parts made of high purity copper powder [37]. Once printed, the green part was sintered
under a reducing atmosphere to create copper parts in pure metal form. The resulting
sintered part had a relative density of 85%. The author attributed this to the relatively
coarse powder and loose packing of the powder bed.
The overall cost of building metal components using this technology as
compared to other AM technologies is also relatively lower, attributed to four main
reasons – lower process energy, lower cost of material, lack of need for support material

56
and recycling of unused powder. Components produced by binder jetting generally have
finer resolution in the z-direction. However, the surface finish may be generally poorer
[38], and will usually require post processing to achieve better mechanical properties.
The process is typically accurate to ±0.125 mm.
2.2.2 Direct Energy Deposition
In DED AM process, a focussed thermal energy is used to fuse materials together
by melting. It is normally used to process metallic materials. The thermal energy may
be based on laser, electron beam or plasma arc. The materials may come in the form of
powder or wire. Wire, as compared to powder, has less accuracy but is more material
efficient. The method of material melting varies between a laser, an electron beam or
plasma arc, all within a controlled environment that has reduced oxygen levels. In the
case of electron beam, the environment will be a vacuumed one.
As shown in Figure 2.7, in a typical DED process, material is deposited via a
nozzle. Thermal energy melts the deposited material with the substrate material to form
a melt pool. The material is deposited according to the sliced CAD data and the trail of
melt pool quickly solidifies to form the desired geometry. This technology may be
commonly used to add materials to existing parts, making it very useful for adding
features to components built by conventional methods (eg casting), but it can also be
used to build up parts to form net shape components. Recent hybrid approaches have
seen DED combined with CNC milling to achieve an accurate end use part that promises
more extensive adoption of this technology in the future.

57
Figure 2.7 - Schematic of powdered based direct energy deposition process [39]
The kinetic energy of powder particles being fed into the melt pool is greater
than the effect of gravity on these powders during flight. As a result, nonvertical
deposition is just as effective as vertical deposition. Multi-axis deposition head motion
is therefore possible and, indeed quite useful. In particular, if the substrate is very large
and/or heavy, it is easier to accurately control the motion of the deposition head than the
substrate. Conversely, if the substrate is a simple flat plate, it is easier to move the
substrate than the deposition head. Whilst in most cases, it is the arm that moves and the
object remains in a fixed position, this can be reversed and a platform could be moved
instead and the arm remain in a fixed position. The choice will depend on the exact
application and object being printed. Thus, depending on the geometries desired and
whether new parts will be fabricated onto flat plates or new geometry will be added to
existing parts, the optimum design will change.
Material cooling times are very fast, typically between 103 to 108 K/s [40, 41].
Depending upon the material or alloy being deposited, these high cooling rates can
produce unique solidification grain structures and/or non-equilibrium grain structures
which are not possible using traditional processing. The cooling time will in turn affect
the final grain structure of the deposited material, although the overlapping of material
must also be considered, where the grain structure is changed as the overlapping can

58
cause re-melting to occur, resulting in a uniform but alternating micro-structure. At
lower cooling rates (when using higher beam powers or lower traverse speeds), the grain
features grow and look more like cast grain structures [36].
Based on a literature study by Gu et al. [42], metallic parts processed by DED
generally have excellent tensile and yield properties, and in most cases comparable to
that produced by other AM processes. However, the porosity in most cases are about
generally higher than powder bed processes.
2.2.3 Material Extrusion
In material extrusion, material is drawn through a nozzle, where it is heated and
is then deposited layer by layer (Figure 2.8). The nozzle can move horizontally and a
platform moves up and down vertically after each new layer is deposited. Advantages
of the material extrusion process include use of readily available ABS plastic, which can
produce models with good structural properties, close to a final production model. In
low volume cases, this can be a more economical method than using injection moulding.
However, the process requires many factors to control in order to achieve a high quality
finish. The nozzle which deposits material will always have a radius, as it is not possible
to make a perfectly square nozzle and this will affect the final quality of the printed
object. Accuracy and speed are low when compared to other processes and the quality
of the final model is limited to material nozzle thickness. By far the most common
extrusion-based AM technology is Fused Deposition Modeling (FDM), produced and
developed by Stratasys, USA.

59
Figure 2.8 - Schematic of material extrusion additive manufacutring (Fused Deposition Modelling)
[43]
One of the limitations of this technology is speed. The speed of an FDM system
is reliant on the feed rate and the plotting speed. Feed rate is also dependent on the ability
to supply the material and the rate at which the liquefier can melt the material and feed
it through the nozzle. If the liquefier were modified to increase the material flow rate,
most likely it would result in an increase in mass. This in turn would make it more
difficult to move the extrusion head faster. For precise movement, the plotting system
is normally constructed using a lead-screw arrangement. Lower cost systems can use
belt drives, but flexing in the belts make it less accurate and there is also a lower torque
reduction to the drive motor [36].
The FDM technology has established a prominent position in AM since its
inception about two decades ago. The technology has attained the market leadership in
terms of the largest number of units installed in plastics-based AM [43]. The main
strength of FDM technology is the wide range of high strength engineering plastics it
can use to create parts not only for design verification, but also for functional testing
and end-use applications in tooling and casting. The simplicity and reliability of the
technology has also prompted development of several others non-filament-type
extrusion-based FDM systems, and it has also lead to the proliferation of several low-
cost FDM-type 3D printers for domestic and hobbyist consumers. The FDM process has
been extensively used by research and development community at universities and
research organizations to further enhance the process and part quality, and to develop
new materials for a variety of new engineering applications. The technology offers a

60
distinct advantage in creating biomedical implants and TE scaffolds of desired
characteristics and this has also led to the development and testing of several
biomaterials for the FDM technology.
It is expected that future research in FDM process will be directed to increasing
the build speed of this process, improving surface texture and development of new
materials, plastics, composites, and biomaterials in filament form for specific
commercial applications. In speeding up the process, research could involve the
incorporation of multiple extrusion nozzles, or incorporating intelligent build strategies
where the interior of the part can be filled faster by thicker extruded rods and outer
surfaces by thinner rods. Research in new FDM materials will be dictated by the
intended applications and the success in rapid and cost-effective production of durable
filaments suitable for FDM processing conditions.
When considering this AM process for metal fabrication, the greatest limitation
is in the material that can be processed. Since material extrusion works by melting the
feedstock before depositing onto the substrate, the heating element must be able to melt
metals of more than 1000 degree Celsius melting temperature. This method has been
demonstrated on metals with very low melting temperature, such as Gallium with a
melting temperature of 86 degree Celsius [44]. Alternatively, special preparations of the
feedstock may also allow for the use of this process for metal fabrication. In the work
by Wu et al. [45], commercially available stainless steel 17-4PH powder and special in-
house developed binder were used. After coating the powder with stearic acid, by ball
milling, the powder was mixed with the binder from the mixer to create the
compounding mixture. Parts produced by this method however may have inferior
properties compared to the actual steel.
Another type of material extrusion based metal AM uses special profiles (rods)
made up of metal or ceramic powder with a thermoplastic binder system. This method
is used by two companies based in the USA, Desktop Metal Inc. and Markforged Inc.
The profiles are fit into cartridges and are then fed into a plasticizing unit where the
highly-filled thermoplastic composite is soft enough for extrusion. The soft material
accumulates in a reservoir and finally a mechanical drive system (e.g., plunger) pushes
the soft material and deposits it onto the building platform in a layer-by-layer manner.
In general, they meant to be used for shaping parts that eventually will be made out of

61
only metal or ceramic, thus the rods have a large amount of powder and the printed parts
will require to be sintered to obtain a dense part [46]. This method has shown to be
successful in various metallic materials, including stainless steel, high-performance
steel, copper and tool steel,
2.2.4 Material Jetting
In material jetting, build material and support material are selectively deposited
onto the x-y plane using print heads (similar to a document inkjet printer). When the
layer is complete, the build platform moves in the z direction by a pre-determine layer
thickness, and the process repeats until the part is completed. Droplets are formed and
positioned into the build surface, in order to build the object being printed, with further
droplets added in new layers until the entire object has been made. The nature of using
droplets, limits the number of materials available to use. Polymers and waxes are often
used and are suitable due to their viscous nature and ability to form drops. The polyjet
technology from Objet Geometries is one such system that utilises this technology (see
Figure 2.9Figure 2.9 - Schematic of material jetting process (Polyjet from Objet
Geometries) [36]).
Figure 2.9 - Schematic of material jetting process (Polyjet from Objet Geometries) [36]

62
The most common material used in material jetting is a liquid photopolymer.
This material will remain a liquid until exposed to Ultra Violet (UV) light, upon which
it hardens into a solid. UV lights are typically attached to either side of the print head,
so that the material will solidify the instant it is laid down. There is recent development
work conducted on using material jetting technology to manufacture metal components.
Similar to resin based material jetting, the technology forms parts from liquid metals,
rather than the powder metals that are used by current AM technologies [47, 48].
Literature on using this method to fabricate metal components is largely limited,
especially in the context of commercial applications. Zambelli et al. [49] provided a
good review of development work using material jetting technology for micro scale
metallic material deposition, but concluded that the techniques cannot be applied
without expert knowledge, and the majority of the research is still focussed on the
understanding and optimisation of the single processes. Perhaps XJet’s NanoParticle
Jetting technology is the closest to realising metallic material deposition using material
jetting, but it is usually used for small component fabrication, and will still require
debinding and sintering [50].
2.2.5 Powder Bed Fusion
Powder bed fusion (PBF) is perhaps one of the most common methods for
building metal components that can be commercially used. The process involves the
selective fusing of materials in a powder bed. The technique fuses parts of a layer, then
the working platform moves downwards, and another layer of powder is added. The
process is repeated until the component has been built up. PBF uses either a laser,
electron beam or a thermal print head to melt and fuse material powder together. In the
process, the powder can either be sintered or fully melted. A number of proprietary
processes have been developed using various combinations of energy source and
sintering or melting mechanism. These are described below.

63
2.2.5.1 Selective Laser Sintering
Selective laser sintering (SLS) machines are made up of three components – a
heat source to fuse the material, a method to control this heat source and a mechanism
to add new layers of material over the previous. SLS fuses thin layers of powder
(typically ~0.1 mm thick) which have been spread across the build area using a counter-
rotating powder levelling roller. The part building process takes place inside an enclosed
chamber filled with nitrogen gas to minimize oxidation and degradation of the powdered
material. The powder in the build platform is maintained at an elevated temperature just
below the melting point and/or glass transition temperature of the powdered material
[36]. Infrared heaters are placed above the build platform to maintain an elevated
temperature around the part being formed; as well as above the feed cartridges to pre-
heat the powder prior to spreading over the build area. In some cases, the build platform
is also heated using resistive heaters around the build platform. This pre-heating of
powder and maintenance of an elevated, uniform temperature within the build platform
is necessary to minimize the laser power requirements of the process (when pre-heating,
less laser energy is required for fusion) and to prevent warping of the part during the
build due to non-uniform thermal expansion and contraction (curling).
The process begins by applying a layer of powder and then preheating it. Once
the appropriate powder layer has been formed and preheated, a focused CO2 laser beam
is directed onto the powder bed and is moved using galvanometers in such a way that it
thermally fuses the material to form the slice cross-section. Surrounding powder remains
loose and serves as support for subsequent layers, thus eliminating the need for the
secondary supports which are necessary for many other AM processes. After completing
a layer, the build platform is lowered by one layer thickness and a new layer of powder
is laid and levelled using the counter-rotating roller. The beam scans the subsequent
slice cross-section. This process repeats until the complete part is built. A cool-down
period is typically required to allow the parts to uniformly come to a low-enough
temperature that they can be handled and exposed to ambient temperature and
atmosphere. If the parts and/or powder bed are prematurely exposed to ambient
temperature and atmosphere, the powders may degrade in the presence of oxygen and
parts may warp due to uneven thermal contraction. Finally, the parts are removed from
the powder bed, loose powder is cleaned off the parts, and further finishing operations,
if necessary, are performed. Please refer to Figure 2.10 for the schematics.

64
Figure 2.10 - Schematic of Selective Laser Sintering process [36]
2.2.5.2 Selective Laser Melting
Selective Laser Melting (SLM) is similar to SLS, except it is commonly used to
achieve metal components with high relative density [51]. However, as compared to
SLS, SLM is often faster, but requires the use of an inert gas, has higher energy costs
and typically has a poor energy efficiency of 10 to 20 % [36]. The process uses either a
roller or a blade to spread new layers of powder over previous layers. A hopper or a
reservoir below or aside the bed provides a fresh material supply. SLM research in the
late 1980s and early 1990s by various research groups was mostly unsuccessful.
Compared to polymers, the high thermal conductivity, propensity to oxidize, high
surface tension, and low absorptivity of metal powders make them significantly more
difficult to process than polymers. Today, the use of lasers with wavelengths better
tuned to the absorptivity of metal powders was one key for enabling SLM of metals.
The other key enablers for SLM, compared to SLS, are different laser scan patterns, the

65
use of f-theta lenses to minimize beam distortion during scanning, and low oxygen, inert
atmosphere control.
Kruth et al. described SLM as a technology that has been developed to produce
near full dense objects, with mechanical properties comparable to those of bulk
materials [52]. In SLM, the metallic powders are fully melted. Kruth et al. also presented
literature on using SLM to process single material powder, alloy powder, and powder
mixture, and concluded that almost 100% relative part density can be achieved, with
mechanical properties comparable to bulk material except ductility, which is strongly
reduced.
2.2.5.3 Selective Heat Sintering
Selective Heat Sintering (SHS) uses a heated thermal printhead to fuse powder
material together. As before, layers are added with a roller in-between fusion of layers.
The process is used in creating concept prototypes and less so structural components.
The use of a thermal print head and not a laser benefits the process by reducing
significantly the heat and power levels required. Baumers et al. presented SHS as a low
cost alternative to SLS for the additive deposition of polymer objects [53].
Thermoplastic powders are used and act as support material. Hence, this process is not
suitable to process metallic components.
2.2.5.4 Electron Beam Melting
In Electron Beam Melting (EBM), layers are fused using an electron beam to
melt metal powders (see Figure 2.11). Due to the use of electron beam, the chamber
usually requires a vacuum environment. EBM provides models with very good strength
properties due to an even temperature distribution of during fusion. Similar to SLM, in
the EBM process, a focused electron beam scans across a thin layer of pre-laid powder,
causing localized melting and resolidification as per the slice cross-section. However,
there are a number of differences between how SLM and EBM are typically practiced,
which are summarized in Table 2.11.

66
Figure 2.11 - Schematic of Electron Beam Melting [36]

67
Table 2.11 - Differences between EBM and SLM [36]
Characteristic Electron beam melting Selective laser melting
Thermal source Electron beam Laser
Atmosphere Vacuum Inert gas
Scanning Deflection coils Galvanometers
Energy absorption Conductivity-limited Absorptivity-limited
Powder pre-heating Use electron beam Use infrared heaters
Scan speeds Very fast, magnetically-driven Limited by galvanometer inertia
Energy costs Moderate High
Surface finish Moderate to poor Excellent to moderate
Feature resolution Moderate Excellent
Materials Metals (conductors) Polymers, metals and ceramics
Electron beams are inherently different from laser beams, as electron beams are
made up of a stream of electrons moving near the speed of light, whereas, laser beams
are made up of photons moving at the speed of light. When an electron beam is passed
through a gas at atmospheric pressure, for instance, the electrons interact with the atoms
in the gas and are deflected. In contrast, a laser beam can pass through a gas unaffected
as long as the gas is transparent at the laser wavelength. Thus, EBM is practiced in a
low-partial-pressure vacuum environment (a small amount of inert gas is swept through
to remove gaseous by-products and oxygen), whereas SLM is practiced in an inert gas
atmosphere at atmospheric pressure. Electrons have a negative charge and are focused
and deflected magnetically, whereas photons are optically focused and deflected using
mirrors attached to motors. As a result, since magnetic coils have an almost
instantaneous response to changing input conditions, an electron beam can be scanned
slowly or very rapidly. In essence an electron beam can be moved instantaneously from
one location to another without needing to traverse the area in-between. In contrast,

68
galvanometers are mirrors attached to motors. For a laser beam focal spot to move from
point A to point B, the galvanometer motors have to move the mirrors accordingly. Thus,
virtually instantaneous motion is not possible and the scan speed is determined by the
mass of the mirrors, the characteristics of the motors, and the distance from the mirrors
to the powder bed.
Laser beams heat the powder when photons are absorbed by powder particles.
Electron beams, however, heat powder by transfer of kinetic energy from incoming
electrons into powder particles. As powder particles absorb electrons they gain an
increasingly negative charge. This has two potentially detrimental effects: (1) if the
repulsive force of neighbouring negatively charged particles overcomes the
gravitational and frictional forces holding them in place, there will be a rapid expulsion
of powder particles from the powder bed, creating a powder cloud; and (2) increasing
negative charges in the powder particles will tend to repel the incoming negatively
charged electrons, thus creating a more diffuse beam. There are no such complimentary
phenomena with photons. As a result, the conductivity of the powder bed in EBM must
be high enough that powder particles do not become highly negatively charged, and scan
strategies must be used to avoid build-up of regions of negatively charged particles. In
practice, electron beam energy is more diffuse; in part, so as not to build up too great a
negative charge in any one location. As a result, the effective melt pool size increases,
creating a larger heat-affected zone. Consequently, the minimum feature size, resolution
and surface finish of an EBM process is typically larger than an SLM process. As
mentioned above, in EBM the powder bed must be conductive. Thus, EBM can only be
used to process conductive materials (e.g., metals) whereas, lasers can be used with any
material that absorbs energy at the laser wavelength (e.g., metals, polymers and
ceramics).
Electron beam generation is typically a much more efficient process than laser
beam generation. When a voltage difference is applied to the heated filament in an
electron beam system, most of the electrical energy is converted into the electron beam,
and higher beam energies (above 1 kW) are available at a moderate cost. By contrast, it
is common for only 10–20% of the total electrical energy input for laser systems to be
converted into beam energy, with the remaining energy lost in the form of heat [36]. In
addition, lasers with beam energies above 1 kW are typically much more expensive than
comparable electron beams with similar energies. Thus, electron beams are a less costly

69
high energy source than laser beams. Newer fibre lasers, however, are more simple in
their design, more reliable to maintain, and more efficient to use (with conversion
efficiencies reported of 70–80% for some fibre lasers) and thus, this energy cost
advantage for electron beams may not be a major advantage in the future.
EBM powder beds are maintained at a higher temperature than SLM powder
beds. There are several reasons for this. First, the higher energy input of the beam used
in the EBM system naturally heats the surrounding loose powder to a higher temperature
than the lower energy laser beams. In order to maintain a steady-state uniform
temperature throughout the build (rather than having the build become hotter as the build
height increases) the EBM process uses the electron beam to heat the metal substrate at
the bottom of the build platform before laying a powder bed. By defocusing the electron
beam and scanning it very rapidly over the entire surface of the substrate or the powder
bed, the bed can be preheated rapidly and uniformly to any pre-set temperature. As a
result, the radiative and resistive heaters present in most SLM systems for powder bed
heating are not typically used in EBM. By maintaining the powder bed at an elevated
temperature, however, the resulting microstructure of a typical EBM part is significantly
different from a typical SLM part. In particular, in SLM the individual laser scan lines
are typically easily distinguishable, whereas individual scan lines are often
indistinguishable in EBM microstructures. Rapid cooling in SLM creates smaller grain
sizes [54] and subsequent layer deposits only partially re-melt the previously deposited
layer. The powder bed is held at a low enough temperature that elevated temperature
grain growth does not erase the layering effects. In EBM, the higher temperature of the
powder bed, and the larger and more diffuse heat input result in a contiguous grain
pattern that is more representative of a cast microstructure [55], with less porosity than
an SLM microstructure.
Post processing requirements include removing excess powder and further
cleaning and CNC work. One advantage and common aim of post processing is to
increase the density and therefore the structural strength of a part. Liquid phase sintering
is a method of melting the metal powder or powder combination in order to achieve
homogenisation and a more continuous microstructure throughout the material,
However, shrinking during the process must be accounted for. Hot isotactic pressing is
another method to increase density; a vacuum sealed chamber is used to exert high

70
pressures and temperatures of the material. Although this is an effective technique to
improve strength, the trade-off is a longer and more expensive build time.
2.2.6 Sheet Lamination
Sheet lamination processes use sheets of materials joined together to form solid
objects. Commonly known processes include laminated object manufacturing (LOM)
and ultrasonic additive manufacturing (UAM). Laminated object manufacturing (LOM)
uses paper (or plastic sheets) as material and adhesive to join the paper together. The
material is first positioned in place on the cutting bed. The material is then bonded in
place, over the previous layer, using adhesive. The required shape is then cut from the
layer, by laser or knife. The process uses a cross hatching method at the unused areas
during this cutting process to allow for easy removal post build. The process then repeats
until the part is complete.
Sheet lamination process has also been used for metal component fabrication
and is very well known for its applications in joining dissimilar metals. Known as UAM,
it uses ultrasonic metal welding to sequentially bond metal sheets together, and
integrates machining to remove material to achieve the desired geometry. This happens
at every layer and is repeated layer by layer until the component is formed (see Figure
2.12).
During UAM, a rotating sonotrode travels along the length of a thin metal foil
(typically 100–150 mm thick) [36]. The foil is held closely in contact with the base plate
or previous layer by applying a normal force via the rotating sonotrode, as shown
schematically in Figure 2.12. The sonotrode oscillates transversely to the direction of
motion, at a constant 20 kHz frequency and user-set oscillation amplitude. After
depositing a foil, another foil is deposited adjacent to it. This procedure is repeated until
a complete layer is placed. The next layer is bonded to the previously deposited layer
using the same procedure. Typically four layers of deposited metal foils are termed one
level in UAM. After deposition of one level, the CNC milling head shapes the deposited
foils/layers to their slice contour (the contour does not need to be vertical, but can be a
curved or angled surface, based on the local part geometry). This additive-subtractive
process continues until the final geometry of the part is achieved.

71
UAM uses metals and includes aluminium, copper, stainless steel and titanium.
The process is low temperature and allows for internal geometries to be created. The
process can bond different materials and requires relatively little energy, as the metal is
not melted. However, Schick et al. [56] showed that metals parts built by UAM had
voids or unbonded areas, which reduce the load-bearing cross section and create a stress
intensity factor. In the same research work, tensile testing revealed that the weld
interface strength was 15% of the bulk foil; shear tests of the weld interfaces was 50%
of the bulk shear strength of the material; and optical microscopy of the fracture surfaces
from the tensile tests revealed that 34% of the interface area was unbonded.
Figure 2.12 - Schematic of ultrasonic additive manufacturing [36]
2.2.7 Vat Photopolymerisation
Vat photopolymerisation uses a vat of liquid photopolymer resin to build parts
layer by layer. An ultraviolet (UV) light is used to cure or harden the resin where
required, whilst a platform moves the object being made downwards after each new
layer is cured. As the process uses liquid to form objects, there is no structural support
from the material during the build phase. In this case, support structures will often need
to be added. Resins are cured using a process of photo polymerisation or UV light, where

72
the light is directed across the surface of the resin with the use of motor controlled
mirrors. Where the resin comes in contact with the light, it cures or hardens. However,
there is no known literature on using this AM technology to fabricate metallic
components.
Figure 2.13 - Schematic of vat photopolymerisation [36]
2.2.8 Selection of Additive Manufacturing Technology
Based on the above literature review of the AM processes categorised by ASTM
F2972, it can be concluded that ASTM A131 EH36 can be directly processed by
processes stated in Table 2.12.
Table 2.12 - Selection of AM technology to process ASTM A131 EH36
Process Metal Fabrication
Summary
Main Limitations for
Metal Fabrication
Binder Jetting Binder jetting, infiltration,
sintering.
Multiple processes required
in the fabrication of metals.
Directed Energy
Deposition (DED)
Thermal energy to fuse
materials together.
Surface finish, complexity
of parts (eg conformal
channels).

73
Material Extrusion Melting feedstock before
depositing onto substrate
Only works on metals with
low melting point, or require
debinding and sintering.
Material Jetting Jetting liquid metals to form
components.
Existing literature is largely
based on development work
on micro scale metal parts.
Powder Bed Fusion
(PBF)
Direct a thermal energy onto a
powder bed, thermally fusing
the material.
Requires environmentally
controlled chamber.
Sheet Lamination Uses ultrasonic metal welding
to sequentially bond metal
sheets together.
Requires subtractive
manufacturing.
Vat
Photopolymerisation
Light-activated
polymerisation.
No known literature to
fabricate metals.
While most of the AM processes can be used to fabricate metallic components,
each of them has their own limitations. Listed in Table 2.12 are also the main limitations
that would eventually determine which technology is more suitable to process EH36.
Binder jetting technology can not directly produce reliable end use metallic components
due to the nature of porosity caused by the binding method, and requires additional
infiltration and sintering procedures. Material extrusion methods have a limitation on
the temperature of the materials that can be processed. Material jetting and vat
photopolymerisation both have very limited literature to process metallic components.
Sheet lamination seems viable but it requires subtractive manufacturing as part of it
process to create geometries and features. That narrows the selection down to directed
energy deposition and powder bed fusion.
Both directed energy deposition and powder bed fusion have shown excellent
processing capabilities for metallic components. Gu et al. [42] did a review of the current
status of research and development of end-use metallic components. From bulk of the
data from literature, parts built by powder bed fusion generally is capable of achieving
higher bulk density than those built using directed energy deposition. As discussed in

74
Chapter 2.2.5, there are four sub-processes under powder bed fusion, namely selective
laser sintering, selective laser melting, selective heat sintering and electron beam
melting. In the same literature review by Gu et al. [42], metallic parts built using
selective laser sintering showed generally higher porosity. Selective heat sintering, as
discussed in Chapter 2.2.5.3, only works on thermoplastic powders and hence cannot
process metallic materials. Selective laser melting and electron beam melting processes
produce parts with high mechanical performance and both have been widely researched
and used, but electron beam requires a vacuum chamber to operate. While this may not
be an issue for small parts, it may be a technical constraint as the need to build larger
components arises.
Another important factor to consider would be the build rate of the AM processes,
especially because the intention is for the application of the AM technology for large
structural steels. Directed energy deposition usually has two types of feedstock, namely
powder or wire, and both are vastly different in their process parameters and deposition
rates. For powder bed fusion, techniques and advancements in both machine and method
designs have greatly influenced its build rates. Khorasani discussed about the various
industrially practised techniques in [57]:
- Interchangeable cylinders as well as automatic powder management
systems to reduce setup times and increase productivity through machine
utilization rate.
- Closed-loop control powder handling and removable cylinders to
increase the speed of productions.
- Circular platforms to prevent dispersion of powder and remove need for
any powder filling or unloading throughout the building cycle, even
when printing at full capability.
- Single automatic powder handling system are used for several machines
in a production line improve machine efficiency.
- Automated powder sieving and recirculation are used to reduce the
production time.
Multi-layer concurrent printing is the latest technology used to reduce the time
of printing and to increase the speed of printing by around 100 times faster than the

75
existing systems. This process spreads multiple layers of powder on the build surface at
the same time allowing a laser to scan multiple spots simultaneously [57].
Table 2.13 shows a curated list of build rates of existing and new AM processes,
and their associated manufacturers. From the list, it can be observed that while PBF
processes generally have lower build rates than DED processes, manufacturers have
made innovation breakthroughs in their process designs to increase the build rates,
especially true for Aeroswift and Aurora Labs. Regardless, it is still true that the build
rates are designed for specific applications, with lower build rates for smaller high
precision parts and high build rates for larger parts which are generally near net shape
and require post machining.
Table 2.13 - Comparison of various DED and PBF build rates
AM Process Manufacturer Build Rate (cm3/hr) Ref
Selective laser
melting
EOS 5-20 [58]
SLM Solution 20-70 [58]
Concept Laser 120 [59]
Renishaw 5-20 [58]
Aeroswift 50-1200 [60]1
Aurora Labs 3300 [61]1,2
G.E. A.T.L.A.S. 180 [57]
Electron beam
melting
ARCAM 80 [58]
Directed energy
deposition
WAAM 160-1300 [62, 63]
Norsk Titanium 1100-2200 [64]
Optomec LENS 50-65 [62]
Aeromet Lasform 1000 [65]
1 Marketed figures with limited literature available in peer-reviewed journal articles

76
2 3300 cm3/hr is converted from marketed figure of 350kg/hr for Titanium
Hence, selective laser melting was eventually selected as the AM process for
EH36 steel due to the following reasons:
- Competence to directly fabricate complex shaped metallic components
- Good source of literature and understanding of process
- Higher bulk density for processing metallic components
- High mechanical performance
- Potential to build large parts [19]
2.3 Part and Material Properties in SLM of Metals
After the material and AM process selections are completed, further
investigations will then be carried out using SLM to process ASTM A131 EH36
material. Literature search showed that there is a substantial amount of research done
on SLM, and its maturity as compared to other AM techniques that can process metallic
materials gave confidence to the AM process selection results. Kruth et al. [54]
discussed the key characteristics of processing metals using SLM, which includes
density, surface quality, mechanical properties and microstructure. SLM can be
characterised by high temperature gradients, causing no equilibrium to be maintained at
the solid and liquid interface. This leads to the formation of non-equilibrium phases and
subsequently changes in the general microstructural features. At higher cooling rates,
finer structures can be observed in the microstructure as compared to conventionally
manufactured metal parts. Grain structure is also influenced by previously solidified
layer grain structure and the SLM processing parameters. Since microstructural features
affect material properties, parts produced by SLM will have mechanical properties
different from bulk materials fabricated by conventional manufacturing techniques.

77
2.3.1 Density
Density determines a part’s mechanical properties, which in turn determines the
part performance. Parts built by conventional manufacturing, such as moulding process,
usually obtain high density due to mechanical pressure. Since the SLM process is
characterised by temperature effects, gravity and capillary forces, it is difficult to
achieve 100% dense parts. In addition, gas bubbles may become entrapped in the
material during the SLM process, thus leading to increase in porosity of the part built.
Porosities formed during the SLM process may be attributed to several factors.
Porosities may be formed due to a decrease in the solubility of the dissolved elements
in the melt pool during cooling and solidification and evaporation of elements with a
high vapor pressure [66]. High surface roughness can also cause low density – high-
roughness peaks and valleys that are formed after each layer can prevent the coater from
depositing a new homogenous powder layer. Moreover, the laser energy may be not
enough to melt the new layer completely since the thickness of the powder in some
regions will be higher because of the high-surface roughness. Morgan et al. has
investigated and provided findings that show that a rough surface may cause the
entrapment of gas upon deposition of a new powder layer [67]. When the new layer is
being scanned, the gas is superheated and expands rapidly removing the liquid metal
above it, thus creating a pore.
Environmental conditions and process parameters influence the attainable
density. Zhang et al. studied the effect of environment variables on density of AISI 316L
stainless steel parts built using SLM. The work focussed on investigating the effect of
protective gases and preheating on the density of the part produced. The study showed
that oxidation reaction between the stainless steel powders and oxygen would be limited
when the oxygen content in the working chamber is key to below 0.5%. Four protective
gases, namely Argon (Ar), Nitrogen (N2), Helium (He) and Hydrogen (H2) were used
in various mixtures, and it was shown that samples fabricated using Ar and N2 exhibited
near full densities with values above 99%. Figure 2.14 shows the density of sample
fabricated. When Ar and N2 are mixed with H2, the densities of the samples built do
not change. Hence it was concluded that influence of H2 as a deoxidiser is relatively
weak due to low oxygen content and low density (H2 rises and stays at the top of the
working chamber because its density is lower than Ar and N2).

78
Figure 2.14 - Relative density (a) and optical image (b) of SLM processed SS316L powder
The study also presented findings that preheating will improve densities of
samples fabricated under Ar environment. Furthermore, preheating can reduce part
deformation and increase dimensional accuracy. Figure 2.15 shows the findings from
the study.

79
Figure 2.15 - Material density versus preheating temperature of powder bed
Badrossamay et al. presented how scanning speed has an effect on the relative
density at three different layers thicknesses for AISI 316L stainless steel [68]. At
sufficiently low scan speeds, the relative density is almost independent of the layer
thickness for the selected range of the layer thickness, and a maximum of 99% relative
density is achievable. At higher scan speed values, a higher layer thickness results in
less density. However, the layer thickness can be increased if the scan speed is
sufficiently lowered to achieve the same density values.
Study has also shown that scanning strategy also has an effect on the relative
density of parts produced using SLM. Kruth et al. discussed on the comparison of three
types of scanning patterns – uni-directional, bi-directional and alternating bi-directional
[54]. In alternating bi-directional, the scan lines are rotated 90 degrees in each layer (see
Figure 2.16 below). The study has found that alternating bi-directional provides the
highest relative density. Jhabvala et al. investigated four scanning strategies and
concluded that the best scanning strategy is chessboard (island) scanning (see Figure
2.17 below) [69]. Lu et al. expanded the investigation on island scan strategy by focusing
on the effect of differing island sizes [70]. The results indicate that the relative density
is increased with the enlargement of island size. Figure 2.18 shows that 2 x 2 mm² (22)
islands achieved much lower relative density values than 5 x 5 mm² (55) and 7 x 7 mm²
(77) islands.

80
Figure 2.16- (a) Effect of scanning strategy; (b) Different scanning strategies by Kruth et al. [54]
Figure 2.17 - Four scanning strategies investigated by Jhabvala et al. [69]

81
Figure 2.18 - Relative density values formed at differing island sizes in island scanning strategy [70]
Even though parts produced by a properly optimised SLM process often exhibit
relative density values of 97% to 99%, small residual porosities may still decrease the
mechanical performance of the part, especially in the areas fatigue and ductility
performance. Laser re-melting is often used to solve this problem and to increase the
density. In SLM process, the term “laser re-melting” is used to refer to a second pass of
the laser beam over the same 2D layer for different purposes such as further material
densification, surface quality and microstructural enhancement of SLM fabricated parts.
Kruth et al. and Yasa et al. has shown that laser re-melting can reduce porosity by three
to five times, thus significantly improving density [54, 66]. In their investigations,
optical microscopy images of cross sections of a SLM produced part without re-melting
were obtained (see Figure 2.19). Similar micrographs were subsequently obtained for
SLM produced part with re-melting (see Figure 2.20). The results show that applying
laser re-melting technique will definitely yield an improvement in the density of the
SLM produced part, but the number of re-melting may not be directly related to the
amount of density improvement.

82
Figure 2.19 - Optical microscopy images of SLM produced part without re-melting [54, 66]

83
Figure 2.20 - Optical microscopy images of SLM produced part with re-melting [54, 66]
2.3.2 Surface Quality
Surface quality has always been a key issue in SLM processed metal parts. High
surface roughness can lead to unacceptable tolerances, increased friction and potentially
becoming a source of fatigue crack initiation [71]. Marimuthu et al. explained that the
surface quality may be caused by 2 phenomena – surface deformation produced by
vaporisation; and surface tension gradient, which influences the direction of melt pool
movement [72].
The top surface roughness of a melt pool can be affected by a rippling effect that
occurs due to surface tension forces exerting a shear force on the liquid surface. This is

84
primarily due to a surface temperature difference between the laser beam and the
solidifying zone caused by the motion of the laser beam. As the thermal gradients reduce,
gravity and melt pool surface curvature counter this external shear force, eventually
restoring the surface height of the melt pool to the free level [73]. However, viscous
forces delay this relaxation process, quick melt pool solidification time often ensures
that complete relaxation is not fully achieved.
Investigations using pulsed lasers have reported that top surface roughness can
be reduced using a low scan speed and high repetition rate due to melt pool stabilization
and reduced surface profile variation on top of the solidified melt pool [74, 75]. However,
low scan speeds and high repetition rates can significantly increase the volume of melt
pool produced and promote a phenomenon known as balling. Balling is the breakup of
the melt pool into small spheres. It occurs when molten material does not wet well to
the underlying substrate or material due to high surface tension differences generated as
a result of variations in thermal properties within the melt pool [51, 76, 77]. These
thermal gradients cause a thermocapillary flow of a fluid within the melt pool from
regions with low surface tension to regions with high surface tension, known as
Marangoni convection [78]. The breaking up of the melt pool into smaller entities
reduces the variation in melt pool surface tension. Balling can increase with the
generation of excessive molten material or if too low viscosity exists within a melt pool
[79]. Kruth et al. stated that when the total surface of a molten pool becomes larger than
that of a sphere with the same volume, the balling effect takes place [51]. Balling is a
severe impediment on interlayer connection, it decreases part density and increases top
surface roughness and side roughness. However, the balling effect more dominantly
affects the side roughness of parts due to the direction of balling scattering to either side
of the melt pool rather than settling on the top surface.
Mumtaz et al. investigated the SLM of Inconel 625 using an Nd:YAG pulsed
laser to produce thin wall parts with an emphasis on attaining parts with minimum top
surface and side surface roughness [71]. His findings showed that the surface finishes
in the z direction and the x-y planes are inversely related. As top average surface
roughness improves, the side average surface roughness worsens. Similarly, as side
average surface roughness improves, the top average surface roughness worsens. This
is primarily due to surface tension forces that arise as a result of thermal variation within
the melt pool. Low top average surface roughness is generally achieved using a high
85
laser spot overlap (above 90 per cent) due to reduced variation in the peaks and troughs
generated by individual overlapping spheres. Low processing scan speeds improve the
top average surface roughness as melt pool is given more time to flatten before melt
pool solidification. The melt pool is flattened by gravity and surface curvature forces
that counteract the external shear forces generated by temperature difference caused by
the moving laser. However, both a high laser spot overlap and low scan speed will
increase the volume of liquid produced within the melt pool. This has a tendency to
widen the melt pool causing a larger variation in thermal properties across the melt pool.
This subsequently generates a greater variation in surface tension and causes the melt
pool to break off into smaller entities (balling) as the melt pool attempts to reduce
surface tension differences. The entities solidify at the edge of the melt pool
subsequently increasing top average surface roughness. The balling effect limits the
SLM process resolution because it causes the formation of discontinuous tracks [71],
therefore limiting the formation of very sharp geometries. It is also responsible for a
non-uniform deposition of material on the previous layers, thus inducing a possible
porosity and delamination between layers that is detrimental to the functional
performance of parts. Side average surface roughness can be reduced using high scan
speeds and low laser spot overlap (below 85 per cent). This encourages quicker melt
pool solidification and minimizes the volume of liquid within the melt pool. This
produces relatively thin melt pools with less variation in the thermal properties across
the melt pool than that of a larger melt pool. The melt pool is more stable and is less
likely to suffer from balling. However, the fast melt pool solidification and low laser
spot overlap will have a detrimental effect on top average surface roughness.
Mamtaz et al. also concluded that the common factor that reduces both top and
side average surface roughness is pulse energy. However it is believed that the increased
peak power generated with the use of a higher pulse energy at a fixed pulse duration is
the main reason for this to occur. High peak powers generate large recoil pressures.
Work has shown that higher peak powers flatten out the melt pool [77] improving
interlayer connection and increasing the wettability of the melt [80]. Improved
wettability reduces a melt pool’s tendency to undergo balling by relieving surface
tension variations [51, 79]. Kruth et al. believes that high peak powers reduce the
tendency for a melt pool to undergo balling due to a higher attained temperature within
the melt [51]. Mamtaz et al. also provided another possible explanation for the decrease

86
in balling with the use of higher peak powers, which is, relation to the increase in recoil
pressure causing any balling formation to completely detach from solidifying melt pool
(and disperse onto the powder bed). However, if peak powers become too high large
amounts of material vaporization can occur with recoil pressures that disrupt the melt
pool surface and increase top average surface roughness. In conclusion, Mamtaz et al.
identified that the parameters that promote a reduction in top average surface roughness
(increased overlap, increased repetition and reduced scan speed) tend to increase the
balling effect and increase side average surface roughness. Parameters that reduce side
average surface roughness (reduced overlap, reduced repetition rate and increased scan
speed) increase the top average surface roughness of parts. However, a parameter that
aids a reduction in both top and side average surface roughness is the use of a higher
peak power due to the flattening/smoothing of the melt pool surface and an improved
wettability of the melt pool reducing its tendency to undergo the balling mechanism.
Kruth et al. used laser re-melting to improve the surface quality. As illustrated
in Figure 2.21 below, the surface quality of parts manufactured by SLM and then
exposed to laser re-melting demonstrated a significant improvement [54]. By applying
appropriate process parameters, Kruth et al. was able to show that a SLM built
component with laser re-melting technique can be produced with no edge-effect (see
Figure 2.22) [54]. However, Strano et al. investigated the surface roughness at various
sloping angles (see Figure 2.23) and concluded that on inclined surfaces, unlike on
horizontal ones, laser re-melting is not possible with SLM technology, since material
can only be sintered horizontally [81].

87
Figure 2.21 - Surface quality enhancement with laser re-melting: (a) SLM without re-melting (b)
Laser re-molten part [54]
Figure 2.22 - SEM image of a SLM laser re-melted surface with no obvious edge-effect [54]
Figure 2.23 - SLM manufactured "truncheon" test part [81]

88
2.3.3 Mechanical Properties
2.3.3.1 Toughness
The mechanical properties obtained with SLM for metal materials have been
widely studied by many research groups in the world. Kruth et al. described the
mechanical properties of SLM parts as comparable to those of bulk materials, apart from
the ductility, which is lower in SLM fabricated parts. Kruth et al. [54] studied the impact
toughness of three materials – AISI 316L stainless steel, Ti6Al4V and maraging steel
300. The Charpy impact test was used to determine the impact toughness values, both
with notch and without notch. From the study, Figure 2.24 shows that specimens with
notch have less resistance to breakage, which means that the high roughness of the SLM
process does not behave like stress-concentrating notches. The study also concluded that
in the case of a good connection between successive layers without any pores, the
building axis does not play a significant role in the toughness results. Hence, the way of
producing the notch does not affect the toughness results. It was also observed that
scatter in impact toughness for the notched samples is significantly lesser than the
samples without notch. The reason for this observation was not stated in Kruth’s
discussions, and an analysis would require a good understanding of the experiment setup,
which was not described in [54].
The results were then compared with that of conventional manufacturing. From
the study, Table 2.14 shows that the toughness of bulk materials is higher than that of
SLM parts. The reason of having lower toughness with SLM can be attributed to the
presence of defects like pores, pick-up of impurities like oxygen and nitrogen (especially
for titanium alloys) and the presence of more brittle non-equilibrium phases. The
findings imply that aging reduces the impact energy but increases the strength and
hardness.

89
Figure 2.24 - Charpy test results for SLM produced parts [54]
Table 2.14 - Comparison of SLM and conventional processes in terms of Charpy V-notch
toughness [54]
Material SLM Conventional
Ti6Al4V 11.5 ± 0.5 (as built)
10.1 ± 0.5 J (annealed)
15 J
Investment casting
Maraging Steel 300 36.3 ± 4.8 J (as built)
10.1 ± 1.4 J (after aging)
18 J
After aging
Stainless Steel 316L 59.2 ± 3.9 (as built) 160 J
cast CF-3M
2.3.3.2 Ductility
In the SLM of steel, many research works have reported low ductility in the SLM
built samples, usually with strong anisotropy associated with building direction. Song
et al. [82] compared the elongation values of SLM built samples with traditionally built
samples. In the comparison, Song et al. presented wrought AISI 316L stainless steel
samples with elongation values of 40% in X, Y, Z axes, and SLM as-built samples with
elongation values of 13-16% in the X and Y axes, but up to 50% in the Z axis. Yadroitsev

90
et al. also reported similar findings. Yadroitsev et al. [83] investigated the mechanical
properties of SLM built AISI 316L stainless steel samples. The findings showed that the
elongation values for the SLM built samples are between 6-13.5%, while wrought
stainless steel elongation value is 40%.
However, some studies have shown that SLM is capable of producing
components with ductility performance close to that of conventional manufacturing.
Spierings et al. [84] investigated the effect of varying stainless steel 316L powder
granulations on the resulting part mechanical properties. The investigation achieved
elongation values of typically 30% (see Figure 2.25), with peak values reaching 50%.
This meets the stated elongation values for wrought stainless steel 316L of 40% obtained
from American Society for Metals (ASM) handbook [85]. Riemer et al. also achieved
similar results [86], with elongation values of 53.7% in his SLM as-built stainless steel
316L tensile test coupons (see Table 2.15). The study concluded that the high elongation
values may be attributed to fine substructures present in the as-built microstructure.
Figure 2.25 - Elongation values for SLM built SS316L from Spierings et al. [84]
Table 2.15 - Ultimate tensile strength, 0.2% offset yield strength and elongation at failure from
Riemer et al. [86]
Condition UTS (MPa) YS (MPa) Elongation (%)
As-built/SLM surface 565 462 53.7
650⁰C/Turned surface 595 443 48.6

91
Traditionally processed 530-680 220 >40
Kanagarajah et al. presented an explanation to the conflicting results for ductility
of metallic materials produced by SLM process [87]. Kakagarajah et al. presented
findings on high ductility in SLM as-built nickel based alloy (Inconel 939). The paper
attributed this to the presence of substructures, e.g. low-angle grain boundaries,
eventually acting as barriers for dislocation motion. Vilaro et al, on the other hand,
reported low ductility for nickel based alloy (Nimonic 263) [88]. Kanagarajah et al. then
attributed this difference to the defects between layers found in Vilaro’s study, which
was not observed in Kanagarajah’s study. Kanagarajah et al. concludes that smaller
grain sizes led to the higher ductility due to a more homogeneous deformation.
2.3.3.3 Tensile Strength
Tensile yield strength and ultimate tensile strength of SLM built metallic
samples are generally excellent, and in many cases exceed that of wrought samples [89].
Table 2.16 shows some of the tensile properties of SLM processed metallic materials,
which when compared to traditional processing, are more superior if not the same. Song
et al. attributed this characteristic to the grain refinement in SLM produced parts [82].
The fine grain characteristics of SLM produced parts are due to high cooling rates
associated with the process. Song et al. [90] investigated the microstructure and tensile
properties of iron parts fabricated by selective laser melting and proposed multiple self-
strengthening mechanisms to explain the high mechanical strength, based on grain size,
dislocation density and precipitated second phase effect on the yield strength. The most
significant strengthening mechanism is proposed to be grain refinement. Abd-Elghany
reported relatively high ultimate tensile strength in the investigation of 304L stainless
steel fabricated by SLM and similarly attributed this to the rapid melting and cooling
characteristic of SLM process [91].

92
Table 2.16 - Tensile properties of SLM processed metallic materials
Material Process Ultimate Tensile
Strength (MPa)
Yield Strength
(MPa)
Reference
SS316L Wrought 450-620 170-310 ASM Handbook [85]
SLM 369-555 312-465 Yadroitsev et al. [83]
SLM 649.8-667 628-649.3 Tolosa et al. [92]
SS304 Casting 520 205 Guan et al. [93]
Wrought 515-620 205-310 ASM Handbook [85]
SLM 714-717 566-570 Guan et al. [93]
17-4PH Wrought 795-1310 515-1170 ASM Handbook [85]
SLM 947-1305 435-537 Luecke [94]
Ni718 Wrought 1340 1100 Zhao et al. [95]
SLM 889-907 1137-1148 Wang et al. [96]
Ti6Al-4V Wrought 828 897 Frazier et al. [97]
SLM 1166-1206 962-1137 Vilaro et al. [98]
2.3.3.4 Fatigue
Studies have shown that the fatigue behaviour of SLM produced specimens is
very sensitive to pores, and it is critical for the amount of porosity to be reduced to
obtain high performance in fatigue [99]. Riemer et al. [86] investigated the effect of
post-processing on the fatigue properties of SLM processed 316L. Four conditions were
tested – namely, as built, as-built with machined surface, post-process heat treatment
with machined surface, and hot isostatically pressed with machined surface. The results
are shown in Table 2.17. The results show that the performance of SLM-processed 316L
under cyclic loading can be increased by a suitable post-treatment. Riemer attributed
this to the reduction of residual stresses achieved by the 650⁰C annealing, resulting in a

93
small increase in the fatigue limit of about 30 MPa. Riemer then compared the results
with Strizak et al.’s fatigue investigation of conventionally process 316L stainless steel
[100], and concluded that stainless steels processed by SLM can meet or even
outperform the fatigue performance of the conventionally processed ones.
Table 2.17 - Fatigue limits for stainless steel 316L from Riemer et al. [86]
Condition Fatigue limit (MPa)
As-built/SLM surface 108
As-built/Turned surface 267
650⁰C/Turned surface 294
HIP/Turned surface 317
Traditionally processed [100, 101] 240-381
Stoffregen et al. [102] reviewed existing work on fatigue analysis of SLM parts
and subsequently investigated the fatigue performance of 17-4PH stainless steel. The
study observed a strong divergence between the fatigue behaviour of as-built and
machined SLM 17-4PH stainless steel specimens in the high cycle fatigue regime. For
the machined specimens, the fatigue strength at N = 107 cycles is 492 MPa and accounts
for 51% of the measured ultimate tensile strength (UTS = 961 MPa). Compared to the
results on conventionally manufactured 17-4PH stainless steel [103], this results show
fatigue strength values in the same magnitude. This indicates that the fatigue behaviour
of machined SLM generated specimens is comparable to conventional manufactured
ones. For the as-built specimens, the fatigue strength at N = 107 cycles is 219 MPa,
which is significantly below the value of machined specimens. The fatigue strength
accounts for only 23% of the ultimate tensile strength. Stroffregen et al. attributed this
to the high surface roughness of as-built specimens and the associated notch effect [104].
However, in another study by Spierings et al. [105], the fatigue performances
(see Figure 2.26) of SLM processed parts are significantly lower (77%) than those of
the standard values for wrought alloy. Song et al. has attributed this to the porosity of

94
parts being the key contributor to the decrease in fatigue life [82]. This conclusion is
consistent with that of Riemeret al.
Figure 2.26 - Fatigue results of SLM process stainless steel 316L [105]
Hence, it can be concluded that fatigue properties of SLM produced metallic
materials can meet that of conventionally produced samples if the two critical conditions
are met:
- Surface roughness should be reduced through post-processing such as machining,
to avoid notch effect;
- Porosity should be reduced as much as possible, increase fatigue life.
One of the possible techniques that can be employed to ensure that the two
conditions mentioned above can be met will be laser re-melting. Yasa et al. [106]
employed laser re-melting on the SLM of stainless steel 316L and the results showed
that the relative density of the part obtained is close to 100% (and hence reduced
porosity), and the surface roughness improved by 90%.
2.3.3.5 Hardness and Wear
Hardness property of SLM produced metallic materials are usually excellent,
and is often superior to conventional processing methods (eg. casting and forging) [107-

95
109]. For a relatively fully dense part without the formation of cracks, the remaining of
a reasonable level of residual stresses in laser processed components favours the
enhancement of hardness [110]. Associated with hardness property, recent researches
start to study the wear and tribology performance of AM processed components. Kruth
et al. [111] have investigated the wear behaviour of prealloyed tool steel produced by
SLM, showing that AM technique is capable to offer excellent surface wear properties.
The densification level of AM processed parts has a fundamental influence on wear
performance. Better wear resistance is obtained for fully dense components. Gu et al.
[112] investigated the SLM of commercially pure Ti and presented findings to show that
superior hardness property compared to conventional powder metallurgy (PM)
processed Ti was obtained. He also agreed that residual stress in SLM-processed parts
favours the enhancement of hardness, and added that the significant grain refinement
effect (Figure 2.27) due to laser rapid solidification favours a further increase in the
obtainable hardness.
Figure 2.27 - Optical microscopy images showing characteristic microstructures of SLM-processed
Ti parts at different processing parameters [112]
Yasa et al. [113] investigated on the effect of process parameters on hardness
performance of Maraging Steel 300. The findings showed that hardness is significantly
affected by density, where, as the scan speed is increased, the hardness values are
significantly reduced due to increased porosity (see Figure 2.28). Yasa et al. also

96
commented that the high cooling rate and rapid solidification unique to SLM prevents
formation of a lath martensite. SEM images (Figure 2.29) showing intercellular spacing
of less than 1 μm contributes to the excellent hardness properties. Yasa et al. also applied
laser re-melting strategy and the findings showed that the hardness values improved by
4.5% with re-melting, and are generally higher than those of maraging steel parts
produced with conventional production techniques. This is consistent with another of
Yasa et al.’s work, where higher hardness encountered in the laser re-melted zone is
attributed to finer microstructure [66]. In that work, it is also observed that the
cellular/dendritic microstructure is more homogenous and has a smaller cell size in the
laser re-melted zone than the regions which is built by SLM with no laser re-melting.
In the same literature, Yasa et al. also investigated on the effect of heat treatment
on hardness [113]. Aging is performed to form a uniform distribution of fine nickel-rich
intermetallic precipitates during the aging of the martensite. These precipitates serve to
strengthen the martensitic matrix. Secondly, it is aimed to minimize or eliminate the
reversion of metastable martensite into austenite and ferrite [114]. In the literature, the
hardening of maraging steels during aging has been attributed to two mechanisms,
namely the short-range ordering in the cobalt-bearing solid solution and precipitation of
nickel-rich intermetallic compounds in the lath martensitic structure [114]. The study
concluded that aging improves hardness by up to 64% when aging for 5 hours at 480⁰C.
However, at prolonged durations, the hardness starts to drop slightly. This is an
indication of overaging, meaning that the re-heating starts reversion of metastable
martensite into austenite, which is an equilibrium phase. Additionally, when a maraging
steel is overaged, the coarsening of the intermetallic precipitates takes place. Yasa et al.
concluded that these two phenomena together decrease the hardness as the part is kept
at elevated temperatures for a prolonged time.

97
Figure 2.28 - Average macro hardness measured on cross-sections versus scan speed for different
layer thicknesses with 95% confidence intervals [113]
Figure 2.29 - Micrographs after etching of cross-sections of Maraging Steel 300 from Yasa et al.
[113]
2.3.4 Microstructure
SLM is an additive manufacturing process that can be characterised by a high
cooling rate of 103 to 108 K/s [40, 41]. Rapid cooling results in a non-equilibrium
solidification process and enhances the limitation of solid solubility, refinement of
grains, and possible formation of new metastable, even amorphous phases [82]. Due to
large temperature gradients and complex heat transfer formed in a molten pool,
preferential grain growth and heterogeneous structure may be formed in SLM built parts
[115]. Song et al. [82] reviewed relevant studies on metal material fabrication through
SLM, and presented results on microstructure, properties, dimensional accuracy and

98
application of SLM. In the review, Song et al. presented results on typical microstructure
and characteristic of SLM built parts.
Song et al. reviewed the works by Wen et al. [116] and Gu et al. [117] and
reported overlaps between molten pool boundaries (MPBs) observed in stainless steel
316L fabricated by SLM. In the review, Song et al. studied the SEM images of MPBs
on a cross section of the SLM samples. MPB as a typical microstructure has been
observed in 316L stainless steel, 304 stainless steel [93], and Ni625 fabricated by SLM.
The cross sectional molten pool of a single track presented an arc-shape configuration
(Figure 2.30), which can be attributed to Gaussian energy distribution of the laser beam.
Multi-line and multi-layer single tracks accumulate to form a 3D object different from
traditional processing. Similar grain orientations on both sides of MPB layers can be
observed (Figure 2.31), where dotted lines indicate grain orientations, displaying an
obvious inheritance. Fine cellular and dendritic structures with a grain size of less than
1 μm is also observed (Figure 2.32). According to Hall-Petch formula [118], finer grain
size leads to better mechanical properties. In the SLM process, large amount of non-
metallic elements including C, O and Si often concentrate around the MPBs to form
non-metallic inclusions. The unstable state of the non-metallic inclusions near the MPBs
greatly affects the mechanical properties of the SLM parts. Figure 2.33 shows that
cracks always originate from MPBs under vertical and horizontal loading direction
conditions [116].
Figure 2.30 - MPBs on the cross section parallel to the laser scanning direction [82]

99
Figure 2.31 - Morphology of the cross section perpendicular to the scanning direction [82]
Figure 2.32 - MPB boundary
Figure 2.33 - Tensile fracture morphologies of the sample fabricated along the direction (a) perpendicular to
the laser scanning direction and (b) with an angle of 60⁰ between the tensile loading direction and x-y plane
[116]
The microstructure of SLM built parts can be controlled by adjusting the
following main parameters: Laser power (P), scanning velocity (V), hatch spacing (d),

100
powder layer thickness (h), and scanning strategy, among others. Higher laser energy
density P/(Vdh) and slower scanning speed will contribute to grain size growth and
change the grain morphology [90, 119, 120]. Song et al. [90] presented results of smaller
grain size with increasing laser scanning speed. Song et al. attributed this to lower
cooling rate with increasing laser scanning speed. As cooling rate in the solidification
process decreases, nucleation rate increases and hence small grains will be formed.
Refinement of the grain size contributes to the observed strengthening of the material
compared with ordinary iron. Figure 2.34 shows the metallographic observation of the
SLM built iron cubes from [90]. It can be found that the grain morphology from the side
views were different from that of the microstructure from the top views. Grains are
larger and more irregular. During the SLM process, the powder particles are irradiated
and heat is transferred from the top to the bottom of pre-laid powder layers, so that the
elongated grains formed during the solidification process due to temperature gradient
that is created between the powder layers along the building direction, as reported in the
papers [93, 121-124]. But in the SLM-fabricated iron parts, those elongated grains
usually were not very obvious. It can be explained that due to the presence of phase
change during the process of melting and solidification of iron powder, the temperature
gradient has been weakened. Elongated grains could not be obviously observed,
although there were some non-equiaxed grains.

101
Figure 2.34 - Metallographic observation from the top view and from the side view of SLM-fabricated iron
cubes at the laser power of 100W using different laser scanning speeds of: (a)–(b) 0.27m/s,(c)–(d)
0.33m/sand(e)–(f) 0.4m/s,respectively [90]
Kruth et al. [54] investigated the microstructure of metallic components after
SLM. Based on his findings, high temperature gradients during SLM process leads to
fine acicular martensite. In the investigation, he suggested that heat transfer direction
will play a large role in the determination of the orientation of grains. Elongated grains
appear along the building directions (Figure 2.35), with heights longer than the layer
thickness. He concluded that the elongated grains are a result of epitaxial solidification.

102
Figure 2.35 - Micrographs of SLM sample showing elongated grains along build direction [54]
Kruth et al. also investigated the microstructure of SLM built AISI 316L
stainless steel [54]. He suggested that during SLM, a fully molten pool forms a depth of
approximately 100 μm, significantly higher than the layer thickness of 30 μm (Figure
2.36). SEM pictures of the cross-section of the AISI 316L parts reveals a fine cellular-
dendritic structure (Figure 2.37). This microstructure is formed as a result of rapid
solidification due to very high cooling rates encountered in SLM.
Figure 2.36 - Frontal section of a SLM part from AISI 316L stainless steel [54]

103
Figure 2.37 - SEM image of the cross-section of SLM built AISI 316L part [54]
Since temperature gradient and the local heat transfer conditions determine the
grain growth of a SLM part, Kruth et al. investigated how changing the process
parameters as well as the scanning strategy may affect the resulting microstructure.
Figure 2.38 shows side and front views of a Ti6Al4V part produced with lowered
scan speed of 50mm/s. The micrographs indicate that decreasing scanning speed results
in coarser grains size. Lowering the scanning speed has also resulted in an elongated
and more irregular melt pool, thereby deteriorating part quality by formation of large
pores. A lower scanning speed also results in grains that are better aligned with the
building direction (see Figure 2.38(b)).
Due to the higher energy input at lower scan speed, the dark zones that indicate
the melt pool boundaries in the side and front views (Figure 2.38) are more intense.
Kruth et al. used the bands to estimate the actual layer thickness, based on the vertical
separation of the bands in the front views. Kruth et al. suggested that these bands become
visible due to the preferential etching of the intermetalic Ti3Al phase. As a result of fast
solidification during the SLM process, segregation of Al occurs and zones rich in Al are
formed. When a higher amount of heat is applied to the material, e.g. lowering scan
speed, the material will reach higher temperatures and more material will remain longer
at higher temperatures, thereby increasing the volume of precipitates.
Kruth et al. also concluded that formation of aligned pores within the SLM-
fabricated parts may likely be a consequence of choosing inappropriate scan spacing.

104
Insufficient overlap between neighbouring scan tracks, caused by increased scan
spacing, results in almost vertically aligned pores in the front section of a SLM part as
shown in Figure 2.39(a). In this case the scan spacing was increased to 100 μm while
the other optimised parameters were kept unchanged. Decreasing the scan spacing
below the optimised setting, may also create diagonally aligned pores in the front section.
It is suggested that the angle of slope of pore alignment is affected by the scan spacing:
the higher the spacing, the higher the slope angle [125]. When the hatch spacing equals
the melt pool width, as shown in Figure 2.39, the angle is 90ºC and the pores are aligned
vertically.
Figure 2.39(b) shows the side view of a Ti6Al4V part that is produced at
optimised process parameters using unidirectional scanning strategy. The layers are
scanned from right to the left, thereby remaining identical thermal profiles when each
layer is being scanned. Since the grains solidify in the direction perpendicular to the
isotherms, the grains are tilted from the building direction as observed in the figure.
Therefore the orientation of the grains is highly dependent on the scanning speed and
scanning strategy, but also on the local part geometry. Consequently, the scanning
strategy may be a powerful tool to control the grain orientation, and hence the
microstructural texture.
Kruth et al. also performed laser re-melting (LSR) and investigated the
microstructure formed. The LSR parameters are scan speed of 200mm/s, laser power of
100W, spot size of 200 μm, and a scan spacing factor of 0.1. From the investigation, the
cellular/dendritic structure of the LSR zone is more apparent than that of the layers that
are not re-melted (see Figure 2.40). In addition, the cell size is finer in the LSR
microstructures, being equiaxed and homogenously visible throughout the re-melted
zone.

105
Figure 2.38 - Influence of scanning speed on microstructure of SLM built parts, (a) side view, (b)
front view [54]
Figure 2.39 - Micrographs of SLM built parts: (a) front view of an increased scan spacing, (b)
influence of scan strategy on grain direction [54]

106
Figure 2.40 - SEM pictures of AISI 316L stainless steel part when last layer was re-melted 10 times,
(a) low magnification, (b) high magnification [54]
Gu et al.[89] reviewed the grain size and structure of AM processed metallic
components. High energy laser interaction gives rise to superfast heating and melting of
materials, which is inevitably followed by a rapid solidification on cooling. Laser based
AM processes normally offer high heating/cooling rates at the solid/liquid interface in a
small sized molten pool. In addition, the rates of quenching that occurs by conduction
of heat through the substrate are sufficiently fast to produce a rapid solidification
microstructure. Hence, Gu et al. concludes, as a characteristic of AM processed
materials, grain refinement is generally expected, due to an insufficient time for grain
development/growth.
Gu et al. also discussed about the anisotropic characteristics of AM processed
metallic materials. The conventional dendritic solidification features of Fe based
materials are not well developed after AM, but showing a directional cellular
microstructure, due to the insufficient growth of secondary dendrite arms. On the other

107
hand, either chemical concentration or temperature gradients in molten pool may
generate surface tension gradient and resultant Marangoni convection [126, 127]
making the solidification a non-steady state process. Meanwhile, rapid solidification has
the kinetic limitation of crystal growth that normally follows the direction of maximum
heat flow. The simultaneous but competitive action of the above two mechanisms, i.e. a
non-equilibrium solidification nature versus a localised directional growth tendency,
may result in a variety of crystal orientations with a localised regularity [128]. Therefore,
AM processed metallic materials may have the inherent, more or less, anisotropic
characteristics.
Gu et al. described another important feature that is intrinsic to AM processed
components as the microstructural difference, both in grain size and its structure,
between the bottom and top of a part along laser deposition direction. As the conduction,
convection, and radiation conditions change, the different thermal histories of different
layers of the part lead to the variation of microstructures along the height direction.
Hence, Gu et al. concluded that the occurrence of grain coarsening is due to: (i)
considerable remelting of the top of previous layer; (ii) long term thermal accumulation.
2.4 Literature Review Summary
Based on the literature review, under the ASTM A131 standard specification for
structural steel for ships, EH36 grade has been chosen for this research. The material is
a high tensile strength steel commonly used in structural components for shipbuilding.
Its chemical composition, tensile requirements and impact requirements are stated in
Table 2.18, Table 2.19 and Table 2.20 respectively. Literature search on the roles of
alloying elements have also been conducted and it will contribute towards the
understanding of the microstructure and mechanical properties of AM processed EH36
material.

108
Table 2.18 - Chemical requirements for ASTM A131 EH36 steel
Element Chemical Composition, % max unless
otherwise specified
Grades EH36
Carbon, C 0.18
Manganese, Mn 0.90 – 1.60
Silicon, Si 0.10 – 0.50
Phosphorous, P 0.035
Sulphur, S 0.035
Aluminium (acid soluble), min, Al 0.015
Columbium, Cb/Niobium, Nb 0.02 – 0.05
Vanadium, V 0.05 – 0.10
Titanium, Ti 0.02
Copper, Cu 0.35
Chromium, Cr 0.20
Nickel, Ni 0.40
Molybdenum, Mo 0.08
Nitrogen, N -
Table 2.19 - Tensile requirements for ASTM A131 EH36
Grade Tensile Strength, ksi
[MPa]
Yield Point,
min, ksi
[MPa]
Elongation in 8 in.
[200mm], min, %
Elongation in 2 in.
[50mm], min, %
EH36 71 to 90 [490 to
620]
51 [355] 19 22

109
Table 2.20 - Charpy V-notch impact requirements for ASTM A131 EH36
Grade Test Temperature, ⁰C Average Absorbed Energy, min, J
t ≤ 50 mm t > 50 mm
t ≤ 70 mm
t > 70 mm
t ≤ 100 mm
EH36 -40 34 41 50
Even though the chemical composition may be optimised for conventional steel
processing, it is important to consider the carbon equivalent (CE). CE is calculated based
on the alloying elements, and is used to determine properties of alloy when the material
(usually ferrous) contains more than just Carbon. CE is especially used in welding to
determine the welding processes required to avoid defects. This would be the main
consideration factor because the parts produced will eventually be joined or welded to
other parts. CE is also used in the development of heat treatment methodology. The CE
for EH36 is shown in Table 2.21.
Table 2.21 - Carbon Equivalent for ASTM A131 EH36
Grade Carbon Equivalent , max, %
Thickness (t ), mm
t ≤ 50 mm t > 50 mm
t ≤ 100 mm
EH36 0.38 0.40
A literature review on the various AM processes under the ASTM F2792 – 12a
Standard Terminology for Additive Manufacturing Technologies standard has also been
conducted. The review focussed on the technologies that can process metallic material.
Selective laser melting (SLM) was eventually selected for this research. Based on the
literature review, parts produced by SLM could achieve very high relative density of
more than 99%. As compared to the same material processed by conventional
manufacturing, SLM produced metallic components have superior tensile and hardness
properties, but lacks in toughness and fatigue performance. These properties are usually
recovered using post processing (eg. heat treatment). Surface quality is usually poor,
and is especially important when considering fatigue crack initiation. Literature showed

110
that the microstructure of SLM built metallic parts are usually characterised by fine
grains with elongation due to temperature gradient in the building direction. SLM built
steels are usually anisotropic and exhibit acicular martensitic structure. The
microstructure can be controlled by varying the process parameters, such as laser power,
scan velocity, hatch spacing, layer thickness and scanning strategy.
A literature search based on using SLM to process EH36 steel was conducted
but no results were found. There is no known literature to use SLM to process EH36
steel. Hence, based on the literature, it has been concluded that the research will
characterise EH36 steel processed by SLM.
2.5 Research Objective and Scope
The overarching objective of the research work is to determine the technical
feasibility of adopting additive manufacturing as a fabrication technology for marine
structures used in shipbuilding, to achieve better design and improved performance. The
objective can be further divided into four main sections:
1) To study the metallic materials conventionally used in shipbuilding and identify
one material for the research work.
2) To study the commercial AM processes and identify a suitable AM process.
3) To develop a repeatable and optimised set of processing parameters for the
fabrication of parts using identified AM process.
4) To establish the mechanical performance of parts produced using the identified
AM process and validate it against industry requirements.
Based on the derived objectives, a set of intended scope is developed. Main
points of the scope can be summarised as follows:
1) To review marine grade shipbuilding steel and provide justifications into the
selection of ASTM A131 EH36 grade
2) To review existing AM technologies and provide justifications into the selection
of SLM process

111
3) To conduct preliminary investigations into using SLM to process ASTM A131
EH36 steel.
4) To develop a set of SLM process parameters to process ASTM A131 EH36 steel
for achieving high relative density.
5) To characterise ASTM A131 EH36 samples built using developed SLM process
parameters.
6) To evaluate and determine the mechanical properties according to ASTM
standards.
7) To investigate using heat treatment to enhance the mechanical properties.
8) To analyse and characterise microstructure.
9) To print a scaled 3D complex joint and validate against microstructure results.
ASTM A131 EH36 grade is an unknown material in the AM materials
development area. Although primarily a low carbon steel, its applications in high
strength and low temperatures areas may put the material under a separate category from
the common low carbon steel materials. Hence, it is important to understand the melting
and forming mechanism of EH36 material using AM technology. This can be achieved
by building samples and observing the microstructure using techniques such as light
optical microscopy (LOM) and scanning electron microscopy (SEM). Further analysis
to complement the investigation could be performed on fracture surfaces.
The process parameters are predicted to have an effect on the final
microstructure of the test sample. Hence, the research project will also investigate how
different process parameters may have an effect on the microstructure and final
mechanical properties. This allows for the material properties to be correlated to the in-
process behaviour and can thus be used to predict the performance of future research
projects.
Mechanical tests will be carried out according to ASTM standards and marine
Classification standards. Coupons will be printed to undergo tests such as tensile and
Charpy v-notch impact toughness tests at specified temperatures. The test results may
be used to correlate the microstructure analysis results and the mechanical properties.
An actual component will then be fabricated and subsequently have its microstructure
observed, and the results will be validated against that obtained from the test coupons.

112
2.6 Proposed Research Roadmap
The proposed research activities to cover the above scope will be outline here.

113
Literature Review
• Marine grade shipbuilding steel and EH36 Steel
• AM and SLM technologies
• Properties of metal produced by SLM
Preliminary Investigations
• Derive preliminary SLM process parameters
• Fabrication of density cubes
• Testing of density cubes
• Microstructure analysis using LOM and SEM
Optimisation of Process Parameters
• Modify SLM process parameters
• Fabrication of density cubes
• Testing of density cubes
• Microstructure analysis using LOM and SEM
Mechanical Properties Characterisation
• Tensile tests
• Impact tests
• Analysis of tests specimens (eg fracture surfaces)
Post Processing Investigations
• Heat treatment methodology
• Microstructure analysis using LOM and SEM

114
Chapter Three Preliminary Investigations
A preliminary investigation of ASTM A131 EH36 high tensile strength steel
used in shipbuilding applications was conducted by Wu et al. [129]. In the study, critical
SLM process parameters such as hatch spacing and scanning speed were investigated to
produce benchmark parts with high density and tensile and impact toughness properties
comparable to conventionally produced EH36 parts. Microstructural analysis was also
carried out to investigate the effects of varying process parameters. The results will
facilitate future studies on SLM of shipbuilding steel.
3.1 Material
The ASTM A131 EH36 high tensile strength steel powder used in the
investigation was supplied by Sandvik Osprey Limited (UK) produced by gas
atomisation process using Nitrogen as the atomisation gas. According to the data sheet
provided by Sandvik Osprey, 95.8% of the particle ranges between particle sizes of 20
μm to 53 μm, while 2.2% is less than 20 μm. Powder tests were carried out and the
results are shown in Table 3.1. The particle size distribution was carried out by an
independent test body and the results show that the median diameter of particle was 44
μm, with less than 10% smaller than 28 μm and 90% with diameter up to 49 μm. The
results also indicated that the mean diameter of particles was 47 μm.
Table 3.2 shows the composition of the EH36 powder in weight percentage
provided by Osprey (based on results from the independent test body) compared with
the elemental composition specified in ASTM A131 standard. Except for Chromium
(Cr) and Vanadium (V), the rest of the elements are within the range stipulated by the
standard. V exceeded the range by 10%, but is relatively less significant compared to
Cr, which exceeded the range by 80%. As discussed in Chapter 2.1.1.1, Cr has a positive
effect on hardenability for high strength steel, and hence the higher percentage of the
element in the EH36 powder is not expected to have detrimental effect. Nonetheless,
since EH36 is an unknown material processed by SLM, this set of elemental
composition was still used in the preliminary studies and will be used as a reference for
future works. Using the elemental composition of EH36 powder provided by Osprey,
the CE obtained is 0.45%.

115
Figure 3.1 shows a scanning electron microscopy (SEM) image of the particles
provided by Osprey. From the image, it can be observed that the particles are mostly
spherical in shape, except for a small percentage of irregularities which did not cause
any deposition issues in the study.
Table 3.1 - ASTM A131 Powder Tests [129]
Powder Tests
Tap Density 5.1 g/cc Particle Size Distribution
Hall Flow 27.6 sec/50g D10 28 μm
D50 44 μm
D90 49 μm

116
Table 3.2 - Elemental composition of ASTM A131 powder [129]
Element Osprey ASTM A131
% %
Manganese, Mn 1.14 0.9-1.6
Chromium, Cr 0.36 0.2 (max)
Silicon, Si 0.24 0.1-0.5
Nickel, Ni 0.11 0.4 (max)
Carbon, C 0.15 0.18 (max)
Vanadium, V 0.11 0.05-0.1
Niobium, Nb 0.03 0.02-0.05
Molybdenum, Mo 0.02 0.08 (max)
Aluminum, Al 0.02 0.015 (min)
Copper, Cu 0.05 0.35 (max)
Phosphorous, P 0.06 0.035 (max)
Titanium, Ti <0.01 0.02 (max)
Sulphur, S 0.007 0.035 (max)
Calcium, Ca 0.003 0.005 (max)
Iron, Fe Balance Balance
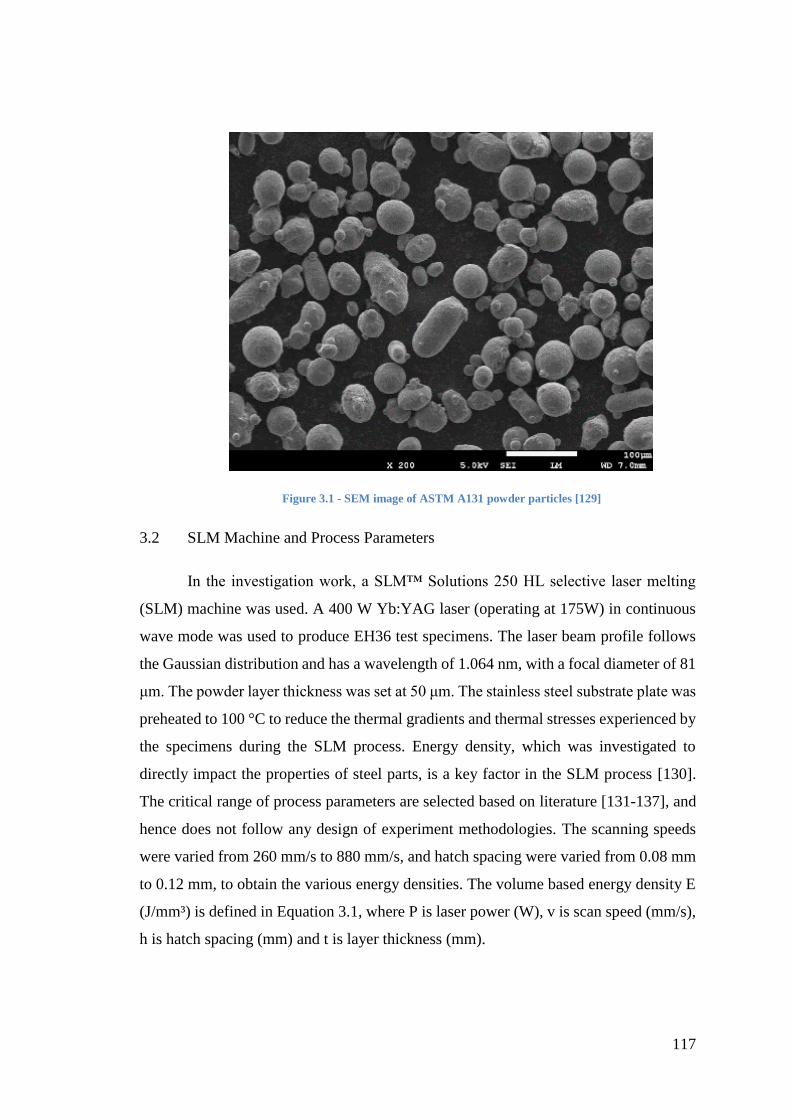
117
Figure 3.1 - SEM image of ASTM A131 powder particles [129]
3.2 SLM Machine and Process Parameters
In the investigation work, a SLM™ Solutions 250 HL selective laser melting
(SLM) machine was used. A 400 W Yb:YAG laser (operating at 175W) in continuous
wave mode was used to produce EH36 test specimens. The laser beam profile follows
the Gaussian distribution and has a wavelength of 1.064 nm, with a focal diameter of 81
μm. The powder layer thickness was set at 50 μm. The stainless steel substrate plate was
preheated to 100 °C to reduce the thermal gradients and thermal stresses experienced by
the specimens during the SLM process. Energy density, which was investigated to
directly impact the properties of steel parts, is a key factor in the SLM process [130].
The critical range of process parameters are selected based on literature [131-137], and
hence does not follow any design of experiment methodologies. The scanning speeds
were varied from 260 mm/s to 880 mm/s, and hatch spacing were varied from 0.08 mm
to 0.12 mm, to obtain the various energy densities. The volume based energy density E
(J/mm³) is defined in Equation 3.1, where P is laser power (W), v is scan speed (mm/s),
h is hatch spacing (mm) and t is layer thickness (mm).

118
𝐸 = 𝑃
𝑣 × ℎ × 𝑡
(3.1)
Based on Equation (3.1), a set of parameters were obtained for energy densities
ranging from 50 J/mm³ to 111 J/mm³. The parameters are detailed in Table 3.3, where
the values in the table refer to laser scanning speed values in mm/s.
Table 3.3 - SLM process parameters (red values refer to laser scanning speed in mm/s) [129]
Power: 175W Layer Thickness: 50 µm
Energy (J/mm³)
Hatch Spacing (mm)
0.08 0.09 0.1 0.11 0.12
111 390 350 310 290 260
105 422 376 336 312 280
99 454 402 362 334 300
92 486 428 388 356 320
86 518 454 414 378 340
81 550 480 440 400 360
75 616 540 492 448 404
69 682 600 544 496 448
62 748 660 596 544 492
56 814 720 648 592 536
50 880 780 700 640 580
3.3 Results
Two sets of specimens were built for preliminary investigations. The first set
investigated feasibility of printing of designs with thin wall, curved and straight vertical

119
surfaces, and slopes with 45 degrees. They were visually observed to have no visible
cracks, distortion or surface porosities as illustrated in Figure 3.2. The second batch of
specimens made of up 5mm x 5mm x 5mm cubes are printed for density tests as shown
in Figure 3.3. They were then put through several other analyses to determine the
integrity of the specimens – x-ray diffraction, light optical microscopy and scanning
electron microscopy.
Figure 3.2 - SLM built test specimens [129]
Figure 3.3 - SLM built density cubes
10mm
10mm

120
3.3.1 Density Test
Density tests were carried out as the optimisation variable during the process
parameter selection because it is a significant factor affecting mechanical properties
[138]. As discussed in Chapter 2.3.1, density determines a part’s mechanical properties,
which in turn determines the part performance, and during process parameter
optimisation, the goal is to achieve as high a density as possible. The tests are performed
in accordance to ASTM B962 – 13: Standard Test Methods for Density of Compacted
or Sintered Powder Metallurgy (PM) Products Using Archimedes’ Principle. Masses of
each specimen in air (ma) and water (mw) were measured independently an electronic
balance with ±1mg accuracy. The measured values were then inserted into Equation (3.2)
to obtain specimen density 𝜌s, where 𝜌w is the density of water (1 g/cm³).
𝜌𝑠 =𝑚𝑎
𝑚𝑎 − 𝑚𝑤 × 𝜌𝑤 (3.2)
The results of the tests are shown in Table 3.4, where table values represent
density values in g/cm3. The highest density value of 7.64 g/cm3 was obtained at an
energy density of 92 J/mm3 using parameters of 0.12 mm hatch spacing, powder at
175W, 50 µm layer thickness and 320 mm/s laser scanning speed. Compared to the
relative density of the compacted supplied powder (7.83 g/cm3), or the material’s bulk
density of 7.85 g/cm3, the results translated to 97.57% fully dense part. Graph of SLM
built part density vs energy density (Figure 3.4) was plotted with a polynomial fit based
on the results to identify the effects of the parameters on part density. It was observed
that increasing energy density generally improves part density, but the two peaks
represented 2 separate optimal energy density values of approximately 60 J/mm3 and
100 J/mm3. At the points with higher density, it was observed that hatch spacings were
generally higher and scan speeds were generally lower.
Table 3.4 - Results from density test (red values represent density in g/cm3) [129]
Power: 175W Layer Thickness: 50 µm
Energy (J/mm3)
Hatch Spacing (mm)
0.08 0.09 0.1 0.11 0.12

121
111 7.178 7.519 7.433 7.489 7.535
105 7.374 7.512 7.528 7.46 7.594
99 7.489 7.483 7.526 7.56 7.573
92 7.476 7.477 7.466 7.528 7.64
86 7.419 7.486 7.494 7.48 7.525
81 7.385 7.465 7.469 7.43 7.401
75 7.503 7.419 7.456 7.434 7.42
69 7.523 7.516 7.482 7.473 7.47
62 7.511 7.537 7.378 7.332 7.361
56 7.47 7.468 7.278 7.391 7.365
50 7.471 7.273 7.014 7.075 6.982
Figure 3.4 - Graph of SLM built part density vs energy density [129]

122
3.3.2 X-Ray Diffraction
X-ray diffraction (XRD) analysis was conducted on the sample powder and SLM
built specimen using Philips X’pert instrument. The raw data was collected and analyzed
using X’pert Highscore software Version 1.0d. The data analysis library was from
JCPDS – International Centre for Diffraction Data. The analysis conditions are listed in
Table 3.5. The XRD analysis is capable of identifying compounds in concentrations
greater than 1.0 wt%. The XRD results shown in Figure 3.5 indicated Fe α-phases in
both the sample powder and SLM built specimen. (A complete set of XRD results for
the subsequent part of the research can be found in Chapter 6.3. Please refer to Figure
6.4.)
Table 3.5 - XRD analysis conditions
Target Voltage Current 2e scan range Step size and time
Cu with Ni filter 40 kV 35 mA 10° – 90° 0.01° and 0.25s
Figure 3.5 - XRD of EH36 (a) powder sample, (b) SLM built specimen [129]
α (110)
α (200) α (211) α (220)

123
Figure 3.6 - XRD of quenched commercial low carbon steel [139]
3.3.3 Light Optical Microscopy
Figure 3.7 shows the micrographs of the SLM built specimen taken with light
optical microscopy (LOM). Slight porosities could be observed, which were consistent
to the density test results discussed earlier. No surface cracks were observed through
LOM. The specimen was then etched using 3% nital and observed under LOM. The
micrographs revealed distinct dark and light bands, as shown using the red dotted lines,
indicating possible areas of different microstructural evolution.
Figure 3.7 - (a) Image of unetched SLM built specimen showing slight porosities, (b) etched sample showing
microstructure and porosity indicating incomplete melting of powder particle [129]
(a) (b)

124
3.3.4 Scanning Electron Microscopy
The SLM built specimen was then observed under scanning electron microscopy
(SEM). Figure 3.8 shows the micrographs obtained. In (a), 2 distinct zones were
observed, where Zone A shows finer grains and Zone B shows coarser grains. This
indicated a possible laser melt track along Zone A, where the higher energy intensity in
the middle of the melt produced finer grain structure. This is a typical phenomena of
SLM processed metals due to the overlapping effect of the laser scanning melt track
[140]. (b) shows possible acicular martensitic structure in the SLM built specimen
consistent with previous works conducted on SLM of steel [141]. A high magnification
SEM image of such possible acicular martensitic microstructure is shown in Figure 3.9.
Figure 3.8 - SEM images of SLM built specimen showing (a) fine grains (Zone A) vs coarse grains (Zone B),
(b) acicular martensitic structure [129]
Zone A Zone B Zone B
(a) (b) Scanning direction
x
y Build
direction

125
Figure 3.9 - High magnification SEM image of SLM built specimen showing acicular martensitic
structure
10µm
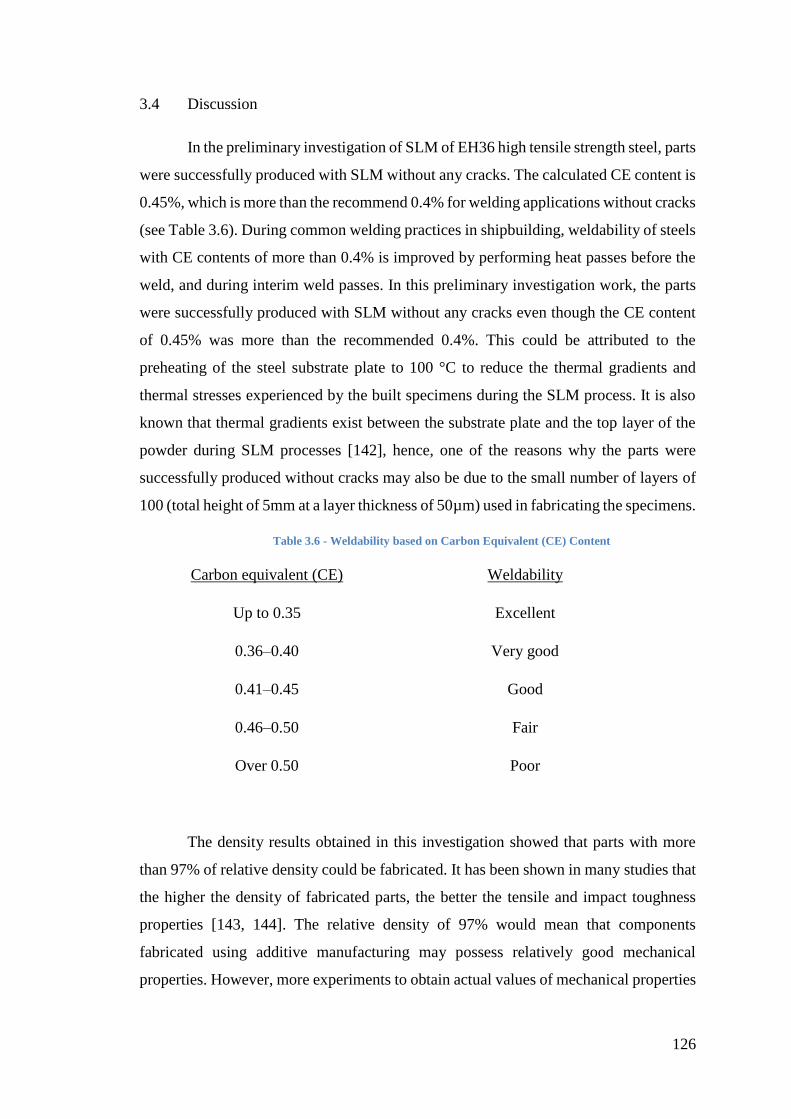
126
3.4 Discussion
In the preliminary investigation of SLM of EH36 high tensile strength steel, parts
were successfully produced with SLM without any cracks. The calculated CE content is
0.45%, which is more than the recommend 0.4% for welding applications without cracks
(see Table 3.6). During common welding practices in shipbuilding, weldability of steels
with CE contents of more than 0.4% is improved by performing heat passes before the
weld, and during interim weld passes. In this preliminary investigation work, the parts
were successfully produced with SLM without any cracks even though the CE content
of 0.45% was more than the recommended 0.4%. This could be attributed to the
preheating of the steel substrate plate to 100 °C to reduce the thermal gradients and
thermal stresses experienced by the built specimens during the SLM process. It is also
known that thermal gradients exist between the substrate plate and the top layer of the
powder during SLM processes [142], hence, one of the reasons why the parts were
successfully produced without cracks may also be due to the small number of layers of
100 (total height of 5mm at a layer thickness of 50µm) used in fabricating the specimens.
Table 3.6 - Weldability based on Carbon Equivalent (CE) Content
Carbon equivalent (CE) Weldability
Up to 0.35 Excellent
0.36–0.40 Very good
0.41–0.45 Good
0.46–0.50 Fair
Over 0.50 Poor
The density results obtained in this investigation showed that parts with more
than 97% of relative density could be fabricated. It has been shown in many studies that
the higher the density of fabricated parts, the better the tensile and impact toughness
properties [143, 144]. The relative density of 97% would mean that components
fabricated using additive manufacturing may possess relatively good mechanical
properties. However, more experiments to obtain actual values of mechanical properties

127
of EH36 components produced using additive manufacturing are required to ascertain
this assumption.
From the XRD results, the peak positions for both sample powder and SLM built
specimen are similar, indicating no change in phases after the SLM process, which
suggests that the powder may be martensitic to begin with. This is true for gas atomised
steel powder as demonstrated in the work by Gulsoy et al. in [145]. It can also be
observed that there was no traces of austenite or carbide detected in the diffraction
patterns, indicating a possible full martensitic microstructure formed during the SLM
inherent rapid cooling process similar to that of quenching. This is consistent with the
work done by Zhang et al. in [139], where XRD was used to inspect quenched
commercial low carbon steel with 0.2%C and lath martensite was observed.
The micrographs also showed the possible formation of acicular martensitic
structure in the SLM built parts, concurring with the results and observation from the
XRD analysis. This is consistent with other reported works for steels built using SLM
process [146, 147]. This means that the parts produced may exhibit properties similar to
martensitic steel, which means high strength and hardness, but relatively low on the
toughness values. Hence, heat treatment processes need to be developed to recover these
mechanical properties.
3.5 Conclusion
(1) The preliminary investigation suggested that SLM is capable of producing EH36
high tensile strength steel parts with a relative density of more than 97%, without
visual and surface cracks. This was achieved at an energy density of 92 J/mm³
using parameters of 0.12 mm hatch spacing, power at 175W, 50 µm layer
thickness and 320 mm/s laser scanning speed. The stainless steel substrate plate
was preheated to 100 °C to reduce the thermal gradients and thermal stresses
experienced by the specimens during the SLM process.
(2) In the SLM fabrication of specimen pieces, slight irregularities in powder shape
did not affect the SLM process and deposition.
(3) The study also indicated the possibility of producing higher density EH36 parts
as the energy density could be increased further.

128
(4) Since the microstructure formed is preliminarily determined to be primarily
martensitic in nature, it was thus suggested for more work to be performed to
confirm, and thereafter develop a suitable heat treatment method to recover the
mechanical properties.
(5) It was also suggested to conduct more work to determine the mechanical
properties of parts produced using SLM for EH36 high tensile strength steel.
(6) This lays the foundation for future work of additive manufacturing of EH36,
which will be important in establishing the technical feasibility of fabricating
high tensile strength steel components for the shipbuilding industry.

129
Chapter Four Mechanical Tests
The preliminary investigation suggested that SLM is capable of producing EH36
parts with a relative density of more than 97%, without visual and surface cracks. Hence,
the mechanical performance of SLM produced EH36 parts are next studied, namely
tensile, impact toughness and hardness. In this mechanical performance study, the
identified critical SLM process parameters from the preliminary investigation, including
hatch spacing, laser power, layer thickness and scanning speed, were used to produce
tensile and impact toughness test specimens. The hardness values are then obtained from
the tensile test specimens. The results will facilitate future studies on SLM of
shipbuilding steel.
4.1 Experimental
The material used in this study is from the same batch as the preliminary
investigations. Hence, the powder characteristics are exactly similar. The machine used
in this study is a SLM™ Solutions 280 HL SLM machine. Based on the results from the
preliminary investigation, the Yb:YAG laser will be operating at 175W in continuous
wave mode to produce the test specimens. The laser beam profile follows the Gaussian
distribution and has a wavelength of 1.064 nm, with a focal diameter of 81 μm. The
powder layer thickness was set at 50 μm. The stainless steel substrate plate was
preheated to 100 °C to reduce the thermal gradients and thermal stresses experienced by
the specimens during the SLM process. The scanning speed will be set to 320 mm/s and
the hatch spacing will be set at 0.12 mm.
A total of 210 specimens were fabricated according to the configuration shown
in Table 4.1. The dimensions of the test coupons are shown in Figure 4.1. The tensile
test coupons were fabricated in 3 different positions, namely horizontal (XY plane),
vertical (Z direction) and 45 degrees to the vertical (45⁰). The dimensions and test
methods are in accordance to E8/E8M − 13a: Standard Test Methods for Tension
Testing of Metallic Materials. For the horizontal specimens, two sets of tensile test
coupons will be tested – the as built test coupons and the machined test coupons – to
investigate the effect of machining on the tensile properties. The machined test coupons
are printed with an additional layer of material all round with thickness 1.5mm.

130
The Charpy V-notched test coupons were fabricated in 3 positions, namely the
notch facing upwards (Notch Up), sideways (Notch Side) or 45 degrees to the vertical
(Notch 45⁰). The dimensions and test methods are in accordance to E23 − 12c: Standard
Test Methods for Notched Bar Impact Testing of Metallic Materials. The notches are
printed together with the specimens, instead of machined in afterwards. The Charpy
tests will be conducted at both 0⁰C and -40⁰C. The various build orientations are
illustrated in Figure 4.2. Three specimens are produced for each configuration and the
average values from the tests will be taken.
The hardness test coupons are prepared from the tensile test coupons. The test
methods are in accordance to E92 – 17: Standard Test Methods for Vickers Hardness
and Knoop Hardness of Metallic Materials. The Vickers hardness values are measured.
Table 4.1 - Number of specimens for tensile and Charpy test
Test Coupons Heat Treatment (⁰C)
Nil 205 315 425 540 650 800
Tensile Test Coupons (XY plane, Machined) 3 3 3 3 3 3 3
Tensile Test Coupons (XY plane, As-Built) 3 3 3 3 3 3 3
Tensile Test Coupons (Z direction) 3 3 3 3 3 3 3
Tensile Test Coupons (45⁰) 3 3 3 3 3 3 3
Charpy Test Coupons (Notch Up), 0 ⁰C 3 3 3 3 3 3 3
Charpy Test Coupons (Notch Side), 0 ⁰C 3 3 3 3 3 3 3
Charpy Test Coupons (Notch 45⁰), 0 ⁰C 3 3 3 3 3 3 3
Charpy Test Coupons (Notch Up), -40 ⁰C 3 3 3 3 3 3 3
Charpy Test Coupons (Notch Side), -40 ⁰C 3 3 3 3 3 3 3
Charpy Test Coupons (Notch 45⁰), -40 ⁰C 3 3 3 3 3 3 3

131
Figure 4.1 - Dimensions of SLM built test coupons (a) tensile test coupons, (b) Charpy test coupons
Figure 4.2 - SLM test coupon orientations (a) tensile test coupon, 45⁰; (b) tensile test coupon, vertical;
(c) tensile test coupon, horizontal; (d) Charpy test coupon, notch facing up; (e) Charpy test coupon, notch
facing side; (e) Charpy test coupon, notch facing 45⁰

132
4.2 Heat Treatment
As discussed in Chapter 2.3.4, SLM of steel produces martensitic microstructure,
and this is also shown in the preliminary investigations in Chapter 3.3.3. Although the
martensite structure is thermodynamically unstable (see discussion in Chapter 2.1.1.2),
the steel will remain in this condition more or less indefinitely at room temperature
because for a change to take place bulk diffusion of carbon, with an activation energy
Q of approximately 83 kJ mol−1 atom, is necessary [25]. The presence of martensite in
a quenched steel, while greatly increasing its hardness and tensile strength, causes the
material to be brittle. The hardness and strength of martensite increase sharply with
increase in C content. Contributions to the strength arise from the carbon in solution,
carbides precipitated during the quench, dislocations introduced during the
transformation and the grain size. Thus, by a carefully controlled tempering treatment,
the quenching stresses can be relieved and some of the carbon can precipitate from the
supersaturated solid solution to form a finely dispersed carbide phase. In this way, the
toughness of the steel can be vastly improved with very little detriment to its hardness
and tensile properties.
A tempering heat treatment process is applied to obtain a preliminary
understanding of the behaviour of EH36 steel after post process heat treatment. For each
of the configuration of the test coupons, six temperatures of heat treatment are applied,
with the seventh specimen receiving no heat treatment, which is it will be tested as-built.
The samples received heat treatment in a non-inert gas atmosphere heat furnace (see
Table 4.3). The target temperatures selected for this heat treatment investigation (see
Table 4.2) are based on industry guidelines from ASM International for tempering of
steels [148]. The maximum target temperature was purposely kept below the material’s
eutectoid temperature to prevent recrystallisation. With reference to the Fe-C phase
diagram shown in Figure 2.1, it is expected that spheroidisation will be observed in
specimens which underwent heat treatment of 650 ⁰C and above.
The heat treatment process is as follows:

133
1. Heat to target temperature at rate of 100⁰C/Hr
2. Hold for 2 hours
3. Chamber cool to room temperature
Table 4.2 - ASM International recommended temperatures for tempering of steel [148]
Fahrenheit (⁰F) Degrees Celsius (⁰C)
400 205
600 315
800 425
1000 540
1200 650
1470 800
Table 4.3 - Heat furnace details
Model ThermConcept KL 15/13
Operating Parameters:
Max Temperature 1340 ⁰C
Protective Gas Connection Nil
Dimensions (mm) Width x Depth x
Height
250 x 340 x 170
4.3 Results
The SLM fabricated test coupons were observed to have no visible cracks, but
this is expected because the process parameters and powder used are exactly the same
as in the preliminary investigation, where the results showed that SLM is capable of
producing EH36 parts with a relative density of more than 97%, without visible surface

134
cracks. Figure 4.3 shows the SLM built test coupons. The parts are built on the build
plate, shown in (a), and removed via wire-cut electrical discharge machining (EDM)
and put through heat treatment. The tensile test coupons in (b) and Charpy test coupons
in (c) both showed discolouration after heat treatment.
Figure 4.3 - SLM built test coupons. (a) As-built on build plate; (b) Tensile test coupons following heat
treatment; (c) Charpy test coupons following heat treatment
4.3.1 Tensile Strength
The tensile test methods are in accordance to E8/E8M − 13a: Standard Test
Methods for Tension Testing of Metallic Materials, on a Universal Testing Machine,
Instron Model 8801. The yield strength (0.2% offset) and ultimate tensile strength are
obtained, as well as the elongation which will be shown in Chapter 4.3.2. The results of
the tensile tests are shown in Table 4.4, Figure 4.4 and Figure 4.5. Figure 4.6 to Figure
4.13 show the individual tensile results with error bars, which show the precision of the
measured tensile properties. A traditionally manufactured coupon is also inserted as
reference data. The highest tensile yield strength of 1030 MPa is obtained at the
machined condition fabricated along the XY plane. The highest ultimate tensile strength
of 1057 MPa is obtained at the machined condition with post-processing heat treatment
of 205⁰C, fabricated along the XY plane. This far exceeded the requirements stipulated
in the ASTM A131 standards, where the yield strength required is 355 MPa and the
ultimate tensile strength is 490 MPa.
Z direction built coupons generally have poorer tensile properties while coupons
built in the XY plane and the 45⁰ directions exhibit generally similar tensile properties.
Machined coupons generally perform slightly better in terms of the tensile properties.
(a) (b) (c)
As-built 205⁰C 315⁰C 425⁰C 540⁰C 650⁰C 800⁰C As-
built 205⁰C 315⁰C 425⁰C 540⁰C 650⁰C 800⁰C
10mm 10mm

135
For the yield strength, as built 45⁰, XY plane and machined coupons perform 32%, 26%
and 34% respectively better than the z direction built coupons. For the ultimate tensile
strength, as built 45⁰, XY plane and machined coupons perform 36%, 35% and 36%
respectively better than the z direction built coupons. As the temperature for the heat
treatment increases, it can be observed that both the yield strength and ultimate tensile
strength decreases slightly, by up to 20% (or 170MPa) from 205⁰C to 540⁰C, but
especially drastically after 540⁰C, with a reduction of 20% to 40% (or 385MPa) for the
650⁰C coupons and 50% to 65% (or 648MPa) for the 800⁰C coupons. Compared against
the ASTM A131 standards, results from all temperatures of heat treatment meet the
requirements, except at 800⁰C, where the yield strength and ultimate tensile strength do
not meet the standards.
Table 4.4 - Table of tensile test results for SLM built samples
Test Coupons Heat Treatment (⁰C)
Nil 205 315 425 540 650 800
Yield
Strength
(MPa)
Tensile Test Coupons (XY, Machined) 1030 996 960 980 967 645 382
Tensile Test Coupons (XY, As-Built) 966 972 901 952 934 670 341
Tensile Test Coupons (Z) 767 618 599 654 733 629 311
Tensile Test Coupons (45⁰) 1011 1027 1037 923 1007 759 393
ASTM A131 Standards 355
Ultimate
Tensile
Strength
(MPa)
Tensile Test Coupons (XY, Machined) 1054 1057 1008 988 988 734 522
Tensile Test Coupons (XY, As-Built) 1045 1026 895 993 977 736 448
Tensile Test Coupons (Z) 775 708 614 745 748 681 334
Tensile Test Coupons (45⁰) 1054 984 981 927 1049 835 499
ASTM A131 Standards 490 - 690

136
Figure 4.4 - Graph of tensile test results (Yield Strength) for SLM built samples
Figure 4.5 - Graph of tensile test results (Ultimate Tensile Strength) for SLM built samples
0
200
400
600
800
1000
1200
Nil 205 315 425 540 650 800
Stre
ngt
h (
MP
a)
Heat Treatment (⁰C)
Yield Strength of SLM Built Samples
XY, Machined XY, As-Built Z Direction 45⁰ Reference ASTM A131
0
200
400
600
800
1000
1200
Nil 205 315 425 540 650 800
Stre
ngt
h (
MP
a)
Heat Treatment (⁰C)
Ultimate Tensile Strength of SLM Built Samples
XY, Machined XY, As-Built Z Direction 45⁰ Reference ASTM A131

137
Figure 4.6 - Graph of Yield Strength (XY, Machined) with error bar
Figure 4.7 - Graph of Yield Strength (XY, As-built) with error bar
300
400
500
600
700
800
900
1000
1100
Nil 205 315 425 540 650 800
Stre
ngt
h (
MP
a)
Heat Treatment (⁰C)
Yield Strength Tensile Test Coupons (XY, Machined)
300
400
500
600
700
800
900
1000
1100
Nil 205 315 425 540 650 800
Stre
ngt
h (
MP
a)
Heat Treatment (⁰C)
Yield Strength Tensile Test Coupons (XY, As-Built)

138
Figure 4.8 - Graph of Ultimate Tensile Strength (XY, Machined) with error bar
Figure 4.9 - Graph of Ultimate Tensile Strength (XY, As-built) with error bar
400
500
600
700
800
900
1000
1100
Nil 205 315 425 540 650 800
Stre
ngt
h (
MP
a)
Heat Treatment (⁰C)
Ultimate Tensile Strength Tensile Test Coupons (XY, Machined)
400
500
600
700
800
900
1000
1100
1200
Nil 205 315 425 540 650 800
Stre
ngt
h (
MP
a)
Heat Treatment (⁰C)
Ultimate Tensile Strength Tensile Test Coupons (XY, As-Built)

139
Figure 4.10- Graph of Yield Strength (Z) with error bar
Figure 4.11 - Graph of Yield Strength (45⁰) with error bar
200
300
400
500
600
700
800
900
Nil 205 315 425 540 650 800
Stre
ngt
h (
MP
a)
Heat Treatment (⁰C)
Yield Strength Tensile Test Coupons (Z)
300
400
500
600
700
800
900
1000
1100
Nil 205 315 425 540 650 800
Stre
ngt
h (
MP
a)
Heat Treatment (⁰C)
Yield Strength Tensile Test Coupons (45)

140
Figure 4.12- Graph of Ultimate Tensile Strength (Z) with error bar
Figure 4.13 - Graph of Ultimate Yield Strength (45⁰) with error bar
4.3.2 Elongation
The results of the elongation values are shown in Table 4.5 and Figure 4.14.
Figure 4.15 to Figure 4.18 show the individual elongation results with error bars. Except
for the coupons built in the 45⁰ direction, the rest of the as-built coupons without post-
process heat treatment have low elongation values of less than 6%. Heat treatment with
300
400
500
600
700
800
900
Nil 205 315 425 540 650 800
Stre
ngt
h (
MP
a)
Heat Treatment (⁰C)
Ultimate Tensile Strength Tensile Test Coupons (Z)
400
500
600
700
800
900
1000
1100
1200
Nil 205 315 425 540 650 800
Stre
ngt
h (
MP
a)
Heat Treatment (⁰C)
Ultimate Tensile Strength Tensile Test Coupons (45)

141
temperatures up to 540⁰C show little or no significant improvement to the elongation
values. At 650⁰C, elongation values for all coupons show significant improvement to as
high as 23.3% in the 45⁰ coupons. At 800⁰C, the elongation values improved even more
significantly to 25.3% for XY machined coupons, 29% for XY as-built coupons, and
37.3% in the 45⁰ coupons. The coupons built in the Z direction performed relatively
poorly regardless of heat treatment. Compared to the ASTM A131 standards of
elongation value at 22%, the 45⁰ coupons meet the requirements at 650⁰C heat treatment,
while the XY machined and the XY as-built coupons will require a heat treatment of up
to 800⁰C.
Table 4.5 - Table of elongation results for SLM built samples
Test Coupons Heat Treatment (⁰C)
Nil 205 315 425 540 650 800
Elongation,
Lo = 4d (%)
Tensile Test Coupons (XY, Machined) 3.3 5.8 4.3 6.2 5.2 12.3 25.3
Tensile Test Coupons (XY, As-Built) 4.4 3.6 2.8 4.4 5.7 10.1 29.0
Tensile Test Coupons (Z) 5.1 4.9 2.1 6.2 4.7 5.1 8.0
Tensile Test Coupons (45⁰) 13.2 12.3 14.8 12.1 16.2 23.3 37.3
ASTM A131 Standards 22
Figure 4.14 - Graph of elongation results for SLM built samples
0
5
10
15
20
25
30
35
40
45
Nil 205 315 425 540 650 800
Elo
nga
tio
n (
%)
Heat Treatment (⁰C)
Elongation Values of SLM Built Samples
XY, Machined XY, As-Built Z Direction 45⁰ Reference ASTM A131

142
Figure 4.15 - Graph of elongation results (XY, machined) with error bar
Figure 4.16 - Graph of elongation results (XY, As-Built) with error bar
0
5
10
15
20
25
30
Nil 205 315 425 540 650 800
Elo
nga
tio
n (
%)
Heat Treatment (⁰C)
Tensile Test Coupons (Machined)
0
5
10
15
20
25
30
35
1 2 3 4 5 6 7
Elo
nga
tio
n (
%)
Heat Treatment (⁰C)
Tensile Test Coupons (As-Built)

143
Figure 4.17 - Graph of elongation results (Z) with error bar
Figure 4.18 - Graph of elongation results (45⁰) with error bar
4.3.3 Charpy V-Notched Impact Toughness
The test methods are in accordance to E23 − 12c: Standard Test Methods for
Notched Bar Impact Testing of Metallic Materials, on a Zwick Impact Machine. The
results of the Charpy V-notched impact toughness tests are shown in Table 4.6 and
Figure 4.19 and Figure 4.20. Figure 4.21 to Figure 4.26 show the individual Charpy
1
2
3
4
5
6
7
8
9
Nil 205 315 425 540 650 800
Elo
nga
tio
n (
%)
Heat Treatment (⁰C)
Tensile Test Coupons (Z)
0
5
10
15
20
25
30
35
1 2 3 4 5 6 7
Elo
nga
tio
n (
%)
Heat Treatment (⁰C)
Tensile Test Coupons (45)

144
results with error bars. For the non-heat treated test coupons, the Charpy values built
with notches facing up and to the side are relatively lower at 28J and 25J for Charpy
tests conducted at 0⁰C and -40⁰C respectively, and the Charpy values built with notches
facing 45⁰ are relatively higher at 46J and 44J for Charpy tests conducted at 0⁰C and -
40⁰C respectively. The Charpy values for all types of coupons remain about their
respective ranges as the temperatures for heat treatment increases, until about 540⁰C.
The Charpy values increase significantly after 540⁰C. At 650⁰C heat treatment
temperature, the Charpy values for both the test coupons built with the notches facing
the sides and facing 45⁰ have values beyond the required 34J at both 0⁰C and -40⁰C
testing temperatures, ranging from 32J to 89J. In general, the Charpy values of coupons
built with notches facing 45⁰ are almost twice as high as those built with the notch facing
up or to the side. The maximum results of approximately 89J for Charpy coupons built
with notches facing 45⁰ occurs at a heat treatment temperature of 800⁰C.
Concluding the results from Charpy tests, compared against the ASTM A131
standards which has a requirement of 34J at both 0⁰C and -40⁰C, test coupons built with
the notches facing the sides met the requirements with heat treatment at 650⁰C and
800⁰C, while for test coupons built with notches facing the top, only the results with
heat treatment at 800⁰C meets the requirements. For test coupons with notches facing
45⁰, all the results from non-heat treated to all heat treated coupons met the requirements.
Table 4.6 – Table of Charpy test results for SLM built samples
Test Coupons Heat Treatment (⁰C)
Nil 205 315 425 540 650 800
Energy
(J)
Charpy Test Coupons (Notch Up), 0 ⁰C 28.3 27.3 27.7 28.7 35.7 32.7 56.3
Charpy Test Coupons (Notch Side), 0 ⁰C 28.3 30.3 27.0 28.3 25.3 38.7 83.3
Charpy Test Coupons (Notch 45⁰), 0 ⁰C 46.3 48.7 47.7 48.0 48.0 64.0 89.0
ASTM A131 Standards, 0 ⁰C 34
Charpy Test Coupons (Notch Up), -40 ⁰C 24.7 26.3 24.7 21.7 27.7 33.3 48.3
Charpy Test Coupons (Notch Side), -40 ⁰C 25.0 28.0 29.3 24.0 28.0 35.7 49.0
Charpy Test Coupons (Notch 45⁰), -40 ⁰C 44.7 46.0 51.7 47.8 46.3 62.5 89.2
ASTM A131 Standards, -40 ⁰C 34

145
Figure 4.19 – Graph of Charpy test results for SLM built samples at 0⁰C
Figure 4.20 – Graph of Charpy test results for SLM built samples at -40⁰C
0.0
20.0
40.0
60.0
80.0
100.0
Nil 205 315 425 540 650 800
Ener
gy A
bso
rbed
(J)
Heat Treatment (⁰C)
Charpy Impact Values of SLM Built Samples at 0⁰C
Notch Up Notch Side Notch 45⁰ ASTM A131
0.0
20.0
40.0
60.0
80.0
100.0
Nil 205 315 425 540 650 800
Ene
rgy
Ab
sorb
ed
(J)
Heat Treatment (⁰C)
Charpy Impact Values of SLM Built Samples at -40⁰C
Notch Up Notch Side Notch 45⁰ ASTM A131

146
Figure 4.21 – Graph of Charpy test results (Notch Up) at 0⁰C with error bar
Figure 4.22 – Graph of Charpy test results (Notch Side) at 0⁰C with error bar
25
30
35
40
45
50
55
60
65
Nil 205 315 425 540 650 800
Ener
gy A
bso
rbed
(J)
Heat Treatment (⁰C)
0 ⁰C Charpy Test Coupons (Notch Up)
0
20
40
60
80
100
Nil 205 315 425 540 650 800
Ener
gy A
bso
rbed
(J)
Heat Treatment (⁰C)
0 ⁰C Charpy Test Coupons (Notch Side)

147
Figure 4.23 – Graph of Charpy test results (Notch 45⁰) at 0⁰C with error bar
Figure 4.24 – Graph of Charpy test results (Notch Up) at -40⁰C with error bar
40
50
60
70
80
90
100
Nil 205 315 425 540 650 800
Ener
gy A
bso
rbed
(J)
Heat Treatment (⁰C)
0 ⁰C Charpy Test Coupons (45)
20
25
30
35
40
45
50
55
Nil 205 315 425 540 650 800
Ener
gy A
bso
rbed
(J)
Heat Treatment (⁰C)
- 40 ⁰C Charpy Test Coupons (Notch Up)

148
Figure 4.25 – Graph of Charpy test results (Notch Side) at -40⁰C with error bar
Figure 4.26 – Graph of Charpy test results (Notch 45⁰) at -40⁰C with error bar
4.3.4 Vickers Hardness
The test methods are in accordance to E92 – 17: Standard Test Methods for
Vickers Hardness and Knoop Hardness of Metallic Materials, on a Future-Tech
Microhardness Tester FM-300e. Vickers hardness measurements were made with a low-
load hardness tester at load level of 300g and at a constant indentor dwell time of 15s.
20
25
30
35
40
45
50
55
Nil 205 315 425 540 650 800
Ener
gy A
bso
rbed
(J)
Heat Treatment (⁰C)
- 40 ⁰C Charpy Test Coupons (Notch Side)
30
40
50
60
70
80
90
100
Nil 205 315 425 540 650 800
Ener
gy A
bso
rbed
(J)
Heat Treatment (⁰C)
- 40 ⁰C Charpy Test Coupons (45)

149
All indentation tests were carried under ambient laboratory conditions. After indentation,
the length of each of the two diagonals of the square-shaped Vickers indentation was
immediately measured by optical microscopy with a magnification of 500 and an error
of measurement of ±0.01 µm. The Vickers hardness numbers, Hv, for the specimens are
listed in Table 4.7. Each of the data points represents an average of measurements from
at least five tests.
The Vickers hardness numbers are generally high at about 350 to 370 for the as-
built and samples with heat treatment of up to 540 ⁰C. The value decreases from 650 ⁰C,
and decrease further at 800 ⁰C. Vickers hardness values are not a requirement in the
ASTM A131 standards for EH36, but it will be used to ascertain martensitic
microstructure in the discussions.
Table 4.7 – Table of Vickers hardness values for SLM built samples
Test Coupons Heat Treatment (⁰C)
Nil 205 315 425 540 650 800
Hv 352 372 353 355 369 252 200
Figure 4.27 – Graph of Vickers hardness numbers (test coupons)
4.4 Discussion
150
200
250
300
350
400
450
0 0 0 0 0 0 0
Har
dn
ess,
Hv
Heat Treatment (⁰C)
Vickers Hardness

150
The SLM built test coupons were fabricated using the process parameters from
the previous preliminary investigation, hence they were successfully built without
visible surface cracks. The as-built tensile values obtained are relatively higher than the
requirements stated in ASTM A131 (based on casting), with the test coupons built in
the 45⁰, XY as-built and XY machined having about 25%-36% higher tensile values
than the coupons built in the z-direction. These equate to an approximately 200-280
increase in MPa. Maximum yield strength is at 1030 MPa and maximum ultimate tensile
strength is at 1054 MPa. Elongation values are lower than requirements stated in ASTM
A131, measuring between 3.3% to 5.1% for the XY machined, XY as-built and z-
direction coupons, and 13.2% for the 45⁰ coupons. Even at 13.2% elongation, this is
only about 60% of the ASTM A131 requirements of 22%. The as-built Charpy values
are generally lower than the requirements of 34J as stated in ASTM A131, at about 24J
to 28J, except for those built with the notch facing 45⁰ which measures about 44J to 46J.
This characteristics of SLM built steels having high tensile strength and low
ductility performance is consistent with the results obtained from other studies [54, 83].
Based on the preliminary investigation, the microstructure of the SLM built specimens
exhibit martensitic-like characteristics, which explains the high strength and low
ductility performance [149]. This is consistent with previous discussions in Chapter
2.1.1.2, as the SLM process creates a very rapid cooling of the EH36 built specimens by
staying on the left of the TTT curve (see Figure 2.2). This is also further evidenced in
the high Vickers hardness numbers consistent with that of low carbon steel with as-
quenched martensitic microstructure [150], where Vickers hardness values are in the
range of 300 to 400 for low carbon steel (see Figure 4.28).

151
Figure 4.28 - Hardness of tempered martensite in iron-carbon (Fe-C) steel [150]
However, Zhao et al. has shown that an optimised heat treatment process may
improve impact toughness performance by up to 50% [151]. In the work, a novel heat-
treatment process was performed on two low-C high-Si/Al steels, and effectively
reduces the size and volume fraction of blocky martensite/austenite phases, giving rise
to much enhanced impact toughness and improved tensile properties. The preliminary
tempering heat treatment process developed in this study showed results consistent with
that of the study conducted by Zhao et al., where the Charpy values in this study
significantly improved at heat treatment temperatures of more than 540⁰C.
The structural changes which occur on tempering may be considered to take
place in three stages. In the primary stage, fine particles of iron carbides precipitates,
with the corresponding formation of low-carbon martensite. This low-carbon martensite
grows at the expense of the high-carbon martensite, and causes a loss of tetragonality in
martensite. This usually occurs between room temperature and 250⁰C. During the
second stage any retained austenite in the steel begins to decompose, usually in the
temperature range of 230-300⁰C. However, the direct observation of retained austenite
in the microstructure has always been rather difficult, particularly if it is present in low

152
concentrations. The little available evidence suggests that in the range 230-300°C,
retained austenite decomposes to bainite, ferrite and cementite, but there is almost no
literature on detailed comparison between this phase and lower bainite. The third stage
is marked by the formation of cementite platelets. During tempering, transition carbides
and low-temperature martensite are replaced by cementite and ferrite. The degree to
which these three stages overlap will be affected by the temperature and the carbon
content. [25]
At temperatures beyond the third stage, the cementite particles undergo a
coarsening process and essentially lose their crystallographic morphology, becoming
spheroidized. The coarsening commences between 300 and 400°C, while
spheroidization takes place increasingly up to 700°C. At the higher end of this range of
temperature the martensite lath boundaries are replaced by more equiaxed ferrite grain
boundaries by a process which is best described as recrystallization. The final result is
an equiaxed array of ferrite grains with coarse spheroidized particles of Fe3C partly, but
not exclusively, in the grain boundaries. In consequence, the final structure produced
will be governed by the initial choice of steel and the properties, and hence thermal
treatment, required.
It was also observed that the Charpy values for different build orientations are
different. This was also reported in the works by Kruth et al. [54], which presented
results of SLM built maraging steel toughness test coupons, and the test coupon built
with the notch facing up had the lowest toughness values.
In general, coupons built in the Z direction have the poorest mechanical
performance results. This is consistent with literature of typical SLM built parts, which
attributes this to weak regions between the melting layers, a characteristic of layer by
layer fabrication techniques [152]. The results presented in the studies from the
reference literature may not be representative of those in this study. Zhang et al.
investigated the effect of the orientation of the build on the mechanical properties of
stainless steel 316L, and the results show that the specimens built in the z-direction have
the lowest mechanical properties. Zhang et al. attributed the poorer properties to a poorer
bonding strength between two adjacent slices/layers, than two adjacent meltings (track
or tool path).

153
However, in certain works, vertically SLM built samples were reported to have
better mechanical performance than horizontally built sample [153]. Wen et al.
explained the mechanics behind this observation by examining the molten pool
boundaries (MPB) in [116]. In his work, Wen et al. investigated 2 types of MPBs (see
Figure 4.29) formed by the SLM process, namely the “layer-layer” MPB and the “track-
track MPB”. The MPBs generated from the layer-by-layer overlapping along the Z-axis
are called as “layer-layer” MPBs (Figure 4.29 (b)), and those generated through track-
by-track overlapping in the X–Y plane are referred to as “track-track” MPBs (Figure
4.29 (c)). For the horizontal specimen, the crack begins at “track–track” MPBs (see
Figure 4.30 (a)) when the tensile loading reaches a certain value, and then extends
quickly along “track–track” MPBs slipping surfaces with the continuous increase of the
tensile loading until the occurrence of fracture and the formation of cleavage surfaces.
For the vertical specimen, the tensile direction is along the “track–track” MPBs (see
Figure 4.30 (b)) slipping surfaces. Cracks initiate first at the “track–track” MPBs when
the tensile loading increases to a certain extent, and then form cleavage steps along the
loading direction. Subsequently, the cracks extend along the “layer–layer” MPBs,
resulting in the fine dimples. Compared with the horizontal specimen, the vertical
specimen has less quantity of “track–track” MPBs on the same cross-sectional area,
which means a lower probability of cracking and better tensile performance for the
vertical samples. In addition, the bonding force of “layer–layer” MPBs is stronger than
that of track–track MPBs, and “layer–layer” MPBs will slip when exerted with a tensile
loading.
Figure 4.29 - Schematic diagram of molten pools during SLM process: (a) single molten pool; (b)
“layer–layer” MPBs; (c) “track–track” MPBs. The arrows represent the grain orientations. [116]

154
Figure 4.30 - Schematic diagrams of MPBs on the stress cross sections of (a) the horizontal and (b)
vertical specimens. [116]
Regardless, in all the literature on using SLM to process steel based components,
parts built in the 45⁰ direction (from the bed substrate) usually improves the mechanical
properties as compared parts built in the horizontal and vertical directions. In the work
conducted by Wang et al. [154], where crystallographic orientation was used to
determine the relation to mechanical properties, the Schmid factor was lowest in
specimens built in the 45⁰ direction, which then gives the highest tensile strength (recall
that tensile strength can be determined by dividing the critical resolved shear stress value
by the maximum Schmid factor). In the work conducted by Wen et al. [116], where
MPBs was used to determine the relation to mechanical properties, the properties were
highest in the 45⁰ built direction. When the loading direction is parallel to the X–Y plane
(i.e. the horizontal specimens), the slipping occurs preferentially along the “track–track”
MPBs surfaces. When the loading direction is along Z-axis (i.e. the vertical specimens),
the slipping will occur primarily along the “layer–layer” MPBs, but also slightly
affected by the “track-track” MPBs surfaces. As the angle of the built transits to 45⁰ to
the horizontal, slipping at both “track–track” and “layer–layer” MPBs surfaces
decreases for both the horizontal and vertical specimens respectively, hence minimising
slipping for both built directions.
In the work conducted in this study, specimens built in the vertical direction
generally have the poorest mechanical properties, and specimens built in the 45⁰
direction have the best mechanical properties. Based on the analysis above, the poor
mechanical properties found in the vertically built specimens may be speculated to be
due to the poor bonding between layers as presented in literature studies. In addition,
the presence of porosities (recall that the density achieved is 97.57%) may have also
contributed to the increase in defects and crack initiations. By printing the specimens in

155
the 45⁰ direction, the mechanical properties can be improved by minimising slipping
occurring in both horizontal and vertical specimens, which usually have high slipping
along “layer–layer” and “track-track” MPBs surfaces at vertical and horizontal
specimens respectively.
4.5 Conclusion
(1) Tensile test coupons and impact toughness test coupons were successfully built
and tested (in accordance to ASTM E8 and E23) with process parameters and
powder identical to that of the preliminary investigation. Preliminary post
process heat treatment was conducted.
(2) Mechanical properties are generally poorer in the vertical built direction and best
in the 45⁰ built direction.
(3) Tensile, Elongation and Charpy results showed that building in the 45⁰ direction
to horizontal and with heat treatment, the properties meet ASTM A131
requirements. Final selection of the test results as shown in Table 4.8.
Table 4.8 - Final test results for SLM built EH36 steel specimen (45⁰ built specimens)
Properties Standards
(ASTM A131)
SLM
As-Built
SLM Built with
Heat Treatment @
650 ⁰C
Yield Strength (MPa) 355 1011±69.9 759±28.2
Ultimate Tensile Strength
(MPa) 490 – 620 1054±28.0 835±63.5
Elongation (%) 22 13.2±0.17 23.3±1.03
Charpy at -40 ⁰C (J) 34 44.7±6.43 62.5±14.57

156
Chapter Five Fracture Surface Morphology
Studying the morphology of fracture surfaces allows for the analysis of causes
of material failures. Through examination of the origin of cracking, the cause of crack
initiation may be determined, which includes common features such as inclusions, voids,
contamination, and stress concentrations. Many studies have been conducted to
characterise fracture surface morphology to correlate the results and their corresponding
mechanical properties[155]. From Chapter Four, the tensile and impact properties of
EH36 can thus be validated and characterised by studying the fracture surface
morphologies.
5.1. Procedure
The tensile and impact Charpy samples from Chapter Four were then prepared
for examination using a scanning electron microscope (SEM, please refer to Table 5.1
for details). Fractography images of the samples were obtained at 50 times and 1000
times magnification.
Table 5.1 - SEM details and parameters
Model Zeiss EVO | MA 15 (Tungsten filament)
Operating Parameters:
Vacuum Mode High Vacuum
Imaging Detector Backscattered electron detector (BSD)
Excitation Voltage 20kV
Working distance 10 mm
5.2. Results
The images from SEM show clearly the fracture morphologies, indicating the
fracture modes whether they were brittle or ductile failures. Figure 5.1 and Figure 5.2
show SEM images of tensile coupons at 50x and 1000x magnification respectively,

157
while Figure 5.3 and Figure 5.4 show that of the Charpy coupons. Regions showing un-
melted particles and voids at the failure zone were purposely selected for discussion.
Figure 5.1 - SEM images of tensile coupons at 50x magnification (a) no heat treatment, (b) 205⁰C, (c) 315⁰C,
(d) 425⁰C, (e) 540⁰C, (f) 650⁰C, (g) 800⁰C, (h) reference sample
Figure 5.2 - SEM images of tensile coupons at 1000x magnification (a) no heat treatment, (b) 205⁰C,
(c) 315⁰C, (d) 425⁰C, (e) 540⁰C, (f) 650⁰C, (g) 800⁰C, (h) reference sample
(a) (b) (c) (d)
(e) (f) (g) (h)
(a) (b) (c) (d)
(e) (f) (g) (h)

158
Figure 5.3 - SEM images of Charpy coupons at 50x magnification (a) no heat treatment, (b) 205⁰C, (c) 315⁰C,
(d) 425⁰C, (e) 540⁰C, (f) 650⁰C, (g) 800⁰C, (h) reference sample
Figure 5.4 - SEM images of Charpy coupons at 1000x magnification (a) no heat treatment, (b) 205⁰C,
(c) 315⁰C, (d) 425⁰C, (e) 540⁰C, (f) 650⁰C, (g) 800⁰C, (h) reference sample
5.3. Discussion
5.3.1 Ductility
The fractography images of the SLM produced test samples (see images (a) to
(g) of Figure 5.1 to Figure 5.4) show a general trend of higher proportion of fine faceted
cleavage structures. It is observed that the reference sample (see images (h)), which is
produced by TMCP (see Chapter 2.1.1.3), shows larger, river-like cleavage structure
(Figure 5.4 (h)). In general, during fracture, the crack propagates until it is impeded, for
example at precipitates or grain boundaries. Because the grains are generally at different
orientations to one another, the crack usually divides into terrace-like steps when
(a) (b) (c) (d)
(e) (f) (g) (h)
(a) (b) (c) (d)
(e) (f) (g) (h)

159
crossing a grain boundary. The newly created different crack planes join together during
further crack propagation producing a characteristic river-like pattern.
Both types of samples show dimple like structures as secondary structure, with
the TMCP produced ones having more significant dimple secondary structure. In a
ductile failure, cavities arisen from inclusions or coarser precipitates are enlarged and
during further yielding the material between them is necked and sheared. It was also
observed that the dimple like structures are more apparent as the temperature of heat
treatment increases. The depth of these dimples can be used as a first approximation to
the level of ductility. The SLM produced samples also had smaller dimples
(approximately 1-5 microns wide) compared to the TMCP produced one which had
larger dimples (approximately 8-10 microns wide). A study [156] was conducted to
correlate the size of dimples to its mechanical properties, and have concluded that larger
dimple sizes correlate with higher ductility values. Comparing these, the SLM produced
samples can thus be considered less ductile.
In addition to the observed fracture structure, powder particles of up to 50
microns were also seen in the micrographs. These spherical powder particles are clear
evidence of incomplete melting during the SLM process. The presence of these un-
melted powder may have contributed to the initiation of the fracture, which had also
been discussed in works by Gong et al. [157], where he correlated regions of brittle
fracture to lack of fusion defects. Interconnected porosity is more conducive to crack
propagation because the crack grows through the path of least resistance[144], and in
this case seems especially likely since several of the un-melted particles are seen in the
same region. As a result, these fractures may have been prematurely accelerated due to
the presence of such defects.
5.3.2 Density and Defects
The SEM images also show a large scatter of unmelted particles, giving rise to
several pockets of void across the samples. The amount of voids also slightly decreased
with the increase in temperature of heat treatment. This is consistent with the density
tests results obtained in Chapter 3.3.1, where the density obtained for SLM as-built part
was approximately 97.57%. It is well documented in prior studies that a fully dense
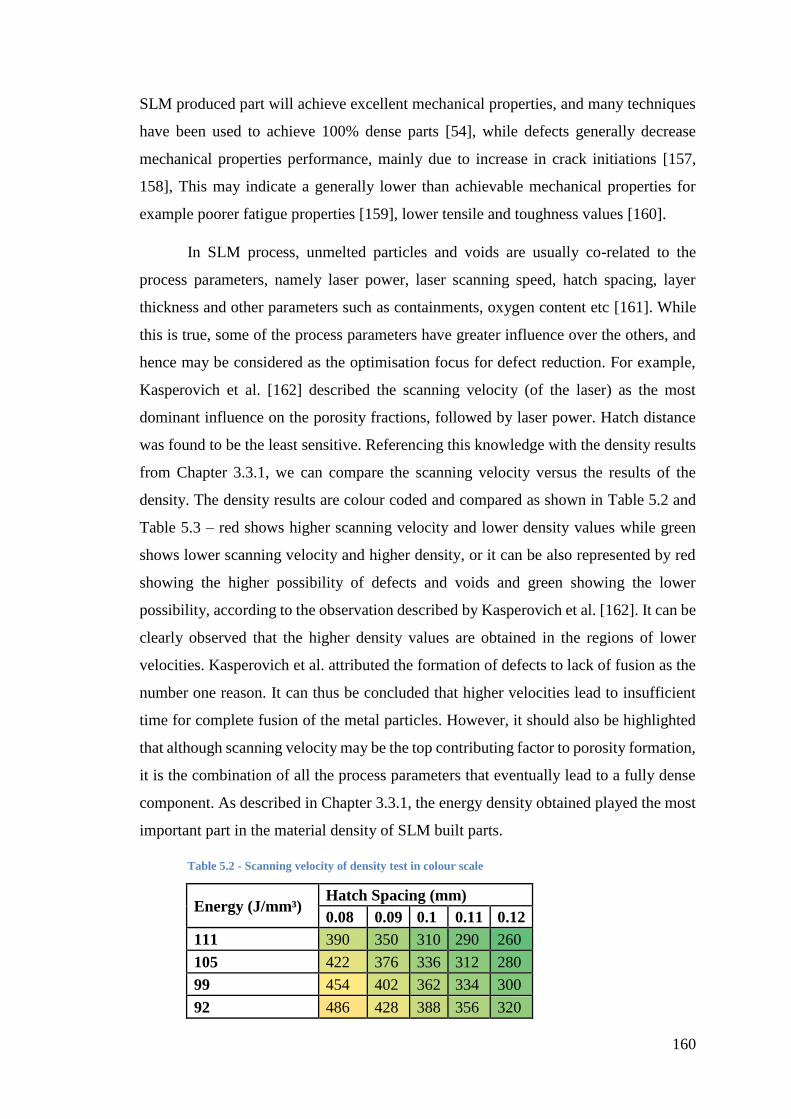
160
SLM produced part will achieve excellent mechanical properties, and many techniques
have been used to achieve 100% dense parts [54], while defects generally decrease
mechanical properties performance, mainly due to increase in crack initiations [157,
158], This may indicate a generally lower than achievable mechanical properties for
example poorer fatigue properties [159], lower tensile and toughness values [160].
In SLM process, unmelted particles and voids are usually co-related to the
process parameters, namely laser power, laser scanning speed, hatch spacing, layer
thickness and other parameters such as containments, oxygen content etc [161]. While
this is true, some of the process parameters have greater influence over the others, and
hence may be considered as the optimisation focus for defect reduction. For example,
Kasperovich et al. [162] described the scanning velocity (of the laser) as the most
dominant influence on the porosity fractions, followed by laser power. Hatch distance
was found to be the least sensitive. Referencing this knowledge with the density results
from Chapter 3.3.1, we can compare the scanning velocity versus the results of the
density. The density results are colour coded and compared as shown in Table 5.2 and
Table 5.3 – red shows higher scanning velocity and lower density values while green
shows lower scanning velocity and higher density, or it can be also represented by red
showing the higher possibility of defects and voids and green showing the lower
possibility, according to the observation described by Kasperovich et al. [162]. It can be
clearly observed that the higher density values are obtained in the regions of lower
velocities. Kasperovich et al. attributed the formation of defects to lack of fusion as the
number one reason. It can thus be concluded that higher velocities lead to insufficient
time for complete fusion of the metal particles. However, it should also be highlighted
that although scanning velocity may be the top contributing factor to porosity formation,
it is the combination of all the process parameters that eventually lead to a fully dense
component. As described in Chapter 3.3.1, the energy density obtained played the most
important part in the material density of SLM built parts.
Table 5.2 - Scanning velocity of density test in colour scale
Energy (J/mm³) Hatch Spacing (mm)
0.08 0.09 0.1 0.11 0.12
111 390 350 310 290 260
105 422 376 336 312 280
99 454 402 362 334 300
92 486 428 388 356 320

161
86 518 454 414 378 340
81 550 480 440 400 360
75 616 540 492 448 404
69 682 600 544 496 448
62 748 660 596 544 492
56 814 720 648 592 536
50 880 780 700 640 580
Table 5.3 - Density values of density test in colour scale
Energy (J/mm3) Hatch Spacing (mm)
0.08 0.09 0.1 0.11 0.12
111 7.178 7.519 7.433 7.489 7.535
105 7.374 7.512 7.528 7.46 7.594
99 7.489 7.483 7.526 7.56 7.573
92 7.476 7.477 7.466 7.528 7.64
86 7.419 7.486 7.494 7.48 7.525
81 7.385 7.465 7.469 7.43 7.401
75 7.503 7.419 7.456 7.434 7.42
69 7.523 7.516 7.482 7.473 7.47
62 7.511 7.537 7.378 7.332 7.361
56 7.47 7.468 7.278 7.391 7.365
50 7.471 7.273 7.014 7.075 6.982
5.4. Conclusion
The above observations generally agree with the mechanical properties results
obtained in Chapter Four. The mechanical test results show that SLM as-built EH36
samples generally exhibit high strength, but low elongation and Charpy values. From a
density and defects perspective, the tensile strength increases with increasing density
and decreasing porosity, while ductility decreases with increasing porosity[144]. The
above fractography observations indicate brittle fracture, absence of ductility and the
voids observed may also contribute to undesired failure. Heat treatment generally
decreases the presence of voids and shows a more dimple-like structure, suggesting that
tensile properties decreases as heat treatment temperature increases, and ductility is
recovered as heat treatment temperature increases (see Figure 4.4, Figure 4.5, Figure
4.14, Figure 4.19 and Figure 4.20). These results are consistent with other works on

162
SLM processing of steel based materials [83, 90, 113]. The following conclusions can
be made.
(1) Tensile and impact samples were examined under scanning electron microscope
to characterise the fracture surface morphology.
(2) SLM produced samples are less ductile as compared to TMCP produced samples.
(3) Tensile strength increases with increasing density and decreasing porosity, while
ductility decreases with increasing porosity.

163
Chapter Six Microstructure Characterisation
Studying the microstructure of the samples allows a good understanding of the
properties of the materials being processed. Different microstructures determine the
different properties of the material, and hence is one of the important factors to be
studied. In this study, the microstructure will also be correlated to the mechanical
properties obtained from Chapter Four.
6.1. Iron-Carbon Binary Phase Diagram
The material in this study (EH36) is considered a low alloy low carbon steel. Its
microstructural development may be referenced to the iron-carbon binary phase diagram
(see Figure 2.1), which is a comprehensive illustration of microstructural development
in iron-carbon alloys. It shows the development of microstructure in iron-carbon alloys
depending on the carbon content composition and heat treatment, which will give a good
understanding of the microstructure of steels [163].
In the case of the EH36 material used in this study, its carbon content is 0.15%,
which puts it at the far left of the phase diagram. The maximum target temperature of
800⁰C was purposely kept below the material’s eutectoid temperature to prevent
recrystallisation. With reference to the Fe-C phase diagram, it is expected that
spheroidisation will be observed in specimens which underwent heat treatment of 650⁰C
and above.
6.2. Experimental
Samples were grinded and polish with reference to ASTM E3 - 11(2017):
Standard Guide for Preparation of Metallographic Specimens. Samples were chemically
etched with 5% nital acid (95% methanol – 5% nitric acid) to expose the grain
boundaries and microstructure images were then taken by using an optical microscope
(Model: Zeiss M2M) at 100 times and 1000 times magnification. The samples are also
put through X-Ray Diffraction (XRD) to validate the phase transformations, if any.

164
6.3. Results
Figure 6.1 and Figure 6.2 show microstructure image at 100x magnification, and
Figure 6.3 show that of 1000x magnification. The images show distinctly the layer by
layer formation unique to additive manufacturing, grain growth through the various heat
treatment temperatures and type of microstructure formed. These will be discussed
further in Chapter 6.4.
Figure 6.1 - Microstructure images showing melt pool layers (a) no heat treatment, (b) 205⁰C, (c) 315⁰C, (d)
425⁰C, (e) 540⁰C, (f) 650⁰C, (g) 800⁰C, (h) reference sample
Figure 6.2 - Microstructure images (a) no heat treatment, (b) 205⁰C, (c) 315⁰C, (d) 425⁰C, (e) 540⁰C, (f) 650⁰C,
(g) 800⁰C, (h) reference sample
(a) (b) (c) (d)
(e) (f) (g) (h)
(a) (b) (c) (d)
(e) (f) (g) (h)
z
x
z
x
z
x
z
x
z
x
z
x
z
x
z
x
z
x
z
x
z
x
z
x
z
x
z
x
z
x
z
x
200µm 200µm
200µm
200µm 200µm
200µm
200µm 200µm
200µm 200µm 200µm 200µm
200µm
200µm 200µm
200µm

165
Figure 6.3 - Microstructure images with higher magnification (a) no heat treatment, (b) 205⁰C, (c) 315⁰C, (d)
425⁰C, (e) 540⁰C, (f) 650⁰C, (g) 800⁰C, (h) reference sample
Figure 6.4 - XRD results
6.4. Discussion
As discussed in Chapter 2.3.4, literature has shown that SLM produced
specimens can generally be characterised by a very fine microstructure due to its rapid
cooling process. The results from the preliminary investigation shown in Chapter 3.3.4
agreed with the literature, with SLM as-built EH36 samples exhibiting very fine acicular
martensitic-like microstructure. This was also verified from the hardness values in
(a) (b) (c) (d)
(e) (f) (g) (h)
z
x
z
x
z
x
z
x
z
x
z
x
z
x
z
x 10µm
10µm 10µm
10µm
10µm 10µm 10µm
10µm

166
Chapter 4.3.4. Further work is then performed to study the change in the microstructure
with relation to heat treatment temperatures.
The microstructure images shown in Figure 6.1 show very distinct layer by layer
deposition paths of the SLM process. This observation decreases as the heat treatment
temperature increases. In image (g), the layering effect can be observed to be totally
absent. From Figure 6.2 and Figure 6.3, several characteristics can be observed. The
grain size has coarsened with the increase in heat treatment temperature, from
approximately 1-3 micron in the as-built sample to 5-20 microns in the sample heat
treated with a temperature of 800⁰C. It has also changed from a martensitic-like
microstructure to a ferrite-like dominant microstructure. This transition of
microstructure is also supported by the results of Vickers hardness tests in Chapter 4.3.4,
where the Vickers hardness values for the as-built and samples with heat treatment of
up to 540 ⁰C coincide with that of a martensitic microstructure, and later decreases at
650 ⁰C and 800 ⁰C. This is consistent with existing past works discussed in Chapter 2.3.4,
where high temperature gradients during SLM process leads to fine acicular martensite
[54].
In image (a), the fine grains are generally elongated but without a pre-determined
direction. From literature (see Chapter 2.3.4), during the SLM process, the powder
particles are irradiated and heat is transferred from the top to the bottom of pre-laid
powder layers, so that the elongated grains formed during the solidification process due
to temperature gradient that is created between the powder layers along the building
direction, a result of epitaxial solidification [54]. However, in SLM-fabricated iron parts,
these elongated grains usually were not very obvious. This can be explained by the
weakened temperature gradient due to the presence of phase change during the process
of melting and solidification of iron powder. Nonetheless, there exists elongated grain
shape which changes to more equiaxed as heat treatment temperature increases.
6.4.1 Effect of Heat Treatment
The heat treatment process has a big effect on the microstructure changes in this
study. During the tempering process, the sample is allowed to cool slowly, rather than
cool rapidly, which will result in the martensitic microstructure. The maximum heat

167
treatment temperature of 800⁰C was selected such that the sample can be heated to a
temperature below the lower critical temperature and allowed to cool at a slower rate.
Referencing Figure 6.1, it can be observed that EH36, being a steel with 0.15%
Carbon, will undergo phase transformation during tempering in the following manner.
In images (a), (b) and (c) from Figure 6.3, from temperatures as low as 100⁰C to 300⁰C,
any transition carbides and martensite starts to be replaced by cementite and ferrite (see
Figure 6.5). Past 300⁰C to 400⁰C, images (d) to (e) shows coarsening of cementite
commences to form spheroids, a process known as spheriodisation. This results in a
microstructure of fine spherical cementite particles in a soft ferritic matrix (see Figure
6.6). At this stage, it can be observed that the microstructure is generally ferritic with
small amounts of spheriodised particles of cementite at the grain boundaries (Figure 6.7).
This is also validated through the conduct of XRD (see Figure 6.4), where presence of
cementite is significant enough to be picked up starting from 425⁰C. This will continue
until about 700⁰C, where at the higher range of the temperatures, recrystallisation occurs
to form equiaxed ferrites (see Figure 6.8).
Figure 6.5 – Effect of heat treatment causing formation of cementite (dark bands) and ferrite (bright
regions)
Figure 6.6 – Effect of heat treatment causing spheriodisation
z
x
z
x z
x
z
x
z
x
10µm
10µm 10µm
10µm 10µm

168
Figure 6.7 - Spheroidal carbides
Figure 6.8 – Effect of heat treatment ending up with recrystallisation
The coarsening of the grains leading to grain growth combined with the
recrystallisation process to form ferrites is particularly important to the explanation of
the mechanical properties. Chapters 6.4.2 and 6.4.3 below will explain these phenomena
and correlate them back to the mechanical properties obtained in Chapter Four.
z
x
z
x
50µm
10µm
10µm

169
6.4.2 Grain Boundary Strengthening
The above observations agree very well with the results from the mechanical
testing from Chapter Four. At lower tempering temperatures, the samples produced had
very high strength due to their very fine grained martensitic microstructure. As the grain
size is reduced, strength increases through Hall-Petch equation, or grain boundary
strengthening. In grain boundary strengthening, the grain boundaries act as pinning
points to prevent further dislocation propagation. As shown in Figure 6.9, both slips
planes in Grains A and B are inhibited by the grain boundary shown in green. Since the
grains differs in orientation, more energy is required for a dislocation to change
directions. Since dislocation movement leads to plasticity, this lack of motivation to
dislocate increases the strength. As strength increases, usually ductility decreases since
dislocations have a higher number of boundaries to pile up into and the volume available
for their movement is greatly reduced.
Figure 6.9 - Grain boundary strengthening
This grain boundary strengthening phenomenon unique to SLM due to its
process related rapid cooling rate is also observed and discussed in various other works
[87, 164-166]. The smaller grain sizes, which then increases dislocations at grain
boundaries and creates higher resistance of the dislocations to slip transfer, is reported
in these other works to also affect other materials such as Aluminium, Inconel and
Titanium. It can hence be concluded that the grain boundary strengthening effect is not
unique to only steel. Coupled with the high strength properties of martensitic
microstructures in steel [167], the SLM built samples exhibited high strength at lower
tempering temperatures. However, it is also the same reason that resulted in the low
ductility of the samples.

170
6.4.3 Transformation of Microstructure
Grain size analysis has been performed according to E112-13: Standard Test
Methods for Determining Average Grain Size, and the intercept method is used to
determine the grain sizes. An example of the grain size determination is shown in Figure
6.10.
Figure 6.10 - Grain size determination of SLM produced sample with 800⁰C heat treatment
The as-built samples exhibited a generally fine martensitic-like microstructure
(see Chapter 3.3.3) of less than 1 microns grain size, which gives the material its high
strength but low ductility properties. However, martensite is an unstable phase, and as
the tempering temperature increases, as discussed above, spheriodisation occurs and the
martensitic structure starts to transform into a primarily ferritic microstructure with
small amounts of cementite. This transformation will result in a loss in high strength but
will recover its ductility. As shown at the 650⁰C sample (see image (f) of Figure 6.3),
the microstructure has started to transform into ferrite, and the grains have coarsened
significantly to 5 microns. This, as shown in the results from the mechanical testing, has
resulted in an improvement in its Charpy value, but a decrease in the tensile strength.
As the tempering temperature continues to increase to 800⁰C, the grain size would have
increased to 8 microns, which is close to the TMCP produced sample of 11 microns (see

171
Figure 6.11), but is still smaller and finer, and the ductility would be very much
recovered, but at the sacrifice of tensile strength.
Figure 6.11 – Comparison of grain sizes of SLM processed sample with 800⁰C heat treatment (left),
vs TMCP produced sample (right)
Based on images (e) to (g) of Figure 6.3 showing the transformation of the
microstructure from tempering temperatures of 540⁰C to 650⁰C and 800⁰C, it seems a
fine grained ferritic microstructure may be the optimal requirement for the appropriate
strength versus ductility combination. At 540⁰C, the microstructure is only starting to
transform to ferrites, but the presence of the martensite with its fine grain sizes provides
the required high tensile strength. With reference to the Fe-C phase diagram in Figure
2.1, heating the samples to 800⁰C and then allowing it to cool slowly enables the
decomposition of austenite to form pearlite embedded in ferrite. Furnace cooling to
room temperature also allows the control of the grain sizes, and also allows the cementite
plates to adopt a more spherical shape. At 800⁰C, the grain sizes would have grown too
large for achieving the required strength, although the primarily ferritic microstructure
is desired for its toughness. Between these temperatures, further work needs to be
carried out to optimise and obtain the best combination of microstructure versus the
grain sizes.
6.5. Conclusion
(1) The SLM built and TMCP built samples are prepared and observed under 100x
and 1000x magnifications to characterise the microstructures.
(2) The microstructures obtained were speculated to be primarily fine acicular
martensite in the SLM as-built samples, transforming to fine spherical cementite
z
x
z
x 10µm
10µm

172
particles in a soft ferritic matrix as heat treatment temperatures increase, and
eventually forms equiaxed ferrites with grain sizes smaller than the TMCP
produced samples. While there is indirect evidence of the presence of such
phases, the occurrence is speculated based on existing literature studies.
(3) The smaller grain sizes help to provide higher tensile properties due to grain
boundary strengthening.
(4) Performing heat treatment on the SLM built samples can improve the impact
properties but at a sacrifice of the tensile properties, due to transformation of
microstructure from martensite to cementite and ferrite.
173
Chapter Seven Complex Joint Fabrication and Examination
As discussed in Chapter One, the marine and offshore industry can be
characterised by the multiple processes required to fabricate complex design
components. The objective of this work is to validate AM technology as a
complementary manufacturing technology to eliminate long leadtime associated with
such multiple processes. In this chapter, a scaled version of the typical complex joint
component will be fabricated using the developed process parameters and validated
against the results using microstructural analysis. While a scaled complex joint model
may not accurately represent the process conditions and the results, it provides a
foundation for future work to scale the fabrication of the part to its actual size. For
example, in the processing of a large component using SLM, it is expected that the
thermal conditions within the build chamber will be significantly different from the
scaled model, leading to different microstructural results in the final product, and a
different microstructural transformation in its subsequent heat treatment regime.
Nonetheless, the results from a scaled model will be able to validate the process
parameters developed from the preliminary work and establish a foundation for future
endeavours to achieve large scale fabrication by SLM.
7.1 Overview of Complex Joint
The complex joint used in this study is based on a node of a structural body,
typically used to join 6 trusses or more. A scaled version was fabricated using SLM
process (see Figure 7.1) based on the process parameters obtained in Chapter Three,
with its print orientation as shown in Figure 7.2. Only one print direction was chosen as
the microstructure analysis will be performed in all 3 planes (ie x, y and z), which will
represent similar analysis in other directions of print. In this case, the scaled model was
printed vertically to enable the observation of the microstructure formed at the region
furthest from the build bed. In order to analyse the microstructure at this furthest region,
a section of the complex joint was then removed and examined as shown in Figure 7.3.

174
Figure 7.1 - Photo of scaled complex joint processed by SLM
Figure 7.2 - Orientation of print of scaled complex joint
1097 mm
842.5 mm 244.5 mm
(Height)

175
Figure 7.3 - Section of complex joint removed for examination (shaded in blue)
7.2 Microstructure Examination and SEM-Imaging
In order to validate SLM process for the fabrication of complex joints,
microstructure examination was performed and compared against those obtained from
the test coupons. The examination was performed using scanning electron microscopy
(SEM) on the scaled model as-built without heat treatment.
Figure 7.4 shows 50 times magnification of the cut-out section of the scaled
model, with Face 1 as the x-y plane to the printing process, and Face 2 and Face 3 as the
z plane to the printing process. Doing a 50 times magnification allows understanding of
the SLM process and the types of defects formed. The images show distinct layer by
layer deposition, which is a characteristic of the SLM process. There is also evidence of
porosities between the layers.
Figure 7.5 shows 500 times magnification with the same orientation. A larger
magnification allows for examination of the microstructure formed. The results show
very fine grain structure with an evenly distributed acicular martensitic-like
microstructure.

176
Figure 7.4 - Scaled model SEM imaging mapped to various printed faces
FACE 1
FACE 2
Face 3
y
x
z
x
z
y
200µm
200µm
200µm

177
Figure 7.5 - Scaled model SEM imaging with larger magnification
7.3 Vickers Hardness
Vickers hardness measurements were made to be able to perform a comparison
with the analysis in Chapter 4.4. All tests parameters are similar to the hardness
measurements conducted in Chapter 4.3.4. The Vickers hardness numbers, Hv, for the
FACE 2
FACE 3
FACE 1
y
x
z
x
z
y
20µm
20µm
20µm

178
specimens are listed in Table 7.1. Each of the data points represents an average of
measurements from at least five tests, and the results are plotted in Figure 7.6.
The Vickers hardness numbers are generally high at 323 to 398, with an average
of 349 to 358, for the as-built scaled model. Vickers hardness values are not a
requirement in the ASTM A131 standards for EH36, but it will be used to ascertain the
martensitic-like microstructure in the discussions.
Table 7.1 - Table of Vickers hardness values for SLM built scaled model
Vickers Hardness Sample locations on node
1 2
Hv 349 358
Figure 7.6 - Graph of Vickers hardness numbers (scaled model)
7.4 Discussion
The microstructure obtained from the SEM examination of the scaled model was
used to compare against that obtained from the test coupons. A sample test coupon was
put under SEM with a 500 times magnification and matched with the corresponding
faces of the scale model as shown in Figure 7.7, where (a) shows x-y plane to the printing
process, and (b) and (c) as the z plane to the printing process.
0
50
100
150
200
250
300
350
400
450
1 2
Har
dn
ess,
Hv
Sample location on node
Vickers Hardness

179
Figure 7.7 - Reference SEM images for comparison with scaled model (a) x-y plane, (b) z plane, (c) z
plane
Based on the micrographs obtained from the scaled model, a large number of
martensite-like phase was observed, consistent with that of the micrographs from the
test coupon. The presence of a martensitic-like microstructure is also validated by the
y
x
z
x
z
y
20µm
20µm
20µm

180
hardness measurements of approximately 350 Hv, which is consistent with the hardness
values of as-built test coupons of 352 Hv shown in Chapter 4.3.4. The microstructure is
made up of fine grains, at less than 1 micron, which gives the specimen its mechanical
properties, as discussed in Chapter Six. This observation is also consistent with other
work, for example from Song et al. [168], where the work identified as-built samples
consisting of cellular and columnar microstructures due to the fast cooling and
solidification rates during SLM. Similar observation was also made by Larimian et al.
[169], which identified as-built samples with refined microstructure and attributed it to
the higher cooling rate obtained in SLM process.
However, in Figure 7.7 (b), the micrograph of the test coupon showed distinct
layers of coarser and finer grains, which signifies the layer by layer deposition of SLM
process. In the corresponding micrograph in Figure 7.5 Face 2, this layer by layer
observation is absent. This observation is critical in comparing and identifying the effect
of building a component versus building test coupons. It thus explains why the study
chose to analyse the microstructure at the region furthest from the build bed. Based on
literature, the microstructure formed should be similar no matter the thickness of the
built specimen, as demonstrated in the work by Dzugan et al. [170]. This lack of distinct
layers of coarser and finer grains in the built scaled model can be explained as follows.
During the SLM process, the heat flux is the highest at the solid-liquid interface. The
heat is transferred to the substrate through the previously built layers along the direction
opposite to the building direction during solidification. This repeated thermal gradient
provides epitaxial columnar grain growth in the SLM produced alloys [171]. This grain
growth is not present in the scaled model and could be attributed to the inherent
annealing effect during the SLM process. During the laser scanning, the heat affected
zone from the next scan path may cause partial heat transfer to the previously scanned
layer, creating an annealing effect [172]. This inherent annealing effect may cancel the
effect of the epitaxial columnar grain growth, hence the difference in the micrographs.
Based on this explanation, we can also predict that in the larger actual sized z-oriented
print, the start of the build should look similar to the end of the build.
7.5 Conclusion
(1) A scaled typical complex joint component was fabricated using the developed
process parameters and validated against the results using microstructural

181
analysis. The microstructure obtained from the SEM examination of the scaled
model was used to compare against that obtained from the test coupons.
(2) The microstructure formed in both coupons and scaled model are largely similar,
showing fine acicular martensitic-like microstructure, which will give the
material its high strength but low ductility properties. While there is indirect
evidence of the presence of such phases, the occurrence is speculated based on
existing literature studies.
(3) The consistency between both test coupon and scaled model microstructures
demonstrate repeatability of the developed process parameters and hence
validates the fabrication of complex joints.
(4) The mechanical properties of the as-built samples can hence be improved
(elongation and impact toughness) through the application of heat treatment
regime as discussed in Chapter Four.

182
Chapter Eight Conclusion & Future Work
In this study, selective laser melting (SLM) has been used to process ASTM
A131 EH36 shipbuilding steel, which would have traditionally been processed using
thermomechanical controlled process (TMCP). The approach into the study can be
summarised into two main portions – preliminary investigation into feasibility of using
SLM to process EH36; characterisation of EH36 through mechanical properties and
microstructure analysis.
The research outcome can be summarised as follows.
1) Conducted in-depth literature review on using selective laser melting to fabricate
EH36 material, including density, mechanical properties and microstructure.
2) The preliminary investigation suggested that selective laser melting is capable
of producing EH36 high tensile strength steel parts with a relative density of
more than 97%, without visible cracks. This was achieved at an energy density
of 92 J/mm³ using parameters of 0.12 mm hatch spacing, power at 175W, 50 µm
layer thickness and 320 mm/s laser scanning speed. The stainless steel substrate
plate was preheated to 100 °C to reduce the thermal gradients and thermal
stresses experienced by the specimens during the SLM process.
3) Conducted tensile and impact toughness tests to obtain mechanical performance
of EH36 steel processed by selective laser melting. The results obtained
indicated that with heat treatment (tempering) at 650⁰C, yield strength obtained
is at 759 MPa, ultimate tensile strength obtained is 835 MPa, elongation obtained
is 23.3% and Charpy V-notched impact toughness value obtained is 62.5J. All
of these met the requirements stated in ASTM A131 standards.
4) Fractography studies were conducted and concluded that SLM produced
samples are less ductile as compared to TMCP produced samples.
5) Generally fine martensitic-like microstructure is observed at the as-built and low
tempering temperatures samples, as validated by the XRD results and hardness
measurements. The samples undergo spheriodisation and the microstructure
transforms to ferritic microstructure as the tempering temperature increases. At
800 °C, the microstructure is primarily ferritic with small amounts of cementite
at its boundaries. This gives rise to its mechanical properties. While there is

183
indirect evidence of the presence of such phases, the occurrence is speculated
based on existing literature studies.
6) A scaled model was fabricated and the microstructure analysed using SEM
technqiues. The as-built microstructure formed was validated to be similar to
that of the test coupons, ie generally fine acicular martensitic-like microstructure.
Hence it can be concluded that the process parameter developed can be used to
fabricate complex joints.
7) The work has contributed to the understanding of characteristics of EH36
material when processing using SLM, which is a novel technique as compared
to traditional TMCP.
8) In conclusion, it can be generalised that EH36 is technically feasible to be
processed using SLM and the resulting properties from this research have been
characterised for future studies.
However, the investigation of using SLM to process EH36 is not entirely
complete and further work can be conducted to complement the findings from this study.
The following are the suggested work to be conducted to further facilitate the research
progress.
1) Heat treatment optimisation – in this research, a tempering process was used.
However, more work can be performed to vary the process parameters in the
tempering process to investigate different effects. In addition, different heat
treatment processes can also be investigated.
2) Tempering temperature optimisation – specific tempering temperatures were
selected for this research but they are not conclusive on the best temperature for
recovering the mechanical properties of SLM processed EH36.
3) Large scale fabrication by SLM – in this study, the developed process parameters
are validated to fabricate the scaled complex joint. However, if a complex joint
is to be fabricated in its actual scale, the results presented in this work may not
be directly applicable and will require further work to investigate the changes
required to the process parameters. Consequently, the investigative work should
include an in-depth study of its associated mechanical properties and
microstructural transformation, so that the process parameters and heat treatment

184
regime developed in study can be co-related to the actual fabrication and post-
processing requirements of the large scale component.
4) SLM was used to process EH36 in this study, but it may not be the best additive
manufacturing (AM) process. Other processes, for example directed energy
deposition, leverages different technology and will yield different results. The
process parameters will also differ. It is hence encouraged to also investigate
varying AM processes.

185
References
1. ASTM, F2792-12a, Standard Terminology for Additive Manufacturing Technologies. 2012, ASTM International: West Conshohocken, PA,.
2. Baese, C., Photographic Process for the Reproduction of Plastic Objects. 1904: US Patent #774,549.
3. Blanther, J.E., Manufacture of Contour Relief Maps. 1892: US Patent #473,901.
4. Bourell, D., et al., A brief history of additive manufacturing and the 2009 roadmap for additive manufacturing: looking back and looking ahead. Proceedings of RapidTech, 2009: p. 24-25.
5. Wohlers, T. and T. Gornet, History of additive manufacturing. Wohlers Report 2011, 2011. 24.
6. Hiemenz, J., Additive manufacturing trends in aerospace. White Paper, Stratasys, USA, 2014: p. 1-11.
7. Joshi, S.C. and A.A. Sheikh, 3D printing in aerospace and its long-term sustainability. Virtual and Physical Prototyping, 2015. 10(4): p. 175-185.
8. Burns, M. and C. Wangenheim. Metal 3D printing applications in the oil & gas industry. in SPE Middle East Oil and Gas Show and Conference. 2019. Society of Petroleum Engineers.
9. Omiyale, B.O. and P.K. Farayibi, Additive manufacturing in the oil and gas industries-A review. Analecta Technica Szegedinensia, 2020. 14(1): p. 9-18.
10. Sireesha, M., et al., A review on additive manufacturing and its way into the oil and gas industry. RSC advances, 2018. 8(40): p. 22460-22468.
11. Tahayeri, A., et al., 3D printed versus conventionally cured provisional crown and bridge dental materials. Dental Materials, 2018. 34(2): p. 192-200.
12. Dawood, A., et al., 3D printing in dentistry. British dental journal, 2015. 219(11): p. 521-529.
13. Strickland, J.D., Applications of Additive Manufacturing in the marine industry. Proceedings of PRADS2016, 2016. 4: p. 8th.
14. Taking nodes to a new level. 11 March 2014 12 November 2018]; Available from: https://www.oedigital.com/news/456517-taking-nodes-to-a-new-level.
15. Burke, P. 3D Printing In The Oil And Gas Industry. 2014 [cited 2014 April]; Available from: http://3dprintingchannel.com/3d-printing-in-the-oil-and-gas-industry/.
16. EISENHAMMER, S. Oil industry joins world of 3D printing. 2014 [cited 2014 April]; Available from: http://www.reuters.com/article/2014/01/23/ge-3dprinting-idUSL5N0KW2OA20140123.
17. Wu, W., et al., Study of Additive Manufacturing in Offshore & Marine, in RAPID 2014. 2014: Detroit, US.
18. Laser, C. X line 2000R ® Technical Data. 2016 11 February 2016]; Available from: http://www.concept-laser.de/fileadmin/branchenbilder/PDFs/1509_X%20line%202000R_DE.pdf.

186
19. Scott, C., South Africa’s giant aeroswift 3D printer gearing up for commercial production. 2017.
20. ASTM, A131/A131M - 14, Standard Specification for Structural Steel for Ships. 2014, ASTM Internatonal: West Conshohocken, PA.
21. Rosado, D.B., et al., Latest developments in mechanical properties and metallurgical features of high strength line pipe steels. International Journal Sustainable Construction & Design, 2013. 4(1).
22. Aung, H., An analysis of the study of mechanical properties and microstructural relationship of HSLA steels used in ship hulls. 2007.
23. Williams, J. Advances in steels for high strength ERW linepipe application in Australia. in Materials forum. 2007.
24. Regina, J., J. Dupont, and A. Marder, The effect of chromium on the weldability and microstructure of Fe-Cr-Al weld cladding. WELDING JOURNAL-NEW YORK-, 2007. 86(6): p. 170.
25. Smallman, R.E. and A.H.W. Ngan, Chapter 12 - Steel Transformations, in Modern Physical Metallurgy (Eighth Edition), R.E. Smallman and A.H.W. Ngan, Editors. 2014, Butterworth-Heinemann: Oxford. p. 473-498.
26. Davenport, E. and E. Bain, General Relations Between Grain Size and Hardenability and the Normality of Steels. Trans. Amer. Soc. Metals, 1934. 22: p. 879-921.
27. Grimpe, F., et al. Improvement of Mechanical Properties of Heavy Plates for High Strength Pipeline Application ie in Arctic Regions. in Proceedings of 2nd International Conference on Super-High Strength Steels. 2010.
28. Koo, J.Y., et al., Metallurgical design of ultra high-strength steels for gas pipelines. International Journal of Offshore and Polar Engineering, 2004. 14(1): p. 2-10.
29. Shinmiya, T., et al., Development of High Deformability Linepipe with Resistance to Strain-aged Hardening by Heat Treatment On-line Process. International Journal of Offshore and Polar Engineering, 2008. 18(4): p. 308-313.
30. Okumoto, Y., et al., Design of ship hull structures: a practical guide for engineers. 2009: Springer Science & Business Media.
31. Gao, X.H., et al. The Development of High Strength Hull Steel Plate FH40. in Applied Mechanics and Materials. 2011. Trans Tech Publ.
32. Goli-Oglu, E.A., Improving the Cold Resistance of 70–100-mm-Thick Heavy Plates FH40 for Marine Structures Built for Arctic Service. Metallurgist, 2015. 59(5): p. 498-504.
33. contributors, W. List of oil fields. 6 June 2016]; Available from: https://en.wikipedia.org/w/index.php?title=List_of_oil_fields&oldid=720244042.
34. Cronin, D., Guidance Notes on High Tensile Steel, in 2013 Shipbuilders meeting. 2013, Tanker Structure Cooperative Forum: Shanghai China.
35. Davis, L. Diagrams cover AM machines and processes. 2016 11 January 2016]; Available from: http://www.materialstoday.com/additive-manufacturing/news/diagrams-cover-am-machines-and-processes/.
36. Gibson, I., D.W. Rosen, and B. Stucker, Additive manufacturing technologies. 2010: Springer.
37. Bai, Y. and C.B. Williams, An exploration of binder jetting of copper. Rapid Prototyping Journal, 2015. 21(2): p. 177-185.

187
38. Chen, H., et al., Process parameters optimization for improving surface quality and manufacturing accuracy of binder jetting additive manufacturing process. Rapid Prototyping Journal, 2016. 22(3): p. 527-538.
39. Brückner, F., S. Nowotny, and C. Leyens. Innovations in laser cladding and direct metal deposition. in SPIE LASE. 2012. International Society for Optics and Photonics.
40. Loh, L.-E., et al., Numerical investigation and an effective modelling on the Selective Laser Melting (SLM) process with aluminium alloy 6061. International Journal of Heat and Mass Transfer, 2015. 80: p. 288-300.
41. Das, M., et al., Laser processing of SiC-particle-reinforced coating on titanium. Scripta Materialia, 2010. 63(4): p. 438-441.
42. Gu, D., et al., Laser additive manufacturing of metallic components: materials, processes and mechanisms. International materials reviews, 2012. 57(3): p. 133-164.
43. Masood, S.H., 10.04 - Advances in Fused Deposition Modeling, in Comprehensive Materials Processing, S.H.F.B.J.V.T. Yilbas, Editor. 2014, Elsevier: Oxford. p. 69-91.
44. Ladd, C., et al., 3D Printing of Free Standing Liquid Metal Microstructures. Advanced Materials, 2013. 25(36): p. 5081-5085.
45. Wu, G.H., et al., Solid freeform fabrication of metal components using fused deposition of metals. Materials & Design, 2002. 23(1): p. 97-105.
46. Gonzalez-Gutierrez, J., et al., Additive manufacturing of metallic and ceramic components by the material extrusion of highly-filled polymers: A review and future perspectives. Materials, 2018. 11(5): p. 840.
47. Kritchman, E., R. Mimon, and H. Gothait, Printing system with self-purge, sediment prevention and fumes removal arrangements. 2014, Google Patents.
48. Benichou, A. and L. LAUFER, Tungsten-carbide/cobalt ink composition for 3d inkjet printing. 2015, Google Patents.
49. Zambelli, T., et al., Additive Manufacturing of Metal Structures at the Micrometer Scale. Advanced Materials, 2017. 29(17): p. 1604211.
50. Strauss, J.T. and T. Pelletiers, Metal Additive Manufacturing and Powder Metallurgy.
51. Kruth, J.P., et al., Selective laser melting of iron-based powder. Journal of Materials Processing Technology, 2004. 149(1-3): p. 616-622.
52. Kruth, J.-P., et al., Binding mechanisms in selective laser sintering and selective laser melting. Rapid prototyping journal, 2005. 11(1): p. 26-36.
53. Baumers, M., C. Tuck, and R. Hague, SELECTIVE HEAT SINTERING VERSUS LASER SINTERING: COMPARISON OF DEPOSITION RATE, PROCESS ENERGY CONSUMPTION AND COST PERFORMANCE.
54. Kruth, J.-P., et al. Part and material properties in selective laser melting of metals. in Proceedings of the 16th international symposium on electromachining. 2010.
55. Cormier, D., O. Harrysson, and H. West, Characterization of H13 steel produced via electron beam melting. Rapid Prototyping Journal, 2004. 10(1): p. 35-41.
56. Schick, D., et al., Microstructural Characterization of Bonding Interfaces in Aluminum 3003 Blocks Fabricated by Ultrasonic Additive Manufacturing-Methods were examined to link microstructure and linear

188
weld density to the mechanical properties of ultrasonic additive manufacturing. Welding Journal, 2010. 89(5): p. 105S.
57. Khorasani, A., et al., A review of technological improvements in laser-based powder bed fusion of metal printers. International Journal of Advanced Manufacturing Technology, 2020.
58. Bhavar, V., et al. A review on powder bed fusion technology of metal additive manufacturing. in 4th International conference and exhibition on Additive Manufacturing Technologies-AM-2014. 2014.
59. Fey, M. and P. HSFK, 3D Printing and International Security. Peace Research Institute Frankfurt (PRIF), 2017.
60. PROJECT AEROSWIFT HELPS UNLOCK THE GROWTH POTENTIAL OF ADDITIVE MANUFACTURING IN SOUTH AFRICA. 2020 12 November 2020]; Available from: https://www.csir.co.za/project-aeroswift.
61. AURORA LABS INCREASES RMP1 METAL 3D PRINTING SPEED BY “2000%”. 26th September 2019 20 October 2019]; Available from: https://3dprintingindustry.com/news/aurora-labs-increases-rmp1-metal-3d-printing-speed-by-2000-162272/.
62. Ruan, J., et al. A review of layer based manufacturing processes for metals. in 2006 International Solid Freeform Fabrication Symposium. 2006.
63. Peleshenko, S., et al., Analysis of the current state of additive welding technologies for manufacturing volume metallic products. Восточно-Европейский журнал передовых технологий, 2017(3 (1)): p. 42-52.
64. MERKE IV: THE MACHINE BEHIND RAPID PLASMA DEPOSITION. 2018 5 May 2020]; Available from: https://www.norsktitanium.com/technology.
65. Sears, J.W., Direct laser powder deposition-'State of the Art'. 1999, Knolls Atomic Power Lab., Niskayuna, NY (US).
66. Yasa, E., J. Deckers, and J.P. Kruth, The investigation of the influence of laser re-melting on density, surface quality and microstructure of selective laser melting parts. Rapid Prototyping Journal, 2011. 17(5): p. 312-327.
67. Morgan, R.H., et al., High density net shape components by direct laser re-melting of single-phase powders. Journal of Materials Science, 2002. 37(15): p. 3093-3100.
68. Badrossamay, M., et al., Improving productivity rate in SLM of commercial steel powders. status: published, 2009.
69. Jhabvala, J., et al., On the effect of scanning strategies in the selective laser melting process. Virtual and physical prototyping, 2010. 5(2): p. 99-109.
70. Lu, Y.J., et al., Study on the microstructure, mechanical property and residual stress of SLM Inconel-718 alloy manufactured by differing island scanning strategy. Optics and Laser Technology, 2015. 75: p. 197-206.
71. Mumtaz, K. and N. Hopkinson, Top surface and side roughness of Inconel 625 parts processed using selective laser melting. Rapid Prototyping Journal, 2009. 15(2): p. 96-103.
72. Marimuthu, S., et al., Laser polishing of selective laser melted components. International Journal of Machine Tools & Manufacture, 2015. 95: p. 97-104.

189
73. Ramos, J.A. and D.L. Bourell, Modeling of surface roughness enhancement of indirect-SLS metal parts by laser surface polishing. Rapid Prototyping of Materials, Proceedings, ed. F.D.S. Marquis and D.L. Bourell. 2002, Warrendale: Minerals, Metals & Materials Soc. 191-202.
74. Fischer, P., et al., Sintering of commercially pure titanium powder with a Nd : YAG laser source. Acta Materialia, 2003. 51(6): p. 1651-1662.
75. Niu, H.J. and I.T.H. Chang, Liquid phase sintering of M3/2 high speed steel by selective laser sintering. Scripta Materialia, 1998. 39(1): p. 67-72.
76. Fuh, J., et al., Improvement of the UV curing process for the laser lithography technique. Materials & Design, 1995. 16(1): p. 23-32.
77. Morgan, R., C.J. Sutcliffe, and W. O'Neill, Density analysis of direct metal laser re-melted 316L stainless steel cubic primitives. Journal of Materials Science, 2004. 39(4): p. 1195-1205.
78. Rombouts, M., et al., Fundamentals of selective laser melting of alloyed steel powders. Cirp Annals-Manufacturing Technology, 2006. 55(1): p. 187-192.
79. Agarwala, M., et al., Direct selective laser sintering of metals. Rapid Prototyping Journal, 1995. 1(1): p. 26-36.
80. Mumtaz, K.A. and N. Hopkinson, Laser melting functionally graded composition of Waspaloy((R)) and Zirconia powders. Journal of Materials Science, 2007. 42(18): p. 7647-7656.
81. Strano, G., et al., Surface roughness analysis, modelling and prediction in selective laser melting. Journal of Materials Processing Technology, 2013. 213(4): p. 589-597.
82. Song, B., et al., Differences in microstructure and properties between selective laser melting and traditional manufacturing for fabrication of metal parts: A review. Frontiers of Mechanical Engineering, 2015. 10(2): p. 111-125.
83. Yadroitsev, I., et al., Mechanical properties of samples fabricated by selective laser melting. 14èmes Assises Européennes du Prototypages & Fabrication Rapide, Paris, 2009.
84. Spierings, A., N. Herres, and G. Levy, Influence of the particle size distribution on surface quality and mechanical properties in AM steel parts. Rapid Prototyping Journal, 2011. 17(3): p. 195-202.
85. Aggen, S.D.W.a.G., ASM Handbook: Wrought Stainless Steels, Properties and Selection: Irons, Steels, and High-Performance Alloys Vol. 1. 1990: ASM International.
86. Riemer, A., et al., On the fatigue crack growth behavior in 316L stainless steel manufactured by selective laser melting. Engineering Fracture Mechanics, 2014. 120: p. 15-25.
87. Kanagarajah, P., et al., Inconel 939 processed by selective laser melting: Effect of microstructure and temperature on the mechanical properties under static and cyclic loading. Materials Science and Engineering: A, 2013. 588: p. 188-195.
88. Vilaro, T., et al., Microstructural and mechanical approaches of the selective laser melting process applied to a nickel-base superalloy. Materials Science and Engineering a-Structural Materials Properties Microstructure and Processing, 2012. 534: p. 446-451.

190
89. Gu, D.D., et al., Laser additive manufacturing of metallic components: materials, processes and mechanisms. International Materials Reviews, 2012. 57(3): p. 133-164.
90. Song, B., et al., Microstructure and tensile properties of iron parts fabricated by selective laser melting. Optics and Laser Technology, 2014. 56: p. 451-460.
91. Abd-Elghany, K. and D. Bourell, Property evaluation of 304L stainless steel fabricated by selective laser melting. Rapid Prototyping Journal, 2012. 18(5): p. 420-428.
92. Tolosa, I., et al., Study of mechanical properties of AISI 316 stainless steel processed by “selective laser melting”, following different manufacturing strategies. The International Journal of Advanced Manufacturing Technology, 2010. 51(5-8): p. 639-647.
93. Guan, K., et al., Effects of processing parameters on tensile properties of selective laser melted 304 stainless steel. Materials & Design, 2013. 50: p. 581-586.
94. Luecke, W.E. and J.A. Slotwinski, Mechanical properties of austenitic stainless steel made by additive manufacturing. Journal of research of the National Institute of Standards and Technology, 2014. 119: p. 398.
95. Zhao, X., et al., Study on microstructure and mechanical properties of laser rapid forming Inconel 718. Materials Science and Engineering: A, 2008. 478(1): p. 119-124.
96. Wang, Z., et al., The microstructure and mechanical properties of deposited-IN718 by selective laser melting. Journal of Alloys and Compounds, 2012. 513: p. 518-523.
97. Frazier, W.E., Metal additive manufacturing: A review. Journal of Materials Engineering and Performance, 2014. 23(6): p. 1917-1928.
98. Vilaro, T., C. Colin, and J.D. Bartout, As-Fabricated and Heat-Treated Microstructures of the Ti-6Al-4V Alloy Processed by Selective Laser Melting. Metallurgical and Materials Transactions a-Physical Metallurgy and Materials Science, 2011. 42A(10): p. 3190-3199.
99. Lenders, S., et al., On the mechanical behaviour of titanium alloy TiAl6V4 manufactured by selective laser melting: Fatigue resistance and crack growth performance. International Journal of Fatigue, 2013. 48: p. 300-307.
100. Strizak, J.P., et al., Fatigue properties of type 316LN stainless steel in air and mercury. Journal of Nuclear Materials, 2005. 343(1-3): p. 134-144.
101. Puchi-Cabrera, E.S., et al., On the fatigue behavior of an AISI 316L stainless steel coated with a PVD TiN deposit. Surface and Coatings Technology, 2004. 182(2–3): p. 276-286.
102. Stoffregen, H.A., K. Butterweck, and E. Abele, FATIGUE ANALYSIS IN SELECTIVE LASER MELTING: REVIEW AND INVESTIGATION OF THIN-WALLED ACTUATOR HOUSINGS.
103. Wu, J.-H. and C.-K. Lin, Tensile and fatigue properties of 17-4 PH stainless steel at high temperatures. Metallurgical and materials transactions A, 2002. 33(6): p. 1715-1724.
104. Arola, D. and C. Williams, Estimating the fatigue stress concentration factor of machined surfaces. International Journal of fatigue, 2002. 24(9): p. 923-930.

191
105. Spierings, A.B., T.L. Starr, and K. Wegener, Fatigue performance of additive manufactured metallic parts. Rapid Prototyping Journal, 2013. 19(2): p. 88-94.
106. Yasa, E. and J.P. Kruth, Microstructural investigation of Selective Laser Melting 316L stainless steel parts exposed to laser re-melting. Procedia Engineering, 2011. 19: p. 389-395.
107. Gu, D., et al., Selective laser melting of in-situ TiC/Ti 5 Si 3 composites with novel reinforcement architecture and elevated performance. Surface and Coatings Technology, 2011. 205(10): p. 3285-3292.
108. Hedberg, Y.S., et al., In vitro biocompatibility of CoCrMo dental alloys fabricated by selective laser melting. Dental materials, 2014. 30(5): p. 525-534.
109. de Wild, M., et al., Damping of selective-laser-melted NiTi for medical implants. Journal of Materials Engineering and Performance, 2014. 23(7): p. 2614-2619.
110. Gu, D. and W. Meiners, Microstructure characteristics and formation mechanisms of in situ WC cemented carbide based hardmetals prepared by Selective Laser Melting. Materials Science and Engineering a-Structural Materials Properties Microstructure and Processing, 2010. 527(29-30): p. 7585-7592.
111. Kumar, S. and J.-P. Kruth, Wear performance of SLS/SLM materials. Advanced Engineering Materials, 2008. 10(8): p. 750-753.
112. Gu, D., et al., Densification behavior, microstructure evolution, and wear performance of selective laser melting processed commercially pure titanium. Acta Materialia, 2012. 60(9): p. 3849-3860.
113. Yasa, E., et al. Microstructure and mechanical properties of maraging steel 300 after Selective Laser Melting. in Solid Freeform Fabrication Symposium Proceedings. 2010.
114. Committee, A.I.H., ASM handbook: Heat treating, Volume 4. 1991, United States of America: ASM International.
115. Zhou, X., et al., Textures formed in a CoCrMo alloy by selective laser melting. Journal of Alloys and Compounds, 2015. 631: p. 153-164.
116. Wen, S., et al., Effect of molten pool boundaries on the mechanical properties of selective laser melting parts. Journal of Materials Processing Technology, 2014. 214(11): p. 2660-2667.
117. Gu, D. and Y. Shen, Balling phenomena in direct laser sintering of stainless steel powder: Metallurgical mechanisms and control methods. Materials & Design, 2009. 30(8): p. 2903-2910.
118. Saada, G., Hall-Petch revisited. Materials Science and Engineering a-Structural Materials Properties Microstructure and Processing, 2005. 400: p. 146-149.
119. Gu, D.D., et al., Bulk-form TiCx/Ti nanocomposites with controlled nanostructure prepared by a new method: selective laser melting. Journal of Physics D-Applied Physics, 2010. 43(29): p. 7.
120. Gu, D.D., H.Q. Wang, and G.Q. Zhang, Selective Laser Melting Additive Manufacturing of Ti-Based Nanocomposites: The Role of Nanopowder. Metallurgical and Materials Transactions a-Physical Metallurgy and Materials Science, 2014. 45A(1): p. 464-476.

192
121. Amato, K.N., et al., Microstructures and mechanical behavior of Inconel 718 fabricated by selective laser melting. Acta Materialia, 2012. 60(5): p. 2229-2239.
122. Song, B., et al., Fabrication and microstructure characterization of
selective laser‐melted FeAl intermetallic parts. Surface and Coatings
Technology, 2012. 206(22): p. 4704-4709. 123. Thijs, L., et al., Fine-structured aluminium products with controllable
texture by selective laser melting of pre-alloyed AlSi10Mg powder. Acta Materialia, 2013. 61(5): p. 1809-1819.
124. Thijs, L., et al., A study of the microstructural evolution during selective laser melting of Ti–6Al–4V. Acta Materialia, 2010. 58(9): p. 3303-3312.
125. Yadroitsev, I., et al., Strategy of manufacturing components with designed internal structure by selective laser melting of metallic powder. Applied Surface Science, 2007. 254(4): p. 980-983.
126. Simchi, A. and H. Pohl, Effects of laser sintering processing parameters on the microstructure and densification of iron powder. Materials Science and Engineering a-Structural Materials Properties Microstructure and Processing, 2003. 359(1-2): p. 119-128.
127. Simchi, A., F. Petzoldt, and H. Pohl, Direct metal laser sintering: Material considerations and mechanisms of particle bonding. International Journal of Powder Metallurgy, 2001. 37(2): p. 49-61.
128. Gu, D.D., et al., Selective Laser Melting of in-situ TiC/Ti5Si3 composites with novel reinforcement architecture and elevated performance. Surface & Coatings Technology, 2011. 205(10): p. 3285-3292.
129. Wu, W., et al., Investigation on processing of ASTM A131 Eh36 high tensile strength steel using selective laser melting. Virtual and Physical Prototyping, 2015. 10(4): p. 187-193.
130. Gu, H., et al. Influences of energy density on porosity and microstructure of selective laser melted 17-4PH stainless steel. in Proceedings of Solid Freeform Fabrication Symposium. 2013.
131. Kruth, J.-P., et al., Selective laser melting of iron-based powder. Journal of materials processing technology, 2004. 149(1-3): p. 616-622.
132. Kruth, J.-P., et al. Part and material properties in selective laser melting of metals. in Proceedings of the 16th International Symposium on Electromachining (ISEM XVI). 2010. SHANGHAI JIAO TONG UNIV PRESS.
133. Liu, Z., et al. A preliminary investigation on selective laser melting of M2 high speed steel. in 5th International Conference on Advanced Research and Rapid Prototyping, Leiria, Portugal. 2011.
134. Mertens, R., et al., Optimization of scan strategies in selective laser melting of aluminum parts with downfacing areas. Journal of Manufacturing Science and Engineering, 2014. 136(6).
135. Casalino, G., et al., Experimental investigation and statistical optimisation of the selective laser melting process of a maraging steel. Optics & Laser Technology, 2015. 65: p. 151-158.
136. Mutua, J., et al., Optimization of selective laser melting parameters and influence of post heat treatment on microstructure and mechanical properties of maraging steel. Materials & Design, 2018. 139: p. 486-497.
137. Seede, R., et al., An ultra-high strength martensitic steel fabricated using selective laser melting additive manufacturing: Densification,

193
microstructure, and mechanical properties. Acta Materialia, 2020. 186: p. 199-214.
138. Maamoun, A.H., et al., The effect of selective laser melting process parameters on the microstructure and mechanical properties of Al6061 and AlSi10Mg alloys. Materials, 2019. 12(1): p. 12.
139. Zhang, P., et al., Twin structure of the lath martensite in low carbon steel. Progress in Natural Science: Materials International, 2016. 26(2): p. 169-172.
140. Zhang, M., et al., An investigation into the aging behavior of CoCrMo alloys fabricated by selective laser melting. Journal of Alloys and Compounds, 2018. 750: p. 878-886.
141. Murr, L.E., et al., Microstructures and properties of 17-4 PH stainless steel fabricated by selective laser melting. Journal of Materials Research and Technology, 2012. 1(3): p. 167-177.
142. Song, B., et al., Process parameter selection for selective laser melting of Ti6Al4V based on temperature distribution simulation and experimental sintering. The International Journal of Advanced Manufacturing Technology, 2012. 61(9-12): p. 967-974.
143. Cherry, J., et al., Investigation into the effect of process parameters on microstructural and physical properties of 316L stainless steel parts by selective laser melting. The International Journal of Advanced Manufacturing Technology, 2015. 76(5-8): p. 869-879.
144. Kurgan, N., Effect of porosity and density on the mechanical and microstructural properties of sintered 316L stainless steel implant materials. Materials & Design, 2014. 55: p. 235-241.
145. Gülsoy, H., S. Özbek, and T. Baykara, Microstructural and mechanical properties of injection moulded gas and water atomised 17-4 PH stainless steel powder. Powder metallurgy, 2007. 50(2): p. 120-126.
146. Kempen, K., et al., Microstructure and mechanical properties of Selective Laser Melted 18Ni-300 steel. Physics Procedia, 2011. 12: p. 255-263.
147. Liu, Z.H., et al. Microstructural investigation of M2 high speed steel produced by selective laser melting: microstructural investigation of M2 high speed steel. in Photonics and Optoelectronics (SOPO), 2012 Symposium on. 2012. IEEE.
148. Penha, R.N., et al., Tempering of Steels[1], in Steel Heat Treating Fundamentals and Processes, J.L. Dossett and G.E. Totten, Editors. 2013, ASM International. p. 0.
149. Randelius, M., Influence of microstructure on fatigue and ductility properties of tool steels. 2008.
150. Canale, L.C., et al., A historical overview of steel tempering parameters. International Journal of Microstructure and Materials Properties, 2008. 3(4-5): p. 474-525.
151. Zhao, L.J., et al., Below-Ms austempering to obtain refined bainitic structure and enhanced mechanical properties in low-C high-Si/Al steels. Scripta Materialia, 2016. 112: p. 96-100.
152. Zhang, Z., et al., Comprehensive effects of placement orientation and scanning angle on mechanical properties and behavior of 316L stainless steel based on the selective laser melting process. Journal of Alloys and Compounds, 2019. 791: p. 166-175.

194
153. Alsalla, H.H., C. Smith, and L. Hao, Effect of build orientation on the surface quality, microstructure and mechanical properties of selective laser melting 316L stainless steel. Rapid Prototyping Journal, 2018. 24(1): p. 9-17.
154. Wang, X., et al., Crystallographic-orientation-dependent tensile behaviours of stainless steel 316L fabricated by laser powder bed fusion. Materials Science and Engineering: A, 2019. 766: p. 138395.
155. Sun, Y., et al., Fracture morphologies of advanced high strength steel during deformation. Acta Metallurgica Sinica (English Letters), 2014. 27(1): p. 101-106.
156. Das, A. and S. Tarafder, Geometry of dimples and its correlation with mechanical properties in austenitic stainless steel. Vol. 59. 2008. 1014-1017.
157. Gong, H., et al., Influence of defects on mechanical properties of Ti–6Al–4V components produced by selective laser melting and electron beam melting. Materials & Design, 2015. 86: p. 545-554.
158. Brueckner-Foit, A., et al., On the role of internal defects in the fatigue damage process of a cast Al-Si-Cu alloy. Procedia Structural Integrity, 2017. 7: p. 36-43.
159. Murakami, Y. and M. Endo, Effects of defects, inclusions and inhomogeneities on fatigue strength. International Journal of Fatigue, 1994. 16(3): p. 163-182.
160. Fleck, N.A. and R.A. Smith, Effect of Density on Tensile Strength, Fracture Toughness, and Fatigue Crack Propagation Behaviour of Sintered Steel. Powder Metallurgy, 1981. 24(3): p. 121-125.
161. Craeghs, T., et al. Online quality control of selective laser melting. in Proceedings of the Solid Freeform Fabrication Symposium, Austin, TX. 2011.
162. Kasperovich, G., et al., Correlation between porosity and processing parameters in TiAl6V4 produced by selective laser melting. Materials & Design, 2016. 105: p. 160-170.
163. Callister, W.D., Materials science and engineering. Vol. 5. John Wiley & Sons NY.
164. Li, W., et al., Effect of heat treatment on AlSi10Mg alloy fabricated by selective laser melting: Microstructure evolution, mechanical properties and fracture mechanism. Materials Science and Engineering: A, 2016. 663: p. 116-125.
165. Prashanth, K., et al., Microstructure and mechanical properties of Al–12Si produced by selective laser melting: Effect of heat treatment. Materials Science and Engineering: A, 2014. 590: p. 153-160.
166. Attar, H., et al., Manufacture by selective laser melting and mechanical behavior of commercially pure titanium. Materials Science and Engineering: A, 2014. 593: p. 170-177.
167. Krauss, G., Martensite in steel: strength and structure. Materials Science and Engineering: A, 1999. 273-275: p. 40-57.
168. Song, J., et al., Effect of heat treatment on microstructure and mechanical behaviours of 18Ni-300 maraging steel manufactured by selective laser melting. Optics & Laser Technology, 2019. 120: p. 105725.
169. Larimian, T., et al., Effect of energy density and scanning strategy on densification, microstructure and mechanical properties of 316L stainless

195
steel processed via selective laser melting. Materials Science and Engineering: A, 2020. 770: p. 138455.
170. Dzugan, J., et al., Effects of thickness and orientation on the small scale fracture behaviour of additively manufactured Ti-6Al-4V. Materials Characterization, 2018. 143: p. 94-109.
171. Jeon, J.M., et al., Effects of microstructure and internal defects on mechanical anisotropy and asymmetry of selective laser-melted 316L austenitic stainless steel. Materials Science and Engineering: A, 2019. 763: p. 138152.
172. Ouyang, D., N. Li, and L. Liu, Structural heterogeneity in 3D printed Zr-based bulk metallic glass by selective laser melting. Journal of Alloys and Compounds, 2018. 740: p. 603-609.

196
Appendix A – List of all data
Heat Treatment
(⁰C)
Yield Strength (MPa)
Tensile Test Coupons (Machined)
1st 2nd 3rd Max Min Avg
Nil 1010 990 1089 1089 990 1029.7
205 999 978 1010 1010 978 995.7
315 956 934 990 990 934 960.0
425 969 978 993 993 969 980.0
540 965 950 987 987 950 967.3
650 636 620 680 680 620 645.3
800 385 401 360 401 360 382.0
Heat Treatment
(⁰C)
Yield Strength (MPa)
Tensile Test Coupons (As-Built)
1st 2nd 3rd Max Min Avg
Nil 967 980 950 980 950 965.6667
205 970 998 948 998 948 972
315 896 903 903 903 896 900.6667
425 965 962 930 965 930 952.3333
540 952 940 910 952 910 934
650 670 650 690 690 650 670
800 344 360 320 360 320 341.3333
Heat Treatment
(⁰C)
Ultimate Tensile Strength (MPa)
Tensile Test Coupons (Machined)
1st 2nd 3rd Max Min Avg
Nil 1051 1020 1090 1090 1020 1053.667
205 1040 1051 1080 1080 1040 1057
315 1003 1010 1010 1010 1003 1007.667
425 994 980 990 994 980 988
540 990 950 1023 1023 950 987.6667
650 722 740 740 740 722 734
800 526 550 490 550 490 522
Heat Treatment
(⁰C)
Ultimate Tensile Strength (MPa)
Tensile Test Coupons (As-Built)
1st 2nd 3rd Max Min Avg
Nil 1021 1001 1114 1114 1001 1045.333
205 1017 1030 1030 1030 1017 1025.667
315 906 870 910 910 870 895.3333

197
425 994 982 1003 1003 982 993
540 976 970 986 986 970 977.3333
650 733 730 745 745 730 736
800 442 451 450 451 442 447.6667
Heat Treatment
(⁰C)
Impact Test Temperature, 0 ⁰C
Charpy Test Coupons (Notch Up)
1st 2nd 3rd Max Min Avg
Nil 28 30 27 30 27 28.33333
205 28 27 27 28 27 27.33333
315 28 27 28 28 27 27.66667
425 28 29 29 29 28 28.66667
540 36 35 36 36 35 35.66667
650 31 29 38 38 29 32.66667
800 56 53 60 60 53 56.33333
Heat Treatment
(⁰C)
Impact Test Temperature, 0 ⁰C
Charpy Test Coupons (Notch Side)
1st 2nd 3rd Max Min Avg
Nil 28 29 28 29 28 28.33333
205 31 30 30 31 30 30.33333
315 25 30 26 30 25 27
425 28 29 28 29 28 28.33333
540 21 26 29 29 21 25.33333
650 37 39 40 40 37 38.66667
800 84 80 86 86 80 83.33333
Heat Treatment
(⁰C)
Impact Test Temperature, - 40 ⁰C
Charpy Test Coupons (Notch Up)
1st 2nd 3rd Max Min Avg
Nil 24 25 25 25 24 24.66667
205 26 27 26 27 26 26.33333
315 24 25 25 25 24 24.66667
425 21 22 22 22 21 21.66667
540 26 30 27 30 26 27.66667
650 33 34 33 34 33 33.33333
800 47 50 48 50 47 48.33333
Impact Test Temperature, - 40 ⁰C
Charpy Test Coupons (Notch Side)

198
Heat Treatment
(⁰C) 1st 2nd 3rd Max Min Avg
Nil 24 26 25 26 24 25
205 28 27 29 29 27 28
315 29 31 28 31 28 29.33333
425 23 25 24 25 23 24
540 29 26 29 29 26 28
650 35 36 36 36 35 35.66667
800 50 48 49 50 48 49
Heat Treatment
(⁰C)
Elongation (%)
Tensile Test Coupons (Machined)
1st 2nd 3rd Max Min Avg
Nil 3 3.7 3.1 3.7 3 3.266667
205 6 5.2 6.3 6.3 5.2 5.833333
315 4 4.8 4.1 4.8 4 4.3
425 6 6.6 6.1 6.6 6 6.233333
540 5 5.9 4.7 5.9 4.7 5.2
650 12 12.8 12.2 12.8 12 12.33333
800 25 24.8 26 26 24.8 25.26667
Heat Treatment
(⁰C)
Elongation (%)
Tensile Test Coupons (As-Built)
1st 2nd 3rd Max Min Avg
Nil 4 4.1 5 5 4 4.366667
205 3.6 4 3.3 4 3.3 3.633333
315 2.2 2.5 3.8 3.8 2.2 2.833333
425 4 4.3 5 5 4 4.433333
540 5.8 6.1 5.2 6.1 5.2 5.7
650 9.8 11 9.4 11 9.4 10.06667
800 29 27.9 30.1 30.1 27.9 29
Heat Treatment
(⁰C)
Yield Strength (MPa)
Tensile Test Coupons (Z)
1st 2nd 3rd Max Min Avg
Nil 765 748 787 787 748 766.7
205 620 595 639 639 595 618.0
315 590 642 566 642 566 599.3
425 676 650 637 676 637 654.3
540 727 787 684 787 684 732.7
650 630 633 624 633 624 629.0

199
800 310 288 336 336 288 311.3
Heat Treatment
(⁰C)
Yield Strength (MPa)
Tensile Test Coupons (45)
1st 2nd 3rd Max Min Avg
Nil 1032 933 1068 1068 933 1011
205 1030 991 1061 1061 991 1027.333
315 999 1051 1060 1060 999 1036.667
425 946 880 944 946 880 923.3333
540 1000 946 1074 1074 946 1006.667
650 780 727 770 780 727 759
800 387 373 420 420 373 393.3333
Heat Treatment
(⁰C)
Ultimate Tensile Strength (MPa)
Tensile Test Coupons (Z)
1st 2nd 3rd Max Min Avg
Nil 804 743 778 804 743 775
205 696 688 739 739 688 707.6667
315 617 600 626 626 600 614.3333
425 716 775 743 775 716 744.6667
540 795 732 717 795 717 748
650 682 729 632 729 632 681
800 341 312 348 348 312 333.6667
Heat Treatment
(⁰C)
Ultimate Tensile Strength (MPa)
Tensile Test Coupons (45)
1st 2nd 3rd Max Min Avg
Nil 1036 1086 1039 1086 1036 1053.667
205 1044 959 949 1044 949 984
315 1008 1011 923 1011 923 980.6667
425 990 898 892 990 892 926.6667
540 1013 1031 1104 1104 1013 1049.333
650 836 898 771 898 771 835
800 492 473 531 531 473 498.6667
Heat Treatment
(⁰C)
Impact Test Temperature, 0 ⁰C
Charpy Test Coupons (45)
1st 2nd 3rd Max Min Avg
Nil 48 46 45 48 45 46.33333
205 48 49 49 49 48 48.66667

200
315 51 48 44 51 44 47.66667
425 50 48 46 50 46 48
540 49 47 48 49 47 48
650 60 65 67 67 60 64
800 84 85 98 98 84 89
Heat Treatment
(⁰C)
Impact Test Temperature, 0 ⁰C
Charpy Test Coupons (Notch Side)
1st 2nd 3rd Max Min Avg
Nil 28 29 28 29 28 28.33333
205 31 30 30 31 30 30.33333
315 25 30 26 30 25 27
425 28 29 28 29 28 28.33333
540 21 26 29 29 21 25.33333
650 37 39 40 40 37 38.66667
800 84 80 86 86 80 83.33333
Heat Treatment
(⁰C)
Impact Test Temperature, - 40 ⁰C
Charpy Test Coupons (45)
1st 2nd 3rd Max Min Avg
Nil 52 40 42 52 40 44.66667
205 54 44 40 54 40 46
315 60 52 43 60 43 51.66667
425 56.25 43.10204 44 56.25 43.10204 47.78401
540 53.08333 40.86957 44.8 53.08333 40.86957 46.25097
650 65 60 62.53333 65 60 62.51111
800 91 85 91.46667 91.46667 85 89.15556
Heat Treatment
(⁰C)
Impact Test Temperature, - 40 ⁰C
Charpy Test Coupons (Notch Side)
1st 2nd 3rd Max Min Avg
Nil 24 26 25 26 24 25
205 28 27 29 29 27 28
315 29 31 28 31 28 29.33333
425 23 25 24 25 23 24
540 29 26 29 29 26 28
650 35 36 36 36 35 35.66667
800 50 48 49 50 48 49
Elongation (%)

201
Heat Treatment
(⁰C)
Tensile Test Coupons (Z)
1st 2nd 3rd Max Min Avg
Nil 5 5.1 5.2 5.2 5 5.1
205 5 5.2 4.5 5.2 4.5 4.9
315 2 2.0 2.2 2.2 2 2.066667
425 6 6.5 6.1 6.5 6 6.2
540 5 4.6 4.5 5 4.5 4.7
650 5 4.9 5.3 5.3 4.9 5.066667
800 8 8.1 7.9 8.1 7.9 8
Heat Treatment
(⁰C)
Elongation (%)
Tensile Test Coupons (45)
1st 2nd 3rd Max Min Avg
Nil 13 13.3 13.3 13.3 13 13.2
205 12 12.5 12.3 12.5 12 12.26667
315 15 15.4 14.1 15.4 14.1 14.83333
425 12 12.4 11.8 12.4 11.8 12.06667
540 16 16.6 16.1 16.6 16 16.23333
650 23 22.4 24.4 24.4 22.4 23.26667
800 38 37.5 36.4 38 36.4 37.3
Heat Treatment
(⁰C)
Yield Strength (MPa)
Vickers hardness (Test coupons)
1st 2nd 3rd 4th 5th Max Min Avg
Nil 349.5 359.8 357.4 341 353.7 359.8 341 352.3
205 368.6 359.3 362.4 396.9 373.4 396.9 359.3 372.1
315 356.7 350.4 354.9 352.4 348.1 356.7 348.1 352.5
425 363.9 360.9 331 358.1 361.2 363.9 331 355.0
540 358 370.3 365.5 376.2 374.8 376.2 358 369.0
650 261.8 249.3 255.9 237.8 252.9 261.8 237.8 251.5
800 205.7 201.9 194.2 194.9 203.6 205.7 194.2 200.1
Sample location on node
Yield Strength (MPa)
Vickers hardness (Scaled model)
1st 2nd 3rd 4th 5th Max Min Avg
1 349.7 349.7 380 331.3 332.6 380 331.3 348.7
2 334.4 373.5 358.2 398.5 323 398.5 323 357.5