Metallic and Non-Metallic Jewelery from the renewed excavations at Tell Beth Shean
Upload
khangminh22Category
view
1download
0
METALLIC ADDITIVE
MANUFACTURING APPLIED
IN THE FILTRATION INDUSTRY
R Neil Burns
A Thesis Submitted in Partial Fulfilment
for the Degree of MSc Engineering (by
Research)
Lancaster University
April 2019

1
Disclaimer
This thesis is submitted in partial fulfilment of the requirements for the degree of Masters
in Engineering (by Research), in the non-traditional format ‘By Publication’ in accordance
with the Regulations of Lancaster University
I hereby declare that unless otherwise indicated, this submission is my own work or work
to which I have significantly contributed and it contains no material previously published
or written by another person, to the best of my knowledge and belief, nor material which
has been accepted for the award of any other degree or diploma of the University or other
institute of higher learning, except where due acknowledgements have been made in the
text.
________________________________
R NEIL BURNS

2
Acknowledgements
Having only started my further education late in life , I would like to thank the people who
had faith in me and encouraged me to believe in myself and commit to a qualification by
research.
The author of thesis MSc (By Research) would like to thank the Technology Strategy Board
(now Innovate UK) for supporting this research activity through grants awarded to Croft
Additive Manufacturing Ltd.
I would like to thank the following people for the time, help and encouragement they have
provided for the duration of this research.
Dr Allan Rennie, my supervisor, who has been inspiring. He was the person that persuaded
me that I was capable of being awarded a Engineering qualification. More than that, he
was the bridge between industry and academia, understanding the fit between the two.
I would also like to thank my colleagues at both Croft Additive Manufacturing Ltd and Croft
Filters Ltd who provided help and support in the carrying out of the project activities. A
special thanks goes to Dr Louise Geekie the person that received the grants from Innovate
UK that gave me the core opportunities to partake in research, opening the door to
industrial research.
3
Abstract
Filter media are essential in all industries to prevent contamination and damage of
downstream processes as well as to perform separation processes. Filtration is required to
remove particulates from fluid, liquid and gas, and for many industrial manufacturing
processes mass produced filters do not provide a tailored filtration system to suit their
requirements. Bespoke filtration solutions are needed. Customized metal filter production,
where batch numbers are small, often from 1 off to a few thousand off, involves individual
filter designs, particular tooling for each filter type, plate perforation, forming and welding
of filter support as well as the many hand operations in mesh cutting and assembly. One
advantage of this process is that the filter media can be tailored to suit operational
pressures, environment type and filtration requirement.
When a filter is placed in a pipe and fluid pumped through the filter, turbulence occurs and
the resistance across the filter, known as the pressure drop, increases and more pumping
energy is required. Design alterations may decrease the pressure drop across the filter,
making the filter more efficient. Additive Manufacturing (AM) was identified as a
technology that had the potential to create novel innovative filters designs that may have
a reduced pressure drop. This thesis examines how additive manufacturing may be utilized
as a tool to develop novel filter media.
A literature review of the types of additive manufacturing technology was undertaken to
understand the principles of layer by layer manufacturing. The technical challenges and
potential defects in AM components were identified. The investigations in this research
utilises Selective Laser Melting (SLM) a powder bed fusion AM technology.
For powder bed fusion, the metallic powder, here Stainless Steel 316L (SS316L), has a
particle size range of 15-45µm. This combination of sizes ensures a maximal packing within
the powder bed, however the AM technology utilized here demonstrated an apparent non-
uniform distribution of powder in the bed and this was investigated.
Designs for novel filtration media that could reduce the turbulence of fluid flow were
created using Design for Additive Manufacturing (DfAM) principles. A novel filter media
with holes aligned to the fluid flow was created and the resultant pressure drop across the
filter was tested in in a flow test rig. The AM filter design had a reduced pressure drop
compared to a conventional filter equivalent. Having demonstrated that AM can be
employed to deliver improved filtration, further novel filtration media were designed to
increase the open area of the filter.
Conventional manufacture of filter media typically comprises of a filter support and woven
wire mesh, whose aperture is dependent on the wire diameter and weave. A novel filter

4
with integrated filter support and mesh was designed in a range of sizes. These filters were
then tested for pressure drop at increasing flow rates and compared to conventional filters.
Integrity of the structural build of these AM filters was carried out using X-Ray CT to
determine if the latticework structure was fully formed and without high levels of porosity.
Initial trials demonstrated that the AM filters delivered an improvement in filter function
however light microscope examination of the latticework determined that the latticework
did not have a maximal open area. Further work was carried out to optimize this design
including CAD redesign of the repeating units and optimization of build parameters used
to build the AM filters. The AM filters were then analysed for latticework strand size,
aperture size and tested for overall strength and pressure drop. Surface finishing methods
were then trialed for SS316L AM components.
The design freedom of Additive Manufacturing has enabled design of novel innovative
filtration media that deliver added value through improved function.

5
Contents
Disclaimer.................................................................................................................................................1
Acknowledgements ..................................................................................................................................2
Abstract ....................................................................................................................................................3
Contents ...................................................................................................................................................5
List of Figures ...........................................................................................................................................9
List of Tables ......................................................................................................................................... 11
Chapter 1 Introduction .......................................................................................................................... 12
1.1 Conventional Metallic Filtration Media ...................................................................................... 12
1.1.1 Expanded Metal ...................................................................................................................... 12
1.1.2 Porous Metal .......................................................................................................................... 13
1.2 Subtractive Manufacture ............................................................................................................ 14
1.2.1 Electro-Chemical Machining (ECM) ........................................................................................ 15
1.3 What Is Additive Manufacturing? ............................................................................................... 15
1.3.1 Types of AM ............................................................................................................................ 15
1.3.2 Material Extrusion .................................................................................................................. 16
1.3.3 Directed Energy Deposition (DED) .......................................................................................... 16
1.3.4 Sheet Lamination .................................................................................................................... 17
1.3.5 Binder Jetting .......................................................................................................................... 17
1.3.6 Direct Vat Photopolymerisation ................................................................................................. 19
1.3.7 Material Jetting ....................................................................................................................... 20
1.3.8 Powder Bed Fusion ...................................................................................................................... 21
1.4 Summary of AM technologies .................................................................................................... 22
1.5 Build Flaws in AM ....................................................................................................................... 23
1.5.1 Porosity ................................................................................................................................... 23
1.5.2 Layer Defects .......................................................................................................................... 24
1.5.3 Under-Melted Material/Unconsolidated Powder .................................................................. 24
1.5.4 Cracking .................................................................................................................................. 25
1.5.5 Residual Stress/Warpage ........................................................................................................ 25
1.6 What AM May do for the Filtration Industry .............................................................................. 26
1.6.1 Advantages ............................................................................................................................. 26

6
1.6.2 Design Freedom/Design Rules In AM ..................................................................................... 27
1.6.3 Build Supports......................................................................................................................... 27
1.6.4 Pros and Cons of What Can Be Built ....................................................................................... 28
Chapter 2 Additive Manufacturing Methodology ................................................................................. 30
2.1 Introduction to AM File Formats ................................................................................................ 30
2.2 STL Format .................................................................................................................................. 30
2.3 AMF Format ................................................................................................................................ 30
2.4 3MF format ................................................................................................................................. 31
2.5 Format Comparison ................................................................................................................... 31
2.5.1 Best Format / Replacement for STL ........................................................................................ 31
2.5.2 Practical examples .................................................................................................................. 35
2.6 Conclusions ................................................................................................................................. 36
2.6.1 Process with New Format ....................................................................................................... 36
Chapter 3 Optimisation of the AM process ........................................................................................... 37
3.1 Powder Challenges ..................................................................................................................... 37
3.1.1 Flowability............................................................................................................................... 37
3.1.2 Particle Size Range .................................................................................................................. 38
3.1.3 Standardisation of Powder Reusage....................................................................................... 38
3.2 Realizer AM Machine Powder Challenges .................................................................................. 39
3.2.1 Delivery System/Appearance of Black Stripes ........................................................................ 39
3.3 Investigation of the Effect of AM Build on the Composition and Particle Size of AM
Powders ................................................................................................................................................ 47
3.3.1 Discussion ............................................................................................................................... 50
Chapter 4 Novel Filter Designs That Deliver Filtration Benefits ............................................................ 52
4.1. Introduction – What is Design / What is it Trying to Achieve ................................................ 52
4.2. Build the Design of the Filter Around the Desired Function - Design for End Purpose ................. 53
4.3. Testing: Flow Rate .................................................................................................................. 54
4.5 Integrated Filter Support and Mesh ........................................................................................... 57
4.6 Method ....................................................................................................................................... 58
4.6.1 Latticework in SLM AM ................................................................................................................ 58
4.6.2 Structural Internal Geometry of the Integrated Filter Support and Filter ............................. 59
4.6.2 X-Ray Computed (CT) Tomography ........................................................................................ 60
4.7 Results ........................................................................................................................................ 60
4.7.1 X-Ray CT Analysis .................................................................................................................... 60

7
4.7.2 Microscopic analysis of aperture and strand size in latticework ........................................... 63
4.8 Pressure Drop in the Integrated Support and Filter ................................................................... 65
4.9 Conclusions ................................................................................................................................. 67
Chapter 5 Designing Advanced Filtration Media ................................................................................... 69
5.1 Introduction ................................................................................................................................ 69
5.1.1 General Remarks .................................................................................................................... 69
5.1.2 Woven Wire Mesh .................................................................................................................. 70
5.1.3 Aperture Size .......................................................................................................................... 70
5.1.4 Additive Manufacturing and Filtration Media Design ............................................................ 71
5.2 Materials and Methods .............................................................................................................. 72
5.2.1 AM Build and Component Tensile Strength ........................................................................... 72
5.2.2 AM Integrated Filter Design ................................................................................................... 73
5.2.3 AM Integrated Filters .............................................................................................................. 75
5.2.4 Integrated Filters: Collapse Pressure and Pressure Drop ....................................................... 77
5.3 Results and Discussion ................................................................................................................ 77
5.3.1 AM Build ................................................................................................................................. 77
5.3.2 Component Tensile Strength .................................................................................................. 77
5.3.3 AM Integrated Filter Design ................................................................................................... 78
5.3.4 AM Integrated Filters: Collapse Pressure ............................................................................... 80
5.3.5 AM Integrated Filters: Pressure Drop ..................................................................................... 81
5.4 Conclusions ................................................................................................................................. 83
Chapter 6 Surface Finishing in Metal AM parts ..................................................................................... 85
6.1 Additive Manufacture ................................................................................................................. 85
6.2 Methods...................................................................................................................................... 87
6.2.1 Metal AM components ........................................................................................................... 87
6.2.2 Test Components .................................................................................................................... 87
6.3 Finishing ...................................................................................................................................... 88
6.4 Surface Roughness ...................................................................................................................... 89
6.5 Test components ........................................................................................................................ 89
6.6 Results ........................................................................................................................................ 90
6.7 Conclusions ................................................................................................................................. 96
Chapter 7 Conclusion ............................................................................................................................ 98
Chapter 8 Further Work .................................................................................................................... 101
Chapter 9 References .......................................................................................................................... 102

8
Chapter 10 Bibliography ...................................................................................................................... 106
Chapter 11 APPENDIX A ...................................................................................................................... 112
Chapter 12 APPENDIX B ....................................................................................................................... 125
Chapter 13 APPENDIX C ....................................................................................................................... 544
Chapter 14 ........................................................................................................................................... 544
Grant Funding ..................................................................................................................................... 544
Chapter 15 APPENDIX D ...................................................................................................................... 545
Journal Paper (peer reviewed) ............................................................................................................ 545
Conference Paper (peer reviewed) ..................................................................................................... 545

9
List of Figures
Figure 1.1 Expanded Metal (Stainless Steel) example of Standard Expanded Metal with raised surface
............................................................................................................................................................... 13
Figure 1.2 Schematic of the Material Extrusion AM Process ................................................................. 16
Figure 1.3 :Schematic of the Directed Energy Deposition (DED) AM Process ....................................... 16
Figure 1.4: Schematic of the Sheet Lamination AM Process ................................................................. 17
Figure 1.5: Schematic of the Binder Jetting AM Process ....................................................................... 18
Figure 1.6: Schematic of the Direct Vat Polymerisation AM Process .................................................... 19
Figure 1.7: Schematic of the Material Jetting AM Process .................................................................... 20
Figure 1.8: Schematic of the Powder Bed Fusion AM Process ............................................................... 21
Figure 2.1: Parametric CAD file .............................................................................................................. 32
Figure 2.2: Coarse STL file (144 KB) ........................................................................................................ 32
Figure 2.3: Fine STL (1,395 KB) ............................................................................................................... 33
Figure 2.4: Fine 3MF (350 KB) ................................................................................................................ 33
Figure 2.5: Fine AMF file (2,896 KB uncompressed, 290 KB compressed) ............................................. 34
Figure 2.6: STL file errors ........................................................................................................................ 35
Figure 2.7: Pleated wire cone ................................................................................................................. 36
Figure 3.1:Powder Bed Fusion process .................................................................................................. 37
Figure 3.2: Schematic diagram of powder stripes visible during and following build. Samples were taken
from each marked section for analysis. ................................................................................................. 39
Figure 3.3: Particle size distribution and comparison of new powder and mixed machined bed powder
samples .................................................................................................................................................. 42
Figure 3.4: Particle size distribution and comparison graphs of samples of grey powder taken from the
left, middle, and right sides of the build plate and the machine bed mixed powder ........................... 43
Figure 3.5: Particle size distribution and comparison graphs of samples taken from the outer edges of
the build plate and machine bed powder .............................................................................................. 44
Figure 3.6: Particle size distribution and comparison of samples taken from the black powder stripes on
both sides of the build plate and machine bed powder ........................................................................ 45
Figure 3.7: Particle size distribution graph of new powder and machine powder ................................ 46
Figure 3.8: Elemental composition breakdown of 4 particles, NP1, NP2, NP3 and NP4 of new
powder(UK80068) as determined by SEM ............................................................................................. 47
Figure 3.9: Elemental composition breakdown of powder caught by sieve .......................................... 48
Figure 3.10: Elemental composition breakdown of powder sieved through 500 mesh ........................ 49
Figure 3.11: Elemental composition breakdown of powder from machine bed powder ..................... 49
Figure 3.12: Powder particle size distribution from each of the four sources ...................................... 50
Figure 4.1: The AM filter design, with holes in-line to the direction of fluid flow shown as the line
drawing (A), as made in SS316L from the side (B), from the top (C) and the bottom (D) ..................... 54
Figure 4.2 : (a) The AM ABS prototype 76.2 mm (3 inch) filter; (b) viewed from above; (c) viewed from
below; (f) The comparable 76.2 mm conventional perforated plate filter; (d) viewed from above; (e)
viewed from below; (f) conventionally fabricated version. ................................................................... 55
Figure 4.3: Graph depicting the change in the pressure drop (Pa) across conventional filter and the AM
filter in response to increases in flow rate (L/min). ............................................................................... 56
Figure 4.4 : Graph depicting the change in the pressure drop (Pa) across conventional filter with 522
µm mesh and the AM filter with 522µm mesh in response to increases in flow rate (l/min) .............. 56

10
Figure 4.5: (a) The conventional filter; (b) the AM filter; and (c) the graph depicts the change in the
pressure drop (kPa) across conventional filter and the AM filter in response to increases in flow rate
(l/min). ................................................................................................................................................... 57
Figure 4.6: (a) Conventional filter showing the distortion of apertures in moulded wire mesh; (b) AM
filter (SS316L) demonstrating apertures with retained size and shape; (c) the repeating node structure
(bar indicates one node length) of the AM integrated support and filter; (d) AM Build plate with the
truncated cone filters with different node sizes examined below. ....................................................... 58
Figure 4.7: Schematic of X-Ray CT setup ................................................................................................ 60
Figure 4.8: Variation in porosity over 20 segments for the six filter types: Nodes 0.5, 1.0, 1.5, 2.0, 2.5
and 3.0 mm. ........................................................................................................................................... 61
Figure 4.9: (a) X ray CT Image showing the integrated filter lattice in grey, with the spaces between as
black. Red arrows depict the measurement for hole width. Histograms of the hole width measurements
made for the : (b) 1.0mm node; and (c) 1.5mm node samples ............................................................. 62
Figure 4.10: Photomicrograph of cubes made using 0.5mm node (left) and 1.0mm node (right). ....... 63
Figure 4.11: Photomicrographs taken using light microscopy of the 0.5mm node cube latticework: A) x-
plane B) y-plane and C) z-plane and the 1.0mm node D) x-plane E) y-plane and F) z- plane ............... 64
Figure 4.12: Pressure drop (kPa) across the AM integrated support and filter with increasing flow rates
(L/min). 3.00 mm node, 2.5 mm node, 2.0 mm node and 1.5 mm node. ............................................. 66
Figure 4.13: Pressure drop (kPa) across the AM integrated support and filter with increasing flow rates
(L/min). 3.00 mm node AM filter, 2.5 mm node AM filter, conventional filter: 3.00 mm apertures, no
mesh, conventional filter with 20 mesh (900µm), conventional filter with 40 mesh (400µm),
conventional filter with 60 mesh (250µm) ............................................................................................ 66
Figure 5.1: Plain woven wire mesh: grey. Aperture size: white arrows. Wire diameter: white bar. Open
area: black. ............................................................................................................................................. 71
Figure 5.2: Schematic diagram of the cross-sectional view of an integrated support and filter AM design
with a) one size apertures formed from a single repeating node and b), c) two sizes of apertures formed
from two different sized repeating nodes. Key: F: flange, O: outside, I: Inside .................................... 74
Figure 5.3: Photographs of AM integrated filter support and filter a) example of 32mm diameter AM
conical filter outer layer AM 500μm and b) inner layer 1000μm-H. Higher resolution photo of repeating
node lattice work of the b) 1000μm-H and c) AM 500μm node of the dual aperture filter. Scale bar:
3000µm. ................................................................................................................................................. 74
Figure 5.4: Photomicrographs of AM 500μm filter discs with 1, 2 or 3 layers of latticework ............... 76
Figure 5.5: The collapse pressure (bar) of one, two and three layers of AM filter discs comprising of
1000µm-H (blue), 500m (red) and 1000µm-F (green) was compared to #18 woven wire mesh disc. . 80
Figure 5.6: Graph of the recorded pressure drop across each of: 1) AM 500µm; 2) AM 1000µm-H; 3) AM
1000µm-F; 4) 1000µm mesh conventional conical filters for both forward flow (FF) ad reverse flow (RF)
in response to stepwise increases in flow rate (L/min). ........................................................................ 82
Figure 5.7: Graph of the recorded pressure drop across each of: 1) 1000µm-H IN AM 500µm OUT; 2)
1000µm-F IN AM 500µm OUT; 3) 1000µm-H OUT AM 500µm IN; 4) 1000µm-F OUT AM 500µm IN conical
filters in response to stepwise increases in flow rate (L/min) ............................................................... 83
Figure 6.1: Photographs of car model built in two orientations. Build layers are most evident on the
surface of the roof in A compared to B. The roof and bonnet of the car in A has a greater surface
roughness than the car in B. .................................................................................................................. 86
Figure 6.2: Test series 1 for vibratory bowl finishing: tube on left, box section on right, manufactured in
SS316L. ................................................................................................................................................... 88
Figure 6.3: Test series 2 for tumbling barrel finishing: (a) cylinder, (b) cube, (c) internally flanged tube,
and (d) tube, manufactured in SS316L. These also give a variety of facets including flat, curved, internal,
and external. .......................................................................................................................................... 88

11
Figure 6.4: Side surface roughness from two different sides of tube, test series 1, BP1. Initial surface
roughness can vary between different vertical sides of the same component, despite both sides being
built in the vertical plane (z-). ................................................................................................................ 91
Figure 6.5: The average surface roughness (Ra: µm) of the Top (black square), side (open circle), internal
surface (black triangle) and Finished (Cross) of test series 1 Tube (A) and Box section (B) prior to post-
processing (unfinished) and after each 60 min treatment period in ceramic media in the vibratory bowl.
The average surface roughness (Ra: µm) of the Top (black square), Side (open circle), Internal surface
(black triangle) and Finished (Cross) of test series 1 Tube (C) and Box section (D) prior to post-
processing. ............................................................................................................................................. 92
Figure 6.6 : (A) The average surface roughness (Ra: µm) of the side of the box section and side of the
tube of test series 1 parts, ceramic finished in vibrator bowl at 8 hour intervals. (B) Average surface
roughness values (n=5 per treatment) from test series 1 Tube side (squares) and Box section side
(circles) from components built using built parameters set 1 (BP1: black line solid fill) and using build
parameters set 2 (BP2: dashed line, no fill). .......................................................................................... 94
Figure 6.7: Mean Surface roughness measurements (Ra: µm) of the side of Test Series 2 parts, flanged
tube, tube, cylinder and cube before and after sandblasting, and following barrel finishing with either
ceramic (A) or plastic (B) media. ............................................................................................................ 95
List of Tables
Table 1.1: Principal AM Technology Types 15
Table 3.1: Particle range and size from all nine samples 33
Table 3.2: Percentage fraction of the constituent components of the powder collected from
the different sources and the resultant averages
43
Table 4.1: Measured average aperture sizes of the cube node for each plane 58
Table 5.1: Position of the tensile test specimens on the SLM build plate 66
Table 5.2: Comparison of conventional mesh and representative AM design 68
Table 5.3: Comparison of target and actual measured strand and aperture dimensions 72
Table 6.1: Average surface roughness (Ra: µm) of internal surfaces of test series 2 parts,
flanged tube and tube before and after sandblasting and following 8, 12, 24, and 32 hours
of tumble finishing in either ceramic or plastic media
88

12
Chapter 1 Introduction
1.1 Conventional Metallic Filtration Media
There are several products used in the conventional manufacture of metal filters. These
include woven wire mesh, perforated plate, expanded metal, knitted mesh, and wedge
wire. There are also some more niche products such as porous metals and a trade named
product called Conidur. Welded wire mesh is widely used in agricultural applications,
industrial, transportation, horticultural, and food processing sectors. It is also used in
mines, gardening, machine, protection, and other decorations. Woven wire mesh is used
in sifting and screening machinery as well as conveyor and automotive belts, animal
enclosures and architectural framework. Most conventional manufacturing process
requires tooling. Tooling includes moulds, dies, and fixtures, and ranges from early-stage
prototypes to full-scale production.
1.1.1 Expanded Metal
Expanded metal was developed in the 1880s and the process used today remains similar
to the original despite years of technological advancements. The machine used is fitted
with a knife that determines the mesh pattern. A sheet of metal is fed through the
machines and is simultaneously cut and stretched using a pressured slitting and stretching
process (metalsupermarkets.com, 2016). The slits created allow the metal to be stretched,
which produces holes uniform in shape. The metal is adaptable to many metal finishing
processes and can be galvanised, anodized, coated, painted, or plated for a variety of
applications.
An important advantage of expanded metal is that the sheet retains its structural integrity
as it has not undergone the stress of being punched (like perforated sheet), and the mesh-
like pattern will not unravel (like woven mesh can do). The manufacture of expanded metal
also creates less waste than other methods as it has been stretched rather than punched.
The most common types of expanded metal are:
Standard Expanded Metal: extremely versatile, economical, and often used to provide a
rigid, raised, slip-resistant surface (Figure 1.1). The strands and bonds are set at a uniform
angle providing strength and rigidity while allowing maximum air circulation.

13
Figure 1.1 Expanded Metal (Stainless Steel) example of Standard Expanded Metal with raised surface
Flattened Expanded Metal: Produced by cold rolling expanded metal to flatten it. This
process is generally chosen when a smooth surface is required and it elongates the length
of the sheet by around 5%.
Hexagonal Expanded Metal: This metal has hexagonal opening instead of the usual
diamond shape. The hexagonal shape gives extra strength while also allowing the passage
of air, light, heat, sound, and liquid. Hexagonal openings are preferred when the metal is
heavily expanded.
Architectural Expanded Metal: This features the usual diamond pattern with added
architectural features. This results in a design that combines good aesthetics, increased
security and privacy, and increased ventilation. It is suitable for functional and decorative
purposes, or a combination of the two.
Micro Expanded Metal: Features small openings in light gauge metal; the openings can be
standard, flattened, hexagonal, or square. This type of expanded metal is often used in
filters.
One of the most important features of expanded metal is its inherent structural integrity
and strength; this is facilitated by the network of rigid strands that allow light and air to
pass freely through it. The material is also lighter that the original equivalent mass for a
given area.
1.1.2 Porous Metal
Porous metal is a cellular structure that contains a large volume of gas-filled pores. Metallic
foams can be formed using aluminium, titanium, steel and several other alloys. The process
of foaming does not affect the mechanical properties of the cell-wall material. It leads to a
unique spatial distribution of metal which results in significantly different properties when

14
compared to a bulk part. The properties of metallic foam generally depend on its porosity
(Kennedy, 2012). The pores in metal foam can be sealed, known as closed-cell foam, or
form an interconnected network, known as open-cell foam.
Open-celled foams with pores not visible to the naked eye have been used as high-
temperature filters in the chemical industry while closed-cell foams are generally utilised
for their impact absorbing properties. Metal foams do not retain their shape on impact
unlike polymer foams so they can only be used once, however they can absorb far higher
impact loads than polymer foams. Opencell foams are typically 5-30% of the density of the
metal that they are made of (Quadbeck 2017). Although they are frequently proposed as a
lightweight structural material they are not widely used for that purpose due to problems
that can arise from their inability to be reused.
Porous metals offer a unique combination of physical and mechanical properties that
cannot be obtained from dense materials. The majority of applications for porous metals
involve their ability to be incorporated into stiff, lightweight structures such as the
sandwich panels that use Aluminium foams as the “filling” which are favoured for their
ability to absorb energy, vibration, and sound as well as their resilience to high
temperatures and good thermal conductivity (Kennedy, 2012).
They provide an elevated strength to weight ratio which reduces localised stress, where
build-up of deformation bands with strain localisation and damage localisation causes
stress-fluctuations preventing potential collapse in the structure (Yung and Diebels 2016).
In engineering a homogenous material is often preferred. One of the key advantages of
porous metals when compared to bulk and porous structures separately are that they can
use certain properties from both groups, making a compound material with several
properties of bulk metals such as their heat capacity, malleability, ductility,
thermal/electrical conductivity, and properties from porous structures such a permeability,
reduced weight, and relatively high structural strength when the low density is accounted
for (Smith et al 2012). These characteristics combined produce a material with a high heat
capacity that is also permeable to fluid.
1.2 Subtractive Manufacture
Subtractive manufacturing, the opposite of additive manufacturing, is a process that
involves the removal of material to produce a component or product (Nijland, 2017). It
begins with a solid material that is cut, drilled, or milled to remove material. There is a wide

15
variety of material and process method options with subtractive manufacture, soft
materials can be easy to machine but will wear more quickly whereas it can be difficult to
achieve complex geometries with harder materials. Subtractive manufacture is preferred
for production of large volumes of simple parts that would not be economical to produce
with additive manufacture (Obert, 2016).
1.2.1 Electro-Chemical Machining (ECM)
Also known as Chemical Etching, ECM is a method of removing metal by an electrochemical
process. It is normally used for mass production and is used for working extremely hard
materials or materials that are difficult to machine using conventional methods. Chemical
etching can be used to easily produce complex, concave curvature components by using
concave and convex tools. As there is no contact between the tooling and the part being
manufactured there are no forces acting on either, and no chance of residual stresses
causing defects in the part. However out of all unconventional machining methods ECM
has high definition and sharp edges or corners are impossible to produce (ME Mechanical
Team, 2017).
1.3 What Is Additive Manufacturing?
Additive Manufacturing (AM), also commonly referred to as rapid prototyping or 3D
printing, is a manufacturing process that allows the user to create complex, solid, fully 3-
dimensional structures from sintered powder, liquid, paper or sheet material. This is
achieved through a process that builds the structure layer-by-layer; these layers are fused
together in crosssectional geometries that are determined through the use of Computer
Aided Design (CAD) to create the product. As an alternative to conventional machining
(Gebhardt, 2012), it allows the user to create the structure in a form that approximates
how the designer envisioned it, thus reducing the limitations of designing new complex
products and prototypes (Szalapaj, 2001). Through the layering process, AM enables the
designer to create multiple parts in a one-piece assembly, such as a door knock or hinge,
which is not always possible when using conventional manufacturing methods such as
casting or moulding.
1.3.1 Types of AM
There are seven main methods of AM; what follows is a description of the principal
technology types with some of the advantages and disadvantages of these processes.

16
1.3.2 Material Extrusion
Figure 1.2 Schematic of the Material Extrusion AM Process
Material extrusion is a process through which parts are constructed layer by layer from
extruded thermoplastic. The plastic is heated within the extruder, allowing it to pass
through the nozzle, forming the layer (Figure 1.2: Material Extrusion 2017). Once the plastic
has been extruded it hardens, allowing another layer to be added. This is a relatively
inexpensive process with the ability to change plastics quickly. However, it is limited to
thermoplastics and cannot use other materials such as metal.
1.3.3 Directed Energy Deposition (DED)
Figure 1.3 :Schematic of the Directed Energy Deposition (DED) AM Process
A DED machine uses a nozzle mounted on a multi-axis arm to deposit melted material onto
the specified surface, where it solidifies. The material is melted on deposition with a laser,

17
electron beam or plasma arc (Figure 1.3: Loughborough 2017). Material is added layer by
layer and solidifies to create or repair new features on an existing object. The DED process
uses material in wire or powder form. Wire is more material efficient when compared to
powder, but is also less accurate (Gibson et al, 2010). This method has the ability to control
the grain structure to a high degree, which lends the process to high-quality repair work
and functional parts (Yan, Xiong and Faierson 2017).
1.3.4 Sheet Lamination
Figure 1.4: Schematic of the Sheet Lamination AM Process
Sheet Lamination processes include Ultrasonic Additive Manufacturing (UAM) and
Laminated Object Manufacturing (LOM). The UAM process uses sheets or ribbons of metal
which are bound together using ultrasonic welding (Figure 1.4: Loughborough 2017). The
process requires additional machining to remove the unbound metal; this is usually done
during the welding process. The LOM process uses a similar layered approach using paper
as material and adhesive instead of welding. Laminated objects are often used for visual
models and aesthetic purposes are not suitable for structural use. Benefits of this AM
method include; speed, low cost, and ease of material handling, however the strength and
integrity of the resulting model is reliant on the adhesive that is used.
1.3.5 Binder Jetting
Similarly to Selective Laser Melting (SLM), binder jetting is a powder bed process that
utilises inject technology and a binding agent. Binder jetting uses layers of metal powder
however unlike other methods an adhesive is used to bind the layers of powder together.

18
The powder material is spread over the build platform and the print head deposits the
binder on top of the powder where required (Figure 1.5: Loughborough 2017). The build
platform is lowered and the process is repeated until the entire object has been made. The
resultant is a ‘green part’ which then needs to be placed in a sintering furnace to remove
the binding agent and achieve final part density. For metal parts, new machine systems
have recently been introduced including Direct Metal and desktop metal. The benefits of
this process are that parts can be made in various different colours with a range of
materials including polymers, metal, and ceramics. It is generally faster than other methods
but the overall process time is extended by the time taken for the binder to set; the part is
often left in the machine to cool and fully solidify to achieve a high-quality finish. The two-
material method allows for different binder-powder combinations and various mechanical
properties. Due to use of composite materials and binding method, the material
characteristics are not always suitable for structural parts.
Figure 1.5: Schematic of the Binder Jetting AM Process

19
1.3.6 Direct Vat Photopolymerisation
Figure 1.6: Schematic of the Direct Vat Polymerisation AM Process
Vat Polymerisation uses a vat of liquid photopolymer resin to construct the product layer
by layer. An Ultraviolet (UV) light is used to cure or harden the resin where required while
the build platform moves the object downwards after each layer has cured (Figure 1.6:
Loughborough 2017). As this process uses liquid to form objects, support structures will
often need to be added as there is no structural support from the material during the build
phase. This process provides a high level of accuracy and good finish but often requires
post curing to make the part strong enough for structural use. Care must be taken to not
contaminate the resin while removing parts from the vat; methods for removing resin and
supports include an alcohol rinse followed by a water rinse. The process can be lengthy as
parts may require additional scrubbing to fully remove excess material. UV light is often
used as a final post cure process to ensure a high quality finish.

20
1.3.7 Material Jetting
Figure 1.7: Schematic of the Material Jetting AM Process
The material jetting AM process creates components in similar manner to a two
dimensional inkjet process. The material is jetted onto the build platform according to the
CAD design layer (Figure 1.7: Loughborough 2017) using either a continuous or ‘Drop on
Demand’ system, where the material solidifies, the build platform is lowered and the
process is repeated and the component built layer by layer. The material, build and
support, is deposited from the nozzles which are moved in the x- and y- directions in a
controlled manner. The material is then hardened using ultraviolet light. As delivery of the
material is in drop form the number of materials suitable for this process is limited, with
polymers and waxes being the most common material. Depending on process support
material is removed using water pressure cleaner or hot oil/water bath or an oven. Parts
are made with high resolution (layer thickness 15-30µm) and may require further post-
processing for complex parts eg tooling. Wax and wax like materials can be used for casting
applications and some wax like materials are available for medical and dental applications.
21
1.3.8 Powder Bed Fusion
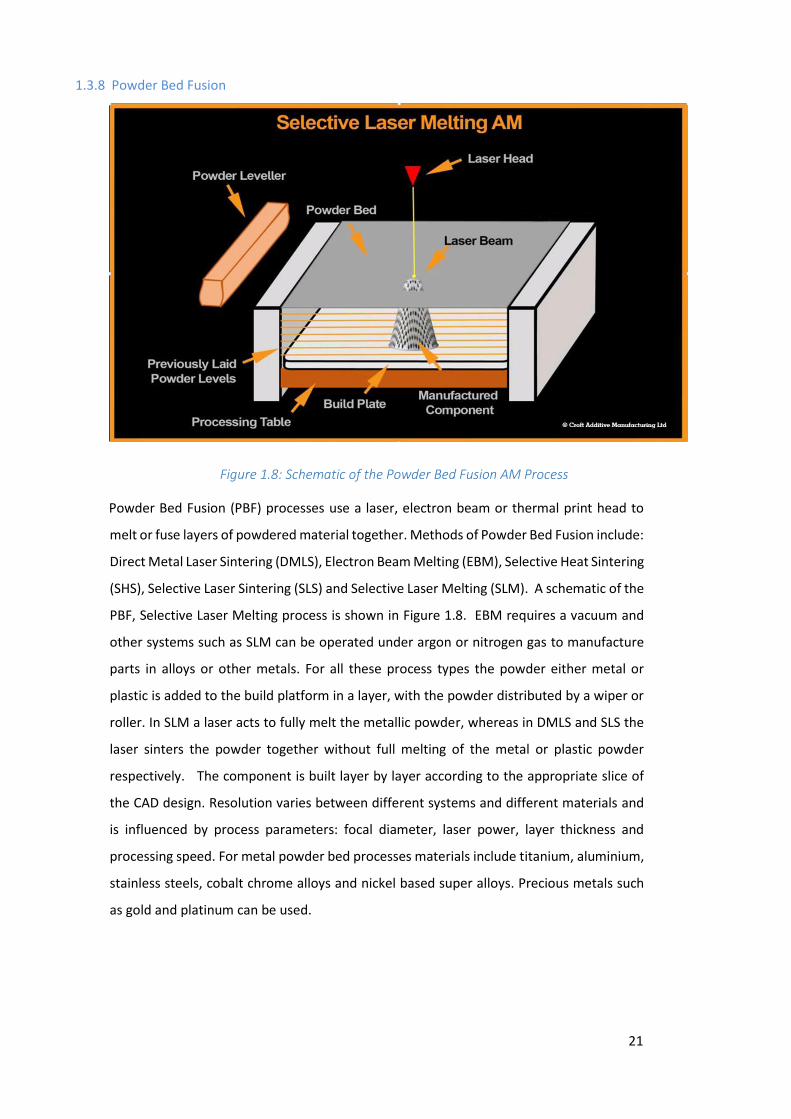
Figure 1.8: Schematic of the Powder Bed Fusion AM Process
Powder Bed Fusion (PBF) processes use a laser, electron beam or thermal print head to
melt or fuse layers of powdered material together. Methods of Powder Bed Fusion include:
Direct Metal Laser Sintering (DMLS), Electron Beam Melting (EBM), Selective Heat Sintering
(SHS), Selective Laser Sintering (SLS) and Selective Laser Melting (SLM). A schematic of the
PBF, Selective Laser Melting process is shown in Figure 1.8. EBM requires a vacuum and
other systems such as SLM can be operated under argon or nitrogen gas to manufacture
parts in alloys or other metals. For all these process types the powder either metal or
plastic is added to the build platform in a layer, with the powder distributed by a wiper or
roller. In SLM a laser acts to fully melt the metallic powder, whereas in DMLS and SLS the
laser sinters the powder together without full melting of the metal or plastic powder
respectively. The component is built layer by layer according to the appropriate slice of
the CAD design. Resolution varies between different systems and different materials and
is influenced by process parameters: focal diameter, laser power, layer thickness and
processing speed. For metal powder bed processes materials include titanium, aluminium,
stainless steels, cobalt chrome alloys and nickel based super alloys. Precious metals such
as gold and platinum can be used.

22
1.4 Summary of AM technologies
These principal AM technologies can be summarised as per the detail provided in Table 1.1,
indicating technology type, print medium, the relevant power source used to initiate the
fabrication process and the relative strengths and weaknesses associated with each.
In this study a selective laser melting powder bed system will be utilise to build the stainless
steel AM filters. The SLM AM system was chosen as the most suitable AM technology to
produce AM filters as the preferred material, stainless steel 316L, delivers strength for
operation in pressured systems as well as being resistant to chemicals and corrosion. The
SLM AM technology here, a Realizer machine has open source software therefore the laser
settings can be manipulated for control of the size of meltpool created and thus potentially
AM filter aperture size. The advantages and disadvantages of the powder bed SM process
is presented below in Section 1.5.
Table 1.1: Principal AM Technology Types
Category Technology Print medium Power source Strengths/Weaknesses
Material Extrusion
Fused Deposition
Modelling (FDM) Thermoplastics, Ceramic slurries, Metal pastes
Thermal Energy
• Inexpensive extrusion machine
• Multi-material printing
Limited part
resolution • Poor surface finish
Contour crafting
Powder Bed Fusion
Selective Laser Sintering (SLS)
Polyamides/Polymer High-powered Laser
beam
• High level of accuracy and detail
• Fully dense parts • High-specific strength
& stiffness • Powder handling
& recycling
• Support and
anchor structure
Direct Metal Laser
Sintering (DMLS)
Selective Laser Melting (SLM) Atomised metal powder 17-4
PH stainless steel, cobalt
chromium, titanium Ti6Al4V),
ceramic powder
Electron Beam Electron Beam Melting (EBM)
Vat Photopolymerisation
Stereolithography
(SLA) Photopolymer, ceramics (Alumina, zirconia, PZT)
Ultraviolet Laser
• Fast build speed • High part resolution • Overcuring, scanned
line shape • High cost for supplies
and materials
Material Jetting Polyjet/Inkjet
printing Photopolymer, Wax
Thermal Energy/Photocuring
• Possible to print with multiple materials
• High surface finish • Low-strength material

23
Binder Jetting Indirect Inkjet printing (Binder 3DP)
Polymer Powder (Plaster, Resin), Ceramic powder, Metal powder
Thermal Energy
• Full-colour object printing
• Require
infiltration during post-processing
• Wide material selection
• High levels of porosity in manufactured parts
Sheet Lamination Laminated
Object
Manufacturing
Plastic Film, Metallic Sheet,
Ceramic Tape Laser Beam
• High surface finish • Low material, machine,
process cost • Decubing issues
Directed Energy Deposition (DED)
Laser Engineered Net Shaping (LENS) Electronic Beam Welding (EBW)
Molten metal powder Laser Beam
• Repair of damaged/worn parts
• Functionally graded material printing
• Requires post- processing machine
1.5 Build Flaws in AM
There is a variety of technical challenges to overcome in order for AM to reach its full
potential as a manufacturing method. Some of the most challenging areas currently facing
the AM industry include: the limited types of materials suitable for AM and understanding
of material properties; process understanding and performance; the need for qualification
and certification of AM process and parts; surface finish and part accuracy; build speed;
build volumes; and the lack of standardisation around AM processes and materials
(Guessasma et al, 2015). AM processes as they are currently, show a variation in the
printed products which can be seen on a part-to-part basis as well as a machine-to-machine
basis. It is vital to understand the process variation since it could otherwise be a limiting
factor in the use of AM in critical components.
Many of the common build flaws mentioned have an effect on each other and one can
exacerbate another. Porosity can be caused by under melted powder; cracking can be a
result of residual stresses etc. so there is significant overlap in the causes of these flaws.
1.5.1 Porosity
Porosity is a flaw common in SLM and also found in PBF and DED processes, generally
caused by the wrong selection of machines parameters, moisture or contamination of feed
material/process environment, inadequate handling or storage, or vaporisation of minor
alloying constituents depending on material feedstock (Bland & Aboulkhair, 2015). Porosity

24
is one of the most prevalent build flaws in AM parts, and can be caused or exacerbated by
other flaws such as poor accuracy of alignment of the laser beam or unmelted powder
trapped in voids within the build. The material is needed to withstand the fragile printed
structure during the printing process. Porosity is sometimes used to refer to other flaws in
AM such as layer defects or unmelted powder, as these issues can lead to porosities.
1.5.2 Layer Defects
The process of using a laser to fuse metallic powder in layers can create defects such as
porosity that can lead to weakness in the part itself. Defects found within layers in a build
are generally caused by irregularities in powder particle size, leading to uneven layers. This
causes stress resulting from multiple layers not being properly sintered. Layer defects can
be caused by an interruption to the power supply, contamination of the build environment
purity, and contamination of the powder supply from previous builds. Surface finish and
dimensional accuracy are affected by both layer thickness and speed of deposition, the
available process parameters are described as: thickness of deposited filament layer, and
fill density. Cross-layer defects are unique to powder-bed fusion processes and are
generally caused by a poor selection of machine parameters, or possibly by contamination
or degradation of the processing environment, as this causes discolouration it is usually
detected visually and indicated that the process is out of control (Everton et al, 2016).
1.5.3 Under-Melted Material/Unconsolidated Powder
Unmelted particles within a build can create weak areas within a layer, lead to stress
concentration, and act as pre-existing defects. These areas can act as crack initiation and
can occur easily at the applied stresses and crack propagation controls the extent of
fatigue. Powder particles in close proximity to the build area are subjected to higher
temperatures arising from the melt pool and the released latent heat during solidification;
this could lead to noticeable distortion and surface roughness. This can be reduced by
remelting layers a second time. Some particles are lightly sintered together and are broken
apart by the high-pressure air jet leaving fractured patched or protrusions on the powder
particle surface. Such surface imperfections are likely to develop with increasing powder
reuse times; this can lead to increased surface roughness and distortion. Repeatedly
reused powder has a better rate of flowability than new powders (Cordova et al 2019).

25
1.5.4 Cracking
Cracking in AM parts can occur due to several metallurgical issues that increase crack
susceptibility. A large range of potential thermal and mechanical conditions present in AM
processes that can lead to cracking are poorly characterised. The boundaries between the
pieces, lines, surfaces, or layers of AM parts are rarely, if ever seamless. Since the
characteristic lengths of raw material and process parameters such as layer height are
often at different length scales, the surface roughness is also often multi-scale. The
boundary between newly created and existing material can act as an interface where
cracks and other types of defects can initiate at this interface and throughout the part.
Non-flat layer edges or layer roughness and the actual roughness of the metal surface are
the main contributors to surface roughness in AM parts. The layering effect can be reduced
by using smaller layer thicknesses, and by using smaller layer thickness values; this usually
means longer build times as the layer thickness dictates the division of a part into a number
of layers.
1.5.5 Residual Stress/Warpage
Residual stress can result from the rapid heating and cooling, and expansion and
contraction that occur during the printing process. When residual stress exceeds the tensile
strength of the printing material or substrate, defects such as cracking in the part or
substrate warping can occur. Residual stresses are at their highest concentration at the
interface between the printed part and the buildplate. The stress is more compressive at
the centre of the build and tensile at the edge of the build (Parry et al 2016). To prevent
warping it is essential to place the ideal number of support structures in the right locations,
this can be difficult to determine without performing trial and error on each new geometry
that is printed. As one scan line is melted all melt pools cool and shrink separately causing
tensile stress between the subsequent melt pools. The more the part builds up in the z-
axis, the thicker the material becomes, preventing distortion from shrinkage that
consequently causes a build-up of stresses that may affect the mechanical and geometrical
properties of the part during their eventual intended use.

26
1.6 What AM May do for the Filtration Industry
1.6.1 Advantages
There are several benefits of using AM which are of great interest to both customer and
producer, including the ability to create complex designs accurately. AM technologies are
not constrained by many of the limitations of conventional manufacturing and so it is
possible to manufacture products with increased levels of geometric complexity, as well as
allowing for the creation of complex and unique parts.
Another benefit of AM is its reduced environmental impact when compared to
conventional manufacture, the additive nature of the process gives material savings, as
does the ability to reuse waste material (i.e. powder, resin) not used during manufacture
(estimated at 95-98% recyclability for metal powders). AM can also improve the efficiency
of a product over its lifecycle, for example in the automotive and aerospace sectors, AM is
utilised to reduce weight and improve the fuel efficiency of their engines. Another benefit
of AM is that it incorporates the use of CAD, not only does this mean that digital design
files can be easily shared; facilitating the modification and customisation of components
and products, but also that companies can sell their innovative skills as a service.
The incorporation of CAD within the AM process creates a unique selling point for each
company (Crump & McKinley, 2013). Rather than just selling products, producers can focus
on the service equally to the product, ensuring that the customers’ requirements are
delivered whilst offering expert advice of the possible ways a product could be designed
and manufactured for the best results. The CAD software, used alongside the SLM
technology itself is able to realise products ranging from as small as 40 µm to the size of
the chamber itself, which depends on the machine used (Gibson et al, 2010). This further
increases the applications AM could be used for. As a ‘tool-less’ and digital technology, AM
facilitates a move from mass-production to mass-customisation, where products can be
produced in batches of one without any cost penalty, allowing manufacturers to meet their
customers’ requirements exactly. When coupled with 3D printing technologies, completely
personalised products such as hearing aids and surgical implants can be economically
manufactured. Internal geometries that cannot be produced by any other means of
manufacturing can be designed into products through AM. Such features have also
demonstrated lower manufacturing costs and added performance values over
conventional processes (Banks 2013).

27
1.6.2 Design Freedom/Design Rules In AM
Design freedom is a major driver of SLM being accepted as a mainstream manufacturing
process and could result in a reduction in lead-times, overall manufacturing costs, and
improved part performance. Design freedom allows for increased complexity in shape,
material, hierarchy, and function. AM allows for fully-functional assemblies and
mechanisms to be fabricated straight away. This significantly increases the possibility of
integrating internal features to improve product performance at the same costs and
challenges the traditional manufacturing paradigm that struggles to conciliate geometric
complexity and performance with low unit cost.
AM technologies have fewer constraints than traditional processes and therefore provide
the designer the ability to selectively place material where it is needed to achieve the
desired functionality. This enables the production of structures that have been
topologically optimised to reduce material use and decrease mass. Current AM processes
provide the most freedom to a designer in the realisation of complex geometric shapes;
this complexity can be implemented without additional cost as there is no need for new
tooling, re-fixturing, or fabrication time. While complexity can be achieved in traditional
manufacturing processes such as injection moulding, there is a direct relation between
geometric complexity and cost. AM processes enable the production of geometries that
would otherwise require the assembly of multiple parts if produced conventionally. It is
also possible to use AM to produce “single-part assemblies” products that feature
integrated mechanism. The parts and joins are printed in place and are supported by
support materials (or unmelted powder) that is removed in post-processing.
1.6.3 Build Supports
In order to create complex geometries such as overhangs, undercuts, and printed part
assemblies with moving components, AM systems must provide some means of supporting
the printed features of subsequent layers. This is typically done by printing fine scaffold
structures from the build material (e.g. vat Photopolymerisation and single nozzle
extrusion AM systems), or via the selective deposition of a secondary, sacrificial support
material (i.e. multi-nozzle extrusion and material jetting AM systems). In binder jetting and
polymer powder bed fusion systems, the unsintered powder material itself provides
support for overhanging features so no additional support is needed. The excess powder is
removed during post-processing using a combination of compressed air and vacuum. In

28
metal based PBF process the support structures are still needed to anchor the printed part
to the buildplate and/or to dissipate heat into the build platform and unsintered powder.
1.6.4 Pros and Cons of What Can Be Built
Current AM technologies are suitable for the fabrication of products that include
customised features, low-volume production, and/or increased geometric complexity.
Typically, the cost for achieving economies of scale via batch production of standardised
part using AM is significantly higher than via injection moulding techniques due to
discrepancy in cycle time. While a higher layer resolution with smaller layer thicknesses
provides a better surface finish, it greatly increases the total build time as more layers are
needed to create the desired geometry. The development of innovative, advanced AM
techniques has progressed rapidly in recent years, and expanded to a broader range of
industry applications. Compared with conventional manufacturing, AM is particularly
suitable for producing low volumes of products, especially for parts with complex
geometries. AM processes also offer great potential for customisation such as fabricating
personalised implants for hip and knee replacements. An increasing number of industries
benefit from advantages of AM technologies, such as increased freedom of design and AM
is progressively expanding from rapid prototyping towards small-series production of
customised parts.
While consumer goods are comprised of a wide variety of materials that render different
behaviours and functionalities, the material selection of AM systems is quite limited. A
large majority of AM systems can only process one material at a time. Multi-material AM
systems are emerging that enable functionally-graded materials, both polymers and
metals, the adoption of these systems is limited due to uncertain behaviour at the material
interfaces and a lack of design software support.
AM technologies ability to selectively place materials offers unique design opportunities
and capabilities that are not possible using traditional manufacturing processes. From
integrating multiple material to creating functional assemblies and parts with integrated
circuits and sensors, AM allows for the realisation of multi-functional products. Given this
capability, one of the challenges lies in creating software environments capable of enabling
a user to efficiently model such complexity. According to a 2015 Government
accountability office report (Persons 2015), a key challenge facing the AM industry is
“Ensuring that manufacturers can repeatedly make the same part and meet precision and

29
consistent performance standards”. For quality comparison purposes, forging, rolling, and
traditional metal manufacturing and processing yield consistent, well-characterised
properties and predictable processing responses. So far, AM produced metals have had
surprisingly strong mechanical behaviours. This is a serious constraint where repeatable
strength, weight, and highly reliable quality are critical. Some experts estimate it could take
up to a decade to achieve confidence and certification for some metal AM applications.
To ensure part quality, repeatability, and consistency across builds and machines, it is
imperative that AM industries develop material, processes, calibrations, testing, and file
format standards. The wide variety of machines, materials, and process makes the
development of a uniform standard an increasingly challenging task. Another aspect that
competes against the need for standardisation is the financial interest of machine
manufacturers in providing custom consumables and spares. From an intellectual property
standpoint, the emergence of 3D printing technologies and downloadable open-source
projects challenges the current legal landscape and social regulations that safeguard
inventors against infringement. The emergence of AM is likely to cause a fundamental shift
in the way design patents are filed and protected.
30
Chapter 2 Additive Manufacturing Methodology
2.1 Introduction to AM File Formats
The current industry standard for file formats is the stereolithography (STL) file. However
as AM technology has matured the shortcomings of the STL format have become apparent.
These include lack of colour, material, density, and orientation. It also does not scale well
to high resolution and lattices. The AM File Format (AMF) was developed but as yet has not
been fully adopted by the industry; while it does address some of the shortcomings of the
STL format it is not a complete solution. A consortium led by Microsoft developed the 3MF
format but this also does not fully address all requirements. A requirement exists to have
a neutral build file as an input to AM machines which would be similar to having a STEP file
in subtractive manufacturing; however, it would include supporting structure, laser path,
and other important parameters required to properly manufacture a part. Several
challenges remain in the types of materials available for printing, the relative cost and
speed of machines, and how to drive mainstream adoption of 3D printing technology.
There is also the considerable challenge of the current file formats used for AM being in
need of upgrade.
2.2 STL Format
The most commonly used file format for 3D printing is the STL format. STL files contain the
surface mesh of an object; any other information is added at the machine when setting up
the build plate. The STL file is basic because it has been the standard for over three decades
and contains only the necessary information for the shape of the part. By removing any
unnecessary information, the file is small to ensure quick transfer to the machine. Most
AM software packages require the user to set material information and error check the STL
file before printing commences, to ensure a successful build. With more complex and larger
builds, the setup can be time consuming.
2.3 AMF Format
In 2009 the American Society for Testing and Materials (ASTM) began development on a
new file format to replace STL. The new file format was initially called “STL 2.0” but was
later renamed AMF. The first iteration of the standard was developed in 2011 and
31
approved in conjunction with ISO in 2013 as ISO/ASTM 52915:2013; the most recent
amendment was in 2016. Like STL, AMF defines the surface mesh of an object. Unlike STL,
AMF contains other details such as metadata (author, time of export, etc.), material of
parts, and colour of parts. AMF also uses an improved meshing method for a more accurate
build. AMF is written in XML so is easily edited and compressed to the users’ needs and is
designed with backwards compatibility with STL and future proofing in mind. The AMF file
is supported by most modern CAD packages.
2.4 3MF format
The 3MF file format was designed my Microsoft to allow direct printing from CAD software
to 3D printer. 3MF is supported by most modern CAD packages but is designed to work
with Windows 8.1 or higher. 3MF can also work with automated subtractive manufacturing
technologies and is more compact than AMF. 3MF is available for development from
Microsoft free of charge and contains almost all of the features AMF does. The 3MF format
can be more technical to work with than AMF. 3MF is less developed than AMF and there
is a potential for errors to occur in the future. The format is also regulated by Microsoft
which could also cause licencing issues to form.
2.5 Format Comparison
2.5.1 Best Format / Replacement for STL
Figure 2.1 provides a basic example to show some differences between the different
formats. The model contains various curved surfaces which can cause problems when
converting to mesh files.

32
Figure 2.1: Parametric CAD file
Information is lost from the curves of the part. Figure 2.2 shows an example of a coarse
mesh which has a small file size of 144KB. It is clearly visible that a significant amount of
information from the curved surface has been lost meaning the printed object is not a very
accurate model to the original CAD design.
Figure 2.2: Coarse STL file (144 KB)
Figure 2.3 shows another STL with a finer mesh. The file size is 1,395KB, almost an order of
magnitude larger than the coarse mesh and the curves still have noticeable flat faces

33
(although would be adequate for this component). Note that this is a compressed binary
file; the uncompressed ASCII (human-readable) version is 7,895 KB.
Figure 2.3: Fine STL (1,395 KB)
Figure 2.4 shows a 3MF file of the same model with the same coarseness parameters as
the STL file. This file is 350KB, significantly less than the STL. The 3MF file also contains the
material and colour information of the part. It can also be seen that the coordinate system
is in the centre of the hole in the part which is the origin of the original CAD model.
Figure 2.4: Fine 3MF (350 KB)

34
The AMF file in its human-readable uncompressed state is significantly larger than the STL
at 2,896 KB, but can be saved in a compressed state making it slightly smaller than the 3MF
file at 290 KB but is not human-readable in this state (Figure 2.5).
Figure 2.5: Fine AMF file (2,896 KB uncompressed, 290 KB compressed)
STL files are significantly larger than AMF and 3MF due to the way the geometry is
specified. An STL file is effectively a list of every triangle in the model, each triangle is
defined by its three vertices and a normal vector. This means that every vertex of the model
is defined multiple times. This also means that rounding errors can result in vertices not
being defined in the exact same position causing triangles to have gaps between them or
to be overlapping, or a variety of other errors. AMF and 3MF files are different in that the
files first define every vertex in the model and assign each vertex a number. After that the
triangles are defined by the three numbers corresponding to the correct vertices. This
means that each vertex of the component is only defined once and there is no chance of
rounding errors between triangles eliminating the sometimes time consuming mesh repair
process.
Figure 2.6 shows an example of an error analysis of an STL file received from a customer
that had a large number of errors and was very time consuming to repair it to a usable
state.

35
Figure 2.6: STL file errors
2.5.2 Practical examples
Figure 2.7 shows a model with a very complicated mesh with a significantly large number
of triangles. The STL file for this model with a fine resolution is 323 MB, the same file saved
as a 3MF is 83 MB and as an AMF is 79 MB. The main advantages at the moment are the
file size and the lack of mesh errors. The 3MF and AMF both contain more information
about the part whilst having a much smaller file size. In future as 3D printing companies
aim to adopt one or both of the formats it will become much more convenient to 3D print
a component as their software will be designed to take the information from the files and
produce the finished code for the printer to use.

36
Figure 2.7: Pleated wire cone
2.6 Conclusions
2.6.1 Process with New Format
Currently the steps involve taking the STL, repairing it, structuring it and slicing it to produce
a contour and support file. The contour file is then hatched and merged with the support
file to produce a laser path and parameter file. This ultimately results in the creation of at
least four different files for a single build, five if multiple of the same part is required. If in
future all of this can be achieved with a single file and a single piece of software, then AM
will become much more convenient. Also the 3MF and AMF files can contain multiples of
the same component without affecting the file size or requiring multiple files. If the
machine manufacturers create their software in future to use the information provided in
3MF or AMF files, then it seems likely that one of the formats will be widely accepted by
the industry due to reduced file sizes, reduced preparation time and the reduced software
requirements and cost associated with that. It is difficult to say at this time which format
will become the more popular but the support and development of various huge CAD and
AM companies in the 3MF consortium may indicate that 3MF may come out on top.

37
Chapter 3 Optimisation of the AM process
3.1 Powder Challenges
Powder Bed fusion (PBF) processes (Figure 3.1) using a laser or electron beam rely on metal
powder with a chemical composition, particle size, and morphology tailored for the specific
AM process. Spherical powder is sieved to achieve an acceptable particle size distribution
to suit the process. The number of alloy powders optimised for PBF processes is currently
limited but will increase following greater adoption of the technology. Commercial metal
powders used by the Directed Energy Deposition (DED) laser process offer a wide range of
alloy selection. These include hard facing alloys and materials in wider use, such as those
for laser cladding. Issues associated with AM metal powders include consistency of
chemistry, PSD, shape morphology, and micro-porosity or contaminants picked up during
powder production.
Figure 3.1:Powder Bed Fusion process
3.1.1 Flowability
The physical characteristics of a metal powder define AM performance. These
characteristics include both bulk properties of the powder and properties of the individual
metal particles. Important bulk properties are packing density and flowability; powders
that pack consistently well to give a high density generally produces components with
fewer flaws and consistent quality. Flowability is arguably more closely associated with
process efficiency. The ability to spread evenly and smoothly across a bed and to form a

38
uniform layer with no air voids is essential for PBF processes. Bulk density and flowability
are directly, though not exclusively, influenced by particle shape and size (Gai et al 2008).
The range of particle characteristics known to influence flowability includes stiffness,
porosity, surface texture, density, and electrostatic charge. Generally smooth, regular
shaped particles flow more easily than those with rougher surfaces or irregular shapes. The
rougher surface of a particle creates increased interparticle friction while irregularly
shaped particles are more prone to mechanical interlocking; both of these effects decrease
flowability. Spherical particles tend to pack more efficiently than irregular particles giving
rise to higher bulk densities. The bulk powder property requirements for AM suggest that
spherical particles are likely to be highly prized.
3.1.2 Particle Size Range
The typical size range for particles in SLM process is 15-45µm, this is so that the layers
within the part being built are densely packed and even. Wide particle size distribution
ranges are important in AM processes as if the particles were all the same size, there would
be a much higher chance of internal porosity or voids forming. In powder where there is a
wider range of particle sizes, the smaller particles fill the spaces in-between the larger
particles.
3.1.3 Standardisation of Powder Reusage
Hebert (2015) states that there are phenomena known in the casting industry where the
alloy composition is modified during the melt process and in the casting industry the
ingredients for the melt are varied to suit the outcome once the product has been cast.
Currently this is not the case in most additive manufacturing applications; Clayton (2014)
looks at three batches of powder manufactured for AM coming from the same supplier and
whilst the three samples had an almost identical particle size distribution and produced
similar results, using the Hall flowmeter to test the specific energy required to spread the
powders on to the build plate gained different results where one batch created twice the
pressure drop compared with the other two that were very similar. Further work by Clayton
(2014) uses powder sieving to compare if there was a difference between used sieve
powder and used powder as it came from the machine. It was concluded that there was
very little difference between the used powders showing that the use of an unused powder
with some reused powder does not vary too much from unused powder on its own.

39
3.2 Realizer AM Machine Powder Challenges
The powder delivery method used by Realizer is a different method than what is used by
most other AM machines. Several machines are designed with two pots. At the start of the
build one is full and one is empty and as the build commences the empty pot drops by one
layer thickness and the pot containing the powder raises by one layer thickness the scraper
blade or a roller then moves the powder from the full pot to the build pot, with the cycle
continuing until the build is completed. Realizer delivers the powder by utilising three
spring screw conveyor at the back of the machine to deliver powder from a storage
container.
3.2.1 Delivery System/Appearance of Black Stripes
During the build, distinct areas of the powder being laid down layer by layer are visible by
eye; these distinct areas appear as stripes lengthways along the build plate as depicted by
the schematic given in Figure 3.2.
Figure 3.2: Schematic diagram of powder stripes visible during and following build. Samples
were taken from each marked section for analysis.

40
The machine delivers the powder through three delivery points prior to the wiper blades
distributing the powder evenly across the surface. The powder appears to be different in
nature as the colour is uneven and the visual size of the particles, in each area, appears
different. It may be that during powder delivery to the build bed that the forces acting on
the powder particles within the screw delivery system is causing redistribution in the
particle sizes and so the powder is not being delivered, uniformly mixed, evenly across the
bed. Spherical particles like those in the new powder settle faster due to their having a
smaller surface area than that of an irregular shaped particle.
Re-using leftover powder allows for a reduction of both raw material cost and overall levels
of waste significantly but it also important to note the extent to which powders are altered
by passing through the AM machine and whether further use is possible without
compromising the quality of the finished part.
Used powder does not flow as freely as new powder due to a wider particle size range and
is therefore less likely to successfully perform in the process. Leftover powder can contain
large fused particles, or may have changed chemically due to picking up surface
contaminants. These large particles can reduce the packing density of the powder and
cause uneven layers and structural problems to a build. Therefore, samples of powder from
each area and control samples will be analysed for particle size in each sample and the
particle distribution range of each sample compared to determine whether:
1. The powder across the build bed contains a uniform distribution of particle sizes
of powder;
2. The actual powder particle size and distribution across the build plate;
3. The difference in particle size and distribution compared to new powder and
compared to the machine bed powder in the machine reservoir.
Nine samples were taken (Table 3.1), one from each area in Figure 3.2, and assigned a
corresponding sample number. The powder samples were examined using a Scanning
Electron Microscope (SEM). Images from each were then analysed to determine the size of
the particles in each sample. The results for each sample were recorded blind to prevent
bias in the results.

41
Table 3.1: Particle range and size from all nine samples
Sample
# of particles Range (µm) % in good range (15-
45µm)
P1 Black Powder (Left)
21 32-182 14.3%
P2 Soft Powder (Left)
74 17-111 62.2%
P3 New Powder (Unused)
356 3-64 81.7%
P4 Grey Powder (Middle)
182 8-101 82.9%
P5 Grey Powder (Right)
305 5-92 78.7%
P6 Machine Bed Powder
(Mixed) 465 1-75 76.1%
P7 Black Powder (Right)
37 21-200 37.8%
P8 Grey Powder (Left)
278 6-90 74.1%
P9 Soft Powder (Right)
340 1-85 77.6%
The size distribution of particles in the unused powder (P3) is quite similar to that of the
mixed machine bed powder (P6: Figure 3.3), the sample of unused powder has a range of
3-64µm, the mixed machine bed powder has an exact range of 3-70µm with 2 anomalous
results of particles both over 1000µm in diameter. The new powder and the mixed machine
bed powder have a similar particle size range. The particles in the unused powder range in
size from 0-65µm with 81.7% of the particles being in the 15-45µm range, the particles in
the mixed machine bed powder range from 0-75µm with a similar distribution to the
unused powder (Figure 3.3).

42
New Powder – Unused Machine Bed Powder
Figure 3.3: Particle size distribution and comparison of new powder and mixed machined
bed powder samples
Grey Powder
The samples of grey powder from the left, right, and middle of the buildplate all have
mostly similar particle size ranges. P4 (Figure 3.4) has a range of 8-100µm and 82.9% of the
particles were in the 15-45µm range, this was the largest percentage of the mixed powder
samples followed by P5 with 78.7% (Range 5-92µm) and P8 with 74.1% (Range 5-85 µm).
In comparison to the machine bed mixed powder (Figure 3.4), the left grey powder
contains the largest number of small particles of <15µm, whereas the middle and right
have less. The particle distribution shows few particles in any sample in size ranges above
45µm, the desired powder bed maximum, indicating good potential packing density.

43
Figure 3.4: Particle size distribution and comparison graphs of samples of grey powder taken
from the left, middle, and right sides of the build plate and the machine bed mixed powder
Soft Powder
Samples P2 and P9 (Figure 3.5) are taken from the powder on the outer edge of the
buildplate. P2 has an exact range of 16-111µm, the percentage of particles in the 15-45µm
range is 62.2%. P9 has a range of 5-83µm with two anomalous particles with diameter over
1000µm, 77.6% of the particles in this sample are within the 15-45µm range. The size
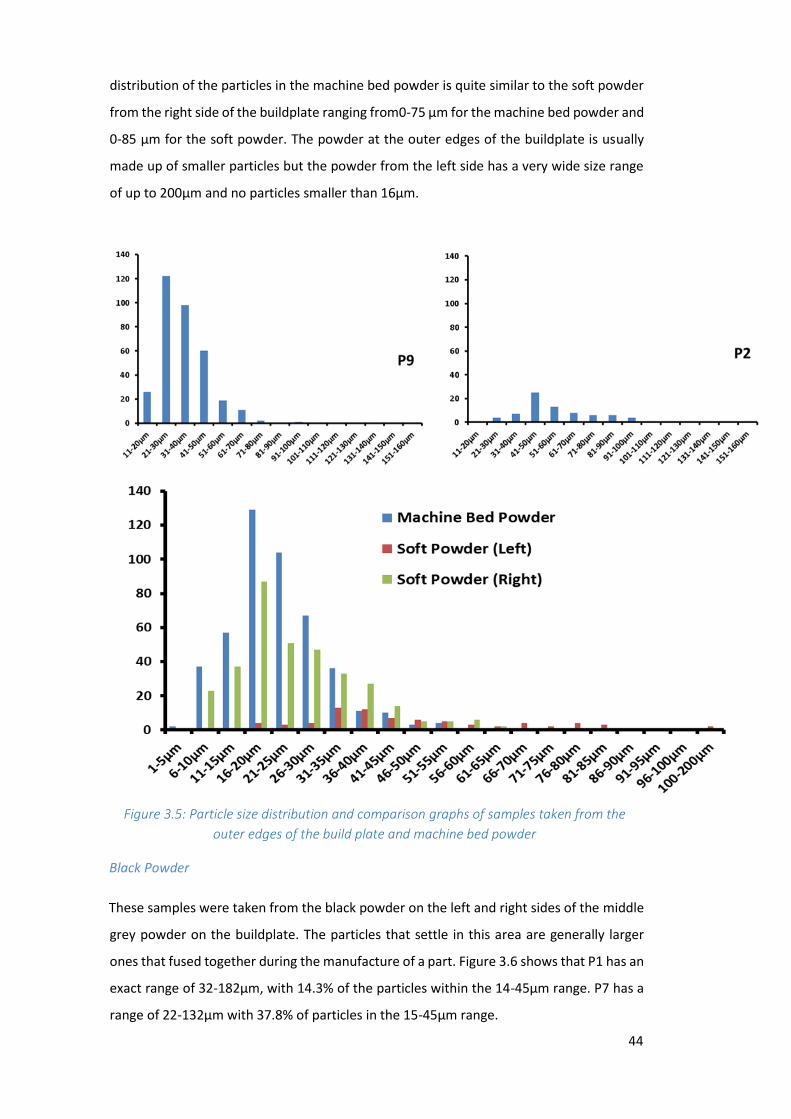
44
distribution of the particles in the machine bed powder is quite similar to the soft powder
from the right side of the buildplate ranging from0-75 µm for the machine bed powder and
0-85 µm for the soft powder. The powder at the outer edges of the buildplate is usually
made up of smaller particles but the powder from the left side has a very wide size range
of up to 200µm and no particles smaller than 16µm.
Figure 3.5: Particle size distribution and comparison graphs of samples taken from the
outer edges of the build plate and machine bed powder
Black Powder
These samples were taken from the black powder on the left and right sides of the middle
grey powder on the buildplate. The particles that settle in this area are generally larger
ones that fused together during the manufacture of a part. Figure 3.6 shows that P1 has an
exact range of 32-182µm, with 14.3% of the particles within the 14-45µm range. P7 has a
range of 22-132µm with 37.8% of particles in the 15-45µm range.

45
The lower graph in Figure 3.6 shows the range of particle sizes in the mixed machine bed
powder, and the black powder from the left and right sides of the buildplate. The sample
size for the black powder is very small when compared to the other samples; P1 contains
21 particles and P7 has 37 whereas most of the other samples contain over 100 particles.
This is because the size of the particles in the black powder is much higher so fewer fit into
the magnified area. The size distribution of the particles in the black powder sample ranges
from 20µm to over 200µm while in the mixed machine bed powder the range is much
smaller from 5µm to 75µm. As the particles in the black powder are mostly outside of the
usable range it is not likely it could be reused unless it was sieved to separate the smaller
particles.
Figure 3.6: Particle size distribution and comparison of samples taken from the black
powder stripes on both sides of the build plate and machine bed powder
The results here demonstrate the metallic powder is being unevenly distributed across the
buildplate during the build. This is clearly shown by the accumulation of larger particles
within the two black stripes and the differences between the soft powder and the grey

46
powder. The results determined that the black areas contained high numbers of large and
oversized particles. This not only changes the flowability dynamics of powder in this region
but also the black regions lack the smaller particles sizes which would infill the interstitial
spaces. This creates the possibility that melted powder in this area may be less dense than
in adjacent regions and components made across the black regions have areas of variable
density. The clear pattern, two black stripes at a consistent distance from each other and
the edges of the build plate indicate that this distribution may be associated with the three
point powder delivery system. Remedial steps were taken to alter the powder delivery
and wiper system to eliminate the uneven delivery of the metallic powder to the
buildplate.
Figure 3.7: Particle size distribution graph of new powder and machine powder
The metallic powder used here was supplied in quantities in excess of 100kg with the same
batch number. The new powder used in the black powder study (as described above) was
supplied in 2014 and this was compared to new powder (UK80068) supplied in 2016 to
determine if the powder particle size distribution had changed from the previous supply.
Samples from new powder (black powder study), new powder (UK80068) and from the
machine powder bed on 30/04/2016 were analysed for particle size and the particle size
distribution was calculated and is shown in Figure 3.7. The re-used powder in the machine
powder bed contains fewer particles of 25µm or less diameter and more particles of 31µm
or above than either of the new unused powders. This reflects the re-use of the powder
where smaller particles are incorporated into the melt pool to form the components. For
both new powders most particles are in the 16-30µm range. However there are less
particles in 6-10µm fraction, and also for the 31-50µm fractions, in the new powder

47
(UK80068) than the new powder (Black powder study). This demonstrates that the powder
particles distribution can change between different batches of metallic powder from the
same supplier. It may be that the supplier has changed the particles size distribution to
enhance the flowability of the powder to suit AM (LPW PowderLife 2016). It is therefore
important to monitor any changes in particle distribution in new powder batches supplied
as these may be associated to flowability issues in the powder delivery to the machine bed.
3.3 Investigation of the Effect of AM Build on the Composition and Particle Size of AM
Powders
The main components of the Stainless Steel powder are Iron, Chromium, and Nickel; it also
contains smaller amounts of Molybdenum, Aluminium, Oxygen, Manganese, and Silica.
The percentages of each element are described in the data sheet for each batch of supplied
powder. Following laser action on the metallic powder bed layer the powder in this layer
and surrounding areas is either fully melted to form part of the meltpool, partially melted
and either attached or not attaced to the component or exposed to different amounts of
heat but not melted or particles can form part of thesplatter from the laser action. What
effects, if any, on the composition of the metallic particles by the build was investigated
using a SEM which had to capability to perform composition analysis on particles in powder
samples. Here we examined the composition of single particles from 4 samples: new
powder (UK80068), oversize particles from the sieving process, particles that passed
through a #500 mesh sieve, and powder from the machine powder bed, sampled on
30/04/18 as above.
Figure 3.8: Elemental composition breakdown of 4 particles, NP1, NP2, NP3 and NP4 of new
powder(UK80068) as determined by SEM

48
4 individual particles (NP1, NP2, NP3 and NP4) were sampled from new powder (UK80068)
and the composition of the particles determined by SEM. All these particles were found to
contain iron, nickel and molybdenum (Figure 3.8). But not all particles contained
chromium, aluminium, oxygen, manganese or silicon (Figure 3.8). These results suggest
that not all individual particles in the SS316L powder contain all the constituents that are
combined to form SS316L rather the total composition arises from the all the constituent
particles. However it may be that the detection system for the constituents in the SEM
system may only detect a proportion of the elements present in a sample containing
different sized particles as the level of penetration into the particle is unknown.
Figure 3.9: Elemental composition breakdown of powder caught by sieve
Oversized powder which did not pass through the sieved following sieving of machine
powder bed powder was analysed to determine if there was any change in the composition
of the particles. 4 particles were examined, OS1, OS2, OS3 and OS4 and the results shown
in Figure (3.9). All particles contained iron and nickel but varying amounts of different
elements were found in the particles for the other element detected (Figure 3.8). This may
reflect the large size of the particles and the detection method.

49
Figure 3.10: Elemental composition breakdown of powder sieved through 500 mesh
Machine bed powder was sieved through #500 mesh (25µm apertures) and the
composition of particles that passed through the sieve was analysed by SEM (Figure 3.10).
Particles were found to contain iron, nickel and chromium but with varying amounts of
aluminium and silicon.
Figure 3.11: Elemental composition breakdown of powder from machine bed powder
The composition of powder particles in the machine bed powder was analysed and the
results shown in Figure 3.11. However only two particles were successfully analysed here.
More sampling of an increased number of particles from each group would provide a fuller
picture of the composition of the particles in each group.
0102030405060708090
100
Mas
s P
erce
nt
(no
rm.)
MPB1 MPB2
0102030405060708090
100M
ass
Per
cen
t (n
orm
.)
#500 1 #500 2

50
The particle size distribution of the four powders tested here is given in Figure 3.12. The
machine sieve is capturing oversize particles as well as a number of smaller particles,
possibly due to the attachment of smaller particles to the sieve itself. Sieving with a smaller
aperture (#500 mesh, 25µm aperture) is time consuming and has been successful in
excluding particles in excess of 45µm. The particles size distribution for this powder
demonstrates that the majority of particles in this powder are less than 30µm.
Figure 3.12: Powder particle size distribution from each of the four sources
3.3.1 Discussion
The findings show that the powder particle size distribution of the new powder is uneven.
Following a build cycle, or number of build cycles the particle distribution changes as the
relative number of smaller particle becomes less and the larger particle sizes become more.
Within our particular mechanical distribution of the powder over the build plate that

51
resulted in two dense black stripes and other regions of varying colours, we have shown
that the particle size distribution in each of these regions differed greatly from that of new
powder. The black stripes were shown to contain a far greater proportion of very large
oversized particles that are most likely the result of heat fusion of two or more other sized
particles, or morphing of smaller particles to a large particle. Here this unusual pattern of
particle distribution has arisen from the mechanical distribution that is particular to the
Realizer 250 machine used. This problem was addressed and the solution was designed
and delivered in house.
There has been significant research on powder based SLM. A typical example of this is when
Honeywell Federal Manufacturing partnered with Missouri University of Science and
Technology on a five year $5 million project (Missouri S&T, 2016). The project looked into
powder characterisation, material property characterisation methods, and temperature
effects on material properties controlling microstructure, and mechanical properties and
chemistry specifically for AM, initially using stainless steel 304L.
Davies et al (2017) demonstrates that virgin powder is totally different to "post processed
powder" in that the virgin powder is spherical as opposed to the change in the powder
morphology and composition
Homogeneous mixing of powders for AM is critical to the successful building of
components. Powder properties are described as being the particle size and shape, and the
bulk properties as being the packing density. Olakanmi et al (2015) whilst working with
aluminium powder for AM refers to the mixing of aluminium powders to improve the
product density that can be achieved. Describing powder properties as being the particle
size and shape and the bulk properties as being the packing density and the probability.
This needs to be borne in mind when reviewing the manner by which the powder is
distributed within the Realiser machine.

52
Chapter 4 Novel Filter Designs That Deliver Filtration Benefits
This chapter puts into practice, considerations for design and its implications for fabrication
of lattice structures that lend themselves well to filtration applications. A significant
component of this chapter is taken from a research paper presented at the American
Filtration Society 2013 Conference (Burns et al, 2013), for what has been termed ‘High Flow
Filter Design’. The full (original) paper is provided at Appendix A.
4.1. Introduction – What is Design / What is it Trying to Achieve
When a filter is employed in a conduit, it forms a barrier and thus creates resistance.
Resistance occurs due to the pressure differential across the filter, with fluid flowing from
high to low pressure across the filter. The pressure drop across a filter is dependent on the
flow rate of the fluid and the amount of resistance that the filter type exerts on the fluid;
when moving fluid within a pumping/filtration system, more energy is required at
increasing flow rates to overcome the filter’s inherent resistance. In 2007, 13% of the UK’s
industrial electricity usage was used for pumping, equivalent to 44.8 million MWh/year,
costing £ 728 million per annum and equating to 6% of the UK’s carbon footprint (equalling
30 million tonnes/year) (Schofield & Veness, 2007). By optimising the fluid flow through a
filter, minimising the turbulence produced and in so doing decreasing the pressure drop
across a filter, the resultant would be a more efficient filtration system. This increase in
efficiency would in turn lead to a decrease in pumping energy required and so reducing the
end users’ energy costs and carbon footprint (Vijayakumar et al, 2013).
The successful operation of pumping systems usually requires filtration, to separate solids
from fluids, with oversize solids in the fluid being retained by the filter media. The filter
media type and aperture size is typically dependent on the end-user requirements and
particular application. Generally, for coarse filtration, a sieve formed from a single
perforated plate or single woven wire mesh layer, retains particles that are too large to
pass through the holes in the sieve. Screens and filters can also be manufactured using
wedge wire. For finer filtration, woven wire mesh with smaller apertures is employed.
However, when fluid flow rates are increased, fine woven wire mesh alone can be damaged
easily. Therefore, filters are designed to comprise of two or more layers. Usually a
perforated plate with larger hole sizes forms the filter support with a layer of woven wire
mesh of suitable aperture size either inside or outside of the support forming the actual
filter. An additional layer of woven wire mesh of an aperture size that is in-between that

53
of the support and the filter mesh is added to encourage the fluid to flow from the support
to the filter mesh of the assembled product. Depth filters comprising of a bed of granular
material (e.g. sand) trap solid particles as they pass through the bed. For very fine or Nano-
filtration, depth filters comprising of fibrous layers or membranes where larger particulates
are unable to traverse the torturous routes through the media, are used to remove very
fine particulates from fluids. Filtration is further dependent on the length of the filter and
maximum filtration can be achieved by increasing the open area of the filter to a maximum.
This is dependent on the area available for the filter as well as the method of construction,
therefore filters are designed specifically for their end-use application and the filter media
type manufactured using a wide variety of fabrication techniques.
4.2. Build the Design of the Filter Around the Desired Function - Design for End Purpose
Optimisation of fluid flow through a filter and minimising turbulence and pressure drop can
lead to a more efficient filtration system. Traditionally, metal filters have been
manufactured using perforated plate, mesh and wedge wire. Additive Manufacturing (AM)
technology can be used to produce filters whose geometries cannot be manufactured using
more conventional manufacturing technologies. Three novel filter geometries were
designed for fabrication using AM to reflect three traditional filter types. A filter design,
with holes in-line to the direction of fluid flow, which can be directly compared to
perforated plate, was produced using AM technology with 316L Stainless Steel as the build
material (Figure 4.1).
When compared to conventional filters of similar aperture size, the pressure drop across
the AM filter with increasing flow rates was significantly less compared to the
conventionally manufactured filter. Thus, less pumping energy is required for the in-line
hole AM filter. The AM filter designed to be representative of a mesh-based filter, was
created as a single part with an integrated support and filter section. This filter has a
significantly increased open area and increased flow rate compared to its comparable
mesh filter. The AM filter representing that fabricated from wedge wire, overcomes
conventional fabrication issues and is an advance towards leaner manufacturing. AM
technology has enabled the production of innovative, geometrically complex, 3D filter
designs that have significant increases in filtration efficiency. Industrial application of these
filters will have a positive impact in reducing the carbon footprint of end users.

54
Figure 4.1: The AM filter design, with holes in-line to the direction of fluid flow shown as the
line drawing (A), as made in SS316L from the side (B), from the top (C) and the bottom (D)
4.3. Testing: Flow Rate
Within a conventional truncated cone shaped filter constructed from perforated plate and
mesh, the fluid enters the filter in-line with the fluid flow. The fluid must then turn through
an angle to pass through the mesh and apertures in the support portion before it once
again changes direction and continues along the conduit. This travel causes undesirable
turbulence within the filtration product/system. Such turbulence increases the energy
requirements for pumping through the filter. At the truncated end of the filter the holes
are in line with the fluid flow however, when the fluid flows towards the truncated point,
the jet flow is attracted to the surface (this is known as the Coanda effect (Tritton, 1977)).
As a result, the fluid flow meets in the middle of the truncated end and so creates
turbulence. Due to the Coanda effect and the resultant turbulence, no significant benefit
is achieved from the holes in line with fluid flow at the truncated end of the conventional
filter. If the holes throughout the filter were to be aligned with the fluid flow direction,
then there may be a substantial benefit with decreased turbulence being produced across
the filter and so the resultant pressure drop will decrease. Historically, this type of filter,
with holes in line with fluid flow was constructed using conventional (typically subtractive)
manufacturing/fabrication methods. A different method of manufacturing was sought to

55
undertake experimental trials, with a prototype model eventually being realised in
Acrylonitrile Butadiene Styrene (ABS) using the fused deposition modelling (FDM) AM
technology (Figure 4.2). The 76.2 mm (3 inch) plastic filter prototype has holes in-line with
fluid flow along its complete length as shown in Figure 4.2 (a-c) which appear as round
holes when observed in plan view (Figure 4.2 b-c). This filter was compared to a
comparable 3-inch conventional filter (Figure 4.2 d-f). Aperture diameter for both filters
was 2 mm.
Figure 4.2 : (a) The AM ABS prototype 76.2 mm (3 inch) filter; (b) viewed from above; (c)
viewed from below; (f) The comparable 76.2 mm conventional perforated plate filter; (d)
viewed from above; (e) viewed from below; (f) conventionally fabricated version.
The filters were tested in-situ within a bespoke flow rig on site at Croft Filters Ltd
(Warrington, UK). The flow rate was increased incrementally and the pressure differential
across the filter being tested (the pressure drop) was measured using a digital pressure
manometer. The measurements were conducted using water as the active fluid media:
density 1000 kg/m3, temperature range 16-20°C and flow rate range 100-450 l/min. The
results are shown in Figure 4.3.
a b
c
f
e
d

56
Figure 4.3: Graph depicting the change in the pressure drop (Pa) across conventional filter
and the AM filter in response to increases in flow rate (L/min).
The pressure drop across the high flow AM filter is significantly less compared to the
pressure drop across the conventional filter at all comparable flow rates (Figure 4.4). This
reflects a 40% decrease in pressure drop across the AM filter. A mesh was added to the
filters and the pressure drop across the filters with increasing flow rates was compared.
The results are shown in Figure 4.4.
Figure 4.4 : Graph depicting the change in the pressure drop (Pa) across conventional filter
with 522 µm mesh and the AM filter with 522µm mesh in response to increases in flow rate
(l/min)

57
The pressure drop across the high flow filter was decreased with the presence of mesh, but
at flow rates of more than 300 l/min the pressure drop across the AM high flow filter was
10% less compared to the conventional filter. The AM version was then constructed in
metal using a Realizer SLM 250 AM machine in SS316L powder. Both filters overall
dimensions are: 32 mm diameter, height 28 mm with 2 mm apertures. The AM filter and
conventional filter were mounted onto flanges and tested in the flow test rig. The results
are shown in Figure 4.5.
The pressure drop across the AM filter was less than that across the conventional filter with
increasing fluid flow rates. This reflects a decrease in the pumping energy required and
hence a potential decrease in energy used (of at least 15%) and carbon footprint produced.
Figure 4.5: (a) The conventional filter; (b) the AM filter; and (c) the graph depicts the
change in the pressure drop (kPa) across conventional filter and the AM filter in response to
increases in flow rate (l/min).
4.5 Integrated Filter Support and Mesh
As previously described, traditional conventional filters are constructed from perforated
plate: the support portion and woven wire mesh: the filter portion. The support portion of
a conventional filter, when designed for optimised geometry and loading (Spierings et al,
2012; 2013) provides its strength and protects the mesh from damage, and supports the

58
mesh from buckling or collapse under increased fluid flow. Woven wire mesh when
maintained in one plane retains its aperture size. When shaped through an angle, woven
wire mesh distorts and so the aperture size is no longer uniform (Figure 4.6a). AM
technology was used to manufacture a single plane filter with uniform apertures (Figure
4.6b) demonstrating that the AM process can produce a repeating pattern of apertures.
Conventional filters with the support covered with shaped woven wire mesh have variable
pore shapes and sizes compared to unshaped woven wire mesh. In addition, the total open
area of the filter is decreased where the mesh is overlapped and welding applied. This
reduces the total overall percent open area.
Figure 4.6: (a) Conventional filter showing the distortion of apertures in moulded wire mesh;
(b) AM filter (SS316L) demonstrating apertures with retained size and shape; (c) the
repeating node structure (bar indicates one node length) of the AM integrated support and
filter; (d) AM Build plate with the truncated cone filters with different node sizes examined
below.
4.6 Method
4.6.1 Latticework in SLM AM
Latticework is employed in metal powder bed systems such as SLM to create anchor and
build supports for components. In addition, when solid AM components are hollowed out
to conserve part weight (known as light-weighting), build supports in the form of
59
latticework are introduced into the internal space so that the now overhanging surfaces
are built. The anchor and build supports can be manipulated in Magics (Materialise,
Belgium) software to be of different thicknesses, repeat unit size and the size of the
attachment point. In addition, they can have variable aperture sizes. SolidWorks 3D CAD
software also provides tools to construct latticeworks in designs.
This pilot study aimed to examine whether repeating latticeworks by themselves can be
used to generate a filter that has uniform aperture size and shape in increasing sizes whilst
maximising the open area. One of the main challenges here is to determine how small an
aperture could be achieved in the filter and the relationship between CAD dimensions and
the resultant dimensions of the filter strands and apertures.
4.6.2 Structural Internal Geometry of the Integrated Filter Support and Filter
For the latticework, the node is the repeating structure unit that makes up the lattice. The
node comprises of an octahedral arrangement of eight arms, equally spaced around the
centre. The node length extends from the end of one arm, though the centre to the end of
the arm in the same plane (Figure 4.6c). The size of the node is determined as the distance
of the repeating unit (Figure 4.6c), therefore does not directly represent the aperture size
in the filter. The final dimensions of the structures produced by AM will differ to a small
degree from the initial CAD drawing due to the meltpool of metal generated by the laser
which is variable depending on the laser melting parameters employed and the mode of
building e.g. hatched versus non-hatched raster, powder particle size, layer thickness, laser
raster rate and position of the laser relative to the part on the platform.
The lattice structures of the integrated support and filter portion were therefore examined
in a series of truncated cone filters (Figure 4.6d) produced with an increasing node size.
The integrated filter support and filter were manufactured in SS316L using the Realizer SLM
250 AM machine. The node sizes of the individual cones were: 0.5, 1.0, 1.5, 2.0, 2.5 and 3.0
mm. The internal geometry and aperture size was examined using X-ray computed
tomography to understand the shape and size of holes in the AM filter structure and how
they relate to the planned structure, i.e. the size and arrangement of nodes, when
produced by AM. X-Ray CT will also determine if there are any large areas of porosity within
the strands of the latticework structure.

60
4.6.2 X-Ray Computed (CT) Tomography
X-ray computed tomography (CT) is an established non-destructive testing technology for
viewing internal features on parts. CT uses X-rays to produce 3D virtual representations of
objects that can be sectioned to view internal regions not visible to the naked eye. A
schematic of how X-ray CT works is given in Figure 4.7. A Nikon Metrology XT H 225 was
used to examine the truncated cone filters’ lattice made from the uniform repeating nodes.
X-ray CT scans were performed on the series of AM filters with increasing node size to
produce suitable 3D reconstructions from which internal structure and aperture size could
be determined.
Figure 4.7: Schematic of X-Ray CT setup
4.7 Results
4.7.1 X-Ray CT Analysis
The filters were scanned in the X-ray CT. The histograms for samples 0.5mm-1.0mm did
not give a distinct separation between air and sample due to the increased quantity of steel
in these samples (Tan et al, 2011). These samples were cut in half and the scans repeated.
Samples 1.5mm-2.5mm gave greyscale histograms with sufficient segregation between
sample and air to allow a trustworthy 50% isosurface to be created (Figure 4.8).
Twenty equidistant segments of one voxel thickness were taken from each scan starting at
a point 20mm above the base of each sample and over a distance equal to x2 the rating of
the sample, i.e. the 20 segments were taken from the 2.5mm sample starting 20mm above
the base and ending 25mm above the base. The segments were analysed by isolating a
toroid encapsulating each segment and calculating the volume of sample and free volume.

61
The results of this analysis are plotted for the twenty segments in Figure 4.8. Thus the
lattice structure produced possesses holes of different geometry running through in
different orientations.
segment
Figure 4.8: Variation in porosity over 20 segments for the six filter types: Nodes 0.5, 1.0, 1.5,
2.0, 2.5 and 3.0 mm.
There is a characteristic variation in the porosity of each segment which is to be expected
given the geometry of the node. For clarity, the maxima and minima in each sample have
been aligned. The maxima in the porosity in Figure 4.8 occurs at the centre of each node
and at the plane where nodes are joined. The square hole through each sample is best
observed at the mid-point between two maximums in porosity.
From each sample, a series of 100 square, hole-width measurements were recorded (as
shown by arrows in Figure 4.9a). The results were plotted as histograms with an interval
size of 0.02mm. Representative samples of aperture size from the 1.0 mm and 1.5 mm
node are plotted in Figures 4.9b and 4.9c. The size of the holes increases with increasing
node size as expected. However, for the 2.5 mm node and 3.0 mm node, the nodes are not
always completed before meeting the extremities of the filter, thus some of the apertures
are buried well within the structure whereas others are necessarily at the edge.
X-Ray CT analysis determined that the latticework was successfully made from the
repeating units: the nodes in the filters that were analysable (Figure 4.9). The porosity
levels found in each filter had alternating areas of low porosity and high porosity reflecting

62
the presence of the apertures followed by the stands of latticework in sequence. The
aperture (shown by high % porosity) was largest in the 2.5mm node and smallest in the
0.5mm node conical filters. The % porosity decreases with each decrease in node size of
the latticework reflecting the smaller apertures in each successive size of node down to
the 0.5mm node. However, as the representative slice diagram (Figure 4.9a) shows each
slice contains a region of the latticework that is not a complete nodal four arm section. This
results in variation in the levels of detected porosity and density and this is reflected in the
dimensions of the aperture size measured (Figure 4.9b and 4.9c). The dimensional
measurements shown (Figure 4.9b and 4.9c) and those of all other node sizes for the
conical filters demonstrate a wide range in size (number of bin sizes) for each node size as
well as variation in the frequency of each bin size in the filters measured. The method of
measurement reflects the usual method of aperture size measurement for filter mesh i.e.
from side to side and not the diagonal.
Figure 4.9: (a) X ray CT Image showing the integrated filter lattice in grey, with the spaces between
as black. Red arrows depict the measurement for hole width. Histograms of the hole width
measurements made for the : (b) 1.0mm node; and (c) 1.5mm node samples

63
4.7.2 Microscopic analysis of aperture and strand size in latticework
Latticeworks made from repeating nodes of sizes 0.5mm and 1.0 mm were built as cubes
for examination of strand size and latticework shape using light and scanning electron
microscopy (SEM). Optical images were taken of each side i.e. x-, y- and z- planes (Figures
4.10 and 4.11) and the aperture size measured in these scaled photographs (results shown
in Table 4.1).
Figure 4.10: Photomicrograph of cubes made using 0.5mm node (left) and 1.0mm node (right).

64
Figure 4.11: Photomicrographs taken using light microscopy of the 0.5mm node cube
latticework: A) x-plane B) y-plane and C) z-plane and the 1.0mm node D) x-plane E) y-plane
and F) z- plane
Measurements of the aperture size were made for each node size from the scaled
photomicrographs and the average values for each of the x-, y- and z-planes are shown in
Table 4.1.

65
Table 4.1: Measured average aperture areas of the cube node for each plane
Cube node x-plane (10-3 mm2) y-plane (10-3 mm2) z-plane (10-3 mm2)
0.5 8.4 9.3 8.2
1.0 141.4 140.5 132.5
For both the 0.5mm node and 1.0mm node the measurements taken from each pane are
not the same. Rather the z-plane for both is smaller and the variation in all three planes do
not return a consistent measurement for the aperture size.
4.8 Pressure Drop in the Integrated Support and Filter
Four AM integrated support and filters (the 1.5, 2.0, 2.5 and 3.0mm cones) were attached
to flanges and tested in the flow test rig. The pressure drop across each filter was recorded
for step-wise increased flow rates. The results are shown in Figure 4.12. The filters tested
had different pressure drops across each at flow rates above 125 L/min. Decreasing the
node size increased the pressure drop for each flow rate tested as expected. The pressure
drop across the 1.5 mm node and 2.0 mm node filter was significantly greater than that in
the 2.5 and 3.0mm node filters.
A comparable conventional filter, 3.00mm aperture, was constructed from perforated
plate to match the dimensions of the truncated integrated filters. The pressure drop across
this filter, by itself, with 900 µm mesh, 400 µm mesh and 250 µm mesh was tested on the
flow rig at increasing flow rates. The results were compared to those of the 2.5 and3.0 mm
node filters and are shown in Figure 4.13.

66
Figure 4.12: Pressure drop (kPa) across the AM integrated support and filter with increasing
flow rates (L/min). 3.00 mm node, 2.5 mm node, 2.0 mm node and 1.5 mm node.
Figure 4.13: Pressure drop (kPa) across the AM integrated support and filter with increasing
flow rates (L/min). 3.00 mm node AM filter, 2.5 mm node AM filter, conventional filter: 3.00
mm apertures, no mesh, conventional filter with 20 mesh (900µm), conventional filter with
40 mesh (400µm), conventional filter with 60 mesh (250µm)
The conventional filter alone had a similar pressure drop compared to the AM 3.0 mm node
filter, and a less pressure drop compared to the 2.5 mm AM node filter. With the
application of mesh of decreasing aperture size, the pressure drop across the conventional

67
filter increased when compared to the conventional filter alone at all flow rates. When
conventional filter has mesh and is compared to the pressure drop across the AM node
filters, both 400 and 250 µm mesh increases the conventional filter pressure drop to
greater than that seen for the AM filter. The 3.00 mm aperture size in the conventional
filter exceeds that of all AM node filters tested.
4.9 Conclusions
The holes in line AM filter design was achieved through the design freedom of AM, where
the component is constructed layer by layer and this design cannot be achieved through
conventional subtractive manufacturing. The trials of the plastic and the metal AM holes
in line filter designs demonstrated that when compared to comparable conventional filters
the pressure drop across the AM filters was significantly reduced thus demonstrating that
the AM design added value through a decrease in resistance. The reduction in resistance
decreases the amount of pumping energy required and thus delivers potential energy cost
savings to the end user, and decreases the AM filters’ carbon footprint.
The second novel AM filter design was based on repeating nodes assembled together to
form a 3D lattice work using nodes of different sizes in a conical filter shape. The continuity
of the latticework was determined by X-ray CT. X-ray CT analysis visualised a slice through
the conical latticework filters clearly showing that the AM shape formed was that of a
latticework for all node sizes. However, each slice varied in its content as the slice was a
predetermined size and therefore the fraction of the node lattice work varied between
slices of one filter and also between filters. Dimensional analysis of the aperture diameter
by frequency distribution demonstrated that the measurements for some node sizes were
in a greater range of bin sizes thus more variable. Taken together these results show that
for the node latticeworks built from the range of 0.5 – 3.0mm the latticework is variable in
its diameter along its length. Also X-ray CT here does not always capture a single lattice
layer in its entirety which made consistent measurements difficult.
Determination of the latticework strand size and apertures was then investigated using
light microscopy. Photomicrographs were taken by light microscopy of cubes of latticework
built using the 0.5mm and 1.0mm nodes to determine aperture size. The aperture sizes
measured varied between the x-, y- and z- planes. The variation in measurements does not
allow for a consistent measurement of the aperture size. This has arisen from the 3D nature
of the latticework being viewed in 2D in the photomicrograph.

68
The AM latticework conical filters were then tested for pressure drop at increasing flow
rates and compared to conventional filters. The filters tested had different pressure drops
across each at flow rates above 125 L/min. Decreasing the node size increased the pressure
drop for each flow rate tested as expected. The pressure drop across the 1.5 mm node and
2.0 mm node filter was significantly greater than that in the 2.5 and 3.0 mm node filters.
The freedom of design available and the capabilities of the AM technology to build lattice
structures in layers (e.g. Williams et al, 2011; Yadroitsev et al, 2009) allowed the
development of a filter assembly that has integrated support and filter layers in which the
repeating units form the support due to the strength of the metal lattice and the rigidity
prevents distortion of aperture size compared to conventional woven wire mesh.
Here AM technology has delivered novel filtration media that cannot be made by
conventional processes. It has been shown that the latticework is formed as a repeating
structure, however the aperture dimension measurement has not been consistently
obtained by with X-ray CT nor analysis of photomicrographs of the latticework. Another
method should be used to determine aperture size which is detailed in Chapter 5. The
results here have shown that the conical filters with increasing aperture size have
decreasing pressure drop across the filters with increasing node size and so this AM design
has the potential to deliver functional filters but the design needs refinement in two areas.
Firstly, the current node design and secondly, the laser actions associated with the material
files used to build the latticework results in an uneven deposition of metal volume from
the laser melted powder with the resultant meltpool having a greater volume at the centre
point of the node. This results in an uneven strand thickness and in an irregular aperture.
The node will be redesigned to minimise the amount of material deposited in the centre of
each node and the material files (laser settings) changed to deliver a more even strand
thickness. These further experiments and results are shown in Chapter 5.

69
Chapter 5 Designing Advanced Filtration Media
This chapter details the design freedoms that are afforded through using additive
manufacturing to integrate both filtration media and supports into complex geometries
with varying dimensional latticework across the product, for optimised application and
performance in use. The following constitutes the majority of a paper published in the
Journal of Chemical Engineering Technology (Burns et al, 2016) which is provided in its
published form at Appendix B.
5.1 Introduction
5.1.1 General Remarks
Many industrial processes pump fluid, liquid or gas as part of their production cycle and
employ filtration as a critical part of the process to separate solids from fluids, with
oversized particles being retained by the filtration media. The overall shape and size of
metal filters is controlled by the endusers filtration requirements, which determines the
aperture size and considerations such as space available and operational pressures. In
general, for coarse filtration, screens and filters manufactured with wedge wire or a sieve
formed from perforated plate or single layer of woven wire mesh is used to retain the
relatively large particulates. For finer filtration, the aperture size in the filtration media
decreases and can range from millimetres, to micrometres, to the nanometre ranges.
However, finer woven wire mesh alone can become distorted or damaged under
operational flow rates and pressure (Glatt et al, 2009; ASTM International, 2006). Thus,
traditionally, metal filtration media are manufactured from two or more layers. A filter
support is made from perforated plate with larger hole sizes, with a layer of woven wire
mesh with suitable aperture size placed on the outside or the inside to form the filter
portion. An additional layer of woven wire mesh with an intermediate aperture size to the
support and filter mesh layer is placed between the layers to encourage fluid flow towards
the filter support after passing the filter mesh in the assembled filtration component.
Planar filters are constructed from one or more layers of woven wire mesh or perforated
plate, whereas a filter medium that captures and retains contaminants within irregular
passages formed within fibrous or granular media is known as a depth filter (ASTM
International, 2006; Tarleton & Wakeman, 2008).
Filtration level is dependent on the total open area of the filter, as determined by the length
available, desired filter aperture size (Brocklehurst et al, 2015), and method of construction
with overall filter efficiency determined by the operating conditions. When a filter is placed

70
in a conduit, it forms a barrier and thus creates resistance due to the pressure differential
across the filter, with fluid flowing from high to low pressure across the filter. The pressure
drop across a filter is dependent on the flow rate of the fluid and the amount of resistance
that the filter type exerts on the fluid. When moving fluid within a pumping/filtration
system, more energy is required at increasing flow rates to overcome the filter’s inherent
resistance. In 2007, 13% of the UK’s industrial electricity usage was for pumping
requirements, equivalent to 44.8 million MWh/year, equating to 6% of the UK’s carbon
footprint (30 million tonnes/year) (Schofield & Veness, 2007). By optimising the fluid flow,
minimising the turbulence produced and in so doing decreasing the pressure drop across
a filter, the resultant would be a more efficient filtration system. This increase in efficiency
would in turn lead to a decrease in pumping energy required and so reducing the end users’
energy costs and carbon footprint.
5.1.2 Woven Wire Mesh
Woven wire mesh is manufactured from drawn wire and its many forms of construction
can deliver a wide range of aperture sizes and values of open area. Woven wire cloth
manufacturers fabricate their wire cloth and provide the weave specifications according to
ISO 9044 (ISO, 1999). Woven wire mesh is manufactured in both imperial and metric
dimensions (Haver & Boecker, 2015), with the level of filtration determined by the size of
the apertures. The total area of the pores, i.e. the open space in a filter, is the sum of the
individual pore areas, known as the open area, and is usually expressed as a percentage.
5.1.3 Aperture Size
Woven wire mesh cloth is formed by weaving: (i) the warp wires - wires running lengthwise
as woven; and (ii) the weft wires - wires running across the cloth as woven. The shape of
the aperture can be altered by controlling the distance between equal diameter warp and
weft wires. More complex weaves can be formed by altering the number of successive
strands that the warp and weft fibres pass over and under in a staggered manner such as
in a twill weave (ASTM International, 2006; Haver & Boecker, 2015). The aperture size of
plain weave woven wire mesh cloth is measured as the aperture width, with the distance
being between two adjacent warp or weft wires, measured in the projected plane at the
mid positions and the wire diameter is the diameter of the wire (Figure 5.1). The number
of apertures in the woven wire mesh cloth can be expressed per unit length (units can be
expressed in inches or centimetres), although aperture size is commonly expressed in

71
metric format (Haver & Boecker, 2015). However, the open area of the mesh, for a given
number of apertures per unit length is dependent on the wire diameter. For example, a
mesh commonly employed in filtration media, #18 mesh, has 18 apertures per inch. For
#18 mesh with a wire diameter of 340μm, aperture size 1065μm the open area is 57%.
Figure 5.1: Plain woven wire mesh: grey. Aperture size: white arrows. Wire diameter: white
bar. Open area: black.
In contrast, a #18 mesh with aperture size 994μm and wire diameter 417μm has an open
area of 50% and for aperture size 954μm, 475μm wire diameter the open area is 46%. In
general, for mesh cloth with an equal number of apertures per unit length, decreases in
wire diameter increases the aperture size and the open area.
5.1.4 Additive Manufacturing and Filtration Media Design
For the end user, the level of filtration (the aperture size) is one of the prime considerations
in selection of filtration media. As described above, woven mesh cloth can have an increase
in open area through a decrease in wire diameter, which in turn decreases the overall
strength of the mesh cloth. An ideal filter would have the maximum open area possible to
minimise the filters’ resistance when in situ in the conduit. Therefore, for some filter media
the open area must be compromised to deliver the required operational strength. Both the
perforated plate and the woven wire mesh are planar, with an x- and y- plane. The design
freedoms and capabilities of additive manufacturing (AM) technology, which manufactures
components layer by layer, offers the opportunity to create components with complex 3D
geometries. Novel AM filter designs can be created to address reduction in the pressure

72
drop across the filter and the potential for a leaner manufacturing process. Metallic AM
technology therefore has the capability to produce novel filter media that are depth filters
with x-, y- and z- planes with both integrated support and filter portions.
For the AM integrated filter design, the filter mesh has a defined aperture size and by
reducing the equivalent wire diameter, these novel filter media have a greater open area
compared to the equivalent woven wire mesh. This potentially reduces the pressure drop
across the filter and so reduces pumping energy requirements. In preliminary studies, AM
filter media have been designed using a repeating node unit to form the latticework of the
filters. Previous test samples demonstrated that this AM integrated filter support and filter
portion design decreased the pressure drop across the filter compared to conventional
filter design (Burns et al, 2013). The integrated support and AM filter portion has the
potential to provide energy cost savings. However, whilst the uniform node design provides
the AM filter with strength, decreasing the node size greatly reduces the open area (Burns
et al, 2013).
The aim is to develop the integrated support and filter AM design to incorporate different
sizes of repeating nodes, with a larger node providing strength and the smaller node
providing the filtration level (Figure 5.2). Two node structures were developed to deliver
two latticeworks: one with a 1000μm aperture and the other with 500μm aperture. Filter
disks comprising of one, two and three layers of the individual nodes were tested for
strength by collapse pressure. Filter discs and conical filters were designed and tested for
each individual node and for conical filters, a combination of nodes, i.e. layer of 500μm and
1000μm. This combination of node sizes should deliver an increase in open area and
maintain strength The AM integrated filter supports and filter portion conical filters were
tested for strength: collapse pressure and their pressure drop.
5.2 Materials and Methods
5.2.1 AM Build and Component Tensile Strength
All AM filter components described were manufactured on a Realizer 250 SLM AM machine
(Realizer GmbH, Germany) in stainless steel 316L (SS316L; LPW Technology Ltd, UK). The
powder particle size range is 15-45μm, with a monomodal distribution. Outsized particles
are removed from the SS316L powder stock by the internal sieving station in the Realizer
machine before the build commences.
Standard tensile test bars (overall length: 37.4mm) consisted of a circular cross-section
(diameter: 5mm), two plain shoulders (length: 5.1mm; diameter: 7.9mm) with an inter-

73
shoulder distance of 27.2mm were made in SS316L using four different material files
named F1, M2, D1 and T9 (n=5, per group). The values for laser power, exposure time and
the point distance for each group were: F1: 1.6W, 20μs, 40 μm; M2: 1.8W, 40μs, 40μm;
D1: 2.0W, 40μs, 40μm; and T9: 1.3W, 60μs, 20μm. The tensile test bar build plate positions
are described as in standard F2971-13 (ASTM International, 2013) and shown in Table 5.1.
All the test specimens were built vertically (z-axis). The tensile strength of each test bar
was determined on a Zwick/Roell Z020 (Herefordshire, UK), in accordance with the
standards ISO 68921:2009 and F3122-14 (British Standards, 2009; ASTM International,
2014) and the results recorded.
Table 5.1: Position of the tensile test specimens on the SLM build plate
T9 Placement
(x, y, z)
F1 Placement
(x, y, z)
D1 Placement
(x, y, z)
M2 Placement
(x, y, z)
1 -100, 100, 18.7 1 100, 100, 18.7 1 -100, -100, 18.7 1 100, -100, 18.7
2 -20, 100, 18.7 2 20, 100, 18.7 2 -20, -100, 18.7 2 20, -100, 18.7
3 -55, 55, 18.7 3 55, 55, 18.7 3 -55, -55, 18.7 3 55, -55, 18.7
4 -100, 20, 18.7 4 100, 20, 18.7 4 -100, -20, 18.7 4 100, -20, 18.7
5 -20, 20, 18.7 5 20,20, 18.7 5 -20, -20, 18.7 5 20, -20, 18.7
5.2.2 AM Integrated Filter Design
An AM integrated filter design was created using a repeating node unit to form the lattice
work of the AM filter as a single unit (Figures 5.2 and 5.3). A previous test series comprising
of AM filters with different node sizes (Burns et al, 2013) had demonstrated that as the
node size decreased, the pressure drop across the filter increased reflecting the decrease
in open area of the AM depth filters. The SLM process will produce a geometry that slightly
differs to that of the original CAD model due to the nature of fabrication of the AM process
(Mumtaz & Hopkinson, 2010).

74
Figure 5.2: Schematic diagram of the cross-sectional view of an integrated support and filter
AM design with a) one size apertures formed from a single repeating node and b), c) two
sizes of apertures formed from two different sized repeating nodes. Key: F: flange, O:
outside, I: Inside
Here the filter support and the filter portion are integrated together as a single unit
whereas in conventionally manufactured filters, the filter support (perforated plate) and
filter portion (mesh) are welded together to form the filter. In Figure 5.2a, the repeating
nodes form both the filter support and filtration portion. In Figure 5.2b the larger repeating
node (dashed lines on outside (O)) provides support as well as increasing the open area of
the filter and the smaller repeating node on the inside (I) forms the filtration portion. Figure
5.2c, the larger repeating node is on the inside with the smaller repeating node on the
outside. The size of the apertures can be altered to suit the required filtration level.
Figure 5.3: Photographs of AM integrated filter support and filter a) example of 32mm diameter AM
conical filter outer layer AM 500μm and b) inner layer 1000μm-H. Higher resolution photo of repeating
node lattice work of the b) 1000μm-H and c) AM 500μm node of the dual aperture filter. Scale bar:
3000µm.
An analysis of the CAD to AM filter component dimensions from the previous study led to
the redesign of the repeating node unit used here so that the AM component dimensions

75
reflected more accurately the CAD dimensions. Two commonly used sizes of woven wire
mesh were selected: conventional #18 mesh - aperture size 1065μm, wire diameter
340μm, open area 57%; and conventional #32 mesh - aperture size 519μm, wire diameter
274μm, open area 43%. Two AM filter nodes were designed to have aperture size 1000μm
and one node to have 500μm. Two strand sizes were used for the 1000μm aperture size
for strength comparison and two designs increased the open area compared to the
comparable conventional mesh (Table 5.2).
Table 5.2: Comparison of conventional mesh and representative AM design
Aperture
size (µm) Wire diameter
(µm) Open area
(%)
Weave type
Conventional
#18 mesh
1065 340 57 Plain woven wire mesh
AM Design
1000µm
1000 300 59.2 Latticework formed from
repeating nodes
Conventional
#32 mesh
519 274 43 Plain woven wire mesh
AM Design
500µm
500 250 44.4 Latticework formed from
repeating nodes
5.2.3 AM Integrated Filters
Filter discs containing one, two or three layers of each of the newly designed nodes were
built in SS316L (Figure 5.4). The laser parameters used were: laser power: 1.8W, exposure
time: 40μs, and point distance: 40μm. The discs were built vertically (z-axis), X+75° in the
following positions on the build plate. One layer 1000μm-H: 63,-74,19; 76,-74,19; 90,-
74,19, one layer 1000μm-F: -102,-71,19; 87,-71,19; -72,-71,19, and one layer 500μm: -18,-
71,19; -4,-71,29; 10,-71,19. Two layer 1000μm-H: 54,-87,19; 65,-87,19; 97,-32,19, two layer
1000μm-F: 76,-87,19; 88,-87,19; 104,-87,19, and two layer 500μm: 69,-30,19; 78,-30,19;
86,-30,19. Three layer 1000μm-H: 58,-30,19; 85,31,19; 100,31,19, three layer 1000μm-F:
64,91,19; 80,91,19; 97,91,19, and three layer 500μm: 59,31,19; 69,31,19; 85,87,19. The
discs were removed from the build plate using a conventional sawing process. The aperture
size and strand diameter of the lattice work for each of the AM designs, 1000μm-H,

76
1000μm-F and 500μm, were measured for each one-layer filter disc (n=20 for each
dimension). The light microscopy measurements were performed on a calibrated visual
capture system (Vision Z, UK) and the results compared to the CAD dimensions.
Figure 5.4: Photomicrographs of AM 500μm filter discs with 1, 2 or 3 layers of latticework
Conical filters were then built by AM in SS316L using each of the single nodes, 1000μm-H,
1000μm-F and 500μm alone. These latticeworks were then used to create AM conical
filters with two different node sizes combined, an example of which is shown in Figure 5.3.
This incorporates a larger node latticework with a smaller node latticework in a single unit.
The multi-node latticework was then applied to a rounded cone filter shape. The laser
parameters used were: laser power: 1.8W, exposure time: 40μs, and point distance: 40μm
The AM filters were built vertically (Z), in the following x, y and z positions on the build
plate (mm). 1000μm-H: 85,90, 29: 85,35,29; 85,18,29, 1000μm-F: -91,90,29; -91, 40, 29; -
91,-17,29, and 500μm: -6,90,29; -6,37,29; -6,-18,29. 1000 μm–H IN to 500μm OUT: 0,-
32,19; 0,-87,19, 500 μm IN to 1000 μm –H OUT: 0,88,19; 0,28,19, 1000 μm–F IN to AM
500μm OUT: -92,88,19; -92,28,19 and 500 μm IN to 1000 μm–F OUT: -92,-32,19; -92,-87,19.
After the initial removal of powder from the build plate by the internal Realizer vacuum
cleaner, the powder retained inside the conical filters was removed by vibration in a sealed
cabinet (in-house design: Croft Additive Manufacturing Ltd). The AM conical filters were
removed from the build plate using conventional sawing methods.

77
5.2.4 Integrated Filters: Collapse Pressure and Pressure Drop
A bespoke collapse pressure tester was built to test the AM integrated filters. The AM filter
and test membrane was inserted into the tester. The system was filled with hydraulic fluid
and the pressure increased on one side by hydraulic hand pump. Collapse pressure was
read from the pressure gauge following structural failure of the filter unit.
The pressure drop across the AM filters was recorded on a flow test rig (Croft Additive
Manufacturing Ltd, UK). The AM filters were placed in the test chamber and water pumped
through the filter. The flow rate was increased in incremental steps from 70 L/min to 250
L/min and the pressure difference measured on the manometer for each step.
5.3 Results and Discussion
5.3.1 AM Build
SS316L powder used here has a monomodal distribution and a size range of 15-45μm
where the smaller particles fill the interstitial volume between the larger particle sizes
to promote layer filling and densification (Murr et al, 2012). Sintered AM techniques
can use different metal powder size and range to deliver different densities and
porosities in the final component (Verlee et al, 2010). In SLM, the laser beam rapidly
heats the powder, the powder melts and shrinkage occurs, from 60% apparent powder
density to ~100% density (Kruth et al, 2010). The heat transfer and fluid flow affect the
size and shape of the weld pool, which in turn can affect the grain growth and
microstructure of the AM component (Kruth et al, 2010; Gu et al, 2012). Alterations in
the microstructure of AM parts can affect the yield strength, tensile strength and
elongation, thus the mechanical properties obtained with SLM may differ from
conventionally produced bulk materials (Kruth et al, 2010; Gu & Zhang, 2013).
Therefore, the tensile strength of test bars that were manufactured using different
material files were tested to determine the laser settings that resulted in tensile
strengths similar to that of conventionally produced SS in these AM discs and filters.
5.3.2 Component Tensile Strength
Twenty tensile testing specimens were produced using four different material definition
files. These material definition files differed in the values for: laser power, exposure time
and the point distance. The net effect of altering the power and duration of the laser is to

78
alter the amount of the SS316L powder that is melted to form the weld pool at that
particular laser exposed area. Varying the point distance, that is, the distance between
adjacent weld pools, alters the area of overlap between melt pools. The effect of these
combined parameters is the total amount of welded SS316L deposited in each layer of the
build which may affect the overall strength of the resultant component.
Four material files, named T9, D1, M2 and F1 whose laser settings are described in Section
5.2.1 were used to build tensile test specimens with five samples per material file. Three
material file specimens resulted in average ultimate tensile strengths of 599 MPa for T9,
604 MPa for M2 and 609 MPa for D1 and one material file, F1, average tensile strength was
250 MPa. Average yield strengths for each material file used were M2: 529 MPa, T9:
528MPa, D1: 531 MPa and F1: 219 MPa. This much reduced ultimate tensile strength and
yield strength was due to the short exposure time and reduced laser power in the material
file which resulted in a more porous component.
One material file that produced test samples with tensile strength of SS316L was then used
to build all the AM filter components for subsequent testing. Here the tensile strength tests
demonstrated that manipulation of AM build parameters can directly affect the
mechanical properties of test specimens and thus some combinations of parameters can
result in tensile strengths similar to that seen in machined stainless steel whereas other
build parameter combinations can result in properties that are less than the comparative
conventionally manufactured specimens. These results demonstrate the build parameter
range that must be used to generate filter media that are of sufficient structural integrity.
5.3.3 AM Integrated Filter Design
For each repeating node design AM filter discs were built in one, two or three layers.
Measurements of the aperture size and strand diameter were made for each node and for
each of the layer designs. Using light microscopy, as the number of layers increased above
a single layer, there was an increase in the variation of the measure aperture diameter and
strand size. This was due to the increasing depth of the filter where underlying areas
overlap with the upper structures being measured. Therefore, measurements were made
only for one layer discs of each of the nodes.
For the one layer AM 1000 μm-H filter disc, the mean aperture size was 984 ± 26μm and
the mean strand diameter was 422 ± 33μm (n=20). The one layer AM 1000μm-F filter disc
had a mean aperture size of 1092 ± 62μm and mean strand diameter was 289 ± 25μm
(n=20). The AM 500μm one-layer filter disc had a mean aperture of 505 ± 28μm and strand

79
diameter of 265 ± 29μm (n=20). The nodes used for the AM filter disc was designed to have
aperture sizes of 500μm and 1000μm as found in #32 and #18 mesh respectively (Table
5.2), but with a decrease in ‘wire’ diameter to increase the ratio of open area.
For the 1000μm-H filter disc the CAD design was for a 1000μm aperture and 400μm strand
size, and the AM filter 1000μm-H disc produced closely reflects these values. The AM
1000μm-F filter disc was designed to have an aperture of 1000μm and strand size of 300μm
and was produced at aperture 1092μm and strand diameter 289μm. The 500μm AM filter
had an aperture size of 505μm and strand diameter of 265μm close to the 500μm and
250μm desired values respectively (Table 5.3). CAD dimensions and the new node design
have delivered AM repeating node latticeworks with consistent dimensions for aperture
size and strand size.
Table 5.3: Comparison of target and actual measured strand and aperture dimensions
Target Aperture
size (µm) Target
Strand size (µm)
Measured
Aperture size (µm)
Measured Strand
diameter (µm)
1000µm-H 1 Layer 1000 400 984.2 ± 26.3 422.5 ± 33.4
1000µm-F 1 Layer 1000 300 1092.0 ± 61.5 289.2 ± 24.7
AM 500µm 1 Layer 500 250 505.0 ± 27.6 265.1 ± 28.8
Conventional woven wire mesh aperture size can vary within a mesh size, quoted as holes
per inch, due to the variation in diameter of weft and warf strands in the weave (ISO, 1999;
Haver & Boecker, 2015). The construction of woven pores has been shown to influence the
fluid flow pattern, with plain weave having a higher flow resistance compared to satin
weave (Lu et al, 1996). The arrangement of the warp and weft fibres form the pore
geometry has been shown to affect the overall porosity of the woven wire mesh (Fischer
& Gerstmann, 2013). The effect of woven wire mesh pore geometry on filter resistance has
been compared in different weaves using mathematical models and practical experiments
(Lu et al, 1996; Fischer & Gerstmann, 2013). Simplification of the overall pore geometry
was intended, by arranging the pore forming strands in linear planes thereby establishing
regular pore diameters in the 3D latticework.

80
5.3.4 AM Integrated Filters: Collapse Pressure
In Figure 5.3, the AM filter design has been built, as shown, to highlight the arrangement
of two latticeworks formed using: 1 - a large node; and 2 - a smaller node. The two
latticeworks are attached to each other to form a single unit. Ideally, the fluid flow through
these depth filters would be in through the large node latticework and out through the
smaller node latticework. For some fluid processes, the flow can be reversed with the flow
entering through the filter portion and exiting through the support portion, known as ‘OUT
to IN’ filters. The AM conical filters can therefore be constructed using a single node alone
(1000μm –H, 1000μm –F and AM 500μm: Figure 5.2a). The 1000μm –H can be combined
with AM 500μm in two orientations ‘1000μm –H IN to AM 500μm OUT’ (Figure 5.2c) and
‘AM 500μm IN to 1000μm –H OUT’ (Figure 5.2b). The 1000μm –F can also be constructed
in this manner to form ‘1000μm –F IN to AM 500μm OUT’ and ‘AM 500μm IN to 1000μm –
F OUT’. All of these AM filter types were tested for their collapse pressure and the pressure
drop in response to increasing flow rates.
Figure 5.5: The collapse pressure (bar) of one, two and three layers of AM filter discs
comprising of 1000µm-H (blue), 500m (red) and 1000µm-F (green) was compared to #18
woven wire mesh disc.
The collapse pressure of one, two, and three layers of AM filter discs composed of AM
500μm, 1000μm –F, and for 1000μm –H and #18 woven wire mesh disc was determined
and the results shown in Figure 5.5. The pressure gauge used records the pressure in bar.
Conventional #18 mesh comparable filter disc collapsed at 31.6 ± 3.3 bar. For all groups,
n=5. For each AM filter disc node type, the collapse pressure for two layers and three layers
was significantly greater than that of a single layer AM disc (t-test, p<0.05), with the
collapse pressure for three layers being significantly greater than that for two layers (t-test,
p<0.05). The 500μm layer discs are stronger than the 1000μm-F discs but weaker than the

81
1000μm-H AM discs. Conventional #18 mesh is significantly stronger than all 500μm and
1000μm-F discs but significantly less than the two and three layer 1000μm-H AM discs. As
expected, the thinner strands of the 1000μm-F design reduced its strength compared to
the 1000μm-H design. Increasing the number of layers increases the overall strength of the
filter discs.
For AM conical filters, the respective collapse pressures are AM 1000μm-F: 10 bar; AM
1000μm-H 24 bar, AM 500μm: 22 bar; 1000μm-F IN to AM 500μm OUT AM filter: 17 bar;
and OUT AM 500μm to IN 1000μm-F AM filter: 20 bar, and 1000μm-H IN to AM 500μm
OUT AM filter: 32 bar; and OUT 1000μm-H to IN AM 500μm AM filter: 29 bar. AM 1000μm-
F collapses at the lowest pressure, and so has the lowest overall strength reflecting the
large open area in this filter design. AM 500μm filter collapsed at the highest pressure, and
so had the greatest strength, reflecting the increased density in the design compared to
AM 1000μm. The collapse pressure of the ‘OUT to IN’ and the ‘IN to OUT’ AM filters were
in between those of the filters with a single node repeated in the latticework.
Varying the aperture size and strand size in AM integrated filters can affect the overall
strength of the filter media. By combining, latticeworks containing two node sizes in
adjoining layers, it is possible to increase the strength of the integrated filter support and
filter portion AM filters. Manipulation of strand size and aperture size using AM allows the
creation of a filtration media whose strength can be modulated to suit the required
operational pressures.
5.3.5 AM Integrated Filters: Pressure Drop
The pressure drop for each of the three single node AM conical filter types was recorded
in response to stepwise increases in flow rate on an in-house flow test rig. The pressure
difference across the filters was recorded for both forward and reverse flow. For the AM
filters constructed from single nodes alone, there was no significant difference between
the values for the forward flow and reverse flow for the AM 500μm, 1000μm-H, whereas
for the 1000μm-F the forward flow pressure drop was significantly less for all flow rates
measured (RM ANOVA<p<0.05). The results are shown in Figure 5.6.

82
Figure 5.6: Graph of the recorded pressure drop across each of: 1) AM 500µm; 2) AM
1000µm-H; 3) AM 1000µm-F; 4) 1000µm mesh conventional conical filters for both forward
flow (FF) ad reverse flow (RF) in response to stepwise increases in flow rate (L/min).
The pressure drop across the AM 1000μm-F filter was less than that across all other single
node filter types tested for all flow rates. The AM 500μm filter had the highest pressure
drop for all flow rates compared to the other single node AM filters. A conventional filter
support was attached to #18 mesh, 1000μm apertures and for the forward and reverse
flow the pressure drop across the filter was not significantly different for either flow
direction nor significantly different from the AM 500μm filter. The 1000μm-F and 1000μm-
H AM conical filters had significantly lower pressure drop for all flow rates compared to the
AM 500μm filter and meshed conventional filter (ANOVA<p<0.05). Increasing the open
area to have approximately 1000μm apertures in the depth integrated filter support and
filter portion delivers significant reductions in the resistance of the filter compared to the
conventional filter with 1000μm mesh.
The pressure drop was measured for increasing flow rates for the AM integrated filters
consisting of two nodes arranged in both ‘OUT to IN’ and ‘IN to OUT’ orientations (Figure
5.7). For the ‘IN to OUT’ and ‘OUT to IN’ filters, the pressure drop across the filters was an
intermediate value to the AM filter cones with only one node type present, although these
values were closer to those of the 500μm filter for all flow rates (see Figure 5.6). This

83
reflects the inclusion of both the node types in a single conical filter unit, that results in the
filter having both 1000 and 500μm apertures.
Figure 5.7: Graph of the recorded pressure drop across each of: 1) 1000µm-H IN AM 500µm
OUT; 2) 1000µm-F IN AM 500µm OUT; 3) 1000µm-H OUT AM 500µm IN; 4) 1000µm-F OUT
AM 500µm IN conical filters in response to stepwise increases in flow rate (L/min)
5.4 Conclusions
The tensile strength tests demonstrated that the AM build parameters used can directly
affect the tensile strength. As the build parameters for all the filter test parts were the
same, variation in strength of the parts was due to the mechanical structure of each
individual component, perhaps relating to surface roughness or other irregularities.
AM technology has been successfully used to create novel filtration media that has
controlled aperture sizes. The repetition of a single node has successfully delivered AM
filter discs and AM filter cones with a regular repeating structure of aperture size and
strand diameter.
The overall strength of the AM conical filters incorporating this combined filter support and
filter portion is affected by the density of the design that reflects the open area. The
pressure drop produced at increasing flow rates is dependent on the open area with the

84
single node larger sized aperture AM filter having the lowest pressure drop and the smaller
sized aperture AM filter having the highest pressure drop.
For the AM integrated filter support and filter portion filters that have both sizes of
apertures arranged in either ‘IN to OUT’ or ‘OUT to IN’ the pressure drop across
these filter types is less than that seen with 500μm apertures alone. This suggests
that the combination of repeating nodes, of different sizes, in a latticework can
deliver a filter that has a reduced pressure drop compared to one with a single node
size. The effectiveness of these filters during operation with a fluid containing
particulates has not yet been tested here. This practical functional test would
deliver information of the effectiveness of the filters in a working in environment,
however these test lie outside of the scope of the current investigation. This filter
type has the potential to reduce the pumping energy requirements of the end user
whilst delivering the required filtration level. Further development and
optimisation of these AM integrated filter support and filter portion filters may lead
to further energy savings.

85
Chapter 6 Surface Finishing in Metal AM parts
Components manufactured using AM technologies are produced with a rough surface and
a significant amount of support material still attached. The support structures can often be
easily removed with simple tooling methods, but it can be difficult to get a smooth, uniform
surface finish – particularly on internal surfaces.
Surface roughness is not consistent across an AM part. The orientation of a surface relative
to the build plate affects its roughness; also, internal surfaces can have a harsher surface
than external surfaces. A major problem is that internal surfaces are often harder to reach;
making it difficult to alter their surface properties. Across the industry there is no
consensus on the method of finishing which yields the best result; often, companies will
use multiple steps in their finishing method.
Through experimentation, it is possible to find an optimal orientation to build parts in;
some build orientations improve certain features of a design. By optimising the orientation,
it is possible to save time on the finishing process and achieve a better overall product.
Research into mass finishing has offered a simpler way to finish parts which works on all
surfaces but does not necessarily improve the consistency across the part.
6.1 Additive Manufacture
Components produced by additive manufacturing generally have a much higher surface
roughness than many currently used subtractive manufacturing processes such as
machining which inherently result in consistent and relatively low roughness surfaces
(Rombouts et al, 2013). There is a greater variety in surface roughness in complex
geometrical AM metal components which can be affected by build orientation. The car
model shown in Figure 6.1 has been built in two orientations (A and B) and from the
photographs, the build layers are most obvious in Figure 6.1A. Measurement of this car’s
roof and bonnet returns a visibly rougher surface compared to the roof and bonnet of the
car in Figure 6.1B. This example demonstrates the variable surface roughness produced on
a single complex part that arises from the build orientation.

86
Figure 6.1: Photographs of car model built in two orientations. Build layers are most evident
on the surface of the roof in A compared to B. The roof and bonnet of the car in A has a
greater surface roughness than the car in B.
This makes unfinished additively manufactured components unsuitable for hygienic or low
friction related functions without further processing. For this reason, research into surface
finish improvement is important in order to develop a practical and economic post-
processing finishing process for industrial AM components. In terms of expense, manual
abrasive finishing is a significant process in industry due to the high cost associated with
the necessary use of skilled workers and the time required (Dadbakhsh et al, 2010). Mass
finishing is much more desirable as it can be used on a large number of components at
once meaning less post processing time per component as well as being almost completely
automated significantly reducing the labour cost associated with finishing. Mass finishing
is a post processing technique most commonly used as a deburring process but also as a
cleaning, edge radiusing and a polishing process. Three types of mass finishing include
rotary barrel finishing, vibratory finishing and centrifugal finishing (Domblesky et al, 2004).
The polishing and deburring characteristics of rotary barrel and vibratory finishing are the
main focus of this investigation.
Vibratory finishing involves bulk processing of components within a recirculating abrasive
media. The vibration of the bowl causes the media and part to move in a helical toroidal
shape. The abrasive action is a result of the differences in mass and relative movement
between parts and contacting media. This relative motion of parts and media creates a
sliding effect between the media and the component that results in the removal of a small
amount of material from the component. Vibratory finishing is a relatively non-aggressive
finishing process due to the components being surrounded evenly by the media and only

87
very small amounts of material being removed at a time. Process variables include media
size, degree of lubrication, speed and duration of finishing. Vibratory finishing and barrel
tumbling which are both mass finishing processes that should be able to improve the
surface finish of a large number of components at the same time, making it more practical
and less labour intensive than manual finishing.
Causes of the high roughness include the “staircase effect” and powder particles not fully
melting into the part and sticking to the exterior (Rombouts et al, 2013). The high surface
roughness can be affected by various things such as the process type (e.g. SLM, EBM, LMD
etc.), the layer thickness, beam parameters and powder quality, amongst others. Here we
investigate the effect of mass finishing processes on the surface roughness of stainless
steel 316L AM components to determine the effect of facet orientation on the
effectiveness of the post-processing finishing process. In this work, it was possible to
examine the effect of sandblasting, vibratory bowl and barrel tumbling using sand, ceramic
and plastic media to decrease the surface roughness.
6.2 Methods
6.2.1 Metal AM components
All components were manufactured using SLM on a Realizer 250 machine. The metallic
powder used was stainless steel 316L (SS316L: LPW Technology) and built in 50µm layers.
The test parts were designed in SolidWorks and build supports and slicing was performed
in Magics (Materialise, Belgium) before being uploaded to the Realizer machine. Once the
parts were completed, they were removed from the build plate by customised pneumatic
saw (in-house design) and the build supports removed and the build support surface
finished to remove the excess build supports.
6.2.2 Test Components
Whilst complex AM components have many facets, at different angles to the x-, y- build
plate plane and so have many potential surfaces, all of which may have a different initial
surface roughness we limited the potential variation in surface roughness by designing
simple test pieces with simple geometries. These test components will also determine the
effect of vibratory finishing on the sharp edges and corners of the component. Test series
1 comprises of two hollow shapes: a hollow box section, 30mm wide, 30mm deep, height

88
30mm and internal width 26mm and a hollow cylinder: external diameter 30mm, internal
diameter, 26mm and height 30mm (Figure 6.2).
Figure 6.2: Test series 1 for vibratory bowl finishing: tube on left, box section on right,
manufactured in SS316L.
Test series 2: comprises of 2 solid shapes: cylinder 10mm diameter, height 10mm, cube
10mm x 10mm x10mm and 2 hollow shapes: cylinder 20mm diameter, 10mm height,
internal diameter 16mm and a cylinder with internal flange, as previous with 2mm internal
flange inner diameter 12 mm (Figure 6.3). These smaller test pieces were only used in the
tumbling barrels.
Figure 6.3: Test series 2 for tumbling barrel finishing: (a) cylinder, (b) cube, (c) internally
flanged tube, and (d) tube, manufactured in SS316L. These also give a variety of facets
including flat, curved, internal, and external.
6.3 Finishing
Sandblasting was performed in a Guyson cabinet using Aluminium Oxide grit. A Rósler R125
vibratory bowl was filled with approximately 100kg ceramic media (9mm angle cut,
Sharmic Engineering Ltd) with 2 litres of water, Speed 1500 rpm. Only Test Series 1 parts
were finished using this process as it is less suited to finishing very small components due
to the difficulty in removing them from the media after finishing. A Balco barrel tumbling
system was filled with either ceramic (6mm diameter, 12mm length angle cut, Sharmic
Engineering Ltd) media in conjunction with the cutting agent and water (SX11-NS: Sharmic

89
Engineering Ltd) or plastic cones (12mm: Sharmic Engineering Ltd) with water. The barrel
is rotated and in doing so causes the components and media to tumble inside the barrel.
This method is more aggressive than vibratory finishing due to the component
experiencing regular unbalanced impacts making it a quicker finishing process but less
suitable for delicate components or components where sharp edges and corners are
critical. The barrels are also more limited in size which reduces to number and size of
components that can be finished. A variety of tumbling tests were performed using ceramic
media and plastic media.
6.4 Surface Roughness
The surface roughness was measured using a Mitutoyo Surftest SJ-210. For these tests, the
parameter of Ra (µm) was measured as this is a very commonly used parameter in industry.
The bottom faces when removed from the build plate had a considerably higher roughness
than any other face due to build supports so these faces were linished prior to surface
finishing. The surface roughness was measured on the finished, side, internal and top
surface for each part. Five measurements per side were taken and the average surface
roughness value calculated for each test point in each experiment.
6.5 Test components
Test series 1: The cylindrical tube (Figure 6.2, left) has an outer diameter of 30mm, an inner
diameter of 26mm and a height of 30mm. The box section (Figure 6.2, right) had an outer
width of 30mm, an inner width of 26mm and a height of 30mm. These shapes were
designed to reduce the variables as much as possible to test curved internal and external
surfaces and flat internal and external surfaces.
Test Series 1: Two build parameters were used to manufacture the test parts. BP 1: (Power
92W, point distance 30 µm, Exposure time 40µs) and BP2 (Laser power 167W, point
distance 40 µm, Exposure time 40µs). A pair of box section and hollow tube were either
sandblasted or not, then exposed to increasing time in the vibratory bowl, with ceramic
media. Surface roughness measurements were taken at hourly intervals to determine the
decrease in surface roughness.
Test Series 2: Multiple copies of each shape were manufactured using build parameter set
BP2. A set comprising of cylinder, cube, hollow tube and flanged tube (Figure 6.3) were

90
then sandblasted and exposed to increasing time in wither ceramic or plastic media in the
tumbler. The parts were removed at regular intervals and the surface measurement on the
bottom, top, side and internal surfaces measured. Five measurements were taken for each
surface at each time points and the average value calculated.
The tests are to be run for as long as it takes to find the minimum surface roughness
achievable from a particular finishing process. A surface will be considered to be at its
minimum for a particular process after it no longer improves after each finishing run, or
when the improvement becomes so small that the particular process is no longer practical.
6.6 Results
The surface roughness of each test piece surface was measured after finishing the bottom
surface before any further post processing was performed to obtain an average surface
roughness (Ra) value for unfinished additively manufactured components. For the box
section and tube, BP1, the surface roughness measurements for the unfinished side surface
roughness is in the range of 7µm to 12µm, reflecting the striations seen that result from
the layer construction (Figure 6.4). This shows that there is a fairly large amount of
variation in surface roughness on the sides of a single component even though the same
features were measured on each part and each part was produced in the same orientation
and with the same build parameters. These differences seemed to occur on faces opposite
to each other which may suggest that this could be a result of the wiping mechanism for
the particular machine where the side of the component facing the wiper may receive a
slightly higher amount of powder than the reverse side which faces the wiper on the return
stroke.
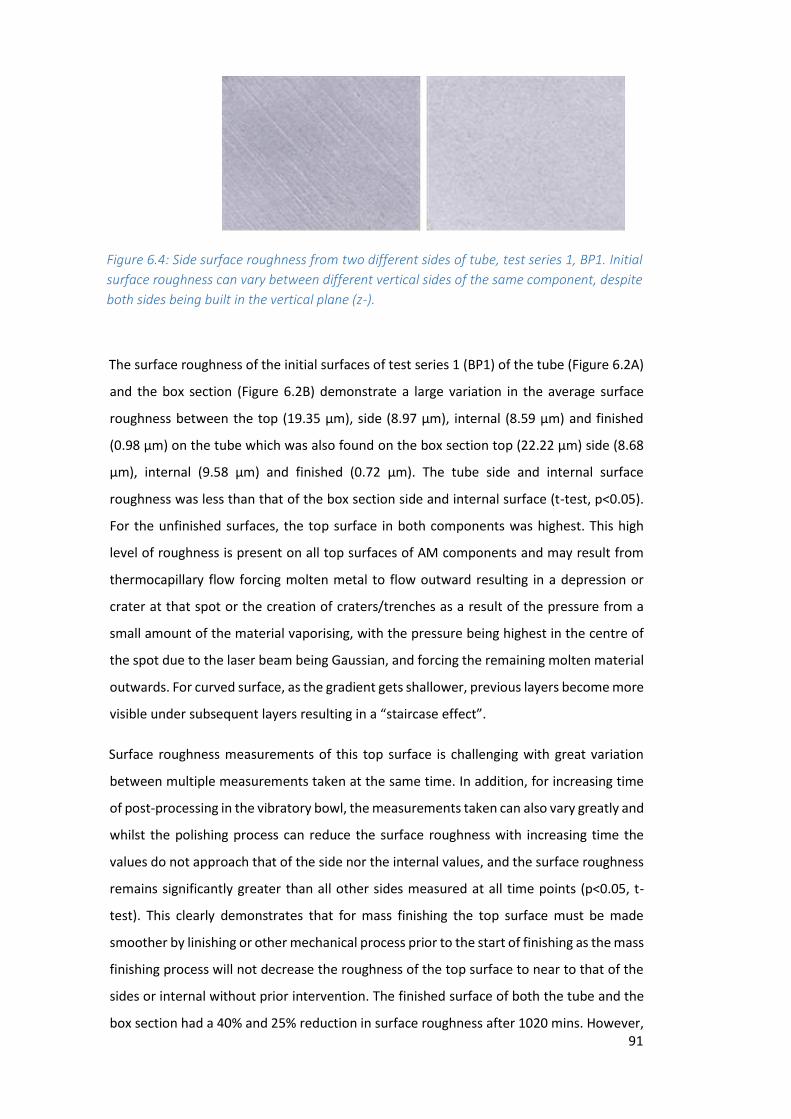
91
Figure 6.4: Side surface roughness from two different sides of tube, test series 1, BP1. Initial
surface roughness can vary between different vertical sides of the same component, despite
both sides being built in the vertical plane (z-).
The surface roughness of the initial surfaces of test series 1 (BP1) of the tube (Figure 6.2A)
and the box section (Figure 6.2B) demonstrate a large variation in the average surface
roughness between the top (19.35 µm), side (8.97 µm), internal (8.59 µm) and finished
(0.98 µm) on the tube which was also found on the box section top (22.22 µm) side (8.68
µm), internal (9.58 µm) and finished (0.72 µm). The tube side and internal surface
roughness was less than that of the box section side and internal surface (t-test, p<0.05).
For the unfinished surfaces, the top surface in both components was highest. This high
level of roughness is present on all top surfaces of AM components and may result from
thermocapillary flow forcing molten metal to flow outward resulting in a depression or
crater at that spot or the creation of craters/trenches as a result of the pressure from a
small amount of the material vaporising, with the pressure being highest in the centre of
the spot due to the laser beam being Gaussian, and forcing the remaining molten material
outwards. For curved surface, as the gradient gets shallower, previous layers become more
visible under subsequent layers resulting in a “staircase effect”.
Surface roughness measurements of this top surface is challenging with great variation
between multiple measurements taken at the same time. In addition, for increasing time
of post-processing in the vibratory bowl, the measurements taken can also vary greatly and
whilst the polishing process can reduce the surface roughness with increasing time the
values do not approach that of the side nor the internal values, and the surface roughness
remains significantly greater than all other sides measured at all time points (p<0.05, t-
test). This clearly demonstrates that for mass finishing the top surface must be made
smoother by linishing or other mechanical process prior to the start of finishing as the mass
finishing process will not decrease the roughness of the top surface to near to that of the
sides or internal without prior intervention. The finished surface of both the tube and the
box section had a 40% and 25% reduction in surface roughness after 1020 mins. However,

92
there was no significant decrease in surface roughness after 8 hours for the tube and 11
hours for the box section. The surface roughness achieved is significantly lower than any
other surface for both the tube and the box section, but this occurs due to the finishing not
the surface finishing techniques employed.
Figure 6.5: The average surface roughness (Ra: µm) of the Top (black square), side (open
circle), internal surface (black triangle) and Finished (Cross) of test series 1 Tube (A) and Box
section (B) prior to post- processing (unfinished) and after each 60 min treatment period in
ceramic media in the vibratory bowl. The average surface roughness (Ra: µm) of the Top
(black square), Side (open circle), Internal surface (black triangle) and Finished (Cross) of test
series 1 Tube (C) and Box section (D) prior to post-processing.
C
D

93
As shown in Figure 6.5, the initial surface roughness of all sides of both the tube and the
box section is a wide range so we investigated the effect of sand blasting the AM
components prior to further post-processing to reduce the initial surface roughness as to
determine if subsequent postprocessing achieved greater reduction in surface roughness
in less time. Ra of Test series 1 parts were measured prior to sandblasting, after
sandblasting, and at each interval after 1 hour of ceramic treatment in the vibratory bowl
for a total of 21 hours (1260 min) and the results shown in Figure
6.6.
Sandblasting significantly reduced the Ra of the top, side and internal surfaces of the tube
and the box section compared to their respective initial surface roughness values (Figure
6.6, p<0.05, t-test). Sandblasting significantly increased the Ra of the finished surface of
both the tube and the box section compared to their respective initial values (Figure 6.5,
p<0.05, t-test). All surfaces, excluding the linished surface, on both the tube and the box
section had a decreased surface roughness following sandblasting (Figure 6.5) compared
to the tube and box section shown in Figure 6.2, with no sandblasting. Sandblasting
significantly reduced the initial surface roughness of the tube sides and tube internal
surfaces by 33% and 46% respectively (Figure 6.5A, p<0.05, t-test) and the Ra of the box
section side and internal surface by 27% and 21% respectively (Figure 6.5D, p<0.05, t-test).
After 1020 min of vibratory bowl polishing the tube and box sections that were sandblasted
prior to exposure to ceramic polishing were significantly smoother (Figures 6.5C and 6.5D)
compared to the tube and box section that were not sandblasted (Figures 6.5A and 6.5B).
Sandblasting prior to vibratory bowl finishing significantly decreases the surface roughness
of the sides, internal and top of AM components and therefore will be employed before all
other finishing.
The results (Figure 6.6) show that the rate of roughness reduction changes at similar rates
between different components resulting in the part with the higher initial roughness
having a higher final roughness after the same amount of finishing. The curves produced
also indicate that the finishing rate changes as roughness reduces, with both charts
indicating that by approximately 16 hours, the rate of roughness reduction significantly
slows.

94
Figure 6.6 : (A) The average surface roughness (Ra: µm) of the side of the box section and
side of the tube of test series 1 parts, ceramic finished in vibrator bowl at 8 hour intervals.
(B) Average surface roughness values (n=5 per treatment) from test series 1 Tube side
(squares) and Box section side (circles) from components built using built parameters set 1
(BP1: black line solid fill) and using build parameters set 2 (BP2: dashed line, no fill).
Test series 1 parts, tube and box section that were built using BP2 were sandblasted before
surface finishing in the vibratory bowl with ceramic media. As the previous improvement
in surface finish was small after 8 hours, the parts here were measured for Ra following 8
hours (480 min) and 16 hours (960 mins) and the results of the average Ra are shown in
Figure 6.7.
The surface roughness (Ra, µm) of the untreated box section side, BP1 was significantly
rougher than the side box section for BP2 (p<0.05, t-test), and this difference was still
apparent after sandblasting. Whereas the untreated tube side, BP1 was significantly less
rough than the tube side BP2 (p<0.05, ttest), and this difference was still apparent after
sandblasting. These results suggest that build parameters do affect the surface roughness
produced on the AM component and the same build parameters may increase the surface
roughness of an external surface and decrease the surface roughness of internal surfaces
(BP1) compared to another set of build plate parameters (BP2) in unfinished and post-
sandblasting treatments. Ceramic post processing decreased the side surface roughness
for all test pieces (Figure 6.7).
A B

95
Figure 6.7: Mean Surface roughness measurements (Ra: µm) of the side of Test Series 2 parts,
flanged tube, tube, cylinder and cube before and after sandblasting, and following barrel
finishing with either ceramic (A) or plastic (B) media.
The surface roughness of Test series 2 components, flanged tube, tube, cylinder and cube
were measured before and after sandblasting. Test pieces were then placed in barrel
tumblers with either ceramic or plastic media and processed for 8, 12, 16, 24, and 32 hours
and the surface roughness measured at each time point (n=5 per group). Average mean
values are shown in Figure 6.7 and Table 6.1. Sandblasting reduced the surface roughness
of both the side and internal surfaces where present.

96
Surface roughness was significantly decreased on the sides of all test series 2 parts, flanged
tube, tube, cylinder and cube by both ceramic (Fig 9A, p<0.05, t-test) and plastic (Fig 7,
p<0.05, t-test) media. Ceramic media decreased the surface roughness of the sides of all
parts after 16 hours compared to the plastic media. The surface roughness of the curved
side on the tube was decreased the least by the ceramic and plastic media. For the surface
roughness of internal surfaces of the flange tube and tube see Table 6.1. The flanged tube
internal surface roughness was more difficult to measure than the tube. The surface
roughness of the flanged tube and tube was decreased less than the side surface roughness
at the same time points. This reflects the lesser exposure of the internal surfaces to the
polishing media due to decreased access to the internal surface compared to the external
surface because of the size and shape of the polishing media.
Table 6.1: Average surface roughness (Ra: µm) of internal surfaces of test series 2 parts, flanged tube and tube before and after sandblasting and following 8, 12, 24, and 32 hours of tumble finishing in either ceramic or plastic media.
Internal Surface
CERAMIC unfinished sandblasted 8h 16h 24h 32h
Flanged Tube 10.93 6.829 5.915 5.244 4.782 6.015
Tube 10.6 10.2 7.853 6.438 5.839 6.901
PLASTIC
Flanged Tube 10.93 6.829 7.785 7.106 6.221 5.885 Tube 10.6 10.2 7.427 7.228 6.438 5.334
6.7 Conclusions
AM components have a variable surface roughness across differently orientated facets. As
shown above, even when simple geometric shapes are built using the same build
parameters, in a vertical orientation the external surface roughness of a flat plane or a
curved plane can vary. In addition, the internal and the external surfaces of the same wall,
flat or curved can have significant differences in surface roughness. In comparison to
subtractive manufactured parts the levels of surface roughness exceed those of finished
surfaces. The surface roughness of AM components can be improved significantly by

97
manual abrasive finishing but this is time consuming and labour intensive. This project has
shown that mass finishing is an alternative to manual finishing and can result in a significant
reduction in surface roughness compared to unfinished additively manufactured
components costing less time per component and requiring minimal labour. However, the
initial variability in surface roughness of different facets of the same AM component
remains following mass finishing processes. This study suggests that a new approach to
surfacing finishing of AM components, compared to finishing of subtractive manufactured
components is required for finishing to industry required specifications. For metal AM parts
that have accessible surfaces that require low Ra, additional material can be added prior
to the build to allow for finishing. Other surfaces can be finished to a better standard by
mass finishing processes. The major challenge remains for surface finishing of internal
inaccessible surfaces where mass finishing media may not reach due to distance or may
not be available in a small enough size to penetrate all internal surfaces. Other finishing
techniques such as abrasive flow may be a potential method for finishing of these surfaces.

98
Chapter 7 Conclusion The results presented in this thesis focus on two main areas of research, firstly in the
manipulation of AM technology and secondly in the design and delivery of novel filtration
media.
Optimisation and maintenance of material used in AM is a key parameter in delivering AM
components. In order for the powder to be moved from the powder reservoir to the
powder bed the powder must have a certain degree of flowability. Powder that has
become damp or heavily used powder where there are many large but few small particles
as well as highly non-spherical particles will not flow into the powder bed and packing
density will decrease. An issue here with the Realizer powder delivery system was shown
by the appearance of black lines across the powder bed. Analysis of particle sizes of powder
samples taken from different physical locations in the powder bed clearly showed that
powder particle sizes were unevenly distributed over the powder bed. The mechanical
delivery system was determined to be cause of the uneven distribution. Additional steps
were then included in the powder spreading system to eliminate this issue. The particle
size analysis of differences between new powder and that of re-used powder used as the
powder bed build material demonstrated that with re-use of powder, some of the smaller
powder particles were used up. However, the relative ratio and distribution of the powder
particle sizes is maintained. This showed that powder can be re-used, and if maintained in
a controlled manner, can retain the powder particle size distribution required for flow and
density packing in the powder bed of the AM machine.
The metallic AM powder is the prior material format to the fully melted metallic format in
AM components. A number of methods were employed here to investigate the integrity
and material strength of SS316L AM components. Firstly, X-Ray CT was employed to
visualize the continuity of the AM latticework structure in the integrated AM filter and to
visualise any areas of low density. The latticework was shown to be a continuous structure
and no large inclusions or other areas of low density was found within the lattice work
strands. Secondly, tensile strength testers were built using build parameters to test the
ultimate tensile strength of parts build by AM. These tests had two major variables. First,
the build orientation, with tensile testers built in the vertical and horizontal planes relative
to the build platform surface. Second, the influence of build parameters including laser
power, spot distance and laser duration. It was shown that vertical tensile testers were
stronger than horizontal tensile testers but both values were similar to the tensile strength
of conventionally manufactured stainless steel. The variation between tensile strength of

99
testers built in different orientations occurs with all powder bed fusion AM systems and
with most material types. For tensile testers built with different build settings, three out of
the four sets of build parameters tested had tensile strengths greater than conventional
SS316L, one build parameter set tensile strength was very low and less than conventional
SS316L. The manipulation of the build parameters was carried out to alter the amount of
melt pool created during the laser action. This manipulation was critical in this study for
the development of the integrated AM filters as control of the amount of melt pool created
controlled the resultant diameter of the strand in the latticework of the integrated filter
and thus the aperture size and filtration level which is crucial for delivering effective
filtration.
The surface finish of AM components and especially metal AM components, is rougher than
that of conventionally machined components as the layer wise construction introduces
roughness on the outside of the part, with the uppermost and support surfaces being
roughest. It was shown here that low energy mass finishing techniques can reduce the
surface roughness of AM parts. However the variation in surface roughness between like-
orientated facets remains the same following the polishing processes, demonstrating that
whilst polishing techniques can reduce AM component surface roughness it cannot
eliminate the variation in the surface roughness. Initial treatment by sandblasting reduced
the surface roughness of the AM component and this study suggests that this should be
the pre-treatment process prior to any subsequent polishing processes. Surface finish
presents a challenge to the AM industry to produce AM components with surface finishes
to suit end-user requirements. A balance must be achieved between utilising build
parameters that create the part with the required material strength, the best orientation
for part build and preferential orientation for surface finish on certain surfaces. However,
for some parts this combination cannot be achieved and therefore as part of the
production process, extra material must be added to the components for subsequent
polishing processing. At present, there are no commercially available finishing processes
that can polish complex AM components internally and externally to the same extent.
An initial study demonstrated that an AM filter design with holes aligned to the fluid flow
delivered a decreased resistance across the filter compared to conventional filter design.
The holes in line filter was designed for AM, was self-building and delivered a filter that
would have a decreased carbon footprint for its lifetime and end-user. The integrated AM
filter design that incorporated the filter support and filter into a single latticework was also
designed to be self-building by SLM AM. The design created is a unique material format
that would be difficult to replicate using other conventional manufacturing processes. The

100
initial design was tested on the flow test rig and results demonstrated that this design, in
different aperture sizes, had a lesser pressure drop compared to the comparable
conventional filter. However inspection of the AM filters produced demonstrated
irregularities in the thickness of the strands and variable aperture sizes. It was shown that
by altering the CAD design of the repeating node for the latticework and by changing the
build parameters used a more regular aperture shape and controlled strand size could be
obtained. It is essential for the purposes of filtration media that variation in aperture size
in the media is minimised so that the filtration level can be specified for customers. This
study has improved the method of manufacture by AM and the more consistent results
will result in increased confidence in the AM integrated filter as a product.
Filters may be employed in high pressure environments so the series of AM integrated filter
discs and conical filters were tested to determine their collapse pressure. Increasing the
number of layers within the filter discs, increased the overall strength of the filter. The AM
latticework reacted differently compared to woven wire mesh in that the AM discs bulged,
then split along the edge of the flange rim whereas the woven wire mesh wires bulged in
the middle, then stretched. These differences reflect that the wire material is
manufactured by being drawn, and this material continues to lengthen under pressure.
These results highlight that filtration media manufactured by AM do not react in the same
manner as conventional filter media. Therefore for any novel AM filter media trials should
be undertaken to determine filter media performance under different pressure
considerations. A potential design change for the AM integrated filter discs and conical
filters could be in the thickening of lattice work strands in the area immediately adjacent
to the flange.
Ideally, efficient filtration media designs would have a low pressure drop and maximised
open area. AM integrated filters were demonstrated to have a lower pressure drop
compared to conventional filters. This was achieved by the AM integrated filter design
having a maximal open area for the filtration level as well as the overall design reducing
turbulence by the orientation of the latticework to allow the fluid to have a more direct
path through the filter. This 3D latticework design would not have been achievable through
CNC machining and presents the opportunity for the creation of filtration media that have
different shapes that could be tailored to suit specific filtration needs. This would expand
the bespoke filtration market by providing a method for creation of a filter where support
and filtration area are combined within the product.

101
The design freedoms of layer by layer manufacturing has enabled the design of a novel
filter with integrated support and filter element in a latticework form. The integrated filter
not only has a unique structure that has been shown to deliver a reduced pressure drop,
i.e. resistance across the filter, compared to conventional filter design but that the design
is further adaptable from a single repeating structure to that of two differently sized
latticework within the same filter. This feature introduced a further element of filtration
into the design. The addition of two sizes of latticework in the conical filter has enabled the
flow through the filter to be more directed and reduced the pressure drop further. Here
the AM integrated filter is performing as a conventional filter with a filter support with two
meshes arranged to draw the fluid flow through the filter. The integrated filter design, as
shown by the results demonstrates a significantly step forward in the design and delivery
of filtration media. This innovation opens up a new opportunity in the bespoke filtration
market, that of using additive manufacturing to design novel filtration media that improve
filtration.
Chapter 8 Further Work
Layer by layer construction of filters has led to an expansion in filter media types that can
deliver an improved filtration. Following on from the work above, further opportunities for
the development of filtration media using AM have been identified. It is of a particular
interest to this author to explore how DfAM can deliver substantial benefits for bespoke
filter manufacture. In particular, the use of metal AM to manufacture wedge wire filters,
which, by conventional manufacture have a relative long lead time, 6-8 weeks. Whilst it
would be possible to replicate existing conventional wedge wire designs, the support and
wedge sections are usually perpendicular which would require supports in SLM AM. In
studies parallel to those described here, novel AM wedge wire filter media have been
developed but a major challenge is in the creation of a slot size of less than 150µm, due to
fusion of particles and meltpool at this distance. In addition, the manipulation of build
parameters here, demonstrated that porous filters can be created by decreasing the
density of the AM component to the point that a porous component can be created.
However measurement of the pore size produced in these AM porous filters is difficult to
measure and the potential for these filters to become a product range is limited without
the means to determine the filtration level. This presents an area for further work to be
developed for a methodology to determine pore size in porous AM filters which would
require funding support as well as academic support.

102
Chapter 9 References
ASTM International. (2006). Standard E2016-06, Standard Specification for Industrial
Woven Wire Cloth, West Conshohocken, PA 2006. www.astm.org, updated version
E2016-11 available, last accessed 27th December 2018.
ASTM International. (2013). Standard F2971 – 13: Standard Practice for Reporting Data for
Test Specimens Prepared by Additive Manufacturing,
[http://www.astm.org/Standards/ F2971.htm], last accessed 27th December 2018.
ASTM International. (2014). F3122–14 Standard Guide for Evaluating Mechanical
Properties of Metal Materials Made via Additive Manufacturing Processes.
[http://www.astm.org/Standards/F3122.htm], last accessed 27th December 2018.
Banks, J. (2013) Adding Value in Additive Manufacturing : Researchers in the United
Kingdom and Europe Look to 3D Printing for Customization. IEEE Pulse 4(6):22-26
DOI: 10.1109/MPUL.2013.2279617
Bland, S. & Aboulkhair, N. T. (2015). Reducing porosity in Additive Manufacturing. Metal
Powder Report, 79-81.
Brocklehurst, K., Hassall, A., Rideal, G. & Stewart, A. (2015). International Filtration News,
34 (3), 3439.
British Standards. (2009). BS EN ISO 6892-1: 2009, Metallic Materials. Tensile testing.
Method of test at ambient temperature. BSI [http://www.bisgroup.com], last
accessed 27th December 2018.
Burns, N., Burns, M., Travis, D., Geekie, L., Rennie, A. & Weston, P. (2013). Novel filter
designs that deliver filtration benefits produced by additive manufacturing.
Proceedings of the American Filtration Society Conference 2013, Cincinnati, USA,
13p.
Burns, N., Burns, M., Travis, D., Geekie, L. & Rennie, A.E.W. (2016). Designing Advanced
Filtration
Media through Metal Additive Manufacturing. Journal of Chemical Engineering &
Technology, 39 (3), 535-542.
Clayton, J. (2014). Optimising metal powders for additive manufacturing. Metal Powder
Report, 69 (5), 14-17. Doi: 10.1016/S0026-0657(14)70223-1.
Cordova, L, Campos, M. and Ting, T (2019) Revealing the effects of powder reuse for
selective laser melting by powder characterisation. Journal of the Minerals, Metals
and Materials Society DOI: 10.1007/s11837-018-3305-2
Crump, S., & McKinley, D. (2013, September 11th). How can you benefit from additive
manufacturing? Retrieved January 17th, 2014, from PACE - Process and Control
Engineering: http://www.pacetoday.com.au/features/how-can-you-benefit-from-
additive-manufacturing

103
Dadbakhsh, S., Hao, L., & Kong, C. (2010). Surface Finish Improvement of LMD Samples
Using Laser Polishing, Virtual and Physical Prototyping, 5 (4).
doi.:10.1080/17452759.2010.528180
Davies, H., Mehmood, S., Khaliq, A., & Ranjha, S. (2017). Microscopic Analyses of 316 L
Stainless Steel Powder from Additive Layer Manufacturing Process. Microscopy and
Microanalysis, 23(S1), 404-405. doi:10.1017/S1431927617002707
Domblesky, J., Evans, R., & Cariapa, V. (2004). Material Removal Model for Vibratory
Finishing. International Journal or Production Research, 42 (5), 1029-1041, DOI:
10.1080/ 00207540310001619641.
Everton, S. K., Dickens, P., Tuck, C., & Dutton, B. (2016). Identification of sub-surface defects
in parts produced by Additive Manufacturing, using Laser generated ultrasound.
DOI: 10.1007/s11837-017-2661-7 Nottingham: University of Nottingham.
th Fischer, A. & Gerstmann, J. (2013). In 5 Eur Conf for Aeronautics and Space Sciences
(EUCASS) Munich, Germany, 1-12.
Gebhardt, P. D.-I. (2012). Understanding Additive Manufacturing. Cincinnati: Hanser
Publications.
Gibson, I., Rosen, D. & Stucker, B. (2010). Additive Manufacturing Technologies: Rapid
Prototyping to Direct Digital Manufacturing. Springer.
Glatt, E., Rief, S., Wiegmann, A., Knefe, M. & Wegenke, E. (2009). Fraunhofer ITWM, 157.
ISSN: 14349973. Retrieved on October 14, 2017, from
http://publica.fraunhofer.de/ eprints/urn_nbn_de_0011-n-946022.pdf
Gai, G., Yang, Y, Jin, L., Zu, X. and Wu, Y. (2008) Particle shape modification and related
property improvements. Powder Technology, 183 (1), 115-121.
Gu, D.D., Meiners, W., Wissenbach, K. & Poprawe, R. (2012). Laser additive manufacturing
of metallic components: materials, processes and mechanisms International
Materials Review, 57, 133-164. DOI:10.1179/1743280411Y.0000000014
Gu, D. & Zhang, G. (2013). Virtual and Physical Prototyping, 8 (1), 11-18. DOI:10.1080/
17452759.2013.772319
Guessasma, S., Zhang, W., Zhu, J., Belhabib, S., & Nouri, H. (2015). Challenges of additive
manufacturing technologies from an optimisation perspective. Int. J. Simul.
Multisci. Des. Optim. 6, A9 Doi: 10.1051/smdo/2016001.
Haver & Boecker (2015). Woven Wire Cloth: Terminology, types of weave and apertures.
[http://www.haverboecker.com, last accessed March 2015].
ISO 9044:1999. (1999). [www.iso.org] , last accessed March 2015].
Kennedy, A. (2012). Porous Metals and Metal Foams Made from Powders. In D. K. Kondoh,
Powder Metallurgy. Nottingham: Manufacturing Division, University of
Nottingham. DOI: 10.5772/33060
th Kruth, J.-P., Badrissamay, M., Yasa, E., Deckers, J., Thijs, L. & Van Humbeeck J. (2010). Proc 16 Int.

104
Sym. on Electromachining (ISEM XVI), Shanghai Jiao Tong University Press,
Shanghai, China, 531-537.
Lu, W., Tung, K. & Hwang, K. (1996). Textile Research Journal, 66 (5), 311-323. DOI:
10.1177/004051759606600505.
ME Mechanical Team (2017, June 10). Electro Mechanical Machining (ECM). Retrieved
September 6, 2017, from https://mechanicalengineering.com/ electro-chemical-
machining-ecm/
metalsupermarkets.com (2016, May 9). How is Expanded Metal made? Retrieved
September 7, 2017, from metalsupermarkets.com:
https://www.metalsupermarkets.com/expandedmetal-made/
Missouri S&T, Honeywell team up in metals research. (2016). Industrial Maintenance &
Plant
Operation, Retrieved September 6, 2017, from https://search-proquest-
com.ezproxy.lancs.ac.uk/docview/1780355883?accountid=11979
Mumtaz, K.A. & Hopkinson, N. (2010). Effect of process parameters on the
surface roughness of overhanging structures in laser powder bed fusion additive
manufacturing J Mater Process Tech, 210, 279-287. DOI:
10.1016/j.jmatprotec.2009.09.011
Murr, L.E., Martinez, E., Amato, K.N., Gaytan, S.M., Hernandez, J., Ramirez, D.A., Shindo,
R.W., Mediana, F. & Wicker, R.B. (2012). Fabrication of Metal and Alloy
Components by Additive Manufacturing: Examples of 3D Materials Science J Mater
Res Tech, 1 (1), 42-54. DOI: 10.1016/S22387854(12)70009-1.
Nijland, M. (2017, May 23). Subtractive vs. additive manufacturing title fight - chemical
etching vs. electroforming. Retrieved September 7, 2017, from vecoprecision.com:
http://insights.vecoprecision.com/subtractive-additive-manufacturing-chemical-
etchingelectroforming
Obert, C. (2016, June 30). Additive or Subtractive Manufacturing? Retrieved August 24,
2017, from engineeringclicks.com: https://www.engineeringclicks.com/additive-
or-subtractive/
Olakanmi, E.O., Cochrane, R.F. & Dalgarno, K.W. (2015). A Review on Selective Laser
Sintering/Melting (SLS/SLM) of Aluminium Alloy Powders: Processing,
Microstructure, and Properties, Progress in Materials Science, 74, 401–477.
Parry L, Ashcroft IA, Wildman RD. (2016) Understanding the effect of laser scan strategy on
residual stress in selective laser melting through thermo-mechanical simulation.
Additive Manufacturing, 12(1), 1–15.
Rombouts, M., Maes, G., Hendrix, W., Delarbre, E., & Motmans, F. (2013). Surface Finish
after Laser Metal Deposition. Physics Procedia, 810-814.
Schofield, S. & Veness, J. (2007). UK Pump Market Study, The British Pump Manufacturers
Association Retrieved May 24, 2013, from [http://www.bpma.org.uk]

105
Smith, B.H., Szyniszewski, S., Hajjar, J.F., Schafer, B.W. and Arwade, S.R. (2012) Steel foam
for structures: A review of applications, manufacturing and material properties.
Journal of Constructional Steel Research, Volume 71, 1-10. DOI:
10.1016/j.jcsr.2011.10.028
Spierings A.B., Starr T.L. and Wegner K. (2013). Fatigue performance of additive
manufactured metallic parts, Rapid Prototyping Journal, 19 (2), 88-94.
Spierings A.B., Wegner K. And Levy G. (2012). Designing material properties locally with
additive manufacturing technology SLM, Solid Freeform Fabrication Symposium
2012, Austin, Texas, USA, 447-455.
Szalapaj, P. (2001). CAD Principles for Architectural Design. New York: Taylor and Francis
Group.
Tan Y., Kiekens K., Kruth J.P., Voet A. and Dewulf W. (2011). Material Dependent
Thresholding for Dimensional X-ray Computed Tomography. Intern. Symp. on
Digital Industrial Radiology and Computed Tomography, Berlin, Germany, 20–22
June.
Tarleton, S. & Wakeman, R. (2008). Dictionary of Filtration and Separation, 1st Ed. Filtration
Solutions, Exeter, UK.
Tritton, D.J. (1977). Physical Fluid Dynamics, Van Nostrand Reinhold, (reprinted 1980),
Section 22.7, The Coanda Effect.
Verlee, B., Dormal T. & Lecomte-Beckers, J. (2010). Powder Metallurgy, 55, 260-267. DOI
10.1179/0032589912X.0000000082.
Vijayakumar, B., Rennie A.E.W., Burns N., Burns M., Travis D. and Battersby P. (2013), How
additive manufacturing helps in reducing power consumption in pumps, Northern
Postgraduate Chemical Engineering Conference, Newcastle, UK.
Williams B.C., Cochran J.K. and Rosen D.W. (2011). Additive manufacturing of metallic
cellular materials via three-dimensional printing, Int. J. Adv. Manuf. Technol., 53,
231-239.
Yadroitsev I., Shishkovsky I., Bertrand P. and Smurov I. (2009). Manufacturing of fine-
structured 3D porous filter elements by selective laser melting, Applied Surface
Science, 255, 5523-5527.
Yan, F., Xiong, W. and Faierson, E.J. (2017) Grain Structure Control of Additively
Manufactured Metallic Materials. Materials, 10, 1260; doi:10.3390/ma10111260
Yung, A. and Diebels, S. (2016) Modelling of metal foams by a modified elastic law.
Mechanics of Materials, 101, 61-70. DOI: 10.1016/j.mechmat.2016.07.007

106
Chapter 10 Bibliography
Aboulkhair, N. T., Everitt, N. M., Ashcroft, I., & Tuck, C. (2014). Reducing porosity in
AlSi10Mg parts processed by selective laser melting. Additive Manufacturing 1-4,
77-86.
Boman, K. (2015, October 27). What Kind of Potential Does 3D Printing Hold
for Oil, Gas? Retrieved June 14,2017, from Rigzone:
http://www.rigzone.com/news/oil_gas/
a/141296/What_Kind_of_Potential_Does_3D_Printing_Hold_for_Oi
l_Gas/?pgNum=2
Canalys. (2016, May 16). Media Alert: 3D Printing Market. Retrieved June 13,
2017, from canalys.com:
http://www.canalys.com/static/press_release/2016/media-alert-
17052016-3dprinting-market-be-worth-us224-billion-2020.pdf
Clarke-Billings, L. (2016, May 12). WHO: Air Pollution Causes 7 Million Deaths Per Year.
Retrieved
June 27, 2017, from Newsweek.com: http://www.newsweek.com/who-air-
pollution-causes7-million-deaths-each-year-459101
Colls, J., & Tiwary, A. (3rd Edition: 2010). Air Pollution: Measurement, Modelling and
Mitigation, Third Edition. CRC Press.
Curran, C. (2016, August 19). The Road Ahead for 3D Printing. Retrieved June 12, 2017,
from usblogs.pwc.com: http://usblogs.pwc.com/emerging-technology/the-road-
ahead-for-3dprinting from Newsweek.com: http://www.newsweek.com/kenya-
worlds-least-toxic-country-551745
Dadbakhsh, S., Hao, L., & Sewell, N. (2012). Effect of selective laser melting layout on the
quality of stainless steel parts. Rapid Prototyping Journal, 18(3), 241-249.
D'Aveni, R. (2015, May). The 3D Printing Revolution. Retrieved June 14, 2017, from Harvard
Business Review: https://hbr.org/2015/05/the-3-d-printing-revolution
Doré Metal Services. (n.d.). How are metal foams absorbing X-Rays, Gamma Rays, and
Radiation? Retrieved from Dore Metal Services May 7 2018:
http://www.doremetals.co.uk/metal-foams-absorbingx-rays-gamma-rays-
radiation/
Farinia Group. (n.d.). Mechanical Properties in Additive Layer Manufacturing. Retrieved July
17, 2017, from Farinia.com: http://www.farinia.com/additive-
manufacturing/3dmaterials/
mechanical_properties_in_additive_layer_manufacturing_is_all_about_metallurg
y_1_of_2
107
Frazier, W. E. (2014). Metal Additive Manufacturing: A Review. Journal of Material
Engineering and Performance, 23 (6) 1917-1928. DOI: 10.1007/s11665-014-0958-
z
Garciá-Moreno, F. (2016). Commercial Applications of Metal Foams: Their Properties and
Production. Materials 2016, 9, 85; doi:10.3390/ma9020085.
Goldsberry, C. (2016, November 15). Oil and Gas Industry turns to 3D printing to cut costs
and boost efficiency. Retrieved June 14, 2017, from plasticstoday.com:
https://www.plasticstoday.com/3d-printing/oil-and-gas-industry-turns-3d-
printing-cutcosts-and-boost-efficiency/148288251046092
Gong, H., Rafi, K., Starr, T., & Stucker, B. (2013). The Effects of Processing Parameters on
Defect Regularity in Ti-6Al-4V Parts Fabricated By Selective Laser Melting and
Electron Beam Melting. 24th International SFF Symposium - An Additive
Manufacturing Conference, SFF 2013, Louisville: University of Louisville.
Grand View Research. (2016). Filters Market Analysis by Product Type, Application, and
Segment Forecasts to 2024. Retrieved on March, 18 2017 from Grand View
Research. https://www.grandviewresearch.com/industry-analysis/filters-market
Grunewald, S. J. (2016, August 4). Metal 3D Printing is now the fastest growing segment of
the 3D printing industry. Retrieved June 15, 2017, from 3dprint.com:
https://3dprint.com/144859/metal-3dp-fastest-growing/
Hague, R., Reeves, P., & Jones, S. (2016). Mapping UK Research and Innovation in Additive
Manufacturing. Innovate UK. Retrieved on April 16th, 2016 from
https://www.gov.uk/government/publications/additive-manufacturing-mapping-
uk-research-into-3d-printing
Herzog, D., Seyda, V., Wycisk, E., & Emmelman, C. (2016). Additive manufacturing of
metals. Acta Materialia, 117, 371-392.
http://dx.doi.org/10.1016/j.actamat.2016.07.019
Holsman, R., & Richards, B. H. (2014). A new dimension of opportunity: 3D printing's
potential for the energy industry. Retrieved Retrieved June 15, 2017 from
Accenture. https://www.accenture.com/t20150523t024834__w__/pl-
en/_acnmedia/accenture/ conversion-assets/dotcom/documents/
global/pdf/dualpub_2/accenture-new-dimension-opportunity-3dp-energy.pdf
insidemetaladditivemanufacturing.com. (2014, January 12). Porosity in metal components
made using Selective Laser Melting. Retrieved July 14, 2017, from
Insidemetaladditivemanufacturing.com:
http://www.insidemetaladditivemanufacturing.com/blog/porosity-in-metal-
componentsmade-using-selective-laser-melting
Jamshidinia, M. (2017). Flaw Generation in Laser Powder Bed Fusion Additive
Manufacturing. Columbus: EWI. Retrieved March 6, 2018 from
https://ewi.org/wp-content/uploads/2017/01/Flaw-Generation-in-Laser-Powder-
Bed-Fusion-Additive-Manufacturing-Jamshidinia.pdf

108
Kalpakjian, S., & Schmid, S. (2014). Manufacturing Engineering and Technology. 7th Edition
Pearson.
Kerns, J. (2016, November 14). How 3D Printing Is Changing Auto Manufacturing. Retrieved
June 13, 2017, from Machine Design: http://www.machinedesign.com/3d-
printing/how-3d-printingchanging-auto-manufacturing
Lloyd's Register. (2016). What affects porosity in Laser Powder Bed Fusion additive
manufacturing? Retrieved July 17, 2017, from lr.org:
http://www.lr.org/en/services/additivemanufacturing/ research-and-
resources/porosity-in-laser-powder-bed-fusion-additivemanufacturing.aspx
Loughborough (2017). Additive Manufacturing Research Group, Loughborough University.
The seven categories of additive manufacturing, Retrieved May, 12 2017, from
http://www.lboro.ac.uk/
research/amrg/about/the7categoriesofadditivemanufacturing/
LPW PowderLife (2016) Retrieved on June 1st 2017 from
https://carpenteradditive.com/wp-
content/uploads/2016/09/LPW_PowderLife_Brochure_web_pdf.pdf
Mahon, L. (2016, July 20). 3D Printed Medicine Set to Offer The Industry $3.89 Billion by
2022. Retrieved June 14, 2017, from 3D Printing Industry:
http://3dprintingindustry.com/news/3dprinted-medicine-set-to-offer-the-
industry-3-89-billion-by-2022-87551/
Material Extrusion. (2017). Omnexus.specialchem.com. Retrieved 9 May 2017, from
http://omnexus.specialchem.com/selection-guide/3d-printing-and-additive-
manufacturing-polymers-and-processes/material-extrusion
Markets and Markets. (2016). Pharmaceutical Filtration Market. Retrieved on June 12,
2017 from Markets and Markets. https://www.marketsandmarkets.com/Market-
Reports/pharmaceutical-filtration-market-209343847.html
Markusson, L. (2017). Powder Characterization of Additive Manufacturing Processes. Lulea:
Lulea University of Technology. Retrieved on September 18th 2017, http://
http://www.diva-portal.org/smash/get/diva2:1084670/FULLTEXT01.pdf
Meyer, D. F. (2016). Metal Foam - a material for heat engineering. Berlin: FIZ Karlsruhe.
Retrieved June 13, 2017,
http://www.bine.info/fileadmin/content/Publikationen/Projekt-
Infos/2016/Projekt_11-2016/ProjektInfo_1116_engl_internetx.pdf
Milewski, J. O. (2017). Additive Manufacturing of Metals: From Fundamental Technology to
Rocket Nozzle, Medical Implants, and Custom Jewelry. Springer, ISBN 978-3-319-
58205-4.
Molitch-Hou, M. (2017, July 10). 7 Issues to Look Out for in Metal 3D Printing. Retrieved
July 13, 2017, from Engineering.com:
http://www.engineering.com/3DPrinting/3DPrintingArticles/ ArticleID/15202/7-
Issues-toLook-Out-for-in-Metal-3D-Printing.aspx

109
OGIC. (2017, February 28). Could Metal 3D printing revolutionise oil and gas
manufacturing? Retrieved June 14, 2017, from ogic.co.uk:
http://www.ogic.co.uk/metal-3d-printingrevolutionise-oil-gas-manufacturing/
Olivo, T. (2016). Filtration Market. Retrieved on March 17, 2017 from
https://www.nonwovens-industry.com/issues/2016-11-
01/view_features/filtration-market-report/.
Persons, T. M. (Ed) (2015) 3D Printing: Opportunities, Challenges, and Policy Implications
of Additive Manufacturing, GAO-15-505SP Addictive Manufacturing Forum 2015,
Retrieved on September 16, 2017 from
https://www.gao.gov/assets/680/670960.pdf
Peters, G. (2015, November 4). 3D printing: futuristic tech set to disrupt oil and gas industry.
Retrieved June 14, 2017, from offshore-technology.com:
http://www.offshoretechnology.com/ features/feature3d-printing-futuristic-tech-
set-to-disrupt-oil-and-gasindustry-4636307/
Ploszajski, A. (2016, February 1). Material of the Month - Metal Foam. Retrieved June 8,
2017, from iom3:http://www.iom3.org/materials-world-
magazine/feature/2016/feb/01/ materialmonth-metal-foams
Prashanth, K., Scudino, S., Klauss, H., Surreddi, K., Lober, L., Wang, Z., et al. (2013).
Microstructure and mechanical properties of Al-12Si produced by Selective Laser
Melting: Effect of heat treatment Materials Science and Engineering A 590:153-
160. DOI: 10.1016/j.msea.2013.10.023.
Quadbeck, P. (2017) Open-cell Metal foams. Retrieved on April 14, 2017 from Fraunhofer
https://www.ifam.fraunhofer.de/content/dam/ifam/en/documents/dd/Infobl%C
3%A4tter/ open_cell_metal_foams_fraunhofer_ifam_dresden.pdf
Riemer, A., & Richard, H. A. (2016). Crack propagation in Additive Manufactured Materials
and Structures. 21st European Conference on Fracture. Procedia Structural
Integrity 2, 1229-1236 DOI:10.1016/j.prostr.2016.06.157.
Sames, W., List, F., Pannala, S., Dehoff, R., & Babu, S. (2016, March 7). The metallurgy and
processing science of metal additive manufacturing. International Materials
Reviews. 61(5) 315-360. doi:10.1080/09506608.2015.1116649
Shipman, M. (2016, March 28). Metal Foam handles heat better than steel, study finds.
Retrieved June 26, 2017, from Phys Org: https://phys.org/news/2016-03-metal-
foam-steel.html
Slotwinski, J. A., Garboczi, E. J., & Hebenstreit, K. M. (2014). Porosity Measurements and
Analysis for Metal Additive Manufacturing Process Control. Journal of Research of
the National Institute of Standards and Technology, 119:494-528. doi:
10.6028/jres.119.019
SME. (2016, May). Additive Manufacturing: State of the Industry. Manufacturing
Engineering. Retrieved June 17, 2017 from
https://advancedmanufacturing.org/additive-manufacturing-state-industry-2/

110
Strano, M., Villa, A., & Mussi, V. (2013). Design and Manufacturing of Anti-Intrusion Bars
made of Aluminium Foam Filled Tubes. International Journal of Material Forming,
6, doi: - 10.1007/s12289-011-1063-6
Stratasys (2015, August 13). Trend Forecast: 3D Printing's Imminent Impact on
Manufacturing. Stratasys Direct Manufacturing. Retrieved on February 2, 2018,
from http://investors.stratasys.com/news-releases/news-release-details/survey-
reveals-3d-printings-imminent-impact-manufacturing
Szondy, D. (2015, July 22). Metal foams could provide lightweight radiation shielding.
Retrieved June 26, 2017, from New Atlas: http://newatlas.com/metal-foam-
lightweight-radiationshielding/38515/
Thompson, M. K., Moroni, G., Vaneker, T., Fadel, G., Campbell, R. I., Gibson, I., et al. (2016).
Design for Additive Manufacturing: Trends, opportunities, considerations, and
constraint. CIRP Annals, 65(2) 737-760. doi: 10.1016/j.cirp.2016.05.004
Thryft, A. R. (2016, August 1). Powder metals expand to include additive manufacturing: a
wider range of better-performing, and sometimes less costly, powder metals are
available for engineers designing multiple applications. Retrieved September 4,
2017, from galegroup.com:
http://find.galegroup.com/grnr/infomark.do?&source=gale&idigest=f4051e469c
d4201e0d9f
bd7920dd8d18&prodId=GRNR&userGroupName=unilanc&tabID=T003&docId=A
494890992
&type=retrieve&contentSet=IAC-Documents&version=1.0
Tritton, D. (1977 (Reprinted 1980)). The Coanda Effect. In Physical Fluid Dynamics. Van
Nostrand Reinhold.
Vayre, B., Vignat, F., & Villenueve, F. (2012). Designing for Additive Manufacturing. 45th
CIRP conference on manufacturing systems. Athens, Greece, ISBN: 978-1-62748-
512-8.
Vendra, L., & Rabiei, A. (2010). Biomedical implants from Metal Foam with Similar Elasticity
to Bone. Expert Rev. Med. Devices 7(6), 727-729.
Vijayakumar, B., Rennie, A., Burns, N., Burns, M., Travis, D., & Battersby, P. (2013). How
Additive Manufacture helps in reducing power consumption in pumps. Northern
Postgraduate Chemical Engineering Conference. Newcastle, UK.
Villarranga-Gomez, H., Seifi, M., Uchiyama, Y., Ramsey, A., & Lewandowski, J. J. (2016, June
28). Assesing the structural integrity of additive manufactured metal parts with x-
ray CT. doi: 10.13140/RG.2.1.1066.6486
Wycisk, E., Solbach, A., Siddique, S., Herzog, D., Walther, F., & Emmelmann, C. (2014).
Effects of Defects in Laser Additive Manufactured Ti-6Al-4V on Fatigue Properties.
8th International Conference on Photonic Technologies. Physics Procedia 56:371–
378.

111
Yakout, M., & Elbestawi, M. A. (2017). Additive Manufacturing of Composite Materials: An
Overview. Ontario: McMaster University 6th International Conference on Virtual
Machining Process Technology (VMPT), At Montréal, Canada
Zaleski, A. (2015, September 17). Why 3D printing is the future of manufacturing, not just a cool
gimmick. Retrieved June 13, 2017, from Fortune.com:
http://fortune.com/2015/09/17/3dprinting-future-of-manufacturing/

112
Chapter 11 APPENDIX A
Burns, N., Burns, M., Travis, D., Geekie, L., Rennie, A. & Weston, P. (2013). Novel filter
designs that deliver filtration benefits produced by additive manufacturing. Proceedings of
the American Filtration Society Conference 2013, Cincinnati, USA, 13p.

Novel Filter Designs that Deliver Filtration Benefits Produced by Metal Additive Manufacturing
Neil R Burns1,2, Mark A Burns1, Darren Travis 1, Louise E Geekie1, Allan EW Rennie 2 and David P Weston
3.
1Croft Filters Ltd, Warrington , Cheshire, United Kingdom
2University of Lancaster , Lancaster, Lancashire, United Kingdom
3University of Leicester, Leicester, Leicestershire , United Kingdom
Abstract
Optimisation of fluid flow through a filter and minimising turbulence and pressure drop can lead to a
more efficient filtration system. Traditionally, metal filters have been manufactured using perforated
plate, mesh and wedge wire. Additive Manufacturing (AM) technology can be used to produce filters
whose geometries cannot be manufactured using more conventional manufacturing technologies.
Three novel filter geometries were designed for fabrication using AM to reflect three traditional filter
types. A filter design, with holes in-line to the direction of fluid flow, which can be directly compared
to perforated plate, was produced using AM technology with 316L Stainless Steel (SS316L) as the build
material. When compared to conventional filters of similar aperture size, the pressure drop across the
AM filter with increasing flow rates was significantly less compared to the conventionally
manufactured filter. Thus, less pumping energy is required for the in-line hole AM filter. The AM filter
designed to be representative of a mesh-based filter, was created as a single part with an integrated
support and filter section. This filter has a significantly increased open area and increased flow rate
compared to its comparable mesh filter. The AM filter representing that fabricated from wedge wire,
overcomes conventional fabrication issues and is an advance towards leaner manufacturing. AM
technology has enabled the production of innovative, geometrically complex, 3D filter designs that
have significant increases in filtration efficiency. Industrial application of these filters will have a
positive impact in reducing the carbon footprint of end users.
Keywords: Filter, Optimisation, Pressure Drop, Additive Manufacturing, Energy Reduction
Introduction
When a filter is employed in a conduit, it forms a barrier and thus creates resistance. Resistance across
a filter occurs due to the pressure differential across the filter, with fluid flowing from high to low
pressure across the filter. The pressure drop across a filter is dependent on the flow rate of the fluid
and the amount of resistance that the filter type exerts on the fluid. When moving fluid within a
pumping/filtration system, more energy is required at increasing flow rates to overcome the filter’s
inherent resistance. In 2007, 13% of the UK’s industrial electricity usage was used for pumping,
equivalent to 44.8 million MWh/year, costing £ 728 million per annum and equating to 6% of the UK’s
carbon footprint (equalling 30 million tonnes/year) [1]. By optimising the fluid flow through a filter,
minimising the turbulence produced and in so doing decreasing the pressure drop across a filter, the

resultant would be a more efficient filtration system. This increase in efficiency would in turn lead to
a decrease in pumping energy required and so reducing the end users’ energy costs and carbon
footprint [2].
The successful operation of pumping systems usually requires filtration, to separate solids from fluids,
with oversize solids in the fluid being retained by the filter media. The filter media type and aperture
size is typically dependent on the end-user requirements and particular application. Generally, for
coarse filtration, a sieve formed from a single perforated plate or single woven wire mesh layer, retains
particles that are too large to pass through the holes in the sieve. Screens and filters can also be
manufactured using wedge wire. For finer filtration, woven wire mesh with smaller apertures is
employed. However, when fluid flow rates are increased, fine woven wire mesh alone can be damaged
easily. Therefore, filters are designed to comprise of two or more layers. Usually a perforated plate
with larger hole sizes forms the filter support with a layer of woven wire mesh of suitable aperture
size either inside or outside of the support forming the actual filter. An additional layer of woven wire
mesh of an aperture size that is in-between that of the support and the filter mesh is added to
encourage the fluid to flow from the support to the filter mesh of the assembled product. Depth filters
comprising of a bed of granular material (e.g. sand) trap solid particles as they pass through the bed.
For very fine or nano-filtration, depth filters comprising of fibrous layers or membranes where larger
particulates are unable to traverse the torturous routes through the media, are used to remove very
fine particulates from fluids. Filtration is further dependent on the length of the filter and maximum
filtration can be achieved by increasing the open area of the filter to a maximum. This is dependent
on the area available for the filter as well as the method of construction, therefore filters are designed
specifically for their end-use application and the filter media type manufactured using a wide variety
of fabrication techniques.
The abovementioned filter media have previously been manufactured employing conventional
methods using perforated plate, woven wire mesh and wedge wire. Additive manufacturing (AM)
technology can be used to produce 3D geometries that cannot be manufactured using conventional
methods [3]. Three novel filter designs were created to reflect the conventional methods but with the
potential to deliver efficiencies for both filtration and the overall manufacturing process.
Additive Manufacturing Technology
The Selective Laser Melting (SLM) (Realizer Gmbh) AM technology employed within this
research/application produces complex products by fusing metal powder to form structures in
accordance with 3D Computer Aided Design (CAD) data. The novel 3D filter design structures were
created in SolidWorks (SolidWorks Corp), exported as *.STL files and uploaded into Magics™
(Materialise). Further changes are made within Magics™ to the structural design, including the
addition of support structures (supporting, for example, overhangs and internal features, which are
important for fabricated component quality [4]) which also act as anchors of the components to the
build platen. The parts are then sliced into a series of consecutive layers, each approximately 50 µm
thick, and finally uploaded into the proprietary Realizer software. The Realizer SLM 250 AM machine
build chamber is heated to 200°C, the pressure increased slightly and the oxygen levels decreased to
0.2% by the addition of an inert gas, Argon. 316L Stainless Steel (SS316L) powder is introduced and a
rubber blade situated on a levelling wiper arm evenly distributes the powder across the base build
platen in a uniform 50 µm layer (a schematic of the process is given in Figure 1). The laser then melts
the SS316L powder according to the CAD design for that particular layer. This process is repeated for
every layer until the build is completed. After cooling, the component is removed from the base build

platen, the sacrificial support structures are removed and the component is subjected to appropriate
post-processing techniques before being tested.
Figure 1: Schematic of AM build process within the Realizer SLM 250 build chamber (adapted from
[5]).
High Flow Filter Design
Within a conventional truncated cone shaped filter constructed from perforated plate and mesh, the
fluid enters the filter in-line with the fluid flow. The fluid must then turn through an angle to pass
through the mesh and apertures in the support portion before it once again changes direction and
continues along the conduit. This travel causes undesirable turbulence within the filtration
product/system. Such turbulence increases the energy requirements for pumping through the filter.
At the truncated end of the filter the holes are in line with the fluid flow however, when the fluid flows
towards the truncated point, the jet flow is attracted to the surface (this is known as the Coanda effect
[6]). As a result, the fluid flow meets in the middle of the truncated end and so creates turbulence.
Due to the Coanda effect and the resultant turbulence, no significant benefit is achieved from the
holes in line with fluid flow at the truncated end of the conventional filter. If the holes throughout the
filter were to be aligned with the fluid flow direction, then there may be a substantial benefit with
decreased turbulence being produced across the filter and so the resultant pressure drop will
decrease. Historically, this type of filter, with holes in line with fluid flow was constructed using
conventional (typically subtractive) manufacturing/fabrication methods. A different method of
manufacturing was sought to undertake experimental trials, with a prototype model eventually being
realised in Acrylonitrile Butadiene Styrene (ABS) using the fused deposition modelling (FDM) AM
technology (Figure 2). The 76.2 mm (3 inch) plastic filter prototype has holes inline with fluid flow
along its complete length as shown in Figure 2 (a-c) which appear as round holes when observed in
plan view (Figure 2b-c). This filter was compared to a comparable 3 inch conventional filter (Figure 2
d-f). Aperture diameter for both filters was 2 mm.

Figure 2: (a) The AM ABS prototype 76.2 mm (3 inch) filter; (b) viewed from above; (c) viewed from
below; (f) The comparable 76.2 mm conventional perforated plate filter; (d) viewed from above; (e)
viewed from below.
The filters were tested in-situ within a bespoke flow rig on site at Croft Filters Ltd (Warrington, UK).
The flow rate was increased incrementally and the pressure differential across the filter being tested
(the pressure drop) was measured using a digital pressure manometer. The measurements were
conducted using water as the active fluid media: density 1000 kg/m3, temperature range 16-20°C and
flow rate range 100-450 l/min. The results are shown in Figure 3.
Figure 3: Graph depicting the change in the pressure drop (Pa) across conventional filter and the AM
filter in response to increases in flow rate (L/min).
The pressure drop across the high flow AM filter is significantly less compared to the pressure drop
across the conventional filter at all comparable flow rates (Figure 3). This reflects a 40% decrease in
pressure drop across the AM filter. A mesh was added to the filters and the pressure drop across the
filters with increasing flow rates was compared. The results are shown in Figure 4.
a b
c
f
e
d

Figure 4: Graph depicting the change in the pressure drop (Pa) across conventional filter with 522µm
mesh and the AM filter with 522µm mesh in response to increases in flow rate (l/min).
The pressure drop across the high flow filter was decreased with the presence of mesh, but at flow
rates of more than 300 l/min the pressure drop across the AM high flow filter was 10% less compared
to the conventional filter.
The AM version was then constructed in metal using a Realizer SLM 250 AM machine in SS316L
powder. Both filters overall dimensions are: 32 mm diameter, height 28 mm with 2 mm apertures.
The AM filter and conventional filter were mounted onto flanges and tested in the flow test rig. The
results are shown in Figure 5.
Figure 5: (a) The conventional filter; (b) the AM filter; and (c) the graph depicts the change in the
pressure drop (kPa) across conventional filter and the AM filter in response to increases in flow rate
(l/min).

The pressure drop across the AM filter was less than that across the conventional filter with increasing
fluid flow rates. This reflects a decrease in the pumping energy required and hence a potential
decrease in energy used (of at least 15%) and carbon footprint produced.
Integrated Filter Support and Mesh
The support portion of a conventional filter, when designed for optimised geometry and loading [7, 8]
provides its strength and protects the mesh from damage, and supports the mesh from buckling or
collapse under increased fluid flow. Woven wire mesh when maintained in one plane retains its
aperture size. When shaped through an angle, woven wire mesh distorts and so the aperture size is
no longer uniform (Figure 6a). Conventional filters with the support covered with woven wire mesh
have variable pore shapes and sizes compared to unshaped woven wire mesh. The freedom of design
available and the capabilities of the AM technology to build lattice structures in layers (e.g. [9, 10])
allowed the development of a filter assembly that has integrated support and filter layers in which the
repeating units form the support due to the strength of the metal lattice and the rigidity prevents
distortion of aperture size compared to conventional woven wire mesh (Figure 6b).
Figure 6: (a) Conventional filter showing the distortion of apertures in moulded wire mesh; (b) AM
filter (SS316L) demonstrating apertures with retained size and shape; (c) the repeating node
structure (bar indicates one node length) of the AM integrated support and filter; (d) AM build plate
with the truncated cone filters with different node sizes examined below.
Structural Internal Geometry of the Integrated Filter support and filter
The internal geometry of the structures produced by AM will differ to a small degree from the initial
CAD drawing due to the surface finish of the product which is variable depending on the laser melting
parameters employed and the mode of building e.g. hatched versus non-hatched raster, powder
particle size, layer thickness, laser raster rate and position of the laser relative to the part on the
platform. The lattice structures of the integrated support and filter portion were therefore examined
in a series of truncated cone filters (Figure 6d) produced with an increasing node size. The integrated

filter support and filter were manufactured in SS316L using the Realizer SLM 250 AM machine. The
node sizes of the individual cones were: 0.5, 1.0, 1.5, 2.0, 2.5 and 3.0 mm. The node is the repeating
structure unit that makes up the lattice. The node comprises of an octahedral arrangement of eight
arms , equally spaced around the centre. The node length extends from the end of one arm, though
the centre to the end of the arm in the same plane (Figure 6c). The size of the node is determined as
the diameter of the repeating unit (Figure 6c), therefore does not directly represent the aperture size
in the filter. The internal geometry and aperture size was examined using X-ray computed tomography
to understand the shape and size of holes in the AM filter structure and how they relate to the planned
structure, i.e. the size and arrangement of nodes, when produced by AM.
X-Ray Computed (CT) Tomography
X-ray computed tomography (CT) is an established non-destructive testing technology for viewing
internal features on parts. CT uses X-rays to produce 3D virtual representations of objects that can be
sectioned to view internal regions not visible to the naked eye. A schematic of how X-ray CT works is
given in Figure 7. A Nikon Metrology XT H 225 was used to examine the truncated cone filters’ lattice
made from the uniform repeating nodes. Thus the lattice structure produced possesses holes of
different geometry running through in different orientations.
Figure 7: Schematic of X-ray CT setup
X-ray CT scans were performed on the series of AM filters with increasing node size to produce suitable
3D reconstructions from which internal structure and aperture size could be determined.
X-ray CT Analysis
The type C filters were scanned in the X-ray CT. The histograms for samples 0.5mm-1.0mm did not
give a distinct separation between air and sample due to the increased quantity of steel in these
samples [11]. These samples were cut in half and the scans repeated. Samples 1.5mm-2.5mm gave
greyscale histograms with sufficient segregation between sample and air to allow a trustworthy 50%
isosurface to be created.
Twenty equidistant segments of one voxel thickness were taken from each scan starting at a point
20mm above the base of each sample and over a distance equal to x2 the rating of the sample, i.e. the
20 segments were taken from the 2.5mm sample starting 20mm above the base and ending 25mm

above the base. The segments were analysed by isolating a toroid encapsulating each segment and
calculating the volume of sample and free volume. The results of this analysis are plotted for the
twenty segments in Figure 8.
segment
Figure 8: Variation in porosity over 20 segments for the six type filters: Nodes 0.5, 1.0, 1.5, 2.0, 2.5
and 3.0 mm.
There is a characteristic variation in the porosity of each segment which is to be expected given the
geometry of the node. For clarity, the maxima and minima in each sample have been aligned. The
maxima in the porosity in Figure 8, occurs at the centre of each node and at the plane where nodes
are joined. The square hole through each sample is best observed at the mid-point between two
maximums in porosity.

Figure 9: (a) X ray CT Image showing the integrated filter lattice in grey, with the spaces between as
black. Red arrow depict the measurement for hole width. Histograms of the hole width
measurements made for the: (b) 1.0 mm node; and (c) 1.5 mm node samples.
From each sample, a series of 100 square, hole-width measurements were recorded (as shown by
arrows in Figure 9a). The results were plotted as histograms with a bin size of 0.02mm. Representative
samples of aperture size from the 1.0 mm and 1.5 mm node are plotted in Figure 9. The size of the
holes increases with increasing node size as expected. However for the 2.5 mm node and 3.0 mm node
the nodes are not always completed before meeting the extremities of the filter, thus some of the
apertures are buried well within the structure whereas others are necessarily at the edge. Further
analysis of these apertures is on-going.
Pressure Drop in the Integrated Support and Filter
Four AM integrated support and filters (the 1.5, 2.0, 2.5 and 3.0 mm cones) were attached to flanges
and tested in the flow test rig. The pressure drop across each filter was recorded for step-wise
increased flow rates. The results are shown in Figure 10. The filters tested had different pressure drops
across each at flow rates above 125 L/min. Decreasing the node size increased the pressure drop for
each flow rate tested as expected. The pressure drop across the 1.5 mm node and 2.0 mm node filter
was significantly greater than that in the 2.5 and 3.0 mm node filters.
A comparable conventional filter, 3.00 mm aperture, was constructed from perforated plate to match
the dimensions of the truncated integrated filters. The pressure drop across this filter, by itself, with
900 µm mesh, 400 µm mesh and 250 µm mesh was tested on the flow rig at increasing flow rates. The
results were compared to those of the 2.5 and3.0 mm node filters and are shown in Figure 11.

Figure 10: Pressure drop (kPa) across the AM integrated support and filter with increasing flow rates
(L/min). 3.00 mm node, 2.5 mm node,2.0 mm node and 1.5 mm node.
Figure 11: Pressure drop (kPa) across the AM integrated support and filter with increasing flow rates
(L/min). 3.00 mm node AM filter, 2.5 mm node AM filter, conventional filter: 3.00 mm apertures, no
mesh, conventional filter with 20 mesh (900µm), conventional filter with 40 mesh (400µm),
conventional filter with 60 mesh (250µm)
The conventional filter alone had a similar pressure drop compared to the AM 3.0 mm node filter, and
a less pressure drop compared to the 2.5 mm AM node filter. With the application of mesh of
decreasing aperture size, the pressure drop across the conventional filter increased when compared
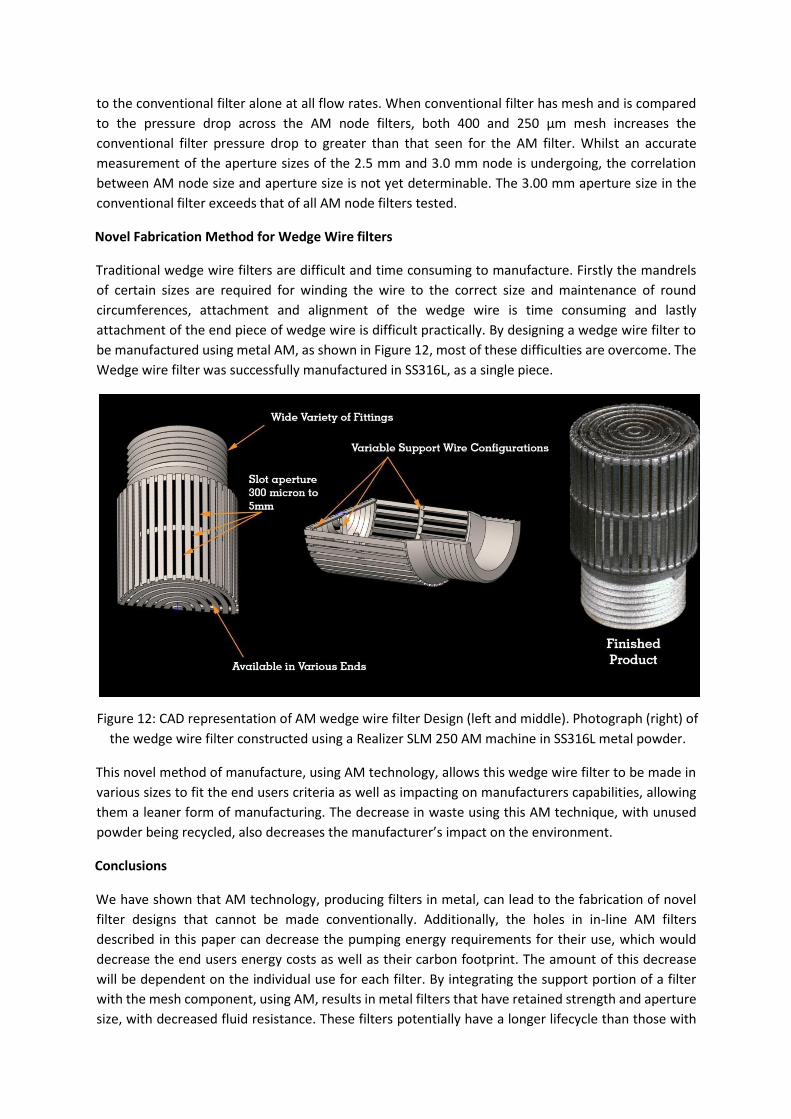
to the conventional filter alone at all flow rates. When conventional filter has mesh and is compared
to the pressure drop across the AM node filters, both 400 and 250 µm mesh increases the
conventional filter pressure drop to greater than that seen for the AM filter. Whilst an accurate
measurement of the aperture sizes of the 2.5 mm and 3.0 mm node is undergoing, the correlation
between AM node size and aperture size is not yet determinable. The 3.00 mm aperture size in the
conventional filter exceeds that of all AM node filters tested.
Novel Fabrication Method for Wedge Wire filters
Traditional wedge wire filters are difficult and time consuming to manufacture. Firstly the mandrels
of certain sizes are required for winding the wire to the correct size and maintenance of round
circumferences, attachment and alignment of the wedge wire is time consuming and lastly
attachment of the end piece of wedge wire is difficult practically. By designing a wedge wire filter to
be manufactured using metal AM, as shown in Figure 12, most of these difficulties are overcome. The
Wedge wire filter was successfully manufactured in SS316L, as a single piece.
Figure 12: CAD representation of AM wedge wire filter Design (left and middle). Photograph (right) of
the wedge wire filter constructed using a Realizer SLM 250 AM machine in SS316L metal powder.
This novel method of manufacture, using AM technology, allows this wedge wire filter to be made in
various sizes to fit the end users criteria as well as impacting on manufacturers capabilities, allowing
them a leaner form of manufacturing. The decrease in waste using this AM technique, with unused
powder being recycled, also decreases the manufacturer’s impact on the environment.
Conclusions
We have shown that AM technology, producing filters in metal, can lead to the fabrication of novel
filter designs that cannot be made conventionally. Additionally, the holes in in-line AM filters
described in this paper can decrease the pumping energy requirements for their use, which would
decrease the end users energy costs as well as their carbon footprint. The amount of this decrease
will be dependent on the individual use for each filter. By integrating the support portion of a filter
with the mesh component, using AM, results in metal filters that have retained strength and aperture
size, with decreased fluid resistance. These filters potentially have a longer lifecycle than those with

layers of mesh and so will expand the applications for these filters, when fully tested. The versatility
and capabilities of the AM technology were used to create a wedge wire filter. This advance in
manufacturing process brings decreased lead times, decreased waste and leads to leaner
manufacturing.
References
1. Schofield, S. and Veness, J. (2007), UK Pump Market Study. The British Pump Manufacturers
Association.
2. Vijayakumar, B., Rennie A.E.W., Burns N., Burns M., Travis D. and Battersby P. (2013), How
additive manufacturing helps in reducing power consumption in pumps, Northern Postgraduate
Chemical Engineering Conference, Newcastle, UK.
3. Vayre B., Vignat F. and Villeneuve F. (2012), Designing for additive manufacturing, 45th CIRP
Conference on Manufacturing Systems, Athens, Greece, 632-637.
4. Dadbakhsh S., Hao L. and Sewell N. (2012), Effect of selective laser melting layout on the quality
of stainless steel parts, Rapid Prototyping Journal, 18 (3), 241-249.
5. http://www.emeraldinsight.com/content_images/fig/1560160403001.png (last accessed 25
September 2013)
6. Tritton, D.J., Physical Fluid Dynamics, Van Nostrand Reinhold, 1977 (reprinted 1980), Section
22.7, The Coanda Effect.
7. Spierings A.B., Starr T.L. and Wegner K. (2013), Fatigue performance of additive manufactured
metallic parts, Rapid Prototyping Journal, 19 (2), 88-94.
8. Spierings A.B., Wegner K. And Levy G. (2012), Designing material properties locally with
additive manufacturing technology SLM, Solid Freeform Fabrication Symposium 2012, Austin, Texas,
USA, 447-455.
9. Williams B.C., Cochran J.K. and Rosen D.W. (2011), Additive manufacturing of metallic cellular
materials via three-dimensional printing, Int. J. Adv. Manuf. Technol., 53, 231-239.
10. Yadroitsev I., Shishkovsky I., Bertrand P. and Smurov I. (2009), Manufacturing of fine-
structured 3D porous filter elements by selective laser melting, Applied Surface Science, 255, 5523-
5527.
11. Tan Y., Kiekens K., Kruth J.P., Voet A. and Dewulf W. (2011), Material Dependent Thresholding
for Dimensional X-ray Computed Tomography. Intern. Symp. on Digital Industrial Radiology and
Computed Tomography, Berlin, Germany, 20–22 June.
Acknowledgements
The high flow filter design prototype development was supported by a Feasibility Study Grant
awarded by the Technology Strategy Board, UK. The integrated support and mesh filter
characterisation study was supported by an Innovation Voucher awarded by the Technology Strategy
Board, UK.

Chapter 12 APPENDIX B
Burns, N., Burns, M., Travis, D., Geekie, L. & Rennie, A.E.W. (2016). Desigining Advanced Filtration
Media through Metal Additive Manufacturing. Journal of Chemical Engineering & Technology, 39 (3),
535-542.

112

Reprint 3/2016

Research Article 535
www.cet-journal.com
Neil Burns1,2 Mark
Burns1
Darren Travis1
Louise Geekie1
Allan E. W. Rennie2
1Croft Additive Manufacturing
Limited, Risley Warrington,
UK.
2Engineering Department,
University of Lancaster,
Bailrigg, Lancaster, UK.
Designing
Advanced
Filtration Media through Metal Additive Manufacturing
Traditional metal filters are manufactured from perforated plate which forms the filter support to withstand operational pressures and one or more layers of woven wire mesh to form the filter portion at the required level of filtration. The design freedoms and capabilities of additive manufacturing (AM) technology provide the opportunity to design novel filter media with integrated support and filter portions that have defined aperture size and strand diameter. Maximizing the open area of a filter increases filtration efficiency. AM integrated filter support and filter portion designs were optimized and the resultant filter media discussed have the potential to decrease the end users’ pumping energy requirements and so reduce energy costs and the inherent carbon footprint.
Keywords: Additive manufacturing, Filter media, Metal 3D printing, Metal filters
Received: June 22, 2015; revised: November 17, 2015; accepted: December 16, 2015
1 Introduction
1.1 General Remarks
Many industrial processes pump fluid, liquid or gas as part of their
production cycle and employ filtration as a critical part of the
process to separate solids from fluids, with oversized particles
being retained by the filtration media. The overall shape and size
of metal filters is controlled by the end users’ filtration
requirements, which determines the aperture size and
considerations such as space available and operational pressures.
In general, for coarse filtration, screens and filters manufactured
with wedge wire or a sieve formed from perforated plate or single
layer of woven wire mesh is used to retain the relatively large
particulates. For finer filtration, the aperture size in the filtration
media decreases and can range from millimeters, to micrometers,
to the nanometer ranges. However, finer woven wire mesh alone can become distorted
or damaged under operational flow rates and pressure [1, 2].
Thus, traditionally, metal filtration media are manufactured from
two or more layers. A filter support is made from perforated plate
with larger hole sizes, with a layer of woven wire mesh with
suitable aperture size placed on the outside or the inside to form
the filter portion. An additional layer of woven wire mesh with an
intermediate aperture size to the support and filter mesh layer is
placed between the layers to encourage fluid flow towards the
filter support after passing the filter mesh in the assembled
filtration component. Planar filters are constructed from one or
more layers of woven wire mesh or perforated plate, whereas a
filter medium that captures and
–
Correspondence: Neil Burns ([email protected]), Croft Additive Manufacturing Limited, Unit T1, Taylor Business Park, Risley Warrington, WA3 6BL, UK.
retains contaminants within irregular passages formed within
fibrous or granular media is known as a depth filter [2, 3]. Filtration level is dependent on the total open area of the
filter, as determined by the length available, desired filter
aperture size [4], and method of construction with overall
filter efficiency determined by the operating conditions.
When a filter is placed in a conduit, it forms a barrier and
thus creates resistance due to the pressure differential
across the filter, with fluid flowing from high to low
pressure across the filter. The pressure drop across a filter
is dependent on the flow rate of the fluid and the amount
of resistance that the filter type exerts on the fluid. When
moving fluid within a pumping/filtration system, more
energy is required at increasing flow rates to overcome the
filter’s inherent resistance. In 2007, 13 % of the UK’s industrial electricity usage was
for pumping requirements, equivalent to 44.8 million MWh
per year, equating to 6 % of the UK’s carbon footprint (30
million tons per year) [5]. By optimizing the fluid flow,
minimizing the turbulence produced, and in so doing
decreasing the pressure drop across a filter, the resultant
would be a more efficient filtration system. This increase in
efficiency would in turn lead to a decrease in pumping
energy required and so reducing the end users’ energy
costs and carbon footprint.
1.2
Woven Wire Mesh
Woven wire mesh is manufactured from drawn wire and its
many forms of construction can deliver a wide range of
DOI: 10.1002/ceat.201500353

Research Article 536
aperture sizes and values of open area. Woven wire cloth
manufacturers fabricate their wire cloth and provide the
weave specifications according to ISO 9044 [6]. Woven wire
mesh is manufactured in both imperial and metric
dimensions [7], with the level of filtration determined by
the size of the apertures. The total area of the pores, i.e.,
the open space in a filter, is the sum of the individual pore
areas, known as the open area, and is usually expressed as
a percentage.
1.3 Aperture Size
Woven wire mesh cloth is formed by weaving: (i) the warp
wires – wires running lengthwise as woven; and (ii) the
weft wires – wires running across the cloth as woven. The
shape of the aperture can be altered by controlling the
distance between equal diameter warp and weft wires.
More complex weaves can be formed by altering the
number of successive strands that the warp and weft
fibers pass over and under in a staggered manner such as
in a twill weave [2, 7]. The aperture size of plain weave
woven wire mesh cloth is measured as the aperture
width, with the distance being between two adjacent
warp or weft wires, measured in the projected plane at
the mid positions and the wire diameter is the diameter
of the wire (Fig. 1).
Figure 1. Plain woven wire mesh: gray. Aperture size: white arrows. Wire diameter: white bar. Open area: black.
The number of apertures in the woven wire mesh cloth
can be expressed per unit length (units can be expressed
in inches or centimeters), although aperture size is
commonly expressed in metric format [7]. However, the
open area of the mesh, for a given number of apertures
per unit length, is dependent on the wire diameter. For
example, a mesh commonly siderations in selection of filtration media. As described above,
woven mesh cloth can have an increase in open area through a
reduction in wire diameter, which in turn decreases the overall
strength of the mesh cloth. An ideal filter would have the maximum
open area possible to minimize the filters’ resistance when in situ
in the conduit. Therefore, for some filter media the open area must
be compromised to deliver the required operational strength. Both
the perforated plate and the woven wire mesh are planar, with an
x- and y-plane. The design freedoms and capabilities of additive
manufacturing (AM) technology, which manufactures components
layer by layer, offers the opportunity to create components with
complex 3D geometries. Novel AM filter designs can be created to
address reduction in the pressure drop across the filter and the
potential for a leaner manufacturing process. Metallic AM
technology, therefore, has the capability to produce novel filter
media that are depth filters with x-, y- and z-planes with both
integrated support and filter portions. For the AM integrated filter design, the filter mesh has a defined
aperture size and by reducing the equivalent wire diameter, these
novel filter media have a greater open area compared to the
equivalent woven wire mesh. This potentially diminishes the
pressure drop across the filter and so reduces pumping energy
requirements. In preliminary studies, AM filter media have been
designed using a repeating node unit to form the latticework of the
filters. Previous test samples demonstrated that this AM integrated
filter support and filter portion design decreased the pressure drop
across the filter compared to conventional filter design [8]. The
integrated support and AM filter portion has the potential to offer
energy cost savings. However, whilst the uniform node design
provides the AM filter with strength, decreasing the node size
greatly reduces the open area [8]. The aim is to develop the integrated support and filter AM design
to incorporate different sizes of repeating nodes, with a larger node
providing strength and the smaller node providing the filtration
level (Fig. 2). Two node structures were developed to deliver two
latticeworks: one with a 1000 mm aperture and the other with 500
mm aperture. Filter disks comprising of one,
employed in filtration media, #18
mesh, has 18 apertures per inch. For
#18 mesh with a wire diameter of 340
mm and aperture size 1065 mm, the
open area is 57 %. In contrast, a #18
mesh with aperture size 994 mm and
wire diameter 417 mm has an open
area of 50 %; for aperture size 954
mm and 475 mm wire diameter the
open area is 46 %. In general for mesh
cloth with an equal number of
apertures per unit length, reduction
in wire diameter increases the aperture size and the open area.
1.4 Additive Manufacturing and Filtration Media Design
For the end user, the level of filtration, i.e., the aperture size, is one of the prime
con-

Research Article 537
Figure 2. Schematic diagram of the cross-sectional view of an integrated support and filter AM design with (a) one-size apertures formed from a single repeating node and (b), (c) two sizes of apertures formed from two differently sized repeating nodes. Here, the filter support and the filter portion are integrated together as a single unit whereas in conventionally manufactured filters the filter support (perforated plate) and filter portion (mesh) are welded together to form the filter. In (a) the repeating nodes form both the filter support and filtration portion. In (b) the larger repeating node (dashed lines on outside (O)) provides support as well as increasing the open area of the filter and the smaller repeating node on the inside (I) forms the filtration portion. (c) The larger repeating node is on the inside with the smaller repeating node on the outside. The size of the apertures can be altered to suit the required filtration level. F: flange, O: outside I: Inside.
two, and three layers of the individual nodes were tested for strength by collapse pressure.
Filter discs and conical filters were designed and tested for each individual node and for
conical filters, a combination of nodes, i.e., layer of 500 and 1000 mm. This combination of
node sizes should deliver an increase in open area and maintain strength. The AM
integrated filter supports and filter portion conical filters were tested for strength: collapse
pressure and their pressure drop.
2 Materials and Methods
2.1 AM Build and Component Tensile Strength
Figure 3. Photographs of AM integrated filter support and filter. (a) Example of 32-mm diameter AM conical filter outer layer AM 500 mm; (b) inner layer 1000 mm-H. Higher resolution photo of repeating node latticework of (b) 1000 mm-H and (c) AM 500 mm node of the dual aperture AM filter.
All AM filter components described were manufactured on a
Realizer 250 SLM AM machine (SLM: selective laser melting;
Realizer GmbH, Germany) in stainless steel 316L (SS316L; LPW
Technology Ltd, UK). The powder particle size range is 15–45
mm, with a monomodal distribution. Outsized particles are
removed from the SS316L powder stock by the internal sieving
station in the Realizer machine before the build commences.
Standard tensile test bars with an overall length of 37.4 mm
consisted of a circular cross section with 5 mm diameter, two
plain shoulders of 5.1 mm length and 7.9 mm diameter with an
inter-shoulder distance of 27.2 mm were made in SS316L using
four different material files (n = 5, per group). The values for laser power, exposure time, and the point
distance for each group were as follows. F1: 1.6 W, 20 ms, 40
mm; M2: 1.8 W, 40 ms, 40 mm; D1: 2.0 W, 40 ms, 40 mm; and
T9: 1.3 W, 60 ms, 20 mm. The tensile test bar build plate
positions are described as in standard F2971-13 [9] and given
in Tab. 1. All the test specimens were built vertically (z-axis).
The tensile strength of each test bar was determined on a
Zwick/Roell Z020 (Herefordshire, UK), in accordance with the
standards ISO 68921:2009 and F3122-14 [10, 11] and the
results recorded.
2.2 AM Integrated Filter Design
An AM integrated filter design was created using a repeating
node unit to form the latticework of the AM filter as a single
unit (Figs. 2, 3). A previous test series comprising of AM filters
with different node sizes [8] had demonstrated that as the
node size decreased, the pressure drop across the filter
increased reflecting the reduction in open area of the AM
depth filters. The SLM process will produce a geometry that
slightly differs to that of the original CAD model due to the
nature of fabrication of the AM process [12]. An analysis of the
CAD to AM filter component dimensions from the previous
study led to the redesign of the repeating node unit used here
so that the AM component dimensions reflected more
accurately the CAD dimensions. Two commonly used sizes of woven wire mesh were
selected: conventional #18 mesh, i.e., aperture size 1065 mm,
wire diameter 340 mm, open area 57 %, and conventional #32
mesh, i.e., aperture size 519 mm, wire diameter 274 mm, open
area 43 %. Two AM filter nodes were designed to have aperture
size 1000 mm and one node to have 500 mm. Two strand sizes
were used for the 1000 mm aperture size for strength
comparison and two designs increased the open area
compared to the comparable conventional mesh (Tab. 2).
2.3 AM Integrated Filters
a) b) c)
a) b) c)
d)

Research Article 538
Filter discs containing one, two or three layers of each of the
newly designed nodes were built in SS316L (Fig. 4). The laser
parameters used were: laser power 1.8 W, exposure time 40
ms, and point distance 40 mm. The discs were built vertically
(z-axis), X+75" in the following positions on the build plate. One
layer 1000 mm-H: 63, –74,19; 76, –74,19; 90, –74,19, one layer
1000 mm-F: –102, –71,19; –87, –71,19; –72, –71,19, and
Table 1. Placement of the vertically built standard tensile test bars on the build plate for each of the four material files used: T2, F1, D1, and M2. x, y and z coordinates (mm).
T2 Placement (x, y, z) F1 Placement (x, y, z) D1 Placement (x, y, z) M2 Placement (x, y, z)
1 –100, 100, 18.7 1 100, 100, 18.7 1 –100, –100, 18.7 1 100, –100, 18.7
2 –20, 100, 18.7 2 20, 100, 18.7 2 –20, –100, 18.7 2 20, –100, 18.7
3 –55, 55, 18.7 3 55, 55, 18.7 3 –55, –55, 18.7 3 55, –55, 18.7
4 –100, 20, 18.7 4 100, 20, 18.7 4 –100, –20, 18.7 4 100, –20, 18.7
5 –20, 20, 18.7 5 20,20, 18.7 5 –20, –20, 18.7 5 20, –20, 18.7
Table 2. Woven wire cloth specifications for #18 and #32 mesh, respectively, and the CAD design specifications for the AM 1000 mm and AM 500 mm equivalents.
Aperture size [mm] Wire diameter [mm] Open area [%] Weave type
Conventional #18 mesh 1065 340 57 Plain woven wire mesh
AM design 1000 mm 1000 300 59.2 Latticework formed from repeating nodes
Conventional #32 mesh 519 274 43 Plain woven wire mesh
AM design 500 mm 500 250 44.4 Latticework formed from repeating nodes
Figure 4. Photomicrographs of AM 500 mm filter discs with one, two or three layers of latticework.
one layer 500 mm: –18, –71,19; –4, –71,29; 10, –71,19.
Two layer 1000 mm-H: 54, –87,19; 65, –87,19; 97, –32,19,
two layer 1000 mm-F: 76, –87,19; 88, –87,19; 104, –87,19,
and two layer 500 mm: 69, –30,19; 78, –30,19; 86, –30,19. Three layer
1000 mm-H: 58, –30,19; 85,31,19; 100,31,19, three layer
1000 mm-F: 64,91,19; 80,91,19; 97,91,19, and three layer
500 mm: 59,31,19; 69,31,19; 85,87,19. The discs were removed from the build plate using a
conventional sawing process. The aperture size and strand
diameter of the lattice work for each of the AM designs,
1000 mm-H, 1000 mm-F and 500 mm, were measured for
each one layer filter disc (n = 20 for each dimension). The
light microscopy measurements were performed on a
calibrated visual capture system (Vision Z, UK) and the
results compared to the CAD dimensions. Conical filters were then built by AM in SS316L using
each of the single nodes, 1000 mm-H, 1000 mm-F and 500
mm alone. These latticeworks were then used to create
AM conical filters with two different node sizes combined,
an example of which is shown in Fig. 3. This incorporates a
larger node latticework with a smaller node latticework in
a single unit. The multinode latticework was then applied
to a rounded cone filter shape. The laser parameters used
were: laser power 1.8 W, exposure time 40 ms, and point
distance 40 mm. The AM filters were built vertically (Z), in the following
x, y and z positions on the build plate (mm). 1000 mm-H:
85,90, 29: 85,35,29; 85,18,29, 1000 mm-F: –91,90,29; –91,
40, 29; –91, –17,29, and 500 mm: –6,90,29; –6,37,29; –6, –
18,29. 1000 mm-H IN to 500 mm OUT: 0, –32,19; 0, –87,19, 500
mm IN to 1000 mm-H OUT: 0,88,19; 0,28,19, 1000 mm-F
IN to AM 500 mm OUT: –92,88,19; –92,28,19 and 500 mm
IN to 1000 mm-F OUT: –92, –32,19; –92, –87,19. After the
initial removal of powder from the build plate by the
internal Realizer vacuum cleaner, the powder retained
inside the conical filters was removed by vibration in a
sealed cabinet (in-house design: CAM Ltd). The AM conical
filters were removed from the build plate using
conventional sawing methods.
Research Article 539
2.4 AM Integrated Filters: Collapse Pressure and
Pressure Drop
A bespoke collapse pressure tester was built to test the AM
integrated filters. The AM filter and test membrane were inserted
into the tester. The system was filled with hydraulic fluid and the
pressure increased on one side by hydraulic hand pump. Collapse
pressure was read from the pressure gauge following structural
failure of the filter unit. The pressure drop across the AM filters was recorded on a flow
test rig (CAM Ltd, UK). The AM filters were placed in the test
chamber and water pumped through the filter. The flow rate was
increased in incremental steps from 70 to 250 L min–1 and the
pressure difference measured on the manometer for each step.
System accuracy was noted as ± 3 %.
3 Results and Discussion
3.1 AM Build
The SS316L powder used here has a monomodal distribution and
a size range of 15–45 mm where the smaller particles fill the
interstitial volume between the larger particle sizes to promote
layer filling and densification [13]. Sintered AM techniques can use
different metal powder size and range to deliver different densities
and porosities in the final component [14]. In SLM, the laser beam
rapidly heats the powder, the powder melts and shrinkage occurs,
from 60 % apparent powder density to ~ 100 % density [15]. The
heat transfer and fluid flow affect the size and shape of the weld
pool, which in turn can influence the grain growth and
microstructure of the AM component [15, 16]. Alterations in the
microstructure of AM parts can affect the yield strength, tensile
strength, and elongation, thus the mechanical properties obtained
with SLM may differ from conventionally produced bulk materials
[15, 17]. Therefore, the tensile strength of test bars that were
manufactured using different material files were tested to
determine the laser settings that resulted in tensile strengths
similar to that of conventionally produced SS in these AM discs and
filters. 3.2 Component Tensile Strength
Twenty tensile testing specimens were produced using four
different material definition files. These material definition files
differed in the values for laser power, exposure time, and the point
distance. The net effect of varying the power and duration of the
laser is to alter the amount of the SS316L powder that is melted to
form the weld pool at that particular laser-exposed area. Varying
the point distance, i.e., the distance between adjacent weld pools,
alters the area of overlap between melt pools. The effect of these
combined parameters is the total amount of welded SS316L
deposited in each layer of the build which may affect the overall
strength of the resultant component. Of the four material files tested, five samples per material file,
three resulted in average ultimate tensile strengths of 599 MPa for
T, 604 MPa for M, and 609 MPa for D and one material file, F, had
an average tensile strength of 250 MPa. Average yield strengths for
each material file used were M: 529 MPa, T: 528 MPa, D: 531 MPa,
and F: 219 MPa. This much reduced ultimate tensile strength and
yield strength was due to the short exposure time and reduced
laser power in the material file which resulted in a more porous
component. One material file that produced test samples with tensile
strength of SS316L was then used to build all the AM filter
components for subsequent testing. Here, the tensile strength
tests demonstrated that manipulation of AM build parameters can
directly affect the mechanical properties of test specimens and
thus some combinations of parameters can result in tensile
strengths similar to that seen in machined stainless steel whereas
other build parameter combinations can lead to properties that
are less than the comparative conventionally manufactured
specimens. These results demonstrate the build parameter range
that must be used to generate filter media which are of sufficient
structural integrity.
3.3 AM Integrated Filter Design
For each repeating node design AM filter discs were built in one,
two or three layers. Measurements of the aperture size and strand
diameter were made for each node and for each of the layer
designs. Using light microscopy, as the number of layers was more
than a single layer, there was an increase in the variation of the
measure aperture diameter and strand size. This was due to the
progressing depth of the filter where underlying areas overlap with
the upper structures being measured. Therefore, measurements
were made only for one-layer discs of each of the nodes. For the one-layer AM 1000 mm-H filter disc, the mean aperture
size was 984 ± 26 mm and the mean strand diameter was 422 ± 33
mm (n = 20). The one-layer AM 1000 mm-F filter disc had a mean
aperture size of 1092 ± 62 mm and mean strand diameter was 289
± 25 mm (n = 20). The AM 500 mm one-layer filter disc had a mean
aperture of 505 ± 28 mm and strand diameter of 265 ± 29 mm (n =
20). The nodes used for the AM filter disc were designed to have
aperture sizes of 500 and 1000 mm as found in #32 and #18 mesh,
respectively (Tab. 2), but with a decrease in ‘wire’ diameter to
increase the ratio of open area. For the 1000 mm-H filter disc, the CAD design was for a
1000 mm aperture and 400 mm strand size, and the AM
filter 1000 mm-H disc produced closely reflects these
values. The AM 1000 mm-F filter disc was designed to have
an aperture of 1000 mm and strand size of 300 mm and
was produced at aperture 1092 mm and strand diameter
289 mm. The 500 mm AM filter had an aperture size of 505
mm and strand diameter of 265 mm close to the 500 and
250 mm desired values, respectively (Tab. 3). CAD
dimensions and the new node design have delivered AM
repeating node latticeworks with consistent dimensions
for aperture size and strand size. Conventional woven wire mesh aperture size can vary
within a mesh size, quoted as holes per inch, due to the
variation in diameter of weft and warf strands in the weave
[6, 7]. The construction of woven pores has been shown to

Research Article 540
influence the fluid flow pattern, with plain weave having a
higher flow resistance compared to satin weave [18]. The
arrangement of the warp and weft fibers from the pore
geometry has been shown to affect the overall porosity of
the woven wire mesh [19]. The impact of woven wire mesh
pore geometry on filter resistance has been compared in
different weaves using mathematical models and practical
experiments [18, 19]. Simplification of the overall pore
geometry was intended, by arranging the poreforming
strands in linear planes, thereby establishing regular pore
diameters in the 3D latticework.
3.4 AM Integrated Filters: Collapse Pressure
In Fig. 3, the AM filter design has been built to highlight the
arrangement of two latticeworks formed using (1) a large
node and (2) a smaller node. The two latticeworks are
attached to each other to form a single unit. Ideally, the
fluid flow through these depth filters would be in through
the large node latticework and out through the smaller
node latticework. For some fluid processes, the flow can
be reversed with the flow entering through the filter
portion and exiting through the support portion, known as
‘OUT to IN’ filters. The AM conical filters can, therefore, be
constructed using a single node alone (1000 mm-H, 1000
mm-F and AM 500 mm: Fig. 2 a). The 1000 mm-H can be
combined with AM 500 mm in two orientations ‘1000 mm-
H IN to AM 500 mm OUT’ (Fig. 2 c) and
‘AM 500 mm IN to 1000 mm-H OUT’ (Fig. 2 b). The 1000 mm-F can also be
constructed in this manner to form ‘1000 mm-F IN to AM
500 mm OUT’ and ‘AM 500 mm IN to 1000 mm-F OUT’. All
of these AM filter types were tested for their collapse
pressure and the pressure drop in response to increasing
flow rates. The collapse pressure of one, two, and three layers of
AM filter discs composed of AM 500 mm was 12.0 ± 0.8,
18.6 ± 0.9, and 24.4 ± 3.4 bar, respectively. For 1000 mm-
F, one, two, and three layers collapse pressure was 11.6 ±
0.9, 14.0 ± 1.2, and 21.4 ± 0.9 bar, respectively, and for
1000 mm-H 23.8 ± 1.8, 36.8 ± 1.8, and 52.0 ± 2.0 bar,
respectively. The pressure gauge used records the
pressure in bar. Conventional #18 mesh comparable filter
disc collapsed at 31.6 ± 3.3 bar. For all groups, n = 5. For
each AM filter disc node type, the collapse pressure for
two layers and three layers was significantly greater than
that of a single-layer AM disc (t-test, p < 0.05), with the
collapse pressure for three layers being significantly
greater than that for two layers (t-test, p < 0.05). The 500
mm layer discs are stronger than the 1000 mm-F discs but
weaker than the 1000 mm-H AM discs. Conventional #18
mesh is significantly stronger than all 500 mm and 1000
mm-F discs but significantly less than the two- and three-
layer 1000 mm-H AM discs. As expected, the thinner
strands of the 1000 mm-F design reduced its strength
compared to the 1000 mm-H design. A higher number of
layers increases the overall strength of the filter discs. For AM conical filters, the respective collapse pressures are:
AM 1000 mm-F 10 bar; AM 1000 mm-H 24 bar, AM 500
mm 22 bar; 1000 mm-F IN to AM 500 mm OUT AM filter
17 bar; and OUT AM 500 mm to IN 1000 mm-F AM filter 20
bar, and 1000 mm-H IN to AM 500 mm OUT AM filter 32
bar; and OUT 1000 mm-H to IN AM 500 mm AM filter 29
bar. AM 1000 mm-F collapses at the lowest pressure, and
so has the lowest overall strength reflecting the large open
area in this filter design. AM 500 mm filter collapsed at the
highest pressure, and so had the greatest strength,
reflecting the increased density in the design compared to
AM 1000 mm. The collapse pressure of the ‘OUT to IN’ and
the ‘IN to OUT’ AM filters were in between those of the
filters with a single node repeated in the latticework. Varying the aperture size and strand size in AM integrated filters
can affect the overall strength of the filter media. By combining,
latticeworks containing two node sizes in adjoining layers, it is
possible to increase the strength of the integrated filter support
and filter portion AM filters. Manipulation of strand size and
aperture size using AM allows the creation of a filtration media
whose strength can be modulated to suit the required operational
pressures.
3.5 AM Integrated Filters: Pressure Drop
The pressure drop for each of the three single-node AM conical
filter types was recorded in response to stepwise increases in flow
rate on an in-house flow test rig. The pressure difference across
the filters was recorded for both forward and reverse flow. For the
AM filters constructed from single nodes alone, there was no
significant difference between the values for the forward flow and
reverse flow for the AM 500 mm and 1000 mm-H, whereas for the
1000 mm-F the forward flow pressure drop was significantly less
for all flow rates measured (RM ANOVA < p < 0.05). The results are
presented in Fig. 5.
Table 3. Target aperture and strand size and dimensions achieved for each repeating node AM latticework.
Target aperture size
[mm] Target strand size [mm] Measured aperture size
[mm] Measured strand diameter
[mm]
1000 mm-H one layer 1000 400 984.2 ± 26.3 422.5 ± 33.4
1000 mm-F one layer 1000 300 1092.0 ± 61.5 289.2 ± 24.7
AM 500 mm one layer 500 250 505.0 ± 27.6 265.1 ± 28.8

Research Article 541
The pressure drop across the AM 1000
mm-F filter was less than that across all
other single-node filter types tested for
all flow rates. The AM 500 mm filter had
the highest pressure drop for all flow
rates compared to the other single-node
AM filters. A conventional filter support
was attached to #18 mesh, 1000 mm
apertures and for the forward and
reverse flow the pressure drop across
the filter was not significantly different
for either flow direction nor significantly
different from the AM 500 mm filter. The
1000 mm-F and 1000 mm-H AM conical
fil- Figure 5. Graph of the recorded pressure drop across each of: 1) AM 500 mm; 2) AM 1000 mm-H; 3) AM 1000 mm-F; 4) 1000 mm mesh conventional conical filters for both forward flow (FF) and reverse flow (RF) in response to stepwise increases in flow rate (L min–1).
ters had significantly lower pressure drop for all
flow rates compared to the AM 500 mm filter and
meshed conventional filter (ANOVA < p < 0.05).
Increasing the open area to have approximately
1000 mm apertures in the depth integrated filter
support and filter portion provides significant
reductions in the resistance of the filter compared
to the conventional filter with 1000 mm mesh. The pressure drop was measured for increasing
flow rates for the AM integrated filters consisting
of two nodes arranged in both ‘OUT to IN’ and ‘IN
to OUT’ orientations (Fig. 6). For the ‘IN to OUT’
and ‘OUT to IN’ filters, the pressure drop across the
filters was an intermediate value to the AM filter
cones with only one node type present, although
these values were closer to those of the 500 mm
filter for all flow rates (see Fig. 5). This reflects the
inclusion of both the node types in a single conical
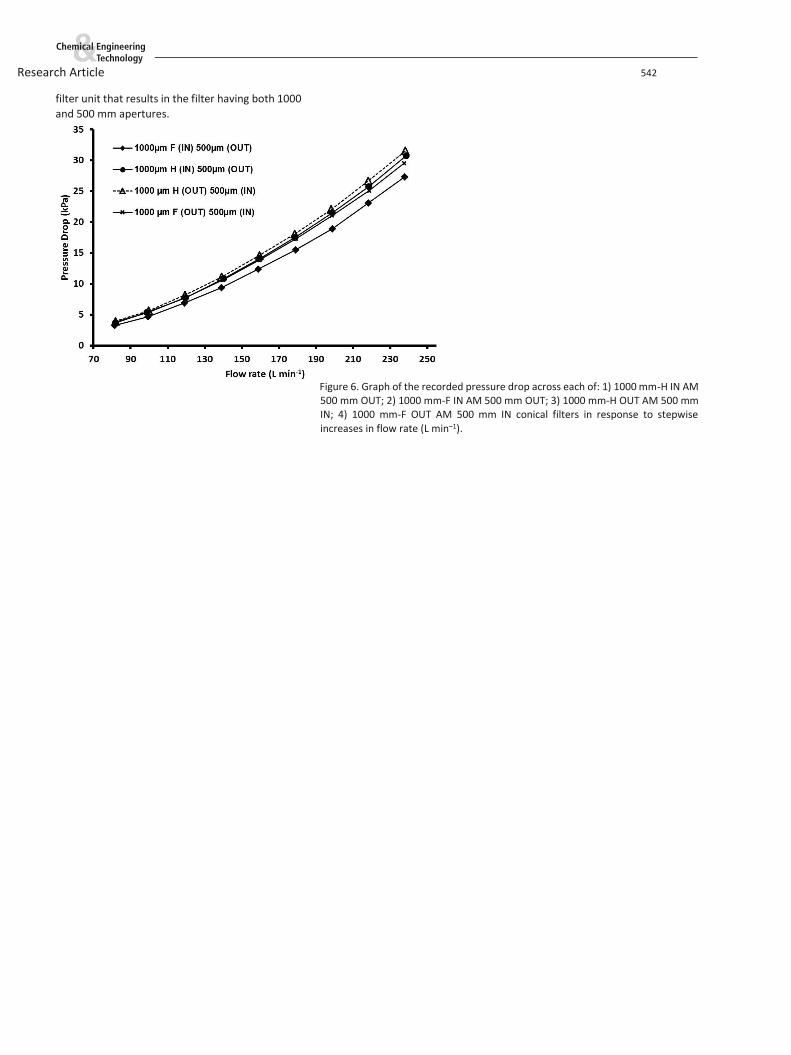
Research Article 542
filter unit that results in the filter having both 1000
and 500 mm apertures.
Figure 6. Graph of the recorded pressure drop across each of: 1) 1000 mm-H IN AM 500 mm OUT; 2) 1000 mm-F IN AM 500 mm OUT; 3) 1000 mm-H OUT AM 500 mm IN; 4) 1000 mm-F OUT AM 500 mm IN conical filters in response to stepwise increases in flow rate (L min–1).

4 Conclusions
The tensile strength tests demonstrated that the AM build
parameters used can directly affect the tensile strength. As the
build parameters for all filter test parts were the same, variation in
strength of the parts was due to the mechanical structure of each
individual component, perhaps relating to surface roughness or
other irregularities. AM technology has been successfully applied to create novel
filtration media with controlled aperture sizes. The repetition of a
single node has successfully delivered AM filter discs and AM filter
cones with a regular repeating structure of aperture size and
strand diameter. The overall strength of the AM conical filters incorporating this
combined filter support and filter portion is affected by the density
of the design that reflects the open area. The pressure drop
produced at increasing flow rates is dependent on the open area
with the single-node larger sized aperture AM filter having the
lowest pressure drop and the smaller sized aperture AM filter
having the highest pressure drop. For the AM integrated filter support and filter portion filters that
have both sizes of apertures arranged in either ‘IN to OUT’ or ‘OUT
to IN’, the pressure drop across these filter types is less than that
seen with 500 mm apertures alone. This suggests that the
combination of repeating nodes, of different sizes, in a latticework
can provide a filter that has a reduced pressure drop compared to
one with a single-node size. This filter type has the potential to
reduce the pumping energy requirements of the end user whilst
delivering the required filtration level. Further development and
optimization of these AM integrated filter support and filter
portion filters may lead to further energy savings.
Acknowledgment
Supported by the Innovate UK, formerly the Technology
Strategy Board, Launchpad Grant, UK, and MSc
Engineering (by Research) Programme, Lancaster
University, UK.
The authors have declared no conflict of interest.
References
[1] E. Glatt, S. Rief, A. Wiegmann, M. Knefe, E. Wegenke,
Fraunhofer ITWM, 2009, 157. [2] Standard E2016-06, Standard Specification for Industrial Woven
Wire Cloth, ASTM International, West Conshohocken, PA 2006.
www.astm.org, updated version E2016-11 available. [3] S. Tarleton, R. Wakeman, Dictionary of Filtration and
Separation, 1st ed., Filtration Solutions, Exeter 2008. [4] K. Brocklehurst, A. Hassall, G. Rideal, A. Stewart, Int. Filtr. News
2015, 34 (3), 34–39. [5] S. Schofield, J. Veness, UK Pump Market Study, The British Pump
Manufacturers Association, West Bromwich 2007.
www.bpma.org.uk
[6] ISO 9044:1999, Industrial Woven Wire Cloth – Technical
Requirements and Tests, International Organization for
Standardization, Geneva 1999. www.iso.org. [7] Woven Wire Cloth: Terminology, Types of Weave and
Apertures, Haver & Boecker, www.haverboecker.com,
(accessed on March 5th, 2015) [8] N. Burns, M. Burns, D. Travis, L. Geekie, A. Rennie, D. Weston, in
Proc. of American Filtration and Separations Society Fall Conf.,
AFS, Cincinnati, USA, 2013, 13. [9] ASTM F2971 – 13, Standard Practice for Reporting Data for Test
Specimens Prepared by Additive Manufacturing, ASTM
International, West Conshohocken, PA 2013, www.astm.org/
Standards/ F2971.htm [10] BS EN ISO 6892-1, 2009 Metallic Materials. Tensile Testing.
Method of Test at Ambient Temperature, British Standards Institution (BSI), London 2009. www.bisgroup.com
[11] F3122–14, Standard Guide for Evaluating Mechanical Properties
of Metal Materials Made via Additive Manufacturing Processes,
ASTM International, West Conshohocken, PA 2014.
www.astm.org/Standards/F3122.htm. [12] K. A. Mumtaz, N. Hopkinson, J. Mater. Process. Technol. 2010,
210, 279–287. DOI: 10.1016/j.jmatprotec.2009.09.011 [13] L. E. Murr, E. Martinez, K. N. Amato, S. M. Gaytan, J. Hernandez,
D. A. Ramirez, R. W. Shindo, F. Mediana, R. B. Wicker, J. Mater.
Res. Technol. 2012, 1 (1), 42–54. DOI: 10.1016/S2238-7854(12)70009-1
[14] B. Verlee, T. Dormal, J. Lecomte-Beckers, Powder Metall. 2010,
55, 260–267. DOI: 10.1179/0032589912X.0000000082 [15] J.-P. Kruth, M. Badrissamay, E. Yasa, J. Deckers, L. Thijs, J. Van
Humbeeck, in Proc, 16th Int. Symp. on Electromachining (ISEM
XVI), Shanghai Jiao Tong University Press, Shanghai 2010, 531–
537. [16] D. D. Gu, W. Meiners, K. Wissenbach, R. Poprawe, Int. Mater.
Rev. 2012, 57, 133–164. DOI: 10.1179/1743280411Y.
0000000014 [17] D. Gu, G. Zhang, Virtual Visual Prototyping 2013, 8 (1), 11–18.
DOI: 10.1080/17452759.2013.772319 [18] W. Lu, K. Tung, K. Hwang, Text. Res. J. 1996, 66 (5), 311–323.
DOI: 10.1177/004051759606600505 [19] A. Fischer, J. Gerstmann, in 5th Eur. Conf. for Aeronautics and
Space Sciences (EUCASS), Munich, July 2013, 1–12.

Chapter 13 APPENDIX C
Chapter 14 Grant Funding
Project Number: 101650. Title: Development of Novel In-House Testing Systems for Innovative
Additive Manufactured Filters. Supported by Technology Strategy Board (now Innovate UK).
Materials and Manufacturing Launchpad- Start Date: 01/12/2013 End Date: 31/05/15 Duration:
18 months Grant value: Eligible Costs- £102,314, Grant Value £61,388.00.
Project Number: 131850. Title: Development of Novel Abrasive Finishing Process to achieve Final
Net Shape of Complex Metal Additive Manufactured Components. Supported by Technology
Strategy Board (now Innovate UK). Mechanical Conversion Manufacturing Processes FS- Start
Date: 01/04/2015 End Date: 31/03/2016 Duration: 12 months Grant value: Eligible Costs-
£117,160, Grant Value £87,870.00.

Chapter 15 APPENDIX D Journal Paper (peer reviewed)
Burns, N, Burns, M, Travis, D, Geekie, L & Rennie, AEW 2016, 'Designing advanced filtration media
through metal additive manufacturing' Chemical Engineering and Technology, vol. 39, no. 3, pp.
535-542. https://doi.org/10.1002/ceat.201500353
Burns, N, Molyneux, A. and Geekie, L. 2016 Surface finishing of metal AM parts. In: Proceedings of
6th International Conference on Additive Technologies (Ed.): Proceedings of 6th International
Conference on Additive Technologies (iCAT 2016, Nürnberg, 29.-30.11.2016). 2016, pp 123-129
Vijayakumar B, Rennie A, Burns N, Travis D & Battersby P, 2014 Introducing Functionality to Filter
Media, Filtration, 14(4), 217-222.
Hasib, H, Rennie, AEW, Burns, N & Geekie, L 2016, 'Pressure Drop and Velocity Simulations in Non-
Stochastic Structures - Filters Fabricated by Additive Manufacturing' Filtration, vol. 16, no. 2, pp.
97-102.
Conference Paper (peer reviewed)
Vijayakumar B, Rennie AEW, Burns N, Burns M, Travis D & Battersby P, Introducing functionality
to filter media, Filter Media 6 International Conference and Exhibition, Chester, UK, November
2013.
Vijayakumar B, Rennie AEW, Burns N, Burns M, Travis D & Battersby P, Using additive
manufacturing to build energy efficient filter supports, International Conference on Additive
Manufacturing Technologies (AM 2013), Bangalore, India, October 2013.
Burns NR, Burns MA, Travis D, Geekie LE, Rennie AEW & Weston DP, Novel filter designs that
deliver filtration benefits produced by metal additive manufacturing (AM), American Filtration &
Separations Society Fall Conference: Innovation in Filter Media and Membranes, Cincinnati, Ohio,
USA, October 2013. P. 10/2013 Proceedings of AFS 2013 Fall Conference: Innovation in Filter
Media and Membranes. 13 p.

Burns NR, Geekie LE, Travis D & Burns MA, Innovations in Filtration through Additive
Manufacturing, Euro PM2014 Congress & Exhibition, Salzburg, Austria, 21-24th September 2014.
Burns NR, Vijayakumar B, Rennie AEW & Geekie L, Filtration efficiency gains by fabrication using
additive manufacturing, European Conference on Fluid-Particle Separation (FPS 2014), Lyon,
France, October 2014
Hasib, H, Rennie, AEW, Burns, N & Geekie, L 2015, 'Simulation of flow characteristics for filters
designed with a non-stochastic lattice structure fabricated via additive manufacturing' Paper
presented at 14th Rapid Design, Prototyping & Manufacturing Conference (RDPM2015),
Loughborough, UK, United Kingdom, 15/12/15 - 16/12/15, pp. 153-158.
Burns, N, Burns, M, Travis, D, Geekie, L & Rennie, A 2015, 'Designing advanced filtration media
through metal additive manufacturing' Paper presented at FILTECH: The Filtration Event,
Conference and Exhibition, Cologne, Germany, United Kingdom, 24/02/15 - 26/02/15.
Copyright © 2022 FDOKUMEN