Assessing function and endurance in adults with spinal and bulbar muscular atrophy: validity of the...
17
Research Article Assessing Function and Endurance in Adults with Spinal and Bulbar Muscular Atrophy: Validity of the Adult Myopathy Assessment Tool Michael O. Harris-Love, 1,2,3 Lindsay Fernandez-Rhodes, 4,5 Galen Joe, 3 Joseph A. Shrader, 3 Angela Kokkinis, 4 Alison La Pean Kirschner, 4,6 Sungyoung Auh, 7 Cheunju Chen, 4,8 Li Li, 3,9 Ellen Levy, 3 Todd E. Davenport, 10 Nicholas A. Di Prospero, 4 and Kenneth H. Fischbeck 4 1 Research Service/Geriatrics and Extended Care, Washington, DC Veterans Affairs Medical Center, 50 Irving Street, NW, Room 11G, Washington, DC 20422, USA 2 School of Public Health and Health Services, George Washington University, 2033 K Street, NW, Suite 210, Washington, DC 20006, USA 3 Rehabilitation Medicine Department, Clinical Center, Department of Health and Human Services (DHHS), National Institutes of Health (NIH), 10 Center Drive, Bethesda, MD 20892, USA 4 National Institute of Neurological Disorders and Stroke (NINDS), Neurogenetics Branch, Department of Health and Human Services (DHHS), National Institutes of Health (NIH), Building 35, Room 2A-1000, 35 Convent Drive, MSC 3705, Bethesda, MD 20892, USA 5 Department of Epidemiology, University of North Carolina at Chapel Hill Gillings, School of Global Public Health, 170 Rosenau Hall, Campus Box 7400, 135 Dauer Drive, Chapel Hill, NC 27599, USA 6 Center for Patient Care and Outcomes Research, Medical College of Wisconsin, 8701 Watertown Plank Road, Milwaukee, WI 53226, USA 7 Clinical Neurosciences Program, NINDS, NIH, 10 Center Drive, Room 5N230, Bethesda, MD 20814, USA 8 Neurology Department, University of Maryland, 110 South Paca Street, Baltimore, MD 21201, USA 9 Physical Medicine and Rehabilitation Service, Veterans Affairs Medical Center, 650 East Indian School Road, Phoenix AZ 85012, USA 10 Department of Physical erapy, omas J. Long School of Pharmacy & Health Sciences, University of the Pacific, 3601 Pacific Avenue, Stockton, CA 95211, USA Correspondence should be addressed to Michael O. Harris-Love; [email protected] Received 9 February 2014; Accepted 7 April 2014; Published 5 May 2014 Academic Editor: Jeffrey Jutai Copyright © 2014 Michael O. Harris-Love et al. is is an open access article distributed under the Creative Commons Attribution License, which permits unrestricted use, distribution, and reproduction in any medium, provided the original work is properly cited. Purpose. e adult myopathy assessment tool (AMAT) is a performance-based battery comprised of functional and endurance subscales that can be completed in approximately 30 minutes without the use of specialized equipment. e purpose of this study was to determine the construct validity and internal consistency of the AMAT with a sample of adults with spinal and bulbar muscular atrophy (SBMA). Methods. AMAT validity was assessed in 56-male participants with genetically confirmed SBMA (mean age, 53 ± 10 years). e participants completed the AMAT and assessments for disease status, strength, and functional status. Results. Lower AMAT scores were associated with longer disease duration ( = −0.29; < 0.03) and lower serum androgen levels ( = 0.49– 0.59; < 0.001). e AMAT was significantly correlated with strength and functional status ( = 0.82–0.88; < 0.001). e domains of the AMAT exhibited good internal consistency (Cronbach’s = 0.77–0.89; < 0.001). Conclusions. e AMAT is a standardized, performance-based tool that may be used to assess functional limitations and muscle endurance. e AMAT has good internal consistency, and the construct validity of the AMAT is supported by its significant associations with hormonal, strength, and functional characteristics of adults with SBMA. is trial is registered with Clinicaltrials.gov identifier NCT00303446. Hindawi Publishing Corporation Rehabilitation Research and Practice Volume 2014, Article ID 873872, 16 pages http://dx.doi.org/10.1155/2014/873872
Transcript of Assessing function and endurance in adults with spinal and bulbar muscular atrophy: validity of the...

Research ArticleAssessing Function and Endurance in Adults withSpinal and Bulbar Muscular Atrophy: Validity of the AdultMyopathy Assessment Tool
Michael O. Harris-Love,1,2,3 Lindsay Fernandez-Rhodes,4,5 Galen Joe,3
Joseph A. Shrader,3 Angela Kokkinis,4 Alison La Pean Kirschner,4,6
Sungyoung Auh,7 Cheunju Chen,4,8 Li Li,3,9 Ellen Levy,3 Todd E. Davenport,10
Nicholas A. Di Prospero,4 and Kenneth H. Fischbeck4
1 Research Service/Geriatrics and Extended Care, Washington, DC Veterans Affairs Medical Center, 50 Irving Street,NW, Room 11G, Washington, DC 20422, USA
2 School of Public Health and Health Services, George Washington University, 2033 K Street, NW, Suite 210,Washington, DC 20006, USA
3 Rehabilitation Medicine Department, Clinical Center, Department of Health and Human Services (DHHS),National Institutes of Health (NIH), 10 Center Drive, Bethesda, MD 20892, USA
4National Institute of Neurological Disorders and Stroke (NINDS), Neurogenetics Branch, Department ofHealth and Human Services (DHHS), National Institutes of Health (NIH), Building 35, Room 2A-1000, 35 Convent Drive,MSC 3705, Bethesda, MD 20892, USA
5Department of Epidemiology, University of North Carolina at Chapel Hill Gillings, School of Global Public Health,170 Rosenau Hall, Campus Box 7400, 135 Dauer Drive, Chapel Hill, NC 27599, USA
6Center for Patient Care and Outcomes Research, Medical College of Wisconsin, 8701 Watertown Plank Road,Milwaukee, WI 53226, USA
7Clinical Neurosciences Program, NINDS, NIH, 10 Center Drive, Room 5N230, Bethesda, MD 20814, USA8Neurology Department, University of Maryland, 110 South Paca Street, Baltimore, MD 21201, USA9Physical Medicine and Rehabilitation Service, Veterans Affairs Medical Center, 650 East Indian School Road,Phoenix AZ 85012, USA
10Department of Physical Therapy, Thomas J. Long School of Pharmacy & Health Sciences, University of the Pacific,3601 Pacific Avenue, Stockton, CA 95211, USA
Correspondence should be addressed to Michael O. Harris-Love; [email protected]
Received 9 February 2014; Accepted 7 April 2014; Published 5 May 2014
Academic Editor: Jeffrey Jutai
Copyright © 2014 Michael O. Harris-Love et al.This is an open access article distributed under the Creative Commons AttributionLicense, which permits unrestricted use, distribution, and reproduction in any medium, provided the original work is properlycited.
Purpose. The adult myopathy assessment tool (AMAT) is a performance-based battery comprised of functional and endurancesubscales that can be completed in approximately 30 minutes without the use of specialized equipment. The purpose of this studywas to determine the construct validity and internal consistency of the AMAT with a sample of adults with spinal and bulbarmuscular atrophy (SBMA).Methods. AMAT validity was assessed in 56-male participants with genetically confirmed SBMA (meanage, 53± 10 years).The participants completed theAMAT and assessments for disease status, strength, and functional status.Results.Lower AMAT scores were associatedwith longer disease duration (𝑟 = −0.29;𝑃 < 0.03) and lower serum androgen levels (𝑟 = 0.49–0.59; 𝑃 < 0.001). The AMAT was significantly correlated with strength and functional status (𝑟 = 0.82–0.88; 𝑃 < 0.001). Thedomains of the AMAT exhibited good internal consistency (Cronbach’s 𝛼= 0.77–0.89; 𝑃 < 0.001). Conclusions. The AMAT is astandardized, performance-based tool thatmay be used to assess functional limitations andmuscle endurance.TheAMAThas goodinternal consistency, and the construct validity of the AMAT is supported by its significant associations with hormonal, strength,and functional characteristics of adults with SBMA.This trial is registered with Clinicaltrials.gov identifier NCT00303446.
Hindawi Publishing CorporationRehabilitation Research and PracticeVolume 2014, Article ID 873872, 16 pageshttp://dx.doi.org/10.1155/2014/873872

2 Rehabilitation Research and Practice
1. Introduction
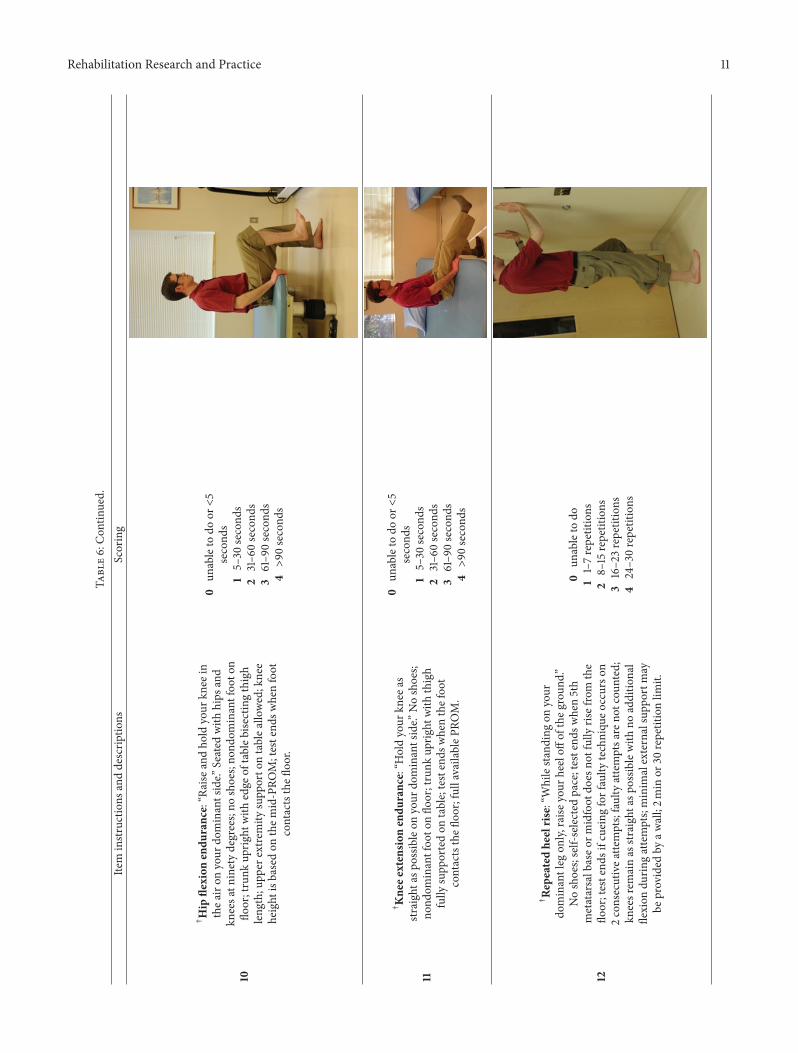
The adult myopathy assessment tool is a standardized,observed, physical performance test designed to be admin-istered relatively quickly in clinical and research settingswith common clinical equipment and minimal training (seeTable 6 for the list of the AMAT tasks and scoring criteria).The AMAT consists of a 13-item battery with an ordinalgrading scale for each item and a summated composite func-tional subscale (range = 0–21), endurance subscale (range =0–24), and total score (range = 0–45), where lower AMATsubscale scores and total score indicate decreased physicalperformance. The functional and endurance domains thatcomprise the AMAT reflect the contribution of impairedmuscle force on functional limitations [1–4] and incorporaterecent findings that physical performance in people with andwithout myopathy are also affected by excessive fatigue [5, 6].
The AMAT items include common movements found inother field tests and clinical assessments [7–13], and havebeen adapted to feature integrated timed and criterion-based scoring within discrete measurement domains (i.e.,functional and endurance AMAT subscales). In addition, thefunctional and endurance AMAT subscales are organized tobe congruent with the disability models proposed by boththe Institute of Medicine (IOM) [14] and the World HealthOrganization (WHO) [15]. The functional and endurancesubscales were combined for the total AMAT score to imbuethe assessment tool with important analytic advantagesspecifically in assessing patients with myopathy. A strictfunctional assessment battery based on the attainment ofa transfer or mobility task may exhibit a significant ceilingeffect (more than 15% of subjects attain the maximum score)if patients havemuscle force abovewhat is needed to completethe task for a single repetition. However, impairments inthese individuals could be revealed during amore demandingendurance task. In contrast, an endurance batterymay displaya significant floor effect (more than 15% of subjects attainthe minimum score) if patients do not have adequate musclecapacity to meet the criteria for a sustained or repetitivetask [16]. Yet, these same individuals may demonstrate therequisite strength to complete a single repetition of a lessdemanding functional task. Integrating these high and lowdemand tasks into the AMAT total score diminishes thepotential floor and ceiling effects of the assessment tool.Additionally, the AMAT items were sequenced to minimizethe effects of fatigue by avoiding consecutive endurancetests of a given agonist muscle group. This assessment wasalso designed to have clinical utility. Therefore, it may becompleted in 25–35 minutes and requires only commonequipment such as a stopwatch, adjustable height exami-nation table, standard stairs, and a goniometer. Moreover,the AMAT subscales and total score have been shownto have high interrater and intrarater reliability (ICC
2,1=
0.95–0.98, 𝑃 < 0.0001) [17].A sample of individuals with spinal and bulbar muscular
atrophy (SBMA or Kennedy disease), an X-linked degenera-tive neuromuscular disorder caused by a CAG trinucleotiderepeat expansion in the first exon of the androgen receptorgene (AR) [18], participated in this study. Briefly, SBMA is
characterized by muscle fasciculations and cramping, bulbarweakness that may result in dysphagia and dysarthria [19,20], and weakness of the proximal and distal muscles thatoften leads to impaired mobility and perceptions of excessivefatigue during upright mobility [19].This sample was initiallyrecruited for a larger clinical trial [21] andwas used as amodelof neuromuscular disease to help determine selected analyticproperties of the AMAT.
There are few standardized scales available for the assess-ment of impairments and functional limitations due toSBMA [19, 25]. Furthermore, self-report assessment toolsmaynot adequately capture observed functional performanceor physical status [26–28]. The purpose of this study wasto determine the construct validity of the AMAT for adultparticipants with SBMA disease. Secondary aims includeddetermining the internal consistency of the AMAT domainsand the relationship between functional AMAT subscaleitems and anatomic regional strength values. Our final aimwas to determine if AMAT cut scores can be defined to reflectsignificant differences in strength, activities of daily living(ADL), timed 2 min walk, or self-reported physical status.
2. Methods
2.1. Participants. Fifty-six subjects (mean age, 53 ± 10 years)were recruited to the National Institutes of Health (NIH)Clinical Research Center in Bethesda, MD, for the purposeof participating in a trial to examine the efficacy and safetyof dutasteride in SBMA [21, 29] (The trial is registered withClinicaltrials.gov identifier NCT00303446); all data wereobtained prospectively at the initial screening visit priorto the administration of dutasteride. Patient demographicinformation has been previously presented [29]. The studywas approved by the National Institute of Neurological Dis-orders and Stroke Institutional Review Board. Signed pho-tograph/recording release forms were obtained from healthyresearch volunteers in support of this project, and signedinformed consent was obtained from study participants inaccordance with the Declaration of Helsinki and Federal reg-ulations. Inclusion criteria included: genetically confirmedSBMA, neurological symptoms of SBMA, ability to walk 100feet with or without the use of an assistive device, male sex,and 18 years of age or older. Exclusion criteria included:female sex, less than 18 years of age, nonambulatory status,and any joint instability or other medical condition deemedby the investigators to pose an undue risk to participantsengaging in the performance-basedmeasures associated withthe study.
2.2. Genetic Testing and Serum Androgen Profile. Blood sam-ples were obtained after an overnight fast and processed in aCLIA-approved laboratory to assess androgen receptor geneCAG repeat length and serum androgen levels including totaltestosterone (TT), free testosterone (FT), and dihydrotestos-terone (DHT).
2.3. Quantitative Muscle Strength Testing. Isometric maxi-mal voluntary contraction (MVC) testing via quantitative

Rehabilitation Research and Practice 3
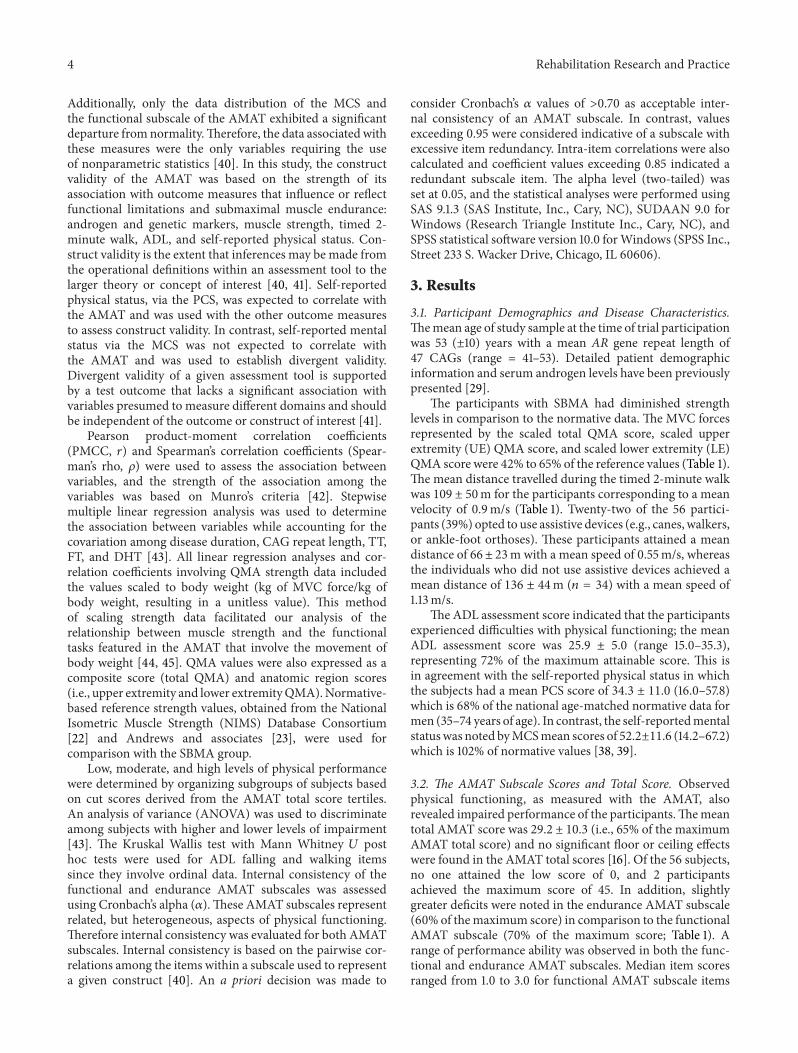
(a) (b)
Figure 1: Isometric maximal voluntary contraction testing via the quantitative muscle assessment device. (Participant positioning shown forthe: (a) hip extensors and (b) elbow flexors.)
muscle assessment (QMA) was used to measure peak forceof bilateral muscle groups. The muscle groups and testingpositions are listed in Table 7. All QMA tests were performedon a fixed-dynamometer (AEVERL Medical, LLC, P.O. Box170, Gainesville, GA 30503) using load cells (Interface, 7401East Butherus Drive, Scottsdale, AZ 85260) with computer-assisted data acquisition. The position of the strap (Figure 1)was adjusted to avoid contact with the participant and main-tain a parallel orientation to the force vector.The dynamome-ter was calibrated per manufacturer guidelines and resetto “zero” prior to each MVC attempt to account for thepassive force exerted against the strap. The mean value of thetwoMVC attempts was used for summation into a compositetotal score and anatomic region score (i.e., upper extremityand lower extremity).
2.4. Ambulation Status. Ambulation was assessed with the2-minute walk test [25–30]. The timed 2-minute walk testhas high reproducibility [30, 31] based on ICCs of 0.93.We administered 3 trials of the 2-minute walk test [32] aspreviously described [33], allowing for 2 practice trials beforerecording distance walked and gait speed. We comparedthe walk distance with the results of Selman and colleagues[24] to determine the predicted distance for age and gendermatched controls.
2.5. Activities of Daily Living and Self-Reported Health Status.ADL assessment was modified [21, 29] from the ADL surveyfrom the Friedreich ataxia rating scale (FARS) [34] bysubstituting a question about bladder control for one regard-ing difficulty with handwriting. While this questionnaireis validated for individuals with Friedreich ataxia [35], theADL items reflect many of the limitations experienced byindividuals with SBMA (i.e., walking, falling, swallowing,speech, dressing, personal hygiene, food handling and utensiluse, and sitting position quality).The ADL assessment scoreswere inverted for statistical analysis, producing an ordinal0–4 item scale (0 = maximum limitation; 4 = unaffected)and a summated composite total score of 36 (range = 0–36)with higher scores indicating increased levels of functioning.
“Walking” and “falling” were individual ADL assessmentitems selected for additional analyses to better understandtheir relationship with AMAT performance.
Modules from the Medical Outcomes Study 36-itemshort form (version 2) questionnaire (SF-36v2) were usedto obtain self-reported information on physical functioningand mental status. The SF-36v2 is a 36-item, 4-week recallhealth-related quality of life assessment that has been usedin multiple disorders and can be condensed into 2 summarymeasures: the physical component summary (PCS) and themental component summary (MCS) [36, 37]. Using theSAS code provided by QualityMetric Inc., raw scores wereconverted into normative-based scores with a mean score of50 (standard deviation, ±10). The scoring algorithms for allSF-36v2 scales and summaries are gender- and age-matchedand facilitate simple and valid comparisons between groups[38, 39].
2.6. Administration of the AMAT. A single physician withfive years of experience with the AMAT administered theobserved, physical performance test to the study participants.The test administrator issued instructions along with taskdemonstration for each AMAT activity before the partici-pants attempted a given task. In addition, all participantswereinformed of the criteria to end each task (see Table 6) andthe test administrator provided “standby” guarding to ensureparticipant safety during tasks requiring upright mobility.The participants were allowed a single attempt at completingeach AMAT task; however, additional task attempts wereallowed in the event of a procedural error during testing.The AMAT was initiated without warm up or preparatoryactivities and performed a minimum of 4 hours apart fromtheQMA and 2-minute walk test to avoid the negative impactof fatigue incurred from prior activity.
2.7. Data Analysis. Descriptive statistics were used to depictparticipant characteristics and all outcome measures. Alldata are expressed as means and standard deviations exceptindividual AMAT item scores. The ordinal item scores areshown as median values and the interquartile range (IQR).
4 Rehabilitation Research and Practice
Additionally, only the data distribution of the MCS andthe functional subscale of the AMAT exhibited a significantdeparture fromnormality.Therefore, the data associated withthese measures were the only variables requiring the useof nonparametric statistics [40]. In this study, the constructvalidity of the AMAT was based on the strength of itsassociation with outcome measures that influence or reflectfunctional limitations and submaximal muscle endurance:androgen and genetic markers, muscle strength, timed 2-minute walk, ADL, and self-reported physical status. Con-struct validity is the extent that inferences may be made fromthe operational definitions within an assessment tool to thelarger theory or concept of interest [40, 41]. Self-reportedphysical status, via the PCS, was expected to correlate withthe AMAT and was used with the other outcome measuresto assess construct validity. In contrast, self-reported mentalstatus via the MCS was not expected to correlate withthe AMAT and was used to establish divergent validity.Divergent validity of a given assessment tool is supportedby a test outcome that lacks a significant association withvariables presumed to measure different domains and shouldbe independent of the outcome or construct of interest [41].
Pearson product-moment correlation coefficients(PMCC, 𝑟) and Spearman’s correlation coefficients (Spear-man’s rho, 𝜌) were used to assess the association betweenvariables, and the strength of the association among thevariables was based on Munro’s criteria [42]. Stepwisemultiple linear regression analysis was used to determinethe association between variables while accounting for thecovariation among disease duration, CAG repeat length, TT,FT, and DHT [43]. All linear regression analyses and cor-relation coefficients involving QMA strength data includedthe values scaled to body weight (kg of MVC force/kg ofbody weight, resulting in a unitless value). This methodof scaling strength data facilitated our analysis of therelationship between muscle strength and the functionaltasks featured in the AMAT that involve the movement ofbody weight [44, 45]. QMA values were also expressed as acomposite score (total QMA) and anatomic region scores(i.e., upper extremity and lower extremityQMA).Normative-based reference strength values, obtained from the NationalIsometric Muscle Strength (NIMS) Database Consortium[22] and Andrews and associates [23], were used forcomparison with the SBMA group.
Low, moderate, and high levels of physical performancewere determined by organizing subgroups of subjects basedon cut scores derived from the AMAT total score tertiles.An analysis of variance (ANOVA) was used to discriminateamong subjects with higher and lower levels of impairment[43]. The Kruskal Wallis test with Mann Whitney 𝑈 posthoc tests were used for ADL falling and walking itemssince they involve ordinal data. Internal consistency of thefunctional and endurance AMAT subscales was assessedusing Cronbach’s alpha (𝛼).These AMAT subscales representrelated, but heterogeneous, aspects of physical functioning.Therefore internal consistency was evaluated for both AMATsubscales. Internal consistency is based on the pairwise cor-relations among the items within a subscale used to representa given construct [40]. An a priori decision was made to
consider Cronbach’s 𝛼 values of >0.70 as acceptable inter-nal consistency of an AMAT subscale. In contrast, valuesexceeding 0.95 were considered indicative of a subscale withexcessive item redundancy. Intra-item correlations were alsocalculated and coefficient values exceeding 0.85 indicated aredundant subscale item. The alpha level (two-tailed) wasset at 0.05, and the statistical analyses were performed usingSAS 9.1.3 (SAS Institute, Inc., Cary, NC), SUDAAN 9.0 forWindows (Research Triangle Institute Inc., Cary, NC), andSPSS statistical software version 10.0 forWindows (SPSS Inc.,Street 233 S. Wacker Drive, Chicago, IL 60606).
3. Results
3.1. Participant Demographics and Disease Characteristics.Themean age of study sample at the time of trial participationwas 53 (±10) years with a mean AR gene repeat length of47 CAGs (range = 41–53). Detailed patient demographicinformation and serum androgen levels have been previouslypresented [29].
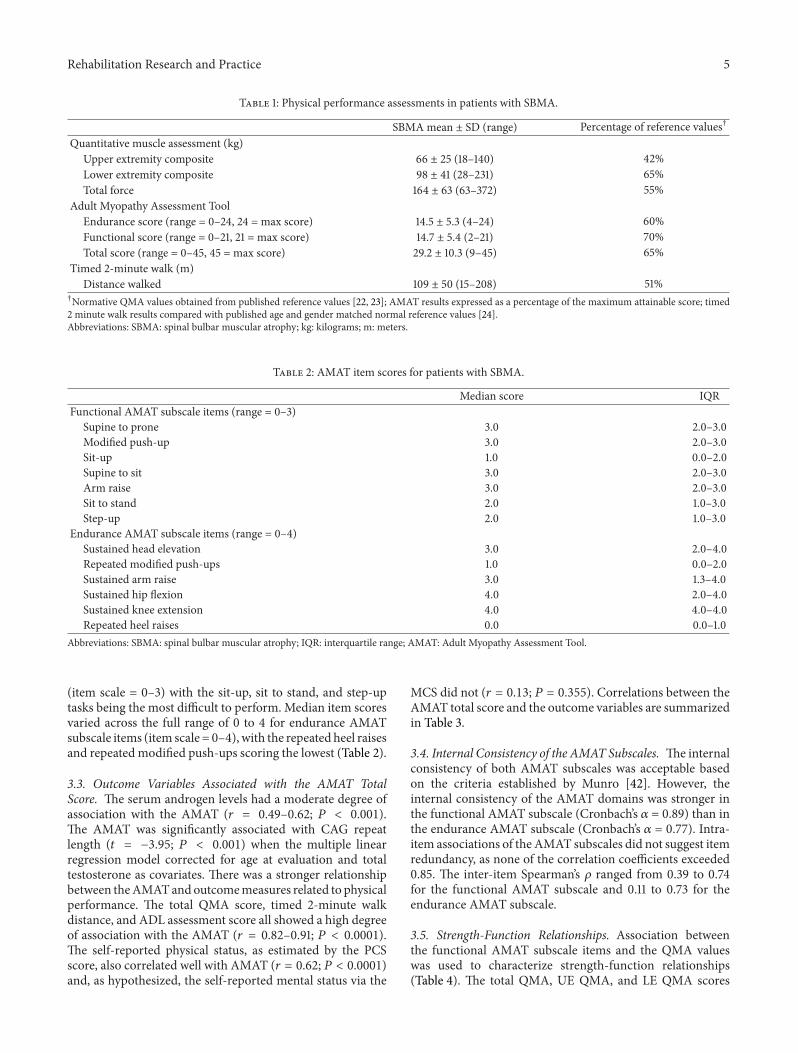
The participants with SBMA had diminished strengthlevels in comparison to the normative data. The MVC forcesrepresented by the scaled total QMA score, scaled upperextremity (UE) QMA score, and scaled lower extremity (LE)QMA score were 42% to 65% of the reference values (Table 1).The mean distance travelled during the timed 2-minute walkwas 109 ± 50m for the participants corresponding to a meanvelocity of 0.9m/s (Table 1). Twenty-two of the 56 partici-pants (39%) opted to use assistive devices (e.g., canes, walkers,or ankle-foot orthoses). These participants attained a meandistance of 66 ± 23mwith a mean speed of 0.55m/s, whereasthe individuals who did not use assistive devices achieved amean distance of 136 ± 44m (𝑛 = 34) with a mean speed of1.13m/s.
The ADL assessment score indicated that the participantsexperienced difficulties with physical functioning; the meanADL assessment score was 25.9 ± 5.0 (range 15.0–35.3),representing 72% of the maximum attainable score. This isin agreement with the self-reported physical status in whichthe subjects had a mean PCS score of 34.3 ± 11.0 (16.0–57.8)which is 68% of the national age-matched normative data formen (35–74 years of age). In contrast, the self-reportedmentalstatuswas noted byMCSmean scores of 52.2±11.6 (14.2–67.2)which is 102% of normative values [38, 39].
3.2. The AMAT Subscale Scores and Total Score. Observedphysical functioning, as measured with the AMAT, alsorevealed impaired performance of the participants.Themeantotal AMAT score was 29.2 ± 10.3 (i.e., 65% of the maximumAMAT total score) and no significant floor or ceiling effectswere found in the AMAT total scores [16]. Of the 56 subjects,no one attained the low score of 0, and 2 participantsachieved the maximum score of 45. In addition, slightlygreater deficits were noted in the endurance AMAT subscale(60% of themaximum score) in comparison to the functionalAMAT subscale (70% of the maximum score; Table 1). Arange of performance ability was observed in both the func-tional and endurance AMAT subscales. Median item scoresranged from 1.0 to 3.0 for functional AMAT subscale items
Rehabilitation Research and Practice 5
Table 1: Physical performance assessments in patients with SBMA.
SBMAmean ± SD (range) Percentage of reference values†
Quantitative muscle assessment (kg)Upper extremity composite 66 ± 25 (18–140) 42%Lower extremity composite 98 ± 41 (28–231) 65%Total force 164 ± 63 (63–372) 55%
Adult Myopathy Assessment ToolEndurance score (range = 0–24, 24 = max score) 14.5 ± 5.3 (4–24) 60%Functional score (range = 0–21, 21 = max score) 14.7 ± 5.4 (2–21) 70%Total score (range = 0–45, 45 = max score) 29.2 ± 10.3 (9–45) 65%
Timed 2-minute walk (m)Distance walked 109 ± 50 (15–208) 51%
†Normative QMA values obtained from published reference values [22, 23]; AMAT results expressed as a percentage of the maximum attainable score; timed2 minute walk results compared with published age and gender matched normal reference values [24].Abbreviations: SBMA: spinal bulbar muscular atrophy; kg: kilograms; m: meters.
Table 2: AMAT item scores for patients with SBMA.
Median score IQRFunctional AMAT subscale items (range = 0–3)
Supine to prone 3.0 2.0–3.0Modified push-up 3.0 2.0–3.0Sit-up 1.0 0.0–2.0Supine to sit 3.0 2.0–3.0Arm raise 3.0 2.0–3.0Sit to stand 2.0 1.0–3.0Step-up 2.0 1.0–3.0
Endurance AMAT subscale items (range = 0–4)Sustained head elevation 3.0 2.0–4.0Repeated modified push-ups 1.0 0.0–2.0Sustained arm raise 3.0 1.3–4.0Sustained hip flexion 4.0 2.0–4.0Sustained knee extension 4.0 4.0–4.0Repeated heel raises 0.0 0.0–1.0
Abbreviations: SBMA: spinal bulbar muscular atrophy; IQR: interquartile range; AMAT: Adult Myopathy Assessment Tool.
(item scale = 0–3) with the sit-up, sit to stand, and step-uptasks being the most difficult to perform. Median item scoresvaried across the full range of 0 to 4 for endurance AMATsubscale items (item scale = 0–4), with the repeated heel raisesand repeated modified push-ups scoring the lowest (Table 2).
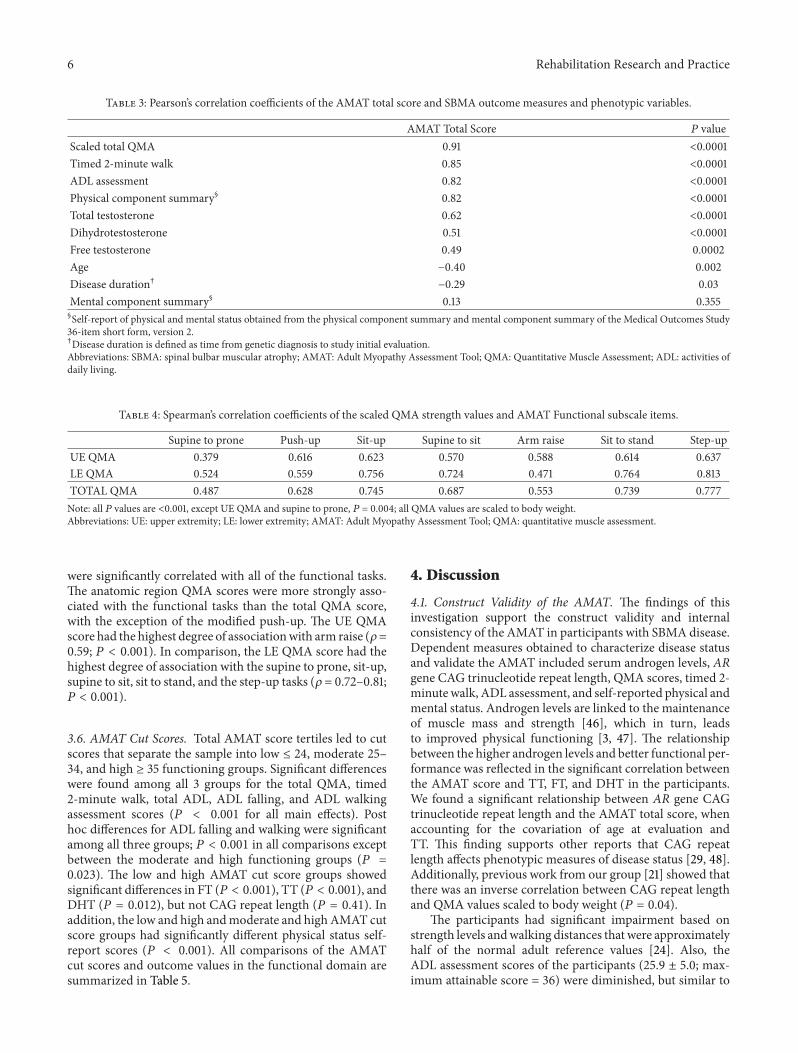
3.3. Outcome Variables Associated with the AMAT TotalScore. The serum androgen levels had a moderate degree ofassociation with the AMAT (𝑟 = 0.49–0.62; 𝑃 < 0.001).The AMAT was significantly associated with CAG repeatlength (𝑡 = −3.95; 𝑃 < 0.001) when the multiple linearregression model corrected for age at evaluation and totaltestosterone as covariates. There was a stronger relationshipbetween theAMATandoutcomemeasures related to physicalperformance. The total QMA score, timed 2-minute walkdistance, and ADL assessment score all showed a high degreeof association with the AMAT (𝑟 = 0.82–0.91; 𝑃 < 0.0001).The self-reported physical status, as estimated by the PCSscore, also correlated well with AMAT (𝑟 = 0.62; 𝑃 < 0.0001)and, as hypothesized, the self-reported mental status via the
MCS did not (𝑟 = 0.13; 𝑃 = 0.355). Correlations between theAMAT total score and the outcome variables are summarizedin Table 3.
3.4. Internal Consistency of the AMAT Subscales. The internalconsistency of both AMAT subscales was acceptable basedon the criteria established by Munro [42]. However, theinternal consistency of the AMAT domains was stronger inthe functional AMAT subscale (Cronbach’s 𝛼 = 0.89) than inthe endurance AMAT subscale (Cronbach’s 𝛼 = 0.77). Intra-item associations of the AMAT subscales did not suggest itemredundancy, as none of the correlation coefficients exceeded0.85. The inter-item Spearman’s 𝜌 ranged from 0.39 to 0.74for the functional AMAT subscale and 0.11 to 0.73 for theendurance AMAT subscale.
3.5. Strength-Function Relationships. Association betweenthe functional AMAT subscale items and the QMA valueswas used to characterize strength-function relationships(Table 4). The total QMA, UE QMA, and LE QMA scores
6 Rehabilitation Research and Practice
Table 3: Pearson’s correlation coefficients of the AMAT total score and SBMA outcome measures and phenotypic variables.
AMAT Total Score 𝑃 valueScaled total QMA 0.91 <0.0001Timed 2-minute walk 0.85 <0.0001ADL assessment 0.82 <0.0001Physical component summary§ 0.82 <0.0001Total testosterone 0.62 <0.0001Dihydrotestosterone 0.51 <0.0001Free testosterone 0.49 0.0002Age −0.40 0.002Disease duration† −0.29 0.03Mental component summary§ 0.13 0.355§Self-report of physical and mental status obtained from the physical component summary and mental component summary of the Medical Outcomes Study36-item short form, version 2.†Disease duration is defined as time from genetic diagnosis to study initial evaluation.Abbreviations: SBMA: spinal bulbar muscular atrophy; AMAT: Adult Myopathy Assessment Tool; QMA: Quantitative Muscle Assessment; ADL: activities ofdaily living.
Table 4: Spearman’s correlation coefficients of the scaled QMA strength values and AMAT Functional subscale items.
Supine to prone Push-up Sit-up Supine to sit Arm raise Sit to stand Step-upUE QMA 0.379 0.616 0.623 0.570 0.588 0.614 0.637LE QMA 0.524 0.559 0.756 0.724 0.471 0.764 0.813TOTAL QMA 0.487 0.628 0.745 0.687 0.553 0.739 0.777Note: all 𝑃 values are <0.001, except UE QMA and supine to prone, 𝑃 = 0.004; all QMA values are scaled to body weight.Abbreviations: UE: upper extremity; LE: lower extremity; AMAT: Adult Myopathy Assessment Tool; QMA: quantitative muscle assessment.
were significantly correlated with all of the functional tasks.The anatomic region QMA scores were more strongly asso-ciated with the functional tasks than the total QMA score,with the exception of the modified push-up. The UE QMAscore had the highest degree of associationwith arm raise (𝜌=0.59; 𝑃 < 0.001). In comparison, the LE QMA score had thehighest degree of association with the supine to prone, sit-up,supine to sit, sit to stand, and the step-up tasks (𝜌 = 0.72–0.81;𝑃 < 0.001).
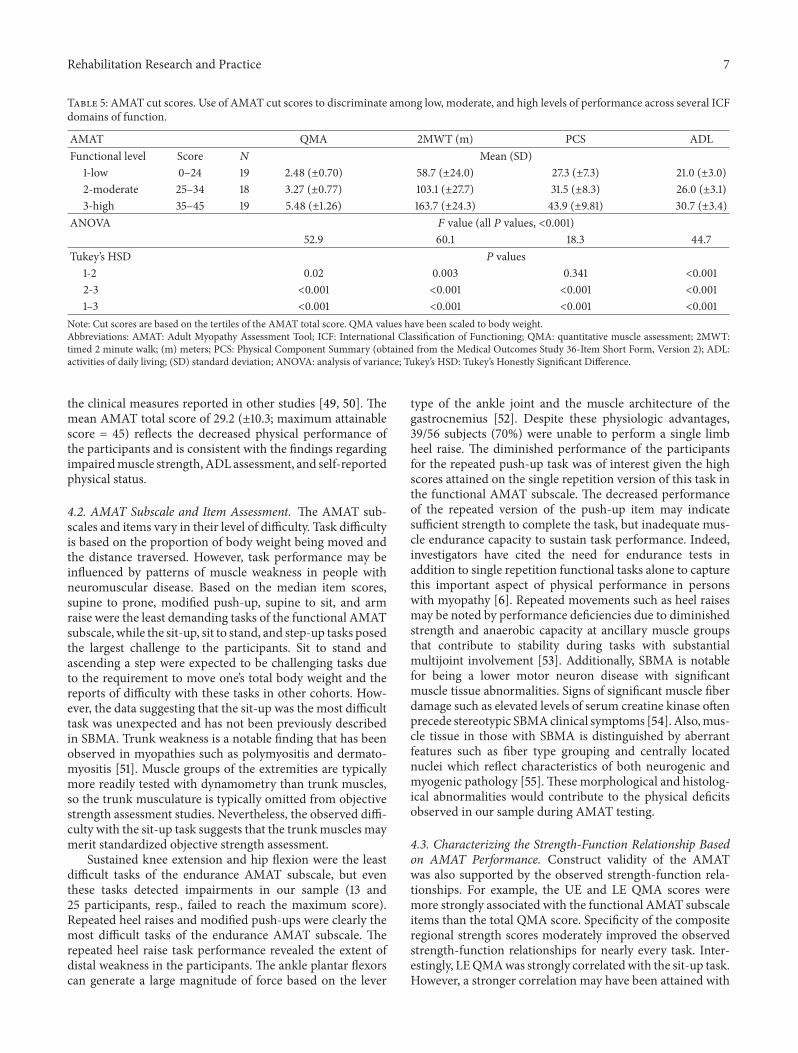
3.6. AMAT Cut Scores. Total AMAT score tertiles led to cutscores that separate the sample into low ≤ 24, moderate 25–34, and high ≥ 35 functioning groups. Significant differenceswere found among all 3 groups for the total QMA, timed2-minute walk, total ADL, ADL falling, and ADL walkingassessment scores (𝑃 < 0.001 for all main effects). Posthoc differences for ADL falling and walking were significantamong all three groups; 𝑃 < 0.001 in all comparisons exceptbetween the moderate and high functioning groups (𝑃 =0.023). The low and high AMAT cut score groups showedsignificant differences in FT (𝑃 < 0.001), TT (𝑃 < 0.001), andDHT (𝑃 = 0.012), but not CAG repeat length (𝑃 = 0.41). Inaddition, the low and high andmoderate and high AMAT cutscore groups had significantly different physical status self-report scores (𝑃 < 0.001). All comparisons of the AMATcut scores and outcome values in the functional domain aresummarized in Table 5.
4. Discussion
4.1. Construct Validity of the AMAT. The findings of thisinvestigation support the construct validity and internalconsistency of the AMAT in participants with SBMA disease.Dependent measures obtained to characterize disease statusand validate the AMAT included serum androgen levels, ARgene CAG trinucleotide repeat length, QMA scores, timed 2-minutewalk, ADL assessment, and self-reported physical andmental status. Androgen levels are linked to the maintenanceof muscle mass and strength [46], which in turn, leadsto improved physical functioning [3, 47]. The relationshipbetween the higher androgen levels and better functional per-formance was reflected in the significant correlation betweenthe AMAT score and TT, FT, and DHT in the participants.We found a significant relationship between AR gene CAGtrinucleotide repeat length and the AMAT total score, whenaccounting for the covariation of age at evaluation andTT. This finding supports other reports that CAG repeatlength affects phenotypic measures of disease status [29, 48].Additionally, previous work from our group [21] showed thatthere was an inverse correlation between CAG repeat lengthand QMA values scaled to body weight (𝑃 = 0.04).
The participants had significant impairment based onstrength levels andwalking distances that were approximatelyhalf of the normal adult reference values [24]. Also, theADL assessment scores of the participants (25.9 ± 5.0; max-imum attainable score = 36) were diminished, but similar to
Rehabilitation Research and Practice 7
Table 5: AMAT cut scores. Use of AMAT cut scores to discriminate among low, moderate, and high levels of performance across several ICFdomains of function.
AMAT QMA 2MWT (m) PCS ADLFunctional level Score 𝑁 Mean (SD)
1-low 0–24 19 2.48 (±0.70) 58.7 (±24.0) 27.3 (±7.3) 21.0 (±3.0)2-moderate 25–34 18 3.27 (±0.77) 103.1 (±27.7) 31.5 (±8.3) 26.0 (±3.1)3-high 35–45 19 5.48 (±1.26) 163.7 (±24.3) 43.9 (±9.81) 30.7 (±3.4)
ANOVA 𝐹 value (all 𝑃 values, <0.001)52.9 60.1 18.3 44.7
Tukey’s HSD 𝑃 values1-2 0.02 0.003 0.341 <0.0012-3 <0.001 <0.001 <0.001 <0.0011–3 <0.001 <0.001 <0.001 <0.001
Note: Cut scores are based on the tertiles of the AMAT total score. QMA values have been scaled to body weight.Abbreviations: AMAT: Adult Myopathy Assessment Tool; ICF: International Classification of Functioning; QMA: quantitative muscle assessment; 2MWT:timed 2 minute walk; (m) meters; PCS: Physical Component Summary (obtained from the Medical Outcomes Study 36-Item Short Form, Version 2); ADL:activities of daily living; (SD) standard deviation; ANOVA: analysis of variance; Tukey’s HSD: Tukey’s Honestly Significant Difference.
the clinical measures reported in other studies [49, 50]. Themean AMAT total score of 29.2 (±10.3; maximum attainablescore = 45) reflects the decreased physical performance ofthe participants and is consistent with the findings regardingimpairedmuscle strength,ADLassessment, and self-reportedphysical status.
4.2. AMAT Subscale and Item Assessment. The AMAT sub-scales and items vary in their level of difficulty. Task difficultyis based on the proportion of body weight being moved andthe distance traversed. However, task performance may beinfluenced by patterns of muscle weakness in people withneuromuscular disease. Based on the median item scores,supine to prone, modified push-up, supine to sit, and armraise were the least demanding tasks of the functional AMATsubscale, while the sit-up, sit to stand, and step-up tasks posedthe largest challenge to the participants. Sit to stand andascending a step were expected to be challenging tasks dueto the requirement to move one’s total body weight and thereports of difficulty with these tasks in other cohorts. How-ever, the data suggesting that the sit-up was the most difficulttask was unexpected and has not been previously describedin SBMA. Trunk weakness is a notable finding that has beenobserved in myopathies such as polymyositis and dermato-myositis [51]. Muscle groups of the extremities are typicallymore readily tested with dynamometry than trunk muscles,so the trunk musculature is typically omitted from objectivestrength assessment studies. Nevertheless, the observed diffi-culty with the sit-up task suggests that the trunkmuscles maymerit standardized objective strength assessment.
Sustained knee extension and hip flexion were the leastdifficult tasks of the endurance AMAT subscale, but eventhese tasks detected impairments in our sample (13 and25 participants, resp., failed to reach the maximum score).Repeated heel raises and modified push-ups were clearly themost difficult tasks of the endurance AMAT subscale. Therepeated heel raise task performance revealed the extent ofdistal weakness in the participants. The ankle plantar flexorscan generate a large magnitude of force based on the lever
type of the ankle joint and the muscle architecture of thegastrocnemius [52]. Despite these physiologic advantages,39/56 subjects (70%) were unable to perform a single limbheel raise. The diminished performance of the participantsfor the repeated push-up task was of interest given the highscores attained on the single repetition version of this task inthe functional AMAT subscale. The decreased performanceof the repeated version of the push-up item may indicatesufficient strength to complete the task, but inadequate mus-cle endurance capacity to sustain task performance. Indeed,investigators have cited the need for endurance tests inaddition to single repetition functional tasks alone to capturethis important aspect of physical performance in personswith myopathy [6]. Repeated movements such as heel raisesmay be noted by performance deficiencies due to diminishedstrength and anaerobic capacity at ancillary muscle groupsthat contribute to stability during tasks with substantialmultijoint involvement [53]. Additionally, SBMA is notablefor being a lower motor neuron disease with significantmuscle tissue abnormalities. Signs of significant muscle fiberdamage such as elevated levels of serum creatine kinase oftenprecede stereotypic SBMAclinical symptoms [54]. Also,mus-cle tissue in those with SBMA is distinguished by aberrantfeatures such as fiber type grouping and centrally locatednuclei which reflect characteristics of both neurogenic andmyogenic pathology [55].These morphological and histolog-ical abnormalities would contribute to the physical deficitsobserved in our sample during AMAT testing.
4.3. Characterizing the Strength-Function Relationship Basedon AMAT Performance. Construct validity of the AMATwas also supported by the observed strength-function rela-tionships. For example, the UE and LE QMA scores weremore strongly associated with the functional AMAT subscaleitems than the total QMA score. Specificity of the compositeregional strength scores moderately improved the observedstrength-function relationships for nearly every task. Inter-estingly, LEQMAwas strongly correlatedwith the sit-up task.However, a stronger correlation may have been attained with

8 Rehabilitation Research and Practice
Table6:Th
eadu
ltmyopathyassessmenttoo
l(AMAT
).
Item
instructions
anddescrip
tions
Scoring
1
†Headelevationendu
rance:“R
aise
your
head
offof
the
table.”
Patie
ntin
supine;patient
flexesh
eadandneck
forw
ardandattemptstomaintainself-selected
position;
testends
whenoccipu
ttou
ches
table.
0<5second
soru
nable
15–30
second
s2
31–6
0second
s3
61–9
0second
s4>90
second
s
2
Supine
topron
e:“R
ollontoyour
stomachwith
out
stopp
ingandplacey
oura
rmsa
tyou
rside.”
Patie
ntbegins
insupine
with
armsa
tside;testends
when
patie
ntispron
ewith
armsa
tside.
0>10
second
stoattempt
transfe
roru
nable
1completionin>6
second
s<10
second
sor
rolls
with
outfreeing
depend
entarm
2completionin>3
second
s≤6second
s3
completionin≤3
second
s
3
Mod
ified
push-up:
“Perform
apush-up
,end
ingwith
your
elbo
wsa
sstraightasp
ossib
le;you
rknees
will
touchthetabledu
ringthem
ovem
ent.”
Patie
ntbegins
with
hand
sfacingforw
ardon
tablew
itharm
in0
degreesa
bductio
n.
0un
ableto
do1
partialelbow
extension;
sternum
inpartial
contactw
ithtable
2partialelbow
extension;
sternum
NOTin
contactw
ithtable
3fullelb
owextension
achieved

Rehabilitation Research and Practice 9
Table6:Con
tinued.
Item
instructions
anddescrip
tions
Scoring
4
†Re
peated
mod
ified
push-up:
“Perform
asmany
push-ups
asyoucan,
ending
with
armsstraight,in
2minutes;you
rupp
erchestsho
uldtouchthetablewith
each
repetition.”
Patie
ntbegins
with
hand
sontablea
ndshou
ldersin0degreesa
bductio
n;self-selected
pace;
testends
ifcueing
forfaulty
techniqu
eoccurso
n2
consecutivea
ttempts;faultyattemptsa
reno
tcou
nted.
0un
ableto
do1
1–10
repetitions
211–
20repetitions
321–30repetitions
431–4
0repetitions
5
Sit-u
p:“Perform
asit-up
.”Patie
ntbegins
from
supine
positionwith
kneesfullyextend
edandwith
hand
son
thighs
oracrossabdo
men;testera
ppliesc
ounter
balancea
tdistallower
extre
mities
forg
rades0
–2.
0un
ableto
do1
scapulae
andT7
vertebra
notincontactw
ithtable
(rectusp
hase)w
ithcoun
ter
balance
2L1
vertebra
notin
contactw
ithtable:
completionof
fullsit-up
(hip
flexorp
hase)w
ithcoun
terb
alance
3completionof
fullsit-up
with
out
coun
terb
alance
6
Supine
tosit
:“Movetoas
ittingpo
sitionatthee
dgeo
fthetableas
quicklyas
youcan.”
Patie
ntbegins
from
supine
position,
legs
straight,andarmsa
tside.Test
ends
whenfeettouchthefl
oora
ndtorsoisvertical.
0≥12
second
stoattempt
transfe
roru
nable
1completionin>7and
<12
second
s2
completionin>4and≤7
second
s3
completionin≤4
second
s

10 Rehabilitation Research and Practice
Table6:Con
tinued.
Item
instructions
anddescrip
tions
Scoring
7
Arm
raise
:“Ra
isebo
thhand
sash
ighas
youcanabove
your
head
with
thee
lbow
sstraight.”
Com
pletew
ithin
availableP
ROM;app
lygradetoweakestup
per
extre
mity
ifasym
metry
ispresent.
0un
ableto
raise
armsto
levelofacrom
iocla
vicular
joint
1hand
sraisedbetween
acromiocla
vicularjoint
and
topof
head
2hand
sraisedabovetop
ofhead
with
outfull
elbow
extension
3hand
sraisedabovetop
ofhead
with
full
elbow
extension
8
†Arm
raise
endu
rance:“R
aise
both
hand
sforward
(sho
ulderfl
exion)
toeyelevelwith
elbo
wsstraight.”
Trun
kup
right
with
outh
yperextensionandbo
thfeet
flato
nflo
or;end
testifshou
lder
flexion
drop
sbelo
w90
degrees;applygradetoweakestup
pere
xtremity
ifasym
metry
ispresent.
0un
ableto
door<5
second
s1
5–30
second
s2
31–6
0second
s3
61–9
0second
s4>90
second
s
9
Sittostan
d:“Stand
upwith
aslittle
arm
supp
ortas
possible.”P
atient
seated
onexam
tablew
ithedge
bisectingthighleng
th,trunk
erect,lower
legs
vertical,
andkn
eesa
t90degreesm
easuredviag
oniometer;
contactb
etweenpo
sterio
raspecto
fthe
legs
andthe
tableisn
otallowed.
0un
ableto
do1
completes
transfe
rwith
twoor
more
extre
mities
incontactw
iththee
xam
tableo
rthigh
2completes
transfe
rwith
onee
xtremity
incontactw
iththee
xam
tableo
rthigh
3completes
transfe
rwith
outcon
tact
ofanyextre
mity
with
the
exam
tableo
rthigh
Rehabilitation Research and Practice 11
Table6:Con
tinued.
Item
instructions
anddescrip
tions
Scoring
10
†Hip
flexion
endu
rance:“R
aise
andho
ldyour
knee
inthea
iron
your
dominantside.”
Seated
with
hips
and
kneesa
tninetydegrees;no
shoes;no
ndom
inantfoo
ton
floor;trunk
uprig
htwith
edge
oftableb
isectingthigh
leng
th;upp
erextre
mity
supp
orto
ntablea
llowed;knee
height
isbasedon
them
id-PRO
M;testend
swhenfoot
contactsthefl
oor.
0un
ableto
door<5
second
s1
5–30
second
s2
31–6
0second
s3
61–9
0second
s4>90
second
s
11
†Kne
eextensio
nendu
rance:“H
oldyour
knee
asstraight
aspo
ssibleon
your
dominantside.”
Noshoes;
nond
ominantfoo
tonflo
or;trunk
uprig
htwith
thigh
fully
supp
ortedon
table;testends
whenthefoo
tcontactsthefl
oor;fullavailableP
ROM.
0un
ableto
door<5
second
s1
5–30
second
s2
31–6
0second
s3
61–9
0second
s4>90
second
s
12
†Re
peated
heelrise:“Whilesta
ndingon
your
dominantleg
only,
raise
your
heeloff
oftheg
roun
d.”Noshoes;self-selected
pace;testend
swhen5th
metatarsalbaseo
rmidfoot
does
notfullyris
efrom
the
floor;testend
sifcueingforfaulty
techniqu
eoccurso
n2consecutivea
ttempts;faultyattemptsa
reno
tcou
nted;
kneesrem
ainas
straightasp
ossib
lewith
noadditio
nal
flexion
durin
gattempts;minim
alexternalsupp
ortm
aybe
provided
byaw
all;2m
inor
30repetitionlim
it.
0un
ableto
do1
1–7repetitions
28–15
repetitions
316–23repetitions
424–30repetitions
12 Rehabilitation Research and Practice
Table6:Con
tinued.
Item
instructions
anddescrip
tions
Scoring
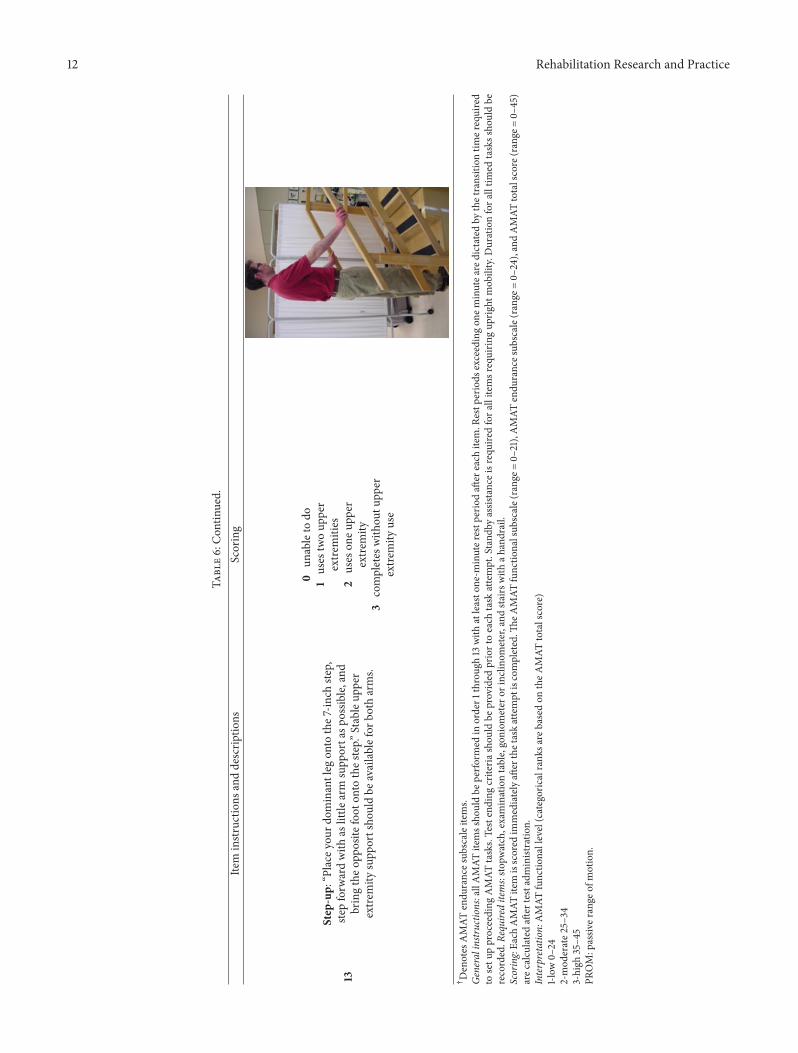
13
Step-up:
“Place
your
dominantleg
onto
the7
-inch
step,
stepforw
ardwith
aslittle
arm
supp
ortasp
ossib
le,and
bringtheo
pposite
foot
onto
thes
tep.”
Stableup
per
extre
mity
supp
ortsho
uldbe
availablefor
both
arms.
0un
ableto
do1
uses
twoup
per
extre
mities
2uses
oneu
pper
extre
mity
3completes
with
outu
pper
extre
mity
use
†Denotes
AMAT
endu
rances
ubscaleitems.
Generalinstr
uctio
ns:allAMAT
itemssho
uldbe
perfo
rmed
inorder1
throug
h13
with
atleasto
ne-m
inuter
estp
eriodaft
ereach
item.R
estp
eriods
exceedingon
eminutea
redictated
bythetransition
timer
equired
tosetu
pproceeding
AMAT
tasks.Testending
criteria
shou
ldbe
provided
priortoeach
task
attempt.Stand
byassistanceisrequiredfora
llitemsrequirin
gup
right
mob
ility.D
urationfora
lltim
edtaskssho
uldbe
recorded.R
equireditems:sto
pwatch,examinationtable,goniom
eter
orinclino
meter,and
stairswith
ahandrail.
Scoring:Ea
chAMAT
item
isscored
immediatelyaft
erthetaskattempt
iscompleted.Th
eAMAT
functio
nalsub
scale(rang
e=0–
21),AMAT
endu
rancesub
scale(rang
e=0–
24),andAMAT
totalscore(range
=0–
45)
arec
alculated
after
testadministratio
n.Interpretatio
n:AMAT
functio
nallevel(categoricalrank
sare
basedon
theA
MAT
totalscore)
1-low
0–24
2-mod
erate2
5–34
3-high
35–4
5PR
OM:passiv
erange
ofmotion.

Rehabilitation Research and Practice 13
Table 7:Quantitative assessment of peakmuscle force.The testedmuscle groups, subject testing position, and orientation of the dynamometerstrap are listed for the quantitative assessment of maximum isometric forceC using a fixed dynamometry load cell£.
Muscle group Patient position Strap positionUpper extremity
Lateral pinch Seated; elbow at 90∘; midrange supination/pronation None; pinch dynamometerHand grip Seated; elbow at 90∘; midrange supination/pronation None; hand grip dynamometer
Wrist flexors Seated; elbow at 90∘; midrange supination/pronation Ventral metacarpals with second stabilizing strap atdorsal proximal wrist
Elbow flexors Supine; elbow at 90∘; midrange supination/pronation Radial distal forearm proximal to wristElbow extensors Supine; elbow at 90∘; midrange supination/pronation Ulnar distal forearm proximal to wristShoulder abductors Supine; shoulder and elbow at 90∘ Lateral distal arm proximal to elbow
Lower extremityAnkle dorsiflexors Supine; ankle at 90∘ Around dorsal metatarsalsKnee extensors Seated; hip and knee at 90∘ Around ankle and proximal to malleolusHip flexors Supine; hip and knee at 90∘ Anterior distal femur and proximal to patellaHip extensors Supine; hip and knee at 90∘ Posterior distal femurHip abductors Seated; hip and knee at 90∘ Lateral distal femur
CAEVERL Medical, LLC P.O. Box 170 Gainesville, GA 30503.£Interface, 7401 East Butherus Drive, Scottsdale, AZ 85260.
a specific measure of trunk strength, which was not includedin this study. In addition, it is unclear why the total QMAscore was more strongly correlated to the modified push-up task than was the UE QMA score. The muscle groupsincluded in the composite UE QMA score did not includethe horizontal adductors of the humerus, and the addition ofthis group may have improved this relationship. Our resultsalso confirm the findings from other investigators regardingthe positive relationship between task difficulty and strength[56]. Among the most difficult AMAT functional tasks weresit to stand and step-up (median score = 2.0). The higheststrength-function correlations we observed involved taskswith a clear LE-bias ranging from 0.76 to 0.81. In contrast, thecorrelations for the UE-biased tasks ranged from 0.59 to 0.62.The large magnitude of association between muscle strengthand LE-biased tasks observed in this study is similar to thefindings of other studies of participants with neuromusculardisease [57].
4.4. Internal Consistency of the AMAT. While both AMATsubscales demonstrated good internal consistency, the func-tional subscale outperformed the endurance subscale. Frankmuscle weakness can confound attempts to measure muscleendurance. Repeated or sustained tasks are designed to mea-sure muscle endurance, but they also demand the requisitestrength to attain the testing position. The distal weaknessexhibited by the participants rendered the repeated heel raisetest, an endurance AMAT subscale item, a de facto functionaltest contingent on strength.Therefore, severe neuromusculardisease that yields specific muscle groups with frank weak-ness would cause a series of muscle endurance tests to bedivergent in their results, thus lowering the intercorrelationof the test items.
4.5. Utility of the AMAT: Cut Scores and Functional Per-formance Categories. The ability to derive meaning fromthe scores of a given outcome measure is a key arbiter of
assessment tool utility. The determination of AMAT cutscores revealed significant categorical differences in physicalperformance. These observed differences included strength,walking, total ADL, ADL falling, and self-reported physicalstatus. Participants categorized as having a “high” level offunctional performance were at least twice as strong as thosecategorized as having a “low” level of functional performance.Similarly, walking distance was nearly three times fartherin participants demonstrating a higher level of functionalperformance in comparison to people in the lowest functionalcategory.This sharp contrast in physical functioning suggeststhat the AMAT cut scores may reveal clinically meaningfuldifferences among the categorical groups. Clinicians mayfind that AMAT cut scores augment their ability to deter-mine when additional rehabilitative interventions or moredetailed assessments are indicated for patients with decliningphysical status. Moreover, AMAT cut scores may be usedby researchers as part of the inclusion or exclusion criteriaof a therapeutic trial, to aid group assignment based onthe severity of physical impairment or provide a criterionfor clinically meaningful improvement or worsening whenparticipant AMAT scores shift in categorical rank. Despitethe clear functional distinctions observed in the categoricalgrouping of our sample, additional study will be needed tobetter understand how the AMAT cut scores identified inthis study apply to other samples and patient populations.Myopathy is a broad category of pathology that encompassesmultiple neuromuscular disorders and myogenic diseases.Therefore, the AMATwas not created for the express purposeof assessing individuals with SBMA. Our preliminary datafrom previous and ongoing clinical studies suggest that theAMAT is a robust measure of physical performance in peoplewith inclusion body myositis and that clinicians exhibit ahigh degree of reliability scoring AMAT performances byindividuals with idiopathic inflammatory myopathies [17].
This performance-based test is intended for use by reha-bilitation practitioners such as physicians, therapists, and
14 Rehabilitation Research and Practice
nurses and may be conducted in physical therapy clinics,outpatient medical facilities, and rehabilitation units withina hospital setting. The emerging analytic properties of theAMAT, including the ability to monitor patient status overtime and observe meaningful shifts in the AMAT functionallevel (i.e., low, moderate, and high), are valuable features ofa test designed to characterize the physical performance ofpeople with chronic degenerative conditions. Our findings insupport of the construct validity and internal consistency ofthe AMAT complement our previous observations regardingthe ability of the AMAT to assess disease progression.Fernandez-Rhodes et al. [29] examined the efficacy andsafety of dutasteride in characterizing disease progressionover a 24-month period in the placebo-control SBMA groupwith a variety of secondary measures of impairment leveland physical status. Motor unit number estimation, mediancompound muscle action potentials, and total QMA scoredetected an annual rate of decline from 1.6% to 2.3%. Incontrast, the AMAT and the PCS score showed an annualdecline of 4.5% and 5.2%, respectively. However, of thesetwo measures, the AMAT was better at detecting a declinein physical status (𝑧 = 0.68, 𝑃 = 0.004 versus 𝑧 = 0.43,𝑃 = 0.054). Therefore, the AMAT may have utility in futureclinical trials based on its favorable “signal-to-noise” ratio.
5. Limitations
Although the findings support the construct validity andinternal consistency of the AMAT, this study had limitations.Our outcome measures did not include a direct measure ofmuscle endurance.While the capacity ofmuscles to exert sus-tained or repeated submaximal forces is consistent with therequirements ofADLperformance andmobility, validation ofthe endurance AMAT subscale would have been improved bycomparisons with an impairment-level measure of anaerobicendurance. The AMAT and other physical performance testshave important advantages over questionnaires regardingphysical functioning. Nonetheless, questionnaires such as theALSFRS-r incorporate important questions regarding bulbarmuscle function and various nonmusculoskeletal features ofALS and SBMA that are not included in the AMAT.While thepurpose and validity of the AMAT benefits from the integrityof its domains, other tests or questionnaires are requiredto address the consequences of neuromuscular disease thatgo beyond physical performance and mobility. Additionally,the cut scores used to categorize participants into AMATfunctional levels in this study yielded statistically significantdistinctions among the 3 subgroups. However, cut scoresbased on percentiles are dependent on the distribution ofscores within a given sample. An alternative approach wouldbe to use criterion-based cut scores derived from establishedmarkers of disablement. A successful implementation of thisapproach to cut scores and functional categories will require alarger sample size to allow for a sufficient allocation of peoplein each subgroup and ensure valid statistical comparisons.Finally, other analytic qualities, such as responsiveness, theminimal clinical important difference score, criterion validityof the endurance subscale, and discriminative validity using
normative reference data, need to be explored to fullyunderstand the clinical and research utility of the AMAT.
6. Conclusions
The AMAT is a standardized, performance-based tool thatassesses functional limitations and muscle endurance inadults with myopathy. Our findings suggest that the AMAThas excellent construct validity and good internal consistencyfor adults with SBMA based on its significant associationswith strength, objective and subjective physical performancemeasures, and self-reported physical status. The utility ofthe AMAT is further supported through the use of cutscores to characterize physical status based on low, moderate,or high levels of performance. These findings support theuse of the AMAT as both a clinical assessment tool andoutcomemeasure in future clinical trials of SBMA andmeritsfurther study in other adult-onset neuromuscular diseasepopulations.
Conflict of Interests
The authors declare that they have no conflict of interests.
Acknowledgments
The authors wish to thank the Intramural Research Pro-gram of the National Institutes of Health (NIH), NationalInstitute of Neurological Disorders and Stroke (NINDS),and Rehabilitation Medicine Department (RMD) of the NIHClinical Center for supporting this work. Please note that theopinions and information contained in this paper are thoseof the authors and do not necessarily reflect those of theDepartment of Veterans Affairs, National Institutes ofHealth,or the United States Public Health Service. Nicholas A. DiProspero is currently an employee of Johnson and Johnson,LLC.
References
[1] M. Manty, C. F. de Leon, T. Rantanen et al., “Mobility-relatedfatigue, walking speed, and muscle strength in older people,”The Journals of Gerontology A, Biological Sciences and MedicalSciences, vol. 67, no. 5, pp. 523–529, 2012.
[2] T. Rantanen, J. M. Guralnik, S. Leveille et al., “Racial differencesin muscle strength in disabled older women,” Journals ofGerontology A, Biological Sciences and Medical Sciences, vol. 53,no. 5, pp. B355–B361, 1998.
[3] T. Rantanen, “Muscle strength, disability and mortality,” Scan-dinavian Journal of Medicine and Science in Sports, vol. 13, no. 1,pp. 3–8, 2003.
[4] L. P. Lowes, L. Alfano, L. Viollet et al., “Knee extensor strengthexhibits potential to predict function in sporadic inclusion-body myositis,” Muscle and Nerve, vol. 45, no. 2, pp. 163–168,2012.
[5] B. H. Jacobson, D. Smith, J. Fronterhouse, C. Kline, andA. Boolani, “Assessment of the benefit of powered exercisesfor muscular endurance and functional capacity in elderly
Rehabilitation Research and Practice 15
participants,” Journal of Physical Activity & Health, vol. 9, no.7, pp. 1030–1035, 2012.
[6] M. O. Harris-Love, “Physical activity and disablement inthe idiopathic inflammatory myopathies,” Current Opinion inRheumatology, vol. 15, no. 6, pp. 679–690, 2003.
[7] A. M. Huber, J. E. Hicks, P. A. Lachenbruch et al., “Validation ofthe childhood health assessment questionnaire in the juvenileidiopathic myopathies,” Journal of Rheumatology, vol. 28, no. 5,pp. 1106–1111, 2001.
[8] U. Svantesson, U. Osterberg, R.Thomee, and G. Grimby, “Mus-cle fatigue in a standing heel-rise test,” Scandinavian Journal ofRehabilitation Medicine, vol. 30, no. 2, pp. 67–72, 1998.
[9] R. T. Moxley III, “Evaluation of neuromuscular function ininflammatory myopathy,” Rheumatic Disease Clinics of NorthAmerica, vol. 20, no. 4, pp. 827–843, 1994.
[10] A. Josefson, E. Romanus, and J. Carlsson, “A functional index inmyositis,” Journal of Rheumatology, vol. 23, no. 8, pp. 1380–1384,1996.
[11] J. M. Guralnik, “Assessment of physical performance anddisability in older persons,”Muscle and Nerve, vol. 20, no. 5, pp.S14–S16, 1997.
[12] M. H. Brooke, G. M. Fenichel, R. C. Griggs et al., “Clinicalinvestigation in Duchenne dystrophy: II. Determination of the“power” of therapeutic trials based on the natural history,”Muscle and Nerve, vol. 6, no. 2, pp. 91–103, 1983.
[13] C. M. McDonald, R. T. Abresch, G. T. Carter et al., “Profilesof neuromuscular diseases. Duchenne muscular dystrophy,”American Journal of Physical Medicine & Rehabilitation, vol. 74,no. 5, supplement, pp. S70–S92, 1995.
[14] E. N. Brandt and A. M. Pope, Enabling America: Assessingthe Role of Rehabilitation Science and Engineering, NationalAcademy Press, Washington, DC, USA, 1997.
[15] World Health Organization, International Classification ofFunctioning, Disability and Health (ICF), Geneva, Switzerland,2001.
[16] C. A. McHorney and A. R. Tarlov, “Individual-patient mon-itoring in clinical practice: are available health status surveysadequate?” Quality of Life Research, vol. 4, no. 4, pp. 293–307,1995.
[17] M. O. Harris-Love, G. Joe, and D. E. Koziol, “Performance-based assessment of functional limitation and muscle endur-ance: reliability of the Adult Myositis Assessment Tool,” Journalof Neurologic Physical Therapy, vol. 28, no. 4, pp. 179–180, 2004.
[18] A. R. La Spada, E. M. Wilson, D. B. Lubahn, A. E. Harding,and K. H. Fischbeck, “Androgen receptor gene mutations in X-linked spinal and bulbarmuscular atrophy,”Nature, vol. 352, no.6330, pp. 77–79, 1991.
[19] N. Chahin, C. Klein, J. Mandrekar, and E. Sorenson, “Naturalhistory of spinal-bulbar muscular atrophy,” Neurology, vol. 70,no. 21, pp. 1967–1971, 2008.
[20] M. A. Ferrante and A. J. Wilbourn, “The characteristic electro-diagnostic features of Kennedy’s disease,”Muscle Nerve, vol. 20,no. 3, pp. 323–329, 1997.
[21] L. E. Rhodes, B. K. Freeman, S. Auh et al., “Clinical features ofspinal and bulbar muscular atrophy,” Brain, vol. 132, no. 12, pp.3242–3251, 2009.
[22] The National Isometric Muscle Strength (NIMS) DatabaseConsortium, “Muscular weakness assessment: use of normalisometric strength data,” Archives of Physical Medicine andRehabilitation, vol. 77, no. 12, pp. 1251–1255, 1996.
[23] A. W. Andrews, M. W.Thomas, and R. W. Bohannon, “Norma-tive values for isometric muscle force measurements obtainedwith hand-held dynamometers,” PhysicalTherapy, vol. 76, no. 3,pp. 248–259, 1996.
[24] J. P. R. Selman, A. A. de Camargo, J. Santos, F. C. Lanza, and S.Dal Corso, “Reference equation for the two-minute walk test inadults and the elderly,” Respiratory Care, vol. 59, no. 4, pp. 525–530, 2014.
[25] H. Banno, M. Katsurio, K. Suzuki et al., “Phase 2 trial ofleuprorelin in patients with spinal and bulbar muscular atro-phy,” Annals of Neurology, vol. 65, no. 2, pp. 140–150, 2009.
[26] Y. Goverover, A. R. O’Brien, N. B. Moore, and J. DeLuca,“Actual reality: a new approach to functional assessment inpersons with multiple sclerosis,” Archives of Physical Medicineand Rehabilitation, vol. 91, no. 2, pp. 252–260, 2010.
[27] R. J. Shephard, “Limits to the measurement of habitual physicalactivity by questionnaires,” British Journal of Sports Medicine,vol. 37, no. 3, pp. 197–206, 2003.
[28] S. F. E. van Weely, J. C. van Denderen, M. P. M. Steultjenset al., “Moving instead of asking? Performance-based testsand BASFI-questionnaire measure different aspects of physicalfunction in ankylosing spondylitis,” Arthritis Research andTherapy, vol. 14, no. 2, article R52, 2012.
[29] L. E. Fernandez-Rhodes, A. D. Kokkinis, M. J. White et al.,“Efficacy and safety of dutasteride in patients with spinal andbulbar muscular atrophy: a randomised placebo-controlledtrial,”The Lancet Neurology, vol. 10, no. 2, pp. 140–147, 2011.
[30] P. Rossier and D. T. Wade, “Validity and reliability comparisonof 4 mobility measures in patients presenting with neurologicimpairment,” Archives of Physical Medicine and Rehabilitation,vol. 82, no. 1, pp. 9–13, 2001.
[31] J. M. Stolwijk-Swuste, A. Beelen, G. J. Lankhorst et al., “SF36physical functioning scale and 2-minute walk test advocated ascore qualifiers to evaluate physical functioning in patients withlate-onset sequelae of poliomyelitis,” Journal of RehabilitationMedicine, vol. 40, no. 5, pp. 387–394, 2008.
[32] K. E. Light, A. L. Bebrman, M. Thigpen, and W. J. Triggs, “The2-minute walk test: a tool for evaluating walking endurance inclients with Parkinson’s disease,” Journal of Neurologic PhysicalTherapy, vol. 21, no. 4, pp. 136–139, 1997.
[33] R. J. Butland, J. Pang, E. R. Gross, A. A. Woodcock, and D. M.Geddes, “Two-, six-, and 12-minute walking tests in respiratorydisease,” British Medical Journal, vol. 284, no. 6329, pp. 1607–1608, 1982.
[34] S.H. Subramony,W.May,D. Lynch et al., “Measuring Friedreichataxia: Interrater reliability of a neurologic rating scale,”Neurol-ogy, vol. 64, no. 7, pp. 1261–1262, 2005.
[35] D. R. Lynch, J. M. Farmer, A. Y. Tsou et al., “Measuring Friedre-ich ataxia: complementary features of examination and perfor-mance measures,”Neurology, vol. 66, no. 11, pp. 1711–1716, 2006.
[36] A. Riazi, J. C. Hobart, D. L. Lamping et al., “Using the SF-36 measure to compare the health impact of multiple sclerosisand Parkinson’s disease with normal population health profiles,”Journal of Neurology Neurosurgery and Psychiatry, vol. 74, no. 6,pp. 710–714, 2003.
[37] D. Finas, M. Bals-Pratsch, J. Sandmann et al., “Quality of life inelderly men with androgen deficiency,” Andrologia, vol. 38, no.2, pp. 48–53, 2006.
[38] J. E. Ware, M. Kosinski, J. B. Bjorner, D. M. Turner-Bowker,B. Gandek, and M. E. Maruish, User’s Manual for the SF-36v2Health Survey, QualtiyMetric, Lincoln,Mass, USA, 2nd edition,2007.

16 Rehabilitation Research and Practice
[39] J. E. Ware, M. Kosinski, and J. E. Dewey, How to Score VersionTwo of the SF-36—Health Survey, QualityMetric, Lincoln,Mass,USA, 2000.
[40] L. G. Portney and M. P. Watkins, Foundations of ClinicalResearch: Applications to Practice, Pearson/Prentice Hall, UpperSaddle River, NJ, USA, 2009.
[41] S. L. Foster and J. D. Cone, “Validity issues in clinical assess-ment,” Psychological Assessment, vol. 7, no. 3, pp. 248–260, 1995.
[42] B. H. Munro, Statistical Methods for Health Care Research,Lippincott Williams & Wilkins, Philadelphia, Pa, USA, 4thedition, 2001.
[43] A. Field, Discovering Statistics Using SPSS, Sage, Los Angeles,Calif, USA, 2009.
[44] S. Jaric, “Role of body size in the relation between musclestrength and movement performance,” Exercise and Sport Sci-ences Reviews, vol. 31, no. 1, pp. 8–12, 2003.
[45] S. Jaric, “Muscle strength testing: use of normalisation for bodysize,” Sports Medicine, vol. 32, no. 10, pp. 615–631, 2002.
[46] M. Brown, “Skeletal muscle and bone: effect of sex steroids andaging,”American Journal of Physiology—Advances in PhysiologyEducation, vol. 32, no. 2, pp. 120–126, 2008.
[47] T. Rantanen, J. M. Guralnik, G. Izmirlian et al., “Associationof muscle strength with maximum walking speed in disabledolder women,” American Journal of Physical Medicine andRehabilitation, vol. 77, no. 4, pp. 299–305, 1998.
[48] M. Doyu, G. Sobue, E. Mukai et al., “Severity of X-linked reces-sive bulbospinal neuronopathy correlates with size of the tan-dem CAG repeat in androgen receptor gene,” Annals of Neurol-ogy, vol. 32, no. 5, pp. 707–710, 1992.
[49] A. R. La Spada, D. B. Roling, A. E. Harding et al., “Meiotic sta-bility and genotype—phenotype correlation of the trinucleotiderepeat in X-linked spinal and bulbar muscular atrophy,” NatureGenetics, vol. 2, no. 4, pp. 301–304, 1992.
[50] N. Atsuta, H. Watanabe, M. Ito et al., “Natural history of spinaland bulbar muscular atrophy (SBMA): a study of 223 Japanesepatients,” Brain, vol. 129, no. 6, pp. 1446–1455, 2006.
[51] H. Alexanderson, L. Broman, A. Tollback, A. Josefson, I. E.Lundberg, and C. H. Stenstrom, “Functional Index-2: validityand reliability of a disease-specific measure of impairment inpatients with polymyositis and dermatomyositis,”Arthritis Careand Research, vol. 55, no. 1, pp. 114–122, 2006.
[52] R. L. Lieber, Skeletal Muscle Structure, Function, and Plasticity:the Physiological Basis of Rehabilitation, Lippincott Williams &Wilkins, Baltimore, Md, USA, 2010.
[53] M. O. Harris-Love, J. A. Shrader, T. E. Davenport et al., “Arerepeated single-limb heel raises and manual muscle testingassociated with peak plantar-flexor force in people with inclu-sion body myositis?” Physical Therapy, vol. 94, no. 4, pp. 543–552, 2014.
[54] J. G. Boyer, A. Ferrier, and R. Kothary, “More than a bystander:the contributions of intrinsic skeletal muscle defects in motorneuron diseases,” Frontiers in Physiology, 2013.
[55] N. Chahin and E. J. Sorenson, “Serum creatine kinase levels inspinobulbar muscular atrophy and amyotrophic lateral sclero-sis,”Muscle and Nerve, vol. 40, no. 1, pp. 126–129, 2009.
[56] G. J. Salem, M.-Y. Wang, J. T. Young, M. Marion, and G.A. Greendale, “Knee strength and lower- and higher-intensityfunctional performance in older adults,” Medicine and Sciencein Sports and Exercise, vol. 32, no. 10, pp. 1679–1684, 2000.
[57] L. Merlini, E. Bertini, C. Minetti et al., “Motor function-musclestrength relationship in spinal muscular atrophy,” Muscle andNerve, vol. 29, no. 4, pp. 548–552, 2004.

Submit your manuscripts athttp://www.hindawi.com
Stem CellsInternational
Hindawi Publishing Corporationhttp://www.hindawi.com Volume 2014
Hindawi Publishing Corporationhttp://www.hindawi.com Volume 2014
MEDIATORSINFLAMMATION
of
Hindawi Publishing Corporationhttp://www.hindawi.com Volume 2014
Behavioural Neurology
EndocrinologyInternational Journal of
Hindawi Publishing Corporationhttp://www.hindawi.com Volume 2014
Hindawi Publishing Corporationhttp://www.hindawi.com Volume 2014
Disease Markers
Hindawi Publishing Corporationhttp://www.hindawi.com Volume 2014
BioMed Research International
OncologyJournal of
Hindawi Publishing Corporationhttp://www.hindawi.com Volume 2014
Hindawi Publishing Corporationhttp://www.hindawi.com Volume 2014
Oxidative Medicine and Cellular Longevity
Hindawi Publishing Corporationhttp://www.hindawi.com Volume 2014
PPAR Research
The Scientific World JournalHindawi Publishing Corporation http://www.hindawi.com Volume 2014
Immunology ResearchHindawi Publishing Corporationhttp://www.hindawi.com Volume 2014
Journal of
ObesityJournal of
Hindawi Publishing Corporationhttp://www.hindawi.com Volume 2014
Hindawi Publishing Corporationhttp://www.hindawi.com Volume 2014
Computational and Mathematical Methods in Medicine
OphthalmologyJournal of
Hindawi Publishing Corporationhttp://www.hindawi.com Volume 2014
Diabetes ResearchJournal of
Hindawi Publishing Corporationhttp://www.hindawi.com Volume 2014
Hindawi Publishing Corporationhttp://www.hindawi.com Volume 2014
Research and TreatmentAIDS
Hindawi Publishing Corporationhttp://www.hindawi.com Volume 2014
Gastroenterology Research and Practice
Hindawi Publishing Corporationhttp://www.hindawi.com Volume 2014
Parkinson’s Disease
Evidence-Based Complementary and Alternative Medicine
Volume 2014Hindawi Publishing Corporationhttp://www.hindawi.com