Cancer induction by restriction of oncogene expression to the stem cell compartment
Upload
independentCategory
view
0download
0
Analysis of gene expression during myconcogene-induced lymphomagenesis inthe bursa of FabriciusPaul E. Neiman*†, Alanna Ruddell*, Christine Jasoni*, Gil Loring*, Sandra Jo Thomas*, Kimberly A. Brandvold*,Ruey-min Lee*‡, Joan Burnside§, and Jeffrey Delrow*
*Divisions of Basic Sciences and Human Biology, Fred Hutchinson Cancer Research Center and the Departments of Medicine and Pathology,University of Washington, 1100 Fairview Avenue North, Seattle, WA 98109-1024; ‡Huntsman Cancer Institute and Section of Oncology,Department of Medicine, University of Utah, 2000 Circle of Hope, Salt Lake City, UT 84112; and §Department of Animal and Food Sciences,University of Delaware, Newark, DE 19717
Communicated by Robert N. Eisenman, Fred Hutchinson Cancer Research Center, Seattle, WA, March 26, 2001 (received for review January 23, 2001)
The transcriptional effects of deregulated myc gene overexpres-sion are implicated in tumorigenesis in a spectrum of experimentaland naturally occurring neoplasms. In follicles of the chicken bursaof Fabricius, myc induction of B-cell neoplasia requires a target cellpopulation present during early bursal development andprogresses through preneoplastic transformed follicles to meta-static lymphomas. We developed a chicken immune system cDNAmicroarray to analyze broad changes in gene expression that occurduring normal embryonic B-cell development and during myc-induced neoplastic transformation in the bursa. The number ofmRNAs showing at least 3-fold change was greater during myc-induced lymphomagenesis than during normal development, andhierarchical cluster analysis of expression patterns revealed thatlevels of several hundred mRNAs varied in concert with levels ofmyc overexpression. A set of 41 mRNAs were most consistentlyelevated in myc-overexpressing preneoplastic and neoplastic cells,most involved in processes thought to be subject to regulation byMyc. The mRNAs for another cluster of genes were overexpressedin neoplasia independent of myc expression level, including a smallsubset with the expression signature of embryonic bursal lympho-cytes. Overexpression of myc, and some of the genes overex-pressed with myc, may be important for generation of preneo-plastic transformed follicles. However, expression profiles of latemetastatic tumors showed a large variation in concert with mycexpression levels, and some showed minimal myc overexpression.Therefore, high-level myc overexpression may be more importantin the early induction of these lymphomas than in maintenance oflate-stage metastases.
The advent of DNA microarray technology for assessment ofgenome-wide changes in gene expression provides opportu-
nities for more comprehensive exploration of complex processessuch as neoplastic change (1, 2). Such an opportunity is pre-sented by the transcriptional effects of deregulated c-myc geneoverexpression, which are implicated in tumorigenesis in aspectrum of experimental and naturally occurring neoplasms(reviewed in refs. 3–5). Experimental induction of B-cell lym-phomas in the bursa of Fabricius of chickens provides one modeltumor system in which deregulated overexpression of c-mycdrives an apparently multistaged neoplastic process in which thenormal target cell population and a preneoplastic cell popula-tion, as well as fully developed clonal tumors and derivative celllines, have been identified and can be conveniently obtained foranalysis (reviewed in ref. 6). In this system, tumor induction byc-myc requires a target cell population present only duringembryonic bursal development (7, 8) and produces, as its initialhistological manifestation, multiple preneoplastic lesions calledtransformed follicles (TF) (9–11). The cells comprising TF area monomorphic population of IgM-positive lymphoblasts thatdisplay surface antigens of early bursal cells and that retain stemcell function (8, 10). They differ from the developmentally
regulated stem cell population of normal bursal follicles, whichdisappears shortly after hatching, by persisting in the posthatch-ing bursa and by progressing to form invasive bursal lymphomasthat metastasize to liver and other organs. Immortalized celllines have been generated from myc-induced bursal lymphomas,perhaps the best characterized of which is DT-40 (12). DT-40cells have the property, rare among established vertebrate celllines, of an efficiency of homologous recombination approachingthat of illegitimate recombination (13), making them useful fortargeted gene deletion and replacement experiments.
To gain new insights into the genes and genetic networksimportant in mediating neoplastic change in this model system,we developed a chicken immune system glass slide microarraybased on DT-40 and supplemental chicken T-cell and B-cellcDNAs. Analysis of mRNA expression was carried out at severalstages of normal embryonic bursal development and of myc-induced preneoplastic TF, metastatic lymphomas, and theDT-40 cell line. In each case, comparison was made to expressionlevels in the normal posthatching bursa where, despite intenseproliferative activity in the lymphoid population of normalfollicles, endogenous c-myc expression is relatively low (14).
Software for cluster analysis (15, 16) was used to identify genesshowing similar patterns of expression. These studies suggestthat high levels of myc overexpression, and consequent broadchanges in gene expression, may be important for TF inductionbut are not consistently required for maintenance of late met-astatic disease. Genes whose level of expression in TF andmetastatic tumors correlated positively with the level of myc-overexpression were identified. This analysis suggests that theeffects of myc on cellular growth and energy controls may be apredominant mechanism in myc-induced neoplasia.
Materials and MethodscDNA Libraries, DT-40 Expressed Sequence Tag Library, and theChicken Immune System Glass Slide cDNA Microarray. The microar-ray constructed for these studies used chicken lymphocytecDNAs from three different libraries. A cDNA library contain-ing about 1.6 3 106 recombinants, with an average insert size ofabout 1.5 kilobase pairs, was prepared from DT-40 poly(A)1
RNA by using mixed oligo dT and random primers and clonedinto the EcoRI site of lambda ZAP II (Stratagene). To reduce
Abbreviations: TF, transformed bursal follicle; HB1, recovered avian myelocytomatosis virusstrain MC-29-HB1; SOM, self-organizing map; NB, normal 2-week posthatching bursa.
Data deposition: The sequences reported in this paper have been deposited in the GenBankdatabase (for accession nos., see Table 2, which is published as supplemental data on thePNAS web site, www.pnas.org).
†To whom reprint requests should be addressed. E-mail: [email protected].
The publication costs of this article were defrayed in part by page charge payment. Thisarticle must therefore be hereby marked “advertisement” in accordance with 18 U.S.C.§1734 solely to indicate this fact.
6378–6383 u PNAS u May 22, 2001 u vol. 98 u no. 11 www.pnas.orgycgiydoiy10.1073ypnas.111144898
redundancy and unwanted avian retroviral RNAs, the librarywas subtracted with biotinylated poly(A)1 RNA from normal2-week posthatching bursa (NB) and avian leukosis virus, aspreviously described (17). Cultures of individual plasmid clones(in pBluescript SK2, Stratagene) of this subtracted DT-40library, called DT40subNB, were archived in a 96-well format.The cDNA inserts were amplified from replica plate cultures byPCR, and 1,800 verified products were used both for single-passDNA sequencing and for robot-assisted spotting onto polylysine-coated glass slides, as previously described (18, 19). Databasesearching provided gene identifications for about 68% of suc-cessfully sequenced DT40subNB cDNAs. Sequence homologycluster analysis (CAP-3) of the library indicated about 55%distinct sequences. Clones with expression patterns of interest inthe array experiments, but which were not successfully se-quenced in the initial single-pass attempt, were selectivelyresequenced and gene identifications obtained by databasesearches. An annotation file with GenBank accession numbersfor DT40subNB clones on the array is published as Table 2 in thesupplemental data on the PNAS web site, www.pnas.org.
Additionally 1,200 unique clones from a sequenced gene-identified chicken activated T-cell cDNA library previouslyprepared by one of us (J.B.)¶ were added to the array (20).Finally, 50 selected nonoverlapping expressed sequence taggedclones from a normal 2-week posthatching bursal library,DKFZ426, previously sequenced and gene-identified by J.-M.Buerstedde (21), were supplied by the Resource Center of theGerman Human Genome Project and added to the array. Thecompleted array contained 3,011 chicken lymphocyte cDNAspots representing about 2,200 different genes.
Retroviral myc-Transduction and RNA Preparation from Tissues andCells. The reference RNA for all experiments was prepared fromnormal 2-week posthatching bursa from inbred Line SC whiteleghorn chickens (Hyline International, Dallas, IA). Suspensionsof follicular lymphocytes were prepared as described (8, 10), andtotal RNA extracted from aliquots of 4 3 107 cells with RNAzol(Tel-Test, Friendswood, TX). As a control for contamination bybursal stromal cells, RNA was extracted from bursas in which thelymphoid population was selectively ablated by treatment withcyclophosphamide (22).
Bursal neoplasia was induced with a replication-defectiveMoloney leukemia virus- based retroviral vector (23) expressingthe myc-oncogene of the recovered avian myelocytomatosisvirus strain MC-29-HB1 (HB1), LmycSN, as previously de-scribed (24). Briefly, embryonic bursal cells were cocultivatedovernight in LmycSN producing monolayers and injected intocyclophosphamide-treated day 18 embryos to repopulate ablatedfollicles. At 4 weeks, posthatching successfully transduced, re-constituted follicles had TF morphology. By transplanting thesecells into cyclophosphamide-ablated secondary recipients, es-sentially pure populations of TF were generated (8, 24), fromwhich RNA was prepared as from normal bursa. Large meta-static lymphomas appeared beginning 8 weeks after eitherprimary or secondary transplantation. Hepatic tumor masseswere dissected away from surrounding normal liver and RNAextracted. RNA was also extracted from normal liver as a controlfor contaminating liver cells.
Generation of Fluorescent cDNA Probes, Hybridization, and DataProcessing. Poly(A)1 RNA was prepared from total RNA byusing a Qiagen (Chatsworth, CA) Oligotex mRNA kit and usedas template to generate cDNA probes labeled with Cyaninedye-conjugated (Cy3 or Cy5) dUTP (Amersham Pharmacia).
Labeling reactions contained 2 mg of Poly(A)1 RNA, 4 mgOligo(dT)18, and 3 mg random hexamer primers in 30 ml of 50mM TriszHCl, pH 7.5y40 mM KCly6 mM MgCl2y10 mM DTTy0.4 mM dATP, dGTP, dCTPy0.15 mM TTPy0.1 mM Cy-dye-labeled dUTPy400 units of Superscript II reverse transcriptase(GIBCOyBRL). Reactions were incubated at 42°C for 1.5 h,diluted to 500 of 10 mm Tris, 1 mm EDTA, pH 7.5, concentratedto '10 ml in a Microcon-30 filter (Amicon), and filtered througha Millipore UltraFree-MC filter unit. Reference normal bursalprobes were labeled with Cy3, and the various experimental testprobes with Cy5 (except in two experiments, where the label wasreversed to control for any bias intrinsic to the fluorescentlabels). In control experiments with CY-3- and CY-5-labeledprobes from different preparations of reference normal 2-weekbursal RNA, we determined that 3-fold changes in expressionwere significant. Test and reference probes were combined in 26ml of 33 SSC (0.45 M NaCly0.045 M Na citrate, pH 7.0)y10 mgpoly adenylatey0.2% SDS, and were competitively hybridized toan arrayed surface under a coverslip for 16 h at 63°C. Slides werewashed in 13 SSC and 0.03% SDS ('1 min), 13 SSC ('1 min),0.23 SSC (20 min), and 0.053 SSC (10 min) and dried bycentrifugation (50 3 g for 5 min). Fluorescent array images werecollected for both Cy3 and Cy5 by using a GenePix 4000Afluorescent scanner (Axon Instruments, Foster City, CA), andimage intensity data were extracted and analyzed by usingGENEPIX PRO 3.0 microarray analysis software. Normalization ofthe Cy5 to Cy3 fluorescent signal in each experiment wasdetermined assuming equivalent global hybridization of test andreference probes to genomic chicken DNA.
ResultsAnalysis of Expression During Normal Bursal Development. Bursalcells were prepared for analysis of expression during normaldevelopment. RNA was extracted from day 15 embryos, whenhematopoietic bursal migrants have colonized the anlage (25),day 16 when most lymphoid cells are in follicles, day 18 withvigorously dividing embryonic follicular populations, and day 21initiating posthatching physiology, including disappearance oftransplantable stem cell and myc-target populations (7, 8). Fig.1A shows that, early in bursal development at embryonic day 15,196 mRNAs demonstrated 3-fold changes in expression, bothincreasing and decreasing relative to the posthatching reference.The number of mRNAs showing differences gradually dimin-ished up to hatching at day 21. Fig. 1B is a self-organizing map(SOM) (16) that, among the mRNAs demonstrating 3-foldchange, identified clusters of cDNAs with similar patterns ofchange during embryonic development. Gene and clone lists forthese clusters are given in Table 3, which is published assupplemental data on the PNAS web site, www.pnas.org. Asummary of these data is as follows.
Genes in SOM clusters 1 and 4 (Fig. 1B) showed relativelyelevated levels of expression in the embryonic day 15 bursalmigrants and day 16 follicular cells that then fell during subse-quent maturation of the bursa. The mRNAs for a number ofT-cell-specific genes, including CD3, T-cell receptor, and gran-zyme B, were prominent in this set, suggesting a multipotentialcharacter of early bursal precursors that is lost during develop-ment. Genes in SOM cluster 7 showed relatively high-levelexpression through embryonic day 18 and then fell by time ofhatching. Some mRNAs in this set (but not in the preceding set)were identified as highly expressed in the myc-induced bursalneoplasms. Genes in SOM clusters 2, 3, and 6 showed progressiveincreases in expression from embryonic day 16 as bursal devel-opment progressed. Included in this group are genes involved inIg production and genes promoting apoptotic cell death, such astumor necrosis factor, mtdybok, and caspase 3. This findingcorrelates with both the principal function of the bursa in
¶Details of the Pat library clones used are found in Array 4 at the University of DelawareChick EST web site: http://udgenome.ags.udel.chickest.array.htm.
Neiman et al. PNAS u May 22, 2001 u vol. 98 u no. 11 u 6379
MED
ICA
LSC
IEN
CES
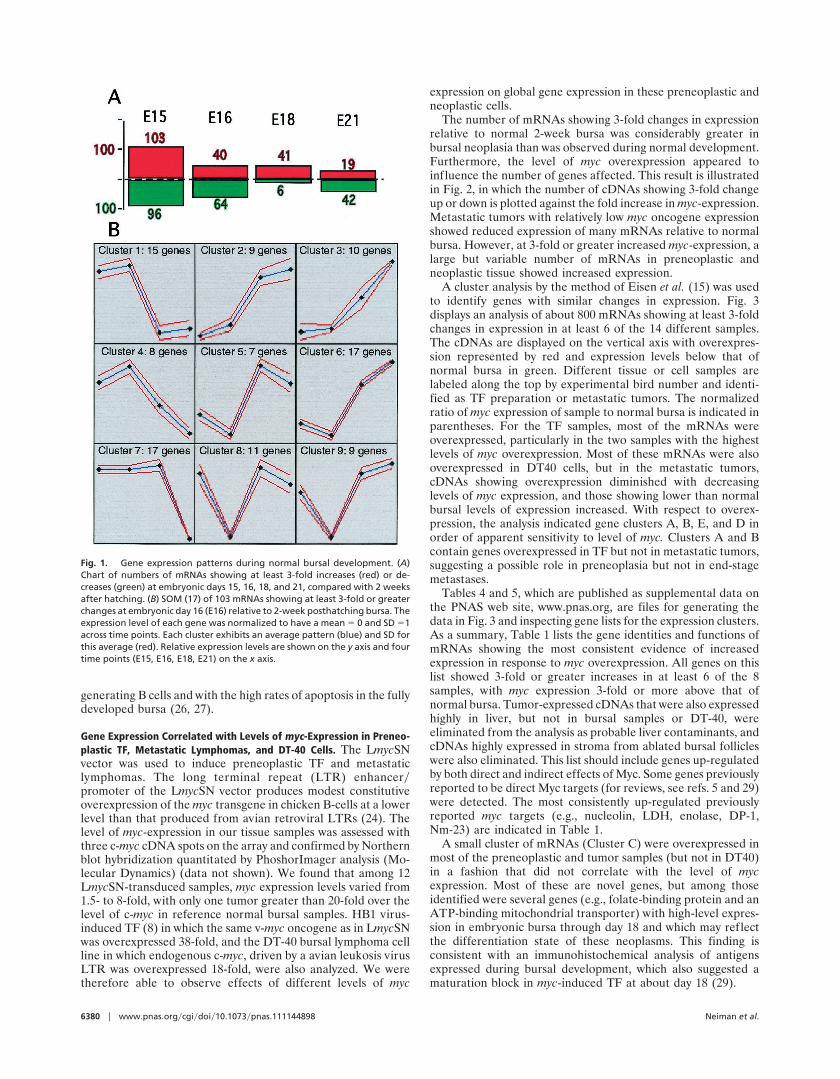
generating B cells and with the high rates of apoptosis in the fullydeveloped bursa (26, 27).
Gene Expression Correlated with Levels of myc-Expression in Preneo-plastic TF, Metastatic Lymphomas, and DT-40 Cells. The LmycSNvector was used to induce preneoplastic TF and metastaticlymphomas. The long terminal repeat (LTR) enhancerypromoter of the LmycSN vector produces modest constitutiveoverexpression of the myc transgene in chicken B-cells at a lowerlevel than that produced from avian retroviral LTRs (24). Thelevel of myc-expression in our tissue samples was assessed withthree c-myc cDNA spots on the array and confirmed by Northernblot hybridization quantitated by PhoshorImager analysis (Mo-lecular Dynamics) (data not shown). We found that among 12LmycSN-transduced samples, myc expression levels varied from1.5- to 8-fold, with only one tumor greater than 20-fold over thelevel of c-myc in reference normal bursal samples. HB1 virus-induced TF (8) in which the same v-myc oncogene as in LmycSNwas overexpressed 38-fold, and the DT-40 bursal lymphoma cellline in which endogenous c-myc, driven by a avian leukosis virusLTR was overexpressed 18-fold, were also analyzed. We weretherefore able to observe effects of different levels of myc
expression on global gene expression in these preneoplastic andneoplastic cells.
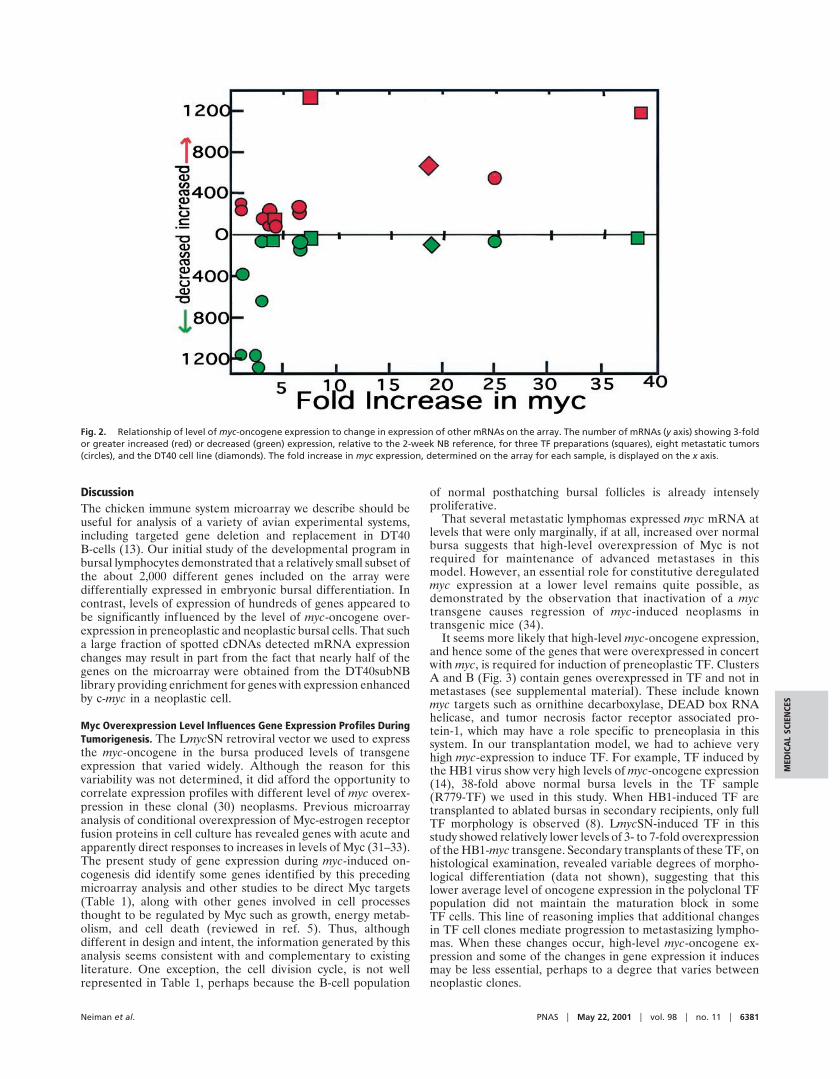
The number of mRNAs showing 3-fold changes in expressionrelative to normal 2-week bursa was considerably greater inbursal neoplasia than was observed during normal development.Furthermore, the level of myc overexpression appeared toinfluence the number of genes affected. This result is illustratedin Fig. 2, in which the number of cDNAs showing 3-fold changeup or down is plotted against the fold increase in myc-expression.Metastatic tumors with relatively low myc oncogene expressionshowed reduced expression of many mRNAs relative to normalbursa. However, at 3-fold or greater increased myc-expression, alarge but variable number of mRNAs in preneoplastic andneoplastic tissue showed increased expression.
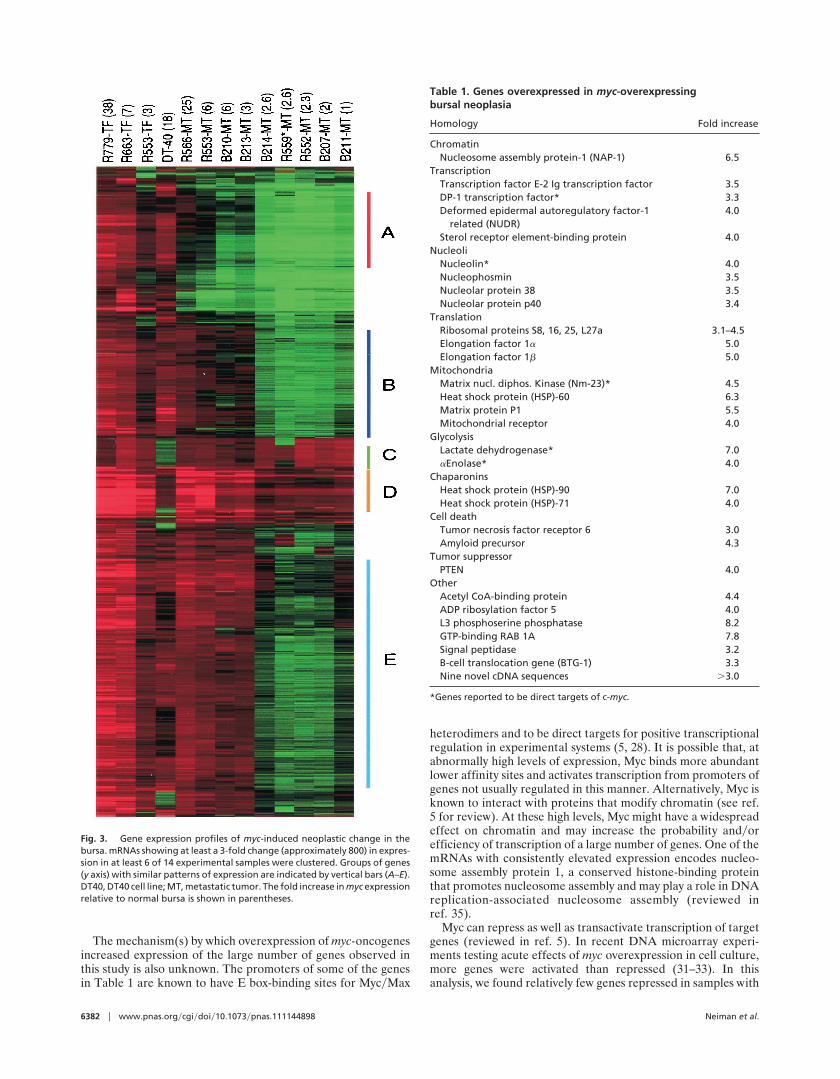
A cluster analysis by the method of Eisen et al. (15) was usedto identify genes with similar changes in expression. Fig. 3displays an analysis of about 800 mRNAs showing at least 3-foldchanges in expression in at least 6 of the 14 different samples.The cDNAs are displayed on the vertical axis with overexpres-sion represented by red and expression levels below that ofnormal bursa in green. Different tissue or cell samples arelabeled along the top by experimental bird number and identi-fied as TF preparation or metastatic tumors. The normalizedratio of myc expression of sample to normal bursa is indicated inparentheses. For the TF samples, most of the mRNAs wereoverexpressed, particularly in the two samples with the highestlevels of myc overexpression. Most of these mRNAs were alsooverexpressed in DT40 cells, but in the metastatic tumors,cDNAs showing overexpression diminished with decreasinglevels of myc expression, and those showing lower than normalbursal levels of expression increased. With respect to overex-pression, the analysis indicated gene clusters A, B, E, and D inorder of apparent sensitivity to level of myc. Clusters A and Bcontain genes overexpressed in TF but not in metastatic tumors,suggesting a possible role in preneoplasia but not in end-stagemetastases.
Tables 4 and 5, which are published as supplemental data onthe PNAS web site, www.pnas.org, are files for generating thedata in Fig. 3 and inspecting gene lists for the expression clusters.As a summary, Table 1 lists the gene identities and functions ofmRNAs showing the most consistent evidence of increasedexpression in response to myc overexpression. All genes on thislist showed 3-fold or greater increases in at least 6 of the 8samples, with myc expression 3-fold or more above that ofnormal bursa. Tumor-expressed cDNAs that were also expressedhighly in liver, but not in bursal samples or DT-40, wereeliminated from the analysis as probable liver contaminants, andcDNAs highly expressed in stroma from ablated bursal follicleswere also eliminated. This list should include genes up-regulatedby both direct and indirect effects of Myc. Some genes previouslyreported to be direct Myc targets (for reviews, see refs. 5 and 29)were detected. The most consistently up-regulated previouslyreported myc targets (e.g., nucleolin, LDH, enolase, DP-1,Nm-23) are indicated in Table 1.
A small cluster of mRNAs (Cluster C) were overexpressed inmost of the preneoplastic and tumor samples (but not in DT40)in a fashion that did not correlate with the level of mycexpression. Most of these are novel genes, but among thoseidentified were several genes (e.g., folate-binding protein and anATP-binding mitochondrial transporter) with high-level expres-sion in embryonic bursa through day 18 and which may reflectthe differentiation state of these neoplasms. This finding isconsistent with an immunohistochemical analysis of antigensexpressed during bursal development, which also suggested amaturation block in myc-induced TF at about day 18 (29).
Fig. 1. Gene expression patterns during normal bursal development. (A)Chart of numbers of mRNAs showing at least 3-fold increases (red) or de-creases (green) at embryonic days 15, 16, 18, and 21, compared with 2 weeksafter hatching. (B) SOM (17) of 103 mRNAs showing at least 3-fold or greaterchanges at embryonic day 16 (E16) relative to 2-week posthatching bursa. Theexpression level of each gene was normalized to have a mean 5 0 and SD 51across time points. Each cluster exhibits an average pattern (blue) and SD forthis average (red). Relative expression levels are shown on the y axis and fourtime points (E15, E16, E18, E21) on the x axis.
6380 u www.pnas.orgycgiydoiy10.1073ypnas.111144898 Neiman et al.
DiscussionThe chicken immune system microarray we describe should beuseful for analysis of a variety of avian experimental systems,including targeted gene deletion and replacement in DT40B-cells (13). Our initial study of the developmental program inbursal lymphocytes demonstrated that a relatively small subset ofthe about 2,000 different genes included on the array weredifferentially expressed in embryonic bursal differentiation. Incontrast, levels of expression of hundreds of genes appeared tobe significantly influenced by the level of myc-oncogene over-expression in preneoplastic and neoplastic bursal cells. That sucha large fraction of spotted cDNAs detected mRNA expressionchanges may result in part from the fact that nearly half of thegenes on the microarray were obtained from the DT40subNBlibrary providing enrichment for genes with expression enhancedby c-myc in a neoplastic cell.
Myc Overexpression Level Influences Gene Expression Profiles DuringTumorigenesis. The LmycSN retroviral vector we used to expressthe myc-oncogene in the bursa produced levels of transgeneexpression that varied widely. Although the reason for thisvariability was not determined, it did afford the opportunity tocorrelate expression profiles with different level of myc overex-pression in these clonal (30) neoplasms. Previous microarrayanalysis of conditional overexpression of Myc-estrogen receptorfusion proteins in cell culture has revealed genes with acute andapparently direct responses to increases in levels of Myc (31–33).The present study of gene expression during myc-induced on-cogenesis did identify some genes identified by this precedingmicroarray analysis and other studies to be direct Myc targets(Table 1), along with other genes involved in cell processesthought to be regulated by Myc such as growth, energy metab-olism, and cell death (reviewed in ref. 5). Thus, althoughdifferent in design and intent, the information generated by thisanalysis seems consistent with and complementary to existingliterature. One exception, the cell division cycle, is not wellrepresented in Table 1, perhaps because the B-cell population
of normal posthatching bursal follicles is already intenselyproliferative.
That several metastatic lymphomas expressed myc mRNA atlevels that were only marginally, if at all, increased over normalbursa suggests that high-level overexpression of Myc is notrequired for maintenance of advanced metastases in thismodel. However, an essential role for constitutive deregulatedmyc expression at a lower level remains quite possible, asdemonstrated by the observation that inactivation of a myctransgene causes regression of myc-induced neoplasms intransgenic mice (34).
It seems more likely that high-level myc-oncogene expression,and hence some of the genes that were overexpressed in concertwith myc, is required for induction of preneoplastic TF. ClustersA and B (Fig. 3) contain genes overexpressed in TF and not inmetastases (see supplemental material). These include knownmyc targets such as ornithine decarboxylase, DEAD box RNAhelicase, and tumor necrosis factor receptor associated pro-tein-1, which may have a role specific to preneoplasia in thissystem. In our transplantation model, we had to achieve veryhigh myc-expression to induce TF. For example, TF induced bythe HB1 virus show very high levels of myc-oncogene expression(14), 38-fold above normal bursa levels in the TF sample(R779-TF) we used in this study. When HB1-induced TF aretransplanted to ablated bursas in secondary recipients, only fullTF morphology is observed (8). LmycSN-induced TF in thisstudy showed relatively lower levels of 3- to 7-fold overexpressionof the HB1-myc transgene. Secondary transplants of these TF, onhistological examination, revealed variable degrees of morpho-logical differentiation (data not shown), suggesting that thislower average level of oncogene expression in the polyclonal TFpopulation did not maintain the maturation block in someTF cells. This line of reasoning implies that additional changesin TF cell clones mediate progression to metastasizing lympho-mas. When these changes occur, high-level myc-oncogene ex-pression and some of the changes in gene expression it inducesmay be less essential, perhaps to a degree that varies betweenneoplastic clones.
Fig. 2. Relationship of level of myc-oncogene expression to change in expression of other mRNAs on the array. The number of mRNAs (y axis) showing 3-foldor greater increased (red) or decreased (green) expression, relative to the 2-week NB reference, for three TF preparations (squares), eight metastatic tumors(circles), and the DT40 cell line (diamonds). The fold increase in myc expression, determined on the array for each sample, is displayed on the x axis.
Neiman et al. PNAS u May 22, 2001 u vol. 98 u no. 11 u 6381
MED
ICA
LSC
IEN
CES
The mechanism(s) by which overexpression of myc-oncogenesincreased expression of the large number of genes observed inthis study is also unknown. The promoters of some of the genesin Table 1 are known to have E box-binding sites for MycyMax
heterodimers and to be direct targets for positive transcriptionalregulation in experimental systems (5, 28). It is possible that, atabnormally high levels of expression, Myc binds more abundantlower affinity sites and activates transcription from promoters ofgenes not usually regulated in this manner. Alternatively, Myc isknown to interact with proteins that modify chromatin (see ref.5 for review). At these high levels, Myc might have a widespreadeffect on chromatin and may increase the probability andyorefficiency of transcription of a large number of genes. One of themRNAs with consistently elevated expression encodes nucleo-some assembly protein 1, a conserved histone-binding proteinthat promotes nucleosome assembly and may play a role in DNAreplication-associated nucleosome assembly (reviewed inref. 35).
Myc can repress as well as transactivate transcription of targetgenes (reviewed in ref. 5). In recent DNA microarray experi-ments testing acute effects of myc overexpression in cell culture,more genes were activated than repressed (31–33). In thisanalysis, we found relatively few genes repressed in samples with
Fig. 3. Gene expression profiles of myc-induced neoplastic change in thebursa. mRNAs showing at least a 3-fold change (approximately 800) in expres-sion in at least 6 of 14 experimental samples were clustered. Groups of genes(y axis) with similar patterns of expression are indicated by vertical bars (A–E).DT40, DT40 cell line; MT, metastatic tumor. The fold increase in myc expressionrelative to normal bursa is shown in parentheses.
Table 1. Genes overexpressed in myc-overexpressingbursal neoplasia
Homology Fold increase
ChromatinNucleosome assembly protein-1 (NAP-1) 6.5
TranscriptionTranscription factor E-2 Ig transcription factor 3.5DP-1 transcription factor* 3.3Deformed epidermal autoregulatory factor-1
related (NUDR)4.0
Sterol receptor element-binding protein 4.0Nucleoli
Nucleolin* 4.0Nucleophosmin 3.5Nucleolar protein 38 3.5Nucleolar protein p40 3.4
TranslationRibosomal proteins S8, 16, 25, L27a 3.1–4.5Elongation factor 1a 5.0Elongation factor 1b 5.0
MitochondriaMatrix nucl. diphos. Kinase (Nm-23)* 4.5Heat shock protein (HSP)-60 6.3Matrix protein P1 5.5Mitochondrial receptor 4.0
GlycolysisLactate dehydrogenase* 7.0aEnolase* 4.0
ChaparoninsHeat shock protein (HSP)-90 7.0Heat shock protein (HSP)-71 4.0
Cell deathTumor necrosis factor receptor 6 3.0Amyloid precursor 4.3
Tumor suppressorPTEN 4.0
OtherAcetyl CoA-binding protein 4.4ADP ribosylation factor 5 4.0L3 phosphoserine phosphatase 8.2GTP-binding RAB 1A 7.8Signal peptidase 3.2B-cell translocation gene (BTG-1) 3.3Nine novel cDNA sequences .3.0
*Genes reported to be direct targets of c-myc.
6382 u www.pnas.orgycgiydoiy10.1073ypnas.111144898 Neiman et al.
3-fold or greater increases in myc mRNA and none that wereconsistently repressed in most of the samples. That a largefraction of the cDNAs on the array were derived from DT-40cells that overexpress Myc to very high levels may have limitedour opportunity to identify targets of repression in the analysisthat could be important in tumorigenesis.
How Does Myc Promote Multistage Tumorigenesis? The direct actionof viral Myc on the promoters of a specific set of target genesundoubtedly plays a central role in acute transformation in tissueculture and rapid induction of neoplasms in vivo by oncogenicmyc-transducing viruses. Recent observations of several forms ofgross genetic instability induced by myc overexpression suggesta second class of mechanisms that could play a role, especiallyin multistage tumorigenesis (36, 37). However, gross geneticchanges of the type described in these reports have not beenobserved in this bursal lymphoma model system (unpublishedobservations). The detection in this study of the overexpressionof hundreds of genes in apparent response to high levels ofmyc-oncogene expression suggests a third type of mechanism.Specifically, phenotypic change caused by some of the spectrum
of overexpressed genes in myc-induced preneoplastic cells mightbe selected to mediate tumor progression. Mutations that fixcritical changes might then occur subsequent to this overexpres-sion-driven process and might allow for a lower level of myc-oncogene expression in some advanced tumor clones.
Which genes and pathways might be most central in neoplasiamediated by myc oncogenes? Inspection of cluster D (Fig. 3) andTable 1 directs attention to the recent discovery of the role ofmyc in regulation of cell growth in fruit f lies (38) and mammalianB cells (39). Eleven of the 32 (35%) known genes in Table 1 areinvolved with nucleolar function, ribosome biogenesis, and pro-tein synthesis. Enlarged and multiple nucleoli are a classicalcytological feature of transformed cells. The next most predom-inant grouping (7 genes, 22%) points to mitochondrial ho-meostasis and the coordinated processes of glycolysis and celldeath (reviewed in ref. 40). These results invite more attentionto these facets of cellular regulation in unraveling the role of mycin neoplastic as well as normal development.
This work was supported by Grants CA-20068 and CA-68328 from theNational Cancer Institute.
1. Brown, P. O. & Botstein, D. (1999) Nat. Genet. 21, 33–37.2. Perou, C. M., Jeffrey, S. S., van de Rijn, M., Rees, C. A., Eisen, M. B., Ross,
D. T., Pergamenschikov, A., Williams, C. F., Zhu, S. X., Lee, J. C., et al. (1999)Proc. Natl. Acad. Sci. USA 96, 9212–9217.
3. DePinho, R. A., Schreiber-Agus, N. & Alt, F. W. (1991) Adv. Cancer Res. 57, 1–46.4. Nesbit, C. E., Tersak, J. M. & Prochownik, E. V. (1999) Oncogene 18,
3004–3016.5. Grandori, C., Cowley, S. M., James, L. P. & Eisenman, R. N. (2000) Annu. Rev.
Cell Dev. Biol. 16, 653–699.6. Neiman, P. E. (1994) Adv. Immunol. 56, 467–484.7. Maas, H. J. L., Deboer, G. F. & Groenend, J. E. (1982) Avian Pathol. 11,
309–327.8. Thompson, C. B., Humphries, E. H., Carlson, L. M., Chen, C.-L. H. & Neiman,
P. E. (1987) Cell 51, 371–381.9. Cooper, M. D., Payne, L. N., Dent, P. B., Burmester, B. R. & Good, R. A.
(1960) J. Natl. Cancer Inst. 41, 373–389.10. Neiman, P., Wolf, C., Enrietto, P. J. & Cooper, G. M. (1985) Proc. Natl. Acad.
Sci. USA 82, 222–236.11. Baba, T. W. & Humphries, E. H. (1985) Proc. Natl. Acad. Sci. USA 82, 213–216.12. Baba, T. W. & Humphries, E. H. (1985) Virology 144, 139–151.13. Buerstedde, J.-M. & Takeda, S. (1991) Cell 67, 179–188.14. Neiman, P. E., Gehly, E. B., Carlson, L. M., Cotter, R. C. & Thompson, C. B.
(1988) Curr. Top. Microbiol. Immunol. 141, 67–74.15. Eisen, M. B., Spellman, P. T., Brown, P. O. & Botstein, D. (1998) Proc. Natl.
Acad. Sci. USA 95, 14863–14868.16. Tamayo, P., Slonim, D., Mesirov, J., Zhu, Q., Kitareewan, S., Dmitrovsky, E.,
Lander, E. S. & Golub, T. R. (1999) Proc. Natl. Acad. Sci. USA 96, 2907–2912.17. Sive, H. L. & St. John, T. (1988) Nucleic Acids Res. 16, 10937.18. Shalon, D., Smith, S. J. & Brown, P. O. (1996) Genome Res. 6, 639–645.19. DeRisi, J. L., Iyer, V. R. & Brown, P. O. (1997) Science 278, 680–686.20. Tirunagaru, V. G., Sofer, L., Cui, J. & Burnside, J. (2000) Genomics 66,
144–151.21. Abdrakhmanov, D., Lodygin, D., Geroth, P., Arakawa, H., Law, A., Plachy, J.,
Korn, B. & Buerstedde, J.-M. (2000) Genome Res. 10, 2062–2069.
22. Eskola, J. & Toivanen, P. (1974) Cell. Immunol. 13, 459–471.23. Miller, A. D. & Rosman, G. J. (1989) BioTechniques 7, 980–990.24. Neiman, P. E., Summers, J., Thomas, S. J., Xuereb, S. & Loring, G. (1994) Cold
Spring Harbor Symp. Quant. Biol. 59, 509–515.25. Le Douarin, N. M., Houssaint, E., Jotereau, F. V. & Belo, M. (1975) Proc. Natl.
Acad. Sci. USA 72, 21701–21705.26. Neiman, P. E., Thomas, S. J. & Loring, G. (1991) Proc. Natl. Acad. Sci. USA
88, 5857–5861.27. Jacobsen, K. A., Paramithiotis, E., Ewert, D. L. & Ratcliffe, M. J. (1996) Adv.
Exp. Med. Biol. 406, 155–165.28. Dang, C. V. (1999) Mol. Cell. Biol. 19, 1–11.29. Brandvold, K. A., Ewart, D. L., Kent, S. C., Neiman, P. E. & Ruddell, A. (2001)
Oncogene, in press.30. Neiman, P., Payne, L. N. & Weiss, R. A. (1980) J. Virol. 34, 178–186.31. Coller, H. A., Grandori, C., Tamayo, P., Colbert, T., Lander, E. S., Eisenman,
R. N. & Golub, T. R. (2000) Proc. Natl. Acad. Sci. USA 97, 3260–3265.32. O’Hagan, R. C., Schreiber-Agus, N., Chen, K., David, G., Engelman, J. A.,
Schwab, R., Alland, L., Thomson, C., Ronning, D. R., Sacchettini, J. C., et al.(2000) Nat. Genet. 24, 113–119.
33. Schumacher, M., Kohlhuber, F., Holzel, M., Kaiser, C., Burtscher, H., Jarsch,M., Bornkamm, G. W., Laux, G., Polack, A., Weidle, U. H. & Eick, D. (2001)Nucleic Acids Res. 29, 397–406.
34. Felsher, D. W. & Bishop, J. M. (1999) Mol. Cell 4, 199–207.35. Krude, T. (1999) Eur. J. Biochem. 263, 1–5.36. Mai, S., Fluri, M., Siwarski, D. & Huppi, K. (1996) Chromosome Res. 4,
365–371.37. Felsher, D. W. & Bishop, J. M. (1999) Proc. Natl. Acad. Sci. USA 96, 3940–3944.38. Johnston, L. A., Prober, D. A., Edgar, B. A., Eisenman, R. N. & Gallant, P.
(1999) Cell 98, 779–790.39. Iritani, B. M. & Eisenman, R. N. (1999) Proc. Natl. Acad. Sci. USA 96,
13180–13185.40. Vander Heiden, M. G. & Thompson, C. B. (1999) Nat. Cell Biol. 1,
E209–E216.
Neiman et al. PNAS u May 22, 2001 u vol. 98 u no. 11 u 6383
MED
ICA
LSC
IEN
CES
Copyright © 2022 FDOKUMEN