Alternating evolutionary pressure in a genetic algorithm facilitates protein model selection
17
BioMed Central Page 1 of 17 (page number not for citation purposes) BMC Structural Biology Open Access Research article Alternating evolutionary pressure in a genetic algorithm facilitates protein model selection Marc N Offman, Alexander L Tournier and Paul A Bates* Address: Biomolecular Modelling Laboratory, Cancer Research UK London Research Institute, Lincoln's Inn Fields Laboratories, London, WC2A 3PX, UK Email: Marc N Offman - [email protected]; Alexander L Tournier - [email protected]; Paul A Bates* - [email protected] * Corresponding author Abstract Background: Automatic protein modelling pipelines are becoming ever more accurate; this has come hand in hand with an increasingly complicated interplay between all components involved. Nevertheless, there are still potential improvements to be made in template selection, refinement and protein model selection. Results: In the context of an automatic modelling pipeline, we analysed each step separately, revealing several non-intuitive trends and explored a new strategy for protein conformation sampling using Genetic Algorithms (GA). We apply the concept of alternating evolutionary pressure (AEP), i.e. intermediate rounds within the GA runs where unrestrained, linear growth of the model populations is allowed. Conclusion: This approach improves the overall performance of the GA by allowing models to overcome local energy barriers. AEP enabled the selection of the best models in 40% of all targets; compared to 25% for a normal GA. Background Impressive progress in protein structure modelling has been achieved over the last decade; however, improve- ment between subsequent rounds of the Critical Assess- ment of Techniques for Protein Structure Prediction (CASP) is often considered to be modest [1,2]. Given the current accuracy, protein models are useful for qualitative analysis and decision-making in support of a wide range of experimental work. High accuracy modelling is essen- tial for important applications such as, molecular replace- ment experiments [3-5], function predictions [6] and virtual drug screening [7]. Modelling techniques, how- ever, are still not accurate enough to close the gap between known protein sequences (approximately 5 million non redundant) and solved protein structures (approximately 50,000). Regardless of the current limitations of modelling, two very encouraging observations have been made from the CASP7 results [1,8,9]. First, the gap between the quality of fully automated and manual modelling techniques has narrowed and second, improvement beyond the best tem- plate is achieved more frequently. Modern template-based modelling pipelines can be divided into a number of common steps. A typical pipe- line starts with template identification and alignment construction. In the next step, models are built using sin- Published: 1 August 2008 BMC Structural Biology 2008, 8:34 doi:10.1186/1472-6807-8-34 Received: 4 June 2008 Accepted: 1 August 2008 This article is available from: http://www.biomedcentral.com/1472-6807/8/34 © 2008 Offman et al; licensee BioMed Central Ltd. This is an Open Access article distributed under the terms of the Creative Commons Attribution License (http://creativecommons.org/licenses/by/2.0 ), which permits unrestricted use, distribution, and reproduction in any medium, provided the original work is properly cited.
-
Upload
independent -
Category
Documents
-
view
0 -
download
0
Transcript of Alternating evolutionary pressure in a genetic algorithm facilitates protein model selection

BioMed CentralBMC Structural Biology
ss
Open AcceResearch articleAlternating evolutionary pressure in a genetic algorithm facilitates protein model selectionMarc N Offman, Alexander L Tournier and Paul A Bates*Address: Biomolecular Modelling Laboratory, Cancer Research UK London Research Institute, Lincoln's Inn Fields Laboratories, London, WC2A 3PX, UK
Email: Marc N Offman - [email protected]; Alexander L Tournier - [email protected]; Paul A Bates* - [email protected]
* Corresponding author
AbstractBackground: Automatic protein modelling pipelines are becoming ever more accurate; this hascome hand in hand with an increasingly complicated interplay between all components involved.Nevertheless, there are still potential improvements to be made in template selection, refinementand protein model selection.
Results: In the context of an automatic modelling pipeline, we analysed each step separately,revealing several non-intuitive trends and explored a new strategy for protein conformationsampling using Genetic Algorithms (GA). We apply the concept of alternating evolutionarypressure (AEP), i.e. intermediate rounds within the GA runs where unrestrained, linear growth ofthe model populations is allowed.
Conclusion: This approach improves the overall performance of the GA by allowing models toovercome local energy barriers. AEP enabled the selection of the best models in 40% of all targets;compared to 25% for a normal GA.
BackgroundImpressive progress in protein structure modelling hasbeen achieved over the last decade; however, improve-ment between subsequent rounds of the Critical Assess-ment of Techniques for Protein Structure Prediction(CASP) is often considered to be modest [1,2]. Given thecurrent accuracy, protein models are useful for qualitativeanalysis and decision-making in support of a wide rangeof experimental work. High accuracy modelling is essen-tial for important applications such as, molecular replace-ment experiments [3-5], function predictions [6] andvirtual drug screening [7]. Modelling techniques, how-ever, are still not accurate enough to close the gap betweenknown protein sequences (approximately 5 million non
redundant) and solved protein structures (approximately50,000).
Regardless of the current limitations of modelling, twovery encouraging observations have been made from theCASP7 results [1,8,9]. First, the gap between the quality offully automated and manual modelling techniques hasnarrowed and second, improvement beyond the best tem-plate is achieved more frequently.
Modern template-based modelling pipelines can bedivided into a number of common steps. A typical pipe-line starts with template identification and alignmentconstruction. In the next step, models are built using sin-
Published: 1 August 2008
BMC Structural Biology 2008, 8:34 doi:10.1186/1472-6807-8-34
Received: 4 June 2008Accepted: 1 August 2008
This article is available from: http://www.biomedcentral.com/1472-6807/8/34
© 2008 Offman et al; licensee BioMed Central Ltd. This is an Open Access article distributed under the terms of the Creative Commons Attribution License (http://creativecommons.org/licenses/by/2.0), which permits unrestricted use, distribution, and reproduction in any medium, provided the original work is properly cited.
Page 1 of 17(page number not for citation purposes)

BMC Structural Biology 2008, 8:34 http://www.biomedcentral.com/1472-6807/8/34
gle templates, multiple templates or template fragments.The resulting models are then often refined, and finallythe models are ranked and the "best" model selected.
Template search and alignment algorithms are showingsignificant improvements in accuracy and are becomingincreasingly efficient. Well established sequence align-ment algorithms such as FASTA [10], BLAST [11] and PSI-BLAST [12] are often replaced, or enhanced by more sen-sitive algorithms. These sensitive algorithms are based onmultiple sequence alignments, sequence profiles or Hid-den Markov models and take other information such assecondary structure prediction into account [13-17]. Theimpact of better alignments on the final model's quality issubstantial, as errors made at this stage are not likely to berecovered during the subsequent modelling process.
Once a single template or several templates have beenselected and the alignments constructed, models can bebuilt. It is common practice to search the conformationalspace in order to further refine the structures [1,18,19].Several different approaches have been developed for thistask, using conserved constraints [20], genetic algorithms[21-25], Monte Carlo sampling [26], Molecular Dynamics[27], principle components analysis [28] or a combina-tion of techniques [29-33]. Previous studies have shownthat techniques combining several approaches performbest, when the different steps are carefully balanced [9].
For quality control and to reduce computational costs,protein model ranking and filtering can be applied atalmost any stage of a modelling pipeline. Energy func-tions or statistical potentials are used to select a finalmodel and usually form an integral part of the refinementmethod itself. Given their importance, the ability to selectthe best model based on energy alone is still relativelypoor [34]. Moreover, most energy scoring methods areoptimised in the context of specific modellingapproaches, and applying them in a different environ-ment may produce less reliable results.
Model selection has become an important field of proteinmodelling, and a separate category has been introduced inthe 4th Critical Assessment of Fully Automated StructurePrediction (CAFASP4) named Model Quality AssessmentPrograms (MQAP). The importance of this field was fur-ther underlined by a category called quality assessment(QA) introduced in CASP7 [35].
Several independent methods have been established andwidely used to differentiate between models of high andpoor quality [36-42]. Two different approaches can be dis-tinguished; MQAPs scoring models in the context ofmodel ensembles and MQAPs scoring single models inde-pendently. However, most of the top ranking MQAPs are
dependent on the information of model ensembles[35,38].
Despite all of the above efforts and improvement in pro-tein model construction, ranking and selection, it is stillnot possible to consistently produce models of high qual-ity. To further progress template-based modelling, it isnecessary to carefully evaluate each step and minimise theaccumulated errors. Here, we describe a hierarchical mod-elling approach (template-based modelling), where eachstep has been carefully evaluated, giving new insights intogenerating and selecting better models. A known limita-tion of Genetic Algorithm (GA) approaches in proteinmodelling is that models tend to end up in local minima,not exploring the conformational landscape enough to beable to find the global energy minima. As a way to allevi-ate this situation we have implemented the novel conceptof Alternating Evolutionary Pressure (AEP) into ourGenetic Algorithm (GA) search engine. In AEP intermedi-ate rounds of unrestricted linear growth are introduced,enabling the models to overcome small energy barriers.The AEP approach is shown to promote greater samplingof the conformational landscape thereby enabling betterstructures to emerge, thus facilitating final model selec-tion.
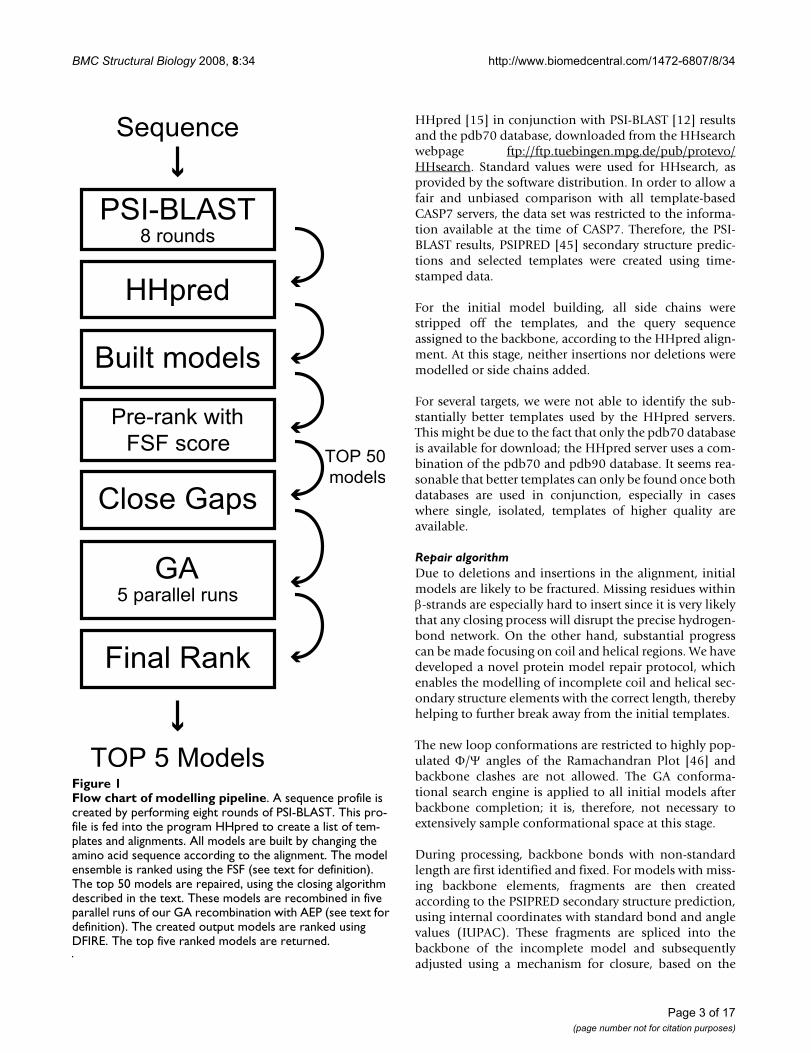
MethodsIn the following, the dataset, the algorithms applied andthe pipeline of the modelling approach are described. Thecore of the method is an optimization protocol based ona Genetic Algorithm (GA). This approach mimics theprinciples of evolution, combining and mutating proteinmodel ensembles. Details of the GA approach used tomodel and refine protein structures can be found in a pre-vious publication [22]. To assure maximum yield, eachstep in the modelling pipeline has been evaluated sepa-rately. For an overview of the pipeline see Figure 1.
DatasetAs the main objective of this work is to highlight prob-lems in protein modelling and to extract potential solu-tions, the performance of the approach was benchmarkedagainst well established modelling methods. We consid-ered all sequences from the seventh round of CASP [43]which were downloaded from the Protein Structure Pre-diction Center webpage (http://www.predictioncenter.org/[44]). The 104 protein sequences comprise 77single and 27 multi-domain proteins. The final datasetconsists of the 75 targets out of the 104 targets, for whichreasonable templates could be identified.
Template identification, sequence alignments and initial model buildingTemplates were identified and sequence alignments con-structed using the Hidden Markov model based algorithm
Page 2 of 17(page number not for citation purposes)
BMC Structural Biology 2008, 8:34 http://www.biomedcentral.com/1472-6807/8/34
HHpred [15] in conjunction with PSI-BLAST [12] resultsand the pdb70 database, downloaded from the HHsearchwebpage ftp://ftp.tuebingen.mpg.de/pub/protevo/HHsearch. Standard values were used for HHsearch, asprovided by the software distribution. In order to allow afair and unbiased comparison with all template-basedCASP7 servers, the data set was restricted to the informa-tion available at the time of CASP7. Therefore, the PSI-BLAST results, PSIPRED [45] secondary structure predic-tions and selected templates were created using time-stamped data.
For the initial model building, all side chains werestripped off the templates, and the query sequenceassigned to the backbone, according to the HHpred align-ment. At this stage, neither insertions nor deletions weremodelled or side chains added.
For several targets, we were not able to identify the sub-stantially better templates used by the HHpred servers.This might be due to the fact that only the pdb70 databaseis available for download; the HHpred server uses a com-bination of the pdb70 and pdb90 database. It seems rea-sonable that better templates can only be found once bothdatabases are used in conjunction, especially in caseswhere single, isolated, templates of higher quality areavailable.
Repair algorithmDue to deletions and insertions in the alignment, initialmodels are likely to be fractured. Missing residues withinβ-strands are especially hard to insert since it is very likelythat any closing process will disrupt the precise hydrogen-bond network. On the other hand, substantial progresscan be made focusing on coil and helical regions. We havedeveloped a novel protein model repair protocol, whichenables the modelling of incomplete coil and helical sec-ondary structure elements with the correct length, therebyhelping to further break away from the initial templates.
The new loop conformations are restricted to highly pop-ulated Φ/Ψ angles of the Ramachandran Plot [46] andbackbone clashes are not allowed. The GA conforma-tional search engine is applied to all initial models afterbackbone completion; it is, therefore, not necessary toextensively sample conformational space at this stage.
During processing, backbone bonds with non-standardlength are first identified and fixed. For models with miss-ing backbone elements, fragments are then createdaccording to the PSIPRED secondary structure prediction,using internal coordinates with standard bond and anglevalues (IUPAC). These fragments are spliced into thebackbone of the incomplete model and subsequentlyadjusted using a mechanism for closure, based on the
Flow chart of modelling pipelineFigure 1Flow chart of modelling pipeline. A sequence profile is created by performing eight rounds of PSI-BLAST. This pro-file is fed into the program HHpred to create a list of tem-plates and alignments. All models are built by changing the amino acid sequence according to the alignment. The model ensemble is ranked using the FSF (see text for definition). The top 50 models are repaired, using the closing algorithm described in the text. These models are recombined in five parallel runs of our GA recombination with AEP (see text for definition). The created output models are ranked using DFIRE. The top five ranked models are returned.
Sequence
PSI-BLAST8 rounds
HHpred
Built models
Pre-rank with FSF score
Close Gaps
GA5 parallel runs
Final Rank
TOP 5 Models
TOP 50models
Page 3 of 17(page number not for citation purposes)

BMC Structural Biology 2008, 8:34 http://www.biomedcentral.com/1472-6807/8/34
cyclic coordinate descent algorithm [47]. The procedure isfully automated and only requires a protein model andthe PSIPRED prediction. All parameters used in the clos-ing algorithm's procedure were derived from our GA algo-rithm, which was trained on the CASP6 and CAFASP4datasets. For algorithmic details [see Additional file 1].
Model rankingSeveral energy functions are used throughout the model-ling pipeline. Preliminary investigations indicated thatpoor quality input models are not selected in the GA opti-mization process. Using model pre-ranking to removethese models at an early stage, allows more computationaltime to be spent on the better models. In the presentapproach, the best models are selected after optimizationbased on their energy scores. To quantify the ranking abil-ity of our energy-scoring scheme for models, we calculatethe Pearson correlation-coefficient between the energyand SC scores, defined below.
Structure Comparison (SC) scoreIn order to assess the quality of the models generated, ameasure describing the conformational similaritybetween models and the known native structure (target)was required. We used a structural comparison scoringscheme, defined as the mean of the scaled TM [48], GDT[49] and maxsub [50] scores. Since all three scores arescaled to the range [0, 1], the final SC score also rangesfrom 0 to 1.
Energy scoring schemesFor each target all models were ranked using several differ-ent scoring schemes. A novel Fast Scoring Function (FSF)was used in the pre-ranking step. The FSF scoring schemeis composed of the following terms:
SFSF = w1Spp + w2Scl + w3Sss
Where Spp, the residue-residue pair potentials, is a score of theinternal packing according to an empirically derivedmixed backbone atom-centroid potential, as describedpreviously [21,22]. Scl, the clash penalty, clashes arecounted between two residues if any two backbone-atomsfrom any pair of non-consecutive residues are closer than2 Å. Sss, the secondary structure score, is a sum of PSIPREDconfidence scores for matches between predicted [45] andassigned secondary structure. The weights for the FSF wereselected using the simplex algorithm [51] on the CASP6and CAFASP4 datasets and are given by: w1 = 1.0, w2 = 2.4and w2 = -2.4.
For scoring of the model populations during the GA opti-mization, the coarse energy score is used to preselect themodels and reduce the population size to 100 models.Subsequently the fine energy score is used to furtherreduce the population to 50 models that are used for thenext round.
The coarse scoring scheme includes the following terms:
Scoarse = w1Spp + w2Scl + w3Sss + w4Shb + w3ΔScomp
Where Spp, Scl and Sss are defined as for the FSF. Shb, thenumber of hydrogen bonds calculated using the softwareSTRIDE [52]. ΔScomp is the compactness reference score[22]. The weights for the coarse scoring scheme are: w1 =1.0, w2 = 2.07, w3 = -4.20, w4 = -0.46 and w5 = 1.37.
The fine scoring scheme includes the following terms:
Sfine = w1Seef + w2Sse + w3ΔScomp
Where Seef is calculated in the following way. SCWRL 3.0is used to replace all the side chains [53] for the energy cal-culation (standard parameters given by the program areused). All scored models are minimised and then scoredusing the effective energy function [54] (EEF) inCHARMM. Sse, the solvent accessibility is calculated usingthe software POPS_A [55] and the solvation free energy[36]. ΔScomp, as previously defined [22]. The weights forthe fine scoring scheme are: w1 = 1.0, w2 = 0.20 and w3 =0.20.
After optimization with the GA protocol, the final modelsare ranked with a combination of the fine and coarseenergy scores, and an all atom pair-potential score, DFIRE[56]. In the combined energy function the coarse and fineenergy components are weighted according to the besttemplate's sequence identity. Sequence identities werebinned into three ranges: 0 – 0.3, 0.3 – 0.5, 0.5 – 1.0. Foreach of these ranges, the weights were optimised using thesimplex algorithm on the CASP6 dataset, see Table 1.
The most representative structure of the final ensemble,which is taken from the middle of the largest cluster, was
SC TM GDT maxsub= + +( )13
Table 1: Weights for combined energy score
Sequence identity Weight coarse Weight fine
0 – 0.3 1 10.3 – 0.5 0.75 10.5 – 1 0.375 1
Weights for the final combined energy score assigned using the simplex algorithm, calculated from the CASP6 and CAFASP4 datasets. The higher the sequence identity, the less the coarse score is weighted.
Page 4 of 17(page number not for citation purposes)

BMC Structural Biology 2008, 8:34 http://www.biomedcentral.com/1472-6807/8/34
used as a control. This was done to investigate how con-sistently the top ranked solutions are selected, comparedto the most representative conformation of the finalensemble.
Energy minimizationTo investigate whether full Cartesian space minimizationfacilitates protein model selection, all models, repairedand un-repaired, were minimised. The steepest descentand adopted basis Newton-Raphson methods wereapplied, as implemented in CHARMM [57] until the valueof the gradient dropped below 1.0 kcal mol-1 Å -2.
GA recombinationWe previously described an efficient move-set used tosearch conformational space of protein models [22]. Thismove-set includes three global operators: the single anddouble crossover and the protein mutation operator; andtwo local operators: the helix and the coil mutation oper-ators. A quick protein health check is performed duringand after the application of the operators: Φ/Ψ anglesmust lie within the highly populated areas of the Ramach-andran Plot and the change in energy-score is subject to apseudo Metropolis criterion. The protocol was optimisedusing the CASP6 and CAFASP4 datasets.
The following modifications have been made to the pro-tocol. Firstly, the input models are clustered using thenearest neighbour method. The metric for this clusteringapproach is based upon overall protein model similarityweighted with the secondary structure scores. Only thelargest two clusters are used for further optimization,thereby removing a few, poor outliers. Secondly, the rangeof movement for mutations has been changed, to allowfiner movements. This was achieved by allowing all valueswithin the highly populated areas of the Ramachandranplot.
After applying the closing algorithm to all selected mod-els, the models were submitted to five parallel runs of theGA protocol. The optimization is run for at least five, anda maximum of 10 rounds, dependant on the populationconvergence. Running the GA for longer was found toincrease the probability of ending in incorrect localminima conformations (data not shown).
Alternating evolutionary pressureIn a GA where Alternating Evolutionary Pressure (AEP) isapplied, a number of non-scored rounds are allowedbetween each scored sampling round. In these non-scoredrounds, the population grows linearly and the structuresin the ensemble are allowed to sample energetically unfa-vourable states. Although energy evaluation is notapplied, to ensure reasonable sampling, basic proteinhealth checks associated with the operators are still in
place. Four different setups were applied: a normal GAand a GA with one to three non-scored intermediaterounds. In each setup, 10 fully ranked rounds were per-formed where the population was reduced to the top 50models.
AccessibilityThe complete modelling procedure can be accessed via aweb server interface at: http://bmm.cancerresearchuk.org/~populus[58]. The average running time for a proteinmodel of 150 residues is 6–7 hours for the standard GAand 15–25 hours if two intermediate non-scored roundsare used (AEP2). For details of this server [see Additionalfile 1].
Results and discussionFor this study we modelled 75 diverse protein sequencesfrom the CASP7 dataset of the category template-basedmodelling. First, a novel backbone repair algorithm isintroduced and compared to the performance of MODEL-LER. In the next step an optimal setup for pre-ranking isinvestigated. The resulting models are recombined using aGA and the improvement in model selection due to theintroduction of AEP is shown. Finally, a summary is givenshowing the performance of several possible modellingpipelines.
Structural comparison of models before and after repairWe have developed a novel algorithm for completing andclosing protein backbones. Coil and helical regions arecompleted and the length of incomplete helical secondarystructure elements is adjusted to agree with the predictedsecondary structure. In contrast to other loop modellingmethods, only a single conformation is created for eachadded structural element. These conformations are furthersampled once the model undergoes recombination usingthe GA.
The distribution of improvement in SC score due to thisrepair process is shown in Figure 2. In 72% of all cases,completed structures show improvement in comparisonto their initial score. The models improved by the repairalgorithm show an average improvement of 0.015 SCscore and the best 25% of the population (3rd quantile)shows an improvement greater than 0.02 SC score.
Analysing the SC score in terms of the assigned secondarystructure, we found that approximately 80% of theimprovement made for all models lies within helical sec-ondary structure elements (see Figure 2 inset). In contrastto this, only approximately 20% improvement is gainedcompleting coil regions. Approximately 60% of theimprovement is situated in the core region, defined hereas the region between the N and C terminal secondary
Page 5 of 17(page number not for citation purposes)

BMC Structural Biology 2008, 8:34 http://www.biomedcentral.com/1472-6807/8/34
structure elements. The rest of the improvement is locatedwithin the termini.
Comparing the models derived from the top ten align-ments of each target, with the equivalent models con-structed with the automodel function in MODELLER [59],the repairing algorithm scores on average 0.428 SC scorecompared to 0.427 SC score for MODELLER. Althoughthe score for the closing algorithm is not significantly bet-ter, this method allows repair of models without the needfor the alignment and/or template.
Initial rankingFor modelling pipelines with extensive conformationalsearch algorithms it is not obvious when to rank models.
Ranking can be applied at several stages, such as beforeinsertions and deletions are dealt with, after backbonecompletion, after minimization or after refinement. Intu-itively, one might think that backbone completion is aminimum criterion to be fulfilled before further consider-ation on model quality can be made. To address this ques-tion, we analysed the effectiveness of the FSF and DFIREscoring schemes before and after repair.
Figure 3 presents the Pearson correlation coefficient, i.e.the correlation between SC score and energy score, for dif-ferent setups, and scoring schemes (the Spearman correla-tion-coefficient shows similar results). Surprisingly, theranking of repaired models produces a lower correlation-coefficient than the ranking of un-repaired models. The
Distribution of the ΔSC score after model repairFigure 2Distribution of the ΔSC score after model repair. The frequency of ΔSC scores for repaired models is shown. Models with negative values have a decreased SC score after backbone repair. Improved models have a positive value. The distribution is shifted towards model improvement. In the insets, it can be seen that more than 80% of improvement lies within helical regions. Most of the improvement is situated in the protein core, the region between the two terminal elements.
-0.06 -0.04 -0.02 0 0.02 0.04 0.06 Δ SC score
Freq
uenc
y
0%10%20%30%40%50%60%70%80%90%
100%
Coil
Helix
0%10%20%30%40%50%60%70%80%90%
100%
C-TerminusCoreN-Terminus
Page 6 of 17(page number not for citation purposes)

BMC Structural Biology 2008, 8:34 http://www.biomedcentral.com/1472-6807/8/34
same trend is seen whether the FSF or the DFIRE energyfunction is applied, showing this effect to be independentof the actual energy-based/statistical scoring functionused. This observation can be explained by the following.Models derived from alignments with fewer insertionsand deletions tend to be closer to the template and aregenerally of better quality. Due to the use of pair potentialenergy functions, models with more residues tend to havebetter energies. Hence before repair, the better modelswith fewer insertions/deletions have lower energy scores.Once repaired, this effect disappears and the advantagegained from the better initial template quality is notpicked up by the energy functions anymore.
On the other hand, ranking according to the alignmentsscores given by the alignments algorithms is normally notsufficient for model selection either. Ranking purely basedon the coverage dependant sequence identities of thealignments, produced a correlation score of 0.772, 12%smaller than the best FSF ranking.
In Figure 3 it can be seen that the best ranking is obtainedusing the FSF on unrepaired, minimised structures,improving the correlation by 6% compared to the bestDFIRE configuration and by 13% compared to rankingusing the weighted SID. Non-repaired models are gener-
ally easier to rank, this is valid both for DFIRE and the FSF.Ranking unrepaired models results in an improved corre-lation coefficient of 6.2% for DFIRE, 4.7% for the FSF.Minimization further facilitates ranking ability for unre-paired models by a further 1% using the FSF.
RecombinationTo further sample the conformational space and select agood final model, all repaired models were recombinedand optimised using the GA. Figure 4 shows the median,first and third quantile of the different modelling popula-tions pre/post GA. All GA runs only have ten fine energyscored rounds. Applying more than ten fine energyrounds increases the probability of convergence of themodel ensemble into a local minimum [see Additionalfile 1, Figure S3].
Running the GA optimization using the SC score to thenative protein structure as the fitness function shows howmuch improvement can potentially be [see Additional file1, Figure S2]. After the application of the GA using thenative structure as guidance, the model ensemble is verynarrow and on average the final population is improvedby 51% to an SC score of 0.643 for non-repaired and0.658 for repaired models. Interestingly even in this idealscenario the move set is unable to produce better structure
Correlation-coefficient for FSF score and DFIREFigure 3Correlation-coefficient for FSF score and DFIRE. The Pearson correlation coefficient is shown for different model data-sets and scoring functions. Weighted SID, DFIRE and the FSF are used for the ranking. Repaired (R), non-repaired (crossed R), minimised (M) and non-minimised (crossed M) models are ranked and compared. Repairing models decreases the correlation coefficients for DFIRE and FSF. Minimisation further improves the ranking ability of the FSF. The best correlation-coefficient can be observed for minimised, non-repaired models.
0.824 0.828
0.854
0.8670.874
0.82
0.84
0.86
0.88
0.9
0.776
0.72
0.74
0.76
0.78
0.8
DFIRE FSF
RM
RM
RM
RM
RM
RM
Co
rrel
atio
n C
oef
ficie
nt
0.772
SID
Page 7 of 17(page number not for citation purposes)

BMC Structural Biology 2008, 8:34 http://www.biomedcentral.com/1472-6807/8/34
due to a lack of good quality templates, absence of sec-ondary structure elements in the model population orinsufficient sampling. It can also be seen that repairedmodels clearly improve the overall population, due to themodels not missing secondary structure elements. Longersampling further increases the improvement, but for the
purpose of comparison we limited the sampling to 10rounds.
In practice we do not have access to the reference structureand have to rely on energy scores to drive the GA. Figure 4also shows the results using different energy scores for
Population distribution pre- and post-GAFigure 4Population distribution pre- and post-GA. The median, first and third quantile are shown for three different setups. In each setup the average of all model distributions are given for repaired (R) and non-repaired (NR) models. The population for the initial, pre-GA models is broad and lies well below the distribution for the post-GA populations. Repaired models show only small improvement for the pre-GA and post-GA energy based model ensembles. However, a clear advantage can be seen once the GA which is directly driven towards the native structure is applied. The populations for the energy driven GA runs can be seen in more detailed in the graph inset. Here, it is also shown how well good models can be selected using different energy functions. These scores are for the averages of the SC scores for the lowest-energy model of each target. The energy functions used are the combined (red dot), the coarse (green diamond), the fine (purple filled square) and DFIRE (blue empty square) for the standard GA and AEP1-3. As the combined energy and DFIRE score has been found to produce the best results, the other scores are not shown for the AEP. The best model selection is seen for AEP2 which has a narrower popula-tion distribution with some good individual outliers. The distribution for AEP3 shows a drop in good models; furthermore, a decreased ability to select good models is shown.
pre GA post GA usingreference structure
post GA using energy scores
Page 8 of 17(page number not for citation purposes)

BMC Structural Biology 2008, 8:34 http://www.biomedcentral.com/1472-6807/8/34
final model selection. It can be seen that repairing struc-tures does improve the top model, for all energy functionsused. The best results can be obtained using the DFIREenergy function producing a 2.4% improvement com-pared to the fine score, a 1.4% improvement compared tothe FSF score and a 0.5% improvement compared to thecombined energy function.
The difference between the average SC score for the bestmodels created using the energy and SC score to drive theGA is only 7%. However, a further 4% improvement islost when selecting the model with the lowest energy outof the final energy driven ensemble.
Alternating evolutionary pressure (AEP)GAs and other similar conformational search algorithmssuffer from the problem that they tend to stay within localminima instead of exploring further afield and potentiallyfinding a deeper minimum. We investigated whether
alternating evolutionary pressure (AEP) could facilitateenergy based model selection, by gently pushing modelsover small energy barriers. This idea is illustrated in Figure5, showing that small changes in protein structure,although insignificant in terms of the SC score, producesignificantly better energies, hence facilitating proteinmodel selection.
Two main elements dictate the success of GA approaches.One is the set of operators (move-set) and the other is thefitness function (energy scoring scheme). Classically, GAsoperate for several generations, iteratively applying theconformational search engine and the fitness function[60] until convergence is obtained. However, interestingresults can be observed, once a series of conformationalchanges are applied, without intermediate populationscoring and reduction. Within these non-scored interme-diate rounds the population grows linearly. The finerenergy evaluation and the reduction of the model ensem-
Energy landscapeFigure 5Energy landscape. Due to energy barriers, some models need to be nudged in order to fall into their optimal energy basins. A relatively small change in structural conformation can have a marked effect on a model's energy; SC scores are given along the energy landscape (top and bottom). A curved representation is chosen to highlight the three-dimensional nature of energy landscapes. Dark circles are conformations that are scored; light grey circles are non-scored, intermediate, conformations. In case (a) one non-scored intermediate conformation is needed to climb a small energy barrier. A more difficult case is shown in (b), where a maximum of two consecutive intermediate conformations are required, before energy evaluation. Case (c) shows a scenario where no intermediate conformation is required.
Energy
acb
0.852
0.852
0.854
0.854
0.856
0.856
Page 9 of 17(page number not for citation purposes)

BMC Structural Biology 2008, 8:34 http://www.biomedcentral.com/1472-6807/8/34
ble to the best members are not applied; however, duringthese rounds the basic protein health checks of the opera-tors are still applied (see Methods).
A similar approach to AEP was introduced by Qian et al.,where the refinement of protein structures was achievedusing an iterative alternation of diversification and inten-sification steps [61]. This approach combines ideas fromtabu search and conformational space annealing, how-ever, it is only applied if the lowest energy refined struc-tures have not converged and show several variable andless reliable regions. In general, this methodology is dif-ferent from classical GAs where the optimization processis more variable, less directed and, therefore, convergenceis only achieved after intensive sampling. For these classi-cal GAs, the principle of AEP has only been used before toprovide theoretical predictions of algorithm performance[62]. Here, we take this idea one step further by removingthe ranking step for a number of intermediate rounds. Weused four different setups: the standard GA and the GAwith one, two and three non-scored intermediate rounds.The results presented in Figure 4 show that our ability toidentify the better conformations varies strongly depend-ing on the number of AEP rounds used. For each GAsetup, we calculated the percentage of targets for whichthe best model based on SC score also had the lowestenergy score. Using the standard GA protocol, the bestmodel was identified in 25% of all targets using the DFIREenergy scores. Similar results are produced with a single(AEP1) intermediate round (31%). For the runs with twointermediate rounds (AEP2) the best model was identifiedin 40% of all targets. However, for three intermediaterounds (AEP3) the selectivity dropped to 30%.
Allowing two intermediate, un-scored GA rounds yieldthe best results for model selection in this analysis. In thissetup, small energy barriers can be overcome, producingsome very good individual models with low energies.However, once the evolutionary pressure is too low, asseen for the AEP with three intermediate rounds, thewhole population drifts away and the quality of the low-est energy model decreases.
In Figure 6 we present the coarse energy distributions fortwo representative remote homology targets, T0300 andT0353, and fine energy distribution for two high homol-ogy targets, T0313 and T0329. Energies for the normal GAand AEP1-3 are shown for each distribution. Generally itcan be seen that the energy funnel is less well defined forlower homology modelling, T0300 and T0353, a knownobservation for energy-based model ranking. The advan-tage of the optimization process with AEP2 (green) isillustrated in T0300. In this energy plot it can be seen thatmore sampling of higher quality models is found forAEP2 (green). Indeed, for 80% of all cases, including
T0300, T0329 and T0353, AEP2 produced the best resultsin the final selection. T0313 and T0329 are exampleswhere sampling with the standard GA is sufficient. In thecases of T0300, T0329 and T0353 the problem of localminima for AEP3 (blue) can be seen, where some individ-ual models of poorer quality have very low energies com-pared to all other sampled models. Sampling of thenormal GA is often not as thorough as for AEP, which canbe seen in T0300 and especially well in T0353, two hardermodelling targets. AEP1 is sampling more space than thestandard GA, but still less than AEP2 and produces infe-rior results.
In order to further understand the effects of AEP weapplied several "normal GA" runs with adapted parame-ters. First standard GAs were run with the same number ofrounds as given for AEP1-3; these runs produced signifi-cantly inferior results compared to the standard GA. Thiseffect can be explained by the oversampling of localminima, which could not be prevented even using statis-tically derived constraints (constraining the less variablestructural regions). Additionally, we increased the popula-tion size for normal GAs to 500, 1000 and 1500 modelsper round, which increased the computational costs butdid not show any improvement in model quality for thelowest energy ranked models. In general, it seems that theAEP2 protocol gives the better balance between samplingthe variable regions without drifting too far away inregions that are more structurally conserved; models thatundergo consecutive multiple mutations in the structur-ally conserved regions are less likely to survive.
Below, we present two cases; the first where there is noimprovement using AEP; the second where significantimprovement could be achieved having two intermediate,un-scored, sampling rounds.
Case I: T0380For T0380 a β-strand mainly protein with 145 residueshad to be modelled. With the template search 17 differenttemplates were identified and, after backbone comple-tion, the SC scores ranged from 0.292 – 0.761. Only onehigh quality template was identified for the starting pop-ulation. The best member in all final ensembles had a SCscore of approximately 0.77. For none of the four recom-bination-setups were we able to select a model close to thebest input. The worst results were created using the AEP3.All selected models ranged between a SC score of 0.609 to0.632. Interestingly, recombination of non-repaired mod-els enabled the selection of a final model with a scoreclose to 0.772. After backbone completion, the energyfunction was not able to distinguish between a goodmodel derived from the best template, and an inferiormodel, produced by the closing algorithm.
Page 10 of 17(page number not for citation purposes)

BMC Structural Biology 2008, 8:34 http://www.biomedcentral.com/1472-6807/8/34
Case II: T0311In this case an all-helical protein with the length of 88 res-idues has been modelled. The sequence search produceda list of 165 potential templates. The top ranking align-ment produced a model with a SC score of 0.600. Thebest, repaired, input model for the recombination had aSC score of 0.617. Applying the standard GA selected amodel of relatively poor quality with a SC score of 0.575.However, allowing two non-scored intermediate roundsimproved the model beyond all initial input models andaided selecting the best member of the final ensemble,
based on energy. For this final model, which has a SCscore of 0.637, two helical secondary structure elementsshow improved positioning relative to the native struc-ture. The native structure and the best models for thestandard GA and the two intermediate rounds GA areshown superimposed in Figure 7. Clearly, the overalltopology of the non-standard GA (backbone RMSD 3.13Å) is improved relative to the standard GA model (back-bone RMSD 7.81 Å), having several helical elements inthe correct orientation.
Sampling with the normal GA and AEPFigure 6Sampling with the normal GA and AEP. The coarse and fine energy (y-axis) versus the SC score (x-axis) is plotted for 10 equally scored rounds, of four representative targets: T0300 (coarse), T0313 (fine), T0329 (fine) and T0353 (coarse). This is done to show the distribution of the models' coarse and fine energy scores; however, for all four cases both energy scores are used for ranking, as described in the methods. For the two coarse energy plots the corresponding energy funnel for the fine scoring scheme is also not particularly well defined, however, certain trends are easier to observe by plotting the coarse scor-ing scheme for these cases (see text). AEP0 (standard GA) is coloured black, AEP1 red, AEP2 green and AEP3 blue. For all four cases the energy of the native structure is shown as a red dash on the right y-axis of each graph. In the case of T0300 the energy of the native structure is much higher than a large proportion of the models. This can explained due to a particularly poor agreement between predicted and native secondary structure.
0.2 0.25 0.3 0.35 0.4 0.45-4000
-3500
-3000
-2500
-2000
AEP0AEP1AEP2AEP3
Coarse energyT0300
0.1 0.15 0.2 0.25 0.3 0.35 0.4-2000
-1500
-1000
-500
AEP0AEP1AEP2AEP3
T0353
0.2 0.3 0.4 0.5 0.6 0.7 0.8
-8000
-6000
-4000
-2000
0
AEP0AEP1AEP2AEP3
Fine energyT0313
0 0.1 0.2 0.3 0.4 0.5 0.6 0.7-5000
-4000
-3000
-2000
-1000
0
AEP0AEP1AEP2AEP3
T0329
Page 11 of 17(page number not for citation purposes)

BMC Structural Biology 2008, 8:34 http://www.biomedcentral.com/1472-6807/8/34
General improvement along the modelling pipelineThe results for the different pre- and post-GA conditionsare compared in Figure 8. Here we compare several possi-ble modelling pipelines. The first pipeline considered,consisted of model selection without application of theGA. In this context the best final models were obtainedusing the FSF on minimised and repaired models. Thisresult seems to contradict our observations on rankingcorrelation; however, here the emphasis is on final modelselection without further refinement of the population.For this setup, an improvement of 4.1% can be seen com-pared to the models derived by the initial alignment.
For all pipelines using the GA with or without AEP, theunrepaired models were pre-ranked and the resultingmodel population was repaired before optimization.Since it was shown that un-repaired models are easier to
rank, one might think that backbone completion shouldbe the final step after recombination. To test this we com-pared both possibilities and it can be seen that performingbackbone completion before the GA rather than after pro-vides an improvement of 1.4% SC score; this can beexplained by the additional sampling of the added sec-ondary structure elements in the GA optimization.
The performances of the fine, the FSF, the combined andDFIRE energy score are compared for final structure selec-tion. The best results for the energy-driven GA wereobtained using DFIRE which improves the average SCscore by 2.4% compared to the fine, 1.4% compared tothe FSF and 0.5% compared to the combined energyscore. Using DFIRE for the final model selection improvedthe average SC score for the normal GA from 0.590 to0.593.
Superimposition of models and target for T0311Figure 7Superimposition of models and target for T0311. The lowest energy model for the standard GA run (purple) and the lowest energy model for the GA with alternating evolutionary pressure (green) are superimposed onto the native structure (light blue). It can be clearly seen that the majority of helical elements superimpose better on the model produced with alter-nating pressure, resulting in a backbone RMSD of 3.13 Å. The model produced with the standard GA has a backbone RMSD of 7.81 Å to the native structure.
Page 12 of 17(page number not for citation purposes)

BMC Structural Biology 2008, 8:34 http://www.biomedcentral.com/1472-6807/8/34
Use of AEP2 during recombination further improved thefinal models' quality from 0.593 to 0.598 in SC scoreusing DFIRE for final selection. DFIRE also performs bet-ter than the combined energy score for the final selectionin AEP2. This shows the importance of using a final modelselection scoring function that is not used for the optimi-zation procedure.
Overall, an improvement of 6.8% is achieved for the opti-mum modelling pipeline (AEP2 + DFIRE) compared tothe models derived from the first alignments. Comparingthese results to the SC scores of all models produced byautomatic servers during CASP7 for our 75 targets, thenormal GA would rank 12th and the AEP2 5th.
Consistent selection of the best SC score model wouldenable a further improvement of up to 4%. Clustering, asdescribed above, was used as an alternative selection pro-
tocol to identify the most representative models, but pro-duced inferior results; on average 4.3% lower than ouroptimal setup. Visual inspection of the final modelensembles indicated that the better structures are oftenisolated from the largest clusters.
Overall, in 77.3% of all targets, the best model of the finalensemble had a greater or equal SC score compared to thebest model of the initial input population. A similar trendwas observed for the lowest energy models, where 69.3%of the lowest energy model of the final population hadgreater or equal SC score compared to the lowest energymodel of the initial population. For 18.7% of all cases thefinal lowest energy model was improved in SC score thanthe best model of the initial input population, therebyselecting or improving the best model.
Summary of average top ranksFigure 8Summary of average top ranks. Final results produced by different pipeline setups are shown. The flow of each setup is defined by symbols, ordered from bottom to top. The following symbols are given: R – repair, M – minimise, FSF – selection with FSF, FINE – selection with the fine energy function, COM – model selection with the combined energy score, DFIRE – selection using the DFIRE energy function, AVG – selecting the centre of the clustered population, BEST – selecting the best model, GA – application of the GA, GA AEP – application of the GA using alternating evolutionary pressure and GA OLD – application of the previously described GA protocol. The best pipeline uses the AEP2 GA for sampling and the final models are selected using DFIRE.
0.6000
0.6200
0.6400
0.557
0.5200
0.5400
0.5600
0.5800
1st A
lignm
ent
no GA
RMFSF
RMFSF
RMFSF
0.569
RMFSF
0.574
0.580 0.581
Aver
age
SC s
core
GA
M
R
COM
GAAEP
0.594
FSF
0.598
M
R
DFIRE
GAAEP
FSF
0.623
0.572
Control
GAOLD
0.538
M
RGA
Best
M
RGA
AVG
FSF FSF
M
RGA
FINE
R
M
FSF
GA
M
RGA
COM
0.571
0.579
0.5850.590
R
M
FSF
GA
FSF FSF FSF FSF
0.593
M
RGA
DFIRE
FSF
GA+AEP2
Page 13 of 17(page number not for citation purposes)

BMC Structural Biology 2008, 8:34 http://www.biomedcentral.com/1472-6807/8/34
Finally, possible structural errors in the selected modelswere investigated, using the ProSA web server [63] whichcompares them to X-ray crystal and NMR structures. Ascan be seen in Figure 9, all 75 models produced energy-related z-scores comparable to the scores of X-ray crystalstructures. Furthermore, it has been shown for our highaccuracy CASP7 submissions that we ranked 8th of all sub-mitting groups for the accurate prediction of the χ1/χ2angles [19]. The move set of the GA has not been changedfor this work, and therefore these findings remain valid,indicating that the conformational sampling performedin internal coordinate space does not adversely affect theside chain quality. However, as a further check of modelquality, a subset of randomly selected models plus thefinal models selected with the best overall pipeline werealso tested for stereo-chemical properties using the PRO-CHECK [64] software package. These models showed a
quality comparable to the other top-ranking models sub-mitted to CASP7.
ConclusionIn the present work we have performed a detailed analysisof the different steps that form the pipeline of our tem-plate based GA protein modelling approach. The resultsshown here, clearly demonstrate that pre-ranking shouldbe applied to unrepaired models before backbone com-pletion. Ranking of these incomplete models using thenovel FSF scoring scheme combined with minimizationwas shown to provide the best ranking (13% improve-ment compared to weighted sequence identity). Thismethod could be used to pre-select a final model in pro-tocols where rapid modelling from single templates isnecessary.
ProSA scoring of top modelsFigure 9ProSA scoring of top models. All top models, selected with DFIRE, were checked using the ProSA web server. Here, the z-scores are plotted against the protein size. Models are shown as black stars. As a control, the distribution of X-ray (light) and NMR (dark) structures from the RCSB Protein Data Bank are shown. This plot has been adapted from the results of the ProSA web server [63].
0 100 200 300 400 500 600 700 800 900 1000Number of residues
-20
-15
-10
-5
0
5
10
Z-sc
ore
• XRAY
• NMR
∗ MODEL
Page 14 of 17(page number not for citation purposes)

BMC Structural Biology 2008, 8:34 http://www.biomedcentral.com/1472-6807/8/34
DFIRE was found to be the most efficient way to select thetop model (0.593 SC score). The selectivity of DFIRE canbe further improved by introducing Alternative Evolu-tionary Pressure (AEP) to the GA protocol (0.598 SCscore). Creating subtle movements in the protein modelsusing AEP, helps to select the better models by nudgingthem to lower energy states.
When using GAs for protein modelling two differenteffects can be achieved. First, GAs can be applied toimprove models beyond the best input structure. Second,GAs can be used to ease the selection of the better proteinmodels by lowering their energies. However, lowering themodel's energy does not necessarily improve the struc-tural score. In the approach used here, the GA was used toimprove selection of good models. Improvement beyondor maintaining the best input model was seen for 77.3%of all targets. However, these models could only be iden-tified in 25% for the normal GA, 31%, 40%, 30% for AEPwith 1–3 intermediate rounds respectively.
The application of all the above strategies improves thefinal average structural score by 7.4% compared to thepurely alignment-based pipeline. This was achieved by acarefully balance between the number of sampled inter-mediate structures (AEP2), the scoring functions used inthe GA and the final selection of models with DFIRE.Overall, this pipeline would rank 5th, comparing theseresults to the scores of all models produced by automaticservers during CASP7 for our 75 targets
Further investigations and development need to be under-taken in order to make full use of the GA/AEP conforma-tional search engine. Other techniques will undoubtedlybe required to further assist conformational searchengines, such as GAs, to recover from local minima. Ingeneral more work is required to refine scoring schemes sothat the best models can be consistently selected from theensembles of structures.
Competing interestsThe authors declare that they have no competing interests.
Authors' contributionsMNO and PAB devised the work. MNO carried out allcomputational work and wrote the initial manuscriptdraft. ALT and PAB edited the paper. All authors read andapproved the final manuscript.
Additional material
AcknowledgementsWe thank all the members of the Biomolecular Modelling Laboratory for many useful discussions and insights. This work was funded by Cancer Research UK, the Barbara Mary Hill Memorial Fund and a B'nai B'rith Leo Back Lodge Scholarship awarded to MNO.
References1. Kryshtafovych A, Fidelis K, Moult J: Progress from CASP6 to
CASP7. Proteins 2007, 69 Suppl 8:194-207.2. Kryshtafovych A, Venclovas C, Fidelis K, Moult J: Progress over the
first decade of CASP experiments. Proteins 2005/09/28 edition.2005, 61 Suppl 7:225-236.
3. Giorgetti A, Raimondo D, Miele AE, Tramontano A: Evaluating theusefulness of protein structure models for molecularreplacement. Bioinformatics 2005/10/06 edition. 2005, 21 Suppl2:ii72-6.
4. Schwarzenbacher R, Godzik A, Grzechnik SK, Jaroszewski L: Theimportance of alignment accuracy for molecular replace-ment. Acta Crystallogr D Biol Crystallogr 2004/06/24 edition. 2004,60(Pt 7):1229-1236.
5. Delarue M: Molecular Replacement techniques in the contextof structural genomics. In Practical Approaches Series Edited by:Sanderson MR, Skelly J. Eds. Oxford University Press.; 2005.
6. Skolnick J, Fetrow JS, Kolinski A: Structural genomics and itsimportance for gene function analysis. Nat Biotechnol 2000/03/04 edition. 2000, 18(3):283-287.
7. Lengauer T, Lemmen C, Rarey M, Zimmermann M: Novel technol-ogies for virtual screening. Drug Discov Today 2004/02/06 edition.2004, 9(1):27-34.
8. Battey JN, Kopp J, Bordoli L, Read RJ, Clarke ND, Schwede T: Auto-mated server predictions in CASP7. Proteins 2007/09/27 edition.2007, 69 (Suppl 8):68-82.
9. Kopp J, Bordoli L, Battey JN, Kiefer F, Schwede T: Assessment ofCASP7 predictions for template-based modeling targets.Proteins 2007/09/27 edition. 2007, 69 (Suppl 8):38-56.
10. Pearson WR: Searching protein sequence libraries: compari-son of the sensitivity and selectivity of the Smith-Watermanand FASTA algorithms. Genomics 1991/11/01 edition. 1991,11(3):635-650.
11. Altschul SF, Gish W, Miller W, Myers EW, Lipman DJ: Basic localalignment search tool. J Mol Biol 1990/10/05 edition. 1990,215(3):403-410.
12. Altschul SF, Madden TL, Schaffer AA, Zhang J, Zhang Z, Miller W, Lip-man DJ: Gapped BLAST and PSI-BLAST: a new generation ofprotein database search programs. Nucleic Acids Res 1997/09/01edition. 1997, 25(17):3389-3402.
13. Eddy SR: Profile hidden Markov models. Bioinformatics 1999/01/27 edition. 1998, 14(9):755-763.
14. Sadreyev R, Grishin N: COMPASS: a tool for comparison ofmultiple protein alignments with assessment of statisticalsignificance. J Mol Biol 2003/01/28 edition. 2003, 326(1):317-336.
15. Soding J, Biegert A, Lupas AN: The HHpred interactive serverfor protein homology detection and structure prediction.Nucleic Acids Res 2005/06/28 edition. 2005, 33(Web Serverissue):W244-8.
Additional file 1Supplementary material. This file provides a detailed description of the protein backbone repairing algorithm, detailed results of the GA recombi-nation for structure and energy-guided optimizations and information on the 3D-Jigsaw 3.0 protein modelling web-server.Click here for file[http://www.biomedcentral.com/content/supplementary/1472-6807-8-34-S1.pdf]
Page 15 of 17(page number not for citation purposes)
http://www.ncbi.nlm.nih.gov/entrez/query.fcgi?cmd=Retrieve&db=PubMed&dopt=Abstract&list_uids=1774068
http://www.ncbi.nlm.nih.gov/entrez/query.fcgi?cmd=Retrieve&db=PubMed&dopt=Abstract&list_uids=1774068
http://www.ncbi.nlm.nih.gov/entrez/query.fcgi?cmd=Retrieve&db=PubMed&dopt=Abstract&list_uids=1774068
http://www.ncbi.nlm.nih.gov/entrez/query.fcgi?cmd=Retrieve&db=PubMed&dopt=Abstract&list_uids=2231712
http://www.ncbi.nlm.nih.gov/entrez/query.fcgi?cmd=Retrieve&db=PubMed&dopt=Abstract&list_uids=2231712
http://www.ncbi.nlm.nih.gov/entrez/query.fcgi?cmd=Retrieve&db=PubMed&dopt=Abstract&list_uids=9254694
http://www.ncbi.nlm.nih.gov/entrez/query.fcgi?cmd=Retrieve&db=PubMed&dopt=Abstract&list_uids=9254694

BMC Structural Biology 2008, 8:34 http://www.biomedcentral.com/1472-6807/8/34
16. Yona G, Levitt M: Within the twilight zone: a sensitive profile-profile comparison tool based on information theory. J MolBiol 2002/02/06 edition. 2002, 315(5):1257-1275.
17. Jaroszewski L, Rychlewski L, Li Z, Li W, Godzik A: FFAS03: aserver for profile--profile sequence alignments. Nucleic AcidsRes 2005/06/28 edition. 2005, 33(Web Server issue):W284-8.
18. Moult J, Fidelis K, Kryshtafovych A, Rost B, Hubbard T, TramontanoA: Critical assessment of methods of protein structure pre-diction-Round VII. Proteins 2007/10/09 edition. 2007, 69 Suppl8:3-9.
19. Read RJ, Chavali G: Assessment of CASP7 predictions in thehigh accuracy template-based modeling category. Proteins2007/09/27 edition. 2007, 69 Suppl 8:27-37.
20. Sali A, Blundell TL: Comparative protein modelling by satisfac-tion of spatial restraints. J Mol Biol 1993/12/05 edition. 1993,234(3):779-815.
21. Contreras-Moreira B, Fitzjohn PW, Bates PA: In silico proteinrecombination: enhancing template and sequence align-ment selection for comparative protein modelling. J Mol Biol2003/04/23 edition. 2003, 328(3):593-608.
22. Offman MN, Fitzjohn PW, Bates PA: Developing a move-set forprotein model refinement. Bioinformatics 2006/05/18 edition.2006, 22(15):1838-1845.
23. Petersen K, Taylor WR: Modelling zinc-binding proteins withGADGET: genetic algorithm and distance geometry forexploring topology. J Mol Biol 2003/01/16 edition. 2003,325(5):1039-1059.
24. Rabow AA, Scheraga HA: Improved genetic algorithm for theprotein folding problem by use of a Cartesian combinationoperator. Protein Sci 1996/09/01 edition. 1996, 5(9):1800-1815.
25. Fang Q, Shortle D: Protein refolding in silico with atom-basedstatistical potentials and conformational search using a sim-ple genetic algorithm. J Mol Biol 2006/05/09 edition. 2006,359(5):1456-1467.
26. Das R, Qian B, Raman S, Vernon R, Thompson J, Bradley P, Khare S,Tyka MD, Bhat D, Chivian D, Kim DE, Sheffler WH, Malmstrom L,Wollacott AM, Wang C, Andre I, Baker D: Structure predictionfor CASP7 targets using extensive all-atom refinement withRosetta@home. Proteins 2007/09/27 edition. 2007, 69 Suppl8:118-128.
27. Lee MR, Tsai J, Baker D, Kollman PA: Molecular dynamics in theendgame of protein structure prediction. J Mol Biol 2002/01/22edition. 2001, 313(2):417-430.
28. Qian B, Ortiz AR, Baker D: Improvement of comparative modelaccuracy by free-energy optimization along principal com-ponents of natural structural variation. Proc Natl Acad Sci U S A2004/10/20 edition. 2004, 101(43):15346-15351.
29. Zhang Y: I-TASSER server for protein 3D structure predic-tion. BMC Bioinformatics 2008/01/25 edition. 2008, 9(1):40.
30. Zhou H, Pandit SB, Lee SY, Borreguero J, Chen H, Wroblewska L,Skolnick J: Analysis of TASSER-based CASP7 protein struc-ture prediction results. Proteins 2007/08/21 edition. 2007, 69Suppl 8:90-97.
31. Terashi G, Takeda-Shitaka M, Kanou K, Iwadate M, Takaya D, HosoiA, Ohta K, Umeyama H: Fams-ace: a combined method toselect the best model after remodeling all server models.Proteins 2007/09/27 edition. 2007, 69 Suppl 8:98-107.
32. Joo K, Lee J, Lee S, Seo JH, Lee SJ: High accuracy template basedmodeling by global optimization. Proteins 2007/09/27 edition.2007, 69 Suppl 8:83-89.
33. Kolinski A, Bujnicki JM: Generalized protein structure predic-tion based on combination of fold-recognition with de novofolding and evaluation of models. Proteins 2005/09/28 edition.2005, 61 Suppl 7:84-90.
34. Fischer D: Servers for protein structure prediction. Curr OpinStruct Biol 2006/03/21 edition. 2006, 16(2):178-182.
35. Cozzetto D, Kryshtafovych A, Ceriani M, Tramontano A: Assess-ment of predictions in the model quality assessment cate-gory. Proteins 2007/08/08 edition. 2007, 69 Suppl 8:175-183.
36. Eisenberg D, McLachlan AD: Solvation energy in protein foldingand binding. Nature 1986/01/16 edition. 1986, 319(6050):199-203.
37. Eisenberg D, Luthy R, Bowie JU: VERIFY3D: assessment of pro-tein models with three-dimensional profiles. Methods Enzymol1997/01/01 edition. 1997, 277:396-404.
38. McGuffin LJ: Benchmarking consensus model quality assess-ment for protein fold recognition. BMC Bioinformatics 2007/09/20 edition. 2007, 8:345.
39. Pettitt CS, McGuffin LJ, Jones DT: Improving sequence-based foldrecognition by using 3D model quality assessment. Bioinfor-matics 2005/06/16 edition. 2005, 21(17):3509-3515.
40. Sippl MJ: Recognition of errors in three-dimensional struc-tures of proteins. Proteins 1993/12/01 edition. 1993,17(4):355-362.
41. Tosatto SC: The victor/FRST function for model quality esti-mation. J Comput Biol 2005/12/29 edition. 2005, 12(10):1316-1327.
42. Wallner B, Elofsson A: Can correct protein models be identi-fied? Protein Sci 2003/04/30 edition. 2003, 12(5):1073-1086.
43. Trapane TL, Lattman EE: Seventh Meeting on the CriticalAssessment of Techniques for Protein Structure Prediction.Proteins 2007, 69 Suppl 8:1-2.
44. CASP: Protein Structure Prediction Center webpage. [http://www.predictioncenter.org/].
45. Jones DT: Protein secondary structure prediction based onposition-specific scoring matrices. J Mol Biol 1999/09/24 edition.1999, 292(2):195-202.
46. Ramachandran GN, Sasisekharan V: Conformation of polypep-tides and proteins. Adv Protein Chem 1968/01/01 edition. 1968,23:283-438.
47. Canutescu AA, Dunbrack RL Jr.: Cyclic coordinate descent: Arobotics algorithm for protein loop closure. Protein Sci 2003/04/30 edition. 2003, 12(5):963-972.
48. Zhang Y, Skolnick J: Scoring function for automated assess-ment of protein structure template quality. Proteins 2004/10/12 edition. 2004, 57(4):702-710.
49. Zemla A, Venclovas C, Moult J, Fidelis K: Processing and analysisof CASP3 protein structure predictions. Proteins 1999/10/20edition. 1999, Suppl 3:22-29.
50. Siew N, Elofsson A, Rychlewski L, Fischer D: MaxSub: an auto-mated measure for the assessment of protein structure pre-diction quality. Bioinformatics 2000/12/08 edition. 2000,16(9):776-785.
51. Mead R, Nelder JA: A simplex method for function minimiza-tion. Comp J 1965, 7:308-313.
52. Frishman D, Argos P: Knowledge-based protein secondarystructure assignment. Proteins 1995/12/01 edition. 1995,23(4):566-579.
53. Canutescu AA, Shelenkov AA, Dunbrack RL Jr.: A graph-theoryalgorithm for rapid protein side-chain prediction. Protein Sci2003/08/22 edition. 2003, 12(9):2001-2014.
54. Lazaridis T, Karplus M: Effective energy functions for proteinstructure prediction. Curr Opin Struct Biol 2000/04/08 edition.2000, 10(2):139-145.
55. Cavallo L, Kleinjung J, Fraternali F: POPS: A fast algorithm for sol-vent accessible surface areas at atomic and residue level.Nucleic Acids Res 2003/06/26 edition. 2003, 31(13):3364-3366.
56. Zhang C, Liu S, Zhou Y: Accurate and efficient loop selectionsby the DFIRE-based all-atom statistical potential. Protein Sci2004/01/24 edition. 2004, 13(2):391-399.
57. Brooks B, Bruccoleri R, Olafson B, States D, Swaminathan S, KarplusM: CHARMM: A program for macromolecular energy, mini-mization, and dynamics calculation. J Comp Chem 1983,4:187-217.
58. Offman MN: 3D Jigsaw 3.0 Modelling Server powered by POP-ULUS. [http://bmm.cancerresearchuk.org/~populus].
59. Eswar N, Webb B, Marti-Renom MA, Madhusudhan MS, Eramian D,Shen MY, Pieper U, Sali A: Comparative protein structure mod-eling using MODELLER. Curr Protoc Protein Sci 2008/04/23 edition.2007, Chapter 2:Unit 2 9.
60. Forrest S: Genetic algorithms: principles of natural selectionapplied to computation. Science 1993/08/13 edition. 1993,261(5123):872-878.
61. Qian B, Raman S, Das R, Bradley P, McCoy AJ, Read RJ, Baker D:High-resolution structure prediction and the crystallo-graphic phase problem. Nature 2007/10/16 edition. 2007,450(7167):259-264.
62. Liekens AML, ten Eikelder HMM, Hilbers PAJ: Finite populationmodels of dynamic optimization with stochastically alternat-ing fitness functions. In IEEE Conf Evolutionary Computation 2003,2:838-845.
Page 16 of 17(page number not for citation purposes)
http://www.ncbi.nlm.nih.gov/entrez/query.fcgi?cmd=Retrieve&db=PubMed&dopt=Abstract&list_uids=8254673
http://www.ncbi.nlm.nih.gov/entrez/query.fcgi?cmd=Retrieve&db=PubMed&dopt=Abstract&list_uids=8254673
http://www.ncbi.nlm.nih.gov/entrez/query.fcgi?cmd=Retrieve&db=PubMed&dopt=Abstract&list_uids=8880904
http://www.ncbi.nlm.nih.gov/entrez/query.fcgi?cmd=Retrieve&db=PubMed&dopt=Abstract&list_uids=8880904
http://www.ncbi.nlm.nih.gov/entrez/query.fcgi?cmd=Retrieve&db=PubMed&dopt=Abstract&list_uids=8880904
http://www.ncbi.nlm.nih.gov/entrez/query.fcgi?cmd=Retrieve&db=PubMed&dopt=Abstract&list_uids=3945310
http://www.ncbi.nlm.nih.gov/entrez/query.fcgi?cmd=Retrieve&db=PubMed&dopt=Abstract&list_uids=3945310
http://www.ncbi.nlm.nih.gov/entrez/query.fcgi?cmd=Retrieve&db=PubMed&dopt=Abstract&list_uids=9379925
http://www.ncbi.nlm.nih.gov/entrez/query.fcgi?cmd=Retrieve&db=PubMed&dopt=Abstract&list_uids=9379925
http://www.ncbi.nlm.nih.gov/entrez/query.fcgi?cmd=Retrieve&db=PubMed&dopt=Abstract&list_uids=8108378
http://www.ncbi.nlm.nih.gov/entrez/query.fcgi?cmd=Retrieve&db=PubMed&dopt=Abstract&list_uids=8108378
http://www.ncbi.nlm.nih.gov/entrez/query.fcgi?cmd=Retrieve&db=PubMed&dopt=Abstract&list_uids=4882249
http://www.ncbi.nlm.nih.gov/entrez/query.fcgi?cmd=Retrieve&db=PubMed&dopt=Abstract&list_uids=4882249
http://www.ncbi.nlm.nih.gov/entrez/query.fcgi?cmd=Retrieve&db=PubMed&dopt=Abstract&list_uids=8749853
http://www.ncbi.nlm.nih.gov/entrez/query.fcgi?cmd=Retrieve&db=PubMed&dopt=Abstract&list_uids=8749853
http://www.ncbi.nlm.nih.gov/entrez/query.fcgi?cmd=Retrieve&db=PubMed&dopt=Abstract&list_uids=8346439

BMC Structural Biology 2008, 8:34 http://www.biomedcentral.com/1472-6807/8/34
Publish with BioMed Central and every scientist can read your work free of charge
"BioMed Central will be the most significant development for disseminating the results of biomedical research in our lifetime."
Sir Paul Nurse, Cancer Research UK
Your research papers will be:
available free of charge to the entire biomedical community
peer reviewed and published immediately upon acceptance
cited in PubMed and archived on PubMed Central
yours — you keep the copyright
Submit your manuscript here:http://www.biomedcentral.com/info/publishing_adv.asp
BioMedcentral
63. Wiederstein M, Sippl MJ: ProSA-web: interactive web servicefor the recognition of errors in three-dimensional structuresof proteins. Nucleic Acids Res 2007/05/23 edition. 2007, 35(WebServer issue):W407-10.
64. Laskowski LR: PROCHECK: a program to check the stereo-chemical quality of protein structures. J Appl Cryst 1993,26:283-291.
Page 17 of 17(page number not for citation purposes)