Human Cortical Activity Correlates With Stereoscopic Depth Perception

Kingdom et al. Vol. 18, No. 5 /May 2001/J. Opt. Soc. Am. A 993
Luminance spatial scale facilitates stereoscopicdepth segmentation
Frederick A. A. Kingdom, Lynn R. Ziegler, and Robert F. Hess
McGill Vision Research Unit, Room H4-14, 687 Pine Avenue West, Montreal, Quebec H3A 1A1, Canada
Received September 6, 2000; accepted October 26, 2000
Are differences in luminance spatial frequency between surfaces that overlap in depth useful for surface seg-mentation? We examined this question, using a novel stimulus termed a dual-surface disparity grating. Thedual-surface grating was made from Gabor micropatterns and consisted of two superimposed sinusoidal dis-parity gratings of identical disparity-modulation spatial frequency and orientation but of opposite spatialphase. Corrugation amplitude thresholds for discrimination of the orientation of the dual-surface gratingwere obtained as a function of the difference in Gabor (luminance) spatial frequency between the two surfaces.When the Gabor micropatterns on the two surfaces were identical in spatial frequency, thresholds were veryhigh and in some instances impossible to obtain. However, with as little as a 1-octave difference in spatialfrequency between the surfaces, thresholds fell sharply to near-asymptotic levels. The fall in thresholds par-alleled a change in the appearance of the stimulus from one of irregular depth to stereo transparency. Themost parsimonious explanation for this finding is that the introduction of a between-surface luminance spatial-frequency difference reduces the number of spurious cross-surface binocular matches, thus helping to revealthe three-dimensional structure of the stimulus. © 2001 Optical Society of America
OCIS codes: 330.0330, 330.1400, 330.5510, 330.7310.
1. INTRODUCTIONStereoscopic vision is an important means of determiningthe three-dimensional structure of the world around us.Primate stereopsis probably originated amid relativelydense vegetation—a visual diet of many overlapping,densely textured surfaces. In such environments stere-opsis is particularly useful for perceptually breaking up ascene into its component structures and surfaces. A goodexample of this is Fig. 1. Fusion of the two stereo halvesreveals branches of the fern largely hidden in the monocu-lar view. Densely textured scenes with overlappingdepth surfaces present the visual system with a particu-larly acute correspondence problem. For every feature inone eye’s view there are not only a number of possiblematches in the other eye’s view of the same surface butalso possible matches from the other surfaces.1–5 It istherefore of special interest to know whether we possessmechanisms that help overcome this correspondenceproblem.
Relevant to this issue is the question as to what stimu-lus characteristics help to facilitate stereoscopic segmen-tation in stimuli such as in Fig. 1. This question hasbeen addressed primarily in the context of the study ofstereo transparency, in which a typical paradigm hasbeen to measure the degree of perceived stereo transpar-ency between two surfaces separated in depth (see Ref. 5for a review). It has been shown, for example, that, whenthe features on the two surfaces differ in color,2 motioncontrast,6 or contrast polarity,4 the perception of stereotransparency appears to be enhanced. In this study weconsider the effectiveness of a between-surface differencein luminance spatial frequency, not so much in the per-ception of stereo transparency as in the identification ofthe three-dimensional structure of the stimulus.
0740-3232/2001/050993-10$15.00 ©
Much evidence points to the importance of luminancespatial frequency for stereopsis. In a seminal study, Ju-lesz and Miller7 found that random dot stereograms sur-vived the effects of added uncorrelated noise if signal andnoise differed in luminance spatial frequency by 2 or moreoctaves. Other psychophysical studies have since con-firmed the importance of spatial frequency selectivity instereopsis,8–12 supported by studies of single-unit record-ings in primate cortex.13 However the importance of lu-minance spatial frequency for stereo segmentation has re-ceived comparatively little attention. Rohaly andWilson14 studied the effects of spatial frequency differ-ences in the phenomenon known as disparityaveraging.5,14–17 This is the phenomenon whereby twooverlapping stimuli at different depths often appear at asingle intermediate depth. They found that two overlap-ping cosine gratings separated by 112 arc sec required aspatial frequency difference of up to 3.5 octaves (a factorof approximately 11) before they appeared as two trans-parent layers separated in depth. This suggests that dis-parity averaging is relatively broadly tuned to luminancespatial frequency. However, in the present study we em-ployed random-element stereograms, and it has been ar-gued that with random-element stereograms correspon-dence noise rather than disparity averaging is the factormost likely to limit the perception of depth transparency.5
Therefore the effectiveness of between-surface luminancespatial-frequency differences in revealing the structure ofmultisurface random-element stimuli has yet to be deter-mined.
To ensure that the subjects’ task was to detect struc-ture rather than to rate stereotransparency, we employedan objective technique involving a novel stimulus basedon the disparity grating introduced by Tyler.18 A dispar-
2001 Optical Society of America

994 J. Opt. Soc. Am. A/Vol. 18, No. 5 /May 2001 Kingdom et al.
Fig. 1. Fusion by crossed disparity reveals branches of the fem at different depths that are largely camouflaged in the monocular view.The more distant branches will have a slightly higher retinal spatial frequency composition. Could this difference facilitate stereoscopicsegmentation?
Fig. 2. Method of construction of a dual-surface disparity grating from two types of Gabor micropatterns.
ity grating is a densely textured stimulus modulated indisparity according to a particular waveform, most typi-cally a sinusoid, and appears as a corrugation in depth.Our stimulus consists of two superimposed disparity grat-ings with the same corrugation orientation and spatialfrequency but 180 deg out of phase. We refer to thisstimulus as a dual-surface disparity grating. Its methodof construction is illustrated in Fig. 2, and two examplestereo pairs are shown in Fig. 3. Our dual-surface dis-parity gratings are composed of dense arrays of randomly
positioned Gabor micropatterns whose surfaces can eitherdiffer in Gabor spatial frequency, as in Figs. 3(a) (see alsoFig. 2), or be the same, as in Fig. 3(b). In all experi-ments, subjects were required to judge the orientation ofthe depth corrugations (which could be left or right ob-lique). Thus we obtained a criterion-free estimate of theability of the visual system to extract the three-dimensional (3-D) structure of a multisurface stimulus,defined by the same depth distribution of local disparities.As with single-surface disparity gratings, we estimated

Kingdom et al. Vol. 18, No. 5 /May 2001/J. Opt. Soc. Am. A 995
the threshold amplitude of disparity modulation, dmin , forour dual-surface gratings.
In Fig. 3(a) the two depth corrugations are easily seen,appearing to weave in and out of each other and givingrise to a strong perception of segmentation and transpar-
ency. In Fig. 3(b), on the other hand, the stimulus ap-pears lacy and irregular in depth and has no discerniblestructure or transparency. Our quantitative measure-ments of dmin parallel these differences in appearance. Abrief report of these findings has been given elsewhere.19
Fig. 3. Example dual-surface disparity gratings. Fusion of the two stereo halves in (a) reveals a 3-D pattern with an obliquely orientedcorrugated structure. On closer inspection one can see two interwoven surfaces and an impression of depth transparency. In (a) themicropatterns are of the same size but differ in luminance spatial frequency by 1 octave, or a factor of 2. In (b) the two surfaces aremade from the same micropatterns, and the corrugated structure is very difficult to perceive in the fused image. In the main experi-ment subjects were required to judge the orientation of the corrugations in the stimulus as a function of the difference in Gabor micro-pattern spatial frequency between the two surfaces (645 deg).
996 J. Opt. Soc. Am. A/Vol. 18, No. 5 /May 2001 Kingdom et al.
2. METHODSA. ObserversTwo of the authors, FK and LZ, acted as subjects. FKwas emmetropic, and LZ used his optical correction.
B. Stimuli
1. Generation and DisplayThe stereograms in all experiments were generated bya Silicon Graphics 02 workstation with screen resolu-tions of 1024 3 1280 pixels. In the first experiment theywere backprojected onto a large translucent screen by anElectrohome ECP-4100 projector. The screen subtended50 3 57 deg at the viewing distance of 114 cm and had amean luminance of 1.2 cd/m3. In the remaining experi-ments the stereo images were displayed on a Sony GDM-20E21 video monitor. The monitor display subtended28 3 38 deg at a viewing distance of 57 cm and had amean luminance of 6.0 cd/m2 when measured through thestereo glasses. The two stereo half-images were dis-played on alternate frames of the display device at 120 Hzand were projected to the two eyes by liquid-crystal shut-ter glasses (Stereographics, Inc., CrystalEyes) synchro-nized to the projector frame rate. It is well known thatinterocular cross talk can occur when liquid-crystal shut-ters are used to separate stereo half-images. Thereforewe used relatively low-contrast stimuli (as measured onthe Sony video monitor) to minimize such cross talk(<33.0%). The exception was FK’s highest Gabor spa-tial frequency condition [3.36 cycles per degree (cpd)] inthe first experiment, where a contrast of 78% was em-ployed. However, the contrast of this high-spatial-frequency Gabor micropattern (hereafter referred to asGabor) was substantially attenuated by the translucentscreen (thus the need for such a high contrast; see below).There was nevertheless some residual cross talk in ourdisplays in the form of a very-low-contrast ‘‘ghost’’ signalsuperimposed on the much-higher-contrast ‘‘true’’ signalin each eye. There is good evidence, however, that low-contrast stereoscopic signals have little effect on the per-ceived depth of superimposed higher-contrast signals20
and good evidence for a contrast-similarity constraint onstereo matching.21 We are therefore confident that anycross talk did not significantly affect stereoscopic perfor-mance in this study.
2. Gabor MicropatternsThe Gabor micropatterns were generated by use of thefunction
L~x ! 5 M@1 1 c sin~2pfx !exp~2x2/2s 2!#,
where M is the mean luminance (see above), c is contrast,f is the spatial frequency, and s is the space constant ofthe envelope. The values of the Gabor parameters c, f,and s will be given with each experiment. The Gaborswere all vertically oriented. The carrier modulation wasin the sine, or ‘‘odd,’’ phase to ensure that the Gabor’sspace-average luminance was the same as that of thebackground.
3. Disparity GratingsDisparity gratings, whether single-surface or dual-surface, contained 1200 Gabors, randomly positioned onthe screen. The disparities of the Gabors were definedwith subpixel accuracy with a resolution of 128th of apixel, or 1.25 arc sec or less (see Ref. 22 for details). Thedisparity was sinusoidally modulated. The orientation ofdisparity modulation was left or right oblique (245° or145°). The phase of disparity modulation was random-ized on each trial. When Gabors fell on top of each other,their amplitudes but not mean luminances were added.At the density of Gabors employed in all experiments thenumber of instances in which the chance addition of Ga-bors resulted in luminance outside the normal range wasnegligible.
C. Procedure
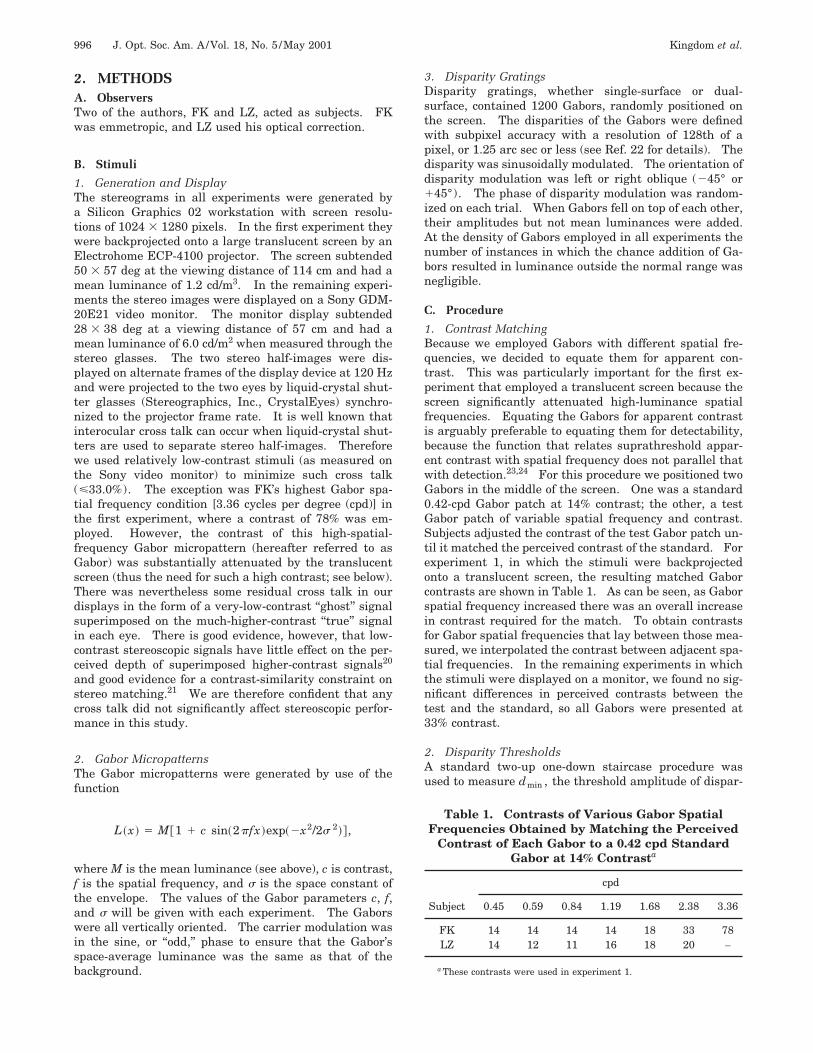
1. Contrast MatchingBecause we employed Gabors with different spatial fre-quencies, we decided to equate them for apparent con-trast. This was particularly important for the first ex-periment that employed a translucent screen because thescreen significantly attenuated high-luminance spatialfrequencies. Equating the Gabors for apparent contrastis arguably preferable to equating them for detectability,because the function that relates suprathreshold appar-ent contrast with spatial frequency does not parallel thatwith detection.23,24 For this procedure we positioned twoGabors in the middle of the screen. One was a standard0.42-cpd Gabor patch at 14% contrast; the other, a testGabor patch of variable spatial frequency and contrast.Subjects adjusted the contrast of the test Gabor patch un-til it matched the perceived contrast of the standard. Forexperiment 1, in which the stimuli were backprojectedonto a translucent screen, the resulting matched Gaborcontrasts are shown in Table 1. As can be seen, as Gaborspatial frequency increased there was an overall increasein contrast required for the match. To obtain contrastsfor Gabor spatial frequencies that lay between those mea-sured, we interpolated the contrast between adjacent spa-tial frequencies. In the remaining experiments in whichthe stimuli were displayed on a monitor, we found no sig-nificant differences in perceived contrasts between thetest and the standard, so all Gabors were presented at33% contrast.
2. Disparity ThresholdsA standard two-up one-down staircase procedure wasused to measure dmin , the threshold amplitude of dispar-
Table 1. Contrasts of Various Gabor SpatialFrequencies Obtained by Matching the Perceived
Contrast of Each Gabor to a 0.42 cpd StandardGabor at 14% Contrasta
cpd
Subject 0.45 0.59 0.84 1.19 1.68 2.38 3.36
FK 14 14 14 14 18 33 78LZ 14 12 11 16 18 20 –
a These contrasts were used in experiment 1.

Kingdom et al. Vol. 18, No. 5 /May 2001/J. Opt. Soc. Am. A 997
ity modulation at the 71% correct level. Between trialssubjects viewed a blank screen with the same mean lumi-nance as the stimulus. A small fixation cross waspresent between stimulus presentations. The stimuluswas presented for a maximum of 2.7 s, but the subjectswere encouraged to respond by key press within 1 s ofstimulus onset. The response turned off the stimulus,and a tone indicated an incorrect response. Each sessionbegan with a high amplitude of disparity modulation, butwithin the range for being able to detect the stereoscopicshape of each component surface. The procedure termi-nated after twelve reversals and the geometric mean am-plitude of disparity modulation was calculated over thelast eight reversals.
3. EXPERIMENTS AND RESULTSA. Experiment 1. Effect of Luminance SpatialFrequency on dmin for Single- and Dual-SurfaceDisparity GratingsIn Fig. 3(a), fusion of the two stereo halves reveals a 3-Dcorrugated structure that is oriented obliquely. Close in-spection of the fused image reveals two corrugated sur-faces interwoven in depth, creating an impression of asegmented image in stereo transparency. Each of thetwo surfaces in Fig. 3(a) is made up of Gabor micropat-terns with the same space constant but with an octavedifference in spatial frequency. In Fig. 3(b) the micropat-terns on the two surfaces are identical, and fusion of thetwo stereo halves fails to reveal the oriented, corrugatedstructure. To quantify these observations we measureddmin for dual-surface disparity gratings as a function ofDf, the difference in center spatial frequency between theGabor micropatterns on the two surfaces. For this ex-periment the spatial frequency of disparity modulationwas 0.039 cpd, producing three cycles diagonally on thescreen.
A potential problem with measuring dmin for our dual-surface gratings is that a change in the micropattern com-position on one surface could simply make that surfacemore detectable, producing a fall in thresholds unrelatedto the dual-surface nature of the stimulus. To minimizethis possibility we first equated the detectability of eachsurface in our dual-surface stimuli. After setting thecontrasts of the Gabor micropatterns to make them equalin apparent contrast (see Table 1), we measured dmin forsingle-surface disparity gratings made from each Gaborspatial frequency. Then the amplitudes of disparitymodulation of each of the surfaces of the dual-surfacegrating were set to the ratio of their individually mea-sured dmin .
For the main part of the experiment we held the spatialfrequency of the Gabors on one of the surfaces constantand varied Gabor spatial frequency on the other. The sof the Gabors on both surfaces was 0.72°. Figure 4(a)shows the results from the two subjects. The two curveson each graph are for two different values of fixed f: 0.42and 1.68 cpd for LZ and 0.42 and 2.38 cpd for FK. WhenDf 5 0 (identical Gabors on each surface), thresholds arevery high; for the fixed f 5 1.68 cpd condition LZ was un-able to obtain any threshold, and for the fixed f 5 2.38
cpd, FK reported an almost complete absence of any sen-sation of 3-D structure. However, for D f values of ;1 oc-tave, both subjects’ thresholds fell to near-asymptotic lev-els. For comparison, in Fig. 4(b) we show thresholds forsingle-surface disparity gratings as a function of Gaborspatial frequency. Figure 4 shows that, although dual-surface thresholds never quite fall to those of the single-surface stimuli, they get close.
B. Experiment 2. Segregated versus NonsegregatedStimuliCould the result shown in Fig. 4 simply be a consequenceof changing the stimulus from having one Gabor spatialfrequency to two? The presence of more than one Gaborspatial frequency might, for example, reduce the ‘‘false-target’’ or stereo-correspondence problem in the stimulusas a whole, irrespective of whether the two types of Gaborwere segregated between surfaces. Put simply, twotypes of Gabor might provide a more feature-rich stimu-lus than one. To test this possibility we conducted a con-trol experiment, using dual-surface disparity gratingsmade from equal numbers of two Gabor spatial frequen-cies. In the segregated condition the two Gabor spatial
Fig. 4. Results of experiment 1. The graphs show dmin , thethreshold amplitude of disparity modulation, for identifying theorientation of a dual-surface disparity grating, as a function ofthe difference in spatial frequency, Df, between the micropat-terns on its two surfaces. The value of zero on the abscissa im-plies identical micropatterns on the two surfaces. The twocurves in each graph are for two different values of fixed micro-pattern spatial frequency f. For the fixed f 5 0.42 cpd condi-tion, variable f was always higher, whereas, for the other fixed fconditions variable f was always lower. The dotted curve in LZ’sdata finishing at Df 5 0.5 indicates that this subject was unableto obtain a threshold below this point. On the right, thresholdsfor single-surface disparity gratings are shown as a function ofmicropattern spatial frequency.

998 J. Opt. Soc. Am. A/Vol. 18, No. 5 /May 2001 Kingdom et al.
Fig. 5. Results from experiment 2. Dmin is shown for both dual-surface and single-surface disparity gratings, with all stimuli con-structed from just two types of Gabors with spatial frequencies 1.0 and 3.0 cpd. (a) Gabors with equal size, s; (b) Gabors with equalbandwidth ( s inversely proportional to f ). Seg, Gabors segregated between surfaces; nonseg, Gabors nonsegregated between surfaces.Single low f, single-surface grating with 1.0 cpd Gabors; single high f, single-surface grating with 3.0 cpd Gabors.
frequencies were separated onto the different surfaces asbefore. In the nonsegregated condition the two Gaborspatial frequencies were distributed equally onto bothsurfaces. Thus the segregated and nonsegregated condi-tions had an identical overall micropattern composition.If the reduction in dmin in Experiment 1 was due to thepresence of two types of Gabor rather than one, we wouldexpect no difference in thresholds between the segregatedand the nonsegregated conditions. On the other hand, ifthe reduction in dmin was due to segregation on the basisof Gabor spatial frequency, we would expect thresholds inthe segregated condition to be significantly lower. Weused Gabor spatial frequencies a factor of 3 apart: 1.0and 3.0 cpd, with s of 0.36 deg. The disparity-modulation frequency was set to 0.085 cpd, producingfour cycles diagonally on the screen. The results areshown in Fig. 5(a), along with thresholds for single-surface disparity gratings made from each type of Gaboralone. As the figure shows, thresholds for the segregatedcondition are much lower than for the nonsegregated con-dition, the former being only slightly higher than thesingle-surface thresholds. The average ratio of nonsegre-gated to segregated thresholds is 3.4 across the two sub-jects.
In Fig. 5(b) we show results for the same experimentusing Gabors with equal bandwidth rather than equalsize ( s). We set Gabor size to be inversely proportionalto Gabor spatial frequency, resulting in s of 0.36 and 0.12for the 1.0- and 3.0-cpd Gabors. The results in Fig. 5(b)are similar to those of Fig. 5(a). The ratio of nonsegre-gated to segregated thresholds is on average 2.8 for theequal-bandwidth condition. Again, the single-surfacethresholds are slightly lower than the segregated, dual-surface thresholds. It is interesting to note that the ab-solute performance levels of the two subjects with thedual-surface disparity gratings in the equal-bandwidthcondition are very similar, in marked contrast to the pre-vious experiments in which FK’s overall sensitivity wassignificantly higher than LZ’s. One possible reason forthis was that LZ was more susceptible to the effects of
correspondence noise. This effect was likely to be great-est in stimuli made from Gabors with small bandwidths,i.e., containing multiple carrier cycles; this was the casefor the high-spatial-frequency Gabors used in all exceptthe present equal-bandwidth experiment.
These two experiments confirm that the lower dmin insegregated-Gabor dual-surface gratings is a result of seg-regation by Gabor type and not feature enrichment.Moreover, the effects are due to Gabor spatial frequencyand not bandwidth.
4. DISCUSSIONBefore considering the theoretical significance of the find-ings of this study, consider whether dmin for identifyingthe orientation of a dual-surface disparity grating is atrue reflection of the ability of human observers to seg-ment a multisurface stimulus. What alternative meth-ods could have been used? An obvious technique wouldhave been to measure dmin for two superimposed flat sur-faces. However, subjects could in principle have simplydiscriminated the range of disparities in the stimuli. Re-quiring subjects to identify the orientation of a dual-surface disparity grating forces them to detect the 3-Dstructure of the stimulus and not just the presence ofmultiple disparities.
Dmin for a dual-surface disparity grating is not, how-ever, a direct measure of the degree of perceived stereotransparency. Nevertheless, it is reasonable to supposethat in the segregated-by-Gabor stimuli, such as in Fig.3(a), a close relationship exists between the perception ofdepth transparency and the lower measured dmin . Whythen is it easier to perceive both the corrugated structureand the transparency in Fig. 3(a) than Fig. 3(b)? In Sec-tion 1 we suggested that densely textured overlappingsurfaces pose a particular correspondence problem for thevisual system, and therefore one obvious explanation isthat the correspondence problem is significantly reduced

Kingdom et al. Vol. 18, No. 5 /May 2001/J. Opt. Soc. Am. A 999
in our Gabor-segregated stimulus. However, before con-sidering this explanation in more detail, we must firstconsider a number of other possibilities.
First, one can rule out the possibility that dual-surfacedisparity gratings made from two, as opposed to one, typeof Gabor have lower dmin simply because they are morefeature rich. In our second experiment we compared dminfor segregated and nonsegregated dual-surface gratings,both of which were made from equal numbers of two typesof Gabor, and found lower dmin for the segregated condi-tion. This result demonstrates that it is the segregationof the two surfaces by Gabor type, rather than the fact ofhaving two Gabor types, that is the critical attribute ofour stimuli.
A second possibility is that shape-from-disparity chan-nels are narrowly tuned for luminance spatial frequency.By a shape-from-disparity channel we mean a mechanismthat is sensitive to a particular rate of change of disparityor disparity-modulation spatial frequency. Psychophysi-cal evidence supports the existence of such channels.25–27
If a disparity-shape channel were stimulated by a dual-surface disparity grating made from a single Gabor spa-tial frequency, we would expect the two superimposedout-of-phase modulations to at least partially cancelwithin the channel, raising thresholds significantly(disparity-surface nulling/masking). On the other handif the two modulations were made from different Gaborspatial frequencies, they might be detected by differentdisparity-shape channels and hence not cancel. Only afew studies have examined the relationship betweendisparity-modulation detection and luminance spatialfrequency.22,28,29 The findings of these studies have beencontradictory, and none has provided conclusive evidencethat disparity-shape channels are luminance spatial fre-quency specific. The study that employed stimuli mostsimilar to the one here was that of Hess et al.22 Theymeasured disparity-modulation functions (dmin as a func-tion of disparity spatial frequency) for single-surface dis-parity gratings made from Gabors of various spatial fre-quencies. Hess et al. found a marked dependence of theshape of the disparity-modulation function on luminancespatial frequency at high, but not low, disparity spatialfrequencies. Although these results are consistent withthe tuning of disparity-shape channels for luminance spa-tial frequency, as are also the results of the present study,the evidence is only indirect. Nevertheless, the possibil-ity exists that disparity-shape-channel luminance-spatial-frequency specificity could underlie our results.
A third possible explanation is disparityaveraging.5,14–17 Two similar features lying at differentdepths along the same line of sight often appear to lie at acommon intermediate depth. We mentioned in Section 1the study by Rohaly and Wilson,14 who showed that withoverlapping cosine gratings, a full release from disparityaveraging required a between-surface luminance spatialfrequency difference of up to 3.5 octaves, suggesting thatdisparity averaging is a relatively broadband phenom-enon. In a comprehensive review of disparity averaging,Howard and Rogers5 concluded that much of the evidencefor disparity averaging in random-element stereograms(as opposed to, for example, the continuous cosine-gratingstereograms employed by Rohaly and Wilson), is better
understood in terms of correspondence noise. Specifi-cally, Howard and Rogers proposed that, in random-element stereograms with two overlapping surfaces, ele-ments that belong to one depth surface are often pairedwith nearest-neighbor elements that belong to the other.This generates a mishmash of randomly matched ele-ments and an impression of lacy depth (see below), whichcould easily be mistaken for disparity averaging. Ourfinding that a between-surface luminance-spatial-frequency difference of just 1 octave released our stimulusfrom its elevated dmin and lack of transparency reinforcesthe idea that it is correspondence noise rather than dis-parity averaging that is the limiting factor with ourrandom-element stimuli, since the release that we ob-served showed narrower tuning than that found by Ro-haly and Wilson. Thus, whereas we cannot rule out thatdisparity averaging contributes to our pattern, it seemsunlikely to be the principal cause.
The fourth, and most parsimonious, explanation for ourresults is correspondence noise. Following Howard andRogers, the nearest-neighbor rule produces spuriouscross-surface matches in the single-Gabor andnonsegregated-Gabor dual-surface disparity gratings butdoes not with segregated-Gabor stimuli because only likeGabors can be matched with like. The like-with-like con-straint is known as the similarity rule. Together withthe uniqueness constraint, which states that a given ele-ment in one eye’s view can be matched only with one ele-ment in the other, the nearest-neighbor and similarityrules are probably sufficient to account for the generalpattern of data in our experiments (for reviews of all theconstraints believed to underlie the solution of the corre-spondence problem, see Refs. 5 and 30). We have notconducted a computer simulation to test whether in com-bination these constraints are sufficient for predicting thepattern of results with our dual-surface stimuli. How-ever, Fig. 6 illustrates how in principle they are sufficient.Each part of Fig. 6 represents both left eye (LE) and righteye (RE) views of a horizontal slice through the 3-D spaceof a half-cycle of a dual-surface disparity grating. The re-gion bordered by the LE and RE stimuli represents thespace within which the array of disparity-sensitive cellsreside. The two types of element (large open circles andsmall filled circles) correspond to two Gabor spatial fre-quencies.
Consider first Fig. 6(a), where both depth surfaces arecomposed of the same elements, i.e., identical Gabors.This is the configuration of the stimuli with identical Ga-bors in experiment 1 and in Fig. 3(b). In principle, anyone of the elements in the left eye’s view could be matchedwith any one in the right eye’s view, but we have chosenonly those matches that together satisfy the uniqueness,nearest-neighbor, and similarity rules. The nearest-neighbor rule results in a number of spurious cross-surface matches, the effect being to collapse the two sur-faces into a single, albeit irregular, depth surface in thecyclopean view. In Figs. 6(b) and 6(c), two types of Gaborare present. Figure 6(b) represents the configuration ofthe nonsegregated condition in experiment 2. Figure 6(c)represents the configuration of the segregated conditionsin both experiments 1 and 2 and Fig. 3(a). We assumethat the similarity constraint restricts matches only to

1000 J. Opt. Soc. Am. A/Vol. 18, No. 5 /May 2001 Kingdom et al.
Fig. 6. Correspondence-noise model of the results. Each figure shows left eye (LE) and right eye (RE) representations of a horizontalslice through a half-cycle of a dual-surface disparity grating. For each eye the set of elements making up the two surfaces are shown oneabove the other for convenience. Small solid circles and large open circles represent Gabors of different spatial frequencies. Binocularmatches are shown along the fixation plane running horizontally between the corners of each figure. The nearest-neighbor rule findsthose matches that minimize disparity with respect to the plane of fixation, but the similarity rule restricts those matches to like Gabors.The uniqueness rule allows only one match per element. (a) Single-Gabor stimulus [as in Fig. 3(b)], (b) nonsegregated two-Gabor stimu-lus, (c) segregated two-Gabor stimulus [as in Fig. 3(a)]. Only in (c) is the dual-surface, sinusoidal structure of the stimulus revealed.
like Gabors but that the other constraints operate in thesame way as in Fig. 6(a). The result shown in Fig. 6(b) isa series of matches somewhat more jumbled in depth thanin Fig. 6(a) but that still do not form two distinct depthsurfaces because there are still instances of cross-surfacematching. In Fig. 6(c), however, the matched elementsform two distinct depth surfaces, as no cross-surfacematching is allowed.
Interestingly, this analysis might suggest that we couldaccount for the qualitative trends in our data by merelysupposing that subjects responded to the interval in eachforced-choice pair with the most perceived variability indepth, which is greatest in Fig. 6(c) and least in Fig. 6(a).However, one must remember that the task that we em-ployed required identification of the orientation of thedepth corrugations, i.e., the 3-D structure of the dual-surface stimulus. It is only in Fig. 6(c) that the full 3-Dstructure of the stimulus is revealed.
What exactly is ‘‘similarity’’ as applied to pairs of Ga-bors of different spatial frequencies? One common mea-sure of similarity is the cross-correlation function. Wecalculated the peak of the (horizontal) cross-correlationfunction between the pairs of Gabors employed in our firstexperiment and found that it declines by a factor of 10 foran approximately 1.4-octave difference in peak Gaborspatial frequency. This decline is similar to the rate atwhich the thresholds fall in Fig. 4(a). Consistent withthe importance of the similarity constraint based on lumi-nance spatial frequency is the recent study by Ziegler andHess.31 They showed a complete absence of any percep-
tion of stereo shape when they viewed a single-surfacedisparity grating presented dichoptically with a 2-octavedifference in Gabor spatial frequency between the twoeyes’ views (see also Ref. 32).
Before leaving the discussion of correspondence noise,we must mention the surface-smoothness constraint.This rule posits that only those matches forming surfacesthat smoothly vary in depth are chosen. A number ofmodels33–36 have used the surface-smoothness constraintin conjunction with other constraints to solve the false-target problem in random-dot stereograms. In the bestknown of these models, that of Marr and Poggio,35 thesurface-smoothness constraint was implemented by a net-work of facilitatory and inhibitory interactions betweenlocal disparity detectors: facilitation in the two-dimensional (frontoparallel) plane and inhibition in the3-D (i.e., depth) plane. The phenomenon of depth trans-parency has been used as an argument against this modeland the surface-smoothness constraint that it embodies,30
as the inhibitory interactions should eliminate thosematches that give rise to multiple depths along similarlines of sight. However, provided that the surface-smoothness constraint is implemented in conjunctionwith the similarity constraint (as in the Marr–Poggiomodel), we see no reason why in principle this might notalso reduce the number of false targets within each sur-face of a Gabor-segregated dual-surface disparity grating,such as in Fig. 3(a).
To summarize: Either luminance-spatial-frequencychannels remain segregated up to the level of the depth

Kingdom et al. Vol. 18, No. 5 /May 2001/J. Opt. Soc. Am. A 1001
corrugation channels or they remain separate up to thelevel of the mechanisms that implement the similarityconstraint for matching. Further experiments will beneeded before we can decide which of these mechanismsunderlies our results. Further experiments will also es-tablish whether other feature attributes besides lumi-nance spatial frequency, such as orientation, color, andluminance polarity, are salient for stereo-depth segmen-tation in dual-surface disparity gratings.
Finally, under what circumstances might differences inluminance spatial frequency be useful for stereo-depthsegmentation? Consider again Fig. 1. The fern has twophysically similar fronds lying in different depths, andthese will have slightly different center luminance spatialfrequencies in their retinal-image projections. This dif-ference in spatial frequency content could facilitate ste-reoscopic segmentation. The two fronds may of coursealso differ in orientation, luminance polarity, or color, butsuch differences are not inevitable. Unlike these proper-ties, spatial scale differences will tend to covary consis-tently with disparity. The importance of gradients inspatial scale that are due to perspective in the monocularretinal image has been appreciated by vision scientistssince Gibson’s publication37 (e.g., see Refs. 38–40). Wehave demonstrated that stereopsis can also exploit suchspatial scale differences when one is segmenting thedepths of complex textured scenes.
ACKNOWLEDGMENTSThis research was supported by a Canadian National Sci-ence and Engineering Research Council grant to F. A. A.Kingdom and a Canadian MRC grant to R. F. Hess.
F. A. A. Kingdom’s e-mail address is [email protected].
REFERENCES AND NOTES1. K. Prazdny, ‘‘Detection of binocular disparities,’’ Biol. Cy-
bern. 52, 93–99 (1985).2. R. A. Akerstrom and J. T. Todd, ‘‘The perception of stereo-
scopic transparency,’’ Percept. Psychophys. 44, 421–432(1988).
3. D. Weinshall, ‘‘Perception of multiple transparent planes instereo vision,’’ Nature 341, 737–739 (1989).
4. S. Gephstein and A. Cooperman, ‘‘Stereoscopic transpar-ency: A test for binocular disambiguating power,’’ VisionRes. 38, 2913–2932 (1998).
5. I. P. Howard and B. J. Rogers, Binocular Vision and Stere-opsis (Oxford U. Press, Oxford, UK, 1995). For a discus-sion of disparity averaging and its limitations as an ex-planatory concept, see pp. 230–234. For a discussion ofthe constraints on stereo matching, see pp. 216–229.
6. J. M. Lankheet and M. Palmen, ‘‘Stereoscopic segregationof transparent surfaces and the effect of motion contrast,’’Vision Res. 38, 659–668 (1998).
7. B. Julesz and J. E. Miller, ‘‘Independent spatial frequencytuned channels in binocular fusion and rivalry,’’ Perception4, 125–143 (1975).
8. J. E. W. Mayhew and J. P. Frisby, ‘‘Rivalrous texture ste-reograms,’’ Nature 264, 53–56 (1976).
9. C. M. Schor and I. Wood, ‘‘Disparity range for local stereop-
sis as a function of luminance spatial frequency,’’ VisionRes. 23, 1649–1654 (1983).
10. H. R. Wilson, R. Blake, and D. L. Halpern, ‘‘Coarse spatialscales constrain the range of fusion of fine spatial scales,’’ J.Opt. Soc. Am. A 8, 229–236 (1991).
11. Y. Yang and R. Blake, ‘‘Spatial frequency tuning of humanstereopsis,’’ Vision Res. 31, 1177–1189 (1991).
12. H. S. Smallman and D. I. A. MacLeod, ‘‘Size-disparity cor-relation in stereopsis at contrast threshold,’’ J. Opt. Soc.Am. A 11, 2169–2183 (1994).
13. G. C. DeAngelis, I. Ohzawa, and R. D. Freeman, ‘‘Neuronalmechanisms underlying stereopsis: How do simple cells inthe visual cortex encode binocular disparity?’’ Perception24, 3–31 (1995).
14. A. M. Rohaly and H. R. Wilson, ‘‘Disparity averaging acrossspatial scales,’’ Vision Res. 34, 1315–1325 (1994).
15. B. Julesz and S. C. Johnson, ‘‘Stereograms portraying am-biguous perceivable surfaces,’’ Proc. Natl. Soc. 61, 437–441(1968).
16. A. J. Parker and Y. Yang, ‘‘Spatial properties of disparitypooling in human stereo vision,’’ Vision Res. 29, 1525–1538(1989).
17. S. B. Stevenson, L. K. Cormack, and C. M. Schor, ‘‘Depthattraction and repulsion in random dot stereograms,’’ Vi-sion Res. 31, 805–813 (1991).
18. C. W. Tyler, ‘‘Depth perception in disparity gratings,’’ Na-ture 251, 140–142 (1974).
19. F. A. A. Kingdom, L. R. Ziegler, and R. F. Hess, ‘‘The role ofspatial scale in stereoscopic segmentation,’’ PerceptionSuppl. 27, 21 (1998).
20. K. Boothroyd and R. Blake, ‘‘Stereopsis from disparity ofcomplex grating patterns,’’ Vision Res. 24, 1205–1222(1984).
21. H. S. Smallman and S. P. McKee, ‘‘A contrast ratio con-straint on stereo matching,’’ Proc. R. Soc. London Ser. B260, 265–271 (1995).
22. R. F. Hess, F. A. A. Kingdom, and L. R. Ziegler, ‘‘On the re-lationship between the spatial channels for luminance anddisparity processing,’’ Vision Res. 39, 559–568 (1999).
23. M. A. Georgeson and G. D. Sullivan, ‘‘Contrast constancy:Deblurring in human vision by spatial frequency channels,’’J. Physiol. (London) 252, 677–656 (1975).
24. N. Brady and D. J. Field, ‘‘What’s constant in contrast con-stancy? The effect of scaling on the perceived contrast ofbandpass patterns,’’ Vision Res. 35, 739–756 (1995).
25. R. A. Schumer and L. Ganz, ‘‘Independent stereoscopicchannels for different extents of spatial pooling,’’ VisionRes. 19, 1303–1314 (1979).
26. C. W. Tyler, ‘‘Sensory processing of binocular disparity,’’ inVergence Eye Movements: Basic and Clinical Aspects, M.C. Schor and K. J. Ciuffreda, eds. (Butterworth, Boston,Mass., 1983), pp. 199–296.
27. A. B. Cobo-Lewis and Y. Y. Yeh, ‘‘Selectivity of cyclopeanmasking for the spatial frequency of disparity modulation,’’Vision Res. 34, 607–620 (1994).
28. K. Pulliam, ‘‘Spatial frequency analysis of three-dimensional vision,’’ in Visual Simulation and Image Real-ism II, K. S. Setty, ed., Proc. SPIE 303, 71–77 (1981).
29. B. Lee and B. Rogers, ‘‘Disparity modulation sensitivity fornarrow-band-filtered stereograms,’’ Vision Res. 37, 1769–1778 (1997).
30. R. Blake and H. R. Wilson, ‘‘Neural models of stereoscopicvision,’’ Trends Neurosci. 14, 445–452 (1991).
31. L. R. Ziegler and R. F. Hess, ‘‘Stereoscopic depth but notshape perception from second-order stimuli,’’ Vision Res.39, 1491–1507 (1999).
32. L. R. Ziegler, F. A. A. Kingdom, and R. F. Hess, ‘‘Local lu-minance factors that determine the maximum disparity forseeing cyclopean surface shape,’’ Vision Res. 40, 1157–1165(2000).
33. G. Sperling, ‘‘Binocular vision: A physical and a neuraltheory,’’ Am. J. Psychol. 83, 461–534 (1970).
34. J. L. Nelson, ‘‘Globality and stereoscopic fusion in binocularvision,’’ J. Theor. Biol. 49, 1–88 (1975).
35. D. Marr and T. Poggio, ‘‘Cooperative computation of stereodisparity,’’ Science 194, 283–287 (1976).

1002 J. Opt. Soc. Am. A/Vol. 18, No. 5 /May 2001 Kingdom et al.
36. J. E. W. Mayhew and J. P. Frisby, ‘‘The computation of bin-ocular edges,’’ Perception 9, 69–86 (1980).
37. J. Gibson, The Perception of the Visual World (Houghton-Mifflin, Boston, Mass., 1950).
38. J. Cutting and R. Millard, ‘‘Three gradients and the percep-tion of flat and curved surfaces,’’ J. Exp. Psychol. Gen. 113,198–216 (1984).
39. J. Todd and R. Akerstrom, ‘‘Perception of three-dimensionalform from patterns of optical texture,’’ J. Exp. Psychol.Hum. Percep. 13, 242–255 (1987).
40. K. Stevens and A. Brookes, ‘‘Integrating stereopsis withmonocular interpretations of planar surfaces,’’ Vision Res.28, 371–386 (1988).
Copyright © 2022 FDOKUMEN