Utility of stereoscopic displays for indirect-vision driving and robot teleoperation
11
Utility of stereoscopic displays for indirect-vision driving and robot teleoperation Jessie Y.C. Chen a *, Razia V.N. Oden b and John O. Merritt c a U.S. Army Research Laboratory – Human Research & Engineering Directorate, Orlando, FL, USA; b Design Interactive, Inc., Oviedo, FL, USA; c The Merritt Group, Williamsburg, MA, USA (Received 24 May 2012; accepted 25 September 2013) The effectiveness of an active shutter-glasses stereoscopic display (SD) and a passive polarised SD was evaluated in a live robot-teleoperation task and a simulated indirect-vision driving task in various terrains. Overall, participants completed their tasks significantly faster with the SDs in three-dimensional (3D) mode than with the SDs in the baseline 2D mode. They also navigated more accurately with the SDs in 3D mode. When the effectiveness of the two types of SDs was examined separately, results showed that the active shutter-glasses SD resulted in faster responses and task completion times than the passive polarised SD, though most of the differences failed to reach statistical significance. Perceived workload when interacting with the two SD systems did not differ significantly between the active versus passive display types or between the 3D and 2D modes of operation; however, participants reported more severe discomfort after interacting with the passive polarised SD. Practitioner Summary: This study demonstrated the utility of SDs for enhancing operators’ navigation-related performance. The results furthered the understanding of the differential effectiveness of an active stereoscopic system versus a passive system. The findings will facilitate the implementation of stereoscopic systems for robotics control and indirect- vision driving in military settings. Keywords: stereoscopic display; human – robot interaction; indirect-vision driving; simulation; military; visual discomfort 1. Introduction The U.S. Army is currently developing future vehicles that can support indirect-vision driving (IVD), which is driving via a visual display rather than by directly viewing the environment (Figure 1). The current plans for the future vehicular programmes are to use a 3608 horizontal by 908 vertical two-dimensional (2D) display to provide local situation awareness information to the driver. However, recent field tests of vehicles using these IVD displays showed that drivers tended to drive significantly slower than when driving with a normal direct view of the environment, taking as much as 60% longer to complete certain driving tasks (General Dynamics Land Systems 2007). Because of these results, the U.S. Army funded the Army Research Laboratory to investigate ways to mitigate performance decrements associated with IVD (current study). This problem is not limited to IVD; robotics operators often find that the lack of depth perception hinders their task performance when they teleoperate their robot via a 2D display (Pezzaniti et al. 2009). There are anecdotal reports of various ways for the operators to cope with the degraded depth perception when they teleoperate a robot to perform manual tasks, such as explosive ordnance disposal. For example, it was found that by switching the view between the cameras, the operator could construct a better mental modal of the 3D scene (Pezzaniti et al. 2009). For tasks involving robotic arms or grippers, some operators have used the ‘bump’ method by moving the manipulator slowly until it ‘bumped’ the object. Even for tasks that only involve navigation (as opposed to fine manipulations), operators often observe the lack of depth perception with their 2D display. For example, in a field test of military robotic vehicles in 2009, a soldier participant noted that ‘the terrain appears flatter than it is’ (Walker 2009). 1.1 Stereoscopic displays One way to mitigate the aforementioned performance decrement is to utilise stereoscopic displays (SDs) to enhance the operators’ depth perception and thereby off-road driving, including robot teleoperation. Past research has shown that SDs, which rely on various techniques to present binocular images to the user, appear to provide advantages over 2D displays such as faster and more accurate perception of the environment, better distance estimation, enhanced detection of terrain This work was authored as part of the Contributors’ official duties as Employees of the United States Government and is therefore a work of the United States Government. In accordance with 17 U.S.C. 105, no copyright protection is available for such works under U.S. Law. A previous version of this study was published as a U.S. Army Research Laboratory technical report (ARL-TR-5259) and was presented at the 27th U.S. Army Science Conference. *Corresponding author. Email: [email protected] Ergonomics, 2014 Vol. 57, No. 1, 12–22, http://dx.doi.org/10.1080/00140139.2013.859739 Downloaded by [University of Central Florida] at 14:18 25 February 2014
-
Upload
independent -
Category
Documents
-
view
1 -
download
0
Transcript of Utility of stereoscopic displays for indirect-vision driving and robot teleoperation

Utility of stereoscopic displays for indirect-vision driving and robot teleoperation
Jessie Y.C. Chena*, Razia V.N. Odenb and John O. Merrittc
aU.S. Army Research Laboratory – Human Research & Engineering Directorate, Orlando, FL, USA;bDesign Interactive, Inc., Oviedo, FL, USA; cThe Merritt Group, Williamsburg, MA, USA
(Received 24 May 2012; accepted 25 September 2013)
The effectiveness of an active shutter-glasses stereoscopic display (SD) and a passive polarised SD was evaluated in a liverobot-teleoperation task and a simulated indirect-vision driving task in various terrains. Overall, participants completed theirtasks significantly faster with the SDs in three-dimensional (3D) mode than with the SDs in the baseline 2D mode. They alsonavigated more accurately with the SDs in 3D mode. When the effectiveness of the two types of SDs was examinedseparately, results showed that the active shutter-glasses SD resulted in faster responses and task completion times than thepassive polarised SD, though most of the differences failed to reach statistical significance. Perceived workload wheninteracting with the two SD systems did not differ significantly between the active versus passive display types or betweenthe 3D and 2D modes of operation; however, participants reported more severe discomfort after interacting with the passivepolarised SD.
Practitioner Summary: This study demonstrated the utility of SDs for enhancing operators’ navigation-relatedperformance. The results furthered the understanding of the differential effectiveness of an active stereoscopic system versusa passive system. The findings will facilitate the implementation of stereoscopic systems for robotics control and indirect-vision driving in military settings.
Keywords: stereoscopic display; human–robot interaction; indirect-vision driving; simulation; military; visual discomfort
1. Introduction
The U.S. Army is currently developing future vehicles that can support indirect-vision driving (IVD), which is driving via a
visual display rather than by directly viewing the environment (Figure 1). The current plans for the future vehicular
programmes are to use a 3608 horizontal by 908 vertical two-dimensional (2D) display to provide local situation awareness
information to the driver. However, recent field tests of vehicles using these IVD displays showed that drivers tended to
drive significantly slower than when driving with a normal direct view of the environment, taking as much as 60% longer to
complete certain driving tasks (General Dynamics Land Systems 2007). Because of these results, the U.S. Army funded the
Army Research Laboratory to investigate ways to mitigate performance decrements associated with IVD (current study).
This problem is not limited to IVD; robotics operators often find that the lack of depth perception hinders their task
performance when they teleoperate their robot via a 2D display (Pezzaniti et al. 2009). There are anecdotal reports of
various ways for the operators to cope with the degraded depth perception when they teleoperate a robot to perform manual
tasks, such as explosive ordnance disposal. For example, it was found that by switching the view between the cameras, the
operator could construct a better mental modal of the 3D scene (Pezzaniti et al. 2009). For tasks involving robotic arms or
grippers, some operators have used the ‘bump’ method by moving the manipulator slowly until it ‘bumped’ the object. Even
for tasks that only involve navigation (as opposed to fine manipulations), operators often observe the lack of depth
perception with their 2D display. For example, in a field test of military robotic vehicles in 2009, a soldier participant noted
that ‘the terrain appears flatter than it is’ (Walker 2009).
1.1 Stereoscopic displays
One way to mitigate the aforementioned performance decrement is to utilise stereoscopic displays (SDs) to enhance the
operators’ depth perception and thereby off-road driving, including robot teleoperation. Past research has shown that SDs,
which rely on various techniques to present binocular images to the user, appear to provide advantages over 2D displays
such as faster and more accurate perception of the environment, better distance estimation, enhanced detection of terrain
This work was authored as part of the Contributors’ official duties as Employees of the United States Government and is therefore a work of the United States Government.
In accordance with 17 U.S.C. 105, no copyright protection is available for such works under U.S. Law.
A previous version of this study was published as a U.S. Army Research Laboratory technical report (ARL-TR-5259) and was presentedat the 27th U.S. Army Science Conference.
*Corresponding author. Email: [email protected]
Ergonomics, 2014
Vol. 57, No. 1, 12–22, http://dx.doi.org/10.1080/00140139.2013.859739
Dow
nloa
ded
by [
Uni
vers
ity o
f C
entr
al F
lori
da]
at 1
4:18
25
Febr
uary
201
4

hazards (e.g. slopes and depressions), enhanced object recognition and detection, and visual noise filtering (Drascic 1991;
Grossman and Balakrishnan 2006; McIntire, Havig, and Geiselman 2012; Merritt, Cuqlock-Knopp, and Myles 1997; Rosen
et al. 2004; Scribner and Gombash 1998; Singer et al. 1995). Studies have also shown that SDs could enhance human
operators’ speed of navigation and distance judgment (Grossman and Balakrishnan 2006; Holzhausen, Pitrella, and Wolf,
1993; Spain and Hughes 1991; Umeda, Martin, and Merritt 1991), surgical task performance (Blavier and Nyssen 2009;
Huber et al. 2003; Van Beurden, Ijsselsteijn, and Juola 2012) and other object manipulation tasks (Alpaslan et al. 2006;
Kawai et al. 2002; Pezzaniti et al. 2009; Rosenberg 1993). McIntire, Havig, and Geiselman (2012) conducted a qualitative
meta-analysis of 71 experiments comparing the effectiveness of SD versus 2D displays for various tasks. Their results show
that SDs were consistently more effective than 2D for tasks involving spatial manipulation and understanding, though this
research was limited to non-medical domains. In medical-related domains, a recent review reported that SDs benefited
performance of various surgical procedures (i.e. decreased surgery time and increased accuracy of procedures) and
visualising anatomical structures (Van Beurden, Ijsselsteijn, and Juola 2012). However, it is important to note that findings
in experimental testing of 3D versus 2D can vary considerably, depending on the presence of non-binocular depth cues in
the tasks, the skill and experience of the participants, visibility and image-quality factors, and whether the 3D-display
system is set up properly (e.g. no ‘reversed stereo’ or swapping of the left/right image channels). The rest of this section
briefly reviews some of the findings that are most relevant to our current investigation.
In general, past research findings suggest that SDs provide the greatest advantage when the image quality, task structure
and predictability (e.g. remote scene familiarity and terrain predictability), user experience and manipulator dexterity were
suboptimal (Draper, Handel, and Hood 1991; Drascic 1991; Umeda, Martin, and Merritt 1991). For example, an earlier test
of teleoperating a ground robot using a stereoscopic head-mounted display (HMD) versus a monoscopic HMD showed that
experienced drivers were able to drive significantly faster with the stereoscopic HMD than with the monoscopic system
(Spain and Hughes 1991). Grossman and Balakrishnan (2006) found that SDs (a volumetric system and two shutter-glasses
systems) were more effective than a 2D display system for depth judgment, collision judgment and path tracing. However,
test results have not always been consistent, especially when autostereoscopic systems were used (Durkee et al. 2010; Ntuen
et al. 2008). Nevertheless, a consistent finding from various studies is that teleoperators generally prefer SDs over 2D
displays (Drascic and Grodski 1993; Green, Dougherty, and Savacool 2003). However, Froner, Holliman, and Liversedge
(2008) showed that user preference for an SD did not always translate into better task performance with the SD. In addition,
as noted in Scribner and Gombash (1998), artificially generated binocular stereovision may increase motion sickness and
perceived stress. Several researchers (Bando, Iijima, and Yano 2012; Howarth 2011; Lambooij et al. 2009) have reviewed
the common visual discomforts associated with viewing stereoscopic images and some potential mitigation strategies to
reduce the discomforts.
More realistic tests were conducted by researchers from the U.S. Army (Merritt et al. 2005; Merritt, Cuqlock-Knopp,
and Myles 1997) who investigated the ability of humans to detect obstacles in static and moving video terrain with 3D and
hyper-stereo displays (i.e. inter-ocular distance artificially increased to increase binocular disparity depth cues). The results
indicated improved detection of negative terrain and mobility obstacles for the 3D conditions versus 2D conditions. These
preliminary field demonstrations of actual Army systems suggest that the 3D performance gains may extend to teleoperated
systems. The researchers caution that SDs have definite perceptual and physical limitations, as mentioned above; however,
Figure 1. IVD environment.
Ergonomics 13
Dow
nloa
ded
by [
Uni
vers
ity o
f C
entr
al F
lori
da]
at 1
4:18
25
Febr
uary
201
4

SDs should be an optional medium for presenting complex terrain, especially where depth perception is crucial, and for
telerobotic-manipulator work and other tasks where normal 3D cues are unavailable.
1.2 Current study
In this study, we investigated whether an SD could improve the operators’ IVD and robot teleoperation performance, and
which type of SD supported better performance. Two types of SD technologies were evaluated: active shutter glasses
(nVIDIAw) and passive polarised glasses (Miracubew). The SDs were configured so that the perceived frame rate,
resolution and brightness of the resulting imageries were as similar to each other as possible (see Section 2.2). The
experiment had two tasks – live robot teleoperation and virtual navigation (simulated IVD). For the Robot Teleoperation
task, participants manoeuvred a physical robot through a course of cones on grass terrain using one of the SDs in both 2D
and 3D modes. For the Virtual Navigation task, participants drove through both stereo and non-stereo scenarios in a
3D-rendered, simulated driving environment (VBS2w). Different types of terrains were simulated in the virtual scenarios.
2. Method
2.1 Participants
Thirty-two individuals (19 males and 13 females, mean age ¼ 25.8) from the Orlando, FL, area participated in the
experiment. Participants received payment for their time at the rate of $15/h.
2.2 Apparatus
2.2.1 SD systems
The two stereoscopic 3D display systems used were an nVIDIA display and a Pavonine Miracube display (Figure 2). The
nVIDIA system used a 56-cm 120Hz display, with a resolution of 1680 £ 1050 pixels. This display was viewed with active-
shutter 3D glasses synchronised by an infrared (IR) emitter pointing towards the glasses, providing stereoscopic video
displayed series of left-eye and right-eye images alternating in time. Each eye saw 60 images per second, and all frames had
full pixel resolution. The Pavonine 3D Miracube system used a 61-cm 60Hz liquid crystal display (LCD), with a resolution
of 1920 £ 1200 pixels. The Miracube system used a filter sheet placed over the LCD screen to make every other pixel row
of the display circularly polarised oppositely from the rest of the rows. Coupled with passive, circularly polarised 3D
glasses, this provided the viewer with stereoscopic input with only a small reduction in screen brightness but with half
vertical resolution of 600 pixel rows per eye. For both displays, to achieve proper depth, convergence and orthostereo (the
ability to produce images in the display which appear to be of the same visual size as in the real world), the display had to be
calibrated each time the experimental condition changed between 2D and 3D; this was achieved by setting the convergence
and inter-axial separation values to a predefined level for 3D and then toggling those values on and off.
The terms ‘active’ versus ‘passive’ refer to the type of 3D glasses used. Active shutter 3D glasses alternately block the
left (L) and right (R) eyes while the display is showing the L and R images, alternating at 120 times per second. Each eye
sees its image for 1/120th of a second followed by a blank when that shutter is closed for 1/120th of a second. This provides
Figure 2. SD used in the virtual navigation task.
J.Y.C. Chen et al.14
Dow
nloa
ded
by [
Uni
vers
ity o
f C
entr
al F
lori
da]
at 1
4:18
25
Febr
uary
201
4
full 1680 £ 1050 resolution for each eye. Typically, the 120Hz flicker rate is high enough not to be visible to the user. The
passive 3D glasses used in these experiments were similar to polarising sunglasses, with no active on/off switch. Both L and
R images are present on the screen at the same time, continuously, with the L eye image shown on the odd pixel rows, the R
eye image shown on the even pixel rows. This means that each eye sees only half of the pixel rows through the polarising
lenses of the passive glasses, which produces a condition in which the pixel rows with images alternate with pixels rows
that are black. Thus, each eye sees only 600 of the 1200 pixel rows, while with the active 3D glasses, each eye sees all
1050 pixel rows.
2.2.2 Stereoscopic simulation
Bohemia Interactive’s VBS2 (U.S. Army version) and the VBS2 VTK Developer Suite v1.23 were used to create the virtual
driving simulation. Custom 3D models that were needed to create the virtual scenarios were modelled in 3ds Max9w, and
custom textures were created with Adobew Photoshopw CS3. For the negative terrain tracks, it was important to minimise
the visual cues that are typically present in realistically rendered 2D simulations (e.g. high-contrast lighting and realistic
textures which give the illusion of added depth). The negative terrain tracks incorporated both positive terrain features, such
as trees and rocks, and negative terrain features, such as cliffs and ditches. An attempt was made to eliminate all visual hints,
such as changes in texture type or shadows that would be a cue to the participant that a drop-off in elevation was ahead.
Flatly rendered textures with random repeating patterns (e.g. sand with weeds and plain grass) were used to eliminate visual
cues caused by the textures. A script was created to change the time of day in VBS2 to dusk to eliminate high-contrast
lighting.
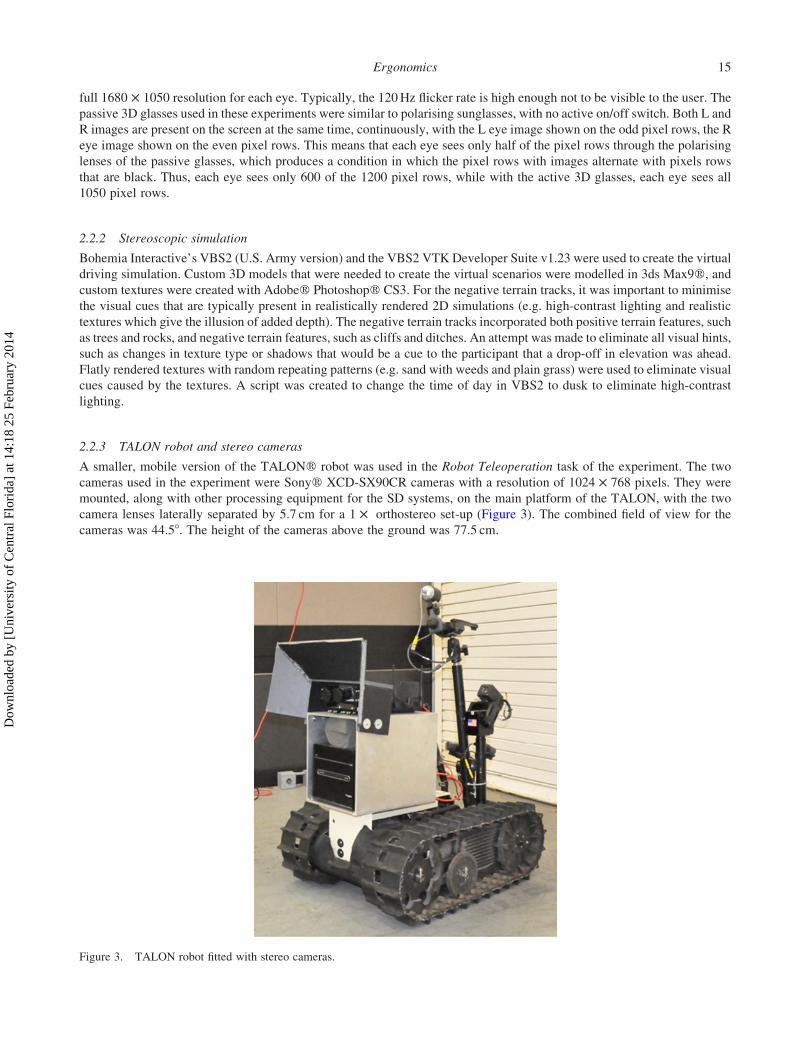
2.2.3 TALON robot and stereo cameras
A smaller, mobile version of the TALONw robot was used in the Robot Teleoperation task of the experiment. The two
cameras used in the experiment were Sonyw XCD-SX90CR cameras with a resolution of 1024 £ 768 pixels. They were
mounted, along with other processing equipment for the SD systems, on the main platform of the TALON, with the two
camera lenses laterally separated by 5.7 cm for a 1 £ orthostereo set-up (Figure 3). The combined field of view for the
cameras was 44.58. The height of the cameras above the ground was 77.5 cm.
Figure 3. TALON robot fitted with stereo cameras.
Ergonomics 15
Dow
nloa
ded
by [
Uni
vers
ity o
f C
entr
al F
lori
da]
at 1
4:18
25
Febr
uary
201
4

2.2.4 Surveys and tests
The stereoscopic depth acuity screening test used was a Randot Stereo Testw. Those who did not meet the 500 s of arc were
excluded from the study. Each participant’s perceived workload was evaluated using the computerised version of the
NASA – Task Load Index (NASA – TLX) questionnaire, which includes a pairwise comparison weighting procedure (Hart
and Staveland 1988). According to Noyes and Bruneau (2007), the computer-based NASA – TLX tends to generate higher
workload ratings than the traditional paper-based survey. However, since the ratings were used to compare the workload
levels across the experimental conditions, the elevated ratings should not affect these comparisons. The simulator sickness
questionnaire (SSQ) was used to evaluate participants’ simulator sickness symptoms (Kennedy et al. 1993). The SSQ
consists of a self-report checklist of 16 symptoms. Each symptom is related in terms of degree of severity (none, slight,
moderate, severe). A total severity (TS) score can be derived by a weighted scoring procedure and reflects overall
discomfort level. In addition, a weighted scoring procedure can be applied to the symptoms to derive scores for three
different symptom clusters, known as sickness subscales (nausea, oculomotor and disorientation).
2.2.5 Experimental design
The overall design of the study was a 2 £ 2 mixed-model design. The between-subjects factor was display type [shutter
(nVIDIA) vs polarised (Miracube)] and the within-subjects factor was stereovision (2D vs 3D).
2.2.6 Procedure
After being briefed on the purpose of the study and signing an informed consent form, participants completed the Randot
Stereo Testw and the demographics questionnaire and were then randomly assigned to either the shutter group or the
polarised group. The participants then went through the calibration process as described in Section 2.2.1. The distance
between the participant and the SD was 58.4 cm for shutter and 63.5 cm for polarised.
Robot teleoperation task. Participants practiced teleoperating the robot (without line-of-sight) for one course in 2D and
one course in 3D. They were then asked to drive a robot through four test courses marked by traffic cones (Figure 4), twice
with 3D and twice with 2D (the same 3D display operated in 2D mode). If participants drove the robot completely outside
the course (i.e. the entire robot was outside the course markers), the trial was restarted; each participant was allowed to
restart each trial twice. If participants went outside the course more than three times, they were moved to the next course.
The performance data from the last successful trial were used with a restart value reflecting how many times participants
had to be restarted. Trials were counterbalanced using a Williams Square to avoid order effects. Each trial took
approximately 1 min and after completing this portion, participants assessed their workload and sickness symptoms.
Virtual navigation task. Participants were asked to drive through three types of courses, and each type of course featured
two unique tracks (Figure 5). One type of course was a ‘Floating Objects Course’ in which participants drove on an
enclosed, pavement course towards six sets of object pairs (Figure 5(a)). Participants were instructed to drive as quickly as
possible around the objects on the side of the closer object (L or R). Another type of course was an ‘Obstacle Course’ in
which participants drove as quickly as possible around obstacles such as rocks and shrubs (Figure 5(b)). The third type of
Figure 4. Robot teleoperation tests.
J.Y.C. Chen et al.16
Dow
nloa
ded
by [
Uni
vers
ity o
f C
entr
al F
lori
da]
at 1
4:18
25
Febr
uary
201
4

course was a ‘Negative Terrain Course’ in which participants drove on an enclosed course of varying negative and positive
terrain features (i.e. holes in the ground, drop-offs and hills; Figure 5(c)). Participants were instructed to drive as quickly as
possible through the course while avoiding the positive and negative terrain obstacles. Participants were given a practice
course for each type of trial in 2D and 3D prior to starting the experimental trials, and participants completed each type of
experimental course twice, once in 2D and once in 3D. Trials were counterbalanced using a Williams Square to avoid order
effects. Each trial took approximately 3 min, and after completing all trials, participants assessed their workload and
sickness symptoms.
Following completion of the experiment, participants were fully debriefed, and their information was taken for
payment. The entire experiment lasted ,1.5 h.
2.2.7 Dependent measures
The dependent measures for the Robot Teleoperation task were course completion time and number of cones hit. The
dependent measures for the Virtual Navigation task were course completion time and accuracy of completing the simulated
driving tasks (i.e. how many terrain hazards they failed to avoid). Subjective measures included participants’ assessments of
their workload (NASA – TLX scores) and sickness (SSQ scores), which were assessed after each part of the experiment.
Mixed-model analyses of variance (ANOVAs) with stereovision as the within-subject variable (2D vs 3D) and display type
(shutter vs polarised) as the between-subject variable were carried out. Non-parametric statistics (Mann–Whitney U) were
used to evaluate the SSQ measures (TS and nausea, oculomotor and disorientation subscales) due to the non-normal
distribution of the sickness data based on the scoring scheme of the SSQ recommended by Kennedy et al. (1993).
3. Results
3.1 Overall effects of stereovision and display types
Table 1 lists the means and standard deviations for each of the performance measures. The effects of stereovision on course
completion times for the robot teleoperation and the three virtual tasks were evaluated. The analysis revealed that there was
a significant main effect for stereovision, F(4,26) ¼ 5.5, p , 0.005, h 2p ¼ 0.46, with 2D being longer/slower than 3D. The
following segments report the performance results for each of the three types of tasks.
3.2 Robot teleoperation
The effects of stereovision and display on participants’ course completion times and number of cones hit were analysed.
There was a significant main effect of stereovision for course completion times, F(1,30) ¼ 6.259, p ¼ 0.018, h 2p ¼ 0.173,
with the 3D condition (M ¼ 65.3 s) resulting in faster completion times in the 3D condition than in the 2D condition
Figure 5. (a) Floating objects course, (b) obstacle course and (c) negative terrain course.
Table 1. Summary of performance measure means and standard deviations (in parentheses).
2D 3D
Test Measures Shutter Polarised Shutter Polarised
Teleoperation Completion time (s) 65.03 (14.71) 74.78 (20.52) 62.63 (14.54) 67.94 (19.87)No of cones hit 3.88 (1.69) 4.56 (1.79) 3.38 (1.40) 4.19 (1.31)
Virtual Floating Completion time (s) 15.01 (3.84) 15.66 (4.66) 16.74 (5.13) 17.43 (6.07)No of trials correct 3.69 (1.01) 4.44 (1.03) 4.44 (1.21) 5.19 (1.11)
Obstacle Completion time (s) 152.6 (33.4) 149.2 (30.4) 160.3 (41.0) 157.7 (40.2)Time off course (s) 16.73 (13.52) 16.92 (10.14) 14.84 (14.09) 13.85 (9.69)
Negative Completion time (s) 209.8 (48.7) 217.6 (50.0) 189.2 (45.0) 217.2 (47.7)Time off course (s) 17.44 (14.29) 10.11 (13.93) 11.23 (6.12) 11.13 (11.39)
Ergonomics 17
Dow
nloa
ded
by [
Uni
vers
ity o
f C
entr
al F
lori
da]
at 1
4:18
25
Febr
uary
201
4

(M ¼ 69.9 s) (Figure 6). In the 3D condition, participants performed slightly faster and more accurately (i.e. hitting less
cones) with the shutter display. However, the differences failed to reach statistical significance.
3.3 Virtual tests
3.3.1 Floating objects course
The effects of stereovision and display on participants’ course completion times and accuracy (i.e. number of trials correct)
were analysed. For course completion times, there was a significant main effect of stereovision, F(1,30) ¼ 8.395,
p ¼ 0.007, h 2p ¼ 0.219, with 2D (M ¼ 15.3) faster than 3D (M ¼ 17.1). However, 3D (M ¼ 4.8) provided significantly
more accurate results than 2D (M ¼ 4.1), F(1,29) ¼ 9.643, p ¼ 0.004, h 2p ¼ 0.243 (Figure 7). In the 3D condition, there
was no significant difference in completion time between the shutter display (M ¼ 4.4) and the polarised display (M ¼ 5.2).
Participants’ average speed (miles per hour) for the virtual tests in the 3D condition is depicted in Figure 8.
3.3.2 Obstacle course
The effects of stereovision and display on participants’ course completion times and accuracy (i.e. time off-course) were
analysed. There were no significant main effects for either measure.
3.3.3 Negative terrain course
The effects of stereovision and display on participants’ course completion times and accuracy (i.e. time off-course) were
analysed. For course completion times, there was a significant main effect of stereovision (Figure 9), F(1,28) ¼ 5.129,
p ¼ 0.031, h 2p ¼ 0.155, with 3D (M ¼ 199) being faster than 2D (M ¼ 214). In the 3D condition, participants performed
slightly faster with the shutter display. However, the difference failed to reach statistical significance. In terms of accuracy,
none of the factors were significant.
Figure 6. Robot teleoperation completion times.
Figure 7. Floating object course – course completion time and number of trials correct.
J.Y.C. Chen et al.18
Dow
nloa
ded
by [
Uni
vers
ity o
f C
entr
al F
lori
da]
at 1
4:18
25
Febr
uary
201
4

3.4 Perceived workload and sickness
Participants’ perceived workload was slightly higher with the shutter display than with the polarised display, but the
difference was not statistically significant. A Mann–Whiney U test was conducted on the SSQ TS scores to determine
the effects of 3D display type on sickness across the experimental session (i.e. sickness associated with use of the
SD, irrespective of the type of test carried out). For this analysis, the TS scores for the final SSQ administration
(i.e. following completion of all three tests) were used. The results revealed a significant difference in TS sickness scores
(U ¼ 45, z ¼ –2.259, p ¼ 0.02); overall, sickness was greater for the polarised display. Analyses of the SSQ subscale
scores were then conducted to evaluate differences in the types of symptoms reported for the two displays. No significant
differences in the oculomotor and disorientation subscales were found between the two displays, but significantly more
nausea-related symptoms were reported for the polarised display than for the shutter display (U ¼ 48, z ¼ –2.667,
p ¼ 0.01). Figure 10 shows the percentages of participants who did not report any symptoms.
Previous research has shown gender differences in reported sickness; therefore, an additional analysis was conducted to
evaluate the effect of gender on sickness in this study. However, this analysis was restricted to the sickness data for each test
type with the polarised display due to the limited number of females in the shutter display group. No significant gender
differences in sickness were found for the robot teleoperation task. The analysis results did reveal a significant gender
difference in sickness severity for the virtual navigation task (U ¼ 9, z ¼ –2.317, p ¼ 0.02), with females reporting greater
sickness than males. Additional analyses on the subscale scores for the virtual task showed that females reported
significantly more oculomotor- and disorientation-related symptoms than males (U ¼ 9, z ¼ –2.353, p ¼ 0.019 and U ¼ 8,
z ¼ –2.507, p ¼ 0.012, respectively). It was also observed that females tended to take more time to complete the virtual
task; however, the difference was not statistically significant.
4. Discussion
In this experiment, we evaluated two SD systems in two different types of tasks: live robot teleoperation and simulated IVD
in virtual environments with different types of terrain. Overall, participants completed their tasks significantly faster when
they used an SD in 3D mode than the baseline 2D mode. When the effectiveness of the SDs was examined separately, the
analysis showed that the shutter-glasses system appeared to be slightly more effective than the polarised system in
Figure 8. Average speed (km per hour) for the virtual tests in 3D condition.
Figure 9. Course completion time in negative terrain courses.
Ergonomics 19
Dow
nloa
ded
by [
Uni
vers
ity o
f C
entr
al F
lori
da]
at 1
4:18
25
Febr
uary
201
4

supporting faster response times and course completion times, although most of the differences failed to reach statistical
significance. These results are consistent with prior findings that active SDs seem to be more effective than passive SDs
(Froner, Holliman, and Liversedge 2008). It is worth noting that the Froner et al. experiment, in which seven types of SDs
were compared (including an active and a passive system), used a chin-rest to assure proper posture of the test participants
(see discussion below on the potential effects of posture on task performance and sickness).
For the floating course of the virtual tasks, the results showed a speed/accuracy trade-off – participants’ accuracy was
significantly better with 3D than with 2D, though they completed the task faster in the 2D condition. For the obstacle course
of the virtual tasks, none of the factors were found to be significant. For the negative terrain course of the virtual tasks,
participants completed the courses significantly faster in the 3D condition than in the 2D condition. The lack of difference in
operator performance for the polarised display may be due to the fact that the negative terrain tracks had a very large
number of graphics that had to be rendered (as opposed to the floating tracks and obstacle tracks), and the polarised display
required two image streams to be rendered for the 3D condition but only one image stream for the 2D condition. Therefore,
images in the 3D polarised condition could have been slightly slower or ‘sluggish’ than the 2D condition, which could
account for why 3D did not result in better performance than 2D for the polarised display. In contrast, there was no
difference in the amount of image streams that had to be rendered in the 2D versus 3D conditions for the shutter display. In
other words, there was no additional ‘cost’ associated with rendering 3D images for the shutter display compared with the
2D condition. As a result, participants drove faster (about a 10% reduction in course completion time) and more accurately
(42% reduction in time off-course) in the 3D condition.
Although the data did not indicate a significant effect of display type on workload for any of the tasks, there was an
effect of display type on sickness; nausea-related symptoms were significantly greater after using the polarised display.
These results suggest that the two displays are comparable in workload, but may differ in terms of their sickness-inducing
characteristics. With the polarised display, if participants moved their eyes out of the ‘ideal’ viewing eye-height, the stereo
would become less clear due to less L/R channel separation, which increases ghosting and reduces binocular depth
perception, whereas the shutter system was not adversely affected by changes in user eye-height relative to the display
screen. Therefore, the viewing-position constraints associated with the polarised display (i.e. participants’ failure to
maintain proper posture and tendency to be outside of their comfortable viewing position) may have contributed to
participants’ elevated sickness ratings, particularly in the nausea-related areas. For reviews on visual discomfort/fatigue
associated with viewing stereoscopic images, see Lambooij et al. (2009) and Howarth (2011). It is worth noting that the
majority of studies on the effects of SDs on user comfort used only either the polarised display or the shutter-glasses-based
display in their investigation. This study represents the first effort to evaluate both types of displays in one single study with
the same stimuli.
Figure 10. SSQ – percentage of participants without any symptoms.
J.Y.C. Chen et al.20
Dow
nloa
ded
by [
Uni
vers
ity o
f C
entr
al F
lori
da]
at 1
4:18
25
Febr
uary
201
4

Building on the results from this experiment, a follow-on study was conducted to further investigate the use of SDs for
simulated robot teleoperation (Drexler et al. 2012). The data analysis shows that the 3D group using an active SD system
had significantly fewer collisions than did the 2D group using the same system, regardless of the terrain types used in the
scenario (i.e. obstacle course or negative terrain). Participants in the SD group also had better target detection performance
than those who were in the 2D group. Finally, there are no significant differences in SSQ TS as well as any sickness subscale
score (nausea, oculomotor and disorientation) between the two groups.
5. Conclusions
In conclusion, the results of this study indicate that stereoscopic 3D displays have advantages over tradition 2D displays
with respect to depth perception, specifically on IVD and robot teleoperation tasks. Furthermore, the results show that the
shutter SD appears to be superior to the polarised SD for these tasks and may also produce less sickness. Further tests are
needed to determine exactly which of the differences between the active shutter glasses display and the passive polarised
display were responsible for the findings in this study.
Acknowledgements
The authors would like to thank Abraham Kim of PEO Integration for his guidance throughout the project. We would like to acknowledgeCaitlin Kenny for her assistance in data collection and Julie Drexler for her analysis of the sickness data. We would also like to thank MikeBarnes and Keryl Cosenzo (ARL-HRED) and Jeff Koshko, Joe Kott, Jeremy Gray and John Vala (TARDEC) for their guidance andassistance and the Robotic Systems Joint Program Office (RS JPO) for lending us the TALON robot. We thank Bob Sottilare, NealFinkelstein and Irwin Hudson (ARL-HRED-STTC) for their assistance. Finally, we acknowledge the contributions of the followingindividuals to this project: Brian Oigarden, Nathan Hubbard, Dean Reed and Brian Plamondon (UCF-IST), and Robert S. Kennedy (RSKAssessments, Inc.).
Funding
This project was funded by PEO Integration.
References
Alpaslan, Z. Y., A. A. Sawchuk, A. A. Rizzo III, and S. Yeh. 2006. “Effects of Gender, Application, Experience, and Constraints onInteraction Performance Using Autostereoscopic Displays.” Proceedings of SPIE (Stereoscopic Displays and Virtual Reality SystemsXIII), Vol. 6055.
Bando, T., A. Iijima, and S. Yano. 2012. “Visual Fatigue Caused by Stereoscopic Images and the Search for the Requirement to PreventThem: A Review.” Displays 33: 76–83.
Blavier, A., and A. S. Nyssen. 2009. “Influence of 2D and 3D View on Performance and Time Estimation in Minimal Invasive Surgery.”Ergonomics 52: 1342–1349.
Draper, J. V., S. Handel, and C. C. Hood. 1991. “Three Experiments with Stereoscopic Television: When It Works and Why.”Proceedings of IEEE International conference on Systems, Man, & Cybernetics 2: 1047–1052.
Drascic, D. 1991. “An Investigation of Monoscopic and Stereoscopic Video for Teleoperation.” Master’s thesis, University of Toronto.Drascic, D., and J. Grodski. 1993. “Defense Teleoperation and Stereoscopic Video.” Proceedings of SPIE (Stereoscopic Displays and
Applications IV) 1915: 58–69.Drexler, J. M., J. Y. C. Chen, S. A. Quinn, and D. Solomon. 2012. Effects of Display Dimension and Viewpoint Synchronization on Robot
Teleoperation Performance in a Simulated Environment. Aberdeen Proving Ground, MD: U.S. Army Research Laboratory TechnicalReport (ARL-TR-6255).
Durkee, K., M. Paley, K. Kudzma, and D. Reiners. 2010. “Evaluation of 2D and 3D Displays to Validate the Integration of HumanPerformance Analysis Methods into Submarine Acquisitions.” In Proceedings of the Human Factors and Ergonomics Society 54thAnnual Meeting, 2196–2200.
Froner, B., N. S. Holliman, and S. P. Liversedge. 2008. “A Comparative Study of Fine Depth Perception on Two-View 3D Displays.”Displays 29: 440–450.
General Dynamics Land Systems. 2007. Vetronics Technology Integration: A Synopsis (unpublished internal report).Green, J., E. Dougherty, and E. Savacool. 2003. “Stereovision System for Shipboard Cranes.” Proceedings of Interservice/Industry
Training, Simulation, & Education Conference (I/ITSEC).Grossman, T., and R. Balakrishnan. 2006. “An Evaluation of Depth Perception on Volumetric Displays.” Proceedings of the Working
Conference on Advanced Visual Interfaces (AVI 2006), 193–200.Hart, S., and L. Staveland. 1988. “Development of NASA TLX (Task Load Index): Results of Empirical and Theoretical Research.” In
Human Mental Workload, edited by P. Hancock, and N. Meshkati, 139–183. Amsterdam, The Netherlands: Elsevier.Holzhausen, K., F. D. Pitrella, and H. Wolf. 1993. “Human Engineering Experiments Using a Telerobotic Vehicle.” In Vision in Vehicles-
IV, edited by A. G. Gale, I. D. Brown, S. P. Taylor, and C. M. Haslegrave, 223–230. Amsterdam, The Netherlands: Elsevier.Howarth, P. A. 2011. “Potential Hazards of Viewing 3-D Stereoscopic Television, Cinema and Computer Games: A Review.”
Ophthalmic & Physiological Optics 31: 111–122.
Ergonomics 21
Dow
nloa
ded
by [
Uni
vers
ity o
f C
entr
al F
lori
da]
at 1
4:18
25
Febr
uary
201
4

Huber, J. W., N. Taffinder, R. C. G. Russell, and A. Darzi. 2003. “The Effects of Different Viewing Conditions on Performance inSimulated Minimal Access Surgery.” Ergonomics 46: 999–1016.
Kawai, S., V. A. Summers, C. L. Mackenzie, C. J. Ivens, and T. Yamamoto. 2002. “Grasping an Augmented Object to AnalyseManipulative Force Control.” Ergonomics 45: 1091–1102.
Kennedy, R. S., N. E. Lane, K. S. Berbaum, and M. G. Lilienthal. 1993. “Simulator Sickness Questionnaire: An Enhanced Method forQuantifying Simulator Sickness.” International Journal of Aviation Psychology 3: 203–220.
Lambooij, M., W. IJsselsteijn, M. Fortuin, and I. Heynderickx. 2009. “Visual Discomfort in Stereoscopic Displays: A Review.” Journalof Imaging Science and Technology 53: 1–14.
Mcintire, J. P., P. R. Havig, and E. E. Geiselman. 2012. “What is 3D Good for? A Review of Human Performance on Stereoscopic 3DDisplays.” Proceedings of SPIE (Head- and Helmet-Mounted Displays XVII), Vol. 8383.
Merritt, J. O., V. G. CuQlock-Knopp, and K. Myles. 1997. “Enhanced Perception of Terrain Hazards in Off-Road Path Choice:Stereoscopic 3D Versus 2D Displays.” Proceedings of SPIE (Targets and Backgrounds) 3062: 101–104.
Merritt, J. O., V. G. CuQlock-Knopp, M. Kregel, J. Smoot, and W. Monaco. 2005. “Perception of Terrain Drop-Offs As a Function of L–R Viewpoint Separation in Stereoscopic Video.” Proceedings of SPIE (Helmet- and Head- Mounted Displays X) 5800: 169–176.
Noyes, J. M., and D. P. Bruneau. 2007. “A Self-Analysis of the NASA-TLX Workload Measure.” Ergonomics 50: 514–519.Ntuen, C. A., M. Goings, M. Reddin, and K. Holmes. 2008. “Comparison Between 2-D & 3-D Using an Autostereoscopic Display: The
Effects of Viewing Field and Illumination on Performance and Visual Fatigue.” International Journal of Industrial Ergonomics 39:388–395.
Pezzaniti, J. L., R. Edmondson, J. Vaden, B. Hyatt, D. B. Chenault, D. Kingston, V. M. Geulen, S. Newell, and B. Pettijohn. 2009. “3DVision System Assessment.” Proceedings of Stereoscopic Displays and Applications XX (SPIE-IS&T Electronic Imaging, SPIE)Vol. 7237.
Rosen, P., Z. Pizlo, C. Hoffmann, and V. S. Popescu. 2004. “Perception of 3D Spatial Relations for 3D Displays.” Proceedings of SPIE(Stereoscopic Displays and Virtual Reality Systems XI) 5291: 9–16.
Rosenberg, L. B. 1993. “The Effect of Interocular Distance upon Operator Performance Using Stereoscopic Displays to Perform VirtualDepth Tasks.” In Proceedings of IEEE Virtual Reality Annual International Symposium 27–32. Piscataway, NJ: IEEE.
Scribner, D., and J. Gombash. 1998. The Effect of Stereoscopic and Wide Field of View Conditions on Teleoperator Performance (ARLTech. Rep. ARL-TR-1598). Aberdeen Proving Ground, MD: Army Research Laboratory.
Singer, M., J. Ehrlich, S. Cinq-Mars, and J. Papin. 1995. Task Performance in Virtual Environments: Stereoscopic Versus MonoscopicDisplays and Head-Coupling (Tech. Rep. 1034) Alexandria, VA: U.S. Army Research Institute for the Behavioral & Social Sciences.
Spain, E., and T. Hughes. 1991. “Objective Assessments of Mobility with an Early Unmanned Ground Vehicle (UGV) Prototype ViewingSystem.” (NOSC Tech. Rep. AD-A237317).
Umeda, A. Y., S. W. Martin, and J. O. Merritt. 1991. “Remote Vision Systems for Teleoperated Ground Vehicles.” Proceedings of NATODefense Research Group on Robotics in the Air-Land Battle, 2008. http://www.dtic.mil/cgibin/GetTRDoc?AD¼ADA236765&Loxation ¼Y2&dox¼GetTRDoc.pdf].
Van Beurden, M. H. P. H., W. A. IJsselsteijn, and J. F. Juola. 2012. “Effectiveness of Stereoscopic Displays in Medicine: A Review.” 3DResearch 3: 3.
Walker, E. C. 2009. Soldier Operational Exercise 1.0 Test Report for the Robotic Vehicle Control Architecture (RVCA). Warren, MI: U.S.Army Tank-Automotive Research, Development, and Engineering Center.
J.Y.C. Chen et al.22
Dow
nloa
ded
by [
Uni
vers
ity o
f C
entr
al F
lori
da]
at 1
4:18
25
Febr
uary
201
4