Alloantigen-presenting plasmacytoid dendritic cells mediate tolerance to vascularized grafts
11
Alloantigen-presenting plasmacytoid dendritic cells mediate tolerance to vascularized grafts Jordi C Ochando 1 , Chiho Homma 1 , Yu Yang 1 , Andres Hidalgo 2 , Alexandre Garin 3 , Frank Tacke 1 , Veronique Angeli 1 , Yansui Li 4 , Peter Boros 4 , Yaozhong Ding 1 , Rolf Jessberger 1,5 , Giorgio Trinchieri 6 , Sergio A Lira 4 , Gwendalyn J Randolph 1 & Jonathan S Bromberg 1,4,7 The induction of alloantigen-specific unresponsiveness remains an elusive goal in organ transplantation. Here we identify plasmacytoid dendritic cells (pDCs) as phagocytic antigen-presenting cells essential for tolerance to vascularized cardiac allografts. Tolerizing pDCs acquired alloantigen in the allograft and then moved through the blood to home to peripheral lymph nodes. In the lymph node, alloantigen-presenting pDCs induced the generation of CCR4 + CD4 + CD25 + Foxp3 + regulatory T cells (T reg cells). Depletion of pDCs or prevention of pDC lymph node homing inhibited peripheral T reg cell development and tolerance induction, whereas adoptive transfer of tolerized pDCs induced T reg cell development and prolonged graft survival. Thus, alloantigen-presenting pDCs home to the lymph nodes in tolerogenic conditions, where they mediate alloantigen-specific T reg cell development and allograft tolerance. The main unsolved goal in clinical transplantation is the establishment of tolerance to transplant antigens. Although much has been learned over the past decade about the various cell populations involved in transplant rejection 1–4 , the precise cell subpopulations involved in the induction and maintenance of transplant tolerance remain unidenti- fied. That is due in part to the difficulty in defining the precise interactions between diverse antigen-presenting cells (APCs) and T cell subsets with disparate trafficking patterns 5 . Antigen-specific immune responses are initiated after the acquisi- tion of foreign molecules in the periphery by phagocytic APCs 6 . After alloantigen uptake, activated APCs undergo a shift in their expression of chemokine receptors and migrate to secondary lymphoid organs 7 . Entry into the spleen is considered nonspecific, whereas entry into the lymph node requires expression of the L-selectin CD62L and the chemokine receptor CCR7, which bind to peripheral node addressin and the chemokine CCL21, respectively, and allow extravasation across high endothelial venules (HEVs) 8 . Once in the secondary lymphoid organs, APCs present complexes of foreign peptide and major histocompatibility complex (MHC) molecules on their surfaces to alloantigen-specific CD4 + T cells, and signals arising from these interactions are key factors in the establishment of either immunity or tolerance. Central tolerance is established in the thymus by clonal deletion of potentially self-reactive T cells. In addition, CD4 + CD25 + Foxp3 + regulatory T cells (T reg cells) help to maintain peripheral tolerance by actively suppressing the activation and population expansion of self-reactive T cells 9 . In several transplantation models, T reg cells have been shown to be important in the induction and maintenance of tolerance to foreign molecules 10–13 , although little is known about the identity of alloantigen-presenting cells that promote their develop- ment into antigen-specific suppressor cells or the location in which this process occurs. Plasmacytoid dendritic cells (pDCs) may be important in the in vivo generation of antigen-specific T reg cells, as their precursors have been reported to prolong graft survival 14 . Along with other published observations 15,16 , those results suggest that interactions between pDCs and CD4 + T cells in the lymph node may be required for T reg cell development and indefinite graft survival. Here we performed fully allogeneic vascularized cardiac transplants and subjected recipient mice to a well characterized tolerogenic protocol that is dependent on T reg cell development 16,17 . Using the YAe monoclonal antibody (mAb), which recognizes a donor-derived I-E d peptide presented in the context of recipient MHC class II I-A b molecules, we identified pDCs as alloantigen-presenting cells that mediate tolerance to vascularized allografts. Alloantigen-presenting pDCs acquired and processed cell-derived transplantation antigens and, after tolerogenic treatment, migrated ‘preferentially’ to the lymph node, where they induced antigen-specific CD4 + CD25 + Foxp3 + T reg cell development. These data are consistent with published results that have established that during tolerance, antigen-specific T reg cells must develop in the lymph node 16 and provide direct evidence that pDCs can act as ‘professional’ tolerance-inducing alloantigen- presenting cells in vivo. Received 19 December 2005; accepted 10 March 2006; published online 23 April 2006; doi:10.1038/ni1333 1 Department of Gene and Cell Medicine, 2 Hematology Center, 3 Immunobiology Center and 4 Recanati/Miller Transplantation Institute, Mount Sinai School of Medicine, New York, New York 10029-6574, USA. 5 Department of Physiological Chemistry, Dresden University of Technology, Dresden, Germany. 6 Laboratory of Parasitic Diseases, National Institute of Allergy and Infectious Diseases, Bethesda, Maryland 20892-8003, USA. 7 Department of Surgery, Mount Sinai School of Medicine, New York, New York 10029-6574, USA. Correspondence should be addressed to J.C.O. ([email protected]) or J.S.B. ([email protected]). 652 VOLUME 7 NUMBER 6 JUNE 2006 NATURE IMMUNOLOGY ARTICLES © 2006 Nature Publishing Group http://www.nature.com/natureimmunology
-
Upload
independent -
Category
Documents
-
view
5 -
download
0
Transcript of Alloantigen-presenting plasmacytoid dendritic cells mediate tolerance to vascularized grafts
Alloantigen-presenting plasmacytoid dendritic cellsmediate tolerance to vascularized grafts
Jordi C Ochando1, Chiho Homma1, Yu Yang1, Andres Hidalgo2, Alexandre Garin3, Frank Tacke1,Veronique Angeli1, Yansui Li4, Peter Boros4, Yaozhong Ding1, Rolf Jessberger1,5, Giorgio Trinchieri6,Sergio A Lira4, Gwendalyn J Randolph1 & Jonathan S Bromberg1,4,7
The induction of alloantigen-specific unresponsiveness remains an elusive goal in organ transplantation. Here we identify
plasmacytoid dendritic cells (pDCs) as phagocytic antigen-presenting cells essential for tolerance to vascularized cardiac
allografts. Tolerizing pDCs acquired alloantigen in the allograft and then moved through the blood to home to peripheral lymph
nodes. In the lymph node, alloantigen-presenting pDCs induced the generation of CCR4+CD4+CD25+Foxp3+ regulatory T cells
(Treg cells). Depletion of pDCs or prevention of pDC lymph node homing inhibited peripheral Treg cell development and tolerance
induction, whereas adoptive transfer of tolerized pDCs induced Treg cell development and prolonged graft survival. Thus,
alloantigen-presenting pDCs home to the lymph nodes in tolerogenic conditions, where they mediate alloantigen-specific
Treg cell development and allograft tolerance.
The main unsolved goal in clinical transplantation is the establishmentof tolerance to transplant antigens. Although much has been learnedover the past decade about the various cell populations involved intransplant rejection1–4, the precise cell subpopulations involved in theinduction and maintenance of transplant tolerance remain unidenti-fied. That is due in part to the difficulty in defining the preciseinteractions between diverse antigen-presenting cells (APCs) andT cell subsets with disparate trafficking patterns5.
Antigen-specific immune responses are initiated after the acquisi-tion of foreign molecules in the periphery by phagocytic APCs6. Afteralloantigen uptake, activated APCs undergo a shift in their expressionof chemokine receptors and migrate to secondary lymphoid organs7.Entry into the spleen is considered nonspecific, whereas entry into thelymph node requires expression of the L-selectin CD62L and thechemokine receptor CCR7, which bind to peripheral node addressinand the chemokine CCL21, respectively, and allow extravasationacross high endothelial venules (HEVs)8. Once in the secondarylymphoid organs, APCs present complexes of foreign peptideand major histocompatibility complex (MHC) molecules on theirsurfaces to alloantigen-specific CD4+ T cells, and signals arising fromthese interactions are key factors in the establishment of eitherimmunity or tolerance.
Central tolerance is established in the thymus by clonal deletion ofpotentially self-reactive T cells. In addition, CD4+CD25+Foxp3+
regulatory T cells (Treg cells) help to maintain peripheral toleranceby actively suppressing the activation and population expansion of
self-reactive T cells9. In several transplantation models, Treg cells havebeen shown to be important in the induction and maintenance oftolerance to foreign molecules10–13, although little is known about theidentity of alloantigen-presenting cells that promote their develop-ment into antigen-specific suppressor cells or the location in whichthis process occurs. Plasmacytoid dendritic cells (pDCs) may beimportant in the in vivo generation of antigen-specific Treg cells, astheir precursors have been reported to prolong graft survival14. Alongwith other published observations15,16, those results suggest thatinteractions between pDCs and CD4+ T cells in the lymph nodemay be required for Treg cell development and indefinite graft survival.
Here we performed fully allogeneic vascularized cardiac transplantsand subjected recipient mice to a well characterized tolerogenicprotocol that is dependent on Treg cell development16,17. Using theYAe monoclonal antibody (mAb), which recognizes a donor-derivedI-Ed peptide presented in the context of recipient MHC class II I-Ab
molecules, we identified pDCs as alloantigen-presenting cells thatmediate tolerance to vascularized allografts. Alloantigen-presentingpDCs acquired and processed cell-derived transplantation antigensand, after tolerogenic treatment, migrated ‘preferentially’ to the lymphnode, where they induced antigen-specific CD4+CD25+Foxp3+ Treg
cell development. These data are consistent with published results thathave established that during tolerance, antigen-specific Treg cellsmust develop in the lymph node16 and provide direct evidencethat pDCs can act as ‘professional’ tolerance-inducing alloantigen-presenting cells in vivo.
Received 19 December 2005; accepted 10 March 2006; published online 23 April 2006; doi:10.1038/ni1333
1Department of Gene and Cell Medicine, 2Hematology Center, 3Immunobiology Center and 4Recanati/Miller Transplantation Institute, Mount Sinai School of Medicine,New York, New York 10029-6574, USA. 5Department of Physiological Chemistry, Dresden University of Technology, Dresden, Germany. 6Laboratory of Parasitic Diseases,National Institute of Allergy and Infectious Diseases, Bethesda, Maryland 20892-8003, USA. 7Department of Surgery, Mount Sinai School of Medicine, New York,New York 10029-6574, USA. Correspondence should be addressed to J.C.O. ([email protected]) or J.S.B. ([email protected]).
652 VOLUME 7 NUMBER 6 JUNE 2006 NATURE IMMUNOLOGY
A R T I C L E S©
2006
Nat
ure
Pub
lishi
ng G
roup
ht
tp://
ww
w.n
atur
e.co
m/n
atur
eim
mun
olog
y
RESULTS
pDCs acquire alloantigen in donor grafts
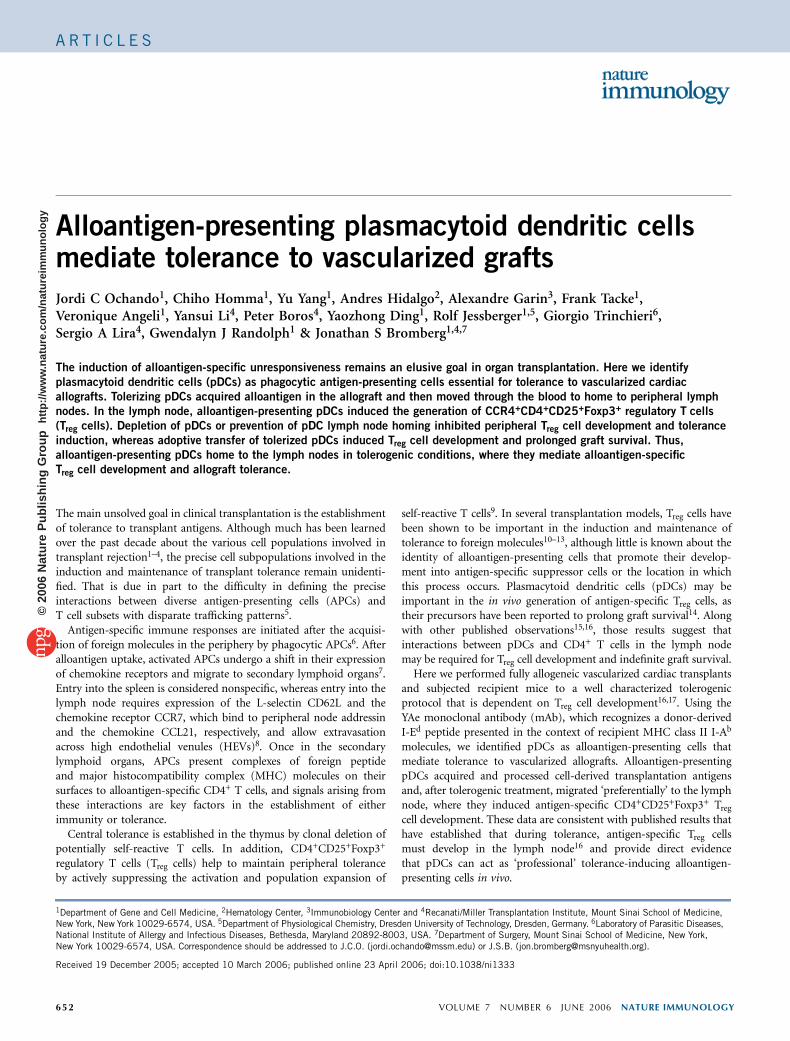
To investigate whether a particular DC subtype is involved inalloantigen uptake and processing in allografts during tolerance, wecharacterized intracardiac alloantigen-presenting cells between 1 and10 weeks after vascular cardiac transplantation. The YAe mAb recog-nizes donor-derived I-Ed peptide presented by recipient I-Ab (ref. 18).Two-color immunohistochemical analysis showed that intragraft YAe+
cells from tolerized recipient mice expressed CD11c, B220, the markerGr-1 and pDC marker PDCA-1 but not CD19 (Fig. 1a). This surfacephenotype is characteristic of mouse pDCs19. Using six-color flow
cytometry, we confirmed that YAe+ cells in both tolerized grafts(Fig. 1b) and rejecting grafts (data not shown) were pDCs. Thesedata indicate that pDCs acquire and process alloantigen in vivo. Thisresult was unexpected, as no reports indicate that pDCs, which arepoorly endocytic20, can internalize cells, a process that would probablyinvolve phagocytosis.
To assess the phagocytic capacity of pDCs, we cultured pDCstogether with fluorescein isothiocyanate (FITC)–labeled latex particles(beads) and monitored engulfment. We used naive splenic B cells andperitoneal macrophages as negative and positive controls, respectively.Immunofluorescence images (Fig. 1c) showed that both pDCs and
a b
c d
YAe
YAe
CD11c
B220
Gr-1
PDCA-1
CD19
MGG
MΦ
MΦ
(F
4/80
)pD
C (
PD
CA
-1)
B c
ell (
B22
0)
pDC
B c
ell
Phase FITC-beadsFITC-beads FITC-beads PE-Cy7 anti-FITC
% o
f max
.%
of m
ax.
% o
f max
.
PE
-Cy7
ant
i-FIT
CP
E-C
y7 a
nti-F
ITC
PE
-Cy7
ant
i-FIT
C
Merged
CD11c
94
5
97
2
96
3
98
1
6
93
91 91 Isotype
Isotype
Isotype
8
11
88
46
53
7
0
7 86
3
15 83
0
101
101
102
102
103
103
104
104
105
105
101
101
102
102
103
103
104
104
105
105 101
100
80
60
40
20
0
100
80
60
40
20
0
100
80
60
40
20
0
102 103 104 105
101
101
102
102
103
103
104
104
105
105
101
101
102
102
103
103
104
104
105
105 101 102 103 104 105
101
101
102
102
103
103
104
104
105
105
101
101
102
102
103
103
104
104
105
105 101 102 103 104 105
B220
Gr-1
PDCA-1
CD19
Merged
Figure 1 Phagocytic pDCs cells take up and process antigen in donor cardiac allografts. Fully mismatched vascularized BALB/c (H-2d) cardiac allografts were
transplanted into C57BL/6 (H-2b) mice. Recipients were injected intravenously with 1 � 107 donor splenocytes on day –7 and 250 mg mAb to CD40L on
days –7, –4, 0 and +4 (times relative to transplantation). Untreated rejecting control mice received hamster immunoglobulin in PBS and rejected their grafts
within 1 week (n ¼ 6 mice per group). (a,b) Two-color microscopy (a; staining of first column indicated along left margin) or six-color flow cytometry gated
on YAe cells (b) of tolerized (1-, 5- and 10-week) and rejecting (1-week) cardiac allografts. Data are representative results from ‘10-week tolerized’ mice.
Original magnification, �250. (c,d) In vitro pDC phagocytic assay of the uptake of 1-mm FITC-labeled latex beads (FITC-beads) over 12 h of culture. (c) May-Grunwald Giemsa staining and live fluorescent images of splenic B cells, splenic pDCs and peritoneal macrophages (Mf). Original magnification, �1,000.
Data are representative results of ten images. (d) Flow cytometry of phagocytic B cells, pDCs and macrophages. Gated FITC-labeled beads were stained with
phycoerythrin-indotricarbocyanine-labeled (PE-Cy7) anti-FITC or the isotype control mAb. All experiments were done at least three times. Numbers in
quadrants (b,d) indicate percentage of cells positive for markers along margins.
NATURE IMMUNOLOGY VOLUME 7 NUMBER 6 JUNE 2006 653
A R T I C L E S©
2006
Nat
ure
Pub
lishi
ng G
roup
ht
tp://
ww
w.n
atur
e.co
m/n
atur
eim
mun
olog
y
macrophages acquired FITC-labeled beads, as demonstrated byfluorescent localization of FITC-coated beads in the cells. Incontrast, FITC-labeled beads were bound only to the external cellmembranes of B cells. We further confirmed the phagocytic capacity ofpDCs by flow cytometry with a FITC-specific mAb (Fig. 1d), whichshowed that 88% of FITC+ cultured pDCs and 53% of FITC+
macrophages, but only 8% of FITC+ B cells, stained negative for cellsurface FITC.
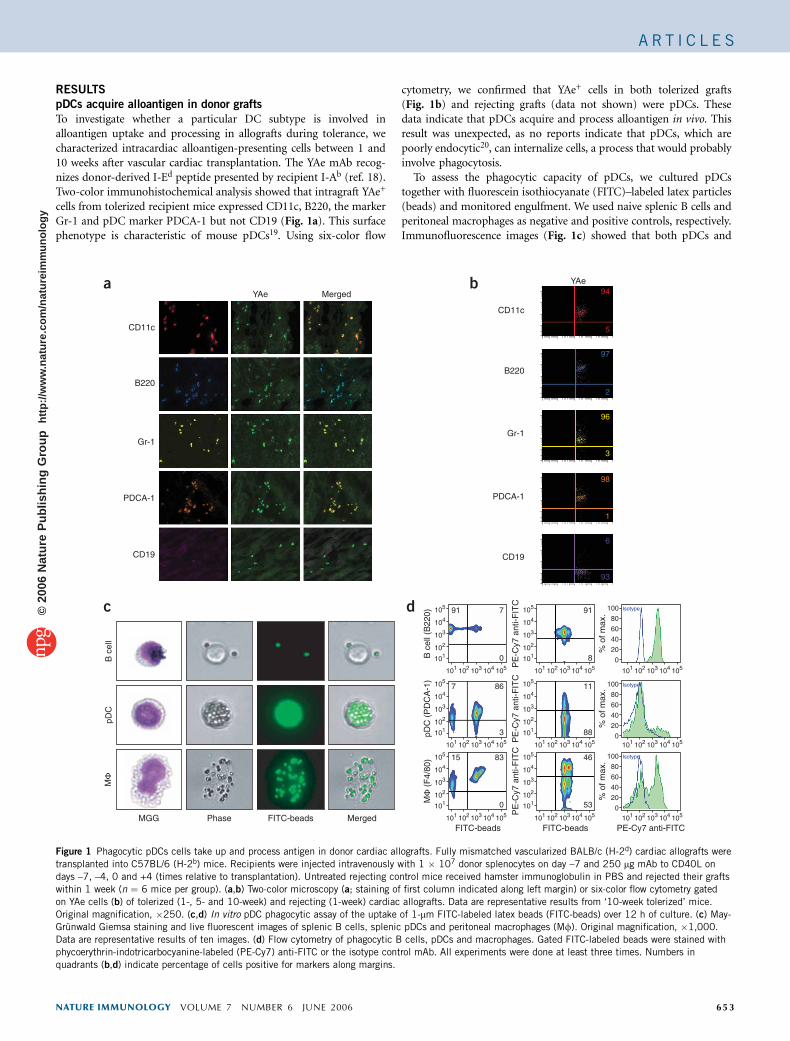
Alloantigen-presenting pDCs circulate in blood
To determine if alloantigen uptake and processing by pDCs results insubsequent maturation and egress from the allograft to lymphoidorgans, we determined whether YAe+ cells were present in bloodand/or lymph (Fig. 2a). YAe+ cells from tolerized recipient mice werepresent in blood but not in efferent lymph, suggesting that the mainroute for egress from the allograft is direct re-entry into blood. Tofurther characterize blood-circulating YAe+ cells, we used Wright-Giemsa staining of cytospin-sorted DC preparations. Freshly isolatedblood pDCs (CD11c+PDCA-1+) were rounded cells with a smoothsurface and large nuclei, whereas blood alloantigen-presentingplasmacytoid cells (YAe+PDCA-1+) had slightly indented nucleiand had pseudopods, and splenic myeloid DCs (mDCs)(CD11c+CD11b+B220–) contained more lobulated nuclei anddemonstrated classical stellate morphology (Fig. 2b). More detailed
examination of the YAe+PDCA-1+ population showed that alloanti-gen-presenting cells had high expression of mRNA encoding inter-feron-a and Toll-like receptors 3, 7 and 9 (Supplementary Figure 1online), consistent with a mature pDC lineage.
We next defined the phenotype of the blood YAe+ cells by flowcytometry (Fig. 2c) and found that more than 90% of YAe+ blood cellswere PDCA-1+, confirming their plasmacytoid phenotype. Detailedcell surface phenotypic analysis of YAe+ PDCA-1+ cells (Fig. 2d)showed that these pDCs had low expression of CD11c, high expressionof Gr-1 and intermediate expression of B220 and lacked expression ofCD19 and CD11b. More detailed examination of costimulatorymolecule expression showed that YAe+PDCA-1+ cells had very lowexpression of CD80 and CD86 but high expression of MHC class II(Fig. 2d), indicative of a partially mature phenotype. Furthermore,YAe+PDCA-1+ cells had high expression of the phagocytic receptorCD206, consistent with the observation that pDCs acquired andprocessed allopeptides in the allograft. Further analysis of the pheno-type of YAe+PDCA-1+ cells demonstrated large amounts of theadhesion molecules LFA-1, ICAM-1, VLA-4 and CD62L (Fig. 2d)and the lymph node–homing chemokine receptors CCR7, ChemR23and CCR2 (Fig. 2e) in tolerized recipient mice. These findingscollectively suggest that alloantigen-presenting pDCs migrate ‘prefer-entially’ to the lymph nodes in tolerized recipient mice but migrate toother lymphoid organs during rejection.
a
d
b
c
e
Tolerized
7.87 3.11 0.77
0.63
101102103104105
102 104 102 104 102 104 102 104 102 104 102 104
4 *
*
**
* *3
2
1
0CCR2
Tolerized Rejecting Naive
CCR7 ChemR23
102 104 102 104 102 104 102 104 102 104 102 104
102 104 102 104 102 104 102 104 102 104 102 104
101102103104105 101102103104105
101
4,000
3,000
2,000
1,000
0
4,000
3,000
2,000
1,000
0
4,000
3,000
2,000
1,000
0
4,000
3,000
2,000
1,000
0
4,000
3,000
2,000
1,000
0
4,000
3,000
2,000
1,000
0
102103104105 101102103104105 101102103104105
101101
102
102
103
103
104
104
105
105
101
102
103
104
105
101 102 103 104 105
0.78 0.71
Blo
odLy
mph
% o
f max
.%
of m
ax.
% o
f max
.
YAe
SS
C
CD11c CD11b B220 Gr-1 CD19 CD4
CD80 CD86 CD40 MHC-II DEC-205 CD206
Exp
ress
ion
(rel
ativ
e un
its ×
103 )
LFA-1 ICAM-1 VLA-2 VLA-4 α4β7 CD62L
Rejecting Naive Naive pDC Naive mDC YAe+ pDC
Tolerized0.5% 0.8%4.4%
0.1%
0.1%
0.1%
Naive
Blood
YAe
Blo
od
PD
CA
-1
Tolerized Rejecting Naive
Figure 2 Alloantigen-presenting pDCs circulate systemically through blood. (a) Percentage of total alloantigen-presenting YAe+ cells recovered from blood
and lymph of tolerized mice (1-, 5- and 10-week), rejecting mice (1-week) and naive mice. Data are representative results of three independent experiments
from ‘10-week tolerized’ mice (n ¼ 3 mice per group). (b) May-Grunwald Giemsa staining (representative of two independent experiments) showing the
morphology of freshly sorted blood naive pDCs (PDCA-1+CD11c+B220+), splenic naive mDCs (CD11c+CD11b+B220–) and ‘10-week tolerized’ blood
circulating YAe+PDCA-1+ pDCs. Original magnification, �1,000; n ¼ 3 mice per group. (c) Flow cytometry of blood cells from tolerized mice (1- and
10-week). Representative results of three independent experiments from ‘10-week tolerized’ mice show that more than 90% of YAe+ cells express PDCA-1
(n ¼ 3). (d) Flow cytometry of the expression of cell surface molecules on freshly isolated blood YAe+PDCA-1+ cells from tolerized mice (1- and 10-week)and rejecting mice (1-week) compared with that of PDCA-1+ cells from naive mice. MHC-II, MHC class II. Data are representative results of three
independent experiments from ‘10-week tolerized’ mice (n ¼ 3 mice per group). (e) Real-time PCR analysis of chemokine receptor expression on blood
circulating YAe+PDCA-1+ cells from ‘10-week tolerized’ and ‘1-week rejecting’ mice compared with that of naive pDCs. *, P o 0.01 (one-way ANOVA). Data
are from two independent experiments; n ¼ 3 mice per group.
654 VOLUME 7 NUMBER 6 JUNE 2006 NATURE IMMUNOLOGY
A R T I C L E S©
2006
Nat
ure
Pub
lishi
ng G
roup
ht
tp://
ww
w.n
atur
e.co
m/n
atur
eim
mun
olog
y
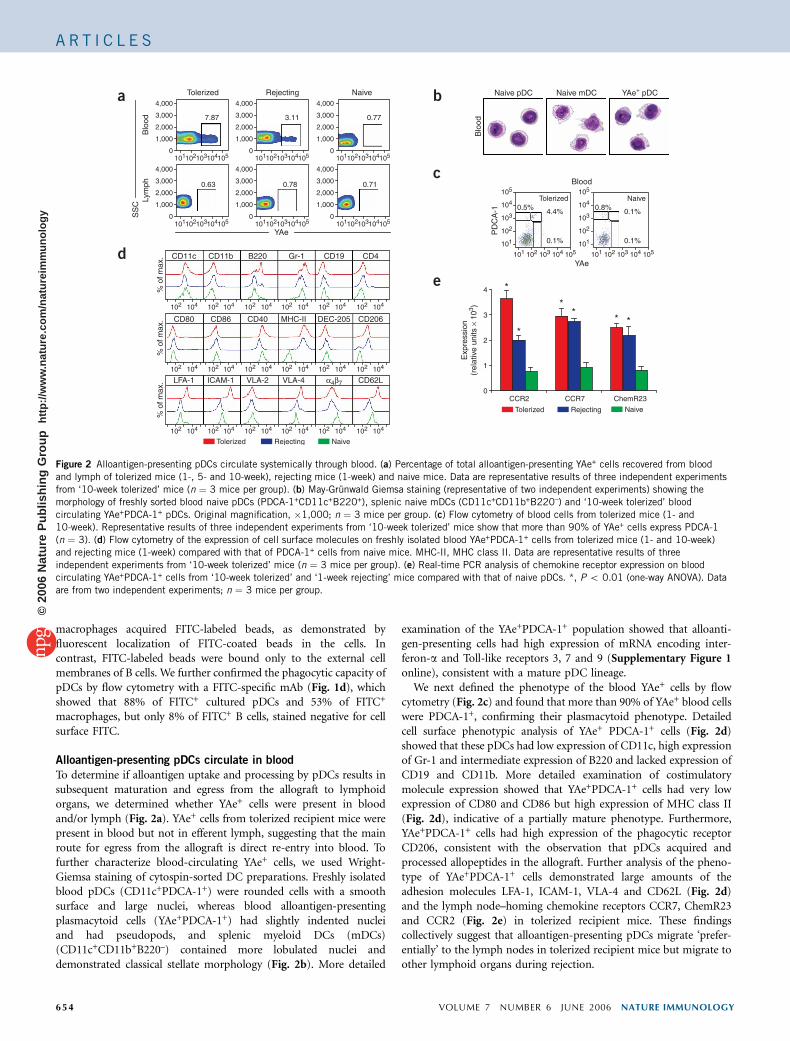
pDCs migrate to lymph node during tolerance
We next used laser-capture microdissection of lymph node sectionsfrom tolerized mice to characterize the function of HEVs in YAe+ pDClymph node homing. CCR2 and CCR7 ligands CCL2, CCL7 andCCL21 were upregulated in HEVs during tolerization (Fig. 3a), whichmay favor lymph node extravasation of CCR2+CCR7+YAe+ pDCs. AsCCL21 produced by HEVs mediates rapid binding of integrin toCD62L ligands21, which can be induced during inflammation22, wealso investigated whether CD62L ligands were upregulated on HEVsduring tolerization. Using a CD62L fusion protein (Fig. 3b), we foundupregulation of CD62L ligands on HEVs in tolerized mice, whichfavors the adhesion of CD62L+ cells to the endothelial barrier.MAdCAM1 is one of the CD62L ligands specifically synthesizedby HEVs23 that was upregulated during tolerization (SupplementaryFig. 2 online). To further determine the functional importance ofCD62L and CD62L ligand upregulation on circulating YAe+ pDCsand HEVs from tolerized mice, we did a modified in vitro HEV-binding assay24 (Fig. 3c). Blood-derived YAe+ pDCs from tolerized
mice bound four to five times more effectively than did YAe+ pDCsfrom rejecting mice to the same HEVs, consistent with the upregula-tion of CD62L on YAe+ pDCs from tolerized but not rejecting mice.We next monitored the in vivo localization of alloantigen-presentingYAe+ cells in the lymph node and spleen. In tolerized mice, YAe+ cellswere distributed systemically throughout the lymphoid compartment(inguinal, axillary, cervical, paraortic and hepatic lymph nodes) yetwere almost completely absent from the spleen (Fig. 3d). In contrast,YAe+ cells were localized mainly in the spleens of rejecting miceand were almost completely absent from the lymph node. Furtherphenotypic analysis of YAe+ cells in secondary lymphoid organs(Fig. 3e) indicated that more than 90% were pDCs during bothrejection and tolerization.
Localization of pDCs and Treg cells together
We next characterized the specific localization of YAe+ cells in thelymph node. During tolerization, YAe+ cells localized specifically inthe vicinity of HEVs and T cell zones outside the follicles and germinal
a
c
d e
b
Before
Exp
ress
ion
(rel
ativ
e un
its ×
103 )
150
Exp
ress
ion
(rel
ativ
e un
its)
100
50
0
0
5
10
15
20
Tolerized
Tolerized HEV Rejecting HEV Naive HEV EDTA control
1868±233 834±153 870±126
Rejecting
Tolerized
Tole
rized
Tolerized YAe+ pDCTolerized HEV Rejecting YAe+ pDC
Rejecting
Rej
ectin
g
YAe
Inguinal LN Axillary LN Cervical LN
Paraortic LN Hepatic LN Spleen
Inguinal LN Axillary LN Cervical LN
Paraortic LN Hepatic LN Spleen
YAe
1.6% 0.8%
0.4%
0.9% 5.0%
0.7%
1.1% 9.1%
0.3%
0.1% 0.7%
0.5%
PD
CA
-1P
DC
A-1
YAe
9±2 2±1
Merged
Naive
10
Rejecting
Tolerized
Naive
86420
10
*
**86420
10
N T
YAe+ pDCYA
e+ p
DC
bou
nd/H
EV
HEV
R
86420
After
Cap
CCL2
**
*
CCL7
CCL19 CCL21
101
102
103
104
105
101101
102
102
103
103
104
104
105 101 102 103 104 105
105
Figure 3 YAe+ cells home to lymph nodes during tolerance and to the spleen during rejection. (a) Right, real-time PCR analysis of chemokine expression in
HEVs isolated from ‘10-week tolerized’, ‘1-week rejecting’ and naive mice by laser-capture microdissection. Left, hematoxylin and eosin staining before (top)
and after (middle) excision of tissue by laser-capture microdissection. Cap (bottom), excised tissue. Original magnification, �100. *, P o 0.01 (one-way
ANOVA); n ¼ 3 mice per group. (b) Immunofluorescent analysis of CD62L ligands expressed on HEVs of tolerized mice (1-, 5- and 10-week), rejecting
mice (1-week) and naive mice. Numbers in images indicate mean fluorescence intensity (determined over entire field). Data are representative results
from ‘10-week tolerized’ and ‘1-week rejecting’ mice (n ¼ 3 mice per group). (c) Left, representative staining of Stamper-Woodruff assay of the binding
of YAe+PDCA-1+ cells from ‘10-week tolerized’ mice (red) and ‘1-week rejecting’ mice (blue) to the same ‘10-week tolerized’ lymph node tissue section.
Numbers in images indicate number of cells bound to HEV. Original magnification, �250. Right, quantitative analysis of the Stamper-Woodruff assay,
determined from ten lymph node sections per slide. N, naive; T, tolerized; R, rejecting. **, P o 0.01, and *, P o 0.05 (one-way ANOVA). (d) Immuno-
fluorescent analysis of YAe+ distribution in secondary lymphoid organs in tolerized mice (1-, 5- and 10-week) and rejecting mice (1-week). Data are repre-
sentative results from ‘10-week tolerized’ mice. Original magnification, �100. (e) Flow cytometry of lymph node and splenic alloantigen-presenting cells
from ‘10-week tolerized’ and ‘1-week rejecting’ mice. Numbers beside outlined areas indicate percentage of cells in each. Data are representative results
from ‘10-week tolerized’ mice. All experiments were done three times.
NATURE IMMUNOLOGY VOLUME 7 NUMBER 6 JUNE 2006 655
A R T I C L E S©
2006
Nat
ure
Pub
lishi
ng G
roup
ht
tp://
ww
w.n
atur
e.co
m/n
atur
eim
mun
olog
y
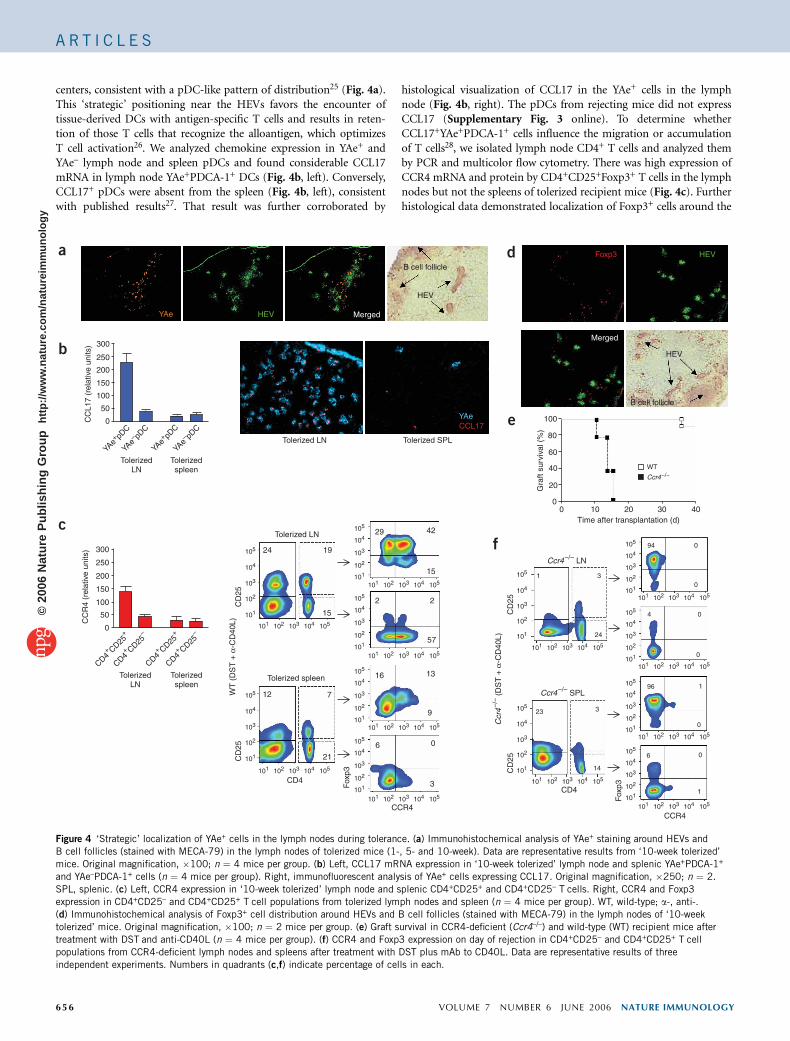
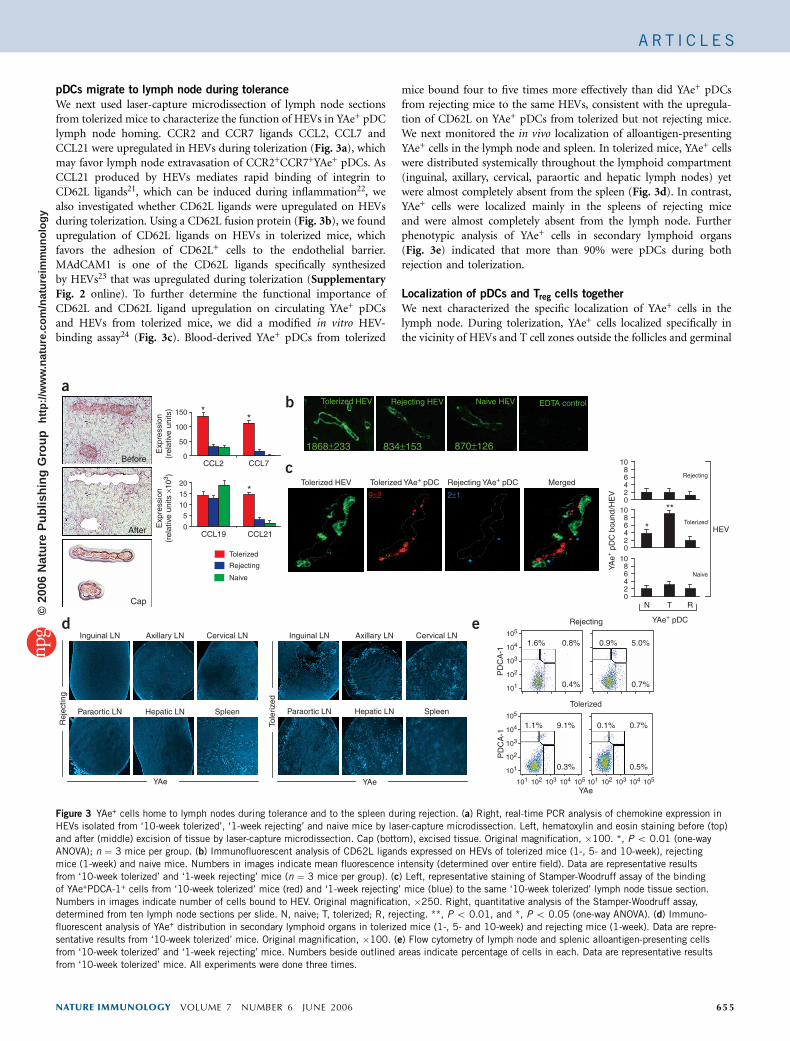
centers, consistent with a pDC-like pattern of distribution25 (Fig. 4a).This ‘strategic’ positioning near the HEVs favors the encounter oftissue-derived DCs with antigen-specific T cells and results in reten-tion of those T cells that recognize the alloantigen, which optimizesT cell activation26. We analyzed chemokine expression in YAe+ andYAe– lymph node and spleen pDCs and found considerable CCL17mRNA in lymph node YAe+PDCA-1+ DCs (Fig. 4b, left). Conversely,CCL17+ pDCs were absent from the spleen (Fig. 4b, left), consistentwith published results27. That result was further corroborated by
histological visualization of CCL17 in the YAe+ cells in the lymphnode (Fig. 4b, right). The pDCs from rejecting mice did not expressCCL17 (Supplementary Fig. 3 online). To determine whetherCCL17+YAe+PDCA-1+ cells influence the migration or accumulationof T cells28, we isolated lymph node CD4+ T cells and analyzed themby PCR and multicolor flow cytometry. There was high expression ofCCR4 mRNA and protein by CD4+CD25+Foxp3+ T cells in the lymphnodes but not the spleens of tolerized recipient mice (Fig. 4c). Furtherhistological data demonstrated localization of Foxp3+ cells around the
105
105
104
104
103
103
102
102
101
105104103102101
105104103102101
105104103102101
105104103102101
105104103102101
105104103102101
105104103102101
105104103102101
105104103102101
105104103102101
105104103102101
101
105
104
103
102
101
105
104
103
102
101
105
104
103
102
101
105
104
103
102
101
105
104
103
102
101 105
104
103
102
101
105
104
103
102
101
105
104
103
102
101
105
104
103
102
101
105
104
103
102
101
105
104
103
102
101
6 0
1
14
323
0
196
0
04
0
094
24
31
CD4CD4
CD
25C
D25
CCR4CCR4
CD
25C
D25
Fox
p3Fox
p3
Ccr4–/– SPL
Ccr4–/– LN
Ccr4
–/– (
DS
T +
α-C
D40
L)
WT
(D
ST
+ α
-CD
40L)
3
06
9
1316
57
22
15
4229
21
712
15
24 19
Tolerized spleen
Tolerized LN
4030201000
Time after transplantation (d)
20
40
60
80
100
Gra
ft su
rviv
al (
%)
WT
Ccr4–/–
B cell follicle
HEV
Merged
HEVFoxp3
YAe HEV Merged
B cell follicle
HEV
Tolerized LN Tolerized SPL
YAeCCL17
300
250
200
150
100
50
0CC
L17
(rel
ativ
e un
its)
CC
R4
(rel
ativ
e un
its)
YAe+ pD
C
YAe+ pD
C
YAe– pD
C
YAe– pD
C
TolerizedLN
Tolerizedspleen
TolerizedLN
Tolerizedspleen
300
250
200
150
100
50
0
CD4+ CD25
+
CD4+ CD25
+
CD4+ CD25
–
CD4+ CD25
–
a d
e
f
b
c
Figure 4 ‘Strategic’ localization of YAe+ cells in the lymph nodes during tolerance. (a) Immunohistochemical analysis of YAe+ staining around HEVs and
B cell follicles (stained with MECA-79) in the lymph nodes of tolerized mice (1-, 5- and 10-week). Data are representative results from ‘10-week tolerized’
mice. Original magnification, �100; n ¼ 4 mice per group. (b) Left, CCL17 mRNA expression in ‘10-week tolerized’ lymph node and splenic YAe+PDCA-1+
and YAe–PDCA-1+ cells (n ¼ 4 mice per group). Right, immunofluorescent analysis of YAe+ cells expressing CCL17. Original magnification, �250; n ¼ 2.
SPL, splenic. (c) Left, CCR4 expression in ‘10-week tolerized’ lymph node and splenic CD4+CD25+ and CD4+CD25– T cells. Right, CCR4 and Foxp3
expression in CD4+CD25– and CD4+CD25+ T cell populations from tolerized lymph nodes and spleen (n ¼ 4 mice per group). WT, wild-type; a-, anti-.(d) Immunohistochemical analysis of Foxp3+ cell distribution around HEVs and B cell follicles (stained with MECA-79) in the lymph nodes of ‘10-week
tolerized’ mice. Original magnification, �100; n ¼ 2 mice per group. (e) Graft survival in CCR4-deficient (Ccr4–/–) and wild-type (WT) recipient mice after
treatment with DST and anti-CD40L (n ¼ 4 mice per group). (f) CCR4 and Foxp3 expression on day of rejection in CD4+CD25– and CD4+CD25+ T cell
populations from CCR4-deficient lymph nodes and spleens after treatment with DST plus mAb to CD40L. Data are representative results of three
independent experiments. Numbers in quadrants (c,f) indicate percentage of cells in each.
656 VOLUME 7 NUMBER 6 JUNE 2006 NATURE IMMUNOLOGY
A R T I C L E S©
2006
Nat
ure
Pub
lishi
ng G
roup
ht
tp://
ww
w.n
atur
e.co
m/n
atur
eim
mun
olog
y
105104103102101
105
105
104
104
103
103
102
102
101
105104103102101105104103102101
105104103102101
105104103102101
105104103102101
105
105
104
104
103
103
102
102
101
101
105104103102101
105104103102101
105104103102101
105104103102101
105104103102101
105104103102101
105104103102101
105104103102101
105104103102101
101
105
104
103
102
101
105
104
103
102
101
105
104
103
102
101
105
104
103
102
101
105
104
103
102
101
105
104
103
102
101
105
104
103
102
101
105
104
103
102
101
105104103102101105104103102101105104103102101
105104103102101
105
105
104
104
103
103
102
102
101101
105104103102101 105
105
104
104
103
103
102
102
101101
105
104
103
102
101
105
104
103
102
101
105
104
103
102
101
105104103102101
105104103102101 105104103102101 105104103102101
105104103102101 105104103102101 105104103102101
100
80
60
40
20
0
100
80
60
40
20
0
100
80
60
40
20
0
100
80
60
40
20
0
100
80
60
40
20
0
100
80
60
40
20
0
LNLNLNLN
7%
30%
12.1%α-TGF-β
CD4+CD25+
(CD4+CD25–)
CD4+CD25–
CD4+CD25+
CD4+CD25–CD4+CD25+
7.2%
Foxp3
Fox
p3
CD4YAe
SS
C
% o
f max
.
% o
f max
.
Foxp3Isotype
SPLSPLSPL5.5%0.5%
+Sorted
CD4+CD25–
SortedCD4+CD25–
CD4
CD
25
98%
1.1% Graft Graft Graft2.9% 2.9%
BloodBloodBlood
Tolerized YAe
6.7%5.6%
Splenic naiveCD4+ TEa
Cultured YAe+ + CD4+ TEa cells
C57BL/6Stimulators
Responders C57BL/6 C57BL/6 C57BL/6
BALB/c BALB/c CBA
+ +Cultured
CD4+CD25+Cultured
0
2
4
6
8
10
[3H
]TdR
upt
ake
(SI)
CCR4
CD4
CD
25
CD
25
Blood
Graft
SPL SPL
LN
LNLN
22%LNLN
SPLSPL
GraftGraft
BloodBlood
75%25%
75%25%
85%15%
2%98%
0
1,000
2,000
3,000
4,000
0
1,000
2,000
3,000
4,000
0
1,000
2,000
3,000
4,000
0
1,000
2,000
3,000
4,000
0
1,000
2,000
3,000
4,000
0
1,000
2,000
3,000
4,000
0
1,000
2,000
3,000
4,000
0
1,000
2,000
3,000
4,000
SS
C
CFSECFSE
CD
25 1.3%
97%
Splenic naiveCD4+ TEa
CD4
100
80
60
40
20
0
% o
f max
.
Foxp3Isotype
4,000
3,000
2,000
1,000
0
SS
C
1.3% 98%
72 h
72 h
72 h
72 h
YAe CFSE TEa Foxp3
YAe CFSE TEa Foxp3
a b
dc
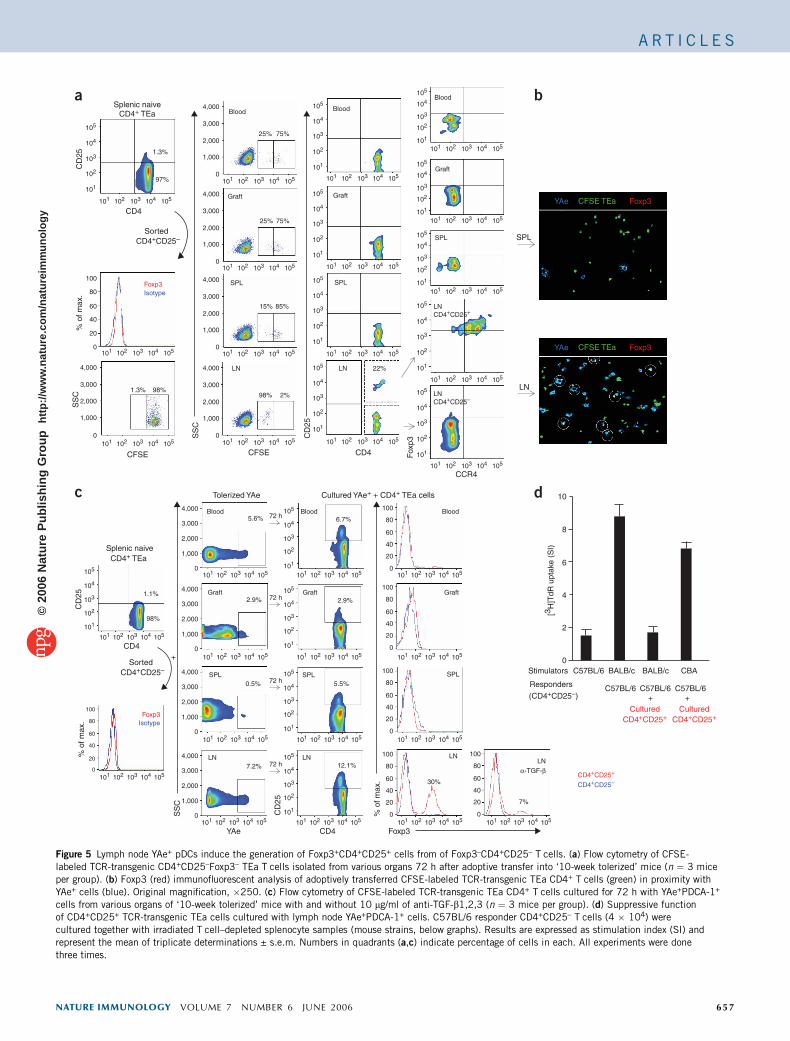
Figure 5 Lymph node YAe+ pDCs induce the generation of Foxp3+CD4+CD25+ cells from of Foxp3–CD4+CD25– T cells. (a) Flow cytometry of CFSE-
labeled TCR-transgenic CD4+CD25–Foxp3– TEa T cells isolated from various organs 72 h after adoptive transfer into ‘10-week tolerized’ mice (n ¼ 3 mice
per group). (b) Foxp3 (red) immunofluorescent analysis of adoptively transferred CFSE-labeled TCR-transgenic TEa CD4+ T cells (green) in proximity with
YAe+ cells (blue). Original magnification, �250. (c) Flow cytometry of CFSE-labeled TCR-transgenic TEa CD4+ T cells cultured for 72 h with YAe+PDCA-1+
cells from various organs of ‘10-week tolerized’ mice with and without 10 mg/ml of anti-TGF-b1,2,3 (n ¼ 3 mice per group). (d) Suppressive function
of CD4+CD25+ TCR-transgenic TEa cells cultured with lymph node YAe+PDCA-1+ cells. C57BL/6 responder CD4+CD25– T cells (4 � 104) were
cultured together with irradiated T cell–depleted splenocyte samples (mouse strains, below graphs). Results are expressed as stimulation index (SI) and
represent the mean of triplicate determinations ± s.e.m. Numbers in quadrants (a,c) indicate percentage of cells in each. All experiments were done
three times.
NATURE IMMUNOLOGY VOLUME 7 NUMBER 6 JUNE 2006 657
A R T I C L E S©
2006
Nat
ure
Pub
lishi
ng G
roup
ht
tp://
ww
w.n
atur
e.co
m/n
atur
eim
mun
olog
y
HEVs, adjacent to the B cell follicles (Fig. 4d), similar to that ofYAe+ cells (Fig. 4a), which suggested that interactions betweenCCL17+ YAe+ and CCR4+CD4+ T cells in the lymph nodes of tolerizedmice might influence Treg cell development. To further investigate theimportance of CCR4-dependent interactions during transplantation,we transplanted cardiac allografts into CCR4-deficient mice andfound that Treg cells did not develop and rejection occurred despiteadministration of the tolerogenic regimen (Fig. 4e,f).
pDCs induce Treg cell development in lymph nodes
To determine whether alloantigen-presenting pDCs mediate toleranceby inducing Treg cell development in the lymph node, we monitoredexpression of the transcription factor Foxp3 in T cell receptor (TCR)–transgenic CD4+CD25–Foxp3– TEa T cells. We isolated TEa T cells,which recognize the same I-Ed–I-Ab complex of peptide and MHC asthe YAe mAb, labeled the cells with carboxyfluoroscein succinimidylester (CFSE) and transferred them into tolerized mice. At 72 h afteradoptive transfer, 98% of TEa cells in the lymph nodes had prolifer-ated, in contrast to 15% in the spleen, 25% in the allograft and 25% inblood (Fig. 5a). Monitoring of CD25 expression showed that 20–30%of the lymph node TEa cells became CD25+ and FoxP3+, whereasspleen, graft and blood TEa T cells remained CD25–. Because Foxp3+
cells also expressed CCR4 (Fig. 4c), we monitored these markers andfound that only the CD25+ TEa cells had high expression of bothFoxp3 and CCR4 (Fig. 5a). Those results were further confirmed byfluorescent immunohistochemistry, which showed that CFSE-labeledTEa cells expressing Foxp3 in the lymph nodes of tolerized mice werelocalized together in proximity to YAe+ cells (Fig. 5b). To furtherdetermine the unique function of lymph node alloantigen-presentingpDCs during Treg cell development, we cultured CD4+CD25–Foxp3–
naive TEa cells with YAe+PDCA-1+ cells from lymph node, spleen,blood or allograft. YAe+ cells from each anatomic compartment wereable to induce CD25 expression in CD4+ T cells (Fig. 5c). However,
only the YAe+PDCA-1+ cells isolated from tolerized lymph nodes wereable to induce Foxp3 expression in CD4+CD25+ T cells, and thisFoxp3 induction occurred in a transforming growth factor-b(TGF-b)–dependent way (Fig. 5c). CD4+CD25+Foxp3+ Treg cellsgenerated from antigen-specific CD4+CD25–Foxp3–TEa cells sup-pressed the in vitro population expansion of CD4+CD25– responderT cells in an alloantigen-specific way (Fig. 5d), demonstrating theirspecific regulatory nature.
pDCs in the lymph node are necessary for tolerance
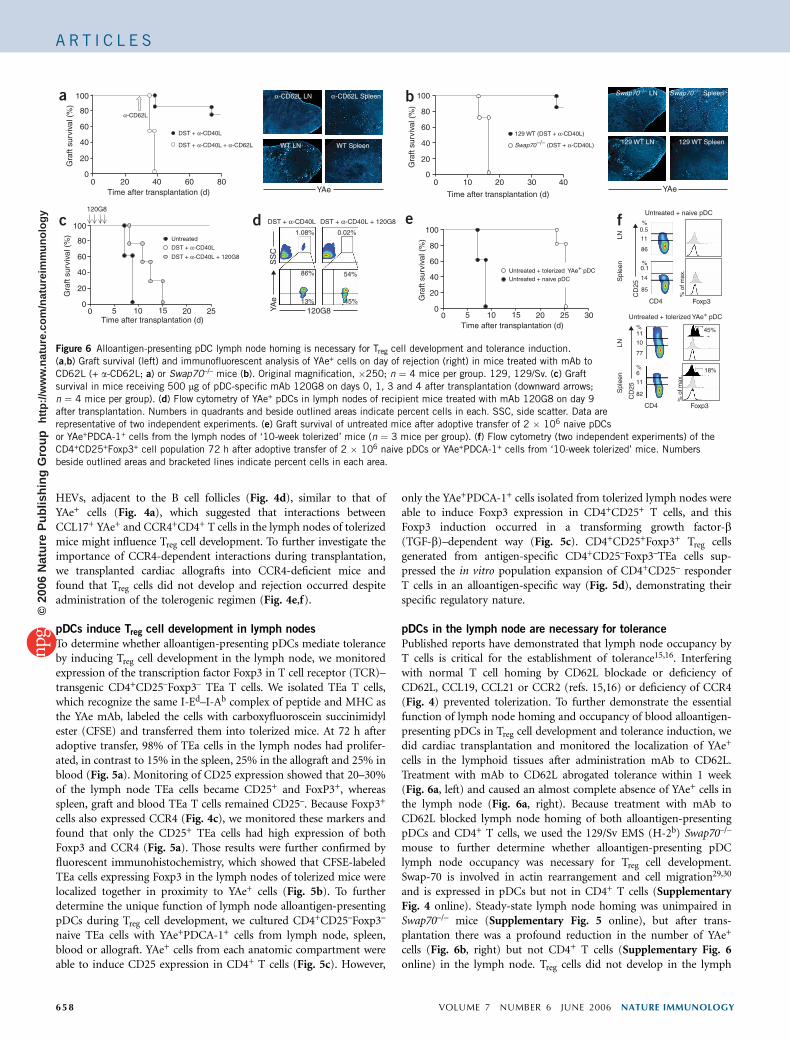
Published reports have demonstrated that lymph node occupancy byT cells is critical for the establishment of tolerance15,16. Interferingwith normal T cell homing by CD62L blockade or deficiency ofCD62L, CCL19, CCL21 or CCR2 (refs. 15,16) or deficiency of CCR4(Fig. 4) prevented tolerization. To further demonstrate the essentialfunction of lymph node homing and occupancy of blood alloantigen-presenting pDCs in Treg cell development and tolerance induction, wedid cardiac transplantation and monitored the localization of YAe+
cells in the lymphoid tissues after administration mAb to CD62L.Treatment with mAb to CD62L abrogated tolerance within 1 week(Fig. 6a, left) and caused an almost complete absence of YAe+ cells inthe lymph node (Fig. 6a, right). Because treatment with mAb toCD62L blocked lymph node homing of both alloantigen-presentingpDCs and CD4+ T cells, we used the 129/Sv EMS (H-2b) Swap70–/–
mouse to further determine whether alloantigen-presenting pDClymph node occupancy was necessary for Treg cell development.Swap-70 is involved in actin rearrangement and cell migration29,30
and is expressed in pDCs but not in CD4+ T cells (SupplementaryFig. 4 online). Steady-state lymph node homing was unimpaired inSwap70–/– mice (Supplementary Fig. 5 online), but after trans-plantation there was a profound reduction in the number of YAe+
cells (Fig. 6b, right) but not CD4+ T cells (Supplementary Fig. 6online) in the lymph node. Treg cells did not develop in the lymph
Foxp3CD4
Foxp3CD4
CD
25C
D25
18%
45%
% o
f max
.%
of m
ax.
82
11
6%
%11
85
14
0.1
10
77
Untreated + tolerized YAe+ pDC
%
%0.5
11
86
Spl
een
LNS
plee
nLN
Untreated + naive pDC
302520151050Time after transplantation (d)
Time after transplantation (d)
2520151050Time after transplantation (d)
Time after transplantation (d)
0
20
40
60
80
100
Untreated + tolerized YAe+ pDCUntreated + naive pDC
120G8YAe
SS
C
DST + α-CD40L DST + α-CD40L + 120G8
45%
54%86%
13%
1.08% 0.02%
Gra
ft su
rviv
al (
%)
Gra
ft su
rviv
al (
%)
0
20
40
60
80
100
Gra
ft su
rviv
al (
%)
0
20
40
60
80
100
Gra
ft su
rviv
al (
%)
806040200
α-CD62L
120G8
DST + α-CD40L
DST + α-CD40L + α-CD62L
DST + α-CD40L
DST + α-CD40L + 120G8
Untreated
100
80
60
40
20
00 10 20 30 40
129 WT (DST + α-CD40L)
Swap70–/– (DST + α-CD40L)
α-CD62L LN
WT LN WT Spleen
α-CD62L Spleen
YAe YAe
Swap70–/– LN
129 WT LN 129 WT Spleen
Swap70–/– Spleena
c d e f
b
Figure 6 Alloantigen-presenting pDC lymph node homing is necessary for Treg cell development and tolerance induction.
(a,b) Graft survival (left) and immunofluorescent analysis of YAe+ cells on day of rejection (right) in mice treated with mAb to
CD62L (+ a-CD62L; a) or Swap70–/– mice (b). Original magnification, �250; n ¼ 4 mice per group. 129, 129/Sv. (c) Graft
survival in mice receiving 500 mg of pDC-specific mAb 120G8 on days 0, 1, 3 and 4 after transplantation (downward arrows;
n ¼ 4 mice per group). (d) Flow cytometry of YAe+ pDCs in lymph nodes of recipient mice treated with mAb 120G8 on day 9
after transplantation. Numbers in quadrants and beside outlined areas indicate percent cells in each. SSC, side scatter. Data are
representative of two independent experiments. (e) Graft survival of untreated mice after adoptive transfer of 2 � 106 naive pDCs
or YAe+PDCA-1+ cells from the lymph nodes of ‘10-week tolerized’ mice (n ¼ 3 mice per group). (f) Flow cytometry (two independent experiments) of the
CD4+CD25+Foxp3+ cell population 72 h after adoptive transfer of 2 � 106 naive pDCs or YAe+PDCA-1+ cells from ‘10-week tolerized’ mice. Numbers
beside outlined areas and bracketed lines indicate percent cells in each area.
658 VOLUME 7 NUMBER 6 JUNE 2006 NATURE IMMUNOLOGY
A R T I C L E S©
2006
Nat
ure
Pub
lishi
ng G
roup
ht
tp://
ww
w.n
atur
e.co
m/n
atur
eim
mun
olog
y
node (Supplementary Fig. 7 online) and tolerance was not induced,despite administration of the tolerizing regimen (Fig. 6a, left). AsCD62L and Swap-70 deficiency also alter B cell migration, weinvestigated the specific function of pDCs during the induction oftolerance to vascularized allografts with a pDC-specific mAb(120G8)31. Treatment with 120G8 prevented tolerance induction inrecipient mice subject to tolerogenic treatment (Fig. 6c) and causedperipheral depletion of pDCs (Fig. 6d). This provides definitiveevidence that pDCs are required for the induction of tolerance tovascularized allografts.
We next investigated the potential therapeutic use of tolerance-inducing alloantigen-presenting pDCs by adoptive transfer ofYAe+PDCA-1+ cells isolated from the lymph nodes of tolerized miceinto untreated recipient mice. When untreated recipient mice receivedYAe+PDCA-1+ cells from the lymph nodes of tolerized donor mice,graft survival was prolonged for up to 24 d (Fig. 6e). In contrast, graftsurvival was not prolonged when untreated recipient mice receivedYAe–PDCA-1+ cells from naive donor mice, and rejection occurred8–10 d after transplantation. We also studied the population expan-sion of CD4+CD25+Foxp3+ cells to further investigate the involvementof YAe+PDCA-1+ cells in Treg cell development and prolonged graftsurvival. In mice receiving naive control pDCs, CD4+ T cells in thelymph node and the spleen had low expression of CD25 and noexpression of Foxp3 (Fig. 6f). However, when we adoptively trans-ferred tolerized YAe+PDCA-1+ cells, we found a distinct population ofCD25hiCD4+ T cells (Fig. 6f). This population expressed Foxp3 in thelymph node (45%) and spleen (18%), suggesting that adoptivelytransferred YAe+PDCA-1+ cells induce Treg cell population expansionand prolong graft survival.
DISCUSSION
Here we have reported that tolerance to vascular alloantigens ismediated at least in part by a distinct pDC subpopulation that iscapable of acquiring and processing MHC class II–derived donorallopeptide in allografts; migrating to peripheral lymph node acrossHEVs due to their expression of a repertoire of integrins, selectins andchemokine receptors; and inducing the peripheral development ofCD4+CD25+Foxp3+ Treg cells. Our findings indicate several potentialtherapeutic targets for pharmacological manipulation, including pDCantigen uptake and presentation, pDC migration and Treg cell devel-opment. This and other tolerizing protocols rely not only on theinduction of Treg cells but also on the engagement other tolerancemechanisms, such as clonal anergy or deletion17. The tolerogenicregimen of donor-specific transfusion (DST) plus mAb to CD40Lused here may contribute to pDC specialization for tolerization byensuring proper trafficking of pDCs into the lymph node or uniqueinteractions between pDCs and naive T cells. Indeed, pDCs activatedthrough CD40L have reduced CD62L expression32, which may explainthe localization of blood pDCs to the lymph nodes but not the spleenafter treatment with mAb to CD40L.
The identification of pDCs as phagocytic cells that transport foreignmolecules from a donor allograft to recipient secondary lymphoidorgans bears relevance to transplantation and demonstrates previouslyunknown functional attributes of this DC subpopulation. AlthoughpDCs have been identified in peripheral tissue33, published work hassuggested that human DCs derived from CD11c–CD4+ pDCs havepoor phagocytic abilities20, indicating that pDCs only present cell-associated endogenous antigen and prime CD8+ T cells34. However,our in vitro experiments have demonstrated that freshly isolatedmouse pDCs are capable of phagocytosis. That finding raises theissue of whether mouse pDCs act like human pDCs and demonstrates
that pDCs also present phagocytosed membrane-associated exogenousantigen and can prime CD4+ T cells. Supporting the idea of phago-cytic functions for pDCs, and consistent with our observation that theC-type lectin mannose receptor CD206 was upregulated after captureof donor allograft MHC II molecules, a C-type lectin receptor onhuman pDCs that functions as an antigen-capturing molecule hasbeen identified35.
Defining the mechanisms of alloantigen-presenting pDC traffickingis critical for understanding tolerance to vascular transplants, assecondary lymphoid organs have different functions in the establish-ment of immunological recognition of or ‘ignorance to’ vascularizedallografts36. In vascularized transplants, alloantigens are not presentedin a localized way but are distributed systemically in many secondarylymphoid organs37,38, indicating that the designation of ‘draining’ isdependent on the type of allograft and its anatomic location and thesurgical manipulation required for its placement. During tolerization,CD62L expression was upregulated on circulating alloantigen-present-ing cells and CD62L ligand expression was upregulated on HEVs, andinteractions between these two molecules facilitated binding of pDCsto HEVs and extravasation of pDCs into lymph nodes. We also foundthat LFA-1, VLA-4, ICAM-1 and chemokine receptors were upregu-lated on pDCs, whereas chemokines were upregulated in HEVs,during tolerization. Expression of a(1,3)-fucosyltransferase VII, afucosyltransferase essential for the biosynthesis of selectin ligands,can be induced by TGF-b39. Therefore, it is possible that in tolerogenicconditions, TGF-b secreted by pDCs or other cell types upregulatesL-selectin ligands on HEVs, which favor extravasation of alloantigen-presenting pDCs into the lymph node and subsequent Treg celldevelopment40. Indeed, failure to visualize alloantigen-presentingcells in the lymph nodes after administration of mAb to CD40L andin Swap-70-deficient mice correlates with a failure of toleranceinduction in these mice. Thus, tolerance may rely on an integratedsignaling pathway orchestrated toward extravasation of alloantigen-presenting pDCs from the blood to the lymph node. These findingsindicate that treatment with a new generation of immunomodulatorydrugs directed against LFA-1 and ICAM-1, which prolong allograftsurvival41 by inhibiting the signals necessary for antigen-dependentT cell activation42 and trafficking into inflamed allografts, may alsointerfere with processes such as pDC homing, which are essentialfor tolerance43.
It is unclear why the lymph node provides the anatomic location forthe tolerogenic immune response to vascular alloantigen. It is note-worthy that the spleen is the main site where antigen-specific immuneresponses are initiated by systemic priming in mice and humans44,45
and, in contrast to lymph nodes, provides the anatomical site whereB cells differentiate into immunoglobulin-secreting plasma cells46. Ithas been shown that splenic DCs ‘preferentially’ present alloantigenduring the immune response against vascular antigens47. TolerogenicDST treatment inhibits alloreactive proliferative responses in thespleen but not in the lymph nodes after vascular cardiac transplanta-tion48 and induces a decrease in splenic alloantibody-secreting cells49.In addition, treatment with mAb to CD40L has been reported todisrupt germinal center structure50. We noted the most alloantigen-presenting pDCs in the spleens of rejecting mice and the lymph nodesof tolerized mice. Those findings suggest that the spleen may be adominant location for immune priming and responsiveness, whereasthe lymph node may be poised to provide regulatory signals depend-ing on many factors, such as the presence of exogenous immunosup-pression or whether splenic function has been disrupted.
Important variables that determine priming versus toleranceinclude the DC subset that presents alloantigen. It has been proposed
NATURE IMMUNOLOGY VOLUME 7 NUMBER 6 JUNE 2006 659
A R T I C L E S©
2006
Nat
ure
Pub
lishi
ng G
roup
ht
tp://
ww
w.n
atur
e.co
m/n
atur
eim
mun
olog
y
that the particular DC subset that presents antigen determineswhether immunity (mDCs) or tolerance (pDCs) is induced. Specifi-cally, T cell priming has been noted when mDCs present FITC-labeledovalbumin (OVA) protein in an inflammatory airway disease model51.In contrast, suppression of the asthmatic response occurs when theantigen is transported by pDCs. Skin-derived DCs present alloantigenand migrate through lymphatics to local draining lymph nodes, wherethey prime antigen-specific T cells52. Here we have reported that for avascularized transplant, alloantigen is presented systemically by pDCsthat circulate through blood. Thus, anatomical differences maydetermine the type of APC that enters the grafted tissue. AlthoughpDCs had the ability to generate Treg cells in our model and expandCD4+CD25+Foxp3+ T cell populations in vitro53, pDCs may not be anexclusive tolerogenic DC subset, so other DCs may have similarfunctions in other settings54. We did not further investigate otherDC subpopulations in our study here of the APC subpopulationsinvolved in alloantigen presentation and mediating tolerance tovascularized allografts. The reason for that is that when studied atdifferent time points, the only DC subpopulation that expressed thealloantigen recognized by the YAe mAb was the pDC subpopulation.We noted a very small population of YAe+ cells (o5%) that were notpDCs or mDCs; future experiments should be directed towardelucidating the phenotype of these cells. The observation that pDCsrepresent more than 95% of the alloantigen-presenting cells in theallograft challenges whether conventional mDC are able to migrateinto the inflamed vascularized tissue and process alloantigen.Although homing of pDCs from blood into peripheral organs hasbeen reported25, not much is known about the migration ofblood circulating mDCs into inflamed vascularized tissue. It ispossible that differences in graft size and type and site of engraftmentmay influence the type of APC that present alloantigen in differenttransplant settings.
As for Treg cell induction, it has been shown that Foxp3 is notinduced anew in non–Treg cells during pathogen-dependent immuneresponses, although the induction of Foxp3 in non–Treg CD4+ T cellsusing systemic tolerogenic protocols was not addressed55. In trans-plantation models, Treg cell development has been reported in theperiphery of tolerant athymic mice12, suggesting that newCD25+CD4+ T cells induced in the periphery of transplanted micemediate tolerance to transplant antigens after tolerogenic treatment13.Supporting that hypothesis, it has been reported that peripheraldevelopment of alloantigen-specific CD4+CD25+Foxp3+ Treg cellsoccurs in the lymph nodes, as blocking lymph node homingby treatment with mAb to CD40L abrogates Treg cell populationexpansion and tolerance16. The findings presented here suggest thatpDCs mediate new Treg cell induction in the periphery in atransplantation setting.
We have shown that an essential pathway for achieving tolerance tovascular allografts is provided by antigen-specific CD4+CD25+Foxp3+
regulatory cells that can be induced anew in the lymph nodes oftransplanted mice by pDCs with systemic tolerogenic regimens. Wehave provided evidence that pDCs mediate Treg cell developmentin vivo. We suggest that the identification of pDCs as alloantigen-presenting cells that either activate antigen-specific effector T cells inthe spleen or induce the population expansion of Treg cells in thelymph nodes may help in the design of specific protocols toaccomplish indefinite graft survival.
METHODSMice. BALB/c, C57BL/6 and CBA mice 8–10 weeks of age were purchased from
The Jackson Laboratory. C57BL/6 TCR-transgenic TEa mice were provided by
A.Y. Rudensky (University of Washington, Seattle, Washington). C57BL/6
CCR4-deficient mice were provided by C. Hogaboam (University of Michigan,
Ann Arbor, Michigan), and Swap-70-deficient 129/Sv EMS and congenic 129/
Sv EMS mice have been described29,31. All mice were housed in a specific
pathogen–free facility in microisolator cages. All experiments used age- and
sex-matched mice in accordance with protocols approved by the Mount Sinai
Institutional Animal Care and Utilization Committee.
Reagents. The YAe hybridoma was a gift from A.Y. Rudensky. The MR1
hamster anti–mouse CD40L hybridoma was a gift from R.J. Noelle (Dartmouth
University, Hanover, New Hampshire). The MEL-14 rat immunoglobulin G2a
(IgG2a) anti–mouse CD62L hybridoma was purchased from the American
Type Culture Collection. The 120G8 rat anti-mouse hybridoma has been
described31. All hybridomas were grown in culture and supernatants were
purified over protein G or protein A columns (Amersham Pharmacia Biotech).
Vascularized cardiac transplantation. BALB/c hearts were transplanted as fully
vascularized heterotopic grafts into C57BL/6 mice as described56. BALB/c
cardiac grafts were transplanted by suturing of donor aorta and donor
pulmonary artery end-to-side to the C57BL/6 recipient lower abdominal aorta
and inferior vena cava, respectively. Recipient mice received intravenous
injections in 0.5 ml PBS at various times. For tolerance, mice were treated
with DST (1 � 107 donor splenocytes intravenously) on day –7 and 250 mg
mAb to CD40L on days –7, –4, 0 and +4 (times relative to transplantation).
One group received 100 mg mAb to CD40L 30 d after tolerization and mice
rejected at 37–40 d. Graft function was monitored every other day by
abdominal palpation. Tolerizing mice were studied at 1, 5 and 10 weeks
after transplantation. Mice that had graft survival 10 weeks or more were
considered ‘tolerized’ (called ‘10-week tolerized’ here). Untreated control mice
received hamster IgG in PBS and rejection, defined as complete cessation of a
palpable beat and confirmed by direct visualization at laparotomy, occurred
1 week after transplantation.
Cell preparations. Single-cell suspensions were prepared as described16. Lymph
(20 ml/mouse) was collected from the cisterna chyli and was resuspended in ice-
cold Hank’s balanced-salt solution medium until further use.
Mixed-lymphocyte reaction and in vitro suppression assay. A total of 2 � 104
sorted YAe+ cells from tolerized and rejecting lymph nodes or spleens were
cultured in triplicate with 5 � 104 with TCR-transgenic TEa CD4+ T cells. For
testing of the antigen-specific suppressive properties of CD4+CD25+ T cells
derived from those cultures, 4 � 104 freshly isolated responder CD4+CD25–
T cells from naive C57BL/6 mice were cultured together in triplicate with
5 � 104 irradiated (1,500 rads) BALB/c splenocyte samples that had been
depleted of T cells by negative selection with Mouse pan T Dynabeads accord-
ing to the manufacturer’s protocol (Dynal), along with 2 � 104 CD4+CD25+
TEa T cells that had been previously cultured for 72 h with tolerized YAe+ cells.
Cells were then cultured for 3 d in 96-well plates. At 18 h before termination of
culture, wells were pulsed with 1 mCi [3H]thymidine and incorporation was
quantified with a scintillation counter. Results are expressed as stimulation
index, determined from mean of triplicate determinations ± s.e.m.
Adoptive transfer and culture conditions of TCR-transgenic CD4+ TEa cells.
CD4+ T cell subsets were isolated from the spleens of TCR-transgenic TEa mice
using the Mouse T-cell CD4 Subset Column Kit (R&D Systems) according to
the manufacturer’s protocol and were purified to 85–90% purity. Enriched
CD4+ cells were stained with CyChrome-labeled antibody to CD4 (anti-CD4)
and phycoerythring-indotricarbocyanine–anti-CD25, and CD4+CD25– cells
were isolated by sorting on a MoFlo cell sorter (DakoCytomation) to 97–99%
purity. Cells were then stained with 5 mM CFSE (Molecular Probes), and 1 � 107
cells were adoptively transferred into transplanted C57BL/6 mice. In vitro CFSE-
labeled TCR-transgenic TEa CD4+ T cells were cultured together for 72 h at a
ratio of 10:1 with YAe+PDCA-1+ cells from the blood, lymph node, spleen or
graft from ‘10-week tolerized’ mice in 96 well-plates with 200 ml of complete
RPMI medium with or without anti-TGF-b1,2,3 (10 mg/ml; R&D Systems).
Laser-capture microdissection. Lymph node frozen sections 10 mm in thick-
ness were fixed in acetone for 1 min and were washed with PBS containing
660 VOLUME 7 NUMBER 6 JUNE 2006 NATURE IMMUNOLOGY
A R T I C L E S©
2006
Nat
ure
Pub
lishi
ng G
roup
ht
tp://
ww
w.n
atur
e.co
m/n
atur
eim
mun
olog
y
RNA inhibitors (200 U/ml; GenHunter). Stained sections were microdissected
with a PixCell II Laser Capture Microscope (Arcturus Engineering). Micro-
dissected cells from at least ten tissue sections were placed together on the same
cap until its entire surface was covered. The transfer film cap with the cells
derived by laser-capture microdissection was then inserted into a microcen-
trifuge tube containing 50 ml of extraction buffer for RNA isolation (Epicentre)
according to the manufacturer’s instructions.
Flow cytometry. For YAe staining, naive untreated cells from C57BL/6 mice
that lack I-Ad molecules were used as negative controls, and cells from
C57BL/6 � BALB/c F1 mice were used as positive controls. Anti–mouse
CD16-32 and biotinylated mouse IgG2b isotype control (PharMingen) were
used to block Fcg III/II receptors and as a YAe isotype control antibody,
respectively. Fluorochrome-conjugated antibodies specific for CD4, CD25,
CD11c, B220, Gr-1, CD19, CD62L, CD11b, GR1, B220 and CD11b and
purified rat antibody specific for mouse a4b7 were purchased from Phar-
Mingen. Purified goat anti-mouse CCR4 was from Capralogics and was
visualized by secondary staining with a phycoerythrin-conjugated monoclonal
anti-goat (Jackson ImmunoResearch). Purified anti-CD62L was from Phar-
Mingen and was visualized by secondary staining with Alexa Fluor 594–
conjugated goat anti-rat (Molecular Probes). FITC-conjugated rat anti–mouse
DEC-205 was from Serotec. FITC-conjugated rat anti–mouse MAdCAM1 was
from Southern Biotech. FITC-conjugated rat antibodies specific for mouse
CD80, CD86, CD40, MHC-II, CD206, LFA-1, ICAM, VLA-2, VLA-4 and CD2
were from eBioscience. Internalization of FITC-labeled beads was confirmed
with biotinylated anti-FITC (Jackson Laboratory) that recognizes the FITC-
labeled beads on the cell surface of cultured cells or with biotinylated mouse
IgG isotype control (PharMingen), plus streptavidin-allophycocyanin (Caltag)
to recognize the membrane-bound FITC-labeled beads. For intracellular
analysis of Foxp3 expression, cells were stained with rat anti-Foxp3 or rat
IgG2a as an isotype control, according to the manufacturer’s protocol
(eBioscience). Anti-TGF-b1,2,3 was from R&D Systems. An LSR II (BD
Biosciences) was used for flow cytometry, and data were analyzed with FlowJo
software (Tree Star). Results are expressed as a percentage of cells with staining
above background, and mAbs were ‘titered’ at regular intervals during the
course of these studies to ensure that saturating concentrations were used.
In vitro phagocytic assay. Sorted splenic B cells, splenic pDCs and peritoneal
macrophages (495% purity) were cultured with 1-mm FITC-labeled beads
(Polysciences) in 10% FBS RPMI medium for time periods ranging from 2 h to
12 h. After that time, cells were placed on glass slides and were examined with a
fluorescence microscope. Images of cell suspensions were acquired with a Leica
DMRA2 fluorescence microscope (Wetzlar) and a digital Hamamatsu charge-
coupled device camera for monitoring internalization of FITC-labeled beads. In
addition, two-color flow cytometry was done on the resuspended cell popula-
tions to demonstrate that the FITC-labeled beads were not bound to the
external cell membranes of pDCs.
Real-time PCR. Total RNA was extracted with the ArrayPure Nano-scale RNA
purification Kit (Epicentre) according to the manufacturer’s instructions.
Reverse transcription used 1 mg of RNA and the Sensiscript RT Kit (Qiagen)
and random primers (Invitrogen) according to the manufacturer’s protocol.
Quantitative real-time PCR was done in duplicate or triplicate using 25 mg
cDNA with 0.4 mM of each primer in a final reaction volume of 30 ml of 1�SYBR Green PCR Master Mix (Applied Biosystems). PCR cycling conditions
were as follows: 50 1C for 2 min and 95 1C for 10 min, and then 40 cycles of
95 1C for 15 s followed by 60 1C for 1 min. Relative expression was calculated as
2(CT ubiquitin – CT gene) (where CT is cycling threshold; ABI PRISM 7700 User
Bulletin 2) with ubiquitin RNA as the endogenous control. All samples were
run in triplicate.
Immunofluorescence microscopy. Hamster anti–mouse CD11c (HL3), pur-
ified rat anti–mouse B220, purified rat anti–mouse Ly6G and purified rat anti–
mouse CD19 were purchased from PharMingen. Phycoerythrin-conjugated rat
anti–mouse PDCA and purified rat anti–mouse PDCA were purchased from
Miltenyi. Purified rat anti–mouse TARC-CCL17 was purchased from
R&D Systems. Indocarbocyanine-conjugated goat anti-hamster IgG and
indocarbocyanine-conjugated goat anti-rat IgG were purchased from Jackson
ImmunoResearch. Phycoerythrin-conjugated rat ant–mouse Foxp3 was pur-
chased from eBioscience. Biotin-labeled YAe antibody was developed with
streptavidin–horseradish peroxidase, biotinyl tyramide (NEN; PerkinElmer)
and streptavidin-carbocyanine (Jackson ImmunoResearch). All slides were
mounted with Vectashield (Vector Laboratories) to preserve fluorescence.
Images were acquired with a Leica DMRA2 fluorescence microscope (Wetzlar)
and a digital Hamamatsu charge-coupled device camera. Separate green, red
and blue images were collected and analyzed with Openlab software
(Improvision). Final image processing was done with Volocity software
(Improvision). For imaging of CD62L ligands on HEVs, chimeric CD62L
fused to human m-chain (a gift from J.B. Lowe, Case Western Reserve
University, Cleveland, Ohio) followed by FITC–anti-human IgM (Jackson
ImmunoResearch) was used. The fluorescence intensity of HEVs was measured
with Slidebook 4.1 Digital Software (Intelligent Imaging Innovations) with
masking of at least four representative areas for each section to obtain the mean
fluorescence intensity over 10 mm2. The z-projection images of 8-mm sections
were analyzed at maximum fluorescence intensities every 0.5 mm.
In vitro HEV-binding assay. A modified Stamper-Woodruff assay was done24.
Frozen sections 8 mm in thickness were overlaid with tolerized and rejecting
blood YAe+ pDCs (1 � 104 in 100 ml) at a ratio of 1:1, labeled with PKH red
(2.5 mM) and PKH green (2.5 mM), respectively (Sigma). Sections were
incubated at 4 1C for 45 min with horizontal rotation at 60 r.p.m. Slides were
then washed in cold PBS and then were fixed for 10 min in 3% paraformalde-
hyde on ice. Samples were stained with rat anti–mouse peripheral node
addressin followed by FITC–goat anti-rat for HEV localization and were
examined by fluorescent microscopy. The adhesion assay used ten lymph node
sections per slide with triplicate slides. Results are expressed as number of cells
bound to HEVs ± s.e.m.
Statistics. For graft survival, one-way analysis of variance (ANOVA) was done.
For chemokine receptor expression, one-way ANOVA and the Dunnett test
were done to examine individual differences versus various controls. For
binding assays, one-way ANOVA and the Dunnett test were done. For total
cell percentages, one-way ANOVA was done.
Note: Supplementary information is available on the Nature Immunology website.
ACKNOWLEDGMENTSWe acknowledge the technical contributions of J. Llodra, H. Nikolayevskiy andS. Freeman, and discussions with M. Merad. Supported by National Institutes ofHealth (R01 AI41428, AI44929 and AI62765 to J.S.B.).
COMPETING INTERESTS STATEMENTThe authors declare that they have no competing financial interests.
Published online at http://www.nature.com/natureimmunology/
Reprints and permissions information is available online at http://npg.nature.com/
reprintsandpermissions/
1. Krieger, N.R., Yin, D.P. & Fathman, C.G. CD4+ but not CD8+ cells are essential forallorejection. J. Exp. Med. 184, 2013–2018 (1996).
2. Sayegh, M.H. et al. Allograft rejection in a new allospecific CD4+ TCR transgenicmouse. Am. J. Transplant. 3, 381–389 (2003).
3. Yamada, A. et al. Further analysis of the T-cell subsets and pathways of murine cardiacallograft rejection. Am. J. Transplant. 3, 23–27 (2003).
4. He, C. & Heeger, P.S. CD8 T cells can reject major histocompatibility complex classI-deficient skin allografts. Am. J. Transplant. 4, 698–704 (2004).
5. Hancock, W.W. Chemokine receptor-dependent alloresponses. Immunol. Rev. 196,37–50 (2003).
6. Banchereau, J. & Steinman, R.M. Dendritic cells and the control of immunity. Nature392, 245–252 (1998).
7. Sallusto, F. et al. Rapid and coordinated switch in chemokine receptor expressionduring dendritic cell maturation. Eur. J. Immunol. 28, 2760–2769 (1998).
8. Miyasaka, M. & Tanaka, T. Lymphocyte trafficking across high endothelial venules:dogmas and enigmas. Nat. Rev. Immunol. 4, 360–370 (2004).
9. Sakaguchi, S. Naturally arising Foxp3-expressing CD25+CD4+ regulatory T cells inimmunological tolerance to self and non-self. Nat. Immunol. 6, 345–352 (2005).
10. Schenk, S. et al. Alloreactive T cell responses and acute rejection of single class IIMHC-disparate heart allografts are under strict regulation by CD4+CD25+ T cells.J. Immunol. 174, 3741–3748 (2005).
11. Hara, M. et al. IL-10 is required for regulatory T cells to mediate tolerance toalloantigens in vivo. J. Immunol. 166, 3789–3796 (2001).
NATURE IMMUNOLOGY VOLUME 7 NUMBER 6 JUNE 2006 661
A R T I C L E S©
2006
Nat
ure
Pub
lishi
ng G
roup
ht
tp://
ww
w.n
atur
e.co
m/n
atur
eim
mun
olog
y
12. Karim, M., Kingsley, C.I., Bushell, A.R., Sawitzki, B.S. & Wood, K.J. Alloantigen-induced CD25+CD4+ regulatory T cells can develop in vivo from CD25–CD4+ precursorsin a thymus-independent process. J. Immunol. 172, 923–928 (2004).
13. Cobbold, S.P. et al. Induction of Foxp3+ regulatory T cells in the periphery of T cellreceptor transgenic mice tolerized to transplants. J. Immunol. 172, 6003–6010(2004).
14. Abe, M., Wang, Z., de Creus, A. & Thomson, A.W. Plasmacytoid dendritic cellprecursors induce allogeneic T-cell hyporesponsiveness and prolong heart graft survival.Am. J. Transplant. 5, 1808–1819 (2005).
15. Bai, Y. et al. L-selectin-dependent lymphoid occupancy is required to induce alloanti-gen-specific tolerance. J. Immunol. 168, 1579–1589 (2002).
16. Ochando, J.C. et al. Lymph node occupancy is required for the peripheral developmentof alloantigen-specific Foxp3+ regulatory T cells. J. Immunol. 174, 6993–7005(2005).
17. Quezada, S.A. et al. Analysis of the underlying cellular mechanisms of anti-CD154-induced graft tolerance: the interplay of clonal anergy and immune regulation.J. Immunol. 175, 771–779 (2005).
18. Murphy, D.B. et al. A novel MHC class II epitope expressed in thymic medulla but notcortex. Nature 338, 765–768 (1989).
19. Nakano, H., Yanagita, M. & Gunn, M.D. CD11c+B220+Gr-1+ cells in mouse lymphnodes and spleen display characteristics of plasmacytoid dendritic cells. J. Exp. Med.194, 1171–1178 (2001).
20. Grouard, G. et al. The enigmatic plasmacytoid T cells develop into dendritic cells withinterleukin (IL)-3 and CD40-ligand. J. Exp. Med. 185, 1101–1111 (1997).
21. Pachynski, R.K., Wu, S.W., Gunn, M.D. & Erle, D.J. Secondary lymphoid-tissuechemokine (SLC) stimulates integrin a4b7-mediated adhesion of lymphocytes tomucosal addressin cell adhesion molecule-1 (MAdCAM-1) under flow. J. Immunol.161, 952–956 (1998).
22. Rosen, S.D. Endothelial ligands for L-selectin: from lymphocyte recirculation toallograft rejection. Am. J. Pathol. 155, 1013–1020 (1999).
23. Berg, E.L., McEvoy, L.M., Berlin, C., Bargatze, R.F. & Butcher, E.C. L-selectin-mediated lymphocyte rolling on MAdCAM-1. Nature 366, 695–698 (1993).
24. Stamper, H.B., Jr & Woodruff, J.J. Lymphocyte homing into lymph nodes: in vitrodemonstration of the selective affinity of recirculating lymphocytes for high-endothelialvenules. J. Exp. Med. 144, 828–833 (1976).
25. Yoneyama, H. et al. Evidence for recruitment of plasmacytoid dendritic cell precursorsto inflamed lymph nodes through high endothelial venules. Int. Immunol. 16, 915–928(2004).
26. Bajenoff, M., Granjeaud, S. & Guerder, S. The strategy of T cell antigen-presenting cellencounter in antigen-draining lymph nodes revealed by imaging of initial T cellactivation. J. Exp. Med. 198, 715–724 (2003).
27. Alferink, J. et al. Compartmentalized production of CCL17 in vivo: strong inducibility inperipheral dendritic cells contrasts selective absence from the spleen. J. Exp. Med.197, 585–599 (2003).
28. Iellem, A. et al. Unique chemotactic response profile and specific expression ofchemokine receptors CCR4 and CCR8 by CD4+CD25+ regulatory T cells. J. Exp.Med. 194, 847–853 (2001).
29. Shinohara, M. et al. SWAP-70 is a guanine-nucleotide-exchange factor that mediatessignalling of membrane ruffling. Nature 416, 759–763 (2002).
30. Sivalenka, R.R. & Jessberger, R. SWAP-70 regulates c-kit-induced mast cell activation,cell-cell adhesion, and migration. Mol. Cell. Biol. 24, 10277–10288 (2004).
31. Asselin-Paturel, C., Brizard, G., Pin, J.J., Briere, F. & Trinchieri, G. Mouse straindifferences in plasmacytoid dendritic cell frequency and function revealed by a novelmonoclonal antibody. J. Immunol. 171, 6466–6477 (2003).
32. Cella, M., Facchetti, F., Lanzavecchia, A. & Colonna, M. Plasmacytoid dendritic cellsactivated by influenza virus and CD40L drive a potent TH1 polarization. Nat. Immunol.1, 305–310 (2000).
33. Jahnsen, F.L. et al. Experimentally induced recruitment of plasmacytoid (CD123high)dendritic cells in human nasal allergy. J. Immunol. 165, 4062–4068 (2000).
34. Salio, M., Palmowski, M.J., Atzberger, A., Hermans, I.F. & Cerundolo, V. CpG-maturedmurine plasmacytoid dendritic cells are capable of in vivo priming of functional CD8
T cell responses to endogenous but not exogenous antigens. J. Exp. Med. 199,567–579 (2004).
35. Dzionek, A. et al. BDCA-2, a novel plasmacytoid dendritic cell-specific type II C-typelectin, mediates antigen capture and is a potent inhibitor of interferon a/b induction.J. Exp. Med. 194, 1823–1834 (2001).
36. Lakkis, F.G., Arakelov, A., Konieczny, B.T. & Inoue, Y. Immunologic ‘ignorance’ ofvascularized organ transplants in the absence of secondary lymphoid tissue. Nat. Med.6, 686–688 (2000).
37. Chen, Y., Demir, Y., Valujskikh, A. & Heeger, P.S. The male minor transplantationantigen preferentially activates recipient CD4+ T cells through the indirect presentationpathway in vivo. J. Immunol. 171, 6510–6518 (2003).
38. Reed, A.J. et al. Alloreactive CD4 T cell activation in vivo: an autonomous function ofthe indirect pathway of alloantigen presentation. J. Immunol. 171, 6502–6509(2003).
39. Wagers, A.J. & Kansas, G.S. Potent induction of a(1,3)-fucosyltransferase VII inactivated CD4+ T cells by TGF-b1 through a p38 mitogen-activated protein kinase-dependent pathway. J. Immunol. 165, 5011–5016 (2000).
40. Chen, W. et al. Conversion of peripheral CD4+CD25– naive T cells to CD4+CD25+
regulatory T cells by TGF-b induction of transcription factor Foxp3. J. Exp. Med. 198,1875–1886 (2003).
41. Corbascio, M. et al. CTLA4Ig combined with anti-LFA-1 prolongs cardiac allograftsurvival indefinitely. Transpl. Immunol. 10, 55–61 (2002).
42. Kandula, S. & Abraham, C. LFA-1 on CD4+ T cells is required for optimal antigen-dependent activation in vivo. J. Immunol. 173, 4443–4451 (2004).
43. Brandt, M., Steinmann, J., Steinhoff, G. & Haverich, A. Treatment with monoclonalantibodies to ICAM-1 and LFA-1 in rat heart allograft rejection. Transpl. Int. 10,141–144 (1997).
44. Liu, Y.J., Oldfield, S. & MacLennan, I.C. Memory B cells in T cell-dependent antibodyresponses colonize the splenic marginal zones. Eur. J. Immunol. 18, 355–362(1988).
45. Ellyard, J.I. et al. Antigen-selected, immunoglobulin-secreting cells persist in humanspleen and bone marrow. Blood 103, 3805–3812 (2004).
46. Shapiro-Shelef, M. & Calame, K. Regulation of plasma-cell development. Nat. Rev.Immunol. 5, 230–242 (2005).
47. Crowley, M., Inaba, K. & Steinman, R.M. Dendritic cells are the principal cells in mousespleen bearing immunogenic fragments of foreign proteins. J. Exp. Med. 172,383–386 (1990).
48. Josien, R., Heslan, M., Brouard, S., Soulillou, J.P. & Cuturi, M.C. Critical requirementfor graft passenger leukocytes in allograft tolerance induced by donor blood transfusion.Blood 92, 4539–4544 (1998).
49. Baldwin, W.M., III, Rhoton, K. & Sanfilippo, F. IgM and IgG alloantibody production bysplenocytes and deposition in rat renal allografts are decreased by donor-specific bloodtransfusion. Transplantation 51, 481–485 (1991).
50. Han, S. et al. Cellular interaction in germinal centers. Roles of CD40 ligand and B7–2in established germinal centers. J. Immunol. 155, 556–567 (1995).
51. de Heer, H.J. et al. Essential role of lung plasmacytoid dendritic cells in prevent-ing asthmatic reactions to harmless inhaled antigen. J. Exp. Med. 200, 89–98(2004).
52. Itano, A.A. et al. Distinct dendritic cell populations sequentially present antigen to CD4T cells and stimulate different aspects of cell-mediated immunity. Immunity 19, 47–57 (2003).
53. Moseman, E.A. et al. Human plasmacytoid dendritic cells activated by CpG oligodeoxy-nucleotides induce the generation of CD4+CD25+ regulatory T cells. J. Immunol. 173,4433–4442 (2004).
54. Kretschmer, K. et al. Inducing and expanding regulatory T cell populations by foreignantigen. Nat. Immunol. 6, 1219–1227 (2005).
55. Fontenot, J.D. et al. Regulatory Tcell lineage specification by the forkhead transcriptionfactor Foxp3. Immunity 22, 329–341 (2005).
56. Corry, R.J., Winn, H.J. & Russell, P.S. Primarily vascularized allografts of hearts inmice. The role of H-2D, H-2K, and non-H-2 antigens in rejection. Transplantation 16,343–350 (1973).
662 VOLUME 7 NUMBER 6 JUNE 2006 NATURE IMMUNOLOGY
A R T I C L E S©
2006
Nat
ure
Pub
lishi
ng G
roup
ht
tp://
ww
w.n
atur
e.co
m/n
atur
eim
mun
olog
y