Predicting drug pharmacokinetics and effect in vascularized tumors using computer simulation
26
J. Math. Biol. (2009) 58:485–510 DOI 10.1007/s00285-008-0214-y Mathematical Biology Predicting drug pharmacokinetics and effect in vascularized tumors using computer simulation John P. Sinek · Sandeep Sanga · Xiaoming Zheng · Hermann B. Frieboes · Mauro Ferrari · Vittorio Cristini Received: 23 February 2007 / Revised: 30 January 2008 / Published online: 10 September 2008 © The Author(s) 2008. This article is published with open access at Springerlink.com Abstract In this paper, we investigate the pharmacokinetics and effect of doxorubi- cin and cisplatin in vascularized tumors through two-dimensional simulations. We take Financial Support from National Cancer Institute, National Science Foundation, and Department of Defense. J. P. Sinek · X. Zheng · V. Cristini Department of Mathematics, University of California, Irvine, CA, USA S. Sanga · V. Cristini Department of Biomedical Engineering, University of Texas, Austin, TX, USA S. Sanga · H. B. Frieboes · V. Cristini Department of Biomedical Engineering, University of California, Irvine, CA, USA H. B. Frieboes · V. Cristini (B ) School of Health Information Sciences, University of Texas Health Science Center, 7000 Fannin, Suite 850A, Houston, TX, 77030, USA e-mail: [email protected] M. Ferrari Center for Nanomedicine, Brown Foundation Institute of Molecular Medicine, Department of Biomedical Engineering, University of Texas Health Science Center at Houston, Houston, TX, USA M. Ferrari Department of Experimental Therapeutics, University of Texas MD Anderson Cancer Center, Houston, TX, USA M. Ferrari Department of Bioengineering, Rice University, Houston, TX, USA V. Cristini Department of Systems Biology, University of Texas MD Anderson Cancer Center, Houston, TX, USA 123
-
Upload
independent -
Category
Documents
-
view
1 -
download
0
Transcript of Predicting drug pharmacokinetics and effect in vascularized tumors using computer simulation

J. Math. Biol. (2009) 58:485–510DOI 10.1007/s00285-008-0214-y Mathematical Biology
Predicting drug pharmacokinetics and effectin vascularized tumors using computer simulation
John P. Sinek · Sandeep Sanga ·Xiaoming Zheng · Hermann B. Frieboes ·Mauro Ferrari · Vittorio Cristini
Received: 23 February 2007 / Revised: 30 January 2008 / Published online: 10 September 2008© The Author(s) 2008. This article is published with open access at Springerlink.com
Abstract In this paper, we investigate the pharmacokinetics and effect of doxorubi-cin and cisplatin in vascularized tumors through two-dimensional simulations. We take
Financial Support from National Cancer Institute, National Science Foundation, and Department ofDefense.
J. P. Sinek · X. Zheng · V. CristiniDepartment of Mathematics, University of California, Irvine, CA, USA
S. Sanga · V. CristiniDepartment of Biomedical Engineering, University of Texas, Austin, TX, USA
S. Sanga · H. B. Frieboes · V. CristiniDepartment of Biomedical Engineering, University of California, Irvine, CA, USA
H. B. Frieboes · V. Cristini (B)School of Health Information Sciences, University of Texas Health Science Center,7000 Fannin, Suite 850A, Houston, TX, 77030, USAe-mail: [email protected]
M. FerrariCenter for Nanomedicine, Brown Foundation Institute of Molecular Medicine,Department of Biomedical Engineering, University of Texas Health Science Center at Houston,Houston, TX, USA
M. FerrariDepartment of Experimental Therapeutics, University of Texas MD Anderson Cancer Center,Houston, TX, USA
M. FerrariDepartment of Bioengineering, Rice University, Houston, TX, USA
V. CristiniDepartment of Systems Biology, University of Texas MD Anderson Cancer Center, Houston, TX, USA
123
486 J. P. Sinek et al.
into account especially vascular and morphological heterogeneity as well as cellularand lesion-level pharmacokinetic determinants like P-glycoprotein (Pgp) efflux andcell density. To do this we construct a multi-compartment PKPD model calibratedfrom published experimental data and simulate 2-h bolus administrations followed by18-h drug washout. Our results show that lesion-scale drug and nutrient distributionmay significantly impact therapeutic efficacy and should be considered as carefully asgenetic determinants modulating, for example, the production of multidrug-resistanceprotein or topoisomerase II. We visualize and rigorously quantify distributions ofnutrient, drug, and resulting cell inhibition. A main result is the existence of signi-ficant heterogeneity in all three, yielding poor inhibition in a large fraction of thelesion, and commensurately increased serum drug concentration necessary for an ave-rage 50% inhibition throughout the lesion (the IC50 concentration). For doxorubicinthe effect of hypoxia and hypoglycemia (“nutrient effect”) is isolated and shown tofurther increase cell inhibition heterogeneity and double the IC50, both undesirable.We also show how the therapeutic effectiveness of doxorubicin penetration therapydepends upon other determinants affecting drug distribution, such as cellular effluxand density, offering some insight into the conditions under which otherwise pro-mising therapies may fail and, more importantly, when they will succeed. Cisplatinis used as a contrast to doxorubicin since both published experimental data and oursimulations indicate its lesion distribution is more uniform than that of doxorubi-cin. Because of this some of the complexity in predicting its therapeutic efficacy ismitigated. Using this advantage, we show results suggesting that in vitro monolayerassays using this drug may more accurately predict in vivo performance than for drugslike doxorubicin. The nonlinear interaction among various determinants representingcell and lesion phenotype as well as therapeutic strategies is a unifying theme of ourresults. Throughout it can be appreciated that macroscopic environmental conditions,notably drug and nutrient distributions, give rise to considerable variation in lesionresponse, hence clinical resistance. Moreover, the synergy or antagonism of combinedtherapeutic strategies depends heavily upon this environment.
Keywords In silico · Simulation · Pharmacokinetics · Prediction · Therapy
Mathematics Subject Classification (2000) 92C45
1 Introduction
While drug resistance to solid tumors is often a consequence of genetic factors, suchas upregulation of anti-apoptotic proteins or overexpression of efflux mechanisms,factors at coarser physiological scales may also profoundly influence tumor therapeu-tic response [50]. A tumor is a heterogeneous three-dimensional composite of fibrousand connective tissues, stromal components, vasculature, and multiple clones of can-cer cells. Atop this intrinsic heterogeneity is layered the anatomical and functionalirregularity of tumoral vasculature, characterized by erratic flow, collapsed vessels,diminished oxygen tension, and a large mean tissue-to-vessel distance [5,29,30,34,54]. As a consequence, the tumor microenvironment is highly variable, marked by
123

Predicting drug pharmacokinetics and effect in vascularized tumors 487
gradients of nutrient and oxygen, resulting in regions of hypoxia, acidity, and necro-sis, and heterogeneous proliferation. In order for an anticancer agent to be effective,it must extravasate, diffuse through lesion tissue, and be transported into cells, whereit must bind to its target and induce cell apoptosis or mitotic inhibition. The tumorenvironment is not conducive to these processes [50]. The vessel bed’s blood flow andspatial distribution hinder uniform extravasation, calling into question the capabilityof drug molecules to adequately distribute throughout tissue. Recent experiments invitro [38,73,81] and in vivo [40,57] demonstrate limited drug penetration throughtumors, especially highly protein-bound molecules like doxorubicin and paclitaxel.Once a drug molecule has traversed lesion tissue from its point of extravasation andis presented to a cancer cell, the path from extracellular space to intracellular targetis fraught with difficulties ranging from protonation due to the acidic environment,which renders anthracyclines incapable of traversing membrane, to intracellular remo-val by drug efflux pumps, to cellular processes that effect DNA repair and drug clea-rance [3,15,31,65,71,79]. In addition to pharmacokinetics, drug pharmacodynamicsis equally impaired. Significant hypoxia and hypoglycemia throughout may induce cellquiescence, reducing the efficacy of cell-cycle chemotherapeutic agents like doxoru-bicin and cisplatin [18,19]. Hypoglycemia causes the glucose-regulated stress res-ponse detrimental to the action of topoisomerase II-directed drugs like doxorubicin[41,49,64,68].
The heterogeneity and three-dimensionality of the tumoral environment presentsa challenge to drug assessment, both during development and in the clinic. Whereasa particular drug may show marked activity against a particular specimen in vitro,its potency may vanish or become far less reliable in vivo. This is evidenced by thedifferential between positive predictive accuracy of in vitro-assisted therapy selection(around 70%) and negative predictive accuracy (around 90%), a situation not remar-kably changed over the years [26,27]. Supraoptimal delivery of drug to cultured cellseliminates the gauntlet of biobarriers in vivo described above, precluding the varia-bility they induce. A drug that consistently works in vitro can therefore be expectedto only sometimes work in vivo. Unraveling the myriad interactions of therapeuticdeterminants within the complex three-dimensional tumoral environment is evidentlydifficult, resulting in high costs of drug development and patient suffering.
Perhaps the crystal ball we are attempting to build is incomplete when made only ofglass typically found in experimental labs; computer (in silico) simulations based onmathematical modeling and calibrated with experimental data might fulfill a key aspectof the lens. A significant capability of in silico experimentation (including simulatedassays) is the complete control over and monitoring of the simulated in vivo tumorenvironment. Moreover, computer modeling can create hypothetical environments andconditions impossible to achieve otherwise, the study of which is nonetheless instru-mental in unraveling disease and drug mechanisms. This expansive control, foundedupon an adequately mechanistic mathematical basis, could facilitate the discovery ofhypotheses as to why certain drugs or therapeutic strategies would or would not beeffective, potentially on a patient-by-patient basis. The relative ease and cost-efficiencyof performing simulations could furthermore enable a thorough investigation of strate-gies, revealing the optimal among them. The judicious combination of this burgeoningtechnology with the capabilities of the wet-lab is an attractive development in both
123

488 J. P. Sinek et al.
drug discovery and the clinical management of cancer leading to the easing of patients’burdens.
The past two decades have witnessed explosive growth in the mathematical andcomputational modeling of vascular and avascular tumors [1,4,7–9,13,36,43,44,56,82]. As the basic elements of tumoral growth models have matured, specialized treat-ments of angiogenesis and flow [2,46,47,69], drug delivery and response [33,40,52,66,80], and effects of the tumoral microenvironment [23,45] have been developed.Some simulation and analysis has provided great insight using one-dimensional mode-ling (employing cylindrical or spherical symmetry) without discrete vasculature. Morerecently, powerful numerical methods have been developed so as to simulate multi-dimensional complex morphological progression and its relation to cell phenotypeand the microenvironment involving, for example, nutrient and biomechanical tissueresponse [23,45,82].
In the present paper we examine therapeutic efficacy of two common drugs, cisplatinand doxorubicin, in relation to phenotypic and microenvironmental conditions. Modelparameters govern extracellular drug/tissue diffusivity; cellular uptake, efflux, andmetabolism; cellular density; and the effect of nutrient heterogeneity on drug action.Simulations are performed in a two-dimensional (non-symmetric) setting employingdiscrete vasculature, which enables the incorporation of morphological and topologi-cal influence on drug and nutrient distributions. The effect of these distributions ontherapeutic efficacy is of special interest. Sinek et al. [66] had earlier performed asimilar investigation; however, the pharmacokinetics and pharmacodynamics (PKPD)component was rudimentary, assuming one homogenous lesion compartment and notbased upon experimentally acquired parameter values. In the present work we imple-ment an extensive multi-compartment PKPD component whose parameter values arecalibrated via published experimental data. This enables a comparison of the tissue-and cell-level drug dynamics of the two drugs, and facilitates the generation of hypo-theses to explain their in vivo characteristics. We ask that the reader consider that ifdoxorubicin and cisplatin were discovered only today, the simulations herein couldbe seen as providing insight into their anticipated in vivo performance, potentiallystreamlining and reducing costs of development. Indeed, the methodology presentedherein could, with additional development, be applied to both established and nascentdrugs to the end of refining clinical trials and assisting in clinical therapeutic strategyto improve patient comfort and survival.
2 Mathematical model and parameters
2.1 Model description
The multiscale tumor growth and angiogenesis simulator developed by Zheng et al.[82] is used to grow the lesions upon which we simulate chemotherapy. This is anonlinear, continuum scale, two-dimensional growth engine whose accuracy is madepossible by an adaptive finite element mesh due to Cristini et al. [11]. The mesh enablesmulti-scale computation for finely resolving tumor morphology, especially aroundimportant areas such as the necrotic/tumor and tumor/host interfaces and around capil-
123
Predicting drug pharmacokinetics and effect in vascularized tumors 489
lary sprouts. Realistic and heterogenous vasculature through which nutrient and drugis provided is generated via the angiogenesis model of Anderson and Chaplain [2].The simulation field incorporates three phases (see Fig. 2): viable cancerous tissue,normal host tissue, and necrotic debris. The lesion/host interface is demarked by thickblack contours, while the microvasculature appears as a web of thin red curves. Darkinterior regions are necrotic debris.
Briefly, nutrient and oxygen are provided through the discrete microvasculature,which is generated in response to angiogenic regulators produced from perinecroticcells. This results in proliferation and tumor growth. The simple steady-state diffusionequation
0 = kv(1 − n)δ + Dn∇2n − knn (1)
is used to model nutrient delivery and uptake, where n is the local nutrient normalizedby the intravascular level, kv is a measure of vascular porosity (0 is impermeable,∞ is completely porous), δ is the Dirac delta function located along the vasculature,Dn is nutrient diffusivity, and kn is the local rate of consumption by cells [82]. Thecharacteristically high porosity of tumor vasculature implies a very high setting of kv sothat, essentially, vasculature provides a constant boundary condition of 1. Experimentsgiven in [51] demonstrate that oxygen penetrates approximately 150 mm into in vitrospheroids before falling to about 10% of serum level. At this point necrosis ensues.Combining this with a diffusivity Dn of around 60,000 mm2 min−1 [53,70], the nutrientuptake rate is calculated to be kn = 24 min−1. Waste resulting from necrotic celldegradation is assumed to be removed via convection towards and through the tumor-host interface as well as via scavenger cell phagocytosis. In regions where nutrient issufficient to maintain viability, mitosis is assumed to be directly proportional to itsconcentration, with the proportionality constant dependent upon the average cell cycletime of the malignant population.
Once the tumors are grown, drug administration via the vasculature is simulated byour multi-compartment pharmacokinetics model, based upon earlier work of [15,17,20,21]. For cisplatin, there are three compartments corresponding to (1) extracellular,(2) cytosolic, and (3) DNA-bound drug. For doxorubicin, there is a fourth compartmentcorresponding to intracellular organelles, e.g., lysosomes. The system of equationsgoverning transport for both drugs (with different parameter values) is
s1 = kv(sv − s1)δ + Ds∇2s1 − k′12s1 + k′
21(s2/106Vc)
s2 = k12106Vcs1 − k21s2 + k32s3 − k23s2(1 − s3/sm) + k42s4 − k24s2(2)
s3 = k23s2(1 − s3/sm) − k32s3 − k3s3
s4 = k24s2 − k42s4
where si represents drug concentration in compartment i , ki j represents a transfer ratefrom compartment i to j , and ki represents a rate of permanent removal from compart-ment i and the system. sv is intravascular drug concentration during bolus, and sm is aDNA saturation parameter relevant to doxorubicin. Vc is the volume of a cell (assumedspherical with diameter 10 mm, yielding Vc = 520 fL cell−1) and appears in the first
123

490 J. P. Sinek et al.
two equations to reconcile the dimensions of sv and s1 (mM) with the dimensions ofall other compartments (fmoles/cell). kv and δ are the same as in Eq. (1). The pri-med rates appearing in the first equation are related to their unprimed counterpartsvia k′
i j = ki j/F where F is the extracellular fraction of whole tissue. Taking a base-
line tumor density of ρ = 1.0E9 cells mL−1, a well-known representative value, incombination with the cell volume previously quoted results in
F = 1 − ρVc(10−12 mL fL−1)
= 0.48, (3)
also a reasonable value. Finally, Ds is the diffusivity of the drug through extracellularspace.
Both cisplatin and doxorubicin pass through cell membrane according to k12 (whichincludes possible pump and transporter activity, as do all other rates). From there, thedrugs may efflux according to k21 or may bind to DNA according to k23. The kineticsdiffer from here for the two drugs. Cisplatin may be removed according to the rate k3,which destroys the functioning of the drug and repairs the DNA [79]. Doxorubicin,however, has an off rate given by k32, and moreover may be sequestered and released bylysosomes according to k24 and k42 [3,31,59]. Although lysosomal flow to membraneand exocytosis of sequestered drug plays a role in some drug resistant cell lines, we arenot necessarily modeling drug resistance via this function, and so assume this processto be negligible in accordance with [16]. On the other hand, we are concerned withthe quantity of drug lysosomes can sequester, as this contributes to the cellular uptakeof drug, and hence, its penetration characteristics.
The pharmacodynamics model consists of the Hill-type equation along the lines ofthose employed in [20,21]
E = N (n)
1 + A−1x−m(4)
where E is cell inhibition (1 minus surviving fraction), x is DNA-bound drug-timeproduct (area under the curve, or AUC), and A and m are phenomenologically fitparameters. N (n) is a function of nutrient n ranging from 0 to 1 used to mimic theeffect of hypoxia and hypoglycemia. Results with doxorubicin show that cells in deeperlayers of spheroids do not respond as well to drug as do cells on the surface, even whenintracellular drug levels are taken into account [18,19]. Other experiments demonstratereduced response in monolayer when cells are forced into quiescence due to reducedoxygen [68]. Still others show that hypoglycemia can deplete topoisomerase II, thusreducing the effect of some anthracyclines [64]. These results imply that the response ofcells to doxorubicin in vivo might correlate to the local nutrient, a phenomenon whichwe herein refer to as the “nutrient effect.” For our purposes, the exact form of N isnot important. For simplicity, we choose N = n p, where p is a phenomenologicalparameter derived from the data of [19], and equals 0.4. Since in our model n isnormalized with respect to the intravascular level, it runs from 0 to 1, and thus sodoes N . Furthermore, at full nutrient levels, N = 1, and so cell inhibition is maximal.In our simulations, drug pharmacokinetics (Eqs. 2) is allowed to proceed from bolus
123

Predicting drug pharmacokinetics and effect in vascularized tumors 491
Table 1 A complete summary of baseline pharmacokinetics and pharmacodynamics parameters
Parameter Description Baseline Value
Dox Cis
Vc Cell volume (fL cell−1) 520 520
ρ Cell density (cells mL−1) 1.0E9 1.0E9
F Interstitial fraction 0.48 0.48
Dn Nutrient/ECM diffusivity (mm2 min−1) 60E3 60E3
Ds Drug/ECM diffusivity (mm2 min−1) 1.0E3 30E3
kn Nutrient metabolism (min−1) 24 24
k12 Drug uptake (min−1) 5.40 0.054
k21 Drug efflux (min−1) 5.40 1.56E–3
k23 Drug–DNA binding (min−1) 8.02E5 3.82E–4
k32 Drug–DNA release (min−1) 1.80E3 0.0
k3 Drug–DNA repair (min−1) 0.0 0.015
k24 Lysosomal sequestration (min−1) 10.0 0.0
k42 Lysosomal release (min−1) 0.07 0.0
sm Drug–DNA capacity (fmole) 1.00 ∞A Phenomenological PD parameter 0.188 7.75
m Phenomenological PD parameter 1.14 1.58
p Nutrient effect parameter 0.4 0.0
Tumor growth and angiogenesis parameters can be found in [82]
initiation to washout 20 h later. During this time the locally varying DNA-bound AUCis calculated and used to find cell inhibition (Eq. 4).
2.2 Pharmacokinetics model parameters
A generally acceptable theoretical setup for performing experiments to measure com-partmental concentrations (and therefore to derive the rate constants we are after)is either a suspension or monolayer in an inexhaustible drug-laden medium corres-ponding to s1. Under these conditions, the relevant model consists of the last threeequations in Eqs. (2), with s1 held constant. We will refer to this model as the modi-fied version of Eqs. (2). All model parameters and values are summarized in Table 1.These will be referred to as the baseline values, some of which will be adjusted laterto simulate different tumor characteristics and therapeutic treatments. We emphasizethat parameter values, having been derived from a variety of published experimentaldata spanning many years and cell types, correspond to a prototypical tumor and can-cer cells suitable for the simulations herein, but not necessarily representative of anyparticular clinical specimen.
Cisplatin parameters We begin with cisplatin, setting k24 and k42 to 0 since we assumeonly three compartments, and k32 to 0 since we assume the repair rate k3 is the
123

492 J. P. Sinek et al.
dominant removal rate of DNA-bound drug. k3 is next obtained as follows. In experi-ments performed by Sadowitz et al. [60], adducts per million nucleotides on isolatedperipheral blood mononuclear cell DNA fall from 75 to 5 and 185 to 40 in 2 h intwo different experiments. Thus, assuming the exponential repair model s3 = k3s3,we calculate the repair rate to be about 0.015 min−1. An initial estimate of k23 is thenmade as follows. Sadowitz shows that for 7 mM cisplatin, in 2 h peripheral bloodmononuclear cells accumulate from about 25 (non-thiol-blocked cells) to 175 (thiol-blocked cells) adducts per million nucleotides. Assuming that DNA consists of about1.25E6 kbp, this converts to from 1.04E–4 to 7.27E–4 fmoles of Pt docked on the DNA(1 atom/adduct). Neglecting the cell membrane and supposing DNA to be exposeddirectly to the drug, we have the ODE s3 = 7λ23 − k3s3, where λ23 is a clearanceparameter (fL min−1). The solution is s3 = 7(λ23/k3)(1 − exp(−k3t)). Substitutingvalues of k3 = 0.015 min−1, t = 120 min, and 1.04E–4≤ s3 ≤7.27E0–4 fmole yields0.27 ≤ λ23 ≤ 1.9 fL min−1. To convert this to a rate we use the relation k23 = λ23/Vc,arriving at 5.19E–4 ≤ k23 ≤ 3.65E–3 min−1. The assumption that DNA was exposeddirectly to the cisplatin solution means that this rate is only a bootstrap approximationand must be refined. We note that the extremely low ratio of adducts per kbp impliesthat the saturation capacity of DNA with respect to cisplatin is never approached, andso set sm to ∞.
Next, we estimate k12 and k21. While doing this we will refine our initial estimateof k23. The whole procedure involves fitting the best curves to data from Troger et al.[76] (Fig. 1a). Troger exposed human tongue carcinoma CAL-27 cells in monolayer tofour different concentrations of cisplatin and then measured total intracellular amountof Pt at selected times. This corresponds to s2 + s3 in our model. Beginning with theprevious estimate of k23 and setting s1 to concentrations used by Troger, we adjust k12and k21 in the modified version of Eqs. (2) until a good fit of Troger’s data is obtained.Simultaneously, we adjust k23 to keep the DNA-bound drug true to results of Sadowitzpreviously discussed. We remark that the disparity between the inward and outwardrates derived for cisplatin may be due in part to carrier-mediated transport, e.g., theCTR1 influx transporter.
Doxorubicin parameters Proceeding to doxorubicin we first obtain an acceptablerange for k12 and k21 from the literature. For a variety of anthracyclines, includingdoxorubicin, initial estimates of cell membrane permeability P are taken from expe-riments with SU-4 and SU-4R wildtype and resistant human lymphoma cells [17],from experiments with EHR2 and EHR2/DNR+ wildtype and resistant Ehrlich ascitestumor cells [15,16], and from experiments with MDA-468 breast cancer cells [40].The range reported is 2.4 ≤ P ≤ 1000 mm min−1. The relation k12 = P Ac/Vc, whereAc represents the cell membrane area, can then be used to arrive at an initial range of1.4 ≤ k12 ≤ 600 min−1, which will be refined later. In the case of passive diffusion,k21 = k12. We note that these values are far larger than those obtained for cisplatinpreviously. More generally, it has been remarked that cell membrane permeability forcisplatin is much lower than for doxorubicin, etoposide, and vinblastine, although allfour drugs are thought to enter cells by passive diffusion [35].
We next turn our attention to DNA-binding affinity. Given the great DNA affinityof the anthracyclines, saturability of the DNA must be taken into account, requiring
123

Predicting drug pharmacokinetics and effect in vascularized tumors 493
Fig. 1 a Data from Troger et al. [76] used to calibrate k12, k21, and k23 for the cisplatin model. Parametersare fit simultaneously to all four curves treated as one set of data. b Cell inhibition fits for Eq. (4) usingLevasseur’s [42] data on A2780 ovarian cancer cells exposed in monolayer
123

494 J. P. Sinek et al.
an estimate of sm. There is evidence a typical anthracycline molecule intercalationoccludes from 3 to 10 binding sites in a manner that cannot be corrected exactly by afactor [48,59,74]; however, to a first approximation we assume that such a correctioncan be applied. Demant and Friche [15] report a DNA binding site concentration ofabout 5 mM within a cell volume of 1000 fL, yielding 5 fmoles of sites. A low valueof 0.7 fmoles is obtained by using our assumed value of 1.25E6 kbp and the reportedsite exclusion parameter of about 3 from Rizzo et al. [59]. Tarasiuk et al. [74] findthat the DNA of human lymphocytes is comprised of about 6.0E6 kbp and that oneintercalating molecule of doxorubicin requires 10 base pairs. Thus, Tarasiuk’s dataimplies a factor-corrected quantity of 1 fmole of binding sites, which we take as arepresentative value of sm.
DNA binding kinetics of the anthracyclines is nontrivial, perhaps requiring multiplesteps and demonstrating sequence specificity [58,59]. Bearing this in mind, as anapproximation it will suffice to assume non-specific, one-step binding and unbindingaccording to the chemical reaction
drug molecule + DNA bpkoff�kon
intercalated bp.
A representative value for the binding coefficient in the above equation for doxoru-bicin is reported as kon = 4.2E8 M−1 min−1 and a value of the unbinding coefficient(identical with k32) as koff = 1800 min−1 [59]. From kon we calculate a clearanceparameter (as with cisplatin) given as λ23 = konsm= 4.2E8 fL min−1 (being cautiouswith the scales of our dimensions). k23 can then be calculated as λ23/Vc, given inTable 1.
We next turn our attention to the rates k24 and k42 governing lysosomal sequestra-tion. Experiments by Hurwitz et al. [31] using U-937 myeloid leukemia cells and theirdox-resistant variant U-A10 show that the ratio of DNA-bound to lysosomally seques-tered drug is about 3 (Hurwitz uses daunorubicin, an anthracycline related to doxo-rubicin). In our modified model equations with all other parameters set as describedabove, the amount of sequestered drug at equilibrium is dependent only upon the ratiok24/k42. This ratio furthermore does not affect the equilibrium quantity of DNA-bounddrug. Arbitrarily selecting k24 = 1 min−1, we find that the appropriate DNA-boundto lysosomally sequestered ratio is obtained by setting k42 to 0.007. Considering thatlysosomal membrane permeability is quite high [16], the lysosomally bound drug mustachieve equilibrium quickly, which can be modified by changing k24 while keepingthe ratio k24/k42 constant. We find that increasing k24 by a factor of 10 reduces thetime required for the system (Eqs. 2) to achieve 95% of equilibrium value (max95) toabout 300 min, below which further increases in k24 only reduce this time negligibly.Thus, we set k24 = 10 and k42 = 0.07.
To refine our initial range of k12 and k21, we use the modified version of Eqs. (2)to compare our simulated monolayer uptake profiles of total intracellular drug withthose of DeGregorio et al. [14] using human Ewing’s sarcoma and rhabdomyosarcomacells. At 5.40 min−1 both uptake profiles and equilibrium values compare favorablyat three test concentrations.
123

Predicting drug pharmacokinetics and effect in vascularized tumors 495
Drug–tissue diffusivity The last pharmacokinetics parameter values needed are thediffusivities Ds of cisplatin and doxorubicin through tumor interstitium. For moleculesof their size (dox M.W. = 544, cis M.W. = 300), diffusivity should be about30,000 mm2 min−1 [53,70]. However, doxorubicin faces particularly severe barriersdue to binding to extracellular constituents such as hyaluronic acid [37,38], and itsdiffusivity in some tissues has been estimated to be as low as 1000 mm2 min−1 [40],which we take as our baseline value.
2.3 Pharmacodynamics model parameters
In order to calibrate the pharmacodynamics model (Eq. 4), we use in vitro data ofLevasseur et al. [42] with A2780 ovarian cancer cells exposed in monolayer to bothdoxorubicin and cisplatin over a range of times and concentrations. We assume thepreviously discussed modified pharmacokinetics model along with the values deri-ved, and simulate Levassuer’s exposures followed by approximately 24 h of drugwashout in drug-free medium (s1 is set to 0). During this time, DNA-bound AUC iscalculated. These data are then used in conjunction with Levasseur’s surviving frac-tion data to fit the parameters A and m in Eq. (4) using Microsoft Excel (Fig. 1b).During this process, nutrient is assumed plentiful (n = 1), thus bypassing the nutrienteffect.
3 Computational simulations
3.1 Non-dimensionalization and numerical methods
Non-dimensionalization of Eqs. 2 is via the length- and time-scales
L = √Ds/k12 T = k−1
12
with the compartmental concentrations transformed as
s1 = s1/sv s2 = s2/1E6Vcsv s3 = s3/1E6Vcsv
s4 = s4/1E6Vcsv sm = sm/1E6Vcsv
resulting in
s1 = kv(1 − s1)δ + ∇2s1 − s1/F + k21s2/F
s2 = s1 − k21s2 + k32s3 − k23s2(1 − s3/sm) + k42s4 − k24s2(5)
s3 = k23s2(1 − s3/sm) − k32s3 − k3s3
s4 = k24s2 − k42s4
The numerical methods for tumor growth and angiogenesis have been described indetail in Zheng et al. [82]. For the reaction–diffusion equations (Eqs. 2) we first use
123

496 J. P. Sinek et al.
Strang splitting. Then the trapezoidal rule is applied to the reaction part, and the Crank-Nicolson scheme, to the diffusion part. For a description of these methods, see Tysonet al. [78] and references therein.
3.2 In silico experiments
Four in silico experiments are performed in the following manner:
1. Three simulated tumors are grown using Zheng et al.’s model [82]. Each lesionrepresents one replication of each experiment.
2. The pharmacokinetics model (Eqs. 5) is used to deliver drug to the lesions. In eachcase we hold the intravascular concentration of drug sv constant for 2 h, then setit to zero for eighteen more hours to allow washout.
3. DNA-bound AUC is computed by re-dimensionalizing s3 and time and integratingusing Matlab. The result is then used in the pharmacodynamics model (Eq. 4) tocompute cell inhibition. Nutrient (Eq. 1) is relevant when the nutrient effect isemployed.
Each lesion is produced based upon the same set of growth and vasculature parame-ters (see Zheng et al. for a complete description), but randomness in the angiogenesisalgorithm and slightly different initial shapes produce different vasculatures and mor-phologies. It is assumed that a tumor in vivo does not grow or regress appreciablyduring the 20-h course of the therapy we are attempting to simulate, hence we stoptumor and vascular growth during our in silico therapies. Intravascular concentrationsare calibrated in each case to produce a total cellular growth inhibition of 50%. Thisconcentration is referred to as the IC50. The sharp “square wave” delivery of drugis perhaps a caricature of clinical bolus administration, but it allows for consistentanalysis and comparison of results.
Our first set of experiments compares DNA-bound drug AUC distributions of doxo-rubicin and cisplatin under the baseline conditions in Table 1. We furthermore showthe homogenizing effect of doxorubicin retention on final DNA-bound AUC [19].We next investigate the impact of inhibition heterogeneity on dosing requirements,paying particular attention to the nutrient effect for doxorubicin under baseline condi-tions and improved penetration by, for example, removing hyaluronic acid [37,38].In our third set of simulations we more deeply investigate the effect of doxorubicinpenetration therapies under three circumstances: baseline tumor density, high tumordensity, and baseline tumor density with Pgp efflux activity. These are chosen becausethey demonstrate a spectrum of possibilities due to their effect on cellular drug uptake.High tumor density increases uptake, while Pgp efflux decreases it. In order to simu-late increased penetration, we increase Ds for doxorubicin from its baseline value to5000 mm2 min−1 for a moderate increase, and 30,000 for the maximum increase, thusmatching the performance of cisplatin. To simulate high tumor density we increase ρ
by 50% to 1.5E9 cells ml−1. This has the effect of lowering the interstitial fraction Fto 0.22, which in turn increases k′
12 and k′21 while leaving all other rates unchanged.
Pgp efflux is simulated by increasing k21 by a factor of 10, which has the effect of redu-cing all intracellular compartment concentrations by approximately the same factor.
123

Predicting drug pharmacokinetics and effect in vascularized tumors 497
This is consistent with results of [10] that show Pgp activity can reduce intracellularconcentrations of daunorubicin (an anthracycline related to doxorubicin) by up to afactor of 100. In our fourth and final set of experiments we investigate permeabilizationtherapy with respect to cisplatin, whereby a detergent, such as digitonin, or electro-permeabilization is used to increase the permeability of cell membrane [35,72]. Wetake an extreme case, increasing the rate constants k12 and k21 from baseline both by afactor of 100. Note that this does not increase the limiting intracellular or DNA-boundlevels of drug attained in simulated monolayer, only the rate at which these come toequilibrium. Thus highly permeabilized, DNA-bound max95 is attained at 3.4 h ofexposure; further permeabilization reduces this negligibly. For comparison, max95 isgreater than 27 h for unpermeabilized cells. This therapy is simulated under both invivo baseline and very high cell densities achieved by increasing the baseline density75% to 1.75E9 cells ml−1. At this density, the interstitial fraction F drops to a mere0.08. Both of these are further compared to monolayer results to probe the conditionsunder which in vitro assays can be used to predict clinical efficacy.
Although all treatments described are duplicated in each of the three in silicotumors, we display only representative plots with appropriate summaries of all data.The nutrient effect is only used where noted.
3.3 Results
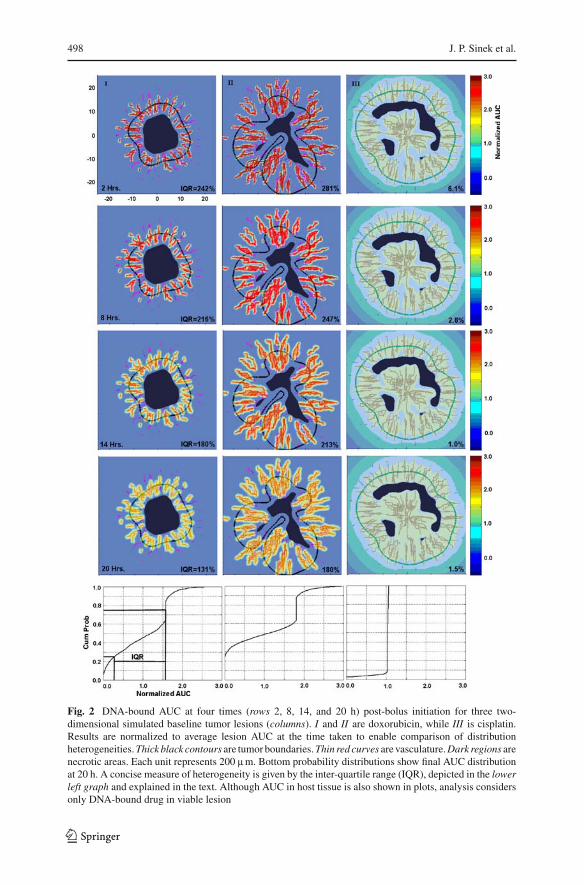
First experiment We begin by examining DNA-bound AUC distributions at varioustimes in the baseline simulated lesions (each lesion corresponding to a column, I, II,or III), shown in Fig. 2. From top to bottom, the times correspond to 2, 8, 14, and 20 hpost-bolus initiation. Levels are normalized relative to the average AUC within viablelesion for comparison of heterogeneity. Although surrounding host tissue cells uptakeand bind with drug differently than cancer cells, we make no distinction in these colorplots; however, quantitative analytical results only consider DNA-bound drug withinviable lesion. The two left column sequences (Lesions I and II) show doxorubicinAUC, while the rightmost column shows cisplatin. For both Lesions I and II, at 2 hdoxorubicin AUC is seen to be about three times the average (dark red) in the vicinityof the vasculature, and almost 0 (blue) elsewhere. The distribution is only slightlymore homogeneous by 8 h. By 14 h the heterogeneity has lessened, with the peaksclose to the vasculature reaching only about 2.2. Finally, at the conclusion of washout20 h after bolus initiation, the distribution has become much more homogeneous, withpeaks only reaching about 1.7 times the average. In contrast, cisplatin distributionwithin Lesion III remains extremely homogeneous, right at the average, throughoutthe entire treatment.
The probability distributions at the bottom, corresponding to AUC at 20 h post-bolus initiation, allow for a more quantitative comparison. The two correspondingto doxorubicin show much heterogeneity relative to cisplatin on the right. Using theleftmost distribution as an example, the average DNA-bound AUC is found to be6.04 fmole min. 25% of tumor cells receive less than 1.66 fmole min each, while 25%of tumor cells receive more than 9.54 fmole min. The remaining 50% of the tumor cellsreceive between these two values, a range of 7.88 fmole min. When normalized with
123
498 J. P. Sinek et al.
Fig. 2 DNA-bound AUC at four times (rows 2, 8, 14, and 20 h) post-bolus initiation for three two-dimensional simulated baseline tumor lesions (columns). I and II are doxorubicin, while III is cisplatin.Results are normalized to average lesion AUC at the time taken to enable comparison of distributionheterogeneities. Thick black contours are tumor boundaries. Thin red curves are vasculature. Dark regions arenecrotic areas. Each unit represents 200 mm. Bottom probability distributions show final AUC distributionat 20 h. A concise measure of heterogeneity is given by the inter-quartile range (IQR), depicted in the lowerleft graph and explained in the text. Although AUC in host tissue is also shown in plots, analysis considersonly DNA-bound drug in viable lesion
123

Predicting drug pharmacokinetics and effect in vascularized tumors 499
Table 2 Mean ± SD of the IC50 and the logs of their ratios with respect to monolayer treatments forexperiments to investigate the impact of drug and nutrient heterogeneity
Nutrient effect IC50,mono(mM) IC50(mM) log(IC50/IC50,mono)
Doxorubicin baseline
Off 0.175 0.482 ± 0.163 0.424 ± 0.138 (∗ p < 0.05)
On 0.175 1.34 ± 0.874 0.830 ± 0.261 (∗ p < 0.05)
Doxorubicin with penetration therapy
Off 0.175 0.197 ± 0.0172 0.0511 ± 0.0371 (p > 0.05)
On 0.175 0.371 ± 0.0356 0.325 ± 0.0407 (∗ p < 0.05)
Cisplatin baseline
N/A 7.05 7.14 ± 0.0757 0.00529 ± 0.00462 (p > 0.05)
IC50,mono is the IC50 of baseline cells in monolayer. At the 5% significance level using a one-tailed t test,the average log ratio for cisplatin does not exceed 0. On the other hand, in three of the four experimentswith doxorubicin, they do. Paired one-tailed t tests show that the average log IC50 ratios for doxorubicinwith the nutrient effect are greater than that without regardless of penetration therapy
respect to the average and expressed as a percent, this yields 131% (the interquartilerange, or IQR), and gives a concise measure of distribution heterogeneity (the closer to0, the more homogeneous). IQR’s are given at each of the other time points as well. Allthree tumors, despite varied lesion and vasculature morphologies, demonstrate similarresults (not all shown). Doxorubicin AUC IQR’s typically lessen from about 250% at2 h to 150% at 20 h; cisplatin AUC IQR’s drop from about 10 to 2%. Interestingly, inthe run shown, the heterogeneity for cisplatin increases slightly in the last frame. Thishappens in one of the other two tumors as well.
Second experiment We next investigate the impact of drug and nutrient heterogeneityon cell inhibition distributions and IC50’s. Bolus administrations are simulated forcisplatin using baseline lesions exactly as in Fig. 2. The PD model (Eq. 4) is then usedto calculate cell inhibition. For doxorubicin we use baseline lesions as well as lesionsin which drug penetration therapy is applied. Experiments for dox are run both withand without the nutrient effect.
A table of average IC50’s and log(IC50/ IC50,mono)’s for these experiments is givenin Table 2. Here and throughout this paper “IC50,mono” refers to baseline cells exposedin monolayer and serves as a reference. Note that, as these are simulated monolayerexposures, IC50,mono is deterministic. Figure 3 shows a typical nutrient profile, usingLesion II as an example with an IQR of 36%. This measurement is completely analo-gous to that used in Fig. 2 except that here it is applied to nutrient distribution and thereis no normalization since nutrient levels are bounded absolutely from 0 to 100 percent,the level within the vasculature, itself. Nutrient IQR’s for the other two lesions arewithin 2% of this value.
At the 5% significance level, one-tailed t tests show that the average log IC50 ratiois not greater than 0 for cisplatin, underscoring the homogeneity of its distribution. Incontrast, out of the four experiments performed for doxorubicin from the combinationsof nutrient effect and penetration therapy, three indicate that the average log ratios aregreater than 0 at the 5% significance level. Within this group of four we can analyze
123

500 J. P. Sinek et al.
Fig. 3 Contour plot showsnutrient distribution in Lesion IIdemonstrating significantheterogeneity. Other lesions aresimilar
the strength of the nutrient effect. For the baseline lesion, the nutrient effect increasesthe log IC50 ratio by 0.406 units (a factor of about 2.5). For the lesion with penetrationtherapy, the increase is 0.274 units (a factor of about 1.9). Paired t tests show thatthese differences are significant at the 5% level.
Cell inhibition distributions closely mirror their AUC distributions, with that ofcisplatin being virtually uniform at 50% inhibition throughout. Conversely, doxoru-bicin displays heterogeneity, increased with the addition of the nutrient effect. UsingLesion II as a representative example for doxorubicin, the upper block of frames inFig. 4 demonstrates the inhibition distributions for the baseline lesion with and withoutthe nutrient effect. While the broadening of the cumulative probability plot as well asa comparison of the color distribution plots indicate that the nutrient effect increasesheterogeneity, inhibition IQR is reduced from 81 to 77% (again, not normalized).The effect of penetration therapy in the lower block of frames is readily apparent.IQR’s, color plots, and probability graphs all indicate more uniform inhibition, ran-ging moderately from 35 to 65%. Again we see increased heterogeneity in the plotswith the addition of the nutrient effect. This time the IQR also reflects the increase.Lesions I and III yield similar results.
Third experiment In our third set of simulations, we investigate the effect of the-rapies designed to improve doxorubicin penetration under several combinations ofdrug/interstitum diffusivities, cell densities, and drug efflux activities (e.g., Pgp).Figure 5 gives bar graphs of (a) log IC50 ratios and (b) AUC interquartile rangesfor three scenarios. The leftmost triplet corresponds to baseline tumor density andno efflux, resulting in a condition of “normal” cellular uptake. The middle tripletcorresponds to high density with no efflux, a condition of high uptake. The rightmostcorresponds to baseline density with efflux, a condition of low uptake. For the log IC50ratio (a), in the baseline tumor case there is a change of −0.388 log units in going fromno removal of hyaluronic acid to almost complete removal. When density is increa-sed, the change increases to −0.709; however, when Pgp efflux is activated, ANOVAreveals there is no statistical difference, and in fact, the measured change is posi-tive. Results are similar when the nutrient effect is included, with all bars essentially
123

Predicting drug pharmacokinetics and effect in vascularized tumors 501
Fig. 4 (Upper block) Cell growth inhibition profile of Lesion II at baseline settings with and withoutthe nutrient effect after bolus administration depicted in Fig. 2. Probability plot and IQR are now ofinhibition distribution and are not normalized with respect to any average. Although the IQR indicatesdecreased heterogeneity with the nutrient effect, both the color distribution plot and the probability plotindicate increased heterogeneity as is evidenced by the broadening of the curve. (Lower block) The sameexperiment, except with doxorubicin penetration increased. Now both the plots and IQR show increasedheterogeneity. The appropriate IC50 is used in each experiment
123

502 J. P. Sinek et al.
Fig. 5 The effect of increasing doxorubicin penetration on a log(IC50/IC50,mono) and b interquartilerange shown in three cases: baseline tumor (excepting penetration therapy), high-density tumor, and normaldensity tumor with Pgp efflux. High density has the effect of increasing drug uptake, while Pgp efflux hasthe opposite effect. Three replications per bar with standard deviations and results of ANOVA displayed
123

Predicting drug pharmacokinetics and effect in vascularized tumors 503
Fig. 6 Effect of permeabilization therapy with respect to cisplatin is shown in three cases. Bars are oflog(IC50,perm/IC50,unperm)where “perm” and “unperm” correspond to permeabilized and unpermeabilizedconditions. Three replications per bar with results of two-tailed t tests relative to monolayer displayed. Whilethere is a statistical difference at the 0.05 significance level for the high-density tumor, this disappears atthe 0.01 significance level
increased by a constant, approximately 0.37. For the AUC interquartile range (b),it is seen that heterogeneity is greatest in the high density case and least in the Pgpefflux case. Within each triplet the heterogeneity decreases with increasing penetrationtherapy, as expected. The magnitudes of change mirror those for the log IC50 ratios,with the baseline case experiencing a moderate change (from 146 to 13%), the highdensity case experiencing a dramatic change (from 217 to 52%), and the Pgp effluxcase experiencing the least change (from 57 to 4%).
Fourth experiment In our fourth and final set of simulations we investigate the effect ofpermeabilization therapy vis-a-vis cisplatin. Figure 6 shows log(IC50,perm/
IC50,unperm) for three cases: monolayer, in vivo with baseline cell density, and invivo with high cell density. Here, the subscripts “perm” and “unperm” denote theapplication or withholding of permeabilization therapy. Permeabilization results in adecrease of 0.154 log IC50 units for simulated monolayers, i.e., a reduction of IC50 bya factor of 0.7, and is thus effective in vitro. An interesting question is whether thiscarries over in vivo, i.e., whether a monolayer assay can be used to predict clinicalefficacy. Improvements for the two in vivo simulations are comparable to monolayerresults, with all three log-differences about −0.14, and no statistical difference bet-ween improvement for the baseline case and for monolayer at the 5% significancelevel using a two-tailed t test.
4 Discussion
In agreement with experimental observation, our simulations show that heterogenei-ties of drug, nutrient, and oxygen, caused in part by irregular vasculature and lesion
123

504 J. P. Sinek et al.
morphology, exist and can significantly impact therapeutic results. Moreover, the senseand magnitude of their influence is not always intuitively obvious. A good example ofthis is that, despite its well-noted penetration difficulties, doxorubicin performs wellclinically. Our simulations show that this may be somewhat explained by its retentionin tissue removed from vasculature, causing homogeneity of exposure to increase longafter the bolus has been terminated (Fig. 2). This phenomenon has been experimentallyverified in [19] with spheroids. Because of this, the resulting cell inhibition distributionis more homogenous than would otherwise be expected. On the other hand, cisplatinmaintains an homogenous DNA-bound distribution at all times from bolus initiationto 20 h later, resulting in an extremely uniform cell inhibition distribution. This result,as well as the near equality of its IC50 and IC50,mono demonstrated in Table 2, has alsobeen experimentally verified with spheroids [18,32,37].
While retention in tissue contributes to the performance of doxorubicin in vivo,Table 2 demonstrates that its heterogeneity of distribution contributes to increasedserum drug concentrations to match the same cell inhibition in monolayer. In onecase, the average amount of drug increases by nearly one log unit. It is reasonable toexpect that heterogeneity of nutrient, resulting in hypoxia and hypoglycemia, shouldcompound this problem for doxorubicin. Indeed, this is the case as can be seen by theapproximate doubling of the IC50’s (0.482 mM vs. 1.34 and 0.197 vs. 0.371) when thenutrient effect is applied. By graphically and quantitatively showing corresponding cellinhibition distributions. Figure 4 offers further insight into these phenomena. It is easilyseen that cell inhibition distributions are as heterogeneous as their corresponding DNA-bound AUC distributions, with areas of lesion removed from vasculature experiencingreduced cell inhibition. An examination of the probability plots in the upper block,corresponding to baseline lesions, shows that a full 24% of viable lesion undergoes noinhibition at all. It is clear from these graphs that penetration therapy greatly decreasesheterogeneity of cell inhibition (and commensurately, IC50) as does removal of thenutrient effect. The latter may be clinically feasible through, for example, carbogenbreathing or recombinant human Epo (rHuEPO) administration [63,75].
One puzzling behavior is that while both the color and probability plots demons-trate consistently increased heterogeneity brought about by the nutrient effect (as isevidenced by the broadening of the probability curves), the IQR actually decreases inthe baseline case from 81 to 77%. This occurs with Lesions I and III as well. A solutionto the mystery is obtained by noticing that, absent the nutrient effect, a large portionof the tumor either experiences no inhibition (about 24%, which is distant from thevasculature) or an already heterogeneous inhibition (about 31%). The remaining 45%receives a near homogeneous level of inhibition (the vertical portion of the curve),and this fraction corresponds to tissue close to the vasculature. Thus, the only signi-ficant heterogeneity that can be induced by the nutrient effect is within this fraction.Indeed, it is just this part of the curve that broadens in the second probability distribu-tion, indicating greater heterogeneity, as expected. As the IQR is designed to measureheterogeneity somewhat more globally, it misses—in fact, misdiagnoses—the changeoccurring within this fraction.
In addition to dosing requirements, there is a second and subtler reason to consi-der heterogeneity of the inhibition distribution when treating clinical tumors. Hete-rogeneities in microenvironmental conditions have been linked to increased lesion
123

Predicting drug pharmacokinetics and effect in vascularized tumors 505
fragmentation and invasiveness [12,25,39,45,55]. While the mechanisms underlyingthis phenomenon are complex, involving myriad protein signaling events and activi-ties at the cellular level, they may at least partly rely on gross lesion effects, includingthose caused by drug administration.
Figure 5 shows what might be expected from therapies that increase doxorubicinpenetration by, for example, removing hyaluronic acid. As expected, for the baselinetumors, greater homogeneity and level of AUC is achieved, resulting in reductionsof IC50. This effect has been experimentally verified using spheroids [37,38]. That itshould be more pronounced for high-density in silico tumors and completely absentin the presence of Pgp efflux is intriguing. A potential explanation is availed by sim-plifying the pharmacokinetics model (Eqs. 2), reducing it to the one-dimensional,one-compartment steady state diffusion equation 0 = D∇2s − ks with diffusivity Dand uptake rate k. In two dimensions, a segment of blood vessel acting as a sourcenext to a section of tissue approximates the one-dimensional case. This equationhas one governing parameter, the characteristic diffusion length L = √
D/k, and a(non-unique) solution sv exp(−x/L), where x is distance from the source and sv is theconstant level of drug in the vasculature. Considering a section of tissue of thickness dnext to a vessel and a fixed exposure time, average AUC is proportional to the integral
d∫
0
sv exp(−x/L)dx = sv L(1 − exp(−d/L)). (6)
Let AUC50 be the fixed average AUC required for fifty percent cell inhibition. Then,ignoring the constant of proportionality,
AUC50 = IC50 L(1 − exp(−d/L)). (7)
Increasing the diffusivity to simulate penetration therapy results in an increased cha-racteristic length C L , where C > 1, and hence a new IC50. The ratio of IC50’s istherefore
AUC50/C L(1 − exp(−d/C L))
AUC50/L(1 − exp(−d/L))= (1 − exp(−d/L))
C(1 − exp(−d/C L)), (8)
which approaches 1 as L → ∞, and approaches 1/C as L → 0. Now, increasing celldensity has the effect of increasing k, resulting in a smaller L , thus manifesting thedifferential in IC50’s. Conversely, activating Pgp efflux has the effect of decreasing k,resulting in a larger L , thus nullifying the differential.
That something along these lines is probably happening is demonstrated in Fig. 5bby the generally high IQR’s for the high density case versus the low IQR’s for the Pgp,and the large change in the high density triplet versus the Pgp triplet. Indeed, there isexperimental evidence that Pgp and other transporters might facilitate drug transportfurther away from vasculature [77]. This could be an important point when decidingupon appropriate therapies for tumors exhibiting different characteristics such as effluxmechanisms and relatively high or low densities. Any therapy involves risk. There may
123

506 J. P. Sinek et al.
be less to gain under certain conditions, advising that the therapy not be performed orperhaps, that concomitant therapy be performed designed to optimize conditions.
The great homogeneity of both cisplatin AUC and cell inhibition demonstrated inFig. 2 and Table 2 indicate that in vitro assays using this drug may have relatively highpositive predictive accuracy. While our simulations do not yield enough resolutionto claim that the results herein answer this question, the outcome shown in Fig. 6is of interest. There is no statistical difference at the 0.01 significance level betweenimprovement obtained by permeabilization therapy in the simulated tumors (even verydense ones) and monolayer. This compares favorably with the findings of [72] in whichthe improvement obtained via cisplatin permeabilization therapy in vitro is stronglyreflected by the improvement in isolated lung perfusion in rats.
While it can and should be argued that the simulations herein fail to account for some(many!) critical aspects of tumor growth and drug response (such as clonal heteroge-neity, cell phase sensitivity, and signaling pathways) and that parameter settings mayin some cases be inexact, it should not be concluded that these shortcomings invalidatecharacteristics the simulations have revealed. Indeed, we have correctly post-dictedseveral results: that doxorubicin retention results in a more uniform AUC and cellinhibition than would otherwise be indicated by its penetration difficulties [19]; thatPgp and other transporters might facilitate drug penetration into lesion tissue [77]; thatcisplatin achieves a highly uniform AUC, and its cellular in vitro monolayer inhibitioncan closely match that of in vitro spheroids [18,32,37]; and that improvement due tocisplatin permeabilization therapy in vitro has the potential to predict improvementin vivo [72]. Through the model we have provided evidence that not only do macro-scopic environmental conditions, namely, drug and nutrient distribution heterogeneity,potentially greatly impact therapeutic efficacy, but also that the outcome of therapeuticstrategies can depend upon them in nonlinear and a priori unpredictable ways. Theresults of our third set of experiments (doxorubicin penetration therapy) provide anexample. In light of this, it would be prudent to devote attention to factors residing atcoarser and more global scales than solely the genetic.
One of our broader goals is to demonstrate how increasingly sophisticated in silicotechnology, driven by mathematical modeling and calibrated with experimental data,can and is being developed to provide an alternate investigative and clinical tool com-plementary to traditional methods [6,24,61,62,67]. It can well be imagined that weredoxorubicin and cisplatin discovered today, the in vivo simulations herein presentedcould be used to anticipate their lesion- and cellular-scale pharmacokinetics, helping torefine clinical trial design and lower costs. In clinical application, the results could beused to guide therapeutic strategy. For example, any risks associated with doxorubicinpenetration therapy could be minimized if it were known that the patient’s tumor wereexpressing Pgp or otherwise had lowered cellular uptake, according to the results givenin Fig. 5. With further development, we anticipate that in silico models and methodssimilar to those in this paper will become increasingly accurate and useful. Towardsthat end we are working on incorporating a more veridical model of vasculature alongthe lines of McDougall and Stephanou, in which blood flow plays a key role in theformation of vasculature [46,69]. We are furthermore developing 3D models, whichare proving successful at accurately simulating morphological evolution [23]. Onearea of special interest is that of liposomal and nanovectored delivery. These have
123

Predicting drug pharmacokinetics and effect in vascularized tumors 507
the potential of unprecedented accuracy and specificity of delivery [22]. It would beinteresting to adapt the PKPD model herein, paying particular attention to transportin and extravasation from blood vessels [28], to see what predictions can be made.
The power of in vitro experimentation lies in its ease of implementation whileremaining in the biological realm. By its very nature, in vitro experimentation attemptsto refine and isolate. Yet, much of what happens in vivo is the result of a nonlinearsystem whose behavior is more than the sum of its parts. The power of in silicosimulation lies in its ability to integrate components into a virtual system capable ofreproducing such behavior, implicitly taking into account circuits of information flowdifficult to explicitly analyze. Accurately calibrated and rigorously validated, suchan integrated model could provide a “dry-lab” to be used as a powerful complementto the traditional wet-lab in fundamental research, drug discovery, and the clinic.It could be used to probe scenarios and test hypotheses that are either difficult orimpossible to instantiate in the body. Results could then suggest supportive in vitroand in vivo experimentation, the end result being new therapeutic targets or strategies.Simultaneously, weaknesses (or strengths!) of the in silico model could be uncoveredand addressed. Computational models have the potential to facilitate an era of greatdiscovery and progress in understanding and treating cancer, and providing new hopeto its victims.
Acknowledgments The authors would like to thank Steve Wise (U.C. Irvine) for assistance with numericalmethods and programming, Ardith El-Kareh (U. of Arizona) for insights into the cellular pharmacokineticsand pharmacodynamics of doxorubicin and cisplatin, Hoa P. Nguyen (U.C. Irvine) for helpful discussionsregarding experimental protocols and drug response, John Fruehauf (U.C. Irvine) for suggestions andcorrections covering a broad spectrum of oncological knowledge, and the anonymous referees for theirhelpful comments.
Open Access This article is distributed under the terms of the Creative Commons Attribution Noncom-mercial License which permits any noncommercial use, distribution, and reproduction in any medium,provided the original author(s) and source are credited.
References
1. Alarcón T, Byrne H, Maini P (2003) A cellular automaton model for tumour growth in inhomogeneousenvironment. J Theor Biol 225:257–274
2. Anderson A, Chaplain M (1998) Continuous and discrete mathematical models of tumor-inducedangiogenesis. Bull Math Biol 60:857–899
3. Arancia G, Calcabrini A, Meschini S, Molinari A (1998) Intracellular distribution of anthracyclines indrug resistant cells. Cytotechnology 27:95–111
4. Araujo R, McElwain D (2004) A history of the study of solid tumour growth: the contribution ofmathematical modelling. Bull Math Biol 66:1039–1091
5. Baish J, Gazit Y, Berk D, Nozue M, Baxter L, Jain R (1996) Role of tumor vascular architecture innutrient and drug delivery: an invasion percolation-based network model. Microvasc Res 51:327–346
6. Bangs A, Paterson T (2003) Finding value in in silico biology. Biosilico 1:18–227. Bellomo N, Prezioso L (2000) Modelling and mathematical problems related to tumor evolution and
its interaction with the immune system. Math Comput Model 32:413–4528. Breward C, Byrne H, Lewis C (2003) A multiphase model describing vascular tumour growth. Bull
Math Biol 65(4):609–6409. Chaplain M (1996) Avascular growth, angiogenesis and vascular growth in solid tumors: the mathe-
matical modelling of the stages of tumour development. Math Comput Model 23:47–87
123

508 J. P. Sinek et al.
10. Chen Y, Simon S (2000) In situ biochemical demonstration that P-glycoprotein is a drug efflux pumpwith broad specificity. J Cell Biol 148:863–870
11. Cristini V, Blawzdziewicz J, Loewenberg M (2001) An adaptive mesh algorithm for evolving surfaces:simulations of drop breakup and coalescence. J Comput Phys 168:445–463
12. Cristini V, Frieboes H, Gatenby R, Caserta S, Ferrari M, Sinek J (2005) Morphologic instability andcancer invasion. Clin Cancer Res 11:6772–6779
13. Cristini V, Lowengrub JS, Nie Q (2003) Nonlinear Simulation of Tumor Growth. J Math Biol 46(3):191–224. doi:10.1007/s00285-002-0174-6
14. DeGregorio M, Lui G, Macher B, Wilbur J (1984) Uptake, metabolism, and cytotoxicity of doxorubicinin human Ewing’s sarcoma and rhabdomyosarcoma cells. Cancer Chemother Pharmacol 12:59–63
15. Demant E, Friche E (1998) Kinetics of anthracycline accumulation in multidrug-resistant tumor cells:relationship to drug lipophilicity and serum albumin binding. Biochem Pharmacol 56:1209–1217
16. Demant E, Sehested M, Jensen P (1990) A model for computer simulation of P-glycoprotein andtransmembrane delta pH-mediated anthracycline transport in multidrug-resistant tumor cells. BiochimBiophys Acta 1055:117–125
17. Dordal M, Ho A, Jackson-Stone M, Fu Y, Goolsby C, Winter J (1995) Flow cytometric assessment ofthe cellular pharmacokinetics of fluorescent drugs. Cytometry 20:307–314
18. Durand R (1986) Chemosensitivity testing in V79 spheroids: drug delivery and cellular microenviron-ment J Natl Cancer Inst 77:247–252
19. Durand R (1990) Slow penetration of anthracyclines into spheroids and tumors: a therapeutic advan-tage? Cancer Chemother Pharmacol 26:198–204
20. El-Kareh A, Secomb T (2003) A mathematical model for cisplatin cellular pharmacodynamics. Neo-plasia 5:161–169
21. El-Kareh A, Secomb T (2005) Two-mechanism peak concentration model for cellular pharmacodyna-mics of Doxorubicin. Neoplasia 7:705–713
22. Ferrari M (2005) Cancer nanotechnology: opportunities and challenges. Nat Rev Cancer 5:161–17123. Frieboes H, Lowengrub J, Wise S, Zheng X, Macklin P, Bearer E, Cristini V (2007) Computer simu-
lation of glioma growth and morphology. NeuroImage 37:S59–S7024. Frieboes H, Zheng X, Sun C, Tromberg B, Gatenby R, Cristini V (2006) An integrated computatio-
nal/experimental model of tumor invasion. Cancer Res 66:1597–160425. Frieboes HB, Sinek JP, Nalcioglu O, Fruehauf JP, Cristini V (2006) Nanotechnology in cancer drug
therapy: a biocomputational approach. In: Ferrari M, Lee AP, Lee LJ (eds) BioMEMS and biomedicalnanotechnology, vol I, Chap 15. Springer, New York, NY, pp 435–460
26. Fruehauf J (2002) In vitro assay-assisted treatment selection for women with breast or ovarian cancer.Endocr Relat Cancer 9:171–182
27. Fruehauf J, Bosanquet A (1993) In vitro determination of drug response: a discussion of clinical appli-cations. Princ Pract Oncol Updates 7:1–16
28. Gentile F, Ferrari M, Decuzzi P (2007) Transport of nanoparticles in blood vessels: the effect of vesselpermeability and blood rheology. Ann Biomed Eng 36:254–261
29. Gulledge C, Dewhirst M (1996) Tumor oxygenation: a matter of supply and demand. Anticancer Res16:741–749
30. Haroon Z, Peters KG, Greenberg CS, Dewhirst MW (1999) Angiogenesis and blood flow in solidtumors. In: Teicher B (ed) Antiangiogenic agents in cancer therapy, Chap 1. Humana Press, Totowa,NJ, pp 3–21
31. Hurwitz S, Terashima M, Mizunuma N, Slapak C (1997) Vesicular anthracycline accumulation indoxorubicin-selected U-937 cells: participation of lysosomes. Blood 89:3745–3754
32. Inoue S, Holland JF, Wasserman L (1985) Susceptibility of multicellular tumor spheroids (MTS) todoxorubicin (DXR) and cisplatin. Proc Am Assoc Cancer Res 26:341
33. Jackson T (2003) Intracellular accumulation and mechanism of action of doxorubicin in a spatio-temporal tumor model. J Theor Biol 220:201–213
34. Jain R (2001) Delivery of molecular medicine to solid tumors: lessons from in vivo imaging of geneexpression and function. J Control Release 74:7–25
35. Jekunen A, Shalinsky D, Hom D, Albright K, Heath D, Howell S (1993) Modulation of cisplatincytotoxicity by permeabilization of the plasma membrane by digitonin in vitro. Biochem Pharmacol45:2079–2085
36. Jiang Y, Pjesivac-Grbovic J, Cantrell C, Freyer J (2005) A multiscale model for avascular tumor growth.Biophys J 89:3884–3894
123

Predicting drug pharmacokinetics and effect in vascularized tumors 509
37. Kohno N, Ohnuma T, Kaneko M, Holland J (1988) Interactions of doxorubicin and cis-platin in squa-mous carcinoma cells in culture. Br J Cancer 58:330–334
38. Kohno N, Ohnuma T, Truog P (1994) Effects of hyaluronidase on doxorubicin penetration into squa-mous carcinoma multicellular tumor spheroids and its cell lethality. J Cancer Res Clin Oncol 120:293–297
39. Kunkel P, Ulbricht U, Bohlen P, Brockmann M, Fillbrandt R, Stavrou D, Westphal M, Lamszus K(2001) Inhibition of glioma angiogenesis and growth in vivo by systemic treatment with a monoclonalantibody against vascular endothelial growth factor receptor-2. Cancer Res 61:6624–6628
40. Lankelma J, Dekker H, Luque F, Luykx S, Hoekman K, van der Valk P, van Diest P, Pinedo H (1999)Doxorubicin gradients in human breast cancer. Clin Cancer Res 5:1703–1707
41. Lee A (1987) Coordinated regulation of a set of genes by glucose and calcium ionophores in mamma-lian cells. Trends Biochem Sci 12:20–23
42. Levasseur L, Faessel H, Slocum H, Greco W (1998) Implications for clinical pharmacodynamic studiesof the statistical characterization of an in vitro antiproliferation assay. J Pharmacokinet Biopharm26:717–733
43. Macklin P, Lowengrub J (2005) Evolving interfaces via gradients of geometry-dependent interior Pois-son problems: application to tumor growth. J Comput Phys 203:191–220
44. Macklin P, Lowengrub J (2006) An improved geometry-aware curvature discretization for level setmethods: application to tumor growth. J Comput Phys 215:392–401
45. Macklin P, Lowengrub J (2007) Nonlinear simulation of the effect of microenvironment on tumorgrowth. J Theor Biol 245:677–704
46. McDougall S, Anderson A, Chaplain M (2006) Mathematical modelling of dynamic adaptivetumour-induced angiogenesis: clinical implications and therapeutic targeting strategies. J Theor Biol241:564–589
47. McDougall S, Anderson A, Chaplain M, Sherratt J (2002) Mathematical modelling of flow throughvascular networks: implications for tumour-induced angiogenesis and chemotherapy strategies. BullMath Biol 64:673–702
48. McGhee J, von Hippel P (1974) Theoretical aspects of DNA–protein interactions: co-operative andnon-co-operative binding of large ligands to a one-dimensional homogeneous lattice. J Mol Biol86:469–489
49. Mellor H, Ferguson D, Callaghan R (2005) A model of quiescent tumour microregions for evaluatingmulticellular resistance to chemotherapeutic drugs. Br J Cancer 93:302–309
50. Minchinton A, Tannock I (2006) Drug penetration in solid tumors. Nat Rev Cancer 6:583–59251. Mueller-Klieser W (1984) Microelectrode measurement of oxygen tension distributions in multicellu-
lar spheroids cultured in spinner flasks. Recent Results Cancer Res 95:134–14952. Norris ES, King JR, Byrne HM (2006) Modelling the response of spatially structured tumours to
chemotherapy: drug kinetics. Math Comput Model 43:820–83753. Nugent L, Jain R (1984) Extravascular diffusion in normal and neoplastic tissues. Cancer Res
44:238–24454. Padera T, Stoll B, Tooredman J, Capen D, di Tomaso E, Jain R (2004) Pathology: cancer cells compress
intratumour vessels. Nature 427:69555. Pennacchietti S, Michieli P, Galluzzo M, Mazzone M, Giordano S, Comoglio P (2003) Hypoxia pro-
motes invasive growth by transcriptional activation of the met protooncogene. Cancer Cell 3:347–36156. Please CP, Pettet G, McElwain DLS (1998) A new approach to modelling the formation of necrotic
regions in tumours. Appl Math Lett 11:89–9457. Primeau A, Rendon A, Hedley D, Lilge L, Tannock I (2005) The distribution of the anticancer drug
doxorubicin in relation to blood vessels in solid tumors. Clin Cancer Res 11:8782–878858. Qu X, Wan C, Becker H, Zhong D, Zewail A (2001) The anticancer drug–DNA complex: femtosecond
primary dynamics for anthracycline antibiotics function. Proc Natl Acad Sci USA 98:14212–1421759. Rizzo V, Sacchi N, Menozzi M (1989) Kinetic studies of anthracycline–DNA interaction by fluores-
cence stopped flow confirm a complex association mechanism. Biochemistry 28:274–28260. Sadowitz P, Hubbard B, Dabrowiak J, Goodisman J, Tacka K, Aktas M, Cunningham M, Dubowy R,
Souid A (2002) Kinetics of cisplatin binding to cellular DNA and modulations by thiol-blocking agentsand thiol drugs. Drug Metab Dispos 30:183–190
61. Sanga S, Frieboes H, Zheng X, Gatenby R, Bearer E, Cristini V (2007) Predictive oncology: a reviewof multidisciplinary, multiscale in silico modeling linking phenotype, morphology and growth. Neu-roimage 37(Suppl 1):S120–134
123
510 J. P. Sinek et al.
62. Sanga S, Sinek J, Frieboes H, Ferrari M, Fruehauf J, Cristini V (2006) Mathematical modeling ofcancer progression and response to chemotherapy. Expert Rev Anticancer Ther 6:1361–1376
63. Shannon A, Bouchier-Hayes D, Condron C, Toomey D (2003) Tumour hypoxia, chemotherapeuticresistance and hypoxia-related therapies. Cancer Treat Rev 29:297–307
64. Shen J, Subjeck J, Lock R, Ross W (1989) Depletion of topoisomerase II in isolated nuclei during aglucose-regulated stress response. Mol Cell Biol 9:3284–3291
65. Simon S, Schindler M (1994) Cell biological mechanisms of multidrug resistance in tumors. Proc NatlAcad Sci USA 91:3497–3504
66. Sinek J, Frieboes H, Zheng X, Cristini V (2004) Two-dimensional chemotherapy simulationsdemonstrate fundamental transport and tumor response limitations involving nanoparticles. BiomedMicrodevices 6:297–309
67. Sinek JP, Frieboes HB, Sivaraman B, Sanga S, Cristini V (2006) Mathematical and computationalmodeling: towards the development of nanodevices for drug delivery. In: Kumar, Challa SSR (eds)Nanotechnologies for the life sciences vol 4: Nanodevices for the life sciences, Chap 2. Wiley, Germany,pp 29–66
68. Siu W, Arooz T, Poon R (1999) Differential responses of proliferating versus quiescent cells to adria-mycin. Exp Cell Res 250:131–141
69. Stéphanou A, McDougall S, Anderson A, Chaplain M (2006) Mathematical modelling of the influenceof blood rheological properties upon adaptive tumour-induced angiogenesis. Math Comput Model44:96–123
70. Swabb E, Wei J, Gullino P (1974) Diffusion and convection in normal and neoplastic tissues. CancerRes 34:2814–2822
71. Takemura Y, Kobayashi H, Miyachi H, Hayashi K, Sekiguchi S, Ohnuma T (1991) The influence oftumor cell density on cellular accumulation of doxorubicin or cisplatin in vitro. Cancer ChemotherPharmacol 27:417–422
72. Tanaka T, Kaneda Y, Li T, Matsuoka T, Zempo N, Esato K (2001) Digitonin enhances the antitumoreffect of cisplatin during isolated lung perfusion. Ann Thorac Surg 72:1173–1178
73. Tannock I, Lee C, Tunggal J, Cowan D, Egorin M (2002) Limited penetration of anticancer drugsthrough tumor tissue: a potential cause of resistance of solid tumors to chemotherapy. Clin Cancer Res8:878–884
74. Tarasiuk J, Frézard F, Garnier-Suillerot A, Gattegno L (1989) Anthracycline incorporation in humanlymphocytes. Kinetics of uptake and nuclear concentration. Biochim Biophys Acta 1013:109–117
75. Teicher BA, Herman TS, Holden SA, Wang YY, Pfeffer MR, Crawford JW, Frei E (1990) Tumorresistance to alkylating agents conferred by mechanisms operative only in vivo. Science 247:1457–1461
76. Troger V, Fischel J, Formento P, Gioanni J, Milano G (1992) Effects of prolonged exposure to cisplatinon cytotoxicity and intracellular drug concentration. Eur J Cancer 28:82–86
77. Tunggal J, Melo T, Ballinger J, Tannock I (2000) The influence of expression of p-glycoprotein on thepenetration of anticancer drugs through multicellular layers. Int J Cancer 86:101–107
78. Tyson R, Stern L, LeVeque R (2000) Fractional step methods applied to a chemotaxis model. J MathBiol 41:455–475
79. Wang D, Lippard S (2005) Cellular processing of platinum anticancer drugs. Nat Rev Drug Discov4:307–320
80. Ward J, King J (2003) Mathematical modelling of drug transport in tumour multicell spheroids andmonolayer cultures. Math Biosci 181:177–207
81. Zheng J, Chen C, Au J, Wientjes M (2001) Time- and concentration-dependent penetration of doxo-rubicin in prostate tumors. AAPS PharmSci 3:E15
82. Zheng X, Wise S, Cristini V (2005) Nonlinear simulation of tumor necrosis, neo-vascularization andtissue invasion via an adaptive finite-element/level-set method. Bull Math Biol 67:211–259
123