Accuracy of coarse-scale land quality maps as a function of the upscaling procedure used for soil...
20
Accuracy of coarse-scale land quality maps as a function of the upscaling procedure used for soil data Volker Hennings Federal Institute for Geosciences and Natural Resources, Stilleweg 2, 30655 Hannover, Germany Received 3 April 2000; accepted 24 September 2001 Abstract A thoroughly investigated study area in Northern Germany was used to determine the accuracy of coarse-scale land quality maps (1:200,000 and 1:1,000,000), and to evaluate possible improvements by applying different upscaling procedures on fine-scale soil data (1:5000). The land quality chosen for this investigation was the mean annual groundwater recharge rate, obtained by a deterministic simulation model of the soil water balance. Three versions of soil maps were compared and evaluated: the existing soil maps versus new soil maps, created by selecting region-specific soil profiles without changing the boundaries of the existing map units or created by direct aggregation of map units. In the study area, characterized mainly by glacial deposits, the taxonomic criterion of the upscaling proce- dure is irrelevant for the accuracy of land quality maps at the 1:1,000,000 scale. The results can be used to divide the total error into two parts: at the 1:200,000 and 1:1,000,000 scale, about 75% of the error is caused by soil spatial variability and cannot be avoided at these scales; the remaining 25% indicate the degree of uncertainty that is caused by the mapping or upscaling procedure and can be eliminated to produce ‘‘best-possible maps’’. D 2002 Elsevier Science B.V. All rights reserved. Keywords: Aggregation; Soil maps; Spatial variability; Upscaling 1. Introduction 1.1. Translating information on soil characteristics and qualities across different spatial scales Each of the soil-forming factors acts over a certain spatial scale, and within each soil- forming factor there can be many spatial scales of interaction. Burrough (1983a) was one 0016-7061/02/$ - see front matter D 2002 Elsevier Science B.V. All rights reserved. PII:S0016-7061(01)00148-3 E-mail address: [email protected] (V. Hennings). www.elsevier.com/locate/geoderma Geoderma 107 (2002) 177 – 196
Transcript of Accuracy of coarse-scale land quality maps as a function of the upscaling procedure used for soil...
Accuracy of coarse-scale land quality maps as a
function of the upscaling procedure used for soil data
Volker Hennings
Federal Institute for Geosciences and Natural Resources, Stilleweg 2, 30655 Hannover, Germany
Received 3 April 2000; accepted 24 September 2001
Abstract
A thoroughly investigated study area in Northern Germany was used to determine the accuracy of
coarse-scale land quality maps (1:200,000 and 1:1,000,000), and to evaluate possible improvements
by applying different upscaling procedures on fine-scale soil data (1:5000). The land quality chosen
for this investigation was the mean annual groundwater recharge rate, obtained by a deterministic
simulation model of the soil water balance. Three versions of soil maps were compared and evaluated:
the existing soil maps versus new soil maps, created by selecting region-specific soil profiles without
changing the boundaries of the existing map units or created by direct aggregation of map units. In the
study area, characterized mainly by glacial deposits, the taxonomic criterion of the upscaling proce-
dure is irrelevant for the accuracy of land quality maps at the 1:1,000,000 scale. The results can be
used to divide the total error into two parts: at the 1:200,000 and 1:1,000,000 scale, about 75% of the
error is caused by soil spatial variability and cannot be avoided at these scales; the remaining 25%
indicate the degree of uncertainty that is caused by the mapping or upscaling procedure and can be
eliminated to produce ‘‘best-possible maps’’. D 2002 Elsevier Science B.V. All rights reserved.
Keywords: Aggregation; Soil maps; Spatial variability; Upscaling
1. Introduction
1.1. Translating information on soil characteristics and qualities across different spatial
scales
Each of the soil-forming factors acts over a certain spatial scale, and within each soil-
forming factor there can be many spatial scales of interaction. Burrough (1983a) was one
0016-7061/02/$ - see front matter D 2002 Elsevier Science B.V. All rights reserved.
PII: S0016 -7061 (01 )00148 -3
E-mail address: [email protected] (V. Hennings).
www.elsevier.com/locate/geoderma
Geoderma 107 (2002) 177–196
of the first soil scientists to use general models to describe the superimposed effects of
spatial variations in soils on the basis of published data. He compared fragments of soil
maps over several scales whereby each area drawn at a finer scale is nested within those
drawn at the coarser scales. One of his conclusions (Burrough, 1983b) was that ‘‘the detail
resolved is partly due to the scale of variation present, and partly to the resolving power of
the map at the given scale’’. Besides these comparisons of maps showing basic, easily
mappable soil characteristics, similar studies have focussed on more complex soil pro-
perties or land qualities obtained by simulation models: Bregt (1989) evaluated the
reliability of soil-moisture-deficit predictions at different scales. Wilson et al. (1996) used
various sets of soil and climate data to evaluate the impact of the resolution of the input
data from maps on model predictions of pesticide leaching. Variogram models at regional,
county and field scales, using soil salinity as an example, have been presented by Odeh
et al. (1998). However, there is little data and few geostatistical studies on soil and land
attributes over many scales. Only a few authors have observed nested behaviour when two
hierarchical scales are included (McBratney, 1992). McBratney (1998) concluded that the
sill variances seen on most variograms are simply a function of the geometric support and
the finite size of the region sampled.
1.2. Compilation of coarse-scale land quality maps in Germany
Soil protection or conservation decisions cannot be made without maps of land qualities,
such as retention capacity for heavy metals, vulnerability to erosion by water, and ground-
water recharge. The relevant decision-makers are more interested in the accuracy of these
land qualitymaps than of the corresponding soil maps. For this reason, when the reliability of
the results of a soil survey is evaluated, the priority interest is not on the purity of the soil map
units, but on errors in the land quality assessment based on existing soil maps. In this paper,
‘‘scale’’ is used depending on the degree of spatial resolution; ‘‘coarse scale’’ means ‘‘upper
scale’’ (1:1,000,000) and refers to a map covering a large area while ‘‘fine scale’’ means
‘‘lower scale’’ and refers to a map at the field or farm level.
The Federal Institute for Geosciences and Natural Resources (BGR) is preparing
nationwide land quality maps e.g., for the new Hydrological Atlas of Germany (HAD),
commissioned by the Ministry for the Environment as a tool to support its soil protection
policies (Bundesministerium fur Umwelt, 2000). For this reason BGR is involved in sev-
eral projects designed to assess the reliability of maps of this kind. On a national scale, the
main objective of such maps is not to provide a highly accurate, site-specific assessment of
the functions or vulnerabilities of the soil but to provide an estimate of the proportion of
the country affected by soil degradation or endowed with land qualities such as high re-
tention capacity for pollutants or a high agricultural yield potential. Current examples are
maps for the HAD project showing the plant-available water capacity in the root zone or
mean annual groundwater recharge.
In Germany, the state soil surveys are responsible for soil mapping and for publishing
soil maps at the 1:25,000 and 1:50,000 scale. All nationwide thematic maps are based on
the 1:1,000,000 Soil Map of Germany (BUK 1000) (Hartwich et al., 1995), which uses 72
map units. Since more detailed soil maps cover only about 35% of the country (Zitzmann,
1994), the 1:1,000,000 map could not be compiled by generalization of fine-scale map
V. Hennings / Geoderma 107 (2002) 177–196178
units and is not the result of an inductive upscaling procedure. Instead of using data from
soil survey institutions, this map is based mostly on expert knowledge about soil-forming
factors. The 1:1,000,000 Soil Map of Germany was compiled using a more or less de-
ductive procedure in which the available geological maps are interpreted. In this pro-
cedure, many soil map units were created by simply relabelling geological map units.
Because methodology and scale of a routine soil survey differ from one state to another,
this status has practical consequences for the 1:1,000,000 soil map:
� The accuracy or reliability of this map is unknown.� The potential for further improvements differs depending on the availability of fine-
scale maps.� When more fine-scale soil maps are completed during the next several years, BGR
will have to check and improve the master 1:1,000,000 soil map by upscaling the
available soil data. This demonstrates the need for an effective upscaling approach
and rule-based algorithms that are suitable for computerised map compilation.
1.3. Objectives of this study
The map compilation methodology of the master 1:1,000,000 soil map of Germany
(BUK 1000) described above and the user’s request for quantitative information on the
reliability of a soil survey institution’s products, require investigations on the accuracy of
coarse-scale land quality maps in selected areas. For that reason a study was carried out
with the aim of covering the following issues.
bThe accuracy of coarse-scale land quality maps, based on BUK 1000, had to be
examined for an area where detailed soil mapping results of full coverage are available
over several scales.
bBecause groundwater recharge is the theme of one of the next HAD maps, this land
quality was chosen for this study.
bSoil data at the 1:5000 scale serve as reference, regardless of any unknown internal
variability of the mapping units referred to. Based on these assumptions, soil-mapping
units at the 1:5000 scale are regarded as completely homogeneous and spatial variability of
soil hydraulic parameters below the field or plot level is neglected.
Four questions were formulated for the study presented here:
� What degree of accuracy is obtained at a given scale if land-quality maps are
derived directly from existing soil maps (1:25,000, 1:200,000, and 1:1,000,000)
without any modification of their boundaries and ‘‘typical profiles’’?� Is it possible to improve the accuracy of these land quality maps if they are based on
alternative soil maps created by selecting region-specific soil profiles without
changing the boundaries of the existing map units?� Is it possible to improve the accuracy of these land quality maps if they are based on
alternative soil maps created by direct aggregation of finer-scale map units?� What degree of uncertainty is caused by soil spatial variability and has to be accepted
as a scale-specific error, and what degree of uncertainty is caused by the mapping or
upscaling procedure and can be eliminated to produce ‘‘best-possible maps’’?
V. Hennings / Geoderma 107 (2002) 177–196 179
2. Materials and methods
2.1. Study area, available soil maps and groundwater recharge determination
This investigation covers the following aspects:
� comparison of soil maps at four scales: 1:5000 (DGK 5 Bo), 1:25,000 (BK 25),
1:200,000 (BSK 200) and 1:1,000,000 (BUK 1000);� a thorough investigation of a selected area, the ‘‘Vechta’’ sheet of the 1:25,000 Soil
Map of Lower Saxony (Benne, 1997), which covers 100 km2;� the land quality under consideration is the mean annual groundwater recharge,
defined as the mean annual seepage rate from the soil;� the 1:5000 map serves as reference.
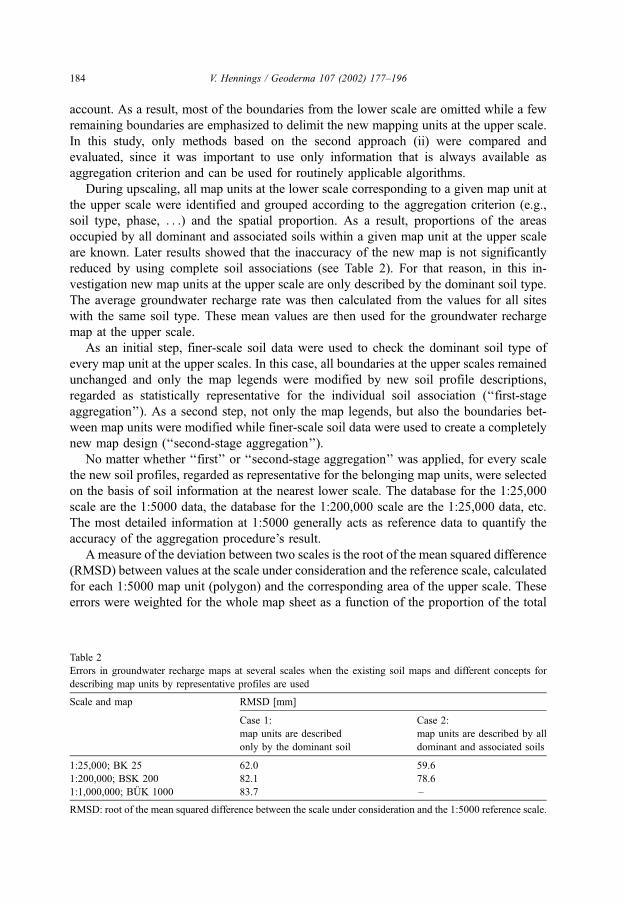
The study area is located in western Lower Saxony (Fig. 1), the northwestern federal
state of Germany. The northern part of the area consists mainly of glacial deposits
covered by sandy loess, the southern part consists mainly of fluvial deposits and soils
with a high water table occur locally. This area was chosen because its soils cover a broad
range of parent materials, the water table varies in depth, and, because the 1:25,000
Vechta sheet was recently mapped, a digital database is available for all scales. Local soils
were classified as Podzoluvisols, Spodo-Stagnic Cambisols, Haplic Podzols and Fluvi-
sols.
The 1:25,000 soil map (BK 25) is the product of the routine soil survey of Lower
Saxony. This map is not the result of conventional mapping techniques, characterized by
about 3000–4000 auger drillings per map sheet or 30–40 drillings per km2. During the
early 1980s, new methods were developed in order to minimize fieldwork and to facilitate
direct interpretation of the soil type from digital data on soil-forming factors such as
geology, relief and land use over the last few centuries (spatial models for prediction of
soil types). The data with the greatest potential for soil type interpretation are the soil
assessment data at 1:5000 that constitute a ‘‘soil digital database’’, containing 150–300
profile descriptions for each sheet from the 1:5000 map. Before they can be used for
further interpretations, the soil assessment data have to be translated into the soil science
terminology by a special computer program. After these data and information from other
sources (e.g., geology, relief and historical land use) have been incorporated into a central
database and GIS system, the spatial prediction model can be run. The result is a
‘‘conceptional soil map’’ that can be used by the soil scientist as basic information at
the beginning of fieldwork. To draw boundaries at the 1:25,000 scale, he needs only 15–
30 additional auger drillings. When the local sheet of the 1:25,000 soil map is finished, the
profile descriptions at 1:5000 are checked to eliminate translation and interpretation
failures of the soil assessment data. At the end there is a new and retrospectively corrected
‘‘soil digital database’’ containing the most detailed information of the Lower Saxony Soil
Information System. These data act as reference values for all further validations of the
aggregation procedures applied for this study.
The 1:200,000 soil map of Lower Saxony (BSK 200) (Luders and Oelkers, 1975) was
compiled during the seventies and is mostly a pedological interpretation of the available
V. Hennings / Geoderma 107 (2002) 177–196180
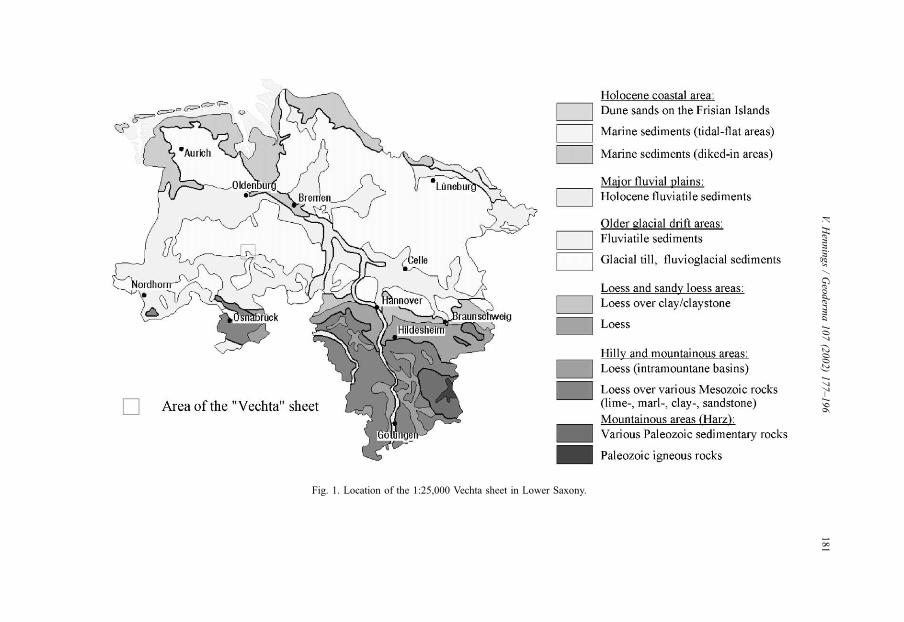
Fig. 1. Location of the 1:25,000 Vechta sheet in Lower Saxony.
V.Hennings/Geoderm
a107(2002)177–196
181
geological maps. Additionally, information about agroclimatic conditions was used to
subdivide Lower Saxony into soil landscapes.
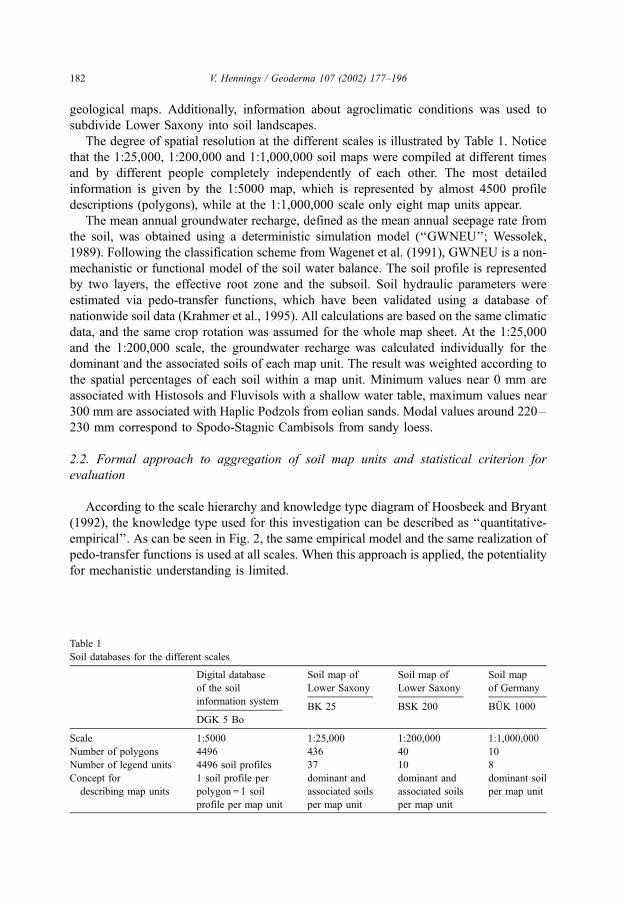
The degree of spatial resolution at the different scales is illustrated by Table 1. Notice
that the 1:25,000, 1:200,000 and 1:1,000,000 soil maps were compiled at different times
and by different people completely independently of each other. The most detailed
information is given by the 1:5000 map, which is represented by almost 4500 profile
descriptions (polygons), while at the 1:1,000,000 scale only eight map units appear.
The mean annual groundwater recharge, defined as the mean annual seepage rate from
the soil, was obtained using a deterministic simulation model (‘‘GWNEU’’; Wessolek,
1989). Following the classification scheme from Wagenet et al. (1991), GWNEU is a non-
mechanistic or functional model of the soil water balance. The soil profile is represented
by two layers, the effective root zone and the subsoil. Soil hydraulic parameters were
estimated via pedo-transfer functions, which have been validated using a database of
nationwide soil data (Krahmer et al., 1995). All calculations are based on the same climatic
data, and the same crop rotation was assumed for the whole map sheet. At the 1:25,000
and the 1:200,000 scale, the groundwater recharge was calculated individually for the
dominant and the associated soils of each map unit. The result was weighted according to
the spatial percentages of each soil within a map unit. Minimum values near 0 mm are
associated with Histosols and Fluvisols with a shallow water table, maximum values near
300 mm are associated with Haplic Podzols from eolian sands. Modal values around 220–
230 mm correspond to Spodo-Stagnic Cambisols from sandy loess.
2.2. Formal approach to aggregation of soil map units and statistical criterion for
evaluation
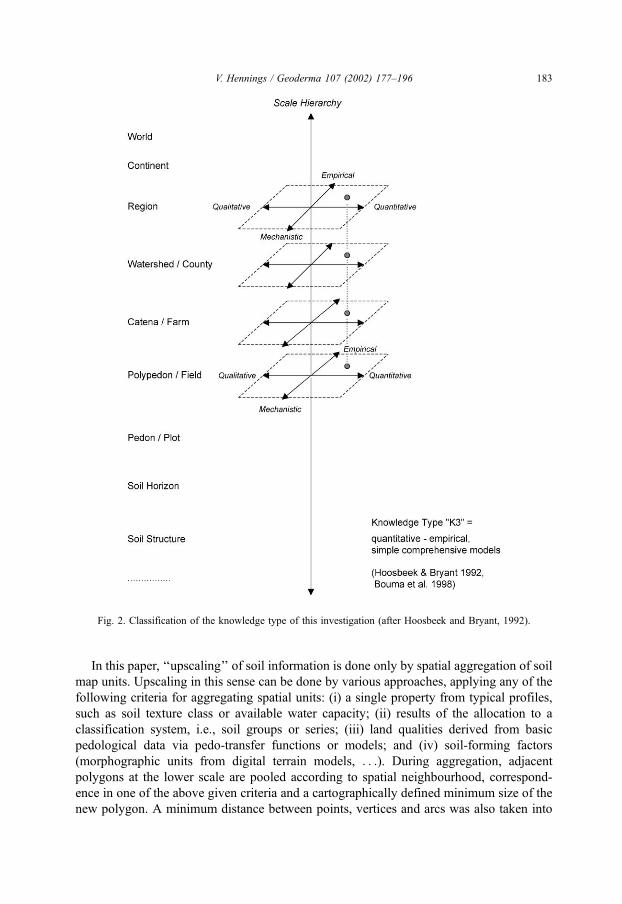
According to the scale hierarchy and knowledge type diagram of Hoosbeek and Bryant
(1992), the knowledge type used for this investigation can be described as ‘‘quantitative-
empirical’’. As can be seen in Fig. 2, the same empirical model and the same realization of
pedo-transfer functions is used at all scales. When this approach is applied, the potentiality
for mechanistic understanding is limited.
Table 1
Soil databases for the different scales
Digital database
of the soil
Soil map of
Lower Saxony
Soil map of
Lower Saxony
Soil map
of Germany
information system
DGK 5 Bo
BK 25 BSK 200 BUK 1000
Scale 1:5000 1:25,000 1:200,000 1:1,000,000
Number of polygons 4496 436 40 10
Number of legend units 4496 soil profiles 37 10 8
Concept for
describing map units
1 soil profile per
polygon = 1 soil
profile per map unit
dominant and
associated soils
per map unit
dominant and
associated soils
per map unit
dominant soil
per map unit
V. Hennings / Geoderma 107 (2002) 177–196182
In this paper, ‘‘upscaling’’ of soil information is done only by spatial aggregation of soil
map units. Upscaling in this sense can be done by various approaches, applying any of the
following criteria for aggregating spatial units: (i) a single property from typical profiles,
such as soil texture class or available water capacity; (ii) results of the allocation to a
classification system, i.e., soil groups or series; (iii) land qualities derived from basic
pedological data via pedo-transfer functions or models; and (iv) soil-forming factors
(morphographic units from digital terrain models, . . .). During aggregation, adjacent
polygons at the lower scale are pooled according to spatial neighbourhood, correspond-
ence in one of the above given criteria and a cartographically defined minimum size of the
new polygon. A minimum distance between points, vertices and arcs was also taken into
Fig. 2. Classification of the knowledge type of this investigation (after Hoosbeek and Bryant, 1992).
V. Hennings / Geoderma 107 (2002) 177–196 183
account. As a result, most of the boundaries from the lower scale are omitted while a few
remaining boundaries are emphasized to delimit the new mapping units at the upper scale.
In this study, only methods based on the second approach (ii) were compared and
evaluated, since it was important to use only information that is always available as
aggregation criterion and can be used for routinely applicable algorithms.
During upscaling, all map units at the lower scale corresponding to a given map unit at
the upper scale were identified and grouped according to the aggregation criterion (e.g.,
soil type, phase, . . .) and the spatial proportion. As a result, proportions of the areas
occupied by all dominant and associated soils within a given map unit at the upper scale
are known. Later results showed that the inaccuracy of the new map is not significantly
reduced by using complete soil associations (see Table 2). For that reason, in this in-
vestigation new map units at the upper scale are only described by the dominant soil type.
The average groundwater recharge rate was then calculated from the values for all sites
with the same soil type. These mean values are then used for the groundwater recharge
map at the upper scale.
As an initial step, finer-scale soil data were used to check the dominant soil type of
every map unit at the upper scales. In this case, all boundaries at the upper scales remained
unchanged and only the map legends were modified by new soil profile descriptions,
regarded as statistically representative for the individual soil association (‘‘first-stage
aggregation’’). As a second step, not only the map legends, but also the boundaries bet-
ween map units were modified while finer-scale soil data were used to create a completely
new map design (‘‘second-stage aggregation’’).
No matter whether ‘‘first’’ or ‘‘second-stage aggregation’’ was applied, for every scale
the new soil profiles, regarded as representative for the belonging map units, were selected
on the basis of soil information at the nearest lower scale. The database for the 1:25,000
scale are the 1:5000 data, the database for the 1:200,000 scale are the 1:25,000 data, etc.
The most detailed information at 1:5000 generally acts as reference data to quantify the
accuracy of the aggregation procedure’s result.
A measure of the deviation between two scales is the root of the mean squared difference
(RMSD) between values at the scale under consideration and the reference scale, calculated
for each 1:5000 map unit (polygon) and the corresponding area of the upper scale. These
errors were weighted for the whole map sheet as a function of the proportion of the total
Table 2
Errors in groundwater recharge maps at several scales when the existing soil maps and different concepts for
describing map units by representative profiles are used
Scale and map RMSD [mm]
Case 1:
map units are described
only by the dominant soil
Case 2:
map units are described by all
dominant and associated soils
1:25,000; BK 25 62.0 59.6
1:200,000; BSK 200 82.1 78.6
1:1,000,000; BUK 1000 83.7 –
RMSD: root of the mean squared difference between the scale under consideration and the 1:5000 reference scale.
V. Hennings / Geoderma 107 (2002) 177–196184
area occupied by the map unit and averaged. When the deviation between two scales is
measured for every 1:5000 polygon, the huge number of single results can also be used for
more detailed interpretations, e.g., to calculate mean errors as a function of soil type, parent
material, etc. (Table 3). Because the main objective of this study were comparisons of dif-
ferent upscaling techniques, the RMSD measure as a global criterion was favoured for
obtaining one averaged result for the whole map sheet.
3. Evaluation of small-scale land quality maps
3.1. Results using existing soil maps
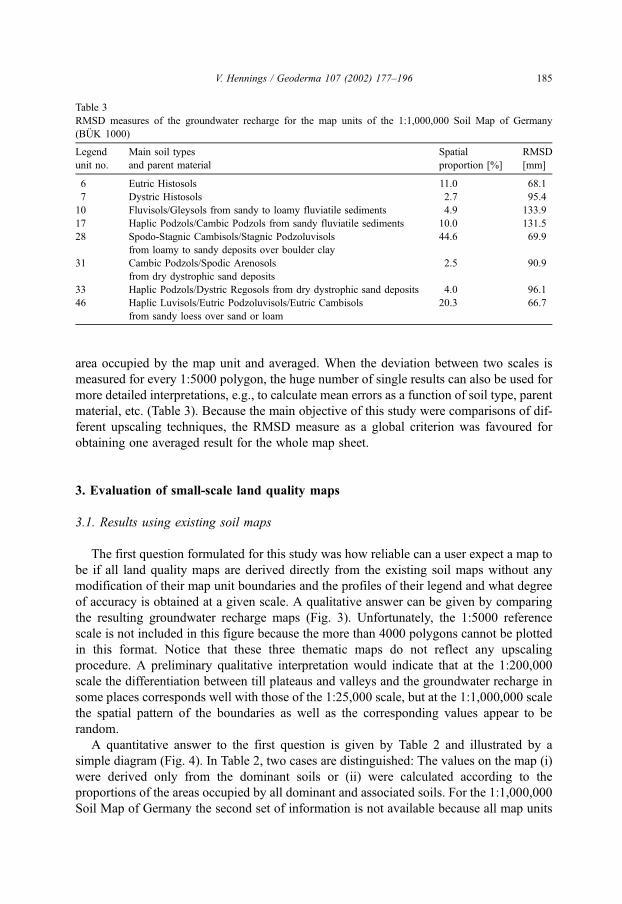
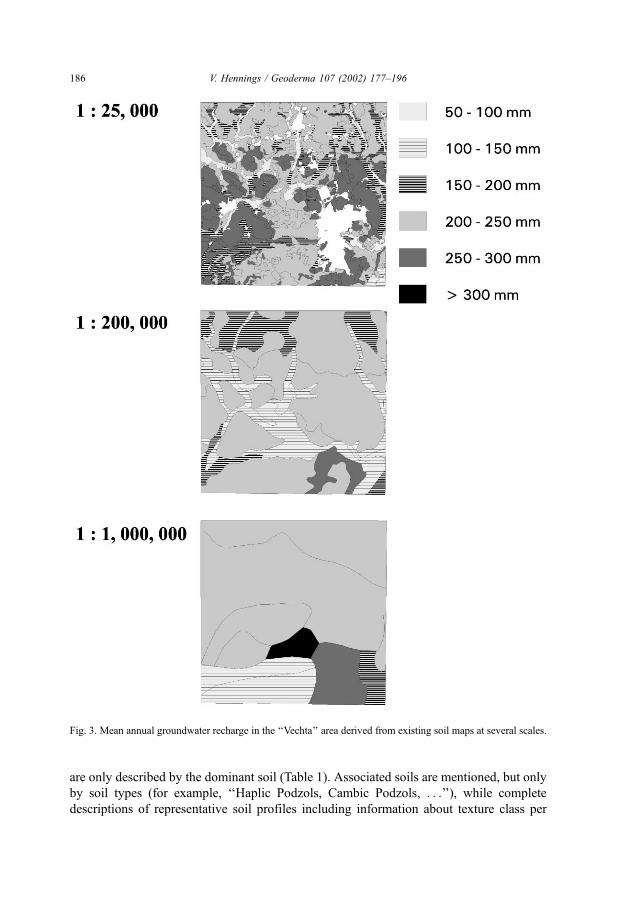
The first question formulated for this study was how reliable can a user expect a map to
be if all land quality maps are derived directly from the existing soil maps without any
modification of their map unit boundaries and the profiles of their legend and what degree
of accuracy is obtained at a given scale. A qualitative answer can be given by comparing
the resulting groundwater recharge maps (Fig. 3). Unfortunately, the 1:5000 reference
scale is not included in this figure because the more than 4000 polygons cannot be plotted
in this format. Notice that these three thematic maps do not reflect any upscaling
procedure. A preliminary qualitative interpretation would indicate that at the 1:200,000
scale the differentiation between till plateaus and valleys and the groundwater recharge in
some places corresponds well with those of the 1:25,000 scale, but at the 1:1,000,000 scale
the spatial pattern of the boundaries as well as the corresponding values appear to be
random.
A quantitative answer to the first question is given by Table 2 and illustrated by a
simple diagram (Fig. 4). In Table 2, two cases are distinguished: The values on the map (i)
were derived only from the dominant soils or (ii) were calculated according to the
proportions of the areas occupied by all dominant and associated soils. For the 1:1,000,000
Soil Map of Germany the second set of information is not available because all map units
Table 3
RMSD measures of the groundwater recharge for the map units of the 1:1,000,000 Soil Map of Germany
(BUK 1000)
Legend
unit no.
Main soil types
and parent material
Spatial
proportion [%]
RMSD
[mm]
6 Eutric Histosols 11.0 68.1
7 Dystric Histosols 2.7 95.4
10 Fluvisols/Gleysols from sandy to loamy fluviatile sediments 4.9 133.9
17 Haplic Podzols/Cambic Podzols from sandy fluviatile sediments 10.0 131.5
28 Spodo-Stagnic Cambisols/Stagnic Podzoluvisols
from loamy to sandy deposits over boulder clay
44.6 69.9
31 Cambic Podzols/Spodic Arenosols
from dry dystrophic sand deposits
2.5 90.9
33 Haplic Podzols/Dystric Regosols from dry dystrophic sand deposits 4.0 96.1
46 Haplic Luvisols/Eutric Podzoluvisols/Eutric Cambisols
from sandy loess over sand or loam
20.3 66.7
V. Hennings / Geoderma 107 (2002) 177–196 185
are only described by the dominant soil (Table 1). Associated soils are mentioned, but only
by soil types (for example, ‘‘Haplic Podzols, Cambic Podzols, . . .’’), while complete
descriptions of representative soil profiles including information about texture class per
Fig. 3. Mean annual groundwater recharge in the ‘‘Vechta’’ area derived from existing soil maps at several scales.
V. Hennings / Geoderma 107 (2002) 177–196186
horizon, etc., are missing. The two concepts, compared in Table 2, lead to similar results.
The error is not significantly reduced by using complete soil associations to describe map
units and is therefore not worthwhile. A initial explanation for this fact has to stress that all
members of a complete soil association differ only in soil type or details of a genetically
based classification system. In general, proportions of the areas occupied by soils with a
shallow water table are underestimated at upper scales. A second possible explanation will
be given in Section 4.
Table 3 lists RMSD values which were calculated grouping the deviations of ground-
water recharge by the legend unit of the 1:1,000,000 soil map. Compared to the RMSD for
the whole map sheet (Table 2), results range from 66.7 mm (legend unit no. 46) to 133.9
mm (legend unit no. 10). Table 3 shows that the 1:1,000,000 groundwater recharge map
provides the most reliable information for soils developed from boulder clay or glacial
deposits covered by sandy loess. Its accuracy is deteriorating in areas characterized by
fluviatile sediments and changing water tables. But even the lowest RMSD result is close
to the mean value for the whole investigation area. This indicates that at the 1:1,000,000
scale, the accuracy of a land quality map is mainly dependent on internal soil spatial
variability within soil map units.
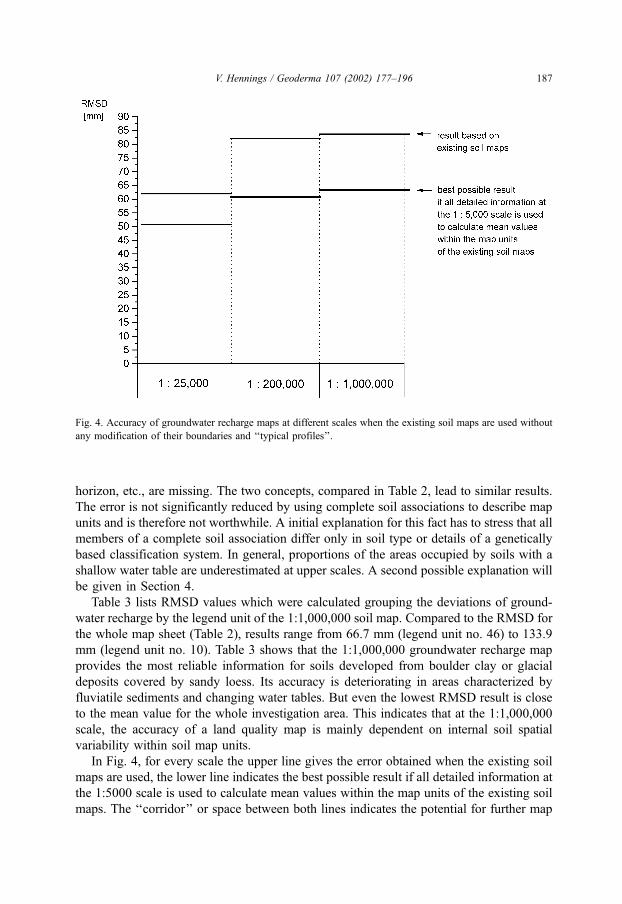
In Fig. 4, for every scale the upper line gives the error obtained when the existing soil
maps are used, the lower line indicates the best possible result if all detailed information at
the 1:5000 scale is used to calculate mean values within the map units of the existing soil
maps. The ‘‘corridor’’ or space between both lines indicates the potential for further map
Fig. 4. Accuracy of groundwater recharge maps at different scales when the existing soil maps are used without
any modification of their boundaries and ‘‘typical profiles’’.
V. Hennings / Geoderma 107 (2002) 177–196 187
improvements by alternative compilation strategies. Four conclusions can be derived from
this figure:
� The root of the mean squared difference of the groundwater recharge data relative to
the detailed data at the 1:5000 scale increases from 62 mm at 1:25,000 to 84 mm at
1:1,000,000.� The accuracy of a groundwater recharge map at the 1:25,000 scale cannot be
improved significantly by alternative concepts.� Both maps at the upper scales seem to be equivalent with regard to their accuracy.� The results can be used to divide the total error into two parts: At the 1:1,000,000
scale about 75% of the error (63/84 mm) is caused by soil spatial variability; the
remaining 25% indicate the degree of uncertainty that is caused by the map
compilation procedure and can be eliminated to produce ‘‘best-possible maps’’.
3.2. Results obtained using alternative soil maps created by selecting region-specific soil
profiles
The second question was whether it is possible to improve the accuracy of coarse-scale
land quality maps if they are based on alternative soil maps created by selecting soil profiles
typical of the region without changing the boundaries of the existing map units and which
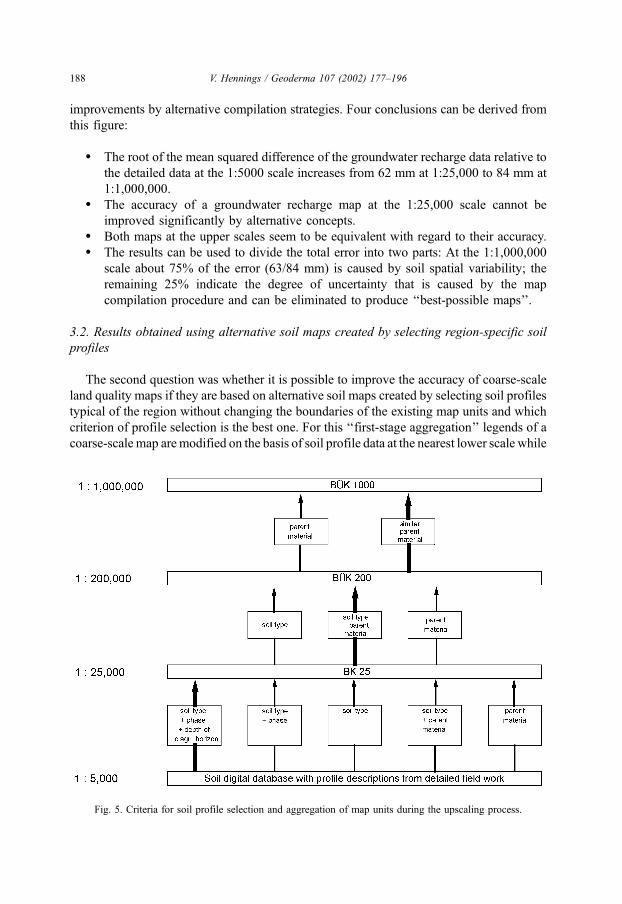
criterion of profile selection is the best one. For this ‘‘first-stage aggregation’’ legends of a
coarse-scale map aremodified on the basis of soil profile data at the nearest lower scale while
Fig. 5. Criteria for soil profile selection and aggregation of map units during the upscaling process.
V. Hennings / Geoderma 107 (2002) 177–196188
boundaries of the map units remain unchanged. Up to five variants of aggregation proce-
dures were applied using different taxonomic criteria for soil profile selection (Fig. 5).
During aggregation, according to ‘‘similar parent materials,’’ genetic aspects were neglected
and correspondence in the soil texture class was emphasized, e.g., eolian sands, fluvioglacial
sands, etc., were combined into one group. The heavy lines indicate the recommendation in
the German Soil Mapping Guidelines, which acts only as a first proposal and does not offer
rule-based algorithms to be used for decision-support systems (Domburg, 1994).
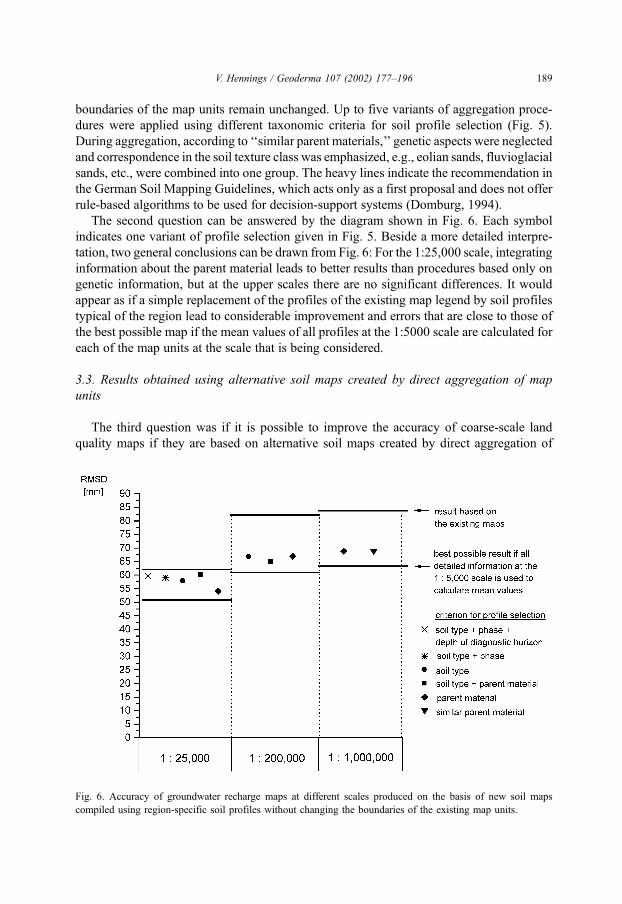
The second question can be answered by the diagram shown in Fig. 6. Each symbol
indicates one variant of profile selection given in Fig. 5. Beside a more detailed interpre-
tation, two general conclusions can be drawn from Fig. 6: For the 1:25,000 scale, integrating
information about the parent material leads to better results than procedures based only on
genetic information, but at the upper scales there are no significant differences. It would
appear as if a simple replacement of the profiles of the existing map legend by soil profiles
typical of the region lead to considerable improvement and errors that are close to those of
the best possible map if the mean values of all profiles at the 1:5000 scale are calculated for
each of the map units at the scale that is being considered.
3.3. Results obtained using alternative soil maps created by direct aggregation of map
units
The third question was if it is possible to improve the accuracy of coarse-scale land
quality maps if they are based on alternative soil maps created by direct aggregation of
Fig. 6. Accuracy of groundwater recharge maps at different scales produced on the basis of new soil maps
compiled using region-specific soil profiles without changing the boundaries of the existing map units.
V. Hennings / Geoderma 107 (2002) 177–196 189
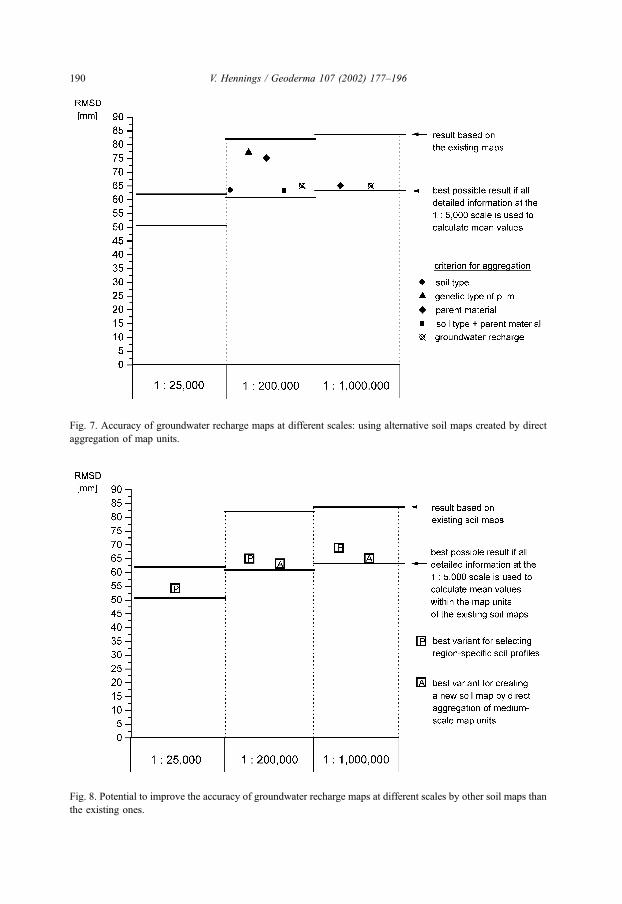
Fig. 8. Potential to improve the accuracy of groundwater recharge maps at different scales by other soil maps than
the existing ones.
Fig. 7. Accuracy of groundwater recharge maps at different scales: using alternative soil maps created by direct
aggregation of map units.
V. Hennings / Geoderma 107 (2002) 177–196190
finer-scale map units (‘‘second-stage aggregation’’) and which criterion of aggregation is
the best-suited one. Complete aggregation of map units was carried out only for the upper
scales because the detailed information of the reference scale was already used to generate
the boundaries of the 1:25,000 map (see Section 2.1). To aggregate map units, three
requirements had to be fulfilled: correspondence to the criterion used for that variant,
spatial neighbourhood, and a minimum size of the resulting polygon for cartographic
reasons.
The third question can be answered again by a diagram (Fig. 7) as already done in
Section 3.1. Two interpretations can be concluded from Fig. 7: To all appearances, the best
result is obtained when information about soil type and parent material is combined. But
even if the best variant is considered, the error does not fall short of the error of the best-
possible result if all detailed information at the 1:5000 scale is used to calculate mean
values within the map units of the existing soil maps. This result can also be illustrated by
a figure that is restricted to only the best variant of Sections 3.2 and 3.3 (Fig. 8). Again, it
looks quite clear that the two strategies to improve the accuracy of the existing coarse-
scale soil maps compared in this study lead to similar results. From the point of view of a
soil survey institution, this means that the more time-consuming and costly second-stage
aggregation procedure of map units is not worthwhile.
4. Summary and discussion
The validity of all this paper’s conclusions is limited to a certain land quality and a
study area characterized mainly by glacial and fluvioglacial sediments. A similar
investigation in another soil landscape or one focused on land qualities dependent on
soil chemical properties, may show completely different results.
A systematic overview of the scale-dependency of processes and the theoretical
constructs or models used to describe them has been given by Wagenet (1998). This
author also classified approaches to scale translation ‘‘up’’ and principal scale translation
failures. Bouma et al. (1998) presented a synopsis of upscaling procedures from similar
studies by various authors. Following their classification, the upscaling procedure applied
in this study (Fig. 2) belongs to group ‘‘2’’ (‘‘changing grid sizes at different scales’’).
According to McBratney (1998), this is one of the ‘‘M1’’ procedures, because inputs to the
model are aggregated and afterwards the model is run at the appropriate scale (Fig. 2).
Such a comparatively simple approach is generally linked to specific scale translation
failures: Wagenet (1998) mentions the interaction of multiple factors to produce unique
phenomena that acts as a major constraint on the ability to translate information over
several scales. This means that the upscaling procedure of this investigation is not as
sophisticated as demanded by McBratney (1998), who regards only variograms over many
scales and realizations of fractal theory as formal approaches to aggregation. Despite these
restrictions, results from Section 3 allow some general conclusions.
Burrough (1983b) was one of the first soil scientists to study superimposed effects of
the spatial variation of soil by comparing nugget variances and estimated fractal di-
mensions of published soil data and fragments of soil maps over several scales. Other
authors evaluated the reliability of land quality predictions at different scales, e.g., Bregt
V. Hennings / Geoderma 107 (2002) 177–196 191
(1989) for soil-moisture-deficits and de Vries et al. (1998) for soil acidification processes.
While increasing absolute errors with scale are observed, most of the maximum error is
often reached at a regional scale and then asymptotically approximating a final sill. Results
of this study show similar features (Figs. 4 and 6, 7, 8). The accuracy of the existing
groundwater recharge map at the 1:25,000 scale cannot be improved significantly even
when the soil map was compiled by direct upscaling, using detailed soil data at the 1:5000
scale. In contrast to this result, 1:200,000 and 1:1,000,000 land quality maps are
improvable if they are based on new or alternative soil maps created by using soil profiles
typical of the region or by direct aggregation of finer-scale map units.
Several authors tried to describe soil spatial variability as a function of soil-forming
factors by deriving general rules from existing publications. Wilding (1985) formulated the
hypothesis that soil spatial variability is closely allied with the parent material and in-
creases from loess and glacial till over fluviatile deposits to fluvioglacial sediments and
tectonic rocks. According to local geological conditions the amount of soil spatial vari-
ability in the study area, characterized mainly by glacial deposits, can be expected as
‘‘medium (to high)’’. Furthermore, the taxonomic criterion of the upscaling procedure in
the Vechta area does not make any difference.
To improve the accuracy of coarse-scale land quality maps, two strategies to create other
soil maps than the existing ones were compared: The result of replacing the soil profiles that
describe the legend units by region-specific soil profiles is equivalent to a completely new
map design in which all boundaries are generated directly from finer-scale map units.
For decisions at the national scale, the 1:1,000,000 map is the most important part of
the soil information system. Early comparisons of the utilities and the cost-effectiveness of
soil maps produced by different survey procedures and to different scales were already
made during the seventies (Beckett and Burrough, 1971a,b). Brus et al. (1992) evaluated
different strategies like revision and upgrading to endorse future decisions for updating
soil survey information. A similar question was raised about how to bring up to date and
improve the 1:1,000,000 soil map and what is the most effective time and cost reducing
strategy. The results indicate that an improvement of this product does not necessarily
require the completion of the mapping process at the 1:25,000 or the 1:50,000 scale by the
soil surveys of the federal states. Because direct aggregation of fine-scale map units is
negligible for the 1:1,000,000 target scale, a considerably improvement of the nationwide
soil map can be expected from the completion of the 1:200,000 map and a national
database of well documented typical soil profiles.
By explaining the phenomenon of soil spatial variability, from the beginning several
soil scientists tended to group spatial variability into broad categories, systematic and
random (s. Wilding and Drees, 1983). Over the past decades, soil survey institutions have
tried to minimize field mapping and to substitute conventional mapping methods by
modern procedures to facilitate direct interpretation of the soil type from digital data on
geology, relief and historical land use. In terms of the above-mentioned concepts, models
of this kind attempt to comprehend the systematic part of soil variation with information
on the soil-forming factors. In an investigation area north of the Harz Mountains in Lower
Saxony, Germany, Hennings (1991) quantified the degree of reliability that can be ob-
tained by applying such models: predictions based only on theory without control bore-
holes may be expected to have an error of 30–40% of the total area. At the 1:1,000,000
V. Hennings / Geoderma 107 (2002) 177–196192
scale, about 75% of the error is caused by the spatial variability of soils and has to be
accepted as a scale-specific error; the remaining 25% indicate the degree of uncertainty
caused by the mapping or upscaling procedure and can be eliminated to produce ‘‘best-
possible maps’’.
Besides the above detailed conclusions, there is also the following general realization
for the user of a 1:1,000,000 land quality map: At this scale, about 75% of the error is
caused by soil spatial variability and cannot be avoided at this scale, boundaries between
map units do not appear to have a statistical basis, and the user of the existing soil map has
to expect or tolerate that the internal heterogeneity of the map units can differ completely.
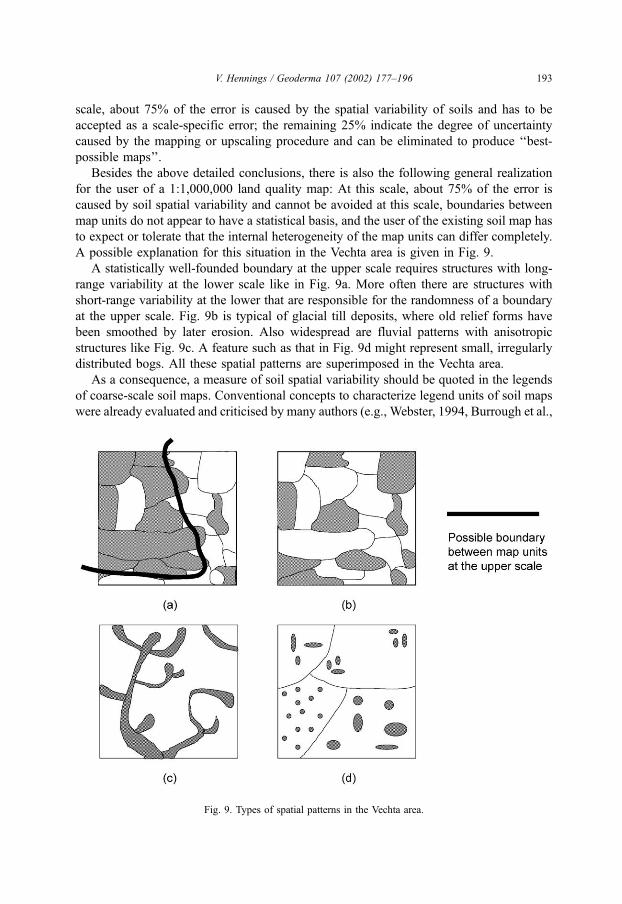
A possible explanation for this situation in the Vechta area is given in Fig. 9.
A statistically well-founded boundary at the upper scale requires structures with long-
range variability at the lower scale like in Fig. 9a. More often there are structures with
short-range variability at the lower that are responsible for the randomness of a boundary
at the upper scale. Fig. 9b is typical of glacial till deposits, where old relief forms have
been smoothed by later erosion. Also widespread are fluvial patterns with anisotropic
structures like Fig. 9c. A feature such as that in Fig. 9d might represent small, irregularly
distributed bogs. All these spatial patterns are superimposed in the Vechta area.
As a consequence, a measure of soil spatial variability should be quoted in the legends
of coarse-scale soil maps. Conventional concepts to characterize legend units of soil maps
were already evaluated and criticised by many authors (e.g., Webster, 1994, Burrough et al.,
Fig. 9. Types of spatial patterns in the Vechta area.
V. Hennings / Geoderma 107 (2002) 177–196 193
1994). Some of them like Brown and Huddleston (1991) or Nordt et al. (1991) recommend
‘‘interpretive purities’’ or confidence intervals of diagnostic properties. Others like Brus
(1993) or Domburg (1994) propose methods like soil map stratification and geostatistical
tools to derive typical semivariograms for widespread mapping units. Burrough et al. (1994)
summarize the most important issues as follows: there is a general need for a systematic
spatial variability analysis of permanent properties in multiple delineations of soil series and
for confidence bands of predictive model results in dependence of the spatial resolution level
of the input data. As a consequence, the convention of describing map units on the basis of
typical soil profiles, which differ only in soil type or details of a genetically based clas-
sification system, is not sufficient. This conclusion is underlined by the results of Table 2
when two concepts for describing map units are compared. It is necessary to use at least
simple statistics, such as frequency distributions or confidence limits of the variance of input
parameter values for simple deterministic simulation models of water and solute transport
(e.g., available water capacity).
5. Outlook
The more general conclusions for a soil survey operating nationwide can be summar-
ized as follows.
bWhen investigations of a similar methodology are repeated in various soil regions,
legend units of a coarse-scale soil map can be grouped or classified according to their
internal spatial variability and priorities can be established for detailed mapping programs
that focus on widespread map units of a finer-scale soil map with nationwide coverage.
bKnowledge of the best suited upscaling procedure can be used by soil surveys to
manage decision-support systems; the development of rule-based aggregation algorithms
allows automated map compilation.
bIf the degree of reliability of the existing soil maps as well as of the ‘‘best-possible
maps’’ can be quantified by statistical measures, the relation between cost and utility of
further work to improve the existing soil maps can be estimated.
Besides the results given above, there are still some objectives for the future:
� testing of other upscaling procedures (e.g., using soil-forming factors as aggregation
criterion), probably not a promising task when interpretations of Fig. 8 are taken
into account;� repetition of this investigation, focussed on land qualities that are dependent on soil
chemical properties;� evaluation of the relative importance of the regionalization of climatic data;� evaluation of the relative importance of the regionalization of land-use data;� identification of the best-suited measures for quantifying soil spatial variability at
the 1:200,000 and 1:1,000,000 scales;� development of rule-based algorithms to be used in decision-support systems.
In general, there is no lack of thoroughly investigated study areas; there is a lack of
generalized rules to predict spatial variation from easily available information. Rules are
V. Hennings / Geoderma 107 (2002) 177–196194
needed that can be transferred to other soil associations with similar soil-forming factors.
The need for an ‘‘information system of map quality data’’ was noted already in the
eighties (Marsman and de Gruijter, 1984).
At present, new approaches, such as pooled variograms, are being tested and the initial
results are being published by soil survey institutions in various countries. For example,
Domburg (1994) mentions such a ‘‘National Sampling Map Unit Program’’, conception-
ally designed to collect detailed quantitative information on the spatial variability within
map units of the 1:50,000 Soil Map of the Netherlands. If the initial results of this program
are available, perhaps the best-suited methodology for deriving pooled variograms at this
scale can be applied. But the question as to whether it is possible to guess parameters of a
variogram model from field experience, i.e., without local sampling and statistical anal-
ysis, will still have to be answered.
References
Beckett, P.H.T., Burrough, P.A., 1971a. The relation between cost and utility in soil survey: IV. Comparison of the
utilities of soil maps produced by different survey procedures, and to different scales. J. Soil Sci. 22, 466–
480.
Beckett, P.H.T., Burrough, P.A., 1971b. The relation between cost and utility in soil survey: V. The cost-effec-
tiveness of different soil survey procedures. J. Soil Sci. 22, 481–489.
Benne, I., 1997. Bodenkarte von Niedersachsen 1:25,000, Blatt 3215 Vechta. Niedersachsisches Landesamt fur
Bodenforschung, Hannover.
Bouma, J., Finke, P.A., Hoosbeek, M.R., Breeuwsma, A., 1998. Soil and water quality at different scales:
concepts, challenges, conclusions and recommendations. In: Finke, P.A., Bouma, J., Hoosbeek, M.R.
(Eds.), Soil and Water Quality at Different Scales. Dev. Plant Soil Sci., vol. 80. Kluwer Academic Publishing,
Dordrecht, pp. 5–11.
Bregt, A., 1989. Quality of representative profile descriptions for predicting the land quality moisture deficit at
different scales. In: Bouma, J., Bregt, A. (Eds.), Land Qualities in Space and Time. Proceedings of a
Symposium by the ISSS, 22.-26.08.1988, Pudoc, Wageningen, pp. 169–172.
Brown, R.B., Huddleston, J.H., 1991. Presentation of statistical data on map units to the user. In: Mausbach, M.J.,
Wilding, L.P. (Eds.), Spatial Variabilities of Soils and Landforms. SSSA Spec. Publ., vol. 28, pp. 127–147.
Brus, D.J., 1993. Incorporating models of spatial variation in sampling strategies for soils. PhD thesis, Wage-
ningen Agricultural University.
Brus, D.J., de Gruijter, J.J., Breeuwsma, A., 1992. Strategies for updating soil survey information: a case study to
estimate phosphate sorption characteristics. J. Soil Sci. 43, 567–581.
Bundesministerium fur Umwelt, Naturschutz und Reaktorsicherheit (BMU) (Ed.), 2000. Hydrologischer Atlas
von Deutschland, 1st delivery, Bonn, 107 pp.
Burrough, P.A., 1983a. Problems of superimposed effects in the statistical study of the spatial variation of soil.
Agric. Water Manag. 6, 123–143.
Burrough, P.A., 1983b. Multiscale sources of spatial variation in soil: I. The application of fractal concepts to
nested levels of soil variation. J. Soil Sci. 34, 577–597.
Burrough, P.A., Bouma, J., Yates, S.R., 1994. The state of the art in pedometrics. Geoderma 62, 311–326.
De Vries, W., Kros, J., van der Salm, C., Groenenberg, J.E., Reind, G.J., 1998. The use of upscaling procedures in
the application of soil acidification models at different spatial scales. In: Finke, P.A., Bouma, J., Hoosbeek,
M.R. (Eds.), Soil and Water Quality at Different Scales. Dev. Plant Soil Sci., vol. 80. Kluwer Academic
Publishing, Dordrecht, pp. 223–236.
Domburg, P., 1994. A knowledge-based system to assist in the design of soil survey schemes. Report 91, DLO
Winand Staring Centre, Wageningen.
Hartwich, R., Behrens, J., Eckelmann, W., Haase, G., Richter, A., Roeschmann, G., Schmidt, R., 1995. Bode-
V. Hennings / Geoderma 107 (2002) 177–196 195
nubersichtskarte der Bundesrepublik Deutschland 1:1.000.000 (BUK 1000). Bundesanstalt fur Geowissen-
schaften und Rohstoffe, Hannover.
Hennings, V., 1991. Die Bedeutung der raumlichen Variabilitat bodenkundlicher Basisdaten fur aktuelle und
zukunftige Kartiertechniken, dargestellt an einem Beispielsgebiet im nordlichen Harzvorland. Geol. Jahrb. F
28 Hannover.
Hoosbeek, M.R., Bryant, R., 1992. Towards the quantitative modelling of pedogenesis—a review. Geoderma 55,
183–210.
Krahmer, U., Hennings, V., Muller, U., Schrey, H.-P., 1995. Ermittlung bodenphysikalischer Kennwerte in
Abhangigkeit von Bodenart, Lagerungsdichte und Humusgehalt. Z. Pflanzenernaehr. Bodenkd. 158, 323–
331.
Luders, R., Oelkers, K.-H., 1975. Bodenkundliche Standortkarte von Niedersachsen und Bremen 1:200,000, Blatt
Osnabruck Niedersachsisches Landesamt fur Bodenforschung, Hannover.
Marsman, B.A., de Gruijter, J.J., 1984. Dutch soil survey goes into quality control. In: Burrough, P.A., Bie, S.W.
(Eds.), Soil Information Systems Technology. Pudoc, Wageningen, pp. 127–134.
McBratney, A.B., 1992. On variation, uncertainty and informatics in environmental soil management. Aust. J.
Soil Res. 30, 913–935.
McBratney, A.B., 1998. Some considerations on methods for spatially aggregating and disaggregating soil
information. In: Finke, P.A., Bouma, J., Hoosbeek, M.R. (Eds.), Soil and Water Quality at Different Scales.
Dev. Plant Soil Sci., vol. 80. Kluwer Academic Publishing, Dordrecht, pp. 51–62.
Nordt, L.C., Jacob, J.S., Wilding, L.P., 1991. Quantifying map unit composition for quality control in soil survey.
In: Mausbach, M.J., Wilding, L.P. (Eds.), Spatial Variabilities of Soils and Landforms. SSSA Spec. Publ., vol.
28. Soil Science Society of America, Madison, WI, pp. 183–197.
Odeh, I.O.A., Todd, A.J., Triantafilis, J., McBratney, A.B., 1998. Status and trends of soil salinity at different
scales: the case for the irrigated cotton growing region of eastern Australia. In: Finke, P.A., Bouma, J.,
Hoosbeek, M.R. (Eds.), Soil and Water Quality at Different Scales. Dev. Plant Soil Sci., vol. 80. Kluwer
Academic Publishing, Dordrecht, pp. 99–107.
Wagenet, R.J., 1998. Scale issues in agroecological research chains. In: Finke, P.A., Bouma, J., Hoosbeek, M.R.
(Eds.), Soil and Water Quality at Different Scales. Dev. Plant Soil Sci., vol. 80. Kluwer Academic Publishing,
Dordrecht, pp. 23–34.
Wagenet, R.J., Bouma, J., Grossman, R.B., 1991. Minimum data sets for use of soil survey information in soil
interpretive models. In: Mausbach, M.J., Wilding, L.P. (Eds.), Spatial Variability of Soils and Landforms.
SSSA Spec. Publ., vol. 28. Madison, WI, pp. 161–182 .
Webster, R., 1994. The development of pedometrics. Geoderma 62, 1–15.
Wessolek, G., 1989. Einsatz von Wasserhaushalts- und Photosynthesemodellen in der Okosystemanalyse. Land-
schaftsentwickl. Umweltforsch. 61, 1–170, Techn. Univ. Berlin.
Wilding, L.P., 1985. Spatial variability: its documentation, accommodation and implication to soil surveys. In:
Nielsen, D.R., Bouma, J. (Eds.), Soil Spatial Variability. Pudoc, Wageningen, pp. 166–194.
Wilding, L.P., Drees, L.R., 1983. Spatial variability and pedology. In: Wilding, L.P., Smeck, N.E., Hall, G.F.
(Eds.), Pedogenesis and Soil Taxonomy. Elsevier, Amsterdam, pp. 83–113.
Wilson, J.P., Inskeep, W.P., Wraith, J.M., Snyder, R.D., 1996. GIS-based solute transport modeling applications:
scale effects of soil and climate data input. J. Environ. Qual. 25, 445–453.
Zitzmann, A., 1994. Geowissenschaftliche Karten in der Bundesrepublik Deutschland. Z. Dtsch. Geol. Ges. 145,
38–87.
V. Hennings / Geoderma 107 (2002) 177–196196