Groundwater flow in an arsenic-contaminated aquifer, Mekong Delta, Cambodia
Accuracy of CFC groundwater dating in a crystalline bedrock aquifer:Data from a site in southern Sweden
Niclas Bockg�rd · Allan Rodhe · K. A. Olsson
Abstract The concentrations of chlorofluorocarbons(CFC-11, CFC-12, and CFC-113) and tritium weredetermined in groundwater in fractured crystalline bed-rock at Finnsj�n, Sweden. The specific goal was toinvestigate the accuracy of CFC dating in such anenvironment, taking potential degradation and mixing ofwater into consideration. The water was sampled to adepth of 42 m in three boreholes along an 800-m transect,from a recharge area to a local discharge area. The CFC-113 concentration was at the detection limit in mostsamples. The apparent recharge date obtained from CFC-11 was earlier than from CFC-12 for all samples, with adifference of over 20 years for some samples. Thedifference was probably caused by degradation of CFC-11. The CFC-12 dating of the samples ranged from before1945 to 1975, with the exception of a sample from thewater table, which had a present-day concentration.Conclusions about flow paths or groundwater velocitycould not be drawn from the CFCs. The comparisonbetween CFC-12 and tritium concentrations showed thatmost samples could be unmixed or mixtures of waterswith different ages, and the binary mixtures that matchedthe measured concentrations were determined. The mix-ing model approach can be extended with additionaltracers.
R�sum� Pr�cision de la datation au CFC dans unaquif�re rocheux-fractur�: donn�es d’un site du sud dela Su�de.
Les concentrations en chlorofluorocarbones (CFC-11,CFC-12, CFC-113) et entritium ont �t� d�termin�es dansl’eau souterraine d’un massif fractur� � Finnsj�n enSu�de. Le but de cette �tude est de mieux cerner lapr�cision de la m�thode de datation au CFC dans ce typed’environnement hydrog�ologique, tout en consid�rantd’�ventuels ph�nom�nes de d�gradation et de m�langed’eaux. L’eau a �t� �chantillonn�e � une profondeur de 42m�tres dans trois forages align�s sur 800 m�tres entre unezone de recharge et une zone de d�versement. Lesconcentrations en CFC-113 sont dans la plupart des�chantillons � la limite de d�tection. Pour tous les�chantillons, la date de la recharge �tablie avec le CFC-11 est ant�rieure � la date �tablie avec le CFC-12. Ladiff�rence entre les deux dates peut d�passer 20 ans ets’explique—probablement—par la d�gradation du CFC-11. Les dates de recharge de la nappe mesur�es au CFC-12 sont comprises entre 1945 et 1975, except� pour un�chantillon qui poss�de une concentration actuelle. Iln’est pas possible de tirer des conclusions concernant ladirection des �coulements et la vitesse de l’eau souter-raine. La comparaison entre CFC-12 et tritium montre quedes �chantillons pourraient Þtre soit le r�sultat du m�langed’eaux d’�ges diff�rents, soit des �chantillons non-m�-lang�s. Dans le cas d’un m�lange binaire, les rapports dum�lange composant la concentration mesur�e sont d�ter-min�s. L’approche par mod�le de m�lange peut Þtre�tendue � des traceurs additionnels.
Resumen Precisi�n en la dataci�n de aguas subterr�neasutilizando CFC en un acu�fero de rocas cristalinas: datosprovenientes de un sitio al sur de Suecia.
Se determinaron las concentraciones de clorofluoru-carbonos (CFC-11, CFC-12, y CFC-113) y de tritio enaguas subterr�neas alojadas en rocas cristalinas fractura-das de Finnsj�n, Suecia. El objetivo espec�fico consisti�en investigar la precisi�n de la dataci�n de aguassubterr�neas con CFC en este tipo de ambiente, tomandoen consideraci�n la degradaci�n potencial y la mezcla deagua. Las muestras de agua se tomaron a una profundidadde 42 m en tres pozos ubicados a lo largo de una l�nea de800 m transversal a una zona de recarga y de zona dedescarga local. En la mayor�a de las muestras se encontr�
Received: 24 January 2003 / Accepted: 31 December 2003Published online: 12 March 2004
Springer-Verlag 2004
N. Bockgrd ()) · A. RodheDepartment of Earth Sciences, Air and Water Science,Uppsala University,Villav�gen 16, 752 36 Uppsala, Swedene-mail: [email protected].: +46-18-4712265Fax: +46-18-551124
K. A. OlssonAnalytical and Marine Chemistry,G�teborg University,412 96 G�teborg, Sweden
Present address:K. A. Olsson, Bjerknessenteret, Allegt. 55,5007 Bergen, Norway
Hydrogeology Journal (2004) 12:171–183 DOI 10.1007/s10040-004-0319-3
que la concentraci�n de CFC-113 estuvo en el l�mite dedetecci�n. La edad que se estim� en todas las muestraspara la recarga aparente en base a CFC-11 fue m�s jovenque la edad proveniente de CFC-12, con una diferencia dem�s de 20 a�os para algunas muestras. Esta diferencia fuecausada probablemente por la degradaci�n del CFC-11.La dataci�n CFC-12 de las muestras vari� de antes de1945 a 1975, con la excepci�n de una muestra tomada enel nivel fre�tico, la cual present� concentraci�n actual. Nofue posible obtener conclusiones acerca de las trayectoriasde flujo o la velocidad de agua subterr�nea a partir de losCFCs. La comparaci�n entre las concentraciones de CFC-12 y tritio mostr� que la mayor�a de las muestras puedentener composici�n sencilla o bien consistir de mezclas deaguas de diferentes edades. Esta comparaci�n tambi�npermiti� determinar las mezclas binarias que correspon-den a las concentraciones medidas. Pueden utilizarsetrazadores adicionales para ampliar el modelo de mezclaspropuesto.
Keywords CFCs · Crystalline rocks · Groundwaterdating · Sweden · Tracers
Introduction
Information on groundwater age, especially of younggroundwaters is needed in many applications. Age datacan be used to characterize the groundwater flow system,and groundwater age also has its intrinsic value in, forexample, biogeochemical applications. Important vari-ables such as velocity and residence time of the ground-water may be estimated from groundwater age. Rechargerates and flow paths within aquifers may also be deter-mined. Another important use of groundwater dating isfor calibration of groundwater models.
Characterizations of groundwater flow and transportare often based on hydraulic considerations. Flux iscalculated from measurements of hydraulic head andhydraulic conductivity through Darcy’s law, usually usingnumerical groundwater models. This involves consider-able uncertainties because of the high variability ofhydraulic conductivity in nature. Additional uncertaintiesare included when groundwater velocity is estimated,since the flux and velocity are related through the flowporosity, which is a parameter that is difficult to estimate.
Observation of the transport using tracers is a moredirect method to determine groundwater velocity. Tracerscan be categorized into artificial tracers which are appliedby the investigator for the purpose of measuring waterflow, and environmental tracers (Cook et al. 1996), whichcan occur naturally or be present as a result of humanactivities. Environmental tracers are advantageous overapplied tracers in applications involving large areas, largewater volumes, or long transport times. Examples of en-vironmental tracers, suitable for young groundwaters(recharged within the past 50 years), are tritium (Eriksson1963) and 36Cl, which have been used since the 1960s,and chlorofluorocarbons (CFCs). In the present study the
possibility of using CFCs for age determination ofgroundwater in fractured crystalline rock was investigat-ed. There are several potential problems associated withthe application of the CFC method in fractured rockenvironments including (a) the possibility of the occur-rence of anaerobic conditions in the groundwater underwhich CFCs may degrade, and (b) the irregular flowpattern for groundwater in fractured rock that maycomplicate the CFC dating due to mixing of water fromdifferent pathways.
The overall purpose of the study was to developmethods for quantitative estimates of groundwater re-charge into Swedish fractured rock aquifers. The specificgoal was to investigate the accuracy of CFC dating insuch an environment taking potential degradation ofCFCs and the effects of mixing of water of different agesinto consideration. A fractured rock aquifer in southernSweden was selected for the investigation.
There is no way to validate the estimated groundwaterage at a certain location in the aquifer. Therefore the sitewas selected so that the estimated ages could be quali-tatively related to the expected flow paths, but theintention was not to determine the details of the ground-water flow in the studied aquifer.
Methods
CFC DatingCFCs have been present in the atmosphere since the1940s. Chlorofluorocarbons CFC-11 (CFCl3), CFC-12(CF2Cl2) and CFC-113 (C2F3Cl3) have a long residencetime in the atmosphere, and their atmospheric concentra-tions show an increasing trend from 1940 to the middle ofthe 1990s (Walker et al. 2001). CFCs were proposed as adating tool for groundwater in the mid-1970s (Thompsonand Hayes 1979) at which time they were already used fordating and tracing circulation and mixing of water massesin the oceans (Lovelock et al. 1973). The CFC methodbecame more widely used for groundwater dating afterthe development of the sample collection procedure byBusenberg and Plummer (1992). The basis for the CFCdating are the assumptions that the CFC concentration inthe recharging water in the unsaturated zone in soil orrock is in equilibrium with the present atmosphere andthat the CFCs are conserved in the groundwater (Busen-berg and Plummer 1992). The measured CFC concentra-tions in water are converted to the corresponding atmo-spheric CFC concentrations, commonly called apparentatmospheric concentrations, using known solubility rela-tionships. Empirical relationships for the solubility inpure water as a function of the temperature are given byWarner and Weiss (1985) for CFC-11 and CFC-12 and byBu and Warner (1995) for CFC-113.
An apparent atmospheric CFC concentration at thetime of recharge of the sampled groundwater can thus becalculated from the CFC concentration in the water andthe recharge temperature, that is, the temperature at themoment when the recharging groundwater and the atmo-
172
Hydrogeology Journal (2004) 12:171–183 DOI 10.1007/s10040-004-0319-3
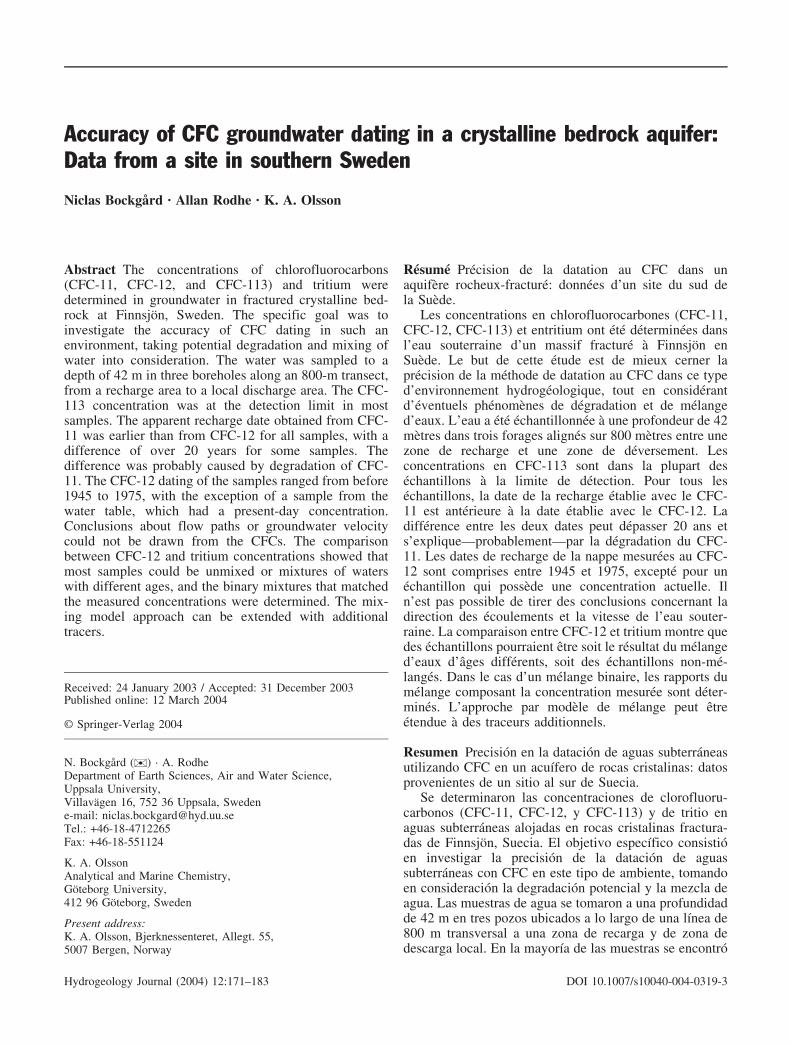
sphere equilibrated. An apparent recharge year is thendetermined by comparing the calculated apparent atmo-spheric concentration with the time series of CFC in theatmosphere. Since the spatial variation in atmosphericCFC concentrations is relatively moderate (Cook andSolomon 1997), the input to groundwater is known withfair accuracy. There may be a time lag between the CFCconcentration in the atmosphere and in the soil air at thegroundwater table, which would make it necessary tocorrect the atmospheric concentration curve in order toget the date of groundwater recharge. The time lagdepends on the rate of gas diffusion through the unsat-urated zone, but it is usually insignificant for unsaturatedzones shallower than about 5 m (Cook and Solomon1997). The time series of CFCs in the atmosphere shownin Fig. 1, given by Walker et al. (2001), was used in thepresent study.
Groundwater studies in shallow, porous aquifers usingCFCs were conducted by, for example, Busenberg andPlummer (1992), Cook et al. (1995), and Oster et al.(1996). CFCs have also been used for groundwater datingin fractured rock. Busenberg and Plummer (1992) sam-pled groundwater from two deep (about 250 m) municipalsupply wells in sedimentary rock. CFCs were used toidentify mixing of very small amounts (1–2%) of youngwater with old, CFC-free water in the wells. The rechargeflux to a 10-m thick highly weathered shale aquifer wasestimated by Cook et al (1996) using CFC-12 profiles.The recharge flux into the underlying unweathered shaleand limestone formation could not be reliably estimatedbecause the tracer concentration in fractures and the rockmatrix was unlikely to be in equilibrium. Plummer et al.(2001) used multiple tracers, including CFCs, to inves-tigate residence time of shallow groundwater dischargingfrom springs and wells in fractured crystalline rock. Thegroundwater ages ranged from 0 to 25 years. The tracerdata indicated that some samples were mixtures ofyounger (0–10 years) and older, CFC-free water. Rela-tively high quantities of excess air (supersaturation of airdue to dissolved air bubbles) were found in the water. Theexcess air is probably formed in the fractures during rapidrises in the water table.
Processes that can alter the CFC concentrations in thegroundwater are sorption, degradation, and mixing. Theeffects of the different processes are difficult to separate.However, sorption of CFC-11 and CFC-12 is probably notimportant in crystalline rock aquifers (Cook and Solomon1997). Concerning degradation, CFC-12 is much morestable than CFC-113, which in turn is more stable thanCFC-11 (Khalil and Rasmussen 1989; Plummer et al.1998b). Degradation of CFC-11 and/or CFC-113 inanaerobic groundwater has been observed in severalstudies (Cook et al. 1995; Oster et al. 1996; Plummer etal. 1998a, 1998b; Goode et al. 1999). Degradation isusually not observed until the dissolved oxygen contentfalls below roughly 0.5 mg l-1 and redox conditions reachsulphate reduction, but where such conditions prevail,CFC-11 and CFC-113 can be almost completely absent(Plummer et al. 1998a). The half-life of CFC-11 in ananaerobic, sulphate-reducing sand aquifer in Ontario,Canada, was estimated to be 0.9–1.7 years (Cook et al.1995). There was however no evidence of degradation ofCFC-12 or CFC-113. Degradation of CFC-11 was ob-served in two anaerobic sand aquifers in the Rhine Valley,Germany (Oster et al. 1996), corresponding to half-livesfrom about 3 to less than 1 year. CFC-11 was almostcompletely degraded after 5–8 years. They estimatedCFC-12 to be about 10 times more stable than CFC-11.Lee et al. (1999) reported that no degradation of CFC-12took place under anoxic conditions, neither in incubationtests of seawater nor in a marine environment, whileCFC-11 was degraded, presumably by biological pro-cesses. Degradation of CFC-12 in groundwater has beenreported from shallow groundwater in till at a forestedhumid site in New Hampshire, USA (Goode et al. 1999)where CFC-12 concentrations at the groundwater tablewere as low as one-third of modern levels. However,CFC-12 is usually assumed to be stable also underanaerobic conditions, as long as the redox potential doesnot fall into methanogenic conditions. The presence ofsulphate in anaerobic environments actually slows the rateof degradation of highly halogenated aliphatic compoundssuch as CFCs by competition as an electron acceptor(Mohn and Tiedje 1992; Sylvestre et al. 1997).
Analysis of Mixed GroundwaterMixing analysis, which in the case of two tracers is basedon mixing diagrams where the two tracer concentrationsin different samples are plotted against each other, cangive information on non-conservative behaviour of thetracers. For conservative tracers, mixing analysis can beused to evaluate in which proportions water from differentsources (in space or time) have mixed to form thesamples. In this study, mixing analysis was used for boththese purposes, with the sources (end-members) for waterbeing the different times for the groundwater recharge.
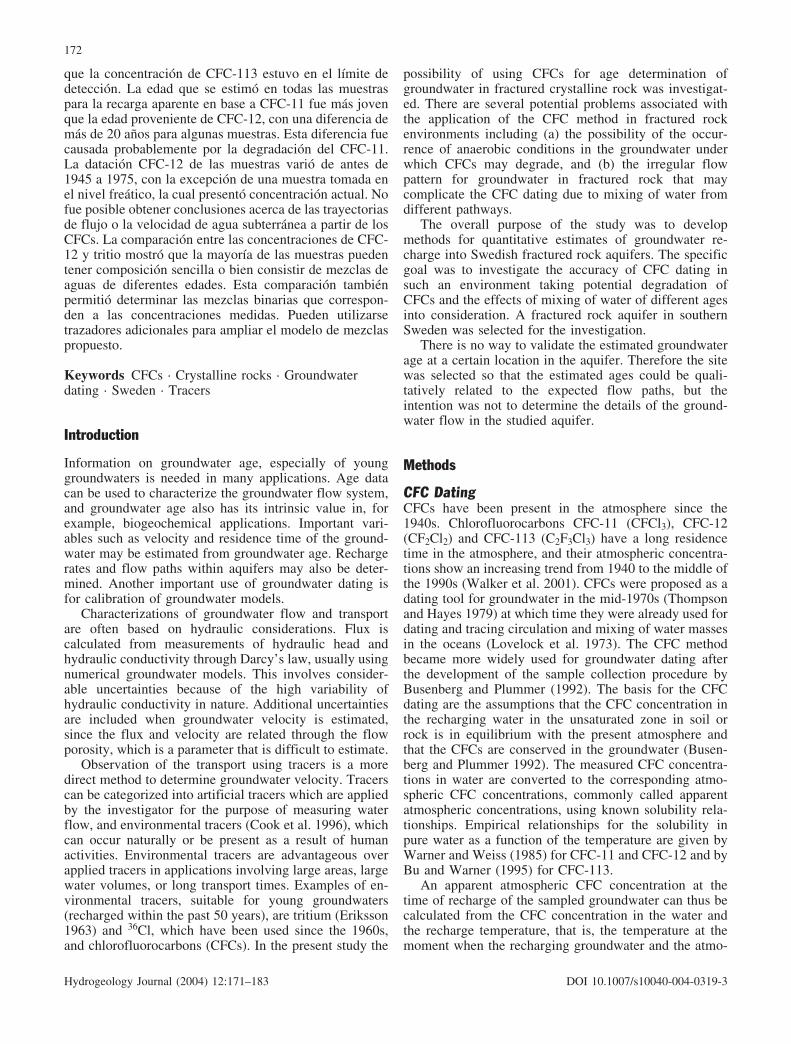
In the principally sketched mixing diagram in Fig. 2the concentration of two tracers at the moment ofrecharge are plotted against each other for different timesof recharge. If the tracers behave conservatively in the
Fig. 1 Reconstructed time series of atmospheric concentrations ofCFCs for the Northern hemisphere (Walker et al. 2001) and annualmean values of tritium concentration in precipitation, corrected fordecay to 2001 (IAEA/WMO 2002)
173
Hydrogeology Journal (2004) 12:171–183 DOI 10.1007/s10040-004-0319-3

groundwater, all samples that constitute mixtures of waterfrom these end-members (recharge times) will fall withinthe envelope of the end-member points (shaded area inthe diagram). In samples falling outside the area in themixing diagram, a non-conservative change must havetaken place of at least one of the tracers, for instance bydegradation or sorption.
Mixing is a general problem when estimating the ageof a groundwater sample directly from the temporal trendof the tracer concentration of the input, i.e., of thegroundwater recharge. If the input concentration of aconservative tracer varies linearly over time, the ageobtained from the input concentration curve represents themean age of the sample. For non-linear input concentra-tion curves, such as those for environmental CFCs ortritium, some type of mixing model has to be assumed inorder to estimate the mean age of a sample. Completemixing (the exponential model) (Eriksson 1958) maydescribe the groundwater discharge from an open aquifer(Maloszewski and Zuber 1982). Here the outflow repre-sents a mixture of waters that have been transported alonga great range of flow-path lengths and velocities, withtransit times theoretically varying from zero to infinity.The other extreme “mixing model” is the piston-flowmodel in which the water flow takes place by puredisplacement without mixing. This model, more or lessmodified by dispersion, may be applied for vertical flowin the unsaturated zone and for groundwater flow to acertain point in a porous aquifer. It may also describe thedischarge from a homogeneous confined aquifer in whichthe flow-path lengths for the discharging groundwater areessentially the same. The piston-flow model may be usedas a simplified description of the flow in a single rockfracture. Regarding the complex pattern of fractures in arock aquifer, it is probable that water sampled at a certainlocation is a mixture of water that has been flowing along
a finite number of fractures, making the sample a mixtureof a finite number of waters with different ages.
In the present study it was assumed that a water samplerepresents a mixture of water that has reached thesampling point by piston flow along two distinct flow-paths, i.e., a binary mixing. This is probably an oversim-plification, but binary mixing is the simplest model tochoose. The binary mixing model can be motivated whenthe water is sampled at shallow depths in a sparse fracturenetwork and only a few conductive fractures are sampledat the same time. This model is often used when twodistinct end-members can be identified, for exampleregional groundwater and locally infiltrating water. Acommon assumption, which simplifies the analysis, whenusing CFCs and tritium as tracers is that one of theend-members is old groundwater that is free from themeasured tracers. Such applications are presented in e.g.,Aeschbach-Hertig et al. (1998), Plummer et al. (1998a),Plummer et al. (2000), and Rademacher et al. (2003).
If a sample is a mixture of water from N end-members,then 2N-1 conservative tracers with different inputfunctions are needed to determine the end-members andto calculate the relative contribution from each end-member (here an end-member is a time of recharge). Abinary mixture, for example, requires measurements ofthree tracers.
In addition to the CFCs, of which only CFC-12 couldbe considered conservative, tritium was used as a tracer.In this way two tracers were used for the binary mixinganalysis, which was not enough for getting uniquesolutions but it made it possible to calculate intervalsfor possible recharge years.
Mixing calculations were done to evaluate whichmixtures could explain the measured tracer concentra-tions. The referred series of atmospheric CFC concentra-tions (Walker et al. 2001) and tritium concentration inprecipitation were used as input. There was no long-termseries of tritium values in precipitation in Swedenavailable for the analysis. Therefore data from Norway(58 60N, 6 340E), from approximately the same latitude asthe field site, was used for the years 1961–1978 and datafrom Germany (50 190N, 11 530E) for the years 1979–1997 (IAEA/WMO 2002). Annual mean values of tritiumconcentration were calculated as the arithmetic mean ofmonthly values (Fig. 1).
The concentration of the tracers in water was calcu-lated for all binary mixtures of water recharged between1940 and 1999 with a time step of one year. For eachcombination of years, the fractions of the two waters inthe mixture were varied from 0 to 100%, with a step of1%. Water recharged in year 1940 is free from bothtritium and CFC-12 and is therefore equivalent to olderwater. The combined normalized squared deviation (e 2)between the modelled and measured concentrations wascalculated for each simulated mixture as:
e2 ¼c�T � cT
� �2
s2T
þc�CFC � cCFC
� �2
s2CFC
ð1Þ
Fig. 2 Schematic mixing diagram for two tracers. The concentra-tions of the tracers at the moment of recharge are plotted againsteach other for different times of recharge. The shaded areaenvelops all possible combinations of concentrations resulting frommixing
174
Hydrogeology Journal (2004) 12:171–183 DOI 10.1007/s10040-004-0319-3
where c�T , cT, c�CFC, and cCFC are the modelled andmeasured concentration of tritium and CFC-12, respec-tively. s2
T and s2CFC are the variances of each difference,
calculated as the sum of the variance of the measuredconcentration and the variance of the modelled concen-tration. For CFC-12, the latter is based on the uncertaintyof the atmospheric concentration for each year, report-ed by Walker et al. (2001), and the uncertainty of therecharge temperature which was assumed to be 1.5 C.Lacking other information, the uncertainty of the tritiuminput function was assumed to be 15%. The modelled andmeasured concentrations are expected to be approximate-ly normally distributed stochastic variables. Therefore, ifthe mean values of the modelled and measured concen-trations are equal, the combined normalized squareddifference, e2, is an approximately c2-distributed stochas-tic variable with two degrees of freedom. The hypothesisH 0, that the sample is a binary mixture of water rechargedin the years a1 and a2, could then be tested. H0 wasrejected at the level of significance of 1% if e2 >c2
2(0.01)=9.21. Acceptably matching binary mixtures werethen those with a difference e2 smaller than 9.21.
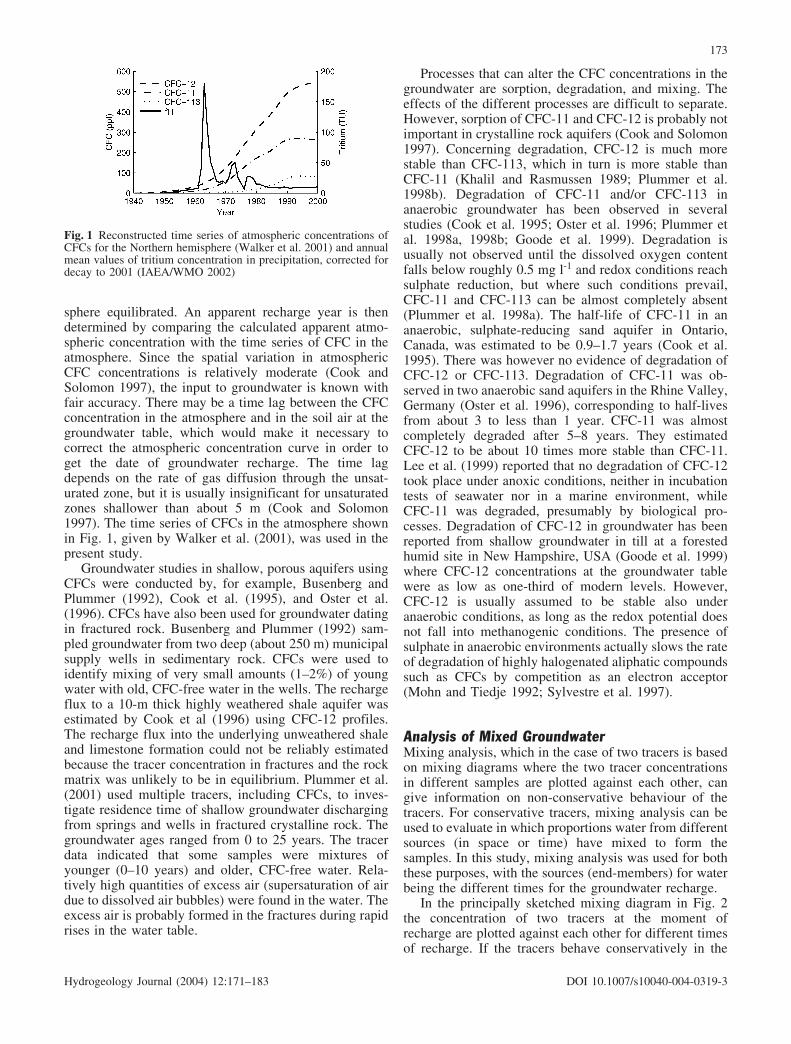
The Study AreaThe Finnsj�n study site is located about 140 km north ofStockholm, Sweden, as shown in Fig. 3. The site wasinvestigated from 1977 to 1992 by the Swedish NuclearFuel and Waste Management Company (SKB) (Ahlbomet al. 1992). Initially the objective was to assess thesuitability of the area to host a repository for nuclearwaste. The objective was later switched to more generalstudies of the nature of groundwater flow in fracturedrock. The activities also included testing of new instru-ments and methods. The studies involved coring 11 deepboreholes (255–730 m deep); drilling 20 percussionboreholes (the majority about 100 m deep); geophysical,geochemical and geohydraulic measurements; rock-me-chanical measurements; and conducting tracer tests.
The site consists of a 25 km2 large catchment drainingto northeast (Fig. 3). The area is comparatively flat and is
located on the Sub-Cambrian peneplain. Altitudes rangefrom about 20 to 40 m above sea level. The distance to thesea is about 12 km. Mean temperature is about 5.5 C,mean annual precipitation is about 670 mm and estimatedannual evapotranspiration is about 430 mm (Ahlbom et al.1992).
The bedrock consists of foliated granodiorite, with amean fracture frequency, measured both on outcrops andin boreholes, of 3 fractures/m (Ahlbom et al. 1992). Threefracture groups are defined in the following order of theirrelative occurrence: (a) Fractures with a steep dip 60–90 to the NW. (b) Fractures with a steep dip to the SW. (c)Flat lying fractures dipping 15–35 to the SW. The 14identified fracture zones on the site are oriented asindicated. The flow porosity in the rock mass in the upper100 m of the bedrock is estimated to be about 10�3.Outcrops are common, and constitute about 15% of thearea. The soils are dominated by till and peat depositswith a mean depth of about 2 m (Larsson and Jacobsson1982).
The regional groundwater flow is assumed to bedirected from southwest to northeast, with a hydraulicgradient of about 0.2–0.3% (Ahlbom et al. 1992). Locally,the shallow groundwater flow in the bedrock is divergingout from the central elevated area (Fig. 3) with localdischarge areas in the low-lying parts. The present studywas performed in boreholes along a transect from thetopographic divide to a local discharge area in which 17percussion boreholes with 115-mm diameters have beendrilled. The boreholes are all about 100 m deep and wereoriginally intended for water-level monitoring, water-injection tests and tracer tests. The water table in thebedrock is typically 0–2 m below the ground surface inlow-lying areas and 1–3 m below the ground surface athillslopes and on the hills (Andersson et al. 1989). Thereare also boreholes in the local discharge area where thewater level rises above the ground surface during parts ofthe year. The amplitude of the annual variation of thewater table is about 1 m. Depending on the local topo-graphy and soil cover thickness, there is groundwater inthe soil, with a water table that differs from that in thebedrock.
Sampled BoreholesThree boreholes, described in Table 1, were selected forgroundwater sampling, two upslope in the recharge areanear the topographic water divide (G14 and G13), and onedownslope near the discharge area (G3) (Fig. 3). Atborehole G14 the soil cover was 0.5 m deep whileboreholes G13 and G3 were located on outcrops. Theboreholes were without casing, apart from a steel casingextending from above the ground surface to somedecimetres into the rock. At about 60 m below thesurface there was a decrease in borehole diameter and nosampling was done below that depth.
The hydraulic conductivity (K) of the boreholes,shown in Fig. 4, has earlier been estimated from waterinjection tests (Swedish Nuclear Fuel and Waste Man-agement Company, unpublished data, 2001). For techni-
Fig. 3 Map of the study area with location of the boreholes selectedfor groundwater sampling. Modified from Andersson et al. (1989)
175
Hydrogeology Journal (2004) 12:171–183 DOI 10.1007/s10040-004-0319-3

cal reasons, the detection limit for K values was higher forthe measurements in borehole G3 than in the two otherboreholes. The mean hydraulic conductivity in the bore-holes (Fig. 4) was low in comparison to the three nearbycored boreholes. The geometric mean of K (measured in3-m sections) in the upper 100 m of the deep coredboreholes in the area is 1.7�10�8 m s�1 (Andersson et al.1989).
The general pattern of the hydraulic head in thebedrock is decreasing head with depth in elevated areasand increasing head with depth in low-lying areas. Thereare, however, local deviations from the general pattern.The hydraulic head in the larger fractures in borehole G3,located in the local discharge area, has for example beenobserved to decrease with depth, with a head difference ofabout 0.5 m between 32 and 92 m depth (Klockars andPersson 1978). The groundwater is fresh in boreholes G13and G14. In borehole G3 the groundwater has a higherchloride and sulphate content, with the chloride concen-tration increasing with depth to 300–400 mg/l, indicatinginfluence from relict sea water (Gustafsson and Klockars1983).
There is a possibility that samples taken in the pres-ent study in 2001 were affected by water injected during
earlier hydraulic tests. The boreholes were drilled in1977–78. The only injection of water in the sampledboreholes was by injection tests that were performed in1977 in borehole G3, and in 1980 in boreholes G13 andG14. Deep groundwater from other boreholes in the areawas used. The injected volumes were probably small, andthe boreholes were pumped after the injection tests inorder to decontaminate the aquifer from the injectedwater. However, such contamination cannot be complete-ly excluded, and the injections might have contributed tothe mixing of the groundwater around the boreholes.
Sampling Procedures and MeasurementsA first sampling campaign was done in June 2001 and asecond campaign in August 2001; dates are shown inTable 2. Groundwater levels were about 1 m lower inAugust than in June (Table 2). Borehole sections in whichthe observed hydraulic conductivity was comparativelyhigh were selected for sampling (Fig. 4). Water wassampled, between double packers with 2-m spacing, witha submersible pump (Grundfoss MP1). Sampling was alsodone using a submersible pump without packers inborehole G14. The water was pumped through Tecalanpolyamide tubing (inner diameter, 5 mm) to an apparatusfor collection of samples for CFC analysis. Electricalconductivity and dissolved oxygen were measured onthe pumped water using portable meters. Sampling wasdone after pumping a volume corresponding to threesection volumes. Procedures and equipment used tocollect the water samples were similar to those developedat U.S. Geological Survey Chlorofluorocarbon Laboratory(Busenberg and Plummer 1992). Triplicates were collect-ed for CFC analysis; also, for each sample a bottle ofwater was stored for tritium analysis.
The water samples were analyzed for CFC-11, CFC-12, and CFC-113 by using a purge-and-trap pre-treatmentsystem coupled to gas chromatographic separation andelectron capture detection. The analytical technique wasoriginally described by Bullister and Weiss (1988) and theinstrument used in this study was developed from this andpresented in detail by Fogelqvist (1999). The injectionpart of that instrument was modified in order to make itpossible to run ampoule samples. A flow of high-puritynitrogen pressures the water sample into a sample loop ofwell-defined volume. This means that the same volume ispurged for each analysis. It is necessary to determine thevolume of the samples to be able to correct for headspacegas volumes as described by Busenberg and Plummer
Table 1 Boreholes at Finnsj�n,Sweden, used for groundwatersampling
Borehole Elevation of land surface Groundwater levela Total depth
(m a.s.l.) (m a.s.l.) (m)
G14 36.32 32.49 100G13 34.18 30.99 100G3 27.10 23.21 99
m a.s.l. indicates meters above sea levela Measured before pumping; G14:2001-08-14; G13:2001-08-23 G3; 2001-08-24
Fig. 4 Hydraulic conductivity distributions in the sampled bore-holes at Finnsj�n, Sweden (Swedish Nuclear Fuel and WasteManagement Company, unpublished data, 2001). Levels forgroundwater sampling are indicated with arrows
176
Hydrogeology Journal (2004) 12:171–183 DOI 10.1007/s10040-004-0319-3

Sam
ple
No.
Bor
eho
leD
epth
Sam
plin
gda
teE
.CC
FC
-11
CF
C-1
2C
FC
-113
H2S
Tri
tium
(m)
(yym
mdd
)(m
Scm
-1)
nC
onc.
(pm
oll-1
)A
ppar
ent
rech
arge
year
nC
onc
(pm
oll-1
)A
ppar
ent
rech
arge
year
nC
onc.
(TU
)g
Mea
nS
tder
ror
Mea
nS
td.
erro
rM
ean
Std
.er
ror
Mea
nS
td.
erro
rM
ean
Std
.er
ror
1G
143a
01-0
6-25
181
14.
600.
092
1977
1.4
14.
120.
068
1997
bn.
d.c
Dd
-n.
d.n.
d.n.
d.2
G14
7-9
01-0
8-27
227
30.
000.
003
<19
501.
11
0.05
0.00
119
490.
4-
D3
16.8
1.7
3G
1436
-38
01-0
8-14
338
20.
040.
044
1952
2.9
10.
660.
011
1967
0.7
-D
217
.22.
14
G14
36-3
801
-08-
2738
73
0.03
0.00
219
510.
42
1.22
0.03
819
720.
8-
D3
17.1
1.7
5G
1442
a01
-06-
2523
02
0.02
0.00
3<
1950
0.4
20.
000.
000
<19
45n.
d.-
Dn.
d.n.
d.n.
d.6
G13
12-1
401
-08-
2376
20.
050.
029
1952
1.4
21.
740.
337
1975
2.3
--
318
.71.
77
G13
40-4
201
-08-
2327
43
0.06
0.01
619
530.
82
1.78
0.04
019
751.
0D
d-
317
.41.
68
G3
10-1
201
-08-
2437
82
0.07
0.00
419
530.
32
0.61
0.01
119
660.
6D
eD
316
.31.
79
G3
26-2
801
-08-
2496
52
0.01
0.00
4<
1950
0.4
20.
340.
007
1962
0.7
-D
312
.51.
610
G3
40-4
201
-08-
2417
503
0.06
0.02
119
531.
03
0.19
0.02
719
581.
2D
e,f
-3
9.2
1.6
E.C
.el
ectr
ical
cond
ucti
vity
;n
num
ber
ofsa
mpl
esus
edfo
rca
lcul
atio
nof
mea
nco
ncen
trat
ion
and
mea
nap
pare
ntre
char
geye
ar;
-su
bsta
nce
not
dete
cted
insa
mpl
es;
Dsu
bsta
nce
dete
cted
insa
mpl
es;
n.d.
not
dete
rmin
eda
Sam
pled
dire
ctly
inth
ebo
reho
lew
itho
utpa
cker
sb
Ass
umed
appa
rent
rech
arge
year
used
for
calc
ulat
ion
ofre
char
gete
mpe
ratu
rec
Rec
harg
eye
araf
ter
abou
t19
90d
Sig
nifi
cant
conc
entr
atio
n.C
ould
not
bequ
anti
fied
due
toin
terf
eren
ces
eC
once
ntra
tion
atde
tect
ion
lim
itf
Det
ecte
din
one
ofth
ree
sam
ples
gA
tda
teof
sam
plin
g
Tab
le2
Tra
cers
ingr
ound
wat
ersa
mpl
edat
Fin
nsj�
n,S
wed
en
177
Hydrogeology Journal (2004) 12:171–183 DOI 10.1007/s10040-004-0319-3
(1992). Calibration gases prepared at Brookhaven Na-tional Laboratory (Happell and Wallace 1997) and cross-calibrated against gases prepared at Scripps Institute ofOceanography, USA, were used for the standardisation ofthe CFCs. The gases were calibrated against the SIO-93scale. The analytical uncertainty was about 2% for CFC-11 and CFC-12 and 4% for CFC-113. In addition to theabove measurements, the occurrence of H2S and CCl4 wasnoted. Due to initial problems with the injection part ofthe analytical equipment only one or two of the triplicatesamples were analyzed for most of the samples (Table 2).The groundwater samples for tritium analysis weremeasured by counting in a low-level liquid scintillationcounter (Wallac Quantulus) with an uncertainty of about5%.
Results
Measurements during the purging of the sampled sectionsof the boreholes showed that electrical conductivity of thepumped water had stabilized before sampling, indicatingthat borehole water had been replaced by groundwaterfrom the sampled depth interval. The electrical conduc-tivity of the water generally increased with depth in allboreholes (Table 2) and noticeably much more in bore-hole G3. An anomaly is the low conductivity in the uppersection of borehole G13. The water from that section alsohad a noticeably brown colour, probably associated withhumic acids. The dissolved oxygen (DO) concentrationhad also stabilized before sampling. The DO concentra-tion was below 1 mg l-1 in all samples except for thesample from just below the water table (the uppermostsample) in borehole G14, which had a DO concentrationof about 2 mg l-1. Hydrogen sulphide (H2S) was detectedin many of the samples (Table 2).
In general, the samples had low CFC concentrations.An exception was the sample taken just below the watertable (Table 2). The CFC concentration of this samplewas used to estimate the recharge temperature, assumingthat the water was in equilibrium with the ambientatmosphere. In this way a recharge temperature of 3.5 Cwas obtained. The CFC-11 concentrations were generallylow, under 0.07 pmol l�1. CFC-12 concentrations werehigher and apparent recharge years spanned from pre-CFC age to 1975. The variation between individual sam-ples from the same section was small, giving apparentrecharge years varying by less than two years. The CFC-113 concentration was at or below the detection limit(about 0.02 pmol l�1) in most samples as indicated inTable 2. CFC-113 was therefore not further used in theevaluation. Another result from the analysis was thatcarbon tetrachloride (CCl4) was missing or detected inonly low concentrations in the samples.
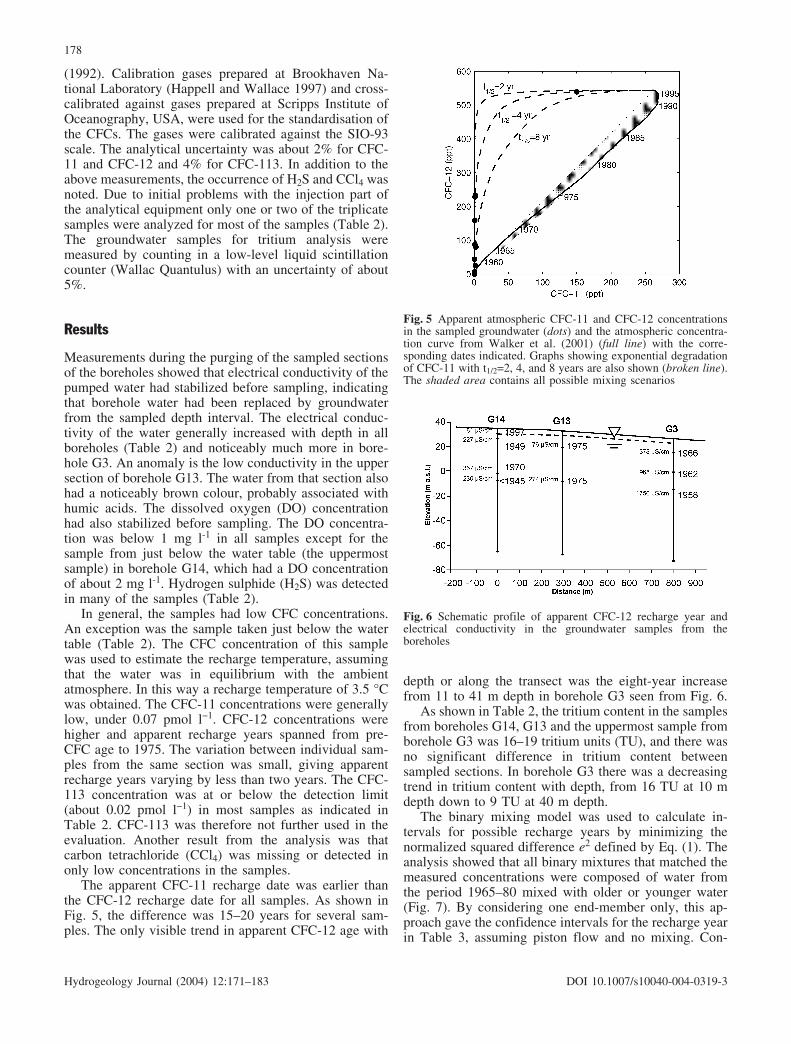
The apparent CFC-11 recharge date was earlier thanthe CFC-12 recharge date for all samples. As shown inFig. 5, the difference was 15–20 years for several sam-ples. The only visible trend in apparent CFC-12 age with
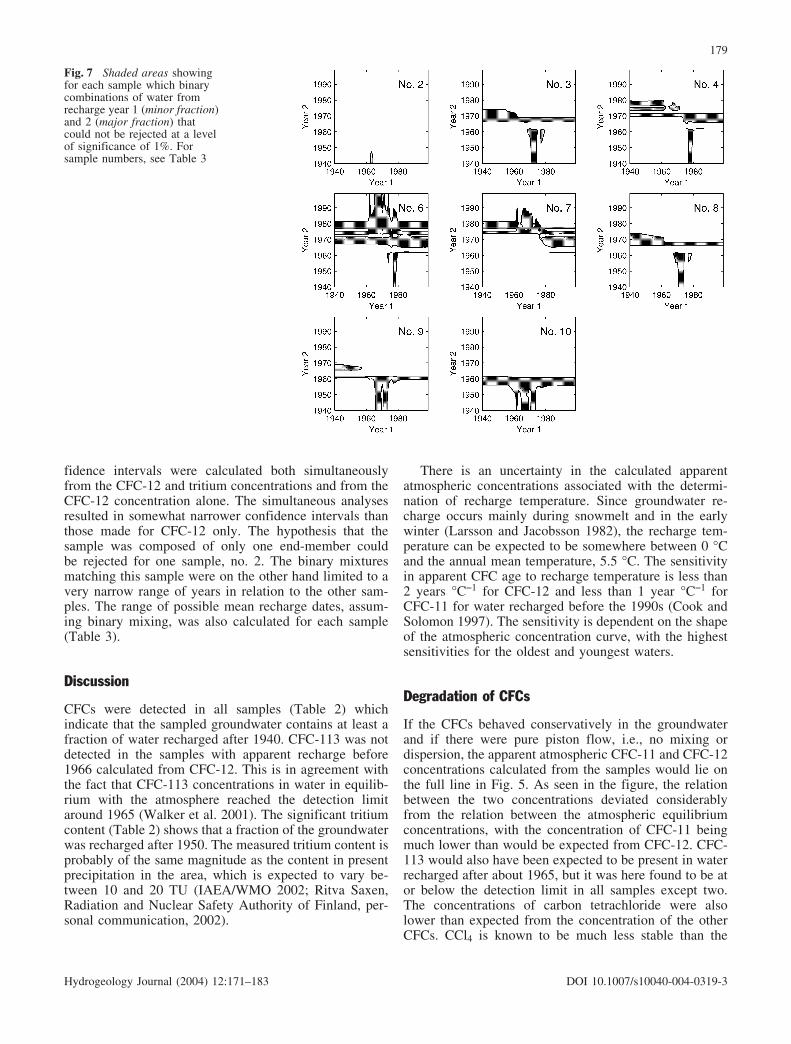
depth or along the transect was the eight-year increasefrom 11 to 41 m depth in borehole G3 seen from Fig. 6.
As shown in Table 2, the tritium content in the samplesfrom boreholes G14, G13 and the uppermost sample fromborehole G3 was 16–19 tritium units (TU), and there wasno significant difference in tritium content betweensampled sections. In borehole G3 there was a decreasingtrend in tritium content with depth, from 16 TU at 10 mdepth down to 9 TU at 40 m depth.
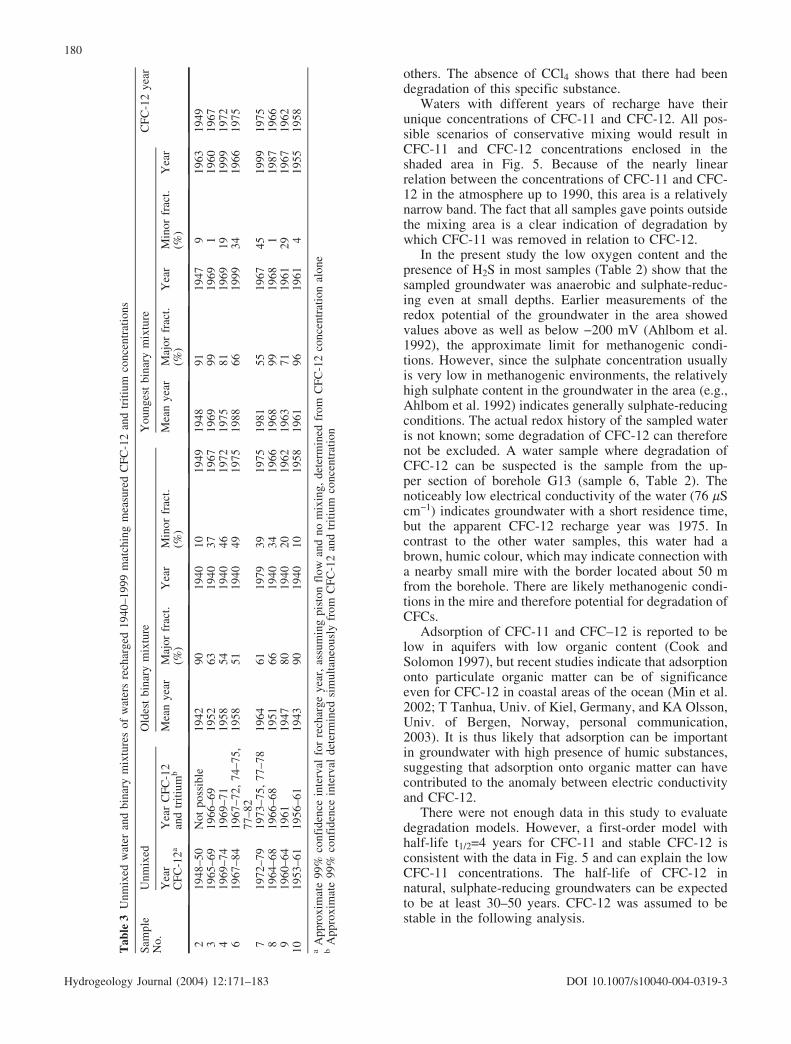
The binary mixing model was used to calculate in-tervals for possible recharge years by minimizing thenormalized squared difference e2 defined by Eq. (1). Theanalysis showed that all binary mixtures that matched themeasured concentrations were composed of water fromthe period 1965–80 mixed with older or younger water(Fig. 7). By considering one end-member only, this ap-proach gave the confidence intervals for the recharge yearin Table 3, assuming piston flow and no mixing. Con-
Fig. 5 Apparent atmospheric CFC-11 and CFC-12 concentrationsin the sampled groundwater (dots) and the atmospheric concentra-tion curve from Walker et al. (2001) (full line) with the corre-sponding dates indicated. Graphs showing exponential degradationof CFC-11 with t1/2=2, 4, and 8 years are also shown (broken line).The shaded area contains all possible mixing scenarios
Fig. 6 Schematic profile of apparent CFC-12 recharge year andelectrical conductivity in the groundwater samples from theboreholes
178
Hydrogeology Journal (2004) 12:171–183 DOI 10.1007/s10040-004-0319-3
fidence intervals were calculated both simultaneouslyfrom the CFC-12 and tritium concentrations and from theCFC-12 concentration alone. The simultaneous analysesresulted in somewhat narrower confidence intervals thanthose made for CFC-12 only. The hypothesis that thesample was composed of only one end-member couldbe rejected for one sample, no. 2. The binary mixturesmatching this sample were on the other hand limited to avery narrow range of years in relation to the other sam-ples. The range of possible mean recharge dates, assum-ing binary mixing, was also calculated for each sample(Table 3).
Discussion
CFCs were detected in all samples (Table 2) whichindicate that the sampled groundwater contains at least afraction of water recharged after 1940. CFC-113 was notdetected in the samples with apparent recharge before1966 calculated from CFC-12. This is in agreement withthe fact that CFC-113 concentrations in water in equilib-rium with the atmosphere reached the detection limitaround 1965 (Walker et al. 2001). The significant tritiumcontent (Table 2) shows that a fraction of the groundwaterwas recharged after 1950. The measured tritium content isprobably of the same magnitude as the content in presentprecipitation in the area, which is expected to vary be-tween 10 and 20 TU (IAEA/WMO 2002; Ritva Saxen,Radiation and Nuclear Safety Authority of Finland, per-sonal communication, 2002).
There is an uncertainty in the calculated apparentatmospheric concentrations associated with the determi-nation of recharge temperature. Since groundwater re-charge occurs mainly during snowmelt and in the earlywinter (Larsson and Jacobsson 1982), the recharge tem-perature can be expected to be somewhere between 0 Cand the annual mean temperature, 5.5 C. The sensitivityin apparent CFC age to recharge temperature is less than2 years C�1 for CFC-12 and less than 1 year C�1 forCFC-11 for water recharged before the 1990s (Cook andSolomon 1997). The sensitivity is dependent on the shapeof the atmospheric concentration curve, with the highestsensitivities for the oldest and youngest waters.
Degradation of CFCs
If the CFCs behaved conservatively in the groundwaterand if there were pure piston flow, i.e., no mixing ordispersion, the apparent atmospheric CFC-11 and CFC-12concentrations calculated from the samples would lie onthe full line in Fig. 5. As seen in the figure, the relationbetween the two concentrations deviated considerablyfrom the relation between the atmospheric equilibriumconcentrations, with the concentration of CFC-11 beingmuch lower than would be expected from CFC-12. CFC-113 would also have been expected to be present in waterrecharged after about 1965, but it was here found to be ator below the detection limit in all samples except two.The concentrations of carbon tetrachloride were alsolower than expected from the concentration of the otherCFCs. CCl4 is known to be much less stable than the
Fig. 7 Shaded areas showingfor each sample which binarycombinations of water fromrecharge year 1 (minor fraction)and 2 (major fraction) thatcould not be rejected at a levelof significance of 1%. Forsample numbers, see Table 3
179
Hydrogeology Journal (2004) 12:171–183 DOI 10.1007/s10040-004-0319-3
others. The absence of CCl4 shows that there had beendegradation of this specific substance.
Waters with different years of recharge have theirunique concentrations of CFC-11 and CFC-12. All pos-sible scenarios of conservative mixing would result inCFC-11 and CFC-12 concentrations enclosed in theshaded area in Fig. 5. Because of the nearly linearrelation between the concentrations of CFC-11 and CFC-12 in the atmosphere up to 1990, this area is a relativelynarrow band. The fact that all samples gave points outsidethe mixing area is a clear indication of degradation bywhich CFC-11 was removed in relation to CFC-12.
In the present study the low oxygen content and thepresence of H2S in most samples (Table 2) show that thesampled groundwater was anaerobic and sulphate-reduc-ing even at small depths. Earlier measurements of theredox potential of the groundwater in the area showedvalues above as well as below �200 mV (Ahlbom et al.1992), the approximate limit for methanogenic condi-tions. However, since the sulphate concentration usuallyis very low in methanogenic environments, the relativelyhigh sulphate content in the groundwater in the area (e.g.,Ahlbom et al. 1992) indicates generally sulphate-reducingconditions. The actual redox history of the sampled wateris not known; some degradation of CFC-12 can thereforenot be excluded. A water sample where degradation ofCFC-12 can be suspected is the sample from the up-per section of borehole G13 (sample 6, Table 2). Thenoticeably low electrical conductivity of the water (76 mScm�1) indicates groundwater with a short residence time,but the apparent CFC-12 recharge year was 1975. Incontrast to the other water samples, this water had abrown, humic colour, which may indicate connection witha nearby small mire with the border located about 50 mfrom the borehole. There are likely methanogenic condi-tions in the mire and therefore potential for degradation ofCFCs.
Adsorption of CFC-11 and CFC–12 is reported to below in aquifers with low organic content (Cook andSolomon 1997), but recent studies indicate that adsorptiononto particulate organic matter can be of significanceeven for CFC-12 in coastal areas of the ocean (Min et al.2002; T Tanhua, Univ. of Kiel, Germany, and KA Olsson,Univ. of Bergen, Norway, personal communication,2003). It is thus likely that adsorption can be importantin groundwater with high presence of humic substances,suggesting that adsorption onto organic matter can havecontributed to the anomaly between electric conductivityand CFC-12.
There were not enough data in this study to evaluatedegradation models. However, a first-order model withhalf-life t1/2=4 years for CFC-11 and stable CFC-12 isconsistent with the data in Fig. 5 and can explain the lowCFC-11 concentrations. The half-life of CFC-12 innatural, sulphate-reducing groundwaters can be expectedto be at least 30–50 years. CFC-12 was assumed to bestable in the following analysis.
Tab
le3
Unm
ixed
wat
eran
dbi
nary
mix
ture
sof
wat
ers
rech
arge
d19
40–1
999
mat
chin
gm
easu
red
CF
C-1
2an
dtr
itiu
mco
ncen
trat
ions
Sam
ple
No.
Unm
ixed
Old
est
bina
rym
ixtu
reY
oung
est
bina
rym
ixtu
reC
FC
-12
year
Yea
rC
FC
-12a
Yea
rC
FC
-12
and
trit
ium
bM
ean
year
Maj
orfr
act.
(%)
Yea
rM
inor
frac
t.(%
)M
ean
year
Maj
orfr
act.
(%)
Yea
rM
inor
frac
t.(%
)Y
ear
219
48–5
0N
otpo
ssib
le19
4290
1940
1019
4919
4891
1947
919
6319
493
1965
–69
1966
–69
1952
6319
4037
1967
1969
9919
691
1960
1967
419
69–7
419
69–7
119
5854
1940
4619
7219
7581
1969
1919
9919
726
1967
–84
1967
–72,
74–7
5,77
–82
1958
5119
4049
1975
1988
6619
9934
1966
1975
719
72–7
919
73–7
5,77
–78
1964
6119
7939
1975
1981
5519
6745
1999
1975
819
64–6
819
66–6
819
5166
1940
3419
6619
6899
1968
119
8719
669
1960
–64
1961
1947
8019
4020
1962
1963
7119
6129
1967
1962
1019
53–6
119
56–6
119
4390
1940
1019
5819
6196
1961
419
5519
58
aA
ppro
xim
ate
99%
conf
iden
cein
terv
alfo
rre
char
geye
ar,
assu
min
gpi
ston
flow
and
nom
ixin
g,de
term
ined
from
CF
C-1
2co
ncen
trat
ion
alon
eb
App
roxi
mat
e99
%co
nfid
ence
inte
rval
dete
rmin
edsi
mul
tane
ousl
yfr
omC
FC
-12
and
trit
ium
conc
entr
atio
n
180
Hydrogeology Journal (2004) 12:171–183 DOI 10.1007/s10040-004-0319-3
Binary Mixing
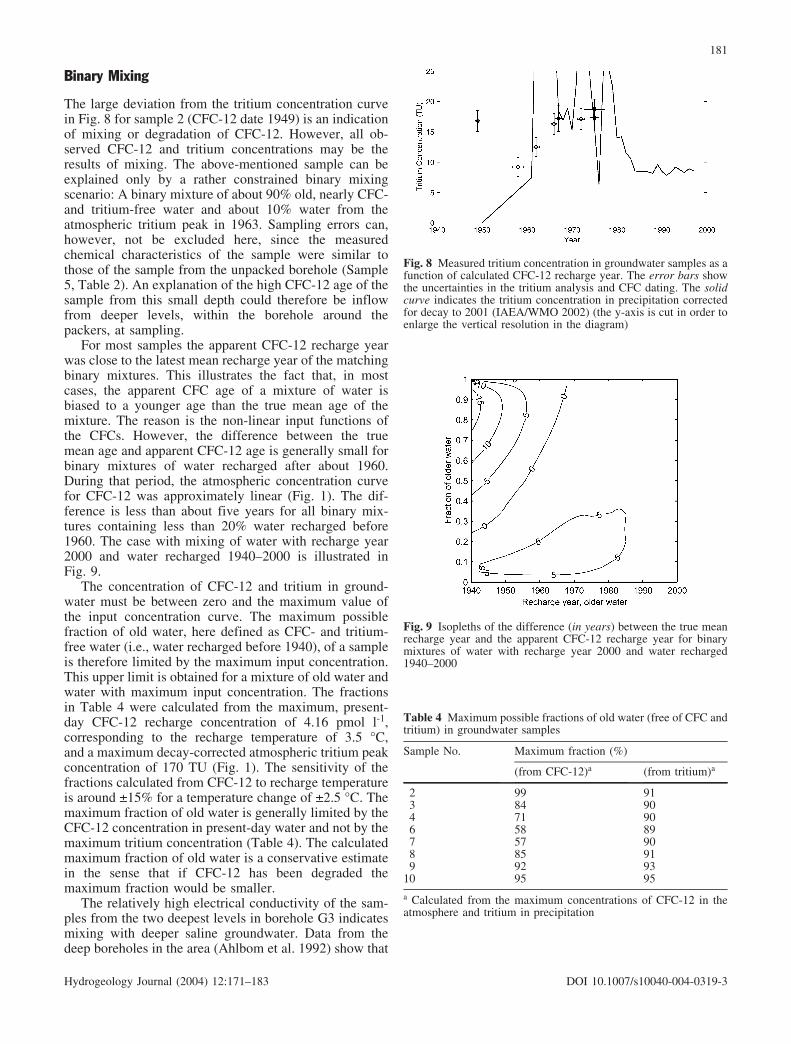
The large deviation from the tritium concentration curvein Fig. 8 for sample 2 (CFC-12 date 1949) is an indicationof mixing or degradation of CFC-12. However, all ob-served CFC-12 and tritium concentrations may be theresults of mixing. The above-mentioned sample can beexplained only by a rather constrained binary mixingscenario: A binary mixture of about 90% old, nearly CFC-and tritium-free water and about 10% water from theatmospheric tritium peak in 1963. Sampling errors can,however, not be excluded here, since the measuredchemical characteristics of the sample were similar tothose of the sample from the unpacked borehole (Sample5, Table 2). An explanation of the high CFC-12 age of thesample from this small depth could therefore be inflowfrom deeper levels, within the borehole around thepackers, at sampling.
For most samples the apparent CFC-12 recharge yearwas close to the latest mean recharge year of the matchingbinary mixtures. This illustrates the fact that, in mostcases, the apparent CFC age of a mixture of water isbiased to a younger age than the true mean age of themixture. The reason is the non-linear input functions ofthe CFCs. However, the difference between the truemean age and apparent CFC-12 age is generally small forbinary mixtures of water recharged after about 1960.During that period, the atmospheric concentration curvefor CFC-12 was approximately linear (Fig. 1). The dif-ference is less than about five years for all binary mix-tures containing less than 20% water recharged before1960. The case with mixing of water with recharge year2000 and water recharged 1940–2000 is illustrated inFig. 9.
The concentration of CFC-12 and tritium in ground-water must be between zero and the maximum value ofthe input concentration curve. The maximum possiblefraction of old water, here defined as CFC- and tritium-free water (i.e., water recharged before 1940), of a sampleis therefore limited by the maximum input concentration.This upper limit is obtained for a mixture of old water andwater with maximum input concentration. The fractionsin Table 4 were calculated from the maximum, present-day CFC-12 recharge concentration of 4.16 pmol l-1,corresponding to the recharge temperature of 3.5 C,and a maximum decay-corrected atmospheric tritium peakconcentration of 170 TU (Fig. 1). The sensitivity of thefractions calculated from CFC-12 to recharge temperatureis around €15% for a temperature change of €2.5 C. Themaximum fraction of old water is generally limited by theCFC-12 concentration in present-day water and not by themaximum tritium concentration (Table 4). The calculatedmaximum fraction of old water is a conservative estimatein the sense that if CFC-12 has been degraded themaximum fraction would be smaller.
The relatively high electrical conductivity of the sam-ples from the two deepest levels in borehole G3 indicatesmixing with deeper saline groundwater. Data from thedeep boreholes in the area (Ahlbom et al. 1992) show that
Fig. 8 Measured tritium concentration in groundwater samples as afunction of calculated CFC-12 recharge year. The error bars showthe uncertainties in the tritium analysis and CFC dating. The solidcurve indicates the tritium concentration in precipitation correctedfor decay to 2001 (IAEA/WMO 2002) (the y-axis is cut in order toenlarge the vertical resolution in the diagram)
Fig. 9 Isopleths of the difference (in years) between the true meanrecharge year and the apparent CFC-12 recharge year for binarymixtures of water with recharge year 2000 and water recharged1940–2000
Table 4 Maximum possible fractions of old water (free of CFC andtritium) in groundwater samples
Sample No. Maximum fraction (%)
(from CFC-12)a (from tritium)a
2 99 913 84 904 71 906 58 897 57 908 85 919 92 93
10 95 95
a Calculated from the maximum concentrations of CFC-12 in theatmosphere and tritium in precipitation
181
Hydrogeology Journal (2004) 12:171–183 DOI 10.1007/s10040-004-0319-3

the deep saline groundwater has an electrical conductivityof about 15,000 mS cm�1 corresponding to a chloridecontent of about 5,000 mg l�1. The fraction of saline waterin the groundwater samples was calculated assumingbinary mixtures between the saline water (15,000 mScm�1) and freshwater (400 mS cm�1). The saline fractionwas calculated to be 4% and 9% at 27 m and 41 m depth,respectively. The change in apparent CFC-12 rechargeyear due to dilution of the young freshwater by the salinefraction is less than 1 year. Water from 100 m depth inborehole KF108, located about 100 m from borehole G3,has been found to have a chloride content (450 mg l�1 Cl�)comparable to the deepest sample from borehole G3 andsignificant tritium content (16 TU 1981). The apparentC-14 age of that water was very old, about 5,800 years(Andersson et al. 1989).
Conclusions
In the studied bedrock aquifer the groundwater turned outto be anaerobic and sulphate reducing even at smalldepths. Degradation of CFCs could therefore be expected.In all samples the CFC-11 and CFC-113 concentrationswere low in relation to the CFC-12 concentrations,indicating degradation of CFC-11 and CFC-113. Degra-dation of CFC-12 is not likely under the present geo-chemical conditions, but it could not be excluded. CFC-12was considered conservative and was used together withtritium for the dating.
The apparent CFC-12 dating of the samples range frombefore 1945 to 1975, with the exception of the sampletaken just below the water table, which had present-dayconcentrations. CFCs could not be used to make quan-titative conclusions about flow paths and velocity of thegroundwater at this site. The only distinguishable trend inapparent CFC-12 age is the increase in age with depth inborehole G3. This trend is in accordance with a decreasein tritium content and an increase in salinity with depth.
Due to the irregular groundwater flow pattern which isdetermined by the fracture system, groundwater in frac-tured rock is expected to be a mixture of waters withdifferent ages. It was found from the CFC-12 and tritiumcontent in the groundwater that all samples could bemixtures. Since CFCs and tritium were detected in allsamples, at least a fraction of the sampled groundwaterwas recharged after 1950. The maximum possible fractionof old water (free from CFC and tritium) in the sampleswas calculated from the maximum input concentrations ofeither CFC-12 or tritium and ranged from 57 to 95%.
The rough assumption was made that the sampledwater was binary mixtures of waters recharged between1940 and 1999. Water recharged in 1940 is free from bothtritium and CFC-12 and is therefore equivalent to olderwater. The binary mixtures matching the measured CFC-12 and tritium concentrations were then determined. Inthis way, the range in mean age of the matching mixturescould be calculated. Due to the degradation of CFC-11and CFC-113 only two tracers were available, and there-
fore no unique solutions of mixtures existed. The pre-sented approach is, however, useful to constrain the pos-sible mixture scenarios and the approach can be extendedwith additional tracers.
Acknowledgements This study was funded by the GeologicalSurvey of Sweden (SGU) (contract 03–1139/2000) and by a grantfrom the environmental fund of the Swedish Association ofGraduate Engineers (CF). The Nuclear Fuel and Waste Manage-ment Co. (SKB) kindly permitted access to their boreholes. Theauthors thank Geosigma AB for providing field equipment andgiving access to unpublished material concerning the Finnsj�n site.The authors would also like to thank the Geological Survey ofDenmark and Greenland (GEUS) and Troels Laier for providingvaluable advice and equipment for CFC sampling. We are gratefulto S�ren Karlsson, Department of Earth Sciences, Uppsala Uni-versity, for the assistance in preparing the field equipment. Thepaper has benefited from valuable and constructive reviews byPeter G. Cook and one anonymous reviewer.
References
Aeschbach-Hertig W, Sclosser P, Stute M, Simpson HJ, Ludin A,Clark JF (1998) A 3H/3He study of groundwater flow in afractured bedrock aquifer. Ground Water 36:661–670
Ahlbom K, Andersson J-E, Andersson P, Ittner T, Ljunggren C,Tir�n S (1992) Finnsj�n study site. Scope of activities and mainresults. Swedish Nuclear Fuel and Waste Management Co.(SKB). SKB Tech Rep 92–33
Andersson J-E, Nordqvist R, Nyberg G, Smellie J, Tir�n S (1989)Hydrogeological conditions in the Finnsj�n area. Compilationof data and conceptual model. Swedish Nuclear Fuel and WasteManagement Co. (SKB). SKB Arbetsrapport 89–24
Bu X, Warner MJ (1995) Solubility of chlorofluorocarbon 113 inwater and seawater. Deep-Sea Res 42:1151–1161
Bullister JL, Weiss RF (1988) Determination of CCl3F and CCl2F2in seawater and air. Deep-Sea Res 35:839–853
Busenberg E, Plummer LN (1992) Use of chlorofluorocarbons(CCl3F and CCl2F2) as hydrologic tracers and age-dating tools:the alluvium and terrace system of Central Oklahoma. WaterResour Res 28:2257–2283
Cook PG, Solomon DK (1997) Recent advances in dating younggroundwater: chlorofluorocarbons, 3H/3He and 85Kr. J Hydrol191:245–265
Cook PG, Solomon DK, Plummer LN, Busenberg E, Schiff SL(1995) Chlorofluorocarbons as tracers of groundwater transportprocesses in a shallow, silty sand aquifer. Water Resour Res31:425–434
Cook PG, Solomon DK, Sanford WE, Busenberg E, Plummer LN,Poreda RJ (1996) Inferring shallow groundwater flow insaprolite and fractured rock using environmental tracers. WaterResour Res 32:1501–1509
Eriksson E (1958) The possible use of tritium for estimatinggroundwater storage. Tellus 10:472–478
Eriksson E (1963) Atmospheric tritium as a tool for the study ofcertain hydrologic aspects in river basins. Tellus 15:303–308
Fogelqvist E (1999) Determination of volatile halocarbons inseawater. In: Grasshoff K, Kremling K, Ehrhardt M (eds)Methods of seawater analysis. Wiley-VCH, Weinheim, pp 501–519
Goode DJ, Busenberg E, Plummer LN, Shapiro AM, Vroblesky DA(1999) CFC’s in the unsaturated zone and in shallow ground-water at Mirror Lake, New Hampshire. In: Morganwalp DW,Buxton HT (eds) USGS Toxic Substances Hydrology Program:Technical meeting March 8–12 1999, USGS Water-ResourcesInvestigations Report 99–4018C, vol 3, pp 809–820
Gustafsson E, Klockars C-E (1983) Studie av strontiums ochcesiums migration i kristallin berggrund [A study of migrationof strontium and caesium in crystalline rock] (in Swedish).
182
Hydrogeology Journal (2004) 12:171–183 DOI 10.1007/s10040-004-0319-3

Swedish Nuclear Fuel and Waste Management Co. (SKB).SKBF/KBS Arbetsrapport 83–29
Happell JD, Wallace DWR (1997) Gravimetric preparation of gasphase working standards containing volatile halogenated com-pounds for oceanographic applications. Deep-Sea Res Part I-Oceanographic Res Pap 44:1725–1738
IAEA/WMO (2002) Global network for isotopes in precipitation.The GNIP database. URL:http://isohis.iaea.org (10 November2002)
Khalil MAK, Rasmussen RA (1989) The potential of soils as sinksof chlorofluorocarbons and other man-made chlorocarbons.Geophys Res Lett 16:679–682
Klockars C-E, Persson O (1978) Berggrundvattenf�rhllanden iFinnsj�omrdets nord�stra del [Groundwater conditions inbedrock in the North Eastern Finnsj�n area] (in Swedish).Swedish Nuclear Fuel and Waste Management Co. (SKB).KBS Tech Rep 60
Larsson N-�, Jacobsson J-� (1982) Studier av grundvattenytan�ver tv sprickzoner i Finnsj�ns unders�kningsomrde [Studiesof the groundwater table over two fracture zones in theFinnsj�n area] (in Swedish). Swedish Nuclear Fuel and WasteManagement Co. (SKB). KBS Arbetsrapport 82–36
Lee BS, Bullister JL, Whitney FA (1999) Chlorofluorocarbon CFC-11 and carbon tetrachloride removal in Saanich Inlet, anintermittently anoxic basin. Mar Chem 66:171–185
Lovelock JE, Maggs RJ, Wade RA (1973) Halogenated hydrocar-bons in and over the Atlantic. Nature 241:194–196
Małoszewski P, Zuber A (1982) Determining the turnover time ofgroundwater systems with the aid of environmental tracers, I.Models and their applicability. J Hydrol 57:207–231
Min D-H, Bullister JL, Weiss RF (2002) Anomalous chlorofluo-rocarbons in the Southern California Basins. Geophys Res Lett29:16-1-16-4. DOI:10.1029/2002GL015408
Mohn WW, Tiedje JM (1992) Microbial reductive dehalogenation.Microbiol Rev 56:482–507
Oster H, Sonntag C, M�nnich KO (1996) Groundwater age datingwith chlorofluorocarbons. Water Resour Res 32:2989–3001
Plummer LN, Busenberg E, B�hlke JK, Nelms DL, Michel RL,Schlosser P (2001) Groundwater residence times in Shenan-doah National Park, Blue Ridge Mountains, Virginia, USA: amulti tracer approach. Chem Geol 179:93–111
Plummer LN, Busenberg E, Drenkard S, Schlosser P, Ekwurzel B,Weppernig R, McConnell JB, Michel RL (1998b) Flow of riverwater into a karstic limestone aquifer. 2. Dating the youngfraction in groundwater mixtures in the Upper Floridan Aquifernear Valdosta, Georgia. Appl Geochem 13:1017–1043
Plummer LN, Busenberg E, McConnell JB, Drenkard S, SchlosserP, Michel RL (1998a) Flow of river water into a karsticlimestone aquifer. 1. Tracing the young fraction in groundwatermixtures in the Upper Floridan Aquifer near Valdosta, Georgia.Appl Geochem 13:995–1015
Plummer LN, Rupert, MG, Busenberg E, Schlosser P (2000) Age ofirrigation water in ground water from the eastern Snake RiverPlane aquifer, south-central Idaho. Ground Water 38:264–283
Rademacher LK, Clark JF, Boles JR (2003) Groundwater residencetimes and flow paths in fractured rock determined usingenvironmental tracers in the Mission Tunnel; Santa BarbaraCounty, California, USA. Environ Geol 43:557–567
Sylvestre M, Bertrand JL, Viel G (1997) Feasibility study for thepotential use of biocatalytical systems to destroy chlorofluoro-carbons (CFCs). Crit Rev Environ Sci Technol 27:87–111
Thompson GM, Hayes JM (1979) Trichlorofluoromethane ingroundwater—a possible tracer and indicator of groundwaterage. Water Resour Res 15:546–554
Walker SJ, Weiss RF, Salameh PK (2001) Reconstructed historiesof the annual mean atmospheric mole fractions for the halo-carbons CFC-11, CFC-12, CFC-113 and Carbon Tetrachloride.URL:http://gaslab.ucsd.edu/pub/cfchist/ (13 September 2001)
Warner MJ, Weiss RF (1985) Solubilities of chlorofluorocarbons11 and 12 in water and seawater. Deep-Sea Res 32:1485–1497
183
Hydrogeology Journal (2004) 12:171–183 DOI 10.1007/s10040-004-0319-3
Copyright © 2022 FDOKUMEN