
Simulation of aquifer-peatland-river interactions under climate change
17
Provided for non-commercial research and educational use only. Not for reproduction or distribution or commercial use. This article was originally published by IWA Publishing. IWA Publishing recognizes the retention of the right by the author(s) to photocopy or make single electronic copies of the paper for their own personal use, including for their own classroom use, or the personal use of colleagues, provided the copies are not offered for sale and are not distributed in a systematic way outside of their employing institution. Please note that you are not permitted to post the IWA Publishing PDF version of your paper on your own website or your institution’s website or repository. Please direct any queries regarding use or permissions to [email protected]
Transcript of Simulation of aquifer-peatland-river interactions under climate change

Provided for non-commercial research and educational use only Not for reproduction or distribution or commercial use
This article was originally published by IWA Publishing IWA Publishing recognizes the retention of the right by the author(s) to photocopy or make single electronic
copies of the paper for their own personal use including for their own classroom use or the personal use of colleagues provided the copies are not offered for sale and
are not distributed in a systematic way outside of their employing institution
Please note that you are not permitted to post the IWA Publishing PDF version of your paper on your own website or your institutionrsquos website or repository
Please direct any queries regarding use or permissions to hydrologyiwapcouk
425 copy IWA Publishing 2014 Hydrology Research | 453 | 2014
Simulation of aquifer-peatland-river interactions under
climate change
M A Bourgault M Larocque and M Roy
ABSTRACT
Wetlands play an important role in preventing extreme low flows in rivers and groundwater level
drawdowns during drought periods This hydrological function could become increasingly important
under a warmer climate Links between peatlands aquifers and rivers remain inadequately
understood The objective of this study was to evaluate the hydrologic functions of the Lanoraie
peatland complex in southern Quebec Canada under different climate conditions This peatland
complex has developed in the beds of former fluvial channels during the final stages of the last
deglaciation The peatland covers a surface area of sim76 km2 and feeds five rivers Numerical
simulations were performed using a steady-state groundwater flow model Results show that the
peatland contributes on average to 77 of the mean annual river base flow The peatland receives
52 of its water from the aquifer Reduced recharge scenarios (20 and 50 of current conditions)
were used as a surrogate of climate change With these scenarios the simulated mean head
decreases by 06 and 16 m in the sand The mean river base flow decreases by 16 and 41 with the
two scenarios These results strongly underline the importance of aquifer-peatland-river interactions
at the regional scale They also point to the necessity of considering the entire hydrosystem in
conservation initiatives
doi 102166nh2013228
M A Bourgault (corresponding author)M LarocqueM RoyDeacutepartement des sciences de la Terre et de
lrsquoatmosphegravere ndash Universiteacute du Queacutebec agraveMontreacuteal
CP 8888succ Centre-VilleMontreacuteal (QC)Canada H3C 3P8E-mail bmarc77gmailcom
M A BourgaultM LarocqueESCER (Eacutetude et simulation du climat agrave lrsquoeacutechelle
reacutegionale) and GEC3 (Global Environment andClimate Change Center) Research Centers
M LarocqueM RoyGEOTOP Research Center in geochemistry and
geodynamics
Key words | aquifer climate change Lanoraie (Queacutebec Canada) peatland river
INTRODUCTION
Peatlands comprise over 50 of the worldrsquos wetlands (Bragg amp
Lindsay ) and represent over 90 of Canadian wetlands
(Tarnocai ) They are well recognized for their role in
sequestrating atmospheric CO2 and CH4 (Roulet
Yli-Petays et al Worrall et al ) Peatlands also
represent important ecosystems and valuable wildlife habi-
tats which provide a wide range of benefits to humans
such as limiting floods sustaining river base flows and
maintaining high groundwater levels over large areas
(Dowrick et al Querner et al ) Unfortunately
wetland loss and degradation currently represent a major
cause of concern for peatland sustainability (Finlayson
et al ) Human activities such as urban expansion agri-
culture (Poulin et al ) and climate change (Wattendorf
et al ) are considered the main causes for worldwide
wetland degradation The growing recognition of the
importance of peatlands as ecosystems has led to a recent
increase in peatland hydrology studies Consequently
there has been a growing appreciation of these systems as
vital economic and ecological resources because they con-
tribute to biological landscape and cultural diversity
(Bragg amp Lindsay )
Many peatlands are groundwater-fed by local or
regional aquifer systems Although studies have pointed to
the importance of peatlands on the watershed water bal-
ance groundwater recharge base flows and river flow
variability (eg Bullock amp Acreman ) the mechanisms
connecting peatlands to local or regional groundwater
flows or to rivers remain incompletely understood
Hydraulic conductivities of the surrounding aquifer
peatland topography (Bradley amp Gilvear ) the extent
of the unsaturated zone in the peat (Reeve et al )
426 M A Bourgault et al | Simulation of aquifer-peatland-river interactions under climate change Hydrology Research | 453 | 2014
recharge to the organic deposits (Delin et al ) and peat
specific storage (Reeve et al ) are among the par-
ameters and processes known to influence peatland
hydrology Conceptual models such as the acrotelm-cato-
telm model (Hilbert et al Holden amp Burt ) and
the double porosity model (Rossi et al ) have been pro-
posed to understand water dynamics within a peatland and
its influence at regional scale Reeve et al () have shown
through simulations that groundwater contribution to peat-
lands can be dominated by a local and subregional flow
Peatland hydrology is also strongly influenced by land uses
(drainage agriculture groundwater extraction peat
mining) (Foley et al Candela et al ) and climate
change (Whittington amp Price )
Numerical models have proven effective to better under-
stand peatland hydrology particularly in characterizing flow
processes occurring at the peatland surface (Holden et al
) and subsurface flow processes such as aquifer-
peatland exchanges (Fraser et al ) For example
Kvaerner amp Klove () have used hydrological modeling
to show that during low flow periods water within rivers ori-
ginated mainly from peat storage while during high flow
streams were feeding the peatland However relatively few
studies report the use of a hydrogeologic numerical model
to understand the influence of peatland on the regional
hydrology under climate and human-induced perturbations
One example is the study of Levison et al () who
showed that a headwater peatland could switch from an
aquifer-fed peatland to an aquifer-recharging peatland
under climate change-induced recharge reduction
The objective of this study was to evaluate the hydrolo-
gic functions of a peatland under different climatic
conditions The study site is the Lanoraie peatland complex
located in southern Quebec (Canada) This peatland com-
plex is the largest in southern Quebec (76 km2) and it is
the site of an ecological preservation known as the Reacuteserve
eacutecologique des Tourbiegraveres-de-Lanoraie (42 km2) This site
has been studied for various aspects over many years
(Comtois Ameacutenatech Rosa amp Larocque
Rosa et al TechnoREM Tousignant et al
Lamarre amp Pellerin ) TechnoREM () has
developed a regional-scale groundwater flow model to
simulate flows in the superficial aquifer Although it
covers the Lanoraie peatland complex this model does
not represent the organic deposits as a heterogeneous
porous media nor does it simulate aquifer-peatland-river
exchanges In the current study a tridimensional ground-
water flow model is built to simulate specifically these
regional aquifer-peatland-river exchanges The model
includes a detailed tridimensional representation of the
peatland complex This model is calibrated for current con-
ditions and it is used to simulate decreasing recharge
scenarios resulting from changing climate conditions
Increased pumping of groundwater for irrigation and
human consumption is also considered as an additional
stress to the hydrosystem
STUDY SITE AND METHODS
Study area
The Lanoraie peatland complex (45058Prime N 73020Prime W) is
located 40 km northeast of Montreal (Quebec Canada)
(Figure 1(a)) The peatland complex is part of a hydrosys-
tem composed of five catchment areas (Saint-Joseph
Point-du-Jour Saint-Jean Saint-Antoine and Bras-sud-
ouest rivers) where surface water and groundwater are
used for human consumption and agriculture The average
monthly air temperature ranges from 114 WC in January
to 206 WC in July The average total annual precipitation
is approximately 1019 mmyr 20 of which falls as
snow (Ministegravere du Deacuteveloppement durable de
lrsquoEnvironnement de la Faune et des Parcs (MDDEFP)
) The Lanoraie peatland is mostly composed of miner-
otrophic peat but also includes three ombrotrophic areas
(Figure 1(a))
The Lanoraie peatland complex region has a strong agri-
cultural vocation and 84 of the territory is used for
agriculture (TechnoREM ) The major crops are pota-
toes carrots onions sweet corns squashes cranberries
and strawberries In many locations irrigation water
comes from pumped groundwater or is harvested from
small reservoirs excavated at the border of the peatland
Some areas of the peatland have been completely
drained for the construction of small roads for organic
soil production and for agriculture A vegetation analysis
carried out in the peatland complex shows that lsquoabioticrsquo
Figure 1 | Location geology and measurements of the Lanoraie peatland complex
(Quebec Canada) (a) plan view and modeled area (black dash line surrounding
the region) and (b) cross-section AA0
427 M A Bourgault et al | Simulation of aquifer-peatland-river interactions under climate change Hydrology Research | 453 | 2014
and lsquoanthropogenicrsquo disturbances in the peatland explain 47
and 24 of the variation in the vegetation composition
respectively (Tousignant et al )
The Lanoraie peatland complex lies on Quaternary
glacial sediments that have distinct hydrogeological
characteristics The lowest part of the sedimentary
sequences is composed of marine clay and lacustrine silt
associated with the postglacial Champlain Sea and the
Lampsilis Lake (Occhietti et al ) respectively which
invaded the isostatically-depressed terrain immediately fol-
lowing ice retreat In the model these two units were
combined based on their hydrodynamics properties and
called the marine clay aquitard (Bourgault et al )
Chronological constraints (radiocarbon 14C dating) indi-
cate that this aquitard unit was deposited between 12 ky
BP and 98 ky BP (Richard amp Occhietti ) It is a major
hydrogeological unit that can be found throughout the
St Lawrence Lowlands up to an altitude of 235 m (Occhietti
et al ) This aquitard unit is overlain by thick sandy sedi-
ments deposited within a large deltaic complex during the
regression of the marine waters in response to the glacial iso-
static adjustment (rebound) following deglaciation
Continued isostatic rebound drove the shoreline southeast-
ward near the present position of the St Lawrence River
The deltaic sands were then subject to fluvial erosion and
remobilization The superficial free water table aquifer
used for human consumption and irrigation is located in
the sand deposits
The peatland complex subsequently developed in
paleochannels of the St Lawrence River The peat depos-
its started accumulating in low-lying depressions oriented
in a SW-NE axis around 69 ky BP (Comtois ) The
organic deposits lay on deltaic sand (aquifer) and lacus-
trine silt and marine clay (aquitard) deposits which
together provide a hydrogeological environment allowing
connections with the regional aquifer (Figure 1(b)) The
peatland and the deltaic sand now form the main super-
ficial reservoirs with mean thicknesses of 26 m (varying
between 2 and 84 m) and 65 m (varying between 1 and
19 m) respectively (Rosa et al Bourgault et al
) Bourgault et al () have shown that the bedrock
topography rises considerably below the peatland com-
plex (Figure 1(b)) forming high and low terrace areas
The high terrace area surrounding the peatland is charac-
terized by the presence of small sand ridges where
piezometric levels are higher than the peatland water
table in the peatland itself (Figure 1(b))
428 M A Bourgault et al | Simulation of aquifer-peatland-river interactions under climate change Hydrology Research | 453 | 2014
Available data
Gridded climatic data were generated by the Centre drsquoexper-
tise hydrique du Queacutebec (Poirier et al ) an agency from
the Quebec Ministry of Environment (Ministegravere du Deacutevelop-
pement durable de lrsquoEnvironnement de la Faune et des
Parcs ndash MDDEFP) The spatial interpolation method relies
on measured values at climatological stations These
stations mainly owned by the MDDEFP are operated by
the ministryrsquos branch of atmospheric monitoring activities
(Direction du suivi de lrsquoeacutetat de lrsquoenvironnement (DSEacuteE) ndash
Service de lrsquoinformation du milieu atmospheacuterique
(SIMAT)) through a climate monitoring program The inter-
polation has been performed at a daily time step using
simple isotropic kriging with monthly mean variograms at
a 01 degree resolution over southern Quebec (see Poirier
et al () for more details) The available data cover the
1900ndash2010 period This study makes use of kriged data of
mean temperature and vertical inflows (VI) Vertical inflows
correspond to the simulated amount of water available for
infiltration based on the snowmelt module in the HYDRO-
TEL model (see Poirier et al () for more details)
At the study area the interannual mean vertical inflows
and air temperature from 1960 to 1990 are 941 mm and
58 WC For this period air temperature was used to calculate
potential evapotranspiration (ETP) based on the method
outlined in Oudin et al () The average ETP calculated
for the 1960ndash1990 period is 590 mmyr
The steady-state groundwater flow model was calibrated
using head measurements from 150 boreholes obtained
from TechnoREM () Rosa amp Larocque () Ameacutena-
tech () and Terratec () (see Figure 1(a)) This
number of heads is sufficient to capture steady state con-
ditions because they were measured during wet and dry
seasons Piezometric heads were monitored hourly (INW-
PT2X pressure transducers) at nine piezometer stations
installed specifically for this study (three in the peatland
and six in the sand aquifer) Of these stations three were
monitored year-round while the others were monitored
only during the summers 2011ndash2012 due to the extensive
snow cover that prevails during the winter months The
piezometers consist of 3 cm OD polyvinyl chloride (PVC)
pipes sealed at their base and equipped with 1 m long
intakes within sand deposits and 30 cm within peat deposits
(the well screen creating a 50 porosity zone in the lower
part of the pipe) Within the peatland the piezometers
were inserted down to 1 m below the peat surface whereas
in the sand they were inserted 1 m below the ground
Discharge measurements and water levels are available
on a daily basis from 2000 to 2005 on the Point-du-Jour
River gauging station (no 052236 hydrometric network
operated by the Centre drsquoexpertise hydrique du Queacutebec
(CEHQ)) and from 1989 to 2010 on the St Lawrence
River gauging station (no 000116-CEHQ) The station on
the Point-du-Jour River is located 15 km upstream of the
lrsquoAssomption River and drains a 703 km2 watershed
(Figure 1(a)) In the current study a gauging station was
installed for water-level measurements (TrueTrack sensor
rating curve) on the Saint-Joseph River during the 2011
summer This station is located at 500 m upstream and
drains a 40 km2 watershed River discharge was also
measured every 2 weeks at different locations on the
rivers during the summers of 2005 (unpublished data)
and 2011 (this study) using a Swoffer 2100 velocimeter
(see Figure 1(a))
Base flows were estimated using the Chapman base flow
separation method (Chapman ) and are evaluated to be
028plusmn 01 m3s and 030plusmn 01 m3s for the Saint-Joseph and
Point-du-Jour rivers respectively The uncertainty on annual
base flows was evaluated using a mean error of 25 on the
flow data measurements used to calibrate the rating curves
This error value is similar to the one suggested by Di
Baldassarre amp Montanari ()
River flows for the other rivers were estimated using bi-
monthly manual measurements (cross-section method based
on flow velocities) They range from 004 to 100 m3s for the
Saint-Jean River from 0 to 080 m3s for the Saint-Antoine
River and from 0 to 067 m3s for the Bras-sud-ouest River
Some of the river flow measurements were made after sev-
eral days without rain and are a good range for base flow
approximations The absence of discharge found in the
Saint-Jean and Saint-Antoine rivers is caused by the pres-
ence of man-made dams used to supply agriculture water
needs during droughts periods
Peat hydraulic conductivities (Kpeat) were estimated by
Rosa amp Larocque () using the Modified Cubic Method
and slug tests Peat hydraulic conductivities range from
01 ms for the upper part of the peat to 1 times 108ms for
Figure 2 | Conceptual groundwater flow model (a) boundary conditions (b) recharge
zones (modified from TechnoREM (2009) and aerial photography analysis)
429 M A Bourgault et al | Simulation of aquifer-peatland-river interactions under climate change Hydrology Research | 453 | 2014
the lower part of the peat with a mean vertical anisotropy
(KvKh) of 13 and a general decreasing pattern with
depth The sand hydraulic conductivities (Ksand) range
from 5 times 104 to 3 times 106ms with an average value of
1 times 104ms and a general vertical decreasing trend pro-
portional to depth (with no more than one order
magnitude variation) (Rosa TechnoREM ) The
sand hydraulic conductivities generally increase towards
the south in association with the delta morphology This
reflects the fact that coarser particles tend to be deposited
close to former shorelines as well as on the periphery of
the delta in response to the severe changes in transport
dynamic associated with a delta
Elevation data were obtained from the Quebec Ministry
of natural resources (Ministegravere des Ressources naturelles
(MRN)) as well as from differential global positioning
system (GPS) surveys (513 points) measured by Techno-
REM () Polygeacuteo () Rosa () Ameacutenatech
() Terratec () and during this study (mean error
25 cm) Using these data a digital elevation model was
built and forced on river bed elevations based on 30 differen-
tial GPS measurements In the study area the elevation
ranges from 7 to 32 m Errors on topography vary between
41 and 52 m with a mean value of 002 m a standard
deviation of 123 m and an absolute error of 050 m in the
upper unconfined sandy aquifer Using a 95 confidence
interval all cells containing head measurements that were
used for model calibration have a maximum error on topo-
graphy of plusmn15 cm
Model development
Numerical model
Groundwater flow is simulated in steady-state using the
groundwater flow module of the Mike SHE model
(Thompson et al Danish Hydraulic Institute (DHI)
) The model covers an area of 364 km2 discretized in
250 m times 250 m grid cells No-flow boundaries limit ground-
water flow at the base and periphery of the model This
no-flow boundary in the north-west part of the model is jus-
tified by the fact that both the Chaloupe and lrsquoAssomption
rivers are flowing on marine clay sediment hence intercept-
ing completely the upper unconfined sandy deltaic aquifer
The southernmost limit is represented with a fixed head
boundary (Figure 2(a)) The use of a fixed head boundary
to represent the St Lawrence River is justified by its limited
water level variations (asymp3 m in the last 22 years at gauging
station no 000116) due to strong controls from a series of
dams
Rivers are represented as head-controlled flux while
river base flows are controlled by leakage coefficients
(Lc) Drains and natural streams are represented in the
model as drains located 1 m below the surface In reality
most of these drains are minor ditches and creeks too
small to be represented as a head-controlled flux Some
430 M A Bourgault et al | Simulation of aquifer-peatland-river interactions under climate change Hydrology Research | 453 | 2014
drains are found within the peatland where the organic
deposits have been perturbed for the construction of
small roads Others are found on the edge of the peatland
where small reservoirs are excavated to store water for
the growing season
Three recharge zones are used (Figure 2(b)) based on
the spatial discretization from TechnoREM () zone 1
corresponds to the sand aquifer zone 2 corresponds to
urban and more densely paved areas and zone 3 corre-
sponds to the peatland According to TechnoREM ()
recharge ranges between 71 and 389 mmyr with a regional
mean value of 230 mmyr
Hydraulic conductivities of the sand aquifer are discre-
tized into six zones based on field measurements from
different sources (Ameacutenatech TechnoREM Bour-
gault et al ) (Figure 3) This zonation based on simple
Figure 3 | Hydraulic conductivity zones (numbers 1 to 6 refer to sand K-zones see
Table 3 for values and black lines represent zone limits) and sand hydraulic
conductivity measurements (black dots represent location of hydraulic tests
and slug tests from Bourgault et al (2011) TechnoREM (2009) and Ameacutenatech
(1989)) BB0 refers to the cross section illustrated in Figure 4
kriging can be correlated to different sedimentary facies
associated with the deltaic depositional processes Large
particles (zone 3 to zone 6) tend to accumulate on the per-
iphery of the delta forming high hydraulic conductivity
regions as observed in others studies (Kostic et al
Ouellon et al ) The choice to use a single layer for
the sand aquifer is based on fact that most of the aquifer-
peatland interactions are located within the first meter of
the saturated zone where sand hydraulic conductivities
vary by less than one order of magnitude (Rosa
TechnoREM ) Peat hydraulic conductivities are discre-
tized vertically into five different layers because of the large
vertical variations reported for this peatland (Rosa amp
Larocque ) A thickness of 05 m is used for each of
the four upper layers and the bottom layer has a variable
thickness where the total peat thickness exceeds 2 m
(Figure 4) The peat hydraulic conductivity is considered
homogeneous horizontally
The model was calibrated using groundwater levels in
150 wells (see Figure 1(a)) as well as river base flows
from the two gauging stations located on the Point-du-
Jour and Saint-Joseph rivers The manual river-flow
measurements were also used to calibrate the model
which are considered to provide a reliable approximation
of river base flow during dry periods Hydraulic conduc-
tivities of the sand aquifer K-zones (zone reflecting spatial
horizontal hydraulic conductivity variations related to
delta morphology) and of the organic deposits K-layers
(layer reflecting vertical variations of horizontal hydraulic
conductivities related to peat forming environment) were
Figure 4 | Vertical discretization of peat hydraulic conductivities Numbers 1 to 5 refer to
calibrated peat K-layers (see Table 3 for values)
431 M A Bourgault et al | Simulation of aquifer-peatland-river interactions under climate change Hydrology Research | 453 | 2014
subjected to calibration along with zonal recharge values
and leakage coefficients
Average relative sensitivity coefficients (Sr) (McCuen
) were calculated using Equation (1) Model sensitivity
was computed for all the calibrated parameters (Ksand
Kpeat for layers 1 and 2 mean recharge and leakage coeffi-
cients) and the analysis focused on the effect of varying
these parameters on heads and base flows
Sr frac14 (ΔF=Fref)=(ΔX=Xref) (1)
where Sr is the relative sensitivity coefficient F is the result
being considered (heads and base flows) and X is the modi-
fied parameter Fref corresponds to the model result obtained
with the calibrated parameter Xref
Climate change scenarios
Changes in regional temperature and precipitation can
affect recharge considerably (Eckhardt amp Ulbrich ) In
this study global climate models (GCM) were used to out-
line different recharge scenarios (Pacific Climate Impacts
Consortium (PCIS) ) Six projections were selected
based on two criteria (1) maximum temperature increases
during recharge periods and (2) maximum decrease in pre-
dicted precipitation All the selected simulations are from
the GCM3 model (third generation coupled global climate
model developed by the Canadian Center for Climate Mod-
elling and Analysis) for the climate of the 2040ndash2069 period
Table 1 | Seasonal temperature (W
C) and precipitation (percentage of vertical input) changes f
Temperature (Wc) CGC3 A1B-run3 CGCM3 A1B-run4 CGCM3 A2
Winter 34 34 42
Spring 27 29 32
Summer 20 28 30
Fall 25 29 33
Precipitation () CGCM3 A1B-run3 CGCM3 A1B-run4 CGCM3 A2
Winter 44 20 30
Spring 28 10 17
Summer 5 4 10
Fall 44 20 30
They are based on the delta method which consists of per-
turbing baseline meteorological data (here the 1960ndash1990
period) with monthly variations derived from the difference
between future climate scenarios and the reference period
One B1 three A1B and two A2 scenarios were selected
representing low medium and high CO2 scenarios
respectively (Green et al )
These criteria were chosen to understand the hydrologi-
cal function of the peatland in connection with the regional
aquifer and the river network within the context of changing
climate conditions It is not intended to study the complete
possible range of precipitation and temperature effect
associated with climate change on the recharge Possible
increases in recharge reported in some studies (eg
Jyrkama amp Sykes Levison et al ) were deliberately
put aside
The selected GCM runs project summer temperatures to
increase between 20 WC (CGCM3 A1B-run3) and 32 WC
(CGCM3_T63 A1B-run1) Winter temperatures are pro-
jected to increase between 30 WC (CGCM3 B1-run5) and
44 WC (CGCM3_T63 A1B-run1) These increases far
exceed the temperature increase of asymp1 WC observed in the
Lanoraie region for the 1960 to 2005 period (Yagouti et al
) Annual precipitation changes are projected to vary
between a decrease of 10 in summer (CGCM3 A2 run-3)
and an increase of 44 during winter and fall (CGCM3
A1B) (see Table 1)
Estimated ETP values for the range of temperature
changes vary from 722 mmyr (CGCM3 A1B-run3) to
or the six selected Canadian GCM in the 2040ndash2069 horizon (PCIS 2012)
-run2 CGCM3 A2-run3 CM3 B1-run5 CGCM3_T 63 A1B-run1
40 30 44
30 24 30
29 23 32
30 25 29
-run2 CGCM3 A2-run3 CM3 B1-run5 CGCM3_T 63 A1B-run1
31 22 28
27 30 21
4 5 10
31 22 28
432 M A Bourgault et al | Simulation of aquifer-peatland-river interactions under climate change Hydrology Research | 453 | 2014
743 mmyr (CGCM3 A2-run2) and are considerably higher
than the ETP for the 1960 to 1990 reference period
(590 mmyr) ETP for the climate scenarios was calculated
using the Oudin et al () formula with the predicted air
temperature derived from the monthly temperature
changes for the 2040ndash2069 horizon Predicted monthly pre-
cipitation changes for the 2040ndash2069 horizon were applied
to the vertical inflow data from the 1960ndash1990 reference
period Future recharge was estimated for each scenario
by applying the net precipitation recharge reduction to
the calibrated recharge values This is based on the hypoth-
esis that overland flow will decrease in the same
proportion as recharge in a changing climate Recharge is
estimated to remain the same in one scenario (CGCM3
A2-run3) and to decrease for the other five scenarios
between 10 and 50 (Figure 5) Most of the literature-
based studies on climate-induced recharge reductions in
Canadian settings show a range of possible increases and
decreases of recharge (Jyrkama amp Sykes Scibek amp
Allen Croteau et al Levison et al ) The
recharge decreases are consistent with those obtained
here To facilitate the simulations two recharge scenarios
representing a reasonable range of predicted recharge con-
sidered in this work were simulated ie 20 decrease and
50 decrease
These scenarios undoubtedly represent crude simplifica-
tions especially considering that climate change may impact
water resources on time scales shorter than 1 year (Maxwell
amp Kollet ) and never reach a complete steady-state
Figure 5 | Effect of recharge scenarios on vertical inflows (VI) and ETP ( numbers stand
for recharge variations based on a given climate change scenario) 0 change
scenario corresponds to the baseline calibrated model
Nonetheless this approach provides a sensitivity analysis
that brings valuable information on the influence of a peat-
land on the regional aquifer and river network in a climate
change environment
RESULTS AND DISCUSSION
Actual peatland and aquifer groundwater dynamics
A piezometric map of the Lanoraie region (Figure 6) was
drawn using simple kriging based on 1550 available heads
Figure 6 | Interpolated piezometric map with regional and local groundwater flow
directions (arrows are drawn as examples of flow directions) (a) flow following
topography from the deltaic aquifer to the surrounding minerotrophic zone (b)
centered radial flow along the peatland topography from ombrotrophic zone
to minerotrophic zone (c) flow along the elongated axis of the peatland
feeding the surrounding river network and d) unidirectional flow from the
peatland to the deltaic aquifer
Table 2 | Average relative sensitivity coefficients
Calibrationparameter Interval
Sr
(head)Sr (river baseflow)
K-sand 00003 000008 (ms) 061 054
K-peat Layer 1 0045 0005 (ms) 010 030
K-peat Layer 2 0001 000001 (ms) 0001 0004
Recharge 165 345 (mmyr) 017 067
Lc 3 times 10 8 1 times 10 8 (S 1) 030 071
433 M A Bourgault et al | Simulation of aquifer-peatland-river interactions under climate change Hydrology Research | 453 | 2014
(as reported by Bourgault et al ()) Thirty differential
GPS river water level measurements (this study) were used
to constrain the piezometric map Heads within the simu-
lated area vary from 5 to 30 masl Regional groundwater
flow directions are oriented NW-SE thus perpendicular to
the elongated axis of the peatland (Figure 6) The NW part
of the aquifer appears to be disconnected from the Lanoraie
peatland as previously mentioned This area is drained by
the lrsquoAssomption and Chaloupe Rivers (Figure 1) Four
local groundwater flow patterns were documented on the
piezometric map (a) a flow following topography from the
deltaic aquifer to the surrounding minerotrophic zone
(b) a centered radial flow along the peatland topography
from ombrotrophic zone to minerotrophic zone (c) a flow
along the elongated axis of the peatland feeding the sur-
rounding river network and (d) a unidirectional flow from
the peatland to the deltaic aquifer The Lanoraie peatland
complex is fed primarily by a local groundwater flow
system as well as by precipitation Because of this setting
the peatland complex is probably sensitive to natural- and
human-induced hydrologic changes
Monitoring of water levels in the organic deposits shows
that groundwater levels within the peatland are relatively
stable through time A severe drought period occurred in
the summer 2012 resulting in 261 mm of precipitation com-
pared to 369 mm in 2011 Water table depths within the
peatland were located on average 15 cm below the peat sur-
face (ie within the acrotelm layer) in 2011 and 22 cm in
2012 For peatland piezometers head fluctuations (ie
max level minus min level) are on average 12 cm in 2011
and 19 cm in 2012 The summer 2012 drought therefore
did not have a significant effect on water levels within the
peatland Monitoring in the sand piezometers shows that
water table depths were on average 180 cm below the sur-
face in 2011 and 204 cm in 2012 For sand piezometers
head fluctuations were on average 51 cm in 2011 and
59 cm in 2012 As for the peatland the dry conditions of
summer 2012 did not have a large impact on groundwater
levels in the sand aquifer Heads in the sand aquifer are
always higher than groundwater levels in the peatland
suggesting a constant unidirectional flow coming from the
sand aquifer to the peatland except for the NE part of the
peatland which has been intensively drained for agriculture
(see Figure 6 local groundwater flow patterns d)
Model calibration
Sensitivity analysis and calibration method
The model was calibrated manually in steady-state by adjust-
ing leakage coefficient sand K-zones peat K-layers and
recharge At the start of the calibration process no spatial het-
erogeneity was considered and values from available data
were used for sand hydraulic conductivity (1times 104ms)
peat hydraulic conductivity (1 times 102ms) and recharge
(230 mmyr) Leakage coefficients were taken from the litera-
ture (1 times 108s) Calibration parameters (except leakage
coefficients) were then zoned (K-zones K-layers and
recharge) based on field measurements (for hydraulic conduc-
tivities) and aerial photography (for recharge) Finally river
leakage coefficients were independently calibrated to mini-
mize errors on head measurement and annual river base flow
Results from the sensitivity analysis (Table 2) show that
K-sand has the largest effect on heads while the leakage
coefficient has the largest effect on base flows However
the Sr values are sufficiently similar to indicate that errors
on estimating hydraulic conductivities or recharge have a
similar impact on the model results This is with the excep-
tion of K-peat for layer 2 which has a very limited influence
on both heads and base flows This reflects the fact that the
model simulates flows predominantly in the upper peat
layer
Calibration results
Calibrated horizontal hydraulic conductivities (Kh) for the
peat and sand layers are shown in Table 3 Sand hydraulic
conductivities range horizontally from 1 times 105 to
6 times 104ms These values are within the range of available
Table 3 | Calibrated sand and peat horizontal hydraulic conductivities Vertical hydraulic
conductivities are equal to 10 Kh
Sand K-zones Kh (ms)
1 1 times 10 58 times 10 5
2 8 times 10 51 times 10 4
3 1 times 10 42 times 10 4
4 2 times 10 43 times 10 4
5 3 times 10 44 times 10 4
6 4 times 10 46 times 10 4
Peat K-layers Kh (ms)
1 3 times 10 2
2 1 times 10 4
3 7 times 10 6
4 1 times 10 6
5 1 times 10 8
434 M A Bourgault et al | Simulation of aquifer-peatland-river interactions under climate change Hydrology Research | 453 | 2014
hydraulic conductivities and the observed increasing trend
of K towards the St Lawrence River The vertical anisotropy
ratio was calibrated to be 10
Calibrated horizontal hydraulic conductivities for the
organic deposits vary from 1 times 108ms (layer 5) to
3 times 102ms (layer 1) ie decreasing considerably with
depth (Table 3) This is consistent with field-based values
from Rosa amp Larocque () at this site and with values
from other peatland studies (eg Ronkanen amp Klove )
The vertical anisotropy ratio was calibrated to be 10 This
ratio is higher than the one reported by Rosa amp Larocque
() but these authors did not measure the acrotelm vertical
hydraulic conductivity This calibration reflects the acrotelm-
catotelm model comprising an upper active peat layer with a
high hydraulic conductivity and less active saturated layer
with a lower hydraulic conductivity It suggests that horizontal
flow may be the principal component of peatland hydrology
especially in the top layers of organic deposits
The calibrated recharge in zone 1 is 293 mmyr This
zone corresponds to high permeability sand where overland
flow is negligible Recharge in zone 2 (urban and more den-
sely paved areas) is 196 mmyr and recharge in zone 3
(peatland) is 213 mmyr The use of a moderate recharge
in zone 3 is justified by the fact that the potential recharge
from spring snowmelt is removed by overland flow within
the peatland due to a complete saturation of the organic
deposits (Holden et al ) The average calibrated
recharge for the study area is 245 mmyr (ie on average
26 of the total vertical inflow) which is similar to the
mean value of 230 mmyr used by TechnoREM () (cf
Figure 2(b)) This simple three zones recharge model depicts
the influence of vegetation and soil on recharge as
suggested by de Vries amp Simmers ()
The calibrated leakage coefficients necessary for best
reproduction of river low flows vary from 2 times 108 to 1 times
108s In Mike SHE leakage coefficients are related to riv-
erbed hydraulic conductivities to the wetted perimeter of
river cross sections to the average flow length (distance
from grid node to the middle of the river bank) as well as
to the vertical surface available for exchange flow (DHI
) Although leakage coefficients can be dynamic through
time and space (Engeler et al ) they were considered
here to be constant in order to limit undue complexity of
the model The calibrated leakage coefficients are consistent
with literature values (eg Doppler et al )
Figures 7(a) and (b) show that the steady-state ground-
water flow model simulates relatively well the available
heads (mean error 007 m mean absolute error 15 m
and root mean square error 181 m) Using a 95 interval
confidence error on simulated heads (difference between
simulated and measured heads) is plusmn47 cm in the peat and
plusmn41 cm in the sand The lower heads are underestimated
by the model while the higher heads are overestimated
However this calibration may be considered satisfying in
the context of a study on the potential of aquifer-peatland-
river interaction since error on simulated peat (plusmn47 cm)
and sand (plusmn41 cm) is less than the smallest model cell
thickness (50 cm)
The effects of peatland perturbation and horizontal
zonation (minerotrophic and ombrotrophic) on hydraulic
conductivities have not been considered in the model
Considering vertically homogeneous sand hydraulic conduc-
tivities could also induce calibration errors The
inaccuracies in head measurements caused by topography
(plusmn15 cm) and the observed head variations during the dry
2012 year in the peat (19 cm) and in the sand (59 cm)
likely contribute to the calibration error of the steady-state
model but do not represent a major source of error Overall
the calibrated model simulates reasonably well the general
flow direction patterns and the hydraulic gradients
Figure 7 | (a) Measured and simulated heads in the peat and sand deposits associated
mean error mean absolute error and root mean square error and (b) histo-
gram of simulated errors for the peat and sand water levels
Figure 8 | Total river flow rates Chapman-estimated base flows and simulated base
flows for (a) Saint-Joseph river and (b) Point-du-Jour river
Table 4 | Average total simulated river base flow and contribution from the peatland to
river base flow
RiverAverage total riverbase flow (m3s)
Peatland contribution toriver base flow (m3s)
Saint-Joseph 025 019
Point-du-Jour 034 014
Saint-Jean 031 022
Saint-Antoine 014 013
Bras-sud- Quest 009 009
435 M A Bourgault et al | Simulation of aquifer-peatland-river interactions under climate change Hydrology Research | 453 | 2014
Figure 8 shows the simulated steady-state base flows of
025 and 034 m3s for the Saint-Joseph and Point-du-Jour
rivers respectively These values are similar to the Chap-
man-estimated base flows but are higher than those of
TechnoREM () in which a groundwater flow model
was used to estimate river base flows on the Saint-Joseph
and Point-du-Jour rivers (007 and 008 m3s respectively)
These differences can be explained by a different represen-
tation of rivers in the TechnoREM () model (fixed
head boundaries) The simulated base flows for Saint-Jean
Saint-Antoine and Bras-sud-ouest rivers are equal to 030
014 and 009 m3s respectively (Table 4) These values
fall within the range of bi-monthly manual measurements
However daily base flows can vary significantly around
the mean throughout the year This variability is explained
by the fact that groundwater-river exchanges vary with
river water levels as well as with adjacent groundwater
levels (Doppler et al ) Given these uncertainties it is
considered that the model calibration for the volumes of
water drained by the five rivers is reasonably good
Peatland hydrology
The model was used to quantify aquifer-peatland-river
exchanges at the regional scale These flows can vary
Table 5 | Peatland and total region water balance
Input flow (m3s) Output flow (m3s)
Peatland (76 km2) Aquifer 060 (52) River 084 (72)
Recharge 055(48)
Drains 032 (28)
Simulated area(364 km2)
Recharge 258(100)
River 142 (55)
Fixed head 035(14)
Drains 081 (31)
436 M A Bourgault et al | Simulation of aquifer-peatland-river interactions under climate change Hydrology Research | 453 | 2014
considerably in direction and quantity due to human-
induced and natural hydrologic modification For example
Holden et al () showed that peat drainage can signifi-
cantly modify river hydrograms by increasing the
sensitivity of river response to rainfall and shortening river
response time In addition Levison et al () demon-
strated that aquifer-peatland interaction can experience
flow reversals under climate change-induced recharge
reductions
The model domain was separated into different water
budget zones The peatland contribution to the annual
total river base flows at the peat-sand transition and at
the mouth of each river is quantified in Table 4 For
example the groundwater contribution to the total Saint-
Joseph annual river base flow coming from the peatland
is equal to 019 m3s whereas the total annual river base
flow is evaluated to 025 m3s This is interpreted as if the
peatland annually contributes 76 of the annual total
Saint-Joseph river base flow The peatland contribution to
simulated river base flows are 41 for the Point-du-Jour
river 71 for the Saint-Jean river 93 for the Saint-
Antoine river and 100 for the Bras-sud-ouest river
Here the 93 and 100 values are unrealistic since neither
the Saint-Antoine nor the Bras-sud-ouest rivers flow exclu-
sively on peat sediments However since these rivers flow
on peat sediments over extensive portions of their reaches
the peatland contribution is probably relatively high These
base flow contributions are much higher than results from
Levison et al () who have shown that a headwater
peatland can sustain 4ndash7 of its outlets base flows How-
ever in that case the rivers did not flow through the peat
sediments
The peatland-related base flows obtained here are con-
trolled by leakage coefficients and riverbed sediment
hydraulic conductivities and therefore present a certain
amount of uncertainty The occurrence of exfiltration from
the underlying sandy aquifer through the low permeability
peat layer to the upper peat (Rossi et al ) and to the
riverdrainage network (Simpson et al ) cannot be
excluded Simpson et al () used drain coefficients at
the local scale to quantify drainage ditch-aquifer interaction
using MODFLOW These interactions were not included in
the Mike SHE model because of the complexity involved in
characterizing them in a regional-scale groundwater flow
model However peatland-river interactions are included
in the model using head-controlled flux boundary where
calibrated leakage coefficients control the exchanged
fluxes between peatland and rivers Nonetheless these simu-
lated fluxes support the concept of an important link
between groundwater and surface water in the Lanoraie
peatland environment
The calibrated model was used to evaluate the contri-
bution of the aquifer to the Lanoraie peatland complex
This was quantified by analyzing the water balance of all
the cells located within the peatland The total flow from
the aquifer to the peatland is equal to 060 m3s (Table 5)
Simulated hydraulic gradients are relatively constant all
around the peatland This indicates that the simulated
aquifer-peatland inflow is distributed uniformly all around
the peatland except for the NE part of the region where
the peatland is drained by the aquifer (see local groundwater
flow patterns d on Figure 6) Recharge from precipitation is
equal to 055 m3s (ie equivalent to the calibrated 230 mm
yr) This means that a significant portion of the water
feeding the peatland (52) comes from the aquifer
Other studies have found that groundwater inflow to a
minerotrophic peatland can reach 88 (Drexler et al
) or even 95 (Gilvear et al ) of the total water
input
For the entire simulated area the recharge is equivalent
to 258 m3s The majority of the water that is recharging
the peatland is exported by the rivers (084 m3s or 72)
and the drainage network (032 m3s or 28) When con-
sidering the entire study area water outflows through the
rivers (142 m3s or 55) fixed head boundaries
(035 m3s or 14) and through the drains (081 m3s or
437 M A Bourgault et al | Simulation of aquifer-peatland-river interactions under climate change Hydrology Research | 453 | 2014
31) Consequently drainage plays a significant role in
both groundwater levels in the sand aquifer and in the peat-
land This is an indication that drainage should be managed
carefully to conserve the current water balance of the
hydrosystem and to ensure water flows to the peatland
Climate change and pumping scenario
Figure 9 illustrates variations in aquifer heads aquifer-peat-
land exchanges and river base flow changes resulting from
the two recharge scenarios (20 and 50 decreases)
Recharge decreases of 20 and 50 resulted in mean head
reductions of 060 and 160 m for the sand aquifer and
054 and 139 m for the peatland
The model simulates mean changes of river base flows
for the five different surrounding rivers of 003 and
009 m3s (ie 16 and 41) for the entire study area
with the two climate change-related recharge reductions
(ie 20 and 50 decrease) (see negative black bars in
Figure 9) Under these scenarios a diminution of aquifer-
peatland exchange from 060 to 049 m3s and 031 m3s is
documented for the 20 and 50 recharge decrease scen-
arios respectively This is equivalent to 18 and 48
decreases in the peatland water input from the aquifer
These results indicate a moderate sensitivity of ground-
water inflow to the peatland and of river base flows to
recharge variations Nonetheless input fluxes from the
Figure 9 | Simulated aquifer-peatland exchanges base flows and mean head variations
in the peat and in the sand aquifer for two recharge reduction scenarios Error
bars were calculated based on maximum and minimum values
aquifer can play an important role in the ecological func-
tion of a peatland Small changes in the volume of
groundwater discharge in the peatland may be sufficient
to significantly affect vegetation (Siegel amp Glaser )
carbon absorption capacities (Gorham ) and peatland
hydrologic regional functions This should be taken into
account when dealing with peatland conservation Water
management limiting human-induced recharge reductions
water pumping and peatland drainage to maintain river
base flows and peatland hydrologic functions represents a
real challenge It is important to keep in mind that the cli-
mate change-induced recharge scenarios selected in this
study represent extreme projections The simulated head
drawdowns and river base flow decreases might not be
representative of future groundwater exchange conditions
but they nevertheless illustrate the system response to
extreme conditions
A fictive pumping station (see Figure 1) was introduced
in a local topographic high (26 m) to quantify the effect of
water withdrawal for agricultural uses and human con-
sumption The fictive pumping station fully penetrates the
sand aquifer (thickness 11 m at this location) Prior to
pumping heads in this area are at 23 m and groundwater
flows towards the peatland (see Figure 6) A pumping rate
of 003 m3s generates 9 m drawdown in the grid cell
where the fictive well is located (no cell refinement was
used) and a reversal of flow directions towards the aquifer
up to asymp1200 m from the well and reaching the peatland
At this pumping rate the peatland feeds the sand aquifer
and the well This drawdown is larger than the one
observed with a 50 decrease recharge equivalent to a
mean 16 m and a maximum 36 m drawdown for the
sand aquifer Based on the average Canadian daily dom-
estic use of fresh water (329 lperson) (Environment
Canada ) this withdrawal could meet the needs of
1080 people which represents approximately 25 of the
Lanoraie population This does not take into account the
use of groundwater by activities related to agriculture
equivalent to asymp0065 m3s within the peatland surrounding
area (TechnoREM ) It is expected that the combined
effects of increased pumping and decreased recharge
would have a significant impact on the entire Lanoraie
hydrosystem This pumping simulation emphasizes the
importance of water use management in this thin aquifer
438 M A Bourgault et al | Simulation of aquifer-peatland-river interactions under climate change Hydrology Research | 453 | 2014
environment to preserve both the peatland and the ground-
water resources
CONCLUSION
The steady-state groundwater flow model developed here
has proven to be adequate to simulate current groundwater
flow conditions in the Lanoraie peatland complex and delta
aquifer hydrosystem This work provides important insights
on aquifer-peatland-river exchanges for the St Lawrence
Lowlands climate and geological setting The numerical
model shows that (1) groundwater flows mainly through
horizontal flow within the organic deposits (2) 52 of the
inflow to the peatland comes from the sand aquifer and
(3) river base flows are predominantly (41 to 100) supplied
by the peatland Under climate change scenarios this study
shows that the Lanoraie peatland complex plays a determi-
nant role on the hydrosystem The organic deposits
prevent drastic drawdown of the surrounding sand and
peat aquifer while limiting river base flow decreases
The extreme recharge decrease scenarios simulated here
clearly show that climate change could cause significant
impacts on the Lanoraie hydrosystem It is understood
that these recharge conditions might not occur Neverthe-
less this work points to the vulnerability of recharge
reductions or increased pumping on the water sustainability
of the peatland complex studied Similar results are
expected in other low-topography sand aquifers hosting
extensive peatlands in humid and cold climates This work
also suggests that an effective peatland management
should consider the surrounding aquifer and other conserva-
tion actions at the regional scale
This study underlines the advantages of using a model to
quantify the effects of various water uses at regional scale
Such model outputs could provide guidelines in water man-
agement plans involving agricultural other human-related
activities and climate related perturbations Additional mul-
tidisciplinary research involving hydrologists and urban and
territory planners are undoubtedly required to better protect
the important water resources associated with peatlands and
other wetlands This is especially true in a context of increas-
ing environmental pressures induced by urban development
and a changing climate
ACKNOWLEDGEMENTS
The financial contributions of the Fonds de recherche du
Queacutebec ndash Nature et technologie (FRQNT) and of the
Global Environment and Climate Change Center (GEC3)
are acknowledged The authors would like to thank the
Ministegravere du Deacuteveloppement durable de lrsquoEnvironnement
de la Faune et des Parcs (MDDEFP) for giving access to
the Lanoraie Preservation area The authors also thank the
landowners for making their properties accessible for this
study
REFERENCES
Ameacutenatech Eacutetude de la tourbiegravere de Lanoraie Divisionameacutenagement et environnement du groupe-conseil SM IncMarch 1989
Bourgault M Larocque M amp Roy M Modeacutelisation 3D delrsquoeacutecoulement souterrain reacutegional de la reacutegion du complexetourbeux de Lanoraie Conference proceedings fromGeoHydro2011 held in Quebec City (Quebec Canada)August 28thndashSeptember 1st
Bradley C amp Gilvear D J Saturated and unsaturated flowdynamics in a floodplain wetland Hydrological Processes 142945ndash2958
Bragg O amp Lindsay R Strategy and action plan for mire andpeatland conservation in Central Europe WetlandsInternational 6 94
Bullock A amp Acreman M The role of wetlands in thehydrological cycle Hydrology and Earth System Sciences 7358ndash389
Candela L von Igel W Javier Elorza F amp Aronica G Impact assessment of combined climate and managementscenarios on groundwater resources and associated wetland(Majorca Spain) Journal of Hydrology 376 510ndash527
Chapman T A comparison of algorithms for stream flowrecession and baseflow separation Hydrological Processes13 701ndash714
Comtois P Histoire holocegravene du climat et de la veacutegeacutetation agraveLanoraie Queacutebec Meacutemoire de maICIRCtrise MScDeacutepartement de geacuteographie Universiteacute de Montreacuteal p 644
Comtois P Histoire holocegravene du climat et de la veacutegeacutetation agraveLanoraie (Queacutebec) Canadian Journal of Earth Sciences 191938ndash1952
Croteau A Nastev M amp Lefebvre R Groundwaterrecharge assessment in the Chateauguay River watershedCanadian Water Resources Journal 35 451ndash468
Delin G N Healy R W Lorenz D L amp Nimmo J R Comparison of local- to regional-scale estimates of ground-water recharge in Minnesota USA Journal of Hydrology 334231ndash249
439 M A Bourgault et al | Simulation of aquifer-peatland-river interactions under climate change Hydrology Research | 453 | 2014
de Vries J amp Simmers I Groundwater recharge anoverview of processes and challenges Hydrogeology Journal10 5ndash17
DHI MIKE SHE User Manual and Training Manual DanishHydraulic Institute Hoslashrsholm Denmark p 396
Di Baldassarre G amp Montanari A Uncertainty in riverdischarge observations a quantitative analysis Hydrologyand Earth System Sciences 13 913ndash921
Doppler T Franssen H J H Kaiser H P Kuhlman U ampStauffer F Field evidence of a dynamic leakagecoefficient for modelling river-aquifer interactions Journal ofHydrology 347 177ndash187
Dowrick D J Freeman C Lock M A amp Reynolds B Sulphate reduction and the suppression of peatland methaneemissions following summer droughtGeoderma 132 384ndash390
Drexler J Z Bedford B L DeGaetano A T amp Siegel D I Quantification of the water budget and nutrient loading in asmall peatland Journal of the American Water ResourcesAssociation 35 753ndash769
Eckhardt K amp Ulbrich U Potential impacts of climatechange on groundwater recharge and streamflow in a centralEuropean low mountain range Journal of Hydrology 284244ndash252
Engeler I Hendricks Franssen H J Muumlller R amp Stauffer F The importance of coupled modelling of variably saturatedgroundwater flow-heat transport for assessing riverndashaquiferinteractions Journal of Hydrology 397 295ndash305
Environment Canada Canadian daily domestic use of freshwater per capita httpwwwecgccaeau-waterdefaultasplang=Enampn=F25C70EC-1 October 2012
Finlayson C M Davidson N C Spiers A G amp Stevenson N J Global wetland inventory ndash current status and futurepriorities Marine and Freshwater Research 50 717ndash727
Foley J A DeFries R Asner G P Barford C Bonan GCarpenter S R Chapin F S Coe M T Daily G C GibbsH K Helkowski J H Holloway T Howard E AKucharik C J Monfreda C Patz J A Prentice I CRamankutty N amp Snyder P K Global consequences ofland use Science 309 570ndash574
Fraser C J D Roulet N T amp Lafleur M Groundwaterflow patterns in a large peatland Journal of Hydrology 246142ndash154
Gilvear D J Andrews R Tellam J H Lloyd J W amp Lerner DN Quantification of the water balance andhydrogeological processes in the vicinity of a smallgroundwater-fed wetland East Anglia UK Journal ofHydrology 144 311ndash334
Gorham E Northern peatlands Role in the carbon cycle andprobable responses to climatic warming EcologicalApplications 1 182ndash195
Green T R Taniguchi M Kooi H Gurdak J J Allen D MHiscock K M Treidel H amp Aureli A Beneath thesurface of global change Impacts of climate change ongroundwater Journal of Hydrology 405 532ndash560
Hilbert D W Roulet N amp Moore T Modelling andanalysis of peatlands as dynamical systems Journal ofEcology 88 230ndash242
Holden J amp Burt T P Hydrological studies on blanket peatthe significance of the acrotelm-catotelm model Journal ofEcology 91 86ndash102
Holden J Evans M G amp Horton M Impact of landdrainage on peatland hydrology Journal of EnvironmentalQuality 35 1764ndash1778
Holden J Kirkby M J Lane S N Milledge D G Brookes CJ Holden V amp McDonald A T Overland flowvelocity and roughness properties in peatlands WaterResources Research 44 11
Jyrkama M I amp Sykes J F The impact of climate changeon spatially varying groundwater recharge in the GrandRiver watershed (Ontario) Journal of Hydrology 338237ndash250
Kostic B Becht A amp Aigner T 3ndashD sedimentaryarchitecture of a Quaternary gravel delta (SW-Germany)implications for hydrostratigraphy Sedimentary Geology 181147ndash171
Kvaerner J amp Klove B Generation and regulation ofsummer runoff in a boreal flat fen Journal of Hydrology360 15ndash30
Lamarre A amp Pellerin S Late holocene paleohydrologicalreconstruction of a bog peatland using testate amoebaeanalysis Lanoraie Quebec Canada Conference proceedingsfrom GeoHydro2011 held in Quebec City (Quebec Canada)August 28thndashSeptember 1st
Levison J Larocque M Fournier V Gagneacute S Pellerin S ampOuellet M A Dynamics of a headwater system andpeatland under current condition and with climate changeHydrological Processes doi101002hyp9978
Maxwell R M amp Kollet S J Interdependence ofgroundwater dynamics and land-energy feedbacks underclimate change Nature Geoscience 1 665ndash669
McCuen R H The role of sensitivity analysis in hydrologicmodeling Journal of Hydrology 18 37ndash53
MDDEFP (Ministegravere du Deacuteveloppement durable delrsquoEnvironnement de la Faune et des Parcs) Statistiqueannuelles et mensuelles httpwwwmddepgouvqccaclimatsurveillance January 2012
Occhietti S Parent M Lajeunesse P Robert F amp Govare Eacute Late pleacuteistocegravenendashearly holocene decay of the Laurentideice sheet in QueacutebecLabrador In Quaternary Glaciations ndash
Extent and Chronology a Closer Look (J Ehlers P LGibbard amp P D Hughes eds) Elsevier Oxford 15 pp 601ndash630 Available from wwwworldcatorgtitlequaternary-glaciations-extent-and-chronology-a-closer-lookoclc742299047viewport
Oudin L Hervieu F Michel C Perrin C Andreassian VAnctil F amp Loumagne C Which potentialevapotranspiration input for a lumped rainfall-runoff modelPart 2 ndash Towards a simple and efficient potential
440 M A Bourgault et al | Simulation of aquifer-peatland-river interactions under climate change Hydrology Research | 453 | 2014
evapotranspiration model for rainfall-runoff modellingJournal of Hydrology 303 290ndash306
Ouellon T Lefebvre R Marcotte D Boutin A Blais V ampParent M Hydraulic conductivity heterogeneity of alocal deltaic aquifer system from the kriged 3D distribution ofhydrofacies from borehole logs Valcartier Canada Journalof Hydrology 351 71ndash86
PCIS (Pacific Climate Impacts Consortium) Pacific climateimpacts consortium httptoolspacificclimateorgtoolsregionalanalysis October 2012
Poirier C Fortier Fillion T C Turcotte R amp Lacombe P Apports verticaux journaliers estimeacutes de 1900 agrave 2010 ndash
version avril 2012 Contribution au Programme drsquoacquisitionde connaissances sur les eaux souterraines (PACES) Rapportreacutedigeacute par le Centre drsquoexpertise hydrique du Queacutebec(CEHQ) Direction de lrsquoexpertise hydrique Queacutebec p 112
Polygeacuteo Contexte stratigraphique quaternaire de la MRCdrsquoAutray (Lanaudiegravere) et modegravele stratigraphique 3D Rapport08695 20
Poulin M Rochefort L Pellerin S amp Thibault J J Threatsand protection for peatlands in Eastern CanadaGeacuteocarrefour 79 (4) 331ndash344
Querner E P Mioduszewski W Povilaitis A amp Slesicka A Modelling peatland hydrology Three cases fromnorthern Europe Polish Journal of Environmental Studies19 149ndash159
Reeve A S Siegel D I amp Glaser P H Simulating verticalflow in large peatlands Journal of Hydrology 227 207ndash217
ReeveA SWarzocha J Glaser PHampSiegelD I Regionalground-water flow modeling of the Glacial Lake AgassizPeatlands Minnesota Journal of Hydrology 243 91ndash100
Reeve A S Evensen R Glaser P H Siegel D I amp RosenberryD Flow path oscillations in transient ground-watersimulations of large peatland systems Journal of Hydrology316 313ndash324
Richard P J H amp Occhietti S 14C chronology for iceretreat and inception of Champlain Sea in the St LawrenceLowlands Canada Quaternary Research 63 353ndash358
Ronkanen A K amp Klove B Hydraulics and flow modellingof water treatment wetlands constructed on peatlands inNorthern Finland Water Research 42 3826ndash3836
Rosa Eacute Caracteacuterisation hydrogeacuteologique du complexetourbeux de Lanoraie Queacutebec Canada MSc thesisDeacutepartement des sciences de la Terre et de lrsquoatmosphegravereUQAM Montreal Quebec Canada p 95
Rosa Eacute amp Larocque M Investigating peat hydrologicalproperties using field and laboratory methods Application tothe Lanoraie peatland complex (southern Quebec Canada)Hydrological Processes 22 1866ndash1875
Rosa Eacute Larocque M Pellerin S Gagneacute S amp Fournier B Determining the number of manual measurements requiredto improve peat thickness estimations by ground penetratingradar Earth Surface Processes and Landforms 34 377ndash383
Rossi P M Ala-aho P Ronkanen A K amp Klove B Groundwater-surface water interaction between an eskeraquifer and a drained fen Journal of Hydrology 432 52ndash60
Roulet N T Peatlands carbon storage greenhouse gasesand the Kyoto Protocol prospects and significance forCanada Wetlands 20 605ndash615
Scibek J amp Allen D M Modeled impacts of predictedclimate change on recharge and groundwater levelsWater Resources Research 42 W11405
Siegel D I amp Glaser P H Groundwater-flow in a bog fencomplex Lost River peatland Northern Minnesota Journalof Ecology 75 743ndash754
Simpson T Holan I P amp Rushton K Drainage ditch-aquifer interaction with special reference to surface watersalinity in the Thurne catchment Norfolk UK Water andEnvironment Journal 25 116ndash128
Tarnocai C The amount of organic carbon in various soilorders and ecological provinces in Canada In Soil Processesand the Carbon Cycle (R Lal J M Kimble R E Follet amp BA Stewart eds) Pennsylvania Academy of SciencePittsburg USA pp 81ndash92
TechnoREM Cartographie hydrogeacuteologique reacutegional de lazone de production maraichegravere des MRC de Joliette etdrsquoAutray Programme drsquoapprovisionnement en eau Canada-Quebec PR08 74 1ndash310
Terratec Eacutetude geacuteotechnique projet no 4630-03 Berthier-Lanaudiere Hydro-Queacutebec 1792-4 1 1ndash49
Thompson J R Sorenson H R Gavin H amp Refsgaard A Application of the coupled MIKE SHEMIKE 11 modellingsystem to a lowland wet grassland in southeast EnglandJournal of Hydrology 293 151ndash179
Tousignant M E Pellerin S amp Brisson J The relativeimpact of human disturbances on the vegetation of a largewetland complex Wetlands 30 333ndash344
Wattendorf P Niederberger J Ehrmann O amp Konold W Consequences of climate change on the water balance of fenpeatlands in Baden-Wuerttemberg Hydrologie UndWasserbewirtschaftung 54 293ndash303
Whittington PNampPrice J S The effects ofwater table draw-down (as a surrogate for climate change) on the hydrology of afen peatland Canada Hydrological Processes 20 3589ndash3600
Worrall F Rowson J G Evans M G Pawson R Daniels S ampBonn A Carbon fluxes from eroding peatlands ndash thecarbon benefit of revegetation following wildfire EarthSurface Processes and Landforms 36 1487ndash1498
Yagouti A Vescovi L amp Boulet G Homogeacuteneacuteisation desseacuteries de tempeacuteratures et analyse de la variabiliteacute spatio-temporelle de ces seacuteries au Queacutebec meacuteridional ConsortiumOuranos Report no 4 Montreal Canada p 154
Yli-Petays M Laine J Vasander H amp Tuittila E S Carbongas exchange of a re-vegetated cut-away peatland fivedecades after abandonment Boreal Environment Research12 177ndash190
First received 17 December 2012 accepted in revised form 15 October 2013 Available online 26 November 2013
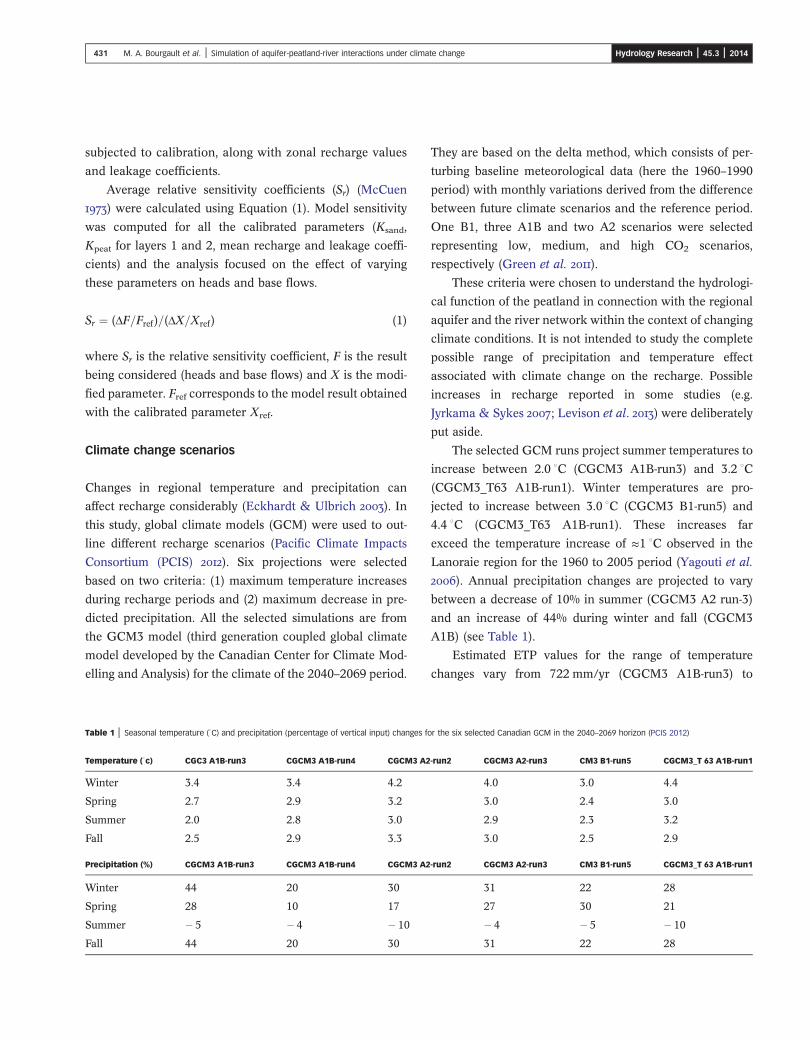