Temporal and spatial aspects of peatland initiation following deglaciation in North America
Upload
independentCategory
view
4download
0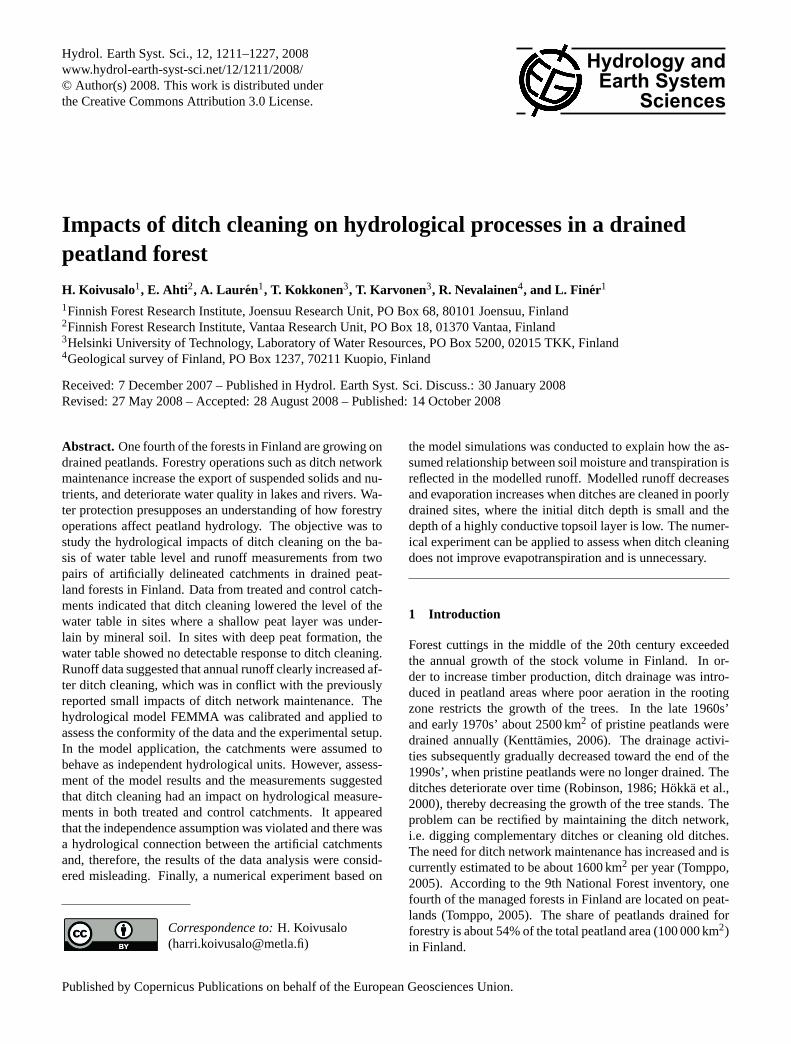
Hydrol. Earth Syst. Sci., 12, 1211–1227, 2008www.hydrol-earth-syst-sci.net/12/1211/2008/© Author(s) 2008. This work is distributed underthe Creative Commons Attribution 3.0 License.
Hydrology andEarth System
Sciences
Impacts of ditch cleaning on hydrological processes in a drainedpeatland forest
H. Koivusalo1, E. Ahti2, A. Laur en1, T. Kokkonen3, T. Karvonen3, R. Nevalainen4, and L. Finer1
1Finnish Forest Research Institute, Joensuu Research Unit, PO Box 68, 80101 Joensuu, Finland2Finnish Forest Research Institute, Vantaa Research Unit, PO Box 18, 01370 Vantaa, Finland3Helsinki University of Technology, Laboratory of Water Resources, PO Box 5200, 02015 TKK, Finland4Geological survey of Finland, PO Box 1237, 70211 Kuopio, Finland
Received: 7 December 2007 – Published in Hydrol. Earth Syst. Sci. Discuss.: 30 January 2008Revised: 27 May 2008 – Accepted: 28 August 2008 – Published: 14 October 2008
Abstract. One fourth of the forests in Finland are growing ondrained peatlands. Forestry operations such as ditch networkmaintenance increase the export of suspended solids and nu-trients, and deteriorate water quality in lakes and rivers. Wa-ter protection presupposes an understanding of how forestryoperations affect peatland hydrology. The objective was tostudy the hydrological impacts of ditch cleaning on the ba-sis of water table level and runoff measurements from twopairs of artificially delineated catchments in drained peat-land forests in Finland. Data from treated and control catch-ments indicated that ditch cleaning lowered the level of thewater table in sites where a shallow peat layer was under-lain by mineral soil. In sites with deep peat formation, thewater table showed no detectable response to ditch cleaning.Runoff data suggested that annual runoff clearly increased af-ter ditch cleaning, which was in conflict with the previouslyreported small impacts of ditch network maintenance. Thehydrological model FEMMA was calibrated and applied toassess the conformity of the data and the experimental setup.In the model application, the catchments were assumed tobehave as independent hydrological units. However, assess-ment of the model results and the measurements suggestedthat ditch cleaning had an impact on hydrological measure-ments in both treated and control catchments. It appearedthat the independence assumption was violated and there wasa hydrological connection between the artificial catchmentsand, therefore, the results of the data analysis were consid-ered misleading. Finally, a numerical experiment based on
Correspondence to:H. Koivusalo([email protected])
the model simulations was conducted to explain how the as-sumed relationship between soil moisture and transpiration isreflected in the modelled runoff. Modelled runoff decreasesand evaporation increases when ditches are cleaned in poorlydrained sites, where the initial ditch depth is small and thedepth of a highly conductive topsoil layer is low. The numer-ical experiment can be applied to assess when ditch cleaningdoes not improve evapotranspiration and is unnecessary.
1 Introduction
Forest cuttings in the middle of the 20th century exceededthe annual growth of the stock volume in Finland. In or-der to increase timber production, ditch drainage was intro-duced in peatland areas where poor aeration in the rootingzone restricts the growth of the trees. In the late 1960s’and early 1970s’ about 2500 km2 of pristine peatlands weredrained annually (Kenttamies, 2006). The drainage activi-ties subsequently gradually decreased toward the end of the1990s’, when pristine peatlands were no longer drained. Theditches deteriorate over time (Robinson, 1986; Hokka et al.,2000), thereby decreasing the growth of the tree stands. Theproblem can be rectified by maintaining the ditch network,i.e. digging complementary ditches or cleaning old ditches.The need for ditch network maintenance has increased and iscurrently estimated to be about 1600 km2 per year (Tomppo,2005). According to the 9th National Forest inventory, onefourth of the managed forests in Finland are located on peat-lands (Tomppo, 2005). The share of peatlands drained forforestry is about 54% of the total peatland area (100 000 km2)in Finland.
Published by Copernicus Publications on behalf of the European Geosciences Union.
1212 H. Koivusalo et al.: Ditch cleaning impacts on hydrology
The hydrological effects of draining pristine peatlandshave been studied widely in Finland (e.g., Kaitera, 1955; Mu-stonen and Seuna, 1971; Seuna, 1980; Starr and Paivanen,1981; Ahti, 1987) and elsewhere (e.g., Robinson, 1986;Lundin, 1994; Prevost et al., 1999; Holden et al., 2006).Holden et al. (2004) provide an extensive review on the ef-fects of drainage on the hydrological and hydrochemical pro-cesses of peatlands. The drainage of peatlands has bothshort- and long-term effects on hydrological processes, andthe magnitude and direction of the effects are dependent onlocal conditions. Many studies report increases in low flowrates after draining peatlands (Mustonen and Seuna, 1971;Seuna, 1980; Ahti, 1987; Johnson, 1998; Prevost et al.,1999), but the impact of drainage on the peak flows reportedin different studies varies. Peak flows after drainage havebeen found to increase (Mustonen and Seuna, 1971; Seuna,1980; Ahti, 1987), decrease (Kaitera, 1955; Lundin, 1994),or to be unchanged (Prevost et al., 1999). Field studies havedemonstrated that differences in soil hydraulic properties,meteorological conditions, vegetation cover and drainage de-sign, can affect the direction of change in the hydrologicalresponse. Robinson and Rycroft (1999) reviewed the mech-anisms underlying the impacts of drainage and stated that, inaddition to site characteristics, also catchment scale proper-ties, such as the location of the drained area and alterationsin the main channel are reflected in the runoff response. Inthe long-term the drainage of peatlands increases growth ofthe tree stands (Seppala, 1969; Hokka, 1997). The increasedheight and leaf area index (LAI) of the tree stand result inhigher canopy interception and transpiration, which gradu-ally leads to a decrease in runoff volumes (e.g., Koivusalo etal., 2006). A well-growing, densely-stocked tree stand mayplay a decisive role in the water balance of a drained peat-land (Ahti and Hokka, 2006). Paivanen and Sarkkola (2000)suggested that maintenance of a ditch network is not neces-sarily required when the volume of the growing stock is suffi-ciently large to maintain efficient interception and transpira-tion. An important question for practical forestry is to assesswhether ditch network maintenance is required, or whetherthe water uptake of the forest stand is sufficient to maintainfavourable moisture conditions in the rooting zone. In addi-tion to the growth of the tree stand, the vegetation colonisa-tion in the ditches can reduce runoff in the long term, ow-ing to the decrease in ditch depths and drainage efficiency(Robinson, 1986). Peatland drainage also has long-term ef-fects on the structure of the topmost peat layers (Silins andRothwell, 1998; Holden et al., 2006). The decreasing soilmoisture content enhances decomposition and subsidence ofthe peat layer, and alters the bulk density, water retentioncharacteristics, and pore-size distribution of the peat. Thesechanges can lead to a decrease in the hydraulic conductivityof peat (Silins and Rothwell, 1998).
Although the hydrological effects of draining pristine peat-lands have been comprehensively studied, the hydrologicaleffects of ditch network maintenance are not fully known.
Joensuu et al. (1999, 2001, 2002) investigated how ditchmaintenance affects runoff and water quality by compar-ing infrequent (biweekly – monthly) measurements from alarge set of small catchment pairs. Clear effects of ditchmaintenance on water quality were detected, but the ef-fects on measured runoff were not visible. Paivanen andSarkkola (2000) also suggested that ditch network mainte-nance combined with stand thinning has minor impacts onthe hydrology of peatlands in terms of water table elevation.Ahti and Paivanen (1997) reported that ditch network main-tenance alone results in a drop of only 0.05 m in the high-est levels of the water table. Lundin (1994) studied the ef-fects of forest clear-cutting and remedial drainage on flowregimes in catchments partly covered with peat or shallowlayers (<0.3 m) of organic material and partly covered withmineral soil (till). Mean annual runoff clearly increased af-ter clear-cutting, and to a lesser extent after the subsequentremedial drainage of the ditch network.
The data and methods used in earlier experimental studiesdo not support an evaluation of the effects of ditch mainte-nance on peatland hydrology as a whole. Combining exper-imental data with hydrological modelling provides one op-tion for assessing and understanding how forest managementpractices affect hydrological processes (see e.g., Kokkonen etal., 2006; Koivusalo et al., 2006; Lauren et al., 2005). Meteo-rological and hydrological measurements are bound togetherin the hydrological model, which allows the user to assess thesuitability of the model structure, the quality of the data, andthe consistency of the experimental setup. Poor performanceof the model can indicate deficiencies in the model struc-ture. An abrupt or gradual change in the model performance,on the other hand, can be an indicator of inconsistency inthe data or in the experimental setup. A successful modelapplication produces information for understanding the pro-cesses behind the observations. In a hydrological model, thedrainage of forested peatlands can be described using rou-tines implemented in agricultural water management mod-els (e.g., Skaggs, 1980; Jarvis, 1994; Oztekin et al., 2004;Oosterbaan et al., 1996). Amatya et al. (1997) and Skaggs etal. (2006) implemented a ditch drainage scheme of this sortin a forest ecosystem model. Dunn and Mackay (1996) pre-sented an application of a catchment scale simulation model,which showed that ditch drainage has counteracting effectson the generation of surface runoff and subsurface flow. Thecounteracting effects can change the direction of the drainageimpact on runoff response.
This study exploits experimental data from a drained peat-land area in central Finland, where four artificial forestedcatchments were created using ditch delineation. Two of thecatchments were subjected to ditch cleaning twenty years af-ter the initial drainage. The objectives of the study were 1)to identify the impact of ditch cleaning on water table lev-els and runoff on the basis of experimental data, 2) to cal-ibrate a hydrological model against the data, and to assesshow model performance reflects the data and the conformity
Hydrol. Earth Syst. Sci., 12, 1211–1227, 2008 www.hydrol-earth-syst-sci.net/12/1211/2008/
H. Koivusalo et al.: Ditch cleaning impacts on hydrology 1213
60°
0 200 km 25° E
N
Puolanka
VaalaSärkijärviTilanjoki
60° N
Helsinki C1 (ditch maintenance)
C2 (control)C3(ditch maintenance)
C4 (control)
0 500 m
a) b)
c)
S1…S3
W1…W3
28-43 mDitch
1
Fig. 1. Location of Tilanjoki and the weather stations in Sarkijarvi, Puolanka, and Vaala(a), layout of 4 research catchments (C1. . . C4) and39 measurement sites(b), and layout of a measurement site between two ditches. W1. . . W3 refer to water table measurement locations andS1. . . S3 to snow measurement points. Forest compartments with different tree stand properties are delineated with grey lines in (b).
of the experimental setup, and 3) to derive the effect ofditch cleaning on annual runoff using a model-based, nu-merical experiment. The model calibration is based on theapproach of Generalised Likelihood Uncertainty Estimation(GLUE) outlined in Beven and Binley (1992) and Beven andFreer (2001). GLUE is introduced to identify multiple pa-rameter sets that produce acceptable predictions of water ta-ble level and runoff, to study the sensitivity of model perfor-mance to calibration parameters, and to identify the limita-tions of the model structure.
2 Site description and field data
The experimental peatland area of Tilanjoki is located on theborder between two municipalities, Utajarvi and Puolanka, inFinland (Fig. 1a). The long-term (1971–2000) mean annualtemperature in the area was 1◦C and precipitation 550 mm/a.The peatlands were drained for the first time in 1969, fourexperimental catchments were delineated in 1983, and ditchcleaning was conducted in two of the catchments (C1 andC3) in autumn 1989 (Fig. 1b). The catchments in which ditchcleaning was carried out, and the control catchments wherethe ditches were not treated, were set up in Tilanjoki to facil-itate a paired catchment analysis of runoff and the export ofsolids and solutes. The areas of catchments C1, C2, C3, andC4 were 0.74, 0.50, 0.99, and 0.28 km2, respectively. Thespacing of the ditches ranges from 28 to 43 m, the depth of
the ditches prior to the cleaning was 0.3–0.5 m, and 0.8 mafter the cleaning.
Runoff at the outlet of each catchment was measured us-ing v-notched weirs and limnigraphs plotting the height ofthe water level at the weir. Inside the four catchments therewere altogether 39 measurement sites, where snow depthand depth of the level of water table were measured at threepoints in each site (Fig. 1b, c). In addition to the snow depthmeasurements, snow water equivalent (SWE) was monitoredat one location in each site. The snow and groundwater levelmeasurements were made once every 1–2 weeks.
Daily meteorological data, including precipitation, airtemperature, relative humidity, wind speed, and cloudiness,were available from nearby weather stations operated bythe Finnish Meteorological Institute in Sarkijarvi (Utajarvi),Vaala and Puolanka (Fig. 1a). In addition to these data, chartrecords of air temperature were available from two on-sitestations near the outlets of catchments 1 and 4. The hydrom-eteorological variables were measured from 1983 to 1994.
Tree stands in the study catchments are dominated byScots pine (Pinus sylvestrisL.), with a minor admixtureof pubescent birch (Betula pubescensEhrh.) and Norwayspruce (Picea abiesL. Karst.). Stand characteristics, as wellas the characteristics of the dominant trees (100 largest treesper ha), including height, diameter at breast height (DBH),and tree density, were measured on sample plots establishedin the 39 measurement sites. In 1983, 1989, and 1995 theproportion of Scots pine out of the total stand volume was91%, 90%, and 89%, respectively. The stand volumes in the
www.hydrol-earth-syst-sci.net/12/1211/2008/ Hydrol. Earth Syst. Sci., 12, 1211–1227, 2008
1214 H. Koivusalo et al.: Ditch cleaning impacts on hydrology
measurement sites ranged from 1.6 to 154 m3/ha, and the me-dian volume was 30 m3/ha in 1983. The bottom layer vege-tation consisted ofSpaghnummoss and the field layer vege-tation of sedges and dwarf shrubs.
The Tilanjoki area is characterized by a shallow peat thick-ness in most of the measurement sites. In this study, topsoilrefers to the shallow peat layer, except in two sites (7 and 8)with a deep peat formation, where the topsoil refers to thepeat layer above the depth of the ditches. Subsoil refers to allthe material below the topsoil. Subsoil is composed of peat,till, or sand, and their spatial distribution within the catch-ments was interpreted from ground penetrating radar data.
3 Methods
3.1 Analysis of water table level and runoff data
Water table and runoff measurements were analysed in or-der to detect the main hydrological impacts of ditch clean-ing. In each catchment the water table data were classifiedaccording to the three subsoil types (peat, till, and sand). Foreach subsoil type and catchment, the median water table levelwas computed for all measurement occasions. Median wasused instead of average, because the water table frequentlydropped below the depth of the measurement tubes, result-ing in censored observations. The median value is not assensitive to censored data as an average value. The annualmean values of the median water table levels before and af-ter ditch cleaning were computed, and the non-parametricMann-Whitney U test was applied to assess whether thelevel of the water table changed between the pre- and post-treatment periods. The non-parametric test was also appliedto determine whether the difference between the catchmentpairs (C2-C1 or C4-C3) changed between the pre- and post-treatment periods for each subsoil type. The significance ofthe change was assessed using a risk level of 5%. In thecomputation of annual water table depth, the censored val-ues were replaced with the measured maximum water tabledepth of the observation tube. The maximum value was usedbecause the effective length of the measurement tubes wasnot known. The data from the first year (1983) were omittedfrom the analysis due to the sedimentation of soil material atthe bottom of the tube after installation.
A paired catchment analysis between C1 and C2, and C3and C4 (Fig. 1) was conducted to determine changes in theannual runoff volumes following ditch cleaning. The pre-treatment (1983–1988) data were used to form a regres-sion model between the time series from the control andtreatment catchments (e.g. Nieminen, 2004). For the post-treatment period, the regression model and the data from thecontrol catchment were used to predict runoff for the treat-ment catchment under the assumption that the treatment hadnot occurred (e.g. Watson et al., 2001). The difference be-tween the observed and predicted values was assumed to be
a measure of the treatment effect. In the computation of an-nual runoff the data were accumulated only for those dayswhen records were available from both the treated and con-trol catchments. Because of the missing data, the estimateof annual runoff in this case is an underestimate compared tothe actual runoff from the catchments.
In a paired catchment analysis, the treated and controlcatchments need to be relatively similar in terms of area, to-pography, geology and vegetation, and the catchments mustnot have a connection linking their hydrological behaviour.When these criteria are met, the catchments can be assumedto have a similar response to manipulation (Cosby et al.,1996).
3.2 Hydrological model
FEMMA (model for Forestry Environmental Management)consists of sub-models for interception and transpiration inthe overstorey and understorey vegetation layers, snow ac-cumulation and melt, soil- and ground water interactions,and stream discharge (Koivusalo et al., 2005; Lauren et al.,2005). In the current study, daily time series of air tempera-ture, precipitation, relative humidity, wind speed, and down-ward short and long-wave radiation were used as input data.For the current study, FEMMA was modified in order to 1)improve the description of the canopy model for young andsparse peatland forests, 2) facilitate the computation of thedrainage flow as a water balance component, 3) improve pre-diction of the water table level, and 4) formulate a spatialdescription of a modelling domain for a drained peatland for-est. The following paragraphs briefly address these modifi-cations, together with the general description of FEMMA.
3.2.1 Canopy and snow models
Based on input data characterising the meteorological con-ditions above the canopy, the canopy model simulatesdownward short and long-wave radiation, wind speed, andthroughfall beneath the forest canopy. Relative humidity andair temperature are assumed to be unaffected by the canopy.The process descriptions are given in detail in Wigmosta etal. (1994), Koivusalo and Kokkonen (2002), and Koivusaloet al. (2006).
The canopy model accounts for the interception of rainfalland snowfall in the overstorey vegetation (trees), and for theinterception of rainfall in the understorey vegetation (fieldand bottom layer). Whenever the ground is snow-covered,interception in the understorey is disregarded. The stand den-sity gives the proportion of the ground that is covered by theoverstorey. In the current version of the canopy model, themethod presented by Raupach (1994) and Schaudt and Dick-inson (2000) was applied to parameterize the zero plane dis-placement height and the roughness height as a function ofthe stand density (canopy closure) and crown ratio. The pa-rameterization ensures that aerodynamic resistance decreases
Hydrol. Earth Syst. Sci., 12, 1211–1227, 2008 www.hydrol-earth-syst-sci.net/12/1211/2008/
H. Koivusalo et al.: Ditch cleaning impacts on hydrology 1215
when canopy closure approaches either full coverage in adense forest or zero in a very sparse forest. The density ofthe understorey canopy was set to the value of one.
Potential evaporation of intercepted water is computedseparately for the overstorey and understorey vegetation ac-cording to a combination equation of the Penman-Monteithtype, where the stomatal resistance is set to zero. Evapora-tion of the intercepted water occurs at the potential rate untilall the intercepted water is depleted. Transpiration, which isinitiated after the canopy has become dry, is controlled bythe stomatal resistance. The stomatal resistance is controlledby the leaf area index (LAI), soil temperature, water vapourpressure deficit, photosynthetically active radiation (PAR),and soil moisture (see Sect. 3.2.2). Evaporation from thesoil surface was neglected, because the moss vegetation andundecomposed litter covering the ground were assumed toblock evaporation from the peat surface.
The snow model simulates the snow surface energy bal-ance, heat conduction through the snowpack into the soil,snowmelt, liquid water retention in the snow, melt water dis-charge out of the snowpack, and compaction of the snow.The snow model is described in more detail in Koivusalo etal. (2001, 2006).
3.2.2 Characteristic profile model
Soil and ground water interactions in FEMMA are describedon the basis of the characteristic profile approach of Kar-vonen et al. (1999). In the case of a drained peatland,the characteristic profile is a vertical one-dimensional col-umn residing between the drainage ditch and the midpointbetween two parallel ditches. Soil water movement andrunoff generation processes are simulated using daily seriesof throughfall/snowmelt available from the canopy and snowsub-models. The characteristic profile model is quasi-two-dimensional in the sense that vertical and lateral water fluxesare computed alternately. The soil column is divided verti-cally into soil layers and the water fluxes between the layersare computed according to the Richards equation (Richards,1939). Transpiration is extracted from the soil layers resid-ing within the rooting zone. Infiltration into a soil column iscontrolled either by the current air-filled pore volume or thehydraulic conductivity of the topsoil layer. Water that cannotinfiltrate is transported laterally to the ditch as surface runoff.
In order to simulate the effect of drainage on transpiration,the relationship between soil moisture and transpiration waschanged from earlier applications of FEMMA. Schwarzel etal. (2006) studied moisture dynamics and evapotranspirationin a drained peatland and presented a relationship betweenthe rooting zone pressure head and the ratio of actual andpotential evapotranspiration. The relationship was adoptedin FEMMA to characterise how excessive soil moisture orsoil drying in the rooting zone decrease transpiration. Thestomatal resistancers is given by
rs = rsminf−11 (Tsoil)f
−12 (1e)f −1
3 (PAR)f −14 (θ) (1)
0
0.25
0.5
0.75
1
θ (-0.15 m)
f 4 ( θ )
Soil moisture
θ (-0.7 m)θ (-1.2 m)θ (-150 m) θ (0 m)
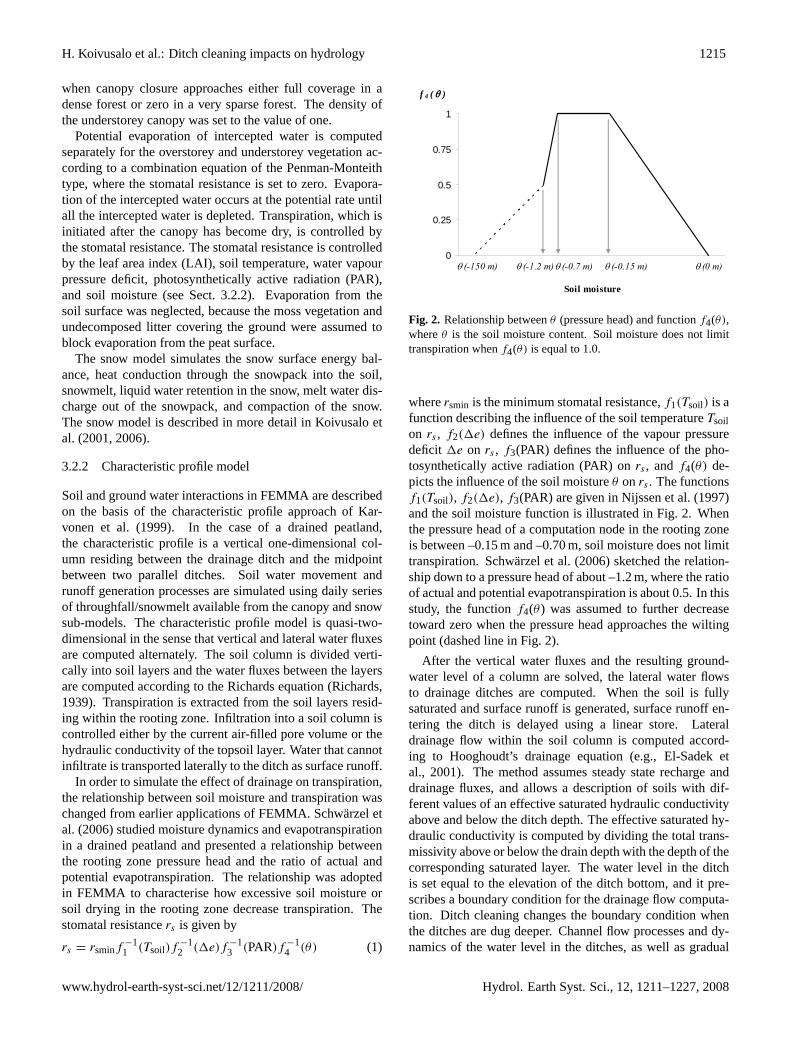
Figure 2. Relationship between θ (pressure head) and function f4(θ), where θ is the soil
moisture content. Soil moisture does not limit transpiration when f4(θ) is equal to 1.0.
35
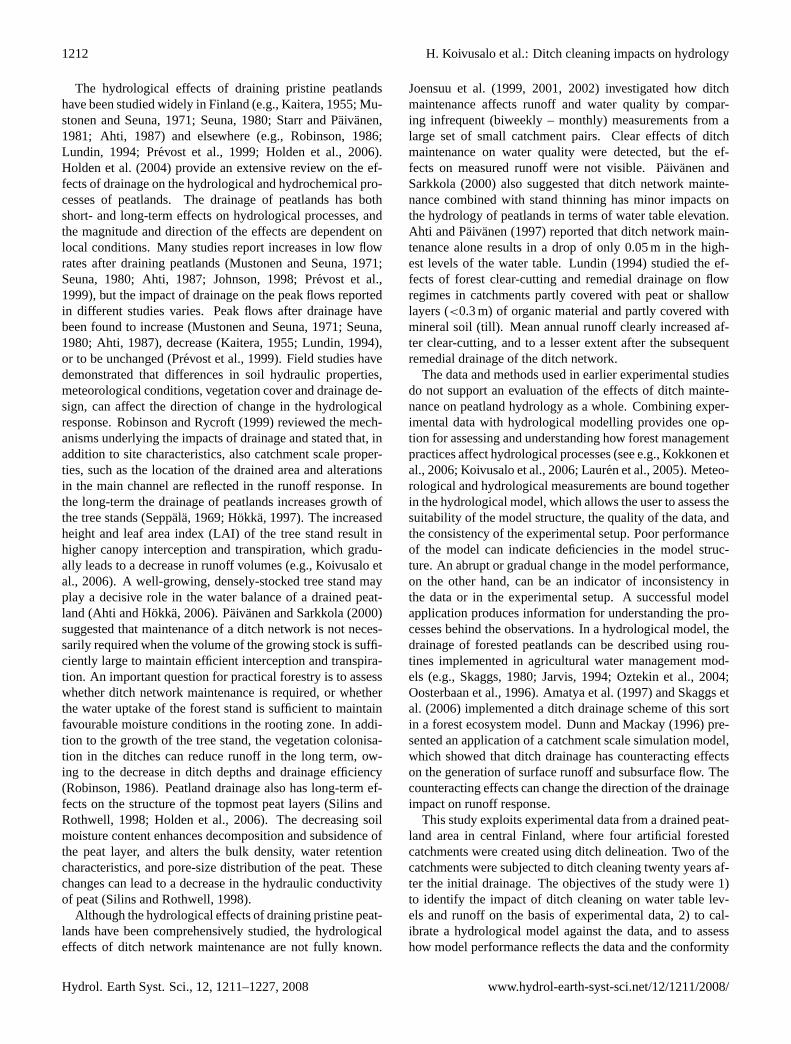
Fig. 2. Relationship betweenθ (pressure head) and functionf4(θ),whereθ is the soil moisture content. Soil moisture does not limittranspiration whenf4(θ) is equal to 1.0.
wherersmin is the minimum stomatal resistance,f1(Tsoil) is afunction describing the influence of the soil temperatureTsoilon rs , f2(1e) defines the influence of the vapour pressuredeficit 1e on rs , f3(PAR) defines the influence of the pho-tosynthetically active radiation (PAR) onrs , andf4(θ) de-picts the influence of the soil moistureθ onrs . The functionsf1(Tsoil), f2(1e), f3(PAR) are given in Nijssen et al. (1997)and the soil moisture function is illustrated in Fig. 2. Whenthe pressure head of a computation node in the rooting zoneis between –0.15 m and –0.70 m, soil moisture does not limittranspiration. Schwarzel et al. (2006) sketched the relation-ship down to a pressure head of about –1.2 m, where the ratioof actual and potential evapotranspiration is about 0.5. In thisstudy, the functionf4(θ ) was assumed to further decreasetoward zero when the pressure head approaches the wiltingpoint (dashed line in Fig. 2).
After the vertical water fluxes and the resulting ground-water level of a column are solved, the lateral water flowsto drainage ditches are computed. When the soil is fullysaturated and surface runoff is generated, surface runoff en-tering the ditch is delayed using a linear store. Lateraldrainage flow within the soil column is computed accord-ing to Hooghoudt’s drainage equation (e.g., El-Sadek etal., 2001). The method assumes steady state recharge anddrainage fluxes, and allows a description of soils with dif-ferent values of an effective saturated hydraulic conductivityabove and below the ditch depth. The effective saturated hy-draulic conductivity is computed by dividing the total trans-missivity above or below the drain depth with the depth of thecorresponding saturated layer. The water level in the ditchis set equal to the elevation of the ditch bottom, and it pre-scribes a boundary condition for the drainage flow computa-tion. Ditch cleaning changes the boundary condition whenthe ditches are dug deeper. Channel flow processes and dy-namics of the water level in the ditches, as well as gradual
www.hydrol-earth-syst-sci.net/12/1211/2008/ Hydrol. Earth Syst. Sci., 12, 1211–1227, 2008
1216 H. Koivusalo et al.: Ditch cleaning impacts on hydrology
0
0.5
1
1.5
2
2.5
3
1 3 5 7 9 11 13 15 17 19 21 23 25 27 29 31 33 35 37 39
LAI [
-]
198319891995
C1 C2 C3 C4C4
Figure 3. Estimated values of LAI in years 1983, 1989, and 1995 in the 39 measurement sites
at Tilanjoki. Catchments C1 and C3 were subjected to ditch cleaning in 1989, and catchments
C2 and C4 were control catchments.
36
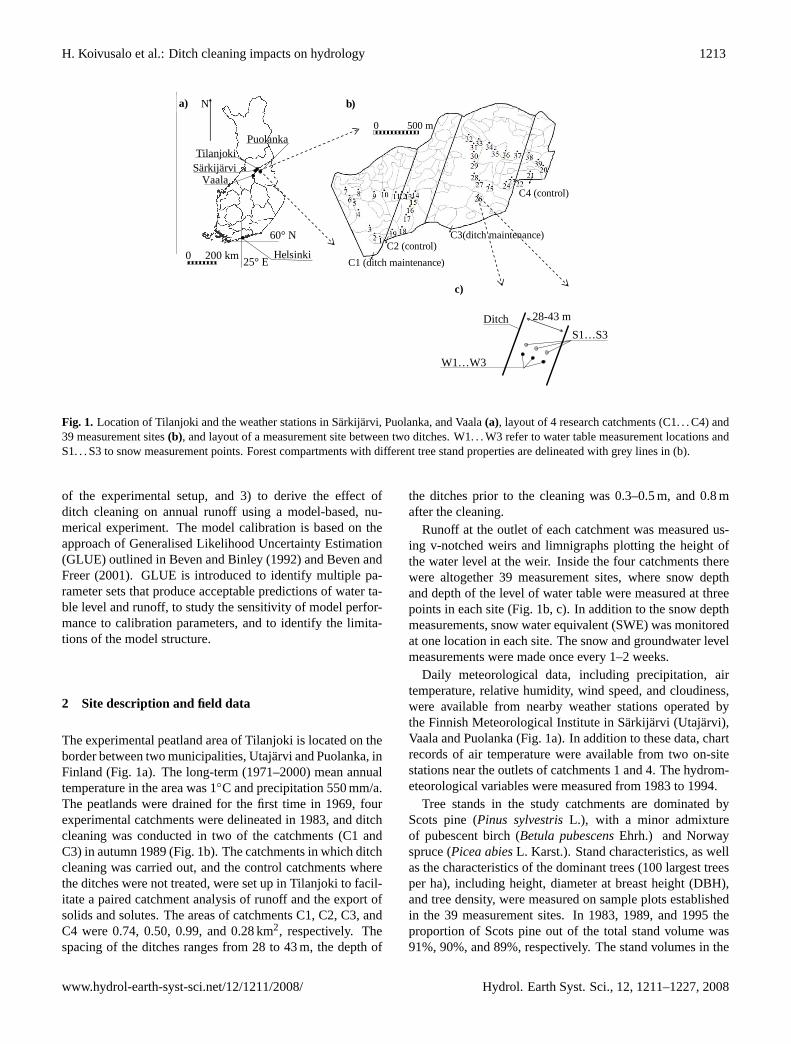
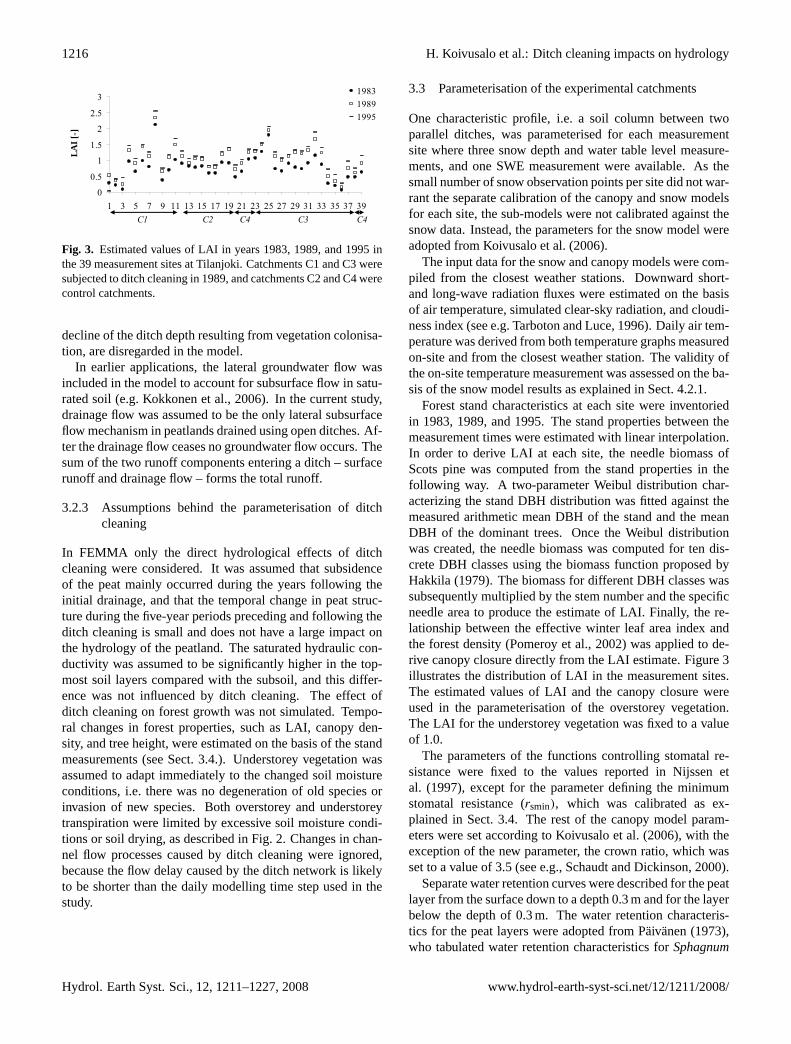
Fig. 3. Estimated values of LAI in years 1983, 1989, and 1995 inthe 39 measurement sites at Tilanjoki. Catchments C1 and C3 weresubjected to ditch cleaning in 1989, and catchments C2 and C4 werecontrol catchments.
decline of the ditch depth resulting from vegetation colonisa-tion, are disregarded in the model.
In earlier applications, the lateral groundwater flow wasincluded in the model to account for subsurface flow in satu-rated soil (e.g. Kokkonen et al., 2006). In the current study,drainage flow was assumed to be the only lateral subsurfaceflow mechanism in peatlands drained using open ditches. Af-ter the drainage flow ceases no groundwater flow occurs. Thesum of the two runoff components entering a ditch – surfacerunoff and drainage flow – forms the total runoff.
3.2.3 Assumptions behind the parameterisation of ditchcleaning
In FEMMA only the direct hydrological effects of ditchcleaning were considered. It was assumed that subsidenceof the peat mainly occurred during the years following theinitial drainage, and that the temporal change in peat struc-ture during the five-year periods preceding and following theditch cleaning is small and does not have a large impact onthe hydrology of the peatland. The saturated hydraulic con-ductivity was assumed to be significantly higher in the top-most soil layers compared with the subsoil, and this differ-ence was not influenced by ditch cleaning. The effect ofditch cleaning on forest growth was not simulated. Tempo-ral changes in forest properties, such as LAI, canopy den-sity, and tree height, were estimated on the basis of the standmeasurements (see Sect. 3.4.). Understorey vegetation wasassumed to adapt immediately to the changed soil moistureconditions, i.e. there was no degeneration of old species orinvasion of new species. Both overstorey and understoreytranspiration were limited by excessive soil moisture condi-tions or soil drying, as described in Fig. 2. Changes in chan-nel flow processes caused by ditch cleaning were ignored,because the flow delay caused by the ditch network is likelyto be shorter than the daily modelling time step used in thestudy.
3.3 Parameterisation of the experimental catchments
One characteristic profile, i.e. a soil column between twoparallel ditches, was parameterised for each measurementsite where three snow depth and water table level measure-ments, and one SWE measurement were available. As thesmall number of snow observation points per site did not war-rant the separate calibration of the canopy and snow modelsfor each site, the sub-models were not calibrated against thesnow data. Instead, the parameters for the snow model wereadopted from Koivusalo et al. (2006).
The input data for the snow and canopy models were com-piled from the closest weather stations. Downward short-and long-wave radiation fluxes were estimated on the basisof air temperature, simulated clear-sky radiation, and cloudi-ness index (see e.g. Tarboton and Luce, 1996). Daily air tem-perature was derived from both temperature graphs measuredon-site and from the closest weather station. The validity ofthe on-site temperature measurement was assessed on the ba-sis of the snow model results as explained in Sect. 4.2.1.
Forest stand characteristics at each site were inventoriedin 1983, 1989, and 1995. The stand properties between themeasurement times were estimated with linear interpolation.In order to derive LAI at each site, the needle biomass ofScots pine was computed from the stand properties in thefollowing way. A two-parameter Weibul distribution char-acterizing the stand DBH distribution was fitted against themeasured arithmetic mean DBH of the stand and the meanDBH of the dominant trees. Once the Weibul distributionwas created, the needle biomass was computed for ten dis-crete DBH classes using the biomass function proposed byHakkila (1979). The biomass for different DBH classes wassubsequently multiplied by the stem number and the specificneedle area to produce the estimate of LAI. Finally, the re-lationship between the effective winter leaf area index andthe forest density (Pomeroy et al., 2002) was applied to de-rive canopy closure directly from the LAI estimate. Figure 3illustrates the distribution of LAI in the measurement sites.The estimated values of LAI and the canopy closure wereused in the parameterisation of the overstorey vegetation.The LAI for the understorey vegetation was fixed to a valueof 1.0.
The parameters of the functions controlling stomatal re-sistance were fixed to the values reported in Nijssen etal. (1997), except for the parameter defining the minimumstomatal resistance (rsmin), which was calibrated as ex-plained in Sect. 3.4. The rest of the canopy model param-eters were set according to Koivusalo et al. (2006), with theexception of the new parameter, the crown ratio, which wasset to a value of 3.5 (see e.g., Schaudt and Dickinson, 2000).
Separate water retention curves were described for the peatlayer from the surface down to a depth 0.3 m and for the layerbelow the depth of 0.3 m. The water retention characteris-tics for the peat layers were adopted from Paivanen (1973),who tabulated water retention characteristics forSphagnum
Hydrol. Earth Syst. Sci., 12, 1211–1227, 2008 www.hydrol-earth-syst-sci.net/12/1211/2008/
H. Koivusalo et al.: Ditch cleaning impacts on hydrology 1217
peat with different bulk densities and degrees of humifica-tion. The water retention characteristics of samples 173–178 (Paivanen, 1973) with a bulk density of 47 kg/m3 wereadopted for the upper peat layer, and the water retentioncharacteristics of samples 97–100 with a bulk density of108 kg/m3 for the lower peat layer. In the current study, pa-rameters of the van Genuchten (1980) function were fittedagainst the data from Paivanen (1973). Temporal changesin peat characteristics were neglected. The water retentioncharacteristics for mineral soils were derived by using theon-site measurements of particle size distribution and the re-lationship presented by Jauhiainen (2004).
Peat is characterised by a high hydraulic conductivity inthe top soil layer, and the conductivity typically decreaseswith depth (e.g. Paivanen, 1973; Ahti, 1987; Lundin, 1994;Skaggs et al., 2006). In each measurement site, the depthof an interface between a highly conductive upper soil layerand a less conductive lower soil layer was deduced from thewater table data in each site. During excessively wet peri-ods, such as the summer of 1987 in Tilanjoki, the water tableremained near the bottom level of the highly conductive top-soil layer. The depth of an interface between the top soillayer having high hydraulic conductivity and the lower layerhaving low conductivity was set equal to the median level ofthe measured water table in the wet summer of 1987 (May–September). The depth of the rooting zone was set to a valueof 0.2 m.
In the model setup the depth of the drainage ditches wasset to 0.5 m prior to ditch cleaning and 0.8 m after cleaningin autumn 1989. Changes in the depth of the ditches causedby erosion, sedimentation, and vegetation colonisation weredisregarded.
3.4 Calibration of FEMMA
FEMMA was calibrated against both water table and runoffdata. Water table data for the calibration were from site 7,where the subsoil is peat, from site 26 with sandy subsoil,and from site 27 with till subsoil. The three calibration sitesrepresented the three different subsoil types within the catch-ments. Measured runoff for the calibration was from catch-ment C3, where the ditches were cleaned in 1989. The mod-elled runoff that was compared against the measured runoffduring the calibration was computed as the average runofffrom the two sites (26 and 27) located in catchment C3. Inorder to reduce the computation time during the model cal-ibration, not all the sites (23–37) located in catchment C3were used in computing runoff.
The six calibration parameters are listed in Table 1. Theminimum stomatal resistance controls the level of transpira-tion during the growing season, and its range was set follow-ing the values presented for coniferous trees in earlier studies(e.g. Wigmosta et al., 1994; Nijssen et al., 1997; Whitaker etal., 2003; Koivusalo et al., 2006). The hydraulic conductiv-ity of the saturated topsoil layer, and the hydraulic conduc-
Table 1. Ranges of the calibration parameters. Calibration parame-ters are the retention coefficient of surface runoff (a), the saturatedhydraulic conductivity of the topsoil layer (Ktop), the conductivityof sandy subsoil (Ksand), the conductivity of till subsoil (Ktill ), theconductivity of peat subsoil (Kpeat), and the minimum stomatal re-sistance (rsmin). The values of the parameters used in the numericalexperiment are also shown.
Min Max Numerical exp.
a [–] 0.05 0.95 1Ktop [cm/h] 0.1 500 124Ksand[cm/h] 0.0001 10 4.6Ktill [cm/h] 0.0001 10 2Kpeat[cm/h] 0.0001 2 0.08rsmin [s/m] 50 1000 508
tivities of peat subsoil, sand subsoil, and till subsoil controlthe dynamics of the water table and runoff. The range ofthe hydraulic conductivity of the topsoil was prescribed to belarger than the ranges for the subsoil hydraulic conductivities(Table 1). The ranges were chosen according to preliminarytesting of the model parameterisation during the wet summerof 1987. It is noteworthy that the saturated hydraulic con-ductivity of the topsoil layer was assumed to be the same inall three sites used for the calibration. The retention coeffi-cient of surface runoff affects the runoff dynamics during thehighest peak flows in spring. The calibration range for theretention coefficient was a physically meaningful range froma small value close to zero to a value close to unity.
The model calibration was based on the GLUE (Gen-eralised Likelihood Uncertainty Estimation) approach ofBeven and Binley (1992). In the application of the GLUEmethodology, prior distributions of the calibration parame-ters were assumed to be uniform within the predefined pa-rameter ranges. For each parameter set, a likelihood mea-sure,ET , was computed as
ET = EgwpEgwtEgwsEr (2)
whereEgwp is the Nash and Sutcliffe (1970) efficiency be-tween the measured and modelled depth to the water tablein site 7 with peat subsoil,Egwt is the efficiency betweenthe measured and modelled water table depth in site 27 withtill subsoil,Egws is the efficiency between the measured andmodelled water table depth in site 26 with sandy subsoil,and Er is the efficiency between measured and modelleddaily runoff in catchment C3. The parameter set was de-termined to be ‘behavioural’ when the individual efficien-cies (Egwp, Egwt, Egws, andEr) were greater than the pre-scribed threshold (See Sect. 4.2.1). After a large set of“behavioural” parameter sets were identified, the posterioridistributions of the calibration parameters were derived aslikelihood-weighted cumulative distributions. The 5th and95th percentiles of the model parameters, simulated water
www.hydrol-earth-syst-sci.net/12/1211/2008/ Hydrol. Earth Syst. Sci., 12, 1211–1227, 2008

1218 H. Koivusalo et al.: Ditch cleaning impacts on hydrology
table level, and simulated runoff were derived as outlined inBeven and Binley (1992) and Beven and Freer (2001). Itshould be noted that the uncertainty estimation in the GLUEmethodology includes subjectivity, because the selection ofcalibration parameters, their prior distributions, and the formof the likelihood function are fixed on the basis of the mod-eller’s deduction (see e.g., Freni et al., 2008). Here the un-certainty limits were applied to see how the equifinality ofthe calibration parameters was reflected in the model resultsand whether there were reasons for a rejection of the modelstructure.
After model calibration, runoff from each catchment wascomputed for each parameter set at a time as follows. Thehydrological model was applied in each measurement site tosimulate the runoff input that enters the ditch network. To-tal runoff from the catchments was computed as an equallyweighted average runoff from the measurement sites locatedin each of the catchments C1–C4 (Fig. 1). The simple aver-aging scheme implies that the distribution of soil and vegeta-tion properties is assumed to be similar in the catchment andamong the water table measurement sites inside the catch-ment.
3.5 Numerical experiment
In the numerical experiment, FEMMA was applied todemonstrate how the key assumptions behind the modelstructure are reflected in the simulated ditch cleaning impactson the water balance. The numerical experiment focused onidentifying changes in annual runoff, when the ditch depthvaried in the range typically found in Finnish drained peat-lands before and after ditch network maintenance. The hy-pothetical drained peatland forest used in the numerical ex-periment was hydrologically isolated from its surroundings,and the most important water fluxes out of the system werethe water flow to the ditches and evapotranspiration of thevegetation. Model simulations were conducted to visualisethe effect of forest dimensions (LAI) and soil conductivitystructure (depth of the highly conductive layer) on the annualrunoff volume. LAI and conductivity depth are the variables,which show large variability between the 39 measurementsites in Tilanjoki.
Table 1 lists the model parameters for the numerical ex-periment. In each model simulation, the ditch depth, forestdimensions, subsoil type, and soil structure, were set to pre-scribed values, and the model was run for a four-year periodfrom 1990 to 1993. The ditch depth varied from a depth of0.3 m to a depth of 1.2 m, LAI of the initial tree stand in 1990was either 0.5 or 2.0, the subsoil type was either peat or till,and the depth of the highly conductive layer ranged from 0.1to 0.4 m. The spacing of the ditches was set to a value of40 m.
4 Results and discussion
4.1 Analysis of the experimental data
4.1.1 Water table level
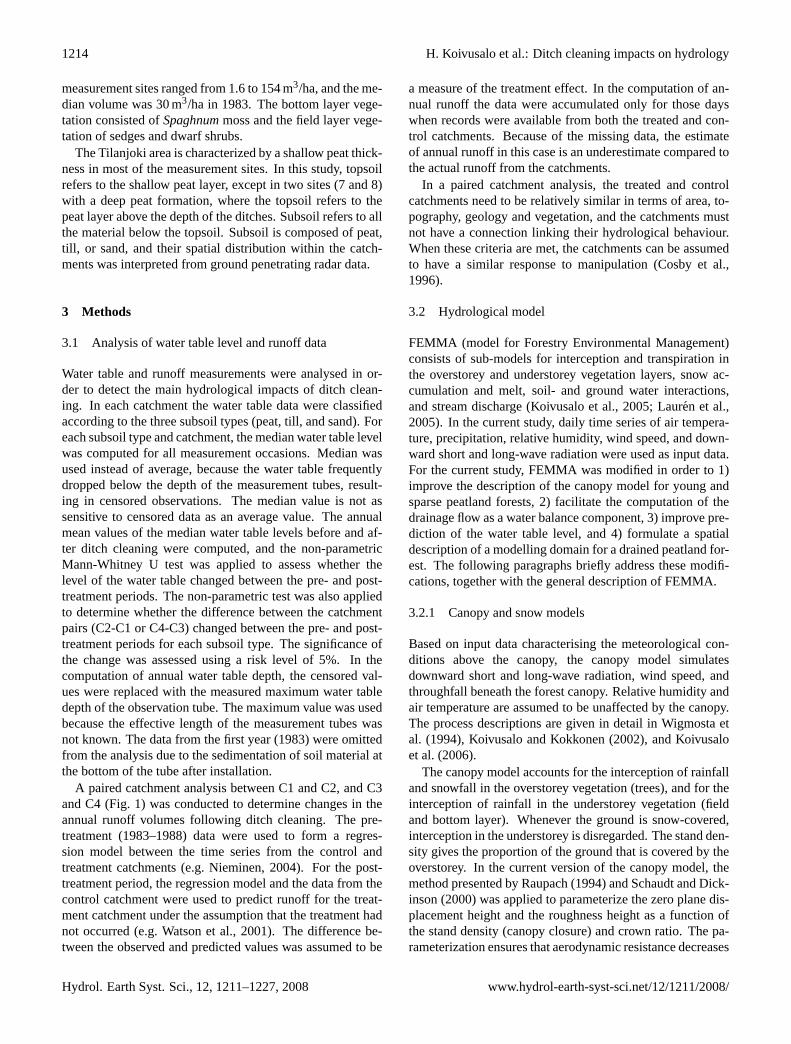
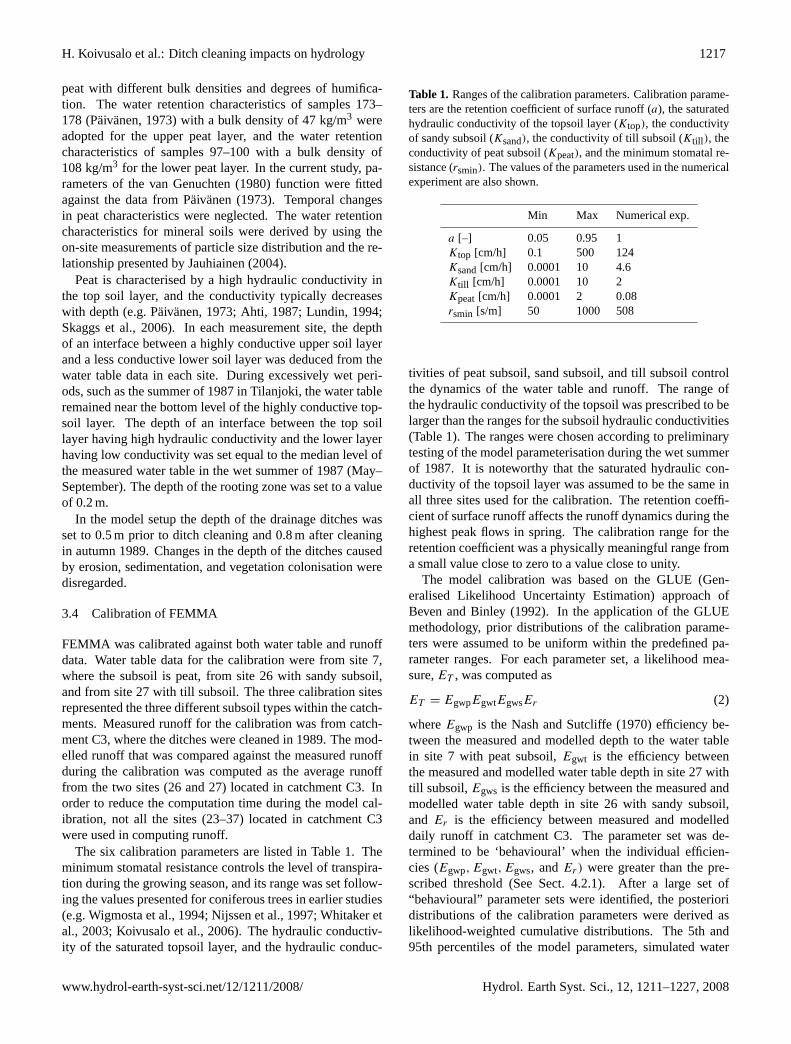
The response of the annual water table level to ditch clean-ing depended on the subsoil type (Fig. 4). The annual watertable level showed no change from the pre-treatment to thepost-treatment period in the sites with a deep peat layer incatchment C1 (Fig. 4a, P-value=0.15). In the sites with tillsubsoil in catchment C1, the water table level decreased af-ter ditch cleaning (Fig. 4b, P-value=0.016). However, thedifference between the annual water table levels betweencatchments C1 (ditch cleaning) and C2 (control) did notchange when moving from the pre-treatment period to thepost-treatment period (Fig. 4b, P-value=0.056). The resultsfor catchments C3 (ditch cleaning) and C4 (control) with tillsubsoil (Fig. 4c) suggest that the difference between the wa-ter table levels in the two catchments increased after ditchmaintenance (P-value=0.008). The impact of ditch cleaningon the water table level was smaller in catchment C1 com-pared with catchment C3. The mean depth of the surfacepeat layer is thin (0.22 m) in catchment C3 compared withthe mean peat depth (0.57 m) in catchment C1. The impactof ditch cleaning could be related to the thickness of the sur-face peat layer on the till subsoil. In the sites with sand sub-soil the impact of ditch cleaning on the water table level wasclear in both catchment pairs C1–C2 and C3–C4 (Fig. 4d–e,P-value=0.008). The peat depth in the sites with sand subsoilwas 0.29 and 0.33 m in catchments C1 and C2, and 0.12 and0.16 m in catchments C3 and C4, respectively.
The decrease of the water table in the control catchmentC4 was significant in Fig. 4c (P-value=0.008) and in Fig. 4e(P-value=0.016). This indicates that 1) the meteorologicalconditions driving the water table dynamics changed fromthe pre-treatment to the post-treatment periods, 2) the controlcatchment was not fully isolated from the treated catchment,or 3) the observed change resulted from the different numberof water table measurements in the pre- and post treatmentsperiods. This issue is analysed further in the modelling exer-cise in Sect. 4.2. The small response of the water table levelin sites with a deep peat formation is line with earlier resultsof Ahti and Paivanen (1997).
4.1.2 Runoff
Runoff from the treated catchment C1 was, on the average,12% lower than runoff from the control catchment C2 beforeditch cleaning but, after ditch cleaning, the runoff of C1 was23% higher than that from C2 (Fig. 5a). The paired catch-ment analysis yielded a regression between the two catch-ments for the pre-treatment period with anR2 value of 0.93(P-value=0.0017). The resulting treatment effect suggestedthat runoff increased by 38% after ditch cleaning.
Hydrol. Earth Syst. Sci., 12, 1211–1227, 2008 www.hydrol-earth-syst-sci.net/12/1211/2008/
H. Koivusalo et al.: Ditch cleaning impacts on hydrology 1219
0
40
80
120WT
dept
h [c
m]
Till subsoil (C1 - treated) Till subsoil (C2 - control)Annual level (C1) Annual level (C2)
b)
0
40
80
120
WT
dept
h [c
m]
Sand subsoil (C1 - treated) Sand subsoil (C2 - control)
Annual level (C1) Annual level (C2)
d)
0
40
80
120
1984 1985 1986 1987 1988 1989 1990 1991 1992 1993 1994 1995
Time [yr]
WT
dept
h [c
m]
Peat subsoil (C1 - treated)Annual level (C1)
a)
Ditch cleaning
0
40
80
120
WT
dept
h [c
m]
Till subsoil (C3 - treated) Till subsoil (C4 - control)Annual level (C3) Annual level (C4)
c)
0
40
80
120
WT
dept
h [c
m]
Sand subsoil (C3 - treated) Sand subsoil (C4 - control)Annual level (C3) Annual level (C4)
e)
Figure 4. Measured median depth of the water table level (WT) in sites with peat subsoil (a),
median WT depth in sites with till subsoil located in catchments C1 (treated) and C2 (control)
(b), median WT depth in sites with till subsoil located in catchments C3 (treated) and C4
(control) (c), median WT depth in sites with sand subsoil located in catchments C1 and C2
(d), and median WT depth in sites with sand subsoil located in catchments C3 and C4 (e). The
horizontal lines show the mean annual WT levels.
37
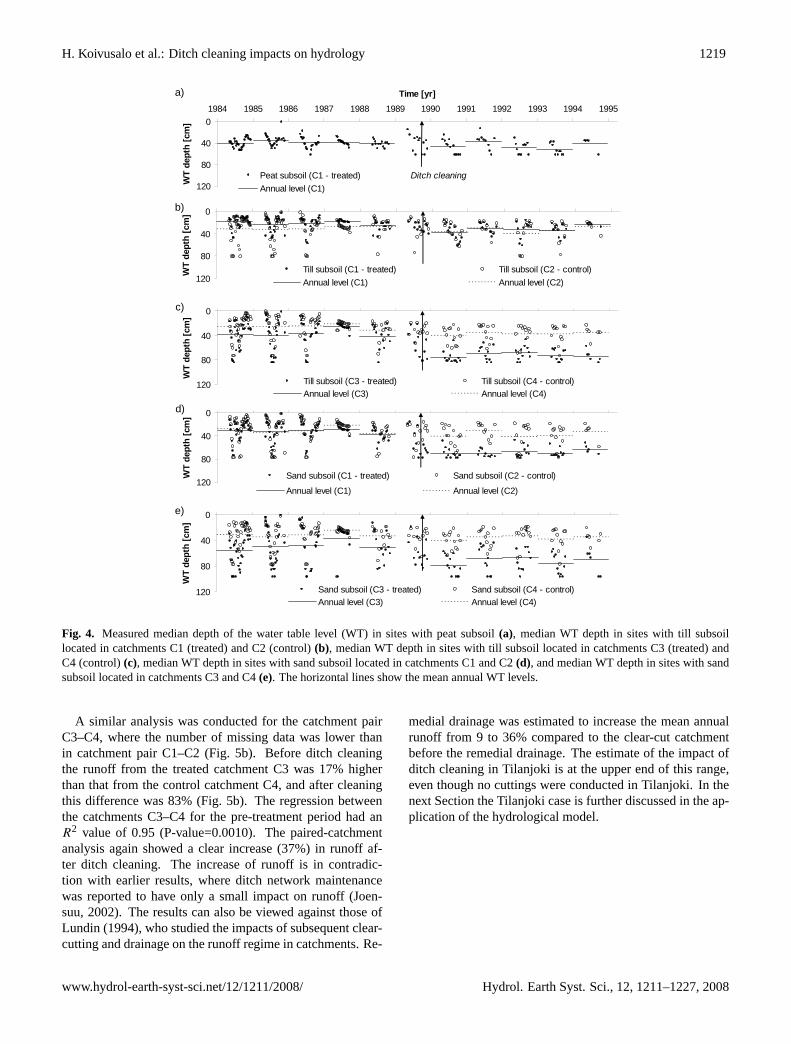
Fig. 4. Measured median depth of the water table level (WT) in sites with peat subsoil(a), median WT depth in sites with till subsoillocated in catchments C1 (treated) and C2 (control)(b), median WT depth in sites with till subsoil located in catchments C3 (treated) andC4 (control)(c), median WT depth in sites with sand subsoil located in catchments C1 and C2(d), and median WT depth in sites with sandsubsoil located in catchments C3 and C4(e). The horizontal lines show the mean annual WT levels.
A similar analysis was conducted for the catchment pairC3–C4, where the number of missing data was lower thanin catchment pair C1–C2 (Fig. 5b). Before ditch cleaningthe runoff from the treated catchment C3 was 17% higherthan that from the control catchment C4, and after cleaningthis difference was 83% (Fig. 5b). The regression betweenthe catchments C3–C4 for the pre-treatment period had anR2 value of 0.95 (P-value=0.0010). The paired-catchmentanalysis again showed a clear increase (37%) in runoff af-ter ditch cleaning. The increase of runoff is in contradic-tion with earlier results, where ditch network maintenancewas reported to have only a small impact on runoff (Joen-suu, 2002). The results can also be viewed against those ofLundin (1994), who studied the impacts of subsequent clear-cutting and drainage on the runoff regime in catchments. Re-
medial drainage was estimated to increase the mean annualrunoff from 9 to 36% compared to the clear-cut catchmentbefore the remedial drainage. The estimate of the impact ofditch cleaning in Tilanjoki is at the upper end of this range,even though no cuttings were conducted in Tilanjoki. In thenext Section the Tilanjoki case is further discussed in the ap-plication of the hydrological model.
www.hydrol-earth-syst-sci.net/12/1211/2008/ Hydrol. Earth Syst. Sci., 12, 1211–1227, 2008
1220 H. Koivusalo et al.: Ditch cleaning impacts on hydrology
0
100
200
300
400
500
Run
off [
mm
/yr]
-4
-3
-2
-1
0
1
Mis
sing
dat
a
C1 - treatedC2 - controlMissing dataSeries4
a)
0
100
200
300
400
500
1983 1984 1985 1986 1987 1988 1989 1990 1991 1992 1993
Time [yr]
Run
off [
mm
/yr]
-4
-3
-2
-1
0
1
Mis
sing
dat
a
C3 - treatedC4 - controlMissing data fractionSeries4
b)
Figure 5. Measured annual runoff in catchments C1 (treated) and C2 (control) (a), and
measured annual runoff in catchments C3 (treated) and C4 (control) (b). The proportion of
days per year when measurements are missing for the catchment pair are also presented. Ditch
cleaning occurred in 1989.
38
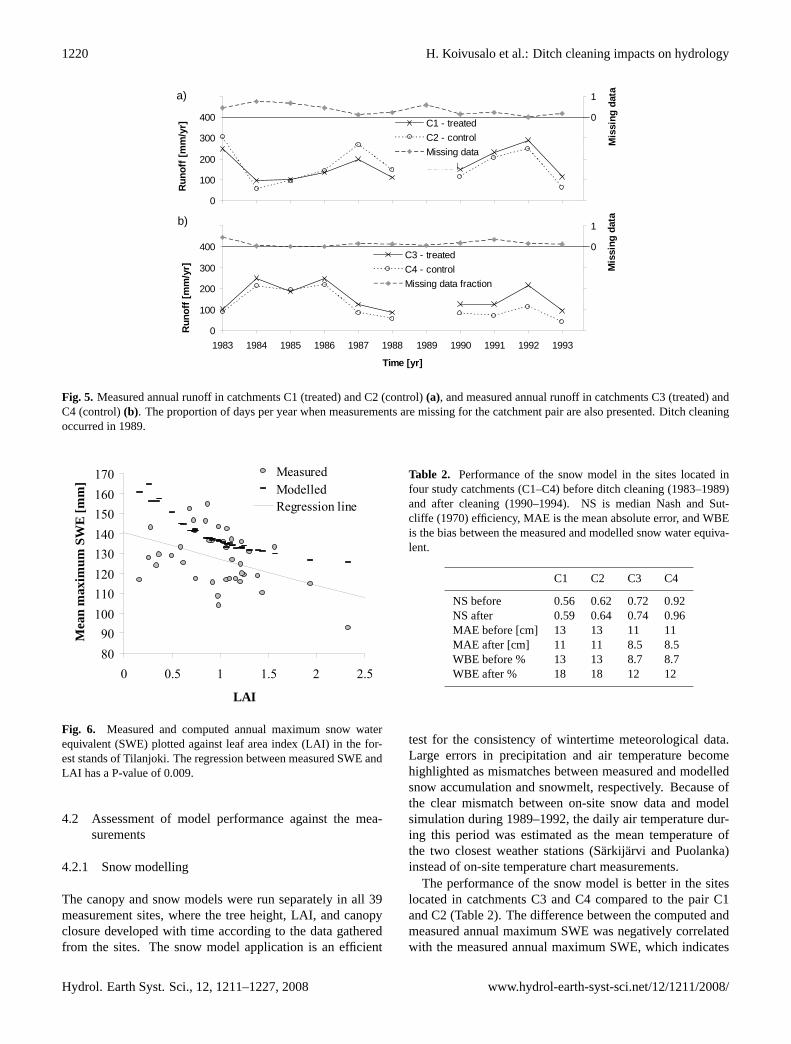
Fig. 5. Measured annual runoff in catchments C1 (treated) and C2 (control)(a), and measured annual runoff in catchments C3 (treated) andC4 (control)(b). The proportion of days per year when measurements are missing for the catchment pair are also presented. Ditch cleaningoccurred in 1989.
8090
100110120130140150160170
0 0.5 1 1.5 2 2
LAI
Mea
n m
axim
um S
WE
[mm
]
.5
MeasuredModelledRegression line
Figure 6. Measured and computed annual maximum snow water equivalent (SWE) plotted
against leaf area index (LAI) in the forest stands of Tilanjoki. The regression between
measured SWE and LAI has a P-value of 0.009.
39
Fig. 6. Measured and computed annual maximum snow waterequivalent (SWE) plotted against leaf area index (LAI) in the for-est stands of Tilanjoki. The regression between measured SWE andLAI has a P-value of 0.009.
4.2 Assessment of model performance against the mea-surements
4.2.1 Snow modelling
The canopy and snow models were run separately in all 39measurement sites, where the tree height, LAI, and canopyclosure developed with time according to the data gatheredfrom the sites. The snow model application is an efficient
Table 2. Performance of the snow model in the sites located infour study catchments (C1–C4) before ditch cleaning (1983–1989)and after cleaning (1990–1994). NS is median Nash and Sut-cliffe (1970) efficiency, MAE is the mean absolute error, and WBEis the bias between the measured and modelled snow water equiva-lent.
C1 C2 C3 C4
NS before 0.56 0.62 0.72 0.92NS after 0.59 0.64 0.74 0.96MAE before [cm] 13 13 11 11MAE after [cm] 11 11 8.5 8.5WBE before % 13 13 8.7 8.7WBE after % 18 18 12 12
test for the consistency of wintertime meteorological data.Large errors in precipitation and air temperature becomehighlighted as mismatches between measured and modelledsnow accumulation and snowmelt, respectively. Because ofthe clear mismatch between on-site snow data and modelsimulation during 1989–1992, the daily air temperature dur-ing this period was estimated as the mean temperature ofthe two closest weather stations (Sarkijarvi and Puolanka)instead of on-site temperature chart measurements.
The performance of the snow model is better in the siteslocated in catchments C3 and C4 compared to the pair C1and C2 (Table 2). The difference between the computed andmeasured annual maximum SWE was negatively correlatedwith the measured annual maximum SWE, which indicates
Hydrol. Earth Syst. Sci., 12, 1211–1227, 2008 www.hydrol-earth-syst-sci.net/12/1211/2008/
H. Koivusalo et al.: Ditch cleaning impacts on hydrology 1221
that SWE was underestimated by the model in the sites witha high maximum SWE and overestimated in the sites with alow maximum SWE. The annual maximum SWE decreasedwith LAI, as shown in Fig. 6, but the annual highest SWEwas recorded in small seedling stands instead of nearly opensites, where the model produced the highest annual maxi-mum SWE. The higher accumulation of snow in seedlingstands compared with the open could be a result of lateralwind-driven snow transport, which was not included in thesnow model.
Model performance for the periods preceding and follow-ing ditch cleaning (Table 2) was similar, suggesting that thecompiled meteorological variables did not contain errors thatcould affect snow processes and change systematically overthe study period. After the snow model was found to havea consistent performance for the periods preceding and fol-lowing ditch cleaning, the model analysis was continued withwater table and runoff simulations.
4.2.2 Application of GLUE methodology
In the application of GLUE methodology, the prior distri-bution of the calibration parameters was assumed to be uni-form within their ranges (Table 1). Monte Carlo samplingwas applied to produce 21 000 sets of parameters, and thelikelihood function (Eq. 2) was computed for each parameterset. The parameter set was determined to be “behavioural”whenEgwt, Egws, andEr were greater than 0.4, andEgwpwas greater than 0.1. A less strict threshold efficiency wasused for simulation of the water table level in site 7 (Egwp),because the range of the water table level variation in the sitewith a peat subsoil was small compared with the range in thesites with a till or sandy subsoil. The highest efficiency valuein site 7 was 0.22 and the corresponding mean absolute errorwas 4.0 cm. In contrast to these values, the best efficienciesin sites 26 and 27, where the water level fluctuations weredynamic, were 0.72 and 0.65, respectively, and the mean ab-solute errors were 10.9 and 11.8 cm.
After parameter sampling and model computations, a totalof 738 “behavioural” parameter sets were identified. Priorand posterior distributions of the calibration parameters re-vealed the degree of equifinality of the calibration param-eters (Fig. 7). The prior and posterior distributions of thesurface runoff retention coefficient (Fig. 7a) were approxi-mately the same, which suggests that the parameter had noinfluence on the performance of the model. The posteriordistribution of the saturated hydraulic conductivity of the topsoil layer (Fig. 7b), which was same for all calibration sites(7, 26, and 27), clearly changed from the prior distribution,but 90 % of the values were still within a large range of 24to 54 m/d. The saturated hydraulic conductivity of the sandysubsoil (0.6 . . . 2.26 m/d) showed only a small change be-tween the prior and posterior distributions, which suggeststhat the predefined range of the prior distribution may havebeen too narrow (Fig. 7c). The saturated hydraulic conduc-
0
0.2
0.4
0.6
0.8
1
0 0.5 1
SR retention coeff. [1/d]
Cum
P
Prior
Posterior
a)
0
0.2
0.4
0.6
0.8
1
0 500 1000
Stomatal res. [s/m]
Cum
. P
Prior
Posterior
f)
0
0.2
0.4
0.6
0.8
1
0 50 100
Top soil cond. [m/d]
Cum
. P
Prior
Posterior
b)
0
0.2
0.4
0.6
0.8
1
0 0.2 0.4
Peat cond. [m/d]
Cum
. PPrior
Posterior
e)
0
0.2
0.4
0.6
0.8
1
0 1 2
Till cond. [m/d]
Cum
. P
Prior
Posterior
d)
0
0.2
0.4
0.6
0.8
1
0 1 2
Sand cond. [m/d]
Cum
. P
Prior
Posterior
c)
Figure 7. Cumulative prior and posterior distributions (Cum. P) of the calibration parameters
including the retention coefficient of surface runoff (a), the saturated hydraulic conductivity
of the topsoil layer (b), the conductivity of sandy subsoil (c), the conductivity of till subsoil
(d), the conductivity of peat subsoil (e), and the minimum stomatal resistance (f).
40
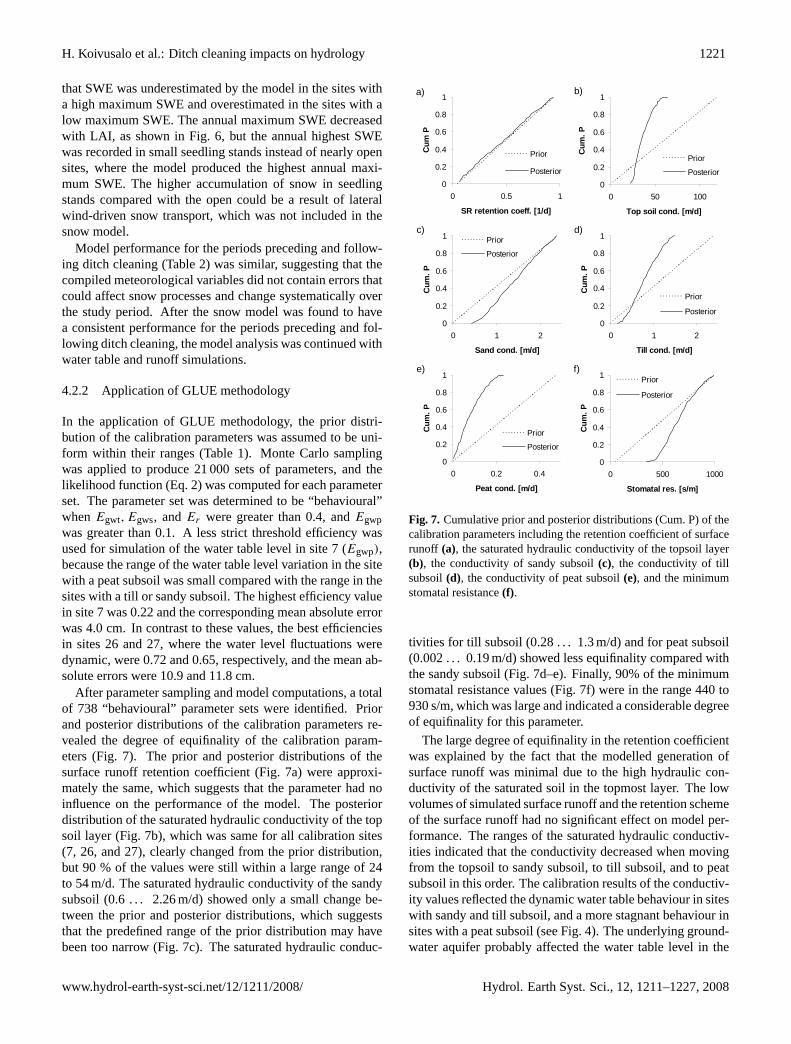
Fig. 7. Cumulative prior and posterior distributions (Cum. P) of thecalibration parameters including the retention coefficient of surfacerunoff (a), the saturated hydraulic conductivity of the topsoil layer(b), the conductivity of sandy subsoil(c), the conductivity of tillsubsoil(d), the conductivity of peat subsoil(e), and the minimumstomatal resistance(f).
tivities for till subsoil (0.28 . . . 1.3 m/d) and for peat subsoil(0.002 . . . 0.19 m/d) showed less equifinality compared withthe sandy subsoil (Fig. 7d–e). Finally, 90% of the minimumstomatal resistance values (Fig. 7f) were in the range 440 to930 s/m, which was large and indicated a considerable degreeof equifinality for this parameter.
The large degree of equifinality in the retention coefficientwas explained by the fact that the modelled generation ofsurface runoff was minimal due to the high hydraulic con-ductivity of the saturated soil in the topmost layer. The lowvolumes of simulated surface runoff and the retention schemeof the surface runoff had no significant effect on model per-formance. The ranges of the saturated hydraulic conductiv-ities indicated that the conductivity decreased when movingfrom the topsoil to sandy subsoil, to till subsoil, and to peatsubsoil in this order. The calibration results of the conductiv-ity values reflected the dynamic water table behaviour in siteswith sandy and till subsoil, and a more stagnant behaviour insites with a peat subsoil (see Fig. 4). The underlying ground-water aquifer probably affected the water table level in the
www.hydrol-earth-syst-sci.net/12/1211/2008/ Hydrol. Earth Syst. Sci., 12, 1211–1227, 2008
1222 H. Koivusalo et al.: Ditch cleaning impacts on hydrology
020406080
100120
1983 1984 1985 1987 1988 1989 1991 1992 1993
Year
Wat
er ta
ble
dept
h [c
m]
Measured median level 5th percentile 95th percentile
a)
Ditch cleaning
020406080
100120W
ater
tabl
e de
pth
[cm
]
Measured median level 5th percentile 95th percentile
b)
Figure 8. Measured and modelled median depth of the water table level (WT) in sites with till
subsoil in catchment C3 (treated) (a), and in catchment C4 (control) (b). Modelled depth is
presented in terms of the 5th and 95th percentiles (90% uncertainty limit).
41
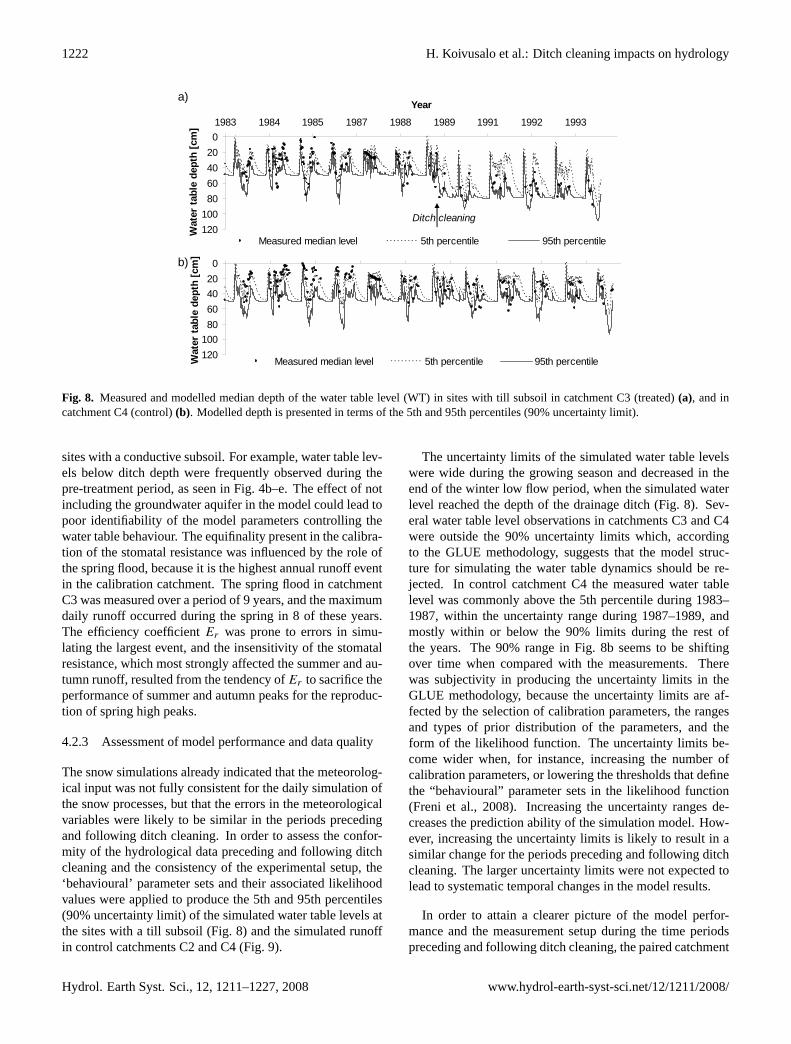
Fig. 8. Measured and modelled median depth of the water table level (WT) in sites with till subsoil in catchment C3 (treated)(a), and incatchment C4 (control)(b). Modelled depth is presented in terms of the 5th and 95th percentiles (90% uncertainty limit).
sites with a conductive subsoil. For example, water table lev-els below ditch depth were frequently observed during thepre-treatment period, as seen in Fig. 4b–e. The effect of notincluding the groundwater aquifer in the model could lead topoor identifiability of the model parameters controlling thewater table behaviour. The equifinality present in the calibra-tion of the stomatal resistance was influenced by the role ofthe spring flood, because it is the highest annual runoff eventin the calibration catchment. The spring flood in catchmentC3 was measured over a period of 9 years, and the maximumdaily runoff occurred during the spring in 8 of these years.The efficiency coefficientEr was prone to errors in simu-lating the largest event, and the insensitivity of the stomatalresistance, which most strongly affected the summer and au-tumn runoff, resulted from the tendency ofEr to sacrifice theperformance of summer and autumn peaks for the reproduc-tion of spring high peaks.
4.2.3 Assessment of model performance and data quality
The snow simulations already indicated that the meteorolog-ical input was not fully consistent for the daily simulation ofthe snow processes, but that the errors in the meteorologicalvariables were likely to be similar in the periods precedingand following ditch cleaning. In order to assess the confor-mity of the hydrological data preceding and following ditchcleaning and the consistency of the experimental setup, the‘behavioural’ parameter sets and their associated likelihoodvalues were applied to produce the 5th and 95th percentiles(90% uncertainty limit) of the simulated water table levels atthe sites with a till subsoil (Fig. 8) and the simulated runoffin control catchments C2 and C4 (Fig. 9).
The uncertainty limits of the simulated water table levelswere wide during the growing season and decreased in theend of the winter low flow period, when the simulated waterlevel reached the depth of the drainage ditch (Fig. 8). Sev-eral water table level observations in catchments C3 and C4were outside the 90% uncertainty limits which, accordingto the GLUE methodology, suggests that the model struc-ture for simulating the water table dynamics should be re-jected. In control catchment C4 the measured water tablelevel was commonly above the 5th percentile during 1983–1987, within the uncertainty range during 1987–1989, andmostly within or below the 90% limits during the rest ofthe years. The 90% range in Fig. 8b seems to be shiftingover time when compared with the measurements. Therewas subjectivity in producing the uncertainty limits in theGLUE methodology, because the uncertainty limits are af-fected by the selection of calibration parameters, the rangesand types of prior distribution of the parameters, and theform of the likelihood function. The uncertainty limits be-come wider when, for instance, increasing the number ofcalibration parameters, or lowering the thresholds that definethe “behavioural” parameter sets in the likelihood function(Freni et al., 2008). Increasing the uncertainty ranges de-creases the prediction ability of the simulation model. How-ever, increasing the uncertainty limits is likely to result in asimilar change for the periods preceding and following ditchcleaning. The larger uncertainty limits were not expected tolead to systematic temporal changes in the model results.
In order to attain a clearer picture of the model perfor-mance and the measurement setup during the time periodspreceding and following ditch cleaning, the paired catchment
Hydrol. Earth Syst. Sci., 12, 1211–1227, 2008 www.hydrol-earth-syst-sci.net/12/1211/2008/
H. Koivusalo et al.: Ditch cleaning impacts on hydrology 1223
0
100
200
300
400
500
Run
off [
mm
/yr]
C1 - treated
95th percentile in C2 - control
5the percentile in C1 - control
a)
0
100
200
300
400
500
C2 - control
95th percentile in C2 - control
5th percentile in C2 - control
b)
0
100
200
300
400
500
83 84 85 86 87 88 89 90 91 92 93
Year
Run
off [
mm
/yr]
C3 - treated95th percentile in C4 - control5th percentile in C4 - control
c)
0
100
200
300
400
500
83 84 85 86 87 88 89 90 91 92 93
Year
C4 - control
95th percentile in C4 - control
5th percentile in C4 - control
d)
Figure 9. Measured annual runoff in catchment C1 (treated) and modelled runoff in C2
(control) (a), measured and modelled runoff in C2 (b), measured runoff in catchment C3
(treated) and modelled runoff in C4 (control) (c), and measured and modelled runoff in C4
(d). Modelled runoff is presented in terms of the 5th and 95th percentiles (90% uncertainty
limit). Ditch cleaning occurred in 1989.
42
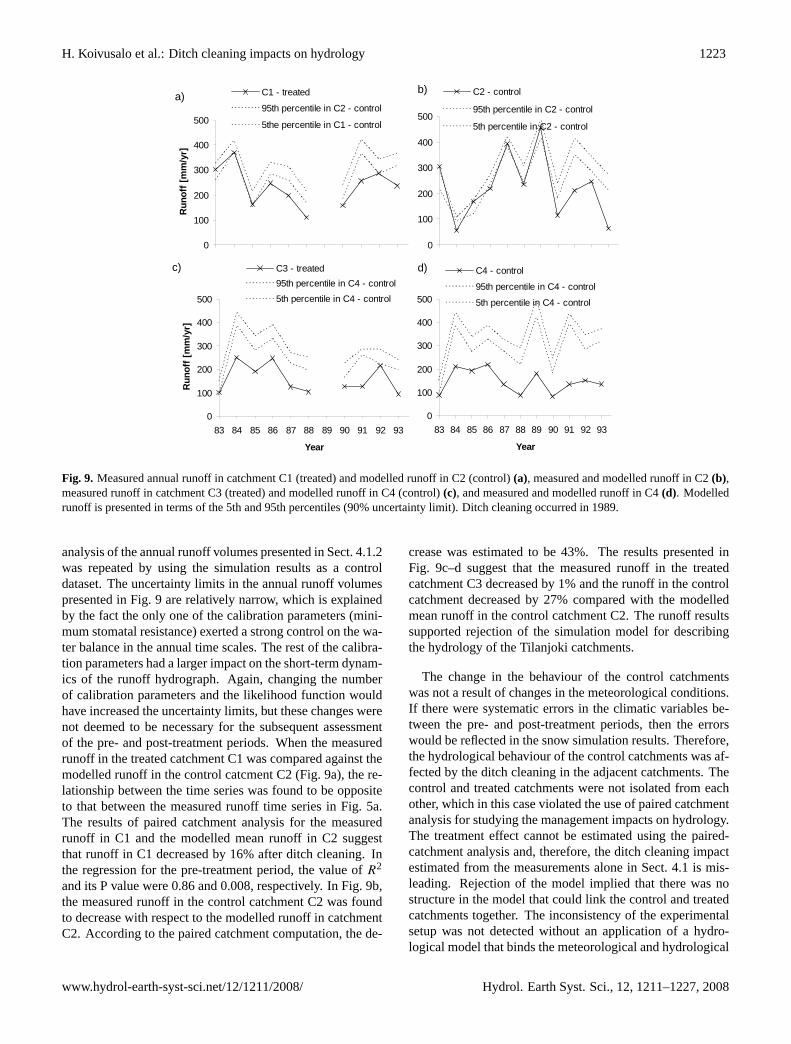
Fig. 9. Measured annual runoff in catchment C1 (treated) and modelled runoff in C2 (control)(a), measured and modelled runoff in C2(b),measured runoff in catchment C3 (treated) and modelled runoff in C4 (control)(c), and measured and modelled runoff in C4(d). Modelledrunoff is presented in terms of the 5th and 95th percentiles (90% uncertainty limit). Ditch cleaning occurred in 1989.
analysis of the annual runoff volumes presented in Sect. 4.1.2was repeated by using the simulation results as a controldataset. The uncertainty limits in the annual runoff volumespresented in Fig. 9 are relatively narrow, which is explainedby the fact the only one of the calibration parameters (mini-mum stomatal resistance) exerted a strong control on the wa-ter balance in the annual time scales. The rest of the calibra-tion parameters had a larger impact on the short-term dynam-ics of the runoff hydrograph. Again, changing the numberof calibration parameters and the likelihood function wouldhave increased the uncertainty limits, but these changes werenot deemed to be necessary for the subsequent assessmentof the pre- and post-treatment periods. When the measuredrunoff in the treated catchment C1 was compared against themodelled runoff in the control catcment C2 (Fig. 9a), the re-lationship between the time series was found to be oppositeto that between the measured runoff time series in Fig. 5a.The results of paired catchment analysis for the measuredrunoff in C1 and the modelled mean runoff in C2 suggestthat runoff in C1 decreased by 16% after ditch cleaning. Inthe regression for the pre-treatment period, the value ofR2
and its P value were 0.86 and 0.008, respectively. In Fig. 9b,the measured runoff in the control catchment C2 was foundto decrease with respect to the modelled runoff in catchmentC2. According to the paired catchment computation, the de-
crease was estimated to be 43%. The results presented inFig. 9c–d suggest that the measured runoff in the treatedcatchment C3 decreased by 1% and the runoff in the controlcatchment decreased by 27% compared with the modelledmean runoff in the control catchment C2. The runoff resultssupported rejection of the simulation model for describingthe hydrology of the Tilanjoki catchments.
The change in the behaviour of the control catchmentswas not a result of changes in the meteorological conditions.If there were systematic errors in the climatic variables be-tween the pre- and post-treatment periods, then the errorswould be reflected in the snow simulation results. Therefore,the hydrological behaviour of the control catchments was af-fected by the ditch cleaning in the adjacent catchments. Thecontrol and treated catchments were not isolated from eachother, which in this case violated the use of paired catchmentanalysis for studying the management impacts on hydrology.The treatment effect cannot be estimated using the paired-catchment analysis and, therefore, the ditch cleaning impactestimated from the measurements alone in Sect. 4.1 is mis-leading. Rejection of the model implied that there was nostructure in the model that could link the control and treatedcatchments together. The inconsistency of the experimentalsetup was not detected without an application of a hydro-logical model that binds the meteorological and hydrological
www.hydrol-earth-syst-sci.net/12/1211/2008/ Hydrol. Earth Syst. Sci., 12, 1211–1227, 2008
1224 H. Koivusalo et al.: Ditch cleaning impacts on hydrology
250
300
350
400
450
500
Run
off [
mm
/yr]
Cond. depth = 0.1 mCond. depth = 0.2 mCond. depth = 0.3 mCond. depth = 0.4 m
a)
250
300
350
400
450
500 Cond. depth = 0.1 mCond. depth = 0.2 mCond. depth = 0.3 mCond. depth = 0.4 m
b)
250
300
350
400
450
500
0.2 0.4 0.6 0.8 1 1.2
Ditch depth [m]
Run
off [
mm
/yr]
Cond. depth = 0.1 mCond. depth = 0.2 mCond. depth = 0.3 mCond. depth = 0.4 m
c)
250
300
350
400
450
500
0.2 0.4 0.6 0.8 1 1.2
Ditch depth [m]
Cond. depth = 0.1 mCond. depth = 0.2 mCond. depth = 0.3 mCond. depth = 0.4 m
d)
Figure 10. Effect of ditch depth on the mean annual runoff in hypothetical sites where the
subsoil type is peat and LAI is 0.5 (a), the subsoil type is peat and LAI is 2.0 (b), the subsoil
type is till and LAI is 0.5 (c), and the subsoil type is till and LAI is 2.0 (d).
43
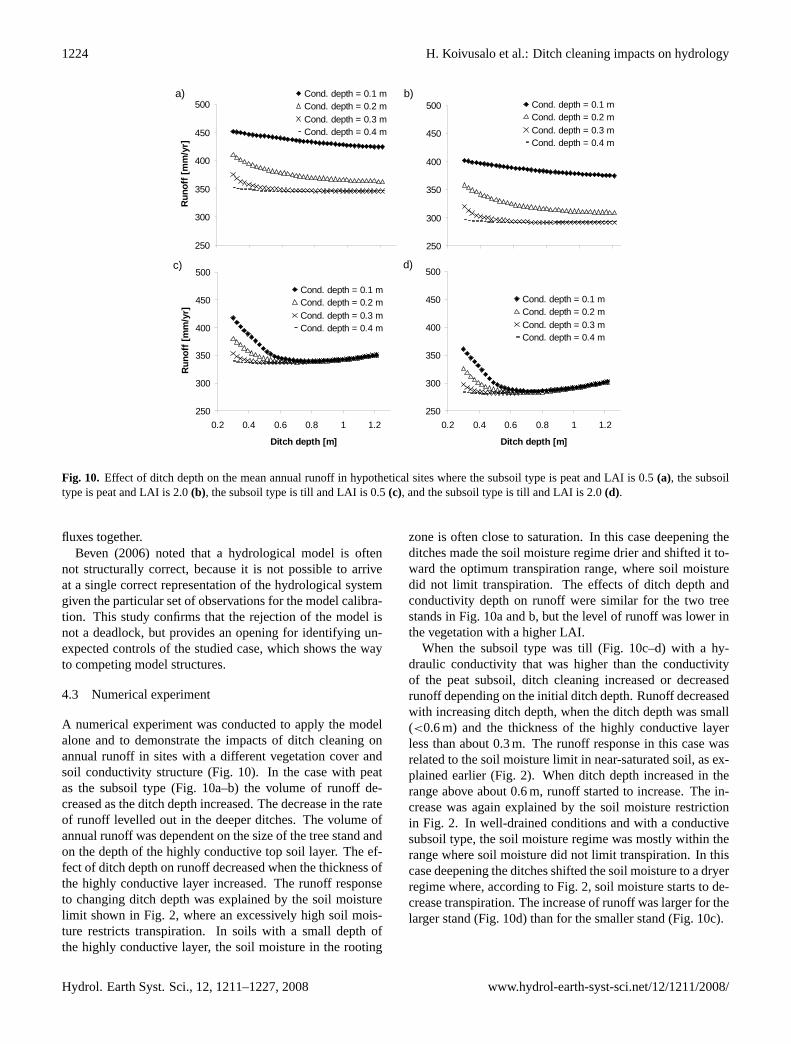
Fig. 10. Effect of ditch depth on the mean annual runoff in hypothetical sites where the subsoil type is peat and LAI is 0.5(a), the subsoiltype is peat and LAI is 2.0(b), the subsoil type is till and LAI is 0.5(c), and the subsoil type is till and LAI is 2.0(d).
fluxes together.Beven (2006) noted that a hydrological model is often
not structurally correct, because it is not possible to arriveat a single correct representation of the hydrological systemgiven the particular set of observations for the model calibra-tion. This study confirms that the rejection of the model isnot a deadlock, but provides an opening for identifying un-expected controls of the studied case, which shows the wayto competing model structures.
4.3 Numerical experiment
A numerical experiment was conducted to apply the modelalone and to demonstrate the impacts of ditch cleaning onannual runoff in sites with a different vegetation cover andsoil conductivity structure (Fig. 10). In the case with peatas the subsoil type (Fig. 10a–b) the volume of runoff de-creased as the ditch depth increased. The decrease in the rateof runoff levelled out in the deeper ditches. The volume ofannual runoff was dependent on the size of the tree stand andon the depth of the highly conductive top soil layer. The ef-fect of ditch depth on runoff decreased when the thickness ofthe highly conductive layer increased. The runoff responseto changing ditch depth was explained by the soil moisturelimit shown in Fig. 2, where an excessively high soil mois-ture restricts transpiration. In soils with a small depth ofthe highly conductive layer, the soil moisture in the rooting
zone is often close to saturation. In this case deepening theditches made the soil moisture regime drier and shifted it to-ward the optimum transpiration range, where soil moisturedid not limit transpiration. The effects of ditch depth andconductivity depth on runoff were similar for the two treestands in Fig. 10a and b, but the level of runoff was lower inthe vegetation with a higher LAI.
When the subsoil type was till (Fig. 10c–d) with a hy-draulic conductivity that was higher than the conductivityof the peat subsoil, ditch cleaning increased or decreasedrunoff depending on the initial ditch depth. Runoff decreasedwith increasing ditch depth, when the ditch depth was small(<0.6 m) and the thickness of the highly conductive layerless than about 0.3 m. The runoff response in this case wasrelated to the soil moisture limit in near-saturated soil, as ex-plained earlier (Fig. 2). When ditch depth increased in therange above about 0.6 m, runoff started to increase. The in-crease was again explained by the soil moisture restrictionin Fig. 2. In well-drained conditions and with a conductivesubsoil type, the soil moisture regime was mostly within therange where soil moisture did not limit transpiration. In thiscase deepening the ditches shifted the soil moisture to a dryerregime where, according to Fig. 2, soil moisture starts to de-crease transpiration. The increase of runoff was larger for thelarger stand (Fig. 10d) than for the smaller stand (Fig. 10c).
Hydrol. Earth Syst. Sci., 12, 1211–1227, 2008 www.hydrol-earth-syst-sci.net/12/1211/2008/
H. Koivusalo et al.: Ditch cleaning impacts on hydrology 1225
The model suggests that, in most cases, the annual runoffvolume decreases and evapotranspiration increases whenditches are cleaned down to a greater depth. If the increase inevapotranspiration is assumed to be related to forest growth,then excessive deepening of the ditches, or cleaning of theditches in sites with deep a surface layer of highly conduc-tive soil, would not be necessary.
Finally, it should be noted that the results of the numericalexperiment only demonstrate how the hydrological impactof ditch cleaning varies and depends on certain vegetationand soil characteristics, but the modelling results are not ageneralization of ditch cleaning impact. Earlier studies haveshown that field, catchment, and meteorological characteris-tics have complex and counteracting effects on the hydrolog-ical impact of drainage (Lundin, 1994; Dunn and Mackay,1996; Robinson and Rycroft, 1999). Since long term pro-cesses, such as vegetation colonization in ditches and subsi-dence of the peat (Robinson, 1986; Holden et al., 2006) weredisregarded in the model, their effects on runoff could not beassessed on the basis of the numerical experiment.
5 Conclusions
Available experimental data on the water table level showedthat the effect of ditch cleaning was not seen in sites witha deep peat formation. The effect of ditch cleaning be-came clear in sites with a shallow peat layer underlain bytill or sand. The results of a paired catchment analysissuggested that annual runoff volume from the two treatedcatchments, where ditch cleaning was performed, stronglyincreased compared with the control catchments, where nocleaning was implemented. The increase estimated from thedata was in conflict with the results of earlier studies, and itwas concluded that a further assessment of the data qualityand experimental setup was required.
The application of a simulation model that binds togethermeteorological and hydrological measurements was a use-ful aid in understanding the difficulties related to the exper-iments. The GLUE methodology allowed an assessment ofthe uncertainty propagation from parameter estimation to themodel simulations, and provided a means to identify defi-ciencies in the model structure. The measured water tablelevel was frequently outside the 90% uncertainty limit of thesimulated water table level, which suggested that the modelcould not predict the water table dynamics. The compari-son between the modelled and measured runoff confirmedthe result that the model was not able to predict the measuredhydrological response to ditch cleaning.
Assessment of the model behaviour and experimental dataduring the pre- and post-treatment periods revealed a shift inthe measured annual runoff in the control catchments com-pared to the modelled runoff from the control catchments.Since the change in runoff from the control catchments wasnot explained by the meteorological conditions, it was con-
cluded that ditch cleaning must have had an impact on runoffin both the treated and control catchments. When pairedcatchments are artificially delineated side-by-side using rel-atively shallow ditches, there is the possibility that the catch-ments may not in fact be fully isolated from each other.Derivation of the water balance in a separated sub-area ofa peatland is a more demanding task than in pristine head-water catchments. In Tilanjoki, the hydrological connectionbetween the treated and control catchments was clearly re-flected in the runoff measurements and less clearly in the wa-ter table measurements. In the design of hydrological experi-ments in drained peatlands the possibility of dependence be-tween artificial catchments should be considered. The studycatchments should preferably be natural catchments delin-eated by topography. When artificial catchments are used,the side-by-side location of differently managed (e.g., controland treated) catchments should be avoided. Runoff data froma natural catchment that includes the artificial study catch-ments (measurements in nested catchments) would be usefulfor the data analysis.
A numerical experiment based on model simulationsdemonstrated how the function between soil moisture andtranspiration efficiency controls the impact of ditch cleaningon the total annual runoff. According to the model, runoffdecreases and evapotranspiration increases, when ditches aredug deeper in poorly drained sites, where the initial ditchdepth is small and the depth of highly conductive top soillayer is low. From the point of view of evapotranspira-tion efficiency, ditch cleaning is not necessary in sites wherethe highly conductive surface soil layer extends to a depthof about 0.3 m and the initial ditch depth is about 0.5 m ordeeper. Information about the necessity of ditch networkmaintenance is valuable for outlining practical guidelines forforest management on drained peatlands.
Acknowledgements.The study was financed by the Ministryof Agriculture and Forestry in Finland (KUNTO and HAMEprojects). Additional funding from the Land and Water TechnlogyFoundation and the Academy of Finland is acknowledged. We aregrateful to P. Vakkilainen, H. mannerkoski, J. Laine, H. Hokka,J. Issakainen, I. Suopanki, T. Haikarainen, S. Putkinen, T. Mattson,and J. Heinonen for assistance and help in this work. The modelapplication was supported by data from the Geological Surveyof Finland, the Finnish Meteorological Institute, and the FinnishEnvironment Institute.
Edited by: J. Seibert
References
Ahti, E.: Water balance of drained peatlands on the basis of watertable simulation during the snowless period, Comm. Inst. For.Fenn., ISSN 0358-09609, 141 pp., 1987.
Ahti, E. and Hokka, H.: Effetcs of the growth and volume of Scotspine stands on the level of the water table on peat in Central
www.hydrol-earth-syst-sci.net/12/1211/2008/ Hydrol. Earth Syst. Sci., 12, 1211–1227, 2008
1226 H. Koivusalo et al.: Ditch cleaning impacts on hydrology
Finland, in: Hydrology and Management of Forested Wetlands,edited by: Amatya, D. M. and Nettles, J., Proceedings of the In-ternational Conference, 8–12 April 2006, New Bern, North Car-olina, ASABE, Michigan, USA, 309–315, 2006.
Ahti, E. and Paivanen, J.: Response of stand growth and water tablelevel to maintenance of ditch networks within forest drainage ar-eas, in: Northern Forested Wetlands: Ecology and Management,edited by: Trettin, C. C., Jurgensen, M. F., Grigal, D. F., Gale,M. R., and Jeglum, J. K., CRC Press Inc., Lewis Publishers, 449–457, 1997.
Amatya, D. M., Skaggs, R. W., Gregory, J. D., and Herrmann, R.B.: Hydrology of a drained forested pocosin watershed, J. Am.Water Resourc. As., 33, 535–546, 1997.
Beven, K.: A manifesto for the equifinality thesis, J. Hydrol., 320,18–36, 2006.
Beven, K. and Binley, A.: The future of distributed models: Modelcalibration and uncertainty prediction, Hydrol. Process., 6, 279–298, 1992.
Beven, K. and Freer, J.: Equifinality, data assimilation, and uncer-tainty estimation in mechanistic modelling of complex environ-mental systems, J. Hydrol., 249, 11–29, 2001.
Cosby, B. J., Norton, S. A., and Kahl, J. S.: Using paired-catchmentmanipulation experiment to evaluate a catchment-scale biogeo-chemical model, Sci. Total Environ., 183, 49–66, 1996.
Dunn, S. M. and Mackay, R.: Modelling the hydrological impactsof open ditch drainage, J. Hydrol., 179, 37–66, 1996.
El-Sadek, A., Feyen, J., and Berlamont, J.: Comparison of modelsfor computing drainage discharge, J. Irrig. Drain. E.-ASCE, 127,363–369, 2001.
Freni, G., Mannina, G., and Viviani, G.: Uncertainty in urbanstormwater quality modelling: The effect of acceptability thresh-old in the GLUE methodology, Water Res., 42, 2061–2072,2008.
Hakkila, P.: Wood density survey and dry weight tables for pine,spruce and birch stems in Finland, Comm. Ins. For. Fenn., 96,1–59, 1979.
Hokka, H.: Models for predicting growth and yield in drained peat-land stands in Finland, The Finnish Foresest Research Institute,Res. Papers, 651, 45 pp., 1997.
Hokka, H., Alenius, V., and Salminen, H.: Predicting the need forditch network maintenance in drained peatland sites in Finland,Mires and Peat, 51, 1–10, 2000.
Holden, J., Chapman, P. J., and Labadz, J. C.: Artificial drainage ofpeatlands: hydrological and hydrochemical process and wetlandrestoration, Prog. Phys. Geog., 28, 95–123, 2004.
Holden, J., Evans, M. G., Burt, T. P., and Horton, M.: Impactof land drainage on peatland hydrology, J. Environ. Qual., 35,1764–1778, 2006.
Jarvis, N. J.: The MACRO model (Version 3.1). Technical descrip-tion and sample simulations, Reports and Dissertation 19, De-partment of Soil Science, Swedish University of AgriculturalSciences, Uppsala, Sweden, 51 pp., 1994.
Jauhiainen, M.: Relationships of particle size distribution curve,soil water retention curve and unsaturated hydraulic conductivityand their implications on water balance of forested and agricul-tural hillslopes, Helsinki University of Technology, Water Re-sourc. Publ., TKK-VTR-12, Espoo, 165 pp., 2004.
Joensuu, S.: Effects of Ditch Network Maintenance and Sedimen-tation Ponds on Export Loads of Suspended Solids and Nutrients
from Peatland Forests, Finnish Forest Research Institute, Res.Papers, 868, Vantaa, 2002.
Joensuu, S., Ahti, E., and Vuollekoski, M.: The effects of peatlandforest ditch maintenance on suspended solids in runoff, BorealEnv. Res., 4, 343–355, 1999.
Joensuu, S., Ahti, E., and Vuollekoski, M.: Long-term effects ofmaintaining ditch networks on runoff water quality, Mires andPeat, 52, 17–29, 2001.
Joensuu, S. Ahti, E., and Vuollekoski, M.: Effects of ditch net-work maintenance on the chemistry of runoff water from peat-land forests, Scand. J. Forest Res., 17, 238–247, 2002.
Johnson, R.: The forest cycle and low river flows: a review of UKand international studies, Forest Ecol. Manag., 109, 1–7, 1998.
Kaitera, P.: Raivauksen ja ojituksen vaikutuksesta vesistoalueidenhydrologiaan (In Finnish), Mires and Peat, 6, 1–10, 1955.
Karvonen, T., Koivusalo, H., Jauhiainen, M., Palko, J., and Wep-pling, K.: A hydrological model for predicting runoff from dif-ferent land use areas, J. Hydrol., 217, 253–265, 1999.
Kenttamies, K.: Metsatalouden fosfori- ja typpikuormituksenmaaritys, in: Metsatalouden vesistokuormitus MESUVE- pro-jektin loppuraportti (In Finnish), edited by: Kenttamies, K. andMattsson, T., Finnsih Environment Institute (SYKE), 816, 9–28,2006.
Koivusalo, H. and Kokkonen, T.: Snow processes in a forest clear-ing and in a coniferous forest, J. Hydrol., 262, 145–164, 2002.
Koivusalo, H., Heikinheimo, M., and Karvonen, T.: Test of a simpletwo-layer parameterisation to simulate the energy balance andtemperature of a snowpack, Theor. Appl. Climatol., 70, 65–79,2001.
Koivusalo, H., Kokkonen, T., Lauren, A., Ahtiainen, M., Karvo-nen, T., Mannerkoski, H., Penttinen, S., Seuna, P., Starr, M., andFiner, L.: Parametrisation and application of a hillslope hydro-logical model to assess impacts of forest clear-cutting on runoffgeneration, Environ. Modell. Softw., 21, 1324–1339, 2006.
Kokkonen, T., Koivusalo, H., Lauren, A., Penttinen, S., Starr, M.,Kellomaki, S., and Finer, L.: Implications of processing spa-tial data from a forested catchment for a hillslope hydrologicalmodel, Ecol. Model., 199, 393–408, 2006.
Lauren, A., Finer, L., Koivusalo, H., Kokkonen, T., Karvonen, T.,Kellomaki, S, Mannerkoski, H., and Ahtiainen, M.: Water andnitrogen processes along a typical water flowpath and streamwa-ter exports from a forested catchment and changes after clear-cutting: a modelling study, Hydrol. Earth Syst. Sc., 9, 1324–1339, 2005.
Lundin, L.: Impacts of forest drainage on flow regime. Studia Fore-stalia Suecica, 192, 22 pp., 1994.
Mustonen, S. and Seuna, P.: Metsaojituksen vaikutuksesta suon hy-drologiaan (In Finnish), Publ. Water Res. Inst., 2, 63 pp., 1971.
Nash, J.E. and Sutcliffe, J.V.: River flow forecasting through con-ceptual models, part I – a discussion of principles, J. Hydrol., 10,282–290, 1970.
Nieminen, M.: Export of dissolved organic carbon, nitrogenand phosphorus following clear-cutting of three Norway spruceforests growing on drained peatlands. Silva Fenn., 38, 123–132,2004.
Nijssen, B., Haddeland, I., and Lettenmaier, D. P.: Point evaluationof a surface hydrology model for BOREAS, J. Geophys. Res.,102(D24), 29 367–29 378, 1997.
Oosterbaan, R. J., Boonstra, J., and Rao, K. V. G. K.: The energy
Hydrol. Earth Syst. Sci., 12, 1211–1227, 2008 www.hydrol-earth-syst-sci.net/12/1211/2008/
H. Koivusalo et al.: Ditch cleaning impacts on hydrology 1227
balance of groundwater flow, in: Subsurface-Water Hydrology,edited by: Singh, V. P. and Kumar, B., Kluwer Academic pub-lishers, The Netherlands, 153–160, 1996.
Oztekin, T., Brown, L. C., and Fausey, N. R.: Modification andevaluation of the WEPP hillslope model for subsurface drainedcropland, An ASAE/CSAE Meeting Paper Number: 042274, St.Joseph, Mich. USA, 21 pp., 2004.
Paivanen, J.: Hydraulic conductivity and water retention in peatsoils, Acta For. Fenn., 129, 70 pp., 1973.
Paivanen, J. and Sarkkola, S.: The effect of thinning and ditch net-work maintenance on the water table level in a Scots pine standon peat soil, Mires and Peat, 51, 131–138, 2000.
Pomeroy, J. W., Gray, D. M., Hedstrom, N. R., and Janowicz, J. R.:Physically based estimation of seasonal snow accumulation inthe boreal forest, in: Proc. Eastern Snow Conf., Stowe, Vermont,USA, 93–108, 2002.
Prevost, M., Plamondon, A. P., and Belleau, P.: Effects of drainageof a forested peatland on water quality and quantity, J. Hydrol.,214, 130—143, 1999.
Raupach, M. R.: Simplified expressions for vegetation roughnesslength and zero-plane displacement as functions of canopy heightand area index, Bound. Lay. Meteorol., 71, 211–216, 1994.
Richards, L. A.: Capillary conduction of liquids through porousmediums, Physics, 1, 318–333, 1931.
Robinson, M.: Changes in catchment runoff following drainage andafforestation, J. Hydrol., 86, 71—84, 1986.
Schaudt, K. J. and Dickinson, R. E.: An approach to deriving rough-ness length and zero-plane displacement height from satellitedata, prototyped with BOREAS data, Agr. Forest Meteorol., 104,143—155, 2000.
Schwarzel, K.,Simnek, J., van Genuchten, M. T., and Wessolek, G.:Measurement and modeling of soil-water dynamics and evapo-transpiration of drained peatland soils, J. Plant Nutr. Soil Sci.,169, 762—774, 2006.
Seppala, K.: Post-drainage growth rate of Norway spruce and Scotspine on peat. Acta For. Fenn., 93, 88 pp., 1969 (in Finnish withEnglish summary).
Seuna, P.: Long-term influence of forestry drainage on the hydrol-ogy of an open bog in Finland. In: The Influence of Man on theHydrological Regime with special Reference to Representativeand Experimental Basins. Proceedings of the Helsinki Sympo-sium 23–26 June 1980, IAHS-AISH Publication, 130, 141–149,1980.
Silins, U. and Rothwell, R. L.: Forest peatland drainage and sub-sidence affect soil water retention and transport properties in anAlberta Peatland, Soil Sci. Soc. Am J., 62, 1048–1056, 1998.
Skaggs, R. W.: A water management model for artificially drainedsoils, North Carolina Agricultural Research Service, Raleigh,NC, 54 pp., 1980.
Skaggs, R. W., Amatya, D. M., Chescheir, G. M., Blanton, C. D.,and Gilliam, J. W.: Effect of Drainage and Management Prac-tices on Hydrology of Pine Plantation. Hydrology and Manage-ment of Forested Wetlands, Proc. Int. Conf., New Bern, NorthCarolina, 3–14, 2006.
Starr, M. and Paivanen, J.: The influence of peatland forest drainageon runoff peak flows, Mires and Peat, 32, 79–84, 1981.
Tarboton, D. G. and Luce, C. H.: Utah Energy Balance Snow Accu-mulation and Melt Model (UEB), Computer model technical de-scription and users guide, Utah Water Research Laboratory andUSDA Forest Service Intermountain Research Station, 1996.
Tomppo, E.: Suomen suometsat 1951–2003, in: Suosta metsaksi,Suometsien ekologisesti ja taloudellisesti kestava kaytto (InFinnish), edited by: Ahti, E., Kaunisto, S., Moilanen, M., Murto-vaara, I., Final Report, Res. Rep. Finnish Forest Res. Inst., Van-taa, 26–38, 2005.
van Genuchten, M. T.: A closed-form equation for predicting thehydraulic conductivity of unsaturated soils, Soil Sci. Soc. Am.J., 44, 892–898, 1980.
Watson, F., Vertessy, R., McMahon, T., Rhodes, B., and Watson, I.:Improved methods to assess water yield changes from paired-catchment studies: application to the Maroondah catchments.Forest Ecol. Manag., 143, 189–204, 2001.
Whitaker, A., Alila, Y., Beckers, J., and Toews, D.: Applicationof the distributed hydrology soil vegetation model to RedfishCreek, British Columbia: model evaluation using internal catch-ment data, Hydrol. Process., 17, 199–224, 2003.
Wigmosta, M. S., Vail, L. W., and Lettenmaier, D. P.: A distributedhydrology-vegetation model for complex terrain, Water Resour.Res., 30, 1665–1679, 1994.
www.hydrol-earth-syst-sci.net/12/1211/2008/ Hydrol. Earth Syst. Sci., 12, 1211–1227, 2008
Copyright © 2022 FDOKUMEN