Calibration of turbidity meter and acoustic doppler velocimetry (Triton-ADV) for sediment types...
17
CALIBRATION OF TURBIDITY METER AND ACOUSTIC DOPPLER VELOCIMETRY (TRITON-ADV) FOR SEDIMENT TYPES PRESENT IN DRAINED PEATLAND HEADWATERS: FOCUS ON PARTICULATE ORGANIC PEAT HANNU MARTTILA, * HEINI POSTILA and BJØRN KLØVE Water Resources and Environmental Engineering Laboratory, Department of Process and Environmental Engineering, University of Oulu, Oulu 90014, Finland ABSTRACT Suspended sediments have a clear impact on fluvial water quality and aquatic habitats. As the concentrations are highly variable, continuous measurement offers a good way to provide accurate and precise values of sediment concentration and yield. However, there is a lack of information regarding the effect of organic peat particles, which typically appear in boreal fluvial systems. In the present study, the effect of different types of suspended sediments on calibration of a turbidity meter and an acoustic Doppler velocimetry (Triton-ADV) was studied in laboratory conditions. The measurements were performed using particulate organic peat, clay and silt with several concentrations ranging from clear water to 3500 mg L 1 . The present study primarily provides organic peat sediment calibration data for used sensors. Regression equations were developed for the different sediment. The results indicate that particle size, shape, concentration and sediment type have an effect on calibration. When the turbidity and the ADV calibration were performed for different particle size groups, sediment types and concentrations, the calibration and suspended solids calculation error was reduced. For the turbidity sensor used, the reliable upper continuous measurement limit for clay, peat and silt sediments was found to be at 1000, 2500 and 3500 mg L 1 , respectively. The ADV-sensor was noticed to be reliable only with fine particles. The results enable easy and first step calibration and error assessment for automatic turbidity and acoustic monitoring of the suspended sediment quality typically present in headwater fluvial systems. This study can be used to evaluate the effect of different sediments on turbidity and ADV-measuring error and reliability during changing particles size distributions, characteristics and concentrations. The laboratory-based approach used in this study indicates that the shape of organic peat particles has an influence on sensor calibration, especially when suspended sediment concentrations are high. Copyright # 2009 John Wiley & Sons, Ltd. key words: turbidity; acoustic doppler velocimetry; calibration; measuring error; suspended solids; particulate organic peat; clay; silt Received 26 March 2009; Revised 29 June 2009; Accepted 2 July 2009 INTRODUCTION Context Suspended sediment (SS) contributes to a large fraction of the total sediment load in headwater systems, plays an important role in the transport of organic pollutants. In Finland, particularly in drainage-dominated peatland catchments, organic suspended sediment is a major pollutant. It has been found that increased organic sediment transport reduces primary production, forms blankets on the stream bottom and destroys fish spawning areas and habitats (e.g. Vuori et al., 1995; Laine and Heikkinen, 2000). Therefore, the estimation of suspended sediment concentration (SSC) load is essential for assessing the quality of aquatic environments and the response of new management practices on it. According to the European Union’s Water Framework Directives (WFD), every surface water body should have ‘good status’ by 2015. To achieve this goal, more water quality monitoring is required to specify problem areas, especially in the headwater areas. The WFD does not particularly deal with RIVER RESEARCH AND APPLICATIONS River Res. Applic. 26: 1019–1035 (2010) Published online 10 August 2009 in Wiley Online Library (wileyonlinelibrary.com) DOI: 10.1002/rra.1304 *Correspondence to: Hannu Marttila, Water Resources and Environmental Engineering Laboratory, Department of Process and Environmental Engineering, University of Oulu, Oulu 90014, Finland. E-mail: hannu.marttila@oulu.fi Copyright # 2009 John Wiley & Sons, Ltd.
Transcript of Calibration of turbidity meter and acoustic doppler velocimetry (Triton-ADV) for sediment types...

RIVER RESEARCH AND APPLICATIONS
River Res. Applic. 26: 1019–1035 (2010)
Published online 10 August 2009 in Wiley Online Library
CALIBRATION OF TURBIDITY METER AND ACOUSTIC DOPPLERVELOCIMETRY (TRITON-ADV) FOR SEDIMENT TYPES PRESENT IN
DRAINED PEATLAND HEADWATERS: FOCUS ONPARTICULATE ORGANIC PEAT
HANNU MARTTILA,* HEINI POSTILA and BJØRN KLØVE
Water Resources and Environmental Engineering Laboratory, Department of Process and Environmental Engineering, University of Oulu,
Oulu 90014, Finland
(wileyonlinelibrary.com) DOI: 10.1002/rra.1304
ABSTRACT
Suspended sediments have a clear impact on fluvial water quality and aquatic habitats. As the concentrations are highly variable,continuous measurement offers a good way to provide accurate and precise values of sediment concentration and yield.However, there is a lack of information regarding the effect of organic peat particles, which typically appear in boreal fluvialsystems. In the present study, the effect of different types of suspended sediments on calibration of a turbidity meter and anacoustic Doppler velocimetry (Triton-ADV) was studied in laboratory conditions. The measurements were performed usingparticulate organic peat, clay and silt with several concentrations ranging from clear water to 3500 mg L�1. The present studyprimarily provides organic peat sediment calibration data for used sensors. Regression equations were developed for thedifferent sediment. The results indicate that particle size, shape, concentration and sediment type have an effect on calibration.When the turbidity and the ADV calibration were performed for different particle size groups, sediment types andconcentrations, the calibration and suspended solids calculation error was reduced. For the turbidity sensor used, the reliableupper continuous measurement limit for clay, peat and silt sediments was found to be at 1000, 2500 and 3500 mg L�1,respectively. The ADV-sensor was noticed to be reliable only with fine particles. The results enable easy and first step calibrationand error assessment for automatic turbidity and acoustic monitoring of the suspended sediment quality typically present inheadwater fluvial systems. This study can be used to evaluate the effect of different sediments on turbidity and ADV-measuringerror and reliability during changing particles size distributions, characteristics and concentrations. The laboratory-basedapproach used in this study indicates that the shape of organic peat particles has an influence on sensor calibration, especiallywhen suspended sediment concentrations are high. Copyright # 2009 John Wiley & Sons, Ltd.
key words: turbidity; acoustic doppler velocimetry; calibration; measuring error; suspended solids; particulate organic peat; clay; silt
Received 26 March 2009; Revised 29 June 2009; Accepted 2 July 2009
INTRODUCTION
Context
Suspended sediment (SS) contributes to a large fraction of the total sediment load in headwater systems, plays an
important role in the transport of organic pollutants. In Finland, particularly in drainage-dominated peatland
catchments, organic suspended sediment is a major pollutant. It has been found that increased organic sediment
transport reduces primary production, forms blankets on the stream bottom and destroys fish spawning areas and
habitats (e.g. Vuori et al., 1995; Laine and Heikkinen, 2000). Therefore, the estimation of suspended sediment
concentration (SSC) load is essential for assessing the quality of aquatic environments and the response of new
management practices on it. According to the European Union’s Water Framework Directives (WFD), every
surface water body should have ‘good status’ by 2015. To achieve this goal, more water quality monitoring is
required to specify problem areas, especially in the headwater areas. The WFD does not particularly deal with
*Correspondence to: Hannu Marttila, Water Resources and Environmental Engineering Laboratory, Department of Process and EnvironmentalEngineering, University of Oulu, Oulu 90014, Finland. E-mail: [email protected]
Copyright # 2009 John Wiley & Sons, Ltd.

1020 H. MARTTILA ET AL.
sediment although it is clear that there is a link between sediment quality and achieving of this WFD objective
(Brils, 2008).
The starting point for quality SSC monitoring is the choice of a suitable measuring technique. Traditionally, SSC
and load have been calculated with individual water samples and water discharge measurements (e.g. Walling and
Webb, 1981). This is time-consuming, and the sampling period may critically affect the calculated annual load. It is
well known that streams transport the majority of sediment load during infrequent storm events. Especially, in
peatland drainage networks the majority of pollutants and sediments are eroded and entrained during peak
discharge periods (e.g. Marttila and Kløve, 2008). Therefore, the measurement of SSC load is important during
these events.
The physical background
Various studies suggest that turbidity and acoustic backscattering may be suitable as continuous surrogate
measures for SSC (e.g. Thorne et al., 1991; Thevenot and Kraus, 1993; Gippel, 1995; Chanson et al., 2008). They
allow in situ continuous monitoring with better accuracy of the total suspended solids (TSS) load. The relationship
between SSC and turbidity is normally strong and well documented when the particle sizes remain nearly constant
or are well related to SSC. However, this relationship is site specific. Turbidity is strongly influenced by particle size
(Foster et al., 1992), for example, it is more sensitive to fine particles than coarse ones (Ludwig and Hanes, 1990).
Moreover, water colour due to dissolved solids (Malcolm, 1985) and temperature, in addition to the particle’s
shape, size and mineral composition (Clifford et al., 1995) can affect turbidity readings. The SSC required to
produce a particular turbidity output can vary by a factor of 100 for different sediments (Pfannkuche and Schmidt,
2003). Some variance can be tolerated as continuous estimate of SSC overcomes the uncertainty of infrequent
sampling, which is the greatest source of error in stream sediment load estimation (Gippel, 1995). However, most
turbidity sensors cannot be successfully used in highly turbid waters since they are susceptible to the effects of
particle characteristics (e.g. aggregate size) as discussed above. As a result, the measurement is still uncertain in
higher concentrations and turbid environments. Very little information is available on the measuring errors arising
from and reliability when working with high inorganic concentrations, and none when the components are mainly
organic. This information would be essential when monitoring drained headwater areas, where conditions can
change from turbid to uniform flow.
Acoustic Doppler velocimetry (ADV) allows the concurrent monitoring of velocities and acoustic backscatter
strength. ADV provides a sound noise ratio (SNR)-signal which indicates the amount of scattered sound pulses
from the particles in the fluid. The measurement occurs at a single point with high frequency. The Acoustic Doppler
Current Profiler (ADCP) has been previously applied for measuring SSC concentrations (e.g. Holdaway et al.,
1999; Fugate and Friedrichs, 2002; Hill et al., 2003). Most of these studies have been conducted in rivers and
coastal zones. However, ADCP is not suitable for shallow waters, and therefore cannot be applied to small drainage
networks or headwaters. Therefore, the smaller ADV instrument is utilized in this study. Previous studies in
estuarine environments have reported a good relationship between concentration and sound noise ratio by ADV
(Fugate and Friedrichs, 2002; Voulgaris and Meyers, 2004; Scully and Friedrichs, 2007). Also, Chanson et al.
(2008) tested ADV probes in small subtropical streams with promising results.
Measuring and data errors
Even though the relationship between SCC and turbidity is generally strong, it is important to consider the errors
and uncertainties present. When monitoring fluvial environments, the change of suspended sediment particle
properties such as particle size over time can result in considerable variation and introduce bias into the calibration
between turbidity, SNR-ratio and SSC. In continuous measuring, errors may derive from several sources (Minella
et al., 2007). Instrument errors associated with the equipment used can be both systematic and random. Systematic
errors caused by the calibration procedure can significantly affect the differences in sediment concentration
estimates. Furthermore, methodological errors caused by indirect measurements of temporal variables and
properties (e.g. particle size) can result in scattering (Gippel, 1995). Also, the selection of the measuring site may
affect results. No general methods have been developed to correct the particle size effect, despite many studies on
measurement procedures (Kineke and Sternberg, 1992; Green and Boon, 1993; Black and Rosenberg, 1994;
Copyright # 2009 John Wiley & Sons, Ltd. River Res. Applic. 26: 1019–1035 (2010)
DOI: 10.1002/rra

TURBIDITY METER AND ACOUSTIC DOPPLER VELOCIMETRY 1021
Pfannkuche and Schmidt, 2003). Reason for this is that the particle sizes and sediment types causes different
outcomes in different environments. Chanson et al. (2008) summarise the recent calibration studies for turbidity
and acoustic backscatter for measuring suspended solids. Turbidity threshold sampling (TTS) has been developed
to improve SSC load estimation during storm flows (Lewis and Rand, 2001). The method is useful but requires
considerable effort at every measurement site.
Problem statement and study objectives
Most of the continuous SSC measurements have been performed in estuaries and larger streams (stream order
>3) where suspended solids consist mainly of relatively small particles. In the shallow waters of drainage networks
and headwaters the sediment’s distributions are different. For example, in channels which dry out, peak flows may
dominate the transport and the transported particle size in suspension may vary notably (e.g. Marttila and Kløve,
2008). The estimation of total loads sets a different challenge for continuous SSC measurements. Particulate
organic components in suspended sediments may have a major effect on turbidity, mainly due to their dense
composition and dark colour. Gippel (1995) noticed that for the same concentration and particle size, the organic
particles gave attenuated turbidity values two to three times higher than mineral particles. The study proposed that
short-term temporal variations from purely organic to purely mineral particle loads are rare in nature and, therefore,
organic matter does not have a major effect on turbidity calibration. However, in the boreal zone and the arctic
environments organic sediments from peatland systems are major sources of sediment and a main component in
suspended solids. Also, organic and inorganic load can vary spatially depending on erosion and weathering
conditions in upstream areas. St-Hilaire et al. (2006) reported a turbidity study downstream a peat extraction bog.
However, the effect of the physical characteristics of the transported sediment (particle size etc.) was not measured.
There is a lack of specific information on how suspended particulate organic peat sediment affects turbidity and the
acoustic threshold. When compared to inorganic sediments, the problem with organic peat sediment is that it
originates from decomposed plant (peat) material, containing plant matter in various stages of decomposition. This
produces a diverse particle sizes and shape distributions in downstream watercourses. Marttila and Kløve (2008)
noticed the peat particles to be heterogeneous in physical characteristics with shapes differing from round to
oblong. The largest particles had an irregular shape while the smaller ones are relatively spherical. The effect of the
concentration, shape and size distribution of particles on turbidity and ADV-velocimetry calibration is not yet fully
understood.
This paper presents a laboratory study where a turbidity meter and an ADV were calibrated for measuring SSC
and particulate organic peat. The measurements were repeated for silt and clay and the results were used to compare
the characteristics of different sediments. The experiments were conducted under controlled conditions using
commercially available instruments. The aims of this study were (1) to evaluate the ability and sensitivity of sensors
to accurately measure instantaneous SSC for different sediment types that can typically be found in the headwaters
of peatland drainage and stream networks, (2) to find the reliable concentration limits, measuring errors,
uncertainty and suitability of measuring methods for drainage sites and especially (3) to estimate the effect of the
particulate organic peat on calibration. This study contributes new data especially on organic peat particles.
METHODS
The relationships between turbidity, acoustic backscatter amplitude and SSC were tested systematically with a
laboratory settling column (2 m height, 0.5 m diameter, Figure 1). Two submersible pumps were installed at the
bottom of the column: one pump mixed the water column and the other lifted the sediment from the bottom. This
arrangement also mixed the coarser sediments equally. The ability to create suspensions of known concentrations
was verified through physical sampling of the water-sediment mixture. The possible impact of the water sample
tube intake location was also tested. This experiment procedure ensured thoroughly mixed conditions followed by
uniform settling conditions.
A turbidity sensor (YSI 600 OMS, range 0–1000 nephelometric turbidity units (NTU), accuracy� 5%) and
Nortek Vector 3D Current Meter using acoustic backscatter Triton-ADV (dynamic range 90 dB, resolution 0.45 dB,
accuracy� 1%) were installed at a height of 1 metre from the column base. Water samples (0.5 l) were taken from
Copyright # 2009 John Wiley & Sons, Ltd. River Res. Applic. 26: 1019–1035 (2010)
DOI: 10.1002/rra

Figure 1. Schematic of the laboratory column experiment (not in scale) and sensors placement
1022 H. MARTTILA ET AL.
the same level with a sampling tube (diameter 0.5 cm) close to the sensors. The sensors were installed on a slight
angle (308) to provide free settling in the column and minimal interference at the measurement point.
Three different sediment types (particulate organic peat, silt and clay) were used in the study (Table I). The
particulate peat sediment was taken from the sedimentation pond of Luisansuo peat harvesting site (72857’’ N,
44894’’ E), located in the Northern Ostrobothnia region of Finland. The silt and clay samples were taken from
nearby areas of Luisansuo. The input concentration was determined from the dry weight of the sediment placed in
the column (g) divided by the volume of the water in the column (320 L). At the beginning of every test run, the
tested sediment was mixed equally in the column by the pumps. The sensors were installed and the first water
sample (0.5 L) was taken when the pumps were still mixing the water to verify the initial state and the equal mixing
of the sediment in the column. The pumps were then turned off and the suspended sediment was allowed to settle
freely. Water samples were taken up to 24 h (48 h for clay samples) with variable sampling periods (Initial state 0 s,
Table I. Characteristics of the sediments used
Particle size (mm) Silt Clay Peat
d10 0.028 0.001 0.037d25 0.069 0.003 0.088d50 0.18 0.007 0.24d75 0.37 0.015 0.50d90 0.48 0.027 0.95
Copyright # 2009 John Wiley & Sons, Ltd. River Res. Applic. 26: 1019–1035 (2010)
DOI: 10.1002/rra
TURBIDITY METER AND ACOUSTIC DOPPLER VELOCIMETRY 1023
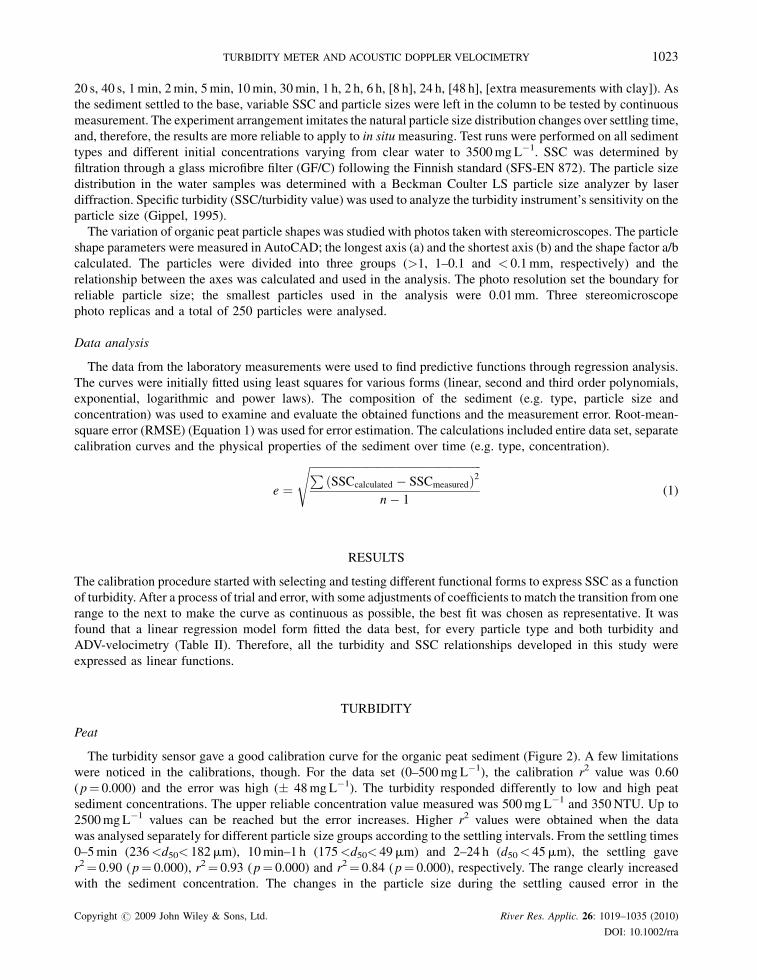
20 s, 40 s, 1 min, 2 min, 5 min, 10 min, 30 min, 1 h, 2 h, 6 h, [8 h], 24 h, [48 h], [extra measurements with clay]). As
the sediment settled to the base, variable SSC and particle sizes were left in the column to be tested by continuous
measurement. The experiment arrangement imitates the natural particle size distribution changes over settling time,
and, therefore, the results are more reliable to apply to in situ measuring. Test runs were performed on all sediment
types and different initial concentrations varying from clear water to 3500 mg L�1. SSC was determined by
filtration through a glass microfibre filter (GF/C) following the Finnish standard (SFS-EN 872). The particle size
distribution in the water samples was determined with a Beckman Coulter LS particle size analyzer by laser
diffraction. Specific turbidity (SSC/turbidity value) was used to analyze the turbidity instrument’s sensitivity on the
particle size (Gippel, 1995).
The variation of organic peat particle shapes was studied with photos taken with stereomicroscopes. The particle
shape parameters were measured in AutoCAD; the longest axis (a) and the shortest axis (b) and the shape factor a/b
calculated. The particles were divided into three groups (>1, 1–0.1 and < 0.1 mm, respectively) and the
relationship between the axes was calculated and used in the analysis. The photo resolution set the boundary for
reliable particle size; the smallest particles used in the analysis were 0.01 mm. Three stereomicroscope
photo replicas and a total of 250 particles were analysed.
Data analysis
The data from the laboratory measurements were used to find predictive functions through regression analysis.
The curves were initially fitted using least squares for various forms (linear, second and third order polynomials,
exponential, logarithmic and power laws). The composition of the sediment (e.g. type, particle size and
concentration) was used to examine and evaluate the obtained functions and the measurement error. Root-mean-
square error (RMSE) (Equation 1) was used for error estimation. The calculations included entire data set, separate
calibration curves and the physical properties of the sediment over time (e.g. type, concentration).
e ¼
ffiffiffiffiffiffiffiffiffiffiffiffiffiffiffiffiffiffiffiffiffiffiffiffiffiffiffiffiffiffiffiffiffiffiffiffiffiffiffiffiffiffiffiffiffiffiffiffiffiffiffiffiffiffiffiffiffiffiffiffiffiffiPðSSCcalculated � SSCmeasuredÞ2
n� 1
s(1)
RESULTS
The calibration procedure started with selecting and testing different functional forms to express SSC as a function
of turbidity. After a process of trial and error, with some adjustments of coefficients to match the transition from one
range to the next to make the curve as continuous as possible, the best fit was chosen as representative. It was
found that a linear regression model form fitted the data best, for every particle type and both turbidity and
ADV-velocimetry (Table II). Therefore, all the turbidity and SSC relationships developed in this study were
expressed as linear functions.
TURBIDITY
Peat
The turbidity sensor gave a good calibration curve for the organic peat sediment (Figure 2). A few limitations
were noticed in the calibrations, though. For the data set (0–500 mg L�1), the calibration r2 value was 0.60
( p¼ 0.000) and the error was high (� 48 mg L�1). The turbidity responded differently to low and high peat
sediment concentrations. The upper reliable concentration value measured was 500 mg L�1 and 350 NTU. Up to
2500 mg L�1 values can be reached but the error increases. Higher r2 values were obtained when the data
was analysed separately for different particle size groups according to the settling intervals. From the settling times
0–5 min (236<d50< 182 mm), 10 min–1 h (175<d50< 49 mm) and 2–24 h (d50< 45 mm), the settling gave
r2¼ 0.90 (p¼ 0.000), r2¼ 0.93 ( p¼ 0.000) and r2¼ 0.84 ( p¼ 0.000), respectively. The range clearly increased
with the sediment concentration. The changes in the particle size during the settling caused error in the
Copyright # 2009 John Wiley & Sons, Ltd. River Res. Applic. 26: 1019–1035 (2010)
DOI: 10.1002/rra

Table II. The best fit relationships and measurement limits for different sediments. The suspended sediment concentration(SSC, mg L�1) is given as a function of turbidity (NTU), sound noise ratio (SNR) and the root mean square error (RMSE) inregression equation
Sedimenttype
Turbidity meter Acoustic Doppler Velocimetry(Triton-ADV)
Organic peatparticle
Reliable measuring limits 0–500 or 2500 mg L�1 Reliable measuring limits 0–500 mg L�1
Whole data (0–500 mg L�1, 236< d50< 45 mm):SSC¼ 1.20�NTUþ 51.81 with r2¼ 0.60,p¼ 0.000, error� 48
Whole data, 236< d50< 45 mm: Not reliableSSC¼ 2.12� SNRþ 22.54 with r2¼ 0.03,p¼ 0.241, error� 10
Whole data (0–2500 mg L�1, 236< d50< 45 mm):SSC¼ 3.96�NTU�94.67 with r2¼ 0.69, p¼ 0.000,error� 68
After 1–2 h settling, 48< d50< 45 mmSSC¼ 44.11� SNR�3089.2 with r2¼ 0.45,p¼ 0.017, error� 4
After 0 s–5 min settling, 236< d50< 183 mmSSC¼ 6.01�NTU�100.57 with r2¼ 0.90, p¼ 0.000,error� 7
After 6 h settling, d50< 45 mmSSC¼ 14.12� SNR�585.11 with r2¼ 0.95,p¼ 0.001, error� 1
After 10 min–1 h settling, 175< d50< 48 mmSSC¼ 1.39�NTUþ 39.35 with r2¼ 0.93, p¼ 0.000,error� 24After 2–24 h settling, d50< 45 mmSSC¼ 1.03�NTUþ 17.78 with r2¼ 0.84, p¼ 0.000,error� 33
Clay Reliable measuring limits 0–1000 mg L�1 and< 1000 NTU
Reliable measuring limits 0–1000 mg L�1 and< 70 SNR
Whole data 0–1000 mg L�1 (7.34< d50< 0.72 mm):SSC¼ 0.85�NTUþ 2.44 with r2¼ 0.90, p¼ 0.000,error� 85
Whole data (7.34< d50< 0.72 mm): Not reliableSSC¼ 1.69� SNRþ 57.15 with r2¼ 0.16,p¼ 0.000, error� 12
Concentration 0–150 mg L�1 SSC¼ 0.84�NTUþ 2.98 with r2¼ 0.93, p¼ 0.000, error� 13
After 6–8 h settling, d50¼ 2.98SSC¼ 14.51� SNR�435.84 with r2¼ 0.78,p¼ 0.000, error� 6
Concentration 150–1000 mg L�1 SSC¼ 0.64�NTUþ93.97 with r2¼ 0.63, p¼ 0.001, error� 94
After 24–48 h settling, 0.97< d50< 0.72 mmSSC¼ 3.56� SNR�49.55 with r2¼ 0.48,p¼ 0.004, error� 8
Silt Reliable measuring limits 0–3500 mg L�1 Reliable measuring limits 0–500 mg L�1
Whole data (181< d50< 47 mm): Not reliableSSC¼ 9.94�NTU�282.33 with r2¼ 0.40,p¼ 0.000 error� 29
Whole data (181< d50< 47 mm): Not reliableSSC¼ 2.82� SNR�117.77 with r2¼ 0.59,p¼ 0.000, error� 13
After 0–20 s settling, 181< d50< 79 mmSSC¼ 20.93�NTU�358.55 with r2¼ 0.94,p¼ 0.000, error� 14
After 40 s–1 min settling, 67< d50< 50 mmSSC¼ 23.18� SNR�1993.9 with r2¼ 0.73,p¼ 0.001, error� 4
After 40 s–1 min settling, 67< d50< 50 mmSSC¼ 4.36�NTU�69.56 with r2¼ 0.93, p¼ 0.000,error� 12
After 2 min–24 h settling, d50< 47 mmSSC¼ 1.69� SNR�59.39 with r2¼ 0.61,p¼ 0.000, error� 11
After 2 min–24 h settling, d50< 47 mmSSC¼ 1.05�NTU�10.62 with r2¼ 0.75, p¼ 0.000,error� 15
1024 H. MARTTILA ET AL.
measurement and changed the slope of the calibration curve. The peat sediment specific turbidity peak (Kpeat)
occurred at 70.86 mm (Figure 3).
Clay
For the laboratory tests with different sediments, the best fit relationships are shown in Table II. The upper
reliable measuring limit for clay was 1000 NTU and 1000 mg L�1. For clay, the optical turbidity sensor gave a
linear response (r2¼ 0.90, p¼ 0.000) for the values up to 1000 mg L�1 and 1000 NTU (combined curve). A more
detailed calibration curve is obtained when the curve is divided into different concentration intervals. For the
Copyright # 2009 John Wiley & Sons, Ltd. River Res. Applic. 26: 1019–1035 (2010)
DOI: 10.1002/rra

Figure 2. Results and confidence interval (95%) from turbidity calibrations for organic peat particle (upper most), clay (middle) and fine sand(lowest) sediments
Figure 3. Dependence of turbidity on specific turbidity for clay (a), peat (b) and fine sand (c) sediment particles
Copyright # 2009 John Wiley & Sons, Ltd. River Res. Applic. 26: 1019–1035 (2010)
DOI: 10.1002/rra
TURBIDITY METER AND ACOUSTIC DOPPLER VELOCIMETRY 1025

Figure 4. Fluctuation of the clay (a), peat (b) and fine sand (c) sediment particle size distribution during settling experiments
1026 H. MARTTILA ET AL.
concentrations between 0–150 mg L�1, a linear response gave a better fit, r2¼ 0.93, p¼ 0.000 (Figure 2). However,
after 150 mg L�1 concentration more scattering appears which affects the calibration curve. For the concentration
interval 150–1000 mg L�1, a linear response is observed (r2¼ 0.63, p¼ 0.001). Also, the range changes notably
after 150 mg L�1 (256 mg L�1), whereas with concentrations less than 150 mg L�1 range was 51 mg L�1,
respectively. The sediment particle size (d50) during the settling dropped from 7.34 mm in turbulent conditions to
0.97 mm at 24 h (Figure 4). In the clay sediment tests, particle size did not have a significant effect on the
measurements. However, after 24 h settling when clay sediment d50 was less than 2 mm, the calibration curve starts
to change as a result of particle size distribution alteration. Particle size had an effect on the calibration curve slope,
when the particle size decreased the slope increased. The effects of particle size (d50) variations on specific turbidity
are illustrated in Figure 3. The clay sediment specific turbidity peak (Kclay) occurred at 0.89 mm, which indicates
that the instruments optical response for the values under K is beyond the instrument’s detection limit.
Silt
Silt SSC showed a poor dependency on NTU values (Figure 2) when all measurements were taken into account in
the calibration curve (r2¼ 0.4). Large variations in the values were observed even at low concentrations such as
50 mg L�1. The upper reliable measuring limit was 3500 mg L�1 at 200 NTU. When the calibration was separated
into different particle sizes, the curves showed a better fit, with r2¼ 0.94 ( p¼ 0.000), r2¼ 0.93 ( p¼ 0.000) and
r2¼ 0.75 ( p¼ 0.000), respectively, for settling times and particle sizes 0–20 s (181<d50< 79 mm), 40–60 s
(67<d50< 61 mm) and 1 min–24 h (d50< 47 mm). The ranges for the corresponding settling times and particle sizes
were 49, 38 and 75 mg L�1, respectively. The effect of particle size on the measurements was significant and the
slope of the calibration curve changed with the settling time and particle size change. During the first 10 min of
settling, the particle size d50 changed from 181 to 47 mm. This had a direct effect on the results. In the first stage of
settling, the samples contained large particles which were not detected as smaller particles produced high turbidity,
and therefore, hindered the detection of larger particles. The silt sediment specific turbidity peak (Ksilt) occurred at
101.7 mm.
ACOUSTIC DOPPLER VELOCIMETRY (TRITON-ADV)
Peat
The organic particulate peat showed a poor dependency on the SNR for the calibration measurement
range 0–500 mg L�1 (r2¼ 0.03). When splitting the data into settling times and particle size distributions, the
calibration improved. However, the samples did not have any correlation for the first 30 min when d50 was
over 182 mm. From 1–2 hours (48<d50< 45 mm) or 6 h (d50< 45 mm) settling periods the r2 values were 0.45
(p¼ 0.017) and 0.95 (p¼ 0.001), respectively. The ranges were 3 and 16. Peat particle size had a significant effect
Copyright # 2009 John Wiley & Sons, Ltd. River Res. Applic. 26: 1019–1035 (2010)
DOI: 10.1002/rra

TURBIDITY METER AND ACOUSTIC DOPPLER VELOCIMETRY 1027
on the results, especially in the first stages of the experiment. After 30 min, the d50 was quite homogenous and close
to 50 mm. However, the d90 value still changed and affected calibration. The upper reliable measuring limit was
500 mg L�1 at 70 dB.
Clay
The acoustic backscatter Triton-ADV showed a poor relationship with SNR-signal and the clay concentration
(r2¼ 0.16) as the results were scattered around the curve (Table II, Figure 5). The uncertainty was significant, since
with the SSC value of 20 mg L�1 the SNR value ranged between 20 and 50 dB. The upper limit for the sensor’s
detection limit was 70 dB at 1000 mg L�1. The shape and slope of the calibration curve was changing considerably
with the particle size and settling time. For example, after 6–8 h and 24–48 h, the settling particle sizes d50¼ 3 and
0.7 mm, respectively and calibration curves were completely different. The correlations (r2) were 0.78 ( p¼ 0.000)
Figure 5. Results and confidence intervals (95%) for Triton-ADV calibrations for organic peat particle (upper most), clay (middle) and fine sand(lowest) sediments
Copyright # 2009 John Wiley & Sons, Ltd. River Res. Applic. 26: 1019–1035 (2010)
DOI: 10.1002/rra

1028 H. MARTTILA ET AL.
and 0.48 ( p¼ 0.004); the range was high, 23 and 25 mg L�1, respectively. These were about half of the maximum
SNR value 70 dB. The best calibration (r2¼ 0.84, p¼ 0.000) was obtained after 6 h settling, when the particle size
was homogenous and d50 was above 2 mm. After 6 h settling and as the particle size decreased, the calibration curve
deteriorated again.
Silt
The silt-size sediment gave a poor calibration for Triton-ADV (r2¼ 0.47). The upper reliable measuring limit for
the SNR signal was 100 dB, which was reached at slightly below 200 mg L�1. When the calibration curve was
separated by settling times and particle size groups, the correlation improved. For 40 s–1 min (d50< 67 mm) and
2 min–24 h (d50< 54 mm) settling, the correlations were r2¼ 0.73 (p¼ 0.001) and r2¼ 0.61 ( p¼ 0.000),
respectively. The range was 11 and 52 mg L�1. However, from the initial state to 20 s with particle sizes
(181<d50< 79 mm) there was no correlation in the data. The particle size clearly influenced the calibration and
error.
Shape analysis of organic peat particles
The organic peat particles were analysed by a stereomicroscope. The analysis showed that the peat particles
were heterogeneous in physical characteristics with different shapes from round to oblong, which corresponds
with previous findings (Marttila and Kløve, 2008). The largest particles had an irregular shape while the
smaller ones were relatively spherical and more similar in shape to inorganic sediment. Smaller particles
appeared often in the form of fragile flocs. The sediment contained mainly peat components (e.g. Sphagnidae),
however, decomposed sedges and forest litter was noticed to form the most un-decomposed portion of the
particles. These particles were very angular and often flat as can be seen in Figure 6. The particle sizes over 1 mm
had the most irregular form and the shape factor (a/b relationship) was low (Table III). On the other hand,
the particle sizes less than 1 mm represented more spherical shapes as the particles were more decomposed
and disintegrated. The change in particle character from irregular to regular shape took place in the particles
between 1 and 0.1 mm.
Figure 6. Organic peat particles taken with stereomicroscope. This figure is available in colour online at wileyonlinelibrary.com
Copyright # 2009 John Wiley & Sons, Ltd. River Res. Applic. 26: 1019–1035 (2010)
DOI: 10.1002/rra

Table III. Result from organic peat particle shape analysis: the longest axis (a) and the shortest axis (b)
> 1 mm Mean Min Max
a 2.144 1.110 3.833b 0.307 0.088 0.621a/b 0.169 0.044 0.4690.1–1 mm Mean Min Maxa 0.364 0.118 0.816b 0.225 0.060 0.416a/b 0.573 0.341 0.973< 0.1 mm Mean Min Maxa 0.056 0.019 0.091b 0.055 0.022 0.102a/b 0.659 0.316 0.896
TURBIDITY METER AND ACOUSTIC DOPPLER VELOCIMETRY 1029
DISCUSSION
Turbidity
Turbidity gave a good calibration for every sediment type and the results were clearly dependent on particle
sizes, particle shapes and concentrations. Large particles produced scatter, making the measurement less reliable.
The results are in agreement with previous findings (Foster et al., 1992), where particle sizes d50¼ 0.015 mm was
used. However, the present study included larger particle sizes (silt: d50¼ 0.18 mm, peat: d50¼ 0.24 mm) making
the results more evident. This was most evident in the case of the organic peat particles as the particle shapes
changed radically with the particle size distribution and concentration. Each particle type had a distinct SSC–
turbidity relationship. Particle size had an effect on calibration curve slopes and each particle size group and type
seems to have a characteristic effect on calibration. Some data showed consistent monotonic increase in SSC with
increasing turbidity. Separate calibration curves for different concentration and particle size groups reduced the
calibration error notably. This approach would be useful to reduce errors for field conditions, especially when
working with organic rich waters and headwater areas. In larger streams the organic peat material is more likely
already beaked down to smaller particles.
The small clay particles had a very good calibration curve, which has also been noticed in previous studies (e.g.
Minella et al., 2008). The clay particle sizes did not have a significant effect on calibration, since the variation in
particle size was not large. The results indicated, though, that after 24 h settling and particle size distribution
d50< 2 mm, the decrease in the particle size begin to affect the results. This derives from the limitation of the
turbidity sensor to detect the smallest particles and resulted in a new calibration curve being required. The clay
sediment specific turbidity peak (Kclay) occurred at 0.89 mm (Figure 3). The result was similar to findings by Gippel
(1995), where the clay material Kclay peak occurred at 1.2 mm. According to Gippel (1995), if the median particle
size falls below critical K size, the ranges are dominated by particles whose optical response to the incident light
beam is beyond the detection limit of the instrument. The limiting factor of the clay particles was the instrument’s
measuring limit, 1000 NTU (Figure 7). This NTU value corresponds to the clay sediment concentration of
1000 mg L�1. In fluvial systems, the suspended sediment load is in most cases dominated by clay- and silt-sized
particles (Knighton, 1998) with concentrations ranging from 0.5 mg L�1 to more than 10 g L�1 (Eisma, 1993). This
implies that some peak values cannot be detected with the turbidity instrument used in this study. However, in
peatland drainage network the concentration rarely exceeds 1000 mg L�1 and, therefore, the results can be utilized
in situ.
Large particles in the silt and organic peat induced the most errors on the calibration curves. The silt
corresponded poorly to NTU values, when all measurements 0–3500 mg L�1 were used. This was expected,
since the turbidity is more sensitive to fine particles than coarse ones (Conner and De Visser, 1992; Gippel, 1995).
In the first stage of the study and settling the samples contained a large amount of the larger particles. At this point
Copyright # 2009 John Wiley & Sons, Ltd. River Res. Applic. 26: 1019–1035 (2010)
DOI: 10.1002/rra

Figure 7. The turbidity as a function of different sediment concentrations
1030 H. MARTTILA ET AL.
the larger particles were covered under high turbidity values (light absorbance) caused by smaller particles which
greatly affect the measured NTU/SSC value. Also, light absorbance from the larger particles scatters differently and
produced altered outcomes when both large and small particles were in suspension. Data separation by the particle
size groups considerable improved the calibration and reduced the error, for example the magnitude of error in the
organic peat particles measurement decreased by a factor of 7. After settling of the largest silt particles and
conditions with d50¼ 0.54 mm, the calibration curves gave a good relationship and small root mean square errors.
The silt particles set a different constraint to the measurement. The limiting factor seemed to be that larger particles
were concealed under the influence of the smaller particles in the turbidity value, resulting in error at high
concentrations. This implies that in changing conditions such as in turbid conditions, sediment transport rate and
distribution at the measuring site control the quality of measurements. The maximum reliable measuring limit was
3500 mg L�1 at 200 NTU which is fairly high for drained peatland headwaters.
The organic peat particles behaved differently at lower and higher concentration values, but showed a good fit for
both conditions. According to particle size and shape analysis, the higher concentrations contained the most diverse
variation of particle characteristics. This had a notable effect on the turbidity sensor calibrations. Peat particles
originate from plants such as mosses, sedge, forest litter etc. This variation poses a challenge to the calibration
procedure. The particle shape analysis showed that particle sizes over 1 mm had the most irregular composition.
This fraction represented only a minor part of the sediment used in the column experiment (d90¼ 95 mm), but these
particles may have a great effect on the calibration via light absorbance and floc formation, which affect settling
conditions. The turbidity output value for concentrations before and after 10 min settling with d50¼ 175 mm
showed a different outcome. This was likely the result of flocculation, which was confirmed by visual observation
during the experiments. At the 5 min sampling time the column contained large flocs, whereas at the 10 min stage
the largest flocs were settled and past the sensor locations. The particle size distribution analysis did not validate
this; at the 5 and 10 min stages there was no difference in the particle sizes (d50¼ 182 and 175 mm, d90¼ 856 and
776 mm, respectively). However, this was due to floc and aggregate breakup in the laser particle size analyzer.
Therefore, it can be assumed that the difference in turbidity readings, between the 5 and 10 min settling stages,
originated from floc formation and particle shape. After 10 min settling, the column still contained smaller flocs,
however, they did not have a significant effect on calibration. The results indicate that the organic peat flocs do not
decrease the measuring error (Table II), if the separate calibration curves are used.
The results clearly indicated that calibration error increased with larger particles, larger variability in particle
sizes and concentration. The decrease in turbidity output with these conditions may be the result of a number of
different processes including: (1) partial blockage of the emitted particles by highly concentrated sediments and
flocs, (2) reduction of the scattering volume relative to the area of detection, (3) multiple scattering, all resulting in
reduction of the return backscattered signal or (4) with the organic peat particles resulting from changing shape and
floc distribution. Hence, in the measuring sites with organic particles present, the floc formation should be taken
Copyright # 2009 John Wiley & Sons, Ltd. River Res. Applic. 26: 1019–1035 (2010)
DOI: 10.1002/rra

TURBIDITY METER AND ACOUSTIC DOPPLER VELOCIMETRY 1031
into consideration. The possibility of error and the influence of organic peat particles and flocs on calibration curve
need to be evaluated in field conditions to ensure quality measurements and results. Information concerning the
effects of particle size and shape is useful when assessing the effect of different particle sizes and concentrations on
calibration and measuring errors during different flow conditions. The settling conditions and velocities used in the
column can be compared e.g. to conditions in a settling basin or stream pool. To the author’s knowledge, similar
settling experiments for turbidity and ADV-sensor calibration have not been conducted before. However,
TTS sampling studies have shown that larger particles affect calibration curves during peak flow events (Lewis and
Rand, 2001). Therefore, if the settling basin’s hydraulic load (detention time) and transported sediment type
is known, it is possible to estimate the calibration error during different flow conditions with the present study
results.
Previously, the organic peat particle/turbidity relationship has been used to monitor peat harvesting site runoff
waters with promising results (St-Hilaire et al., 2006). The study showed that the initial organic peat sediment
concentration could be up to 10 000 mg L�1. Large scale error was observed by St-Hilaire et al. (2006), confirming
our findings on the significant impacts of the organic particle sizes and flocs on calibration. In both studies
(including the present) the root mean square error increased with SSC. This is important to take into consideration
when assessing measuring error in drained peatland catchments. If the limiting factors for field measuring are
examined, the organic peat particles and turbidity value show similar behaviour for both clay and silt sediments.
After the settling of larger particles and flocs in the column, the behaviour was similar to clay, and the limiting
factor was the instrument’s measuring limit. As with the silt, high concentrations and large particles reduced the
measurement accuracy, and as discussed above, also flocs had an effect on the calibration. The organic peat
particle’s reliable concentration upper limit was 500 mg L�1 and with poorer calibration for values up to
2500 mg L�1. Even though, the linear correlation showed poor correlation after 2500 mg L�1, results indicate that
non-linear relationship could appear beyond a this threshold. However, used data was not capable form this reliable
relationship. Large organic particle flushes in drained peatlands occur, for example, in peat harvesting sites, where
Sallantaus (1983) reported peak concentrations up to 2500 mg L�1. In a peatland forest drainage site, Joensuu et al.
(1999) monitored 1300 mg L�1 concentrations. Therefore, the present study results substantiate the utilization of
turbidity sensors in drained peatland catchments.
Even though, the study included typical sediments in headwaters, there are few limitations in the findings. The
natural system often contains different sources of sediment. Thus, sediment transport on a single hydrograph can be
complex and transported material can be mixtures of different sediments. In these conditions, turbidity/SS
calibration curve need to calibrate in situ using sediments from local source and water column. However, the
represented curves above can be used to evaluate measuring error and limitations during changing concentration
conditions. Future research should include testing with sediment mixtures and their effect on calibration and
measuring reliability.
Effect of water colour was not included on experimental procedure and turbidity calibration was performed using
clear water. However, previous studies have concluded that water colour (Malcolm, 1985) and dissolved load have
impact on calibration curves. This is evident also in drained peatlands, where dissolved load often contains iron,
which discolours the runoff waters. This furthers highlights requirements also for site specific calibrations for
turbidity sensors.
Doppler velocimetry (Triton-ADV)
The potential of the Triton-ADV for measuring suspended sediment concentrations can be an advantage. The
results demonstrated that the calibration of the acoustic Doppler velocimetry (Triton-ADV) must be carefully
carried out. The ADV was sensitive to variation in the particle size, concentration and particle type. However, the
results indicate that the ADV could be used in fluvial systems where the SSC transport consists of relatively small
particle sizes. The results are in accordance with previous studies by Fugate and Friedrichs (2002), who noted that
the ADV was sensitive to particle grain size differences. Also in our study, reliable calibrations were achieved with
the small particles.
The upper concentration limit for clay was close to the measured turbidity limit, 1000 mg L�1. Previous studies
show high variability in calibration; Kawanisi and Yokosi (1997) reported calibration between 0–80 mg L�1,
Copyright # 2009 John Wiley & Sons, Ltd. River Res. Applic. 26: 1019–1035 (2010)
DOI: 10.1002/rra

1032 H. MARTTILA ET AL.
Nikora and Goring (2002) 2–400 mg L�1, Voulgaris and Meyers (2004) 2–100 mg L�1 and Chanson et al. (2008)
0–710 mg L�1. These studies were performed mainly in estuaries and with small particle sizes. In the present study
the best calibration with the clay particles was achieved with the 6 h settling period samples, when particle size
distribution was uniform (d50¼ 3 mm). Thereafter, the calibration curve deteriorated, and after 24–48 h of settling
the particle sizes (d50¼ 0.97 and 0.72 mm, respectively) were too small to be detected by the ADV-instrument. A
similar effect was also noticed for the turbidity sensor, where the results were confirmed by the specific turbidity
findings that the smallest particles in suspension were not detected.
The upper reliable concentration measuring limit was below 500 mg L�1 for both silt and organic peat particles.
The peat particle measurement with ADV was influenced by the particle size, concentration and shape. Similar to
the clay particles, the best calibration for organic peat particles was achieved after 6 h settling when d50 was less
than 45 mm. This indicates the importance of uniform sediment distribution for quality measurements with the
ADV. Results from the silt particles verifies this finding. The ADV does not seem to detect larger particles from the
fluid when a larger amount of smaller particles are present. Larger particles are covered by SNR-signals caused by
smaller particles. As with the turbidity, the ADV-velocimetry SNR-signal error may be the result of a number of
processes, such as partial blockage, reduced sound scattering volume or multiple scattering. The particle size
analysis indicated that particle sizes and all particle types over d50 > 50 mm induce error in measurements and
calibration. The turbidity values were influenced by the peat particle flocs, however, with the ADV reliable
concentration and particle sizes (d50< 45 mm) started after 6 h settling. Then only small particles were in
suspension and no larger flocs appeared. The influence of flocs on early stage errors and disturbances is difficult to
estimate, regardless, they may have a major effect.
With all particle types, the ADV sensors gave a high range of dB values (SNR-signal) with high concentrations.
This created major uncertainty on the measurements. As discussed above, the results indicate that the ADV could
be used in fluvial systems with relatively small particle sizes. However, in changing hydrodynamic environments,
the use of ADV to estimate SSC may be problematic, since the ADV-derived estimates are sensitive to SSC
variations and particle size distributions. For instance, in drainage systems where SSCs and particle size
distributions may vary over time and space, the use of the ADV-velocimetry as SSC surrogate seems limited. ADV
cannot detect large particles if the SNR-signal is influenced by high concentrations of smaller particles. Thus, a
preliminary knowledge of sediment properties (e.g. type, particle distribution) and hydrodynamics (e.g. flow
conditions, peak flow rate) at the measuring site is required to estimate error and assess the choice of an appropriate
measurement system. Chanson et al. (2008) noticed small differences between different ADV meters. Thus, the
calibration of the ADV is also specific to the instrument itself, since the instrument’s measuring frequency can
differ.
In order to reduce errors associated with turbidity and ADV measurement in field conditions, a solution could be
to divide the calibration curve for different concentration and particle size ranges. Peak and low flows that
commonly have different sediment properties (sediment type, concentration) should be estimated with separate
curves. A similar conclusion has been derived in TTS studies by Lewis and Rand, (2001) who made calibrations for
different flow conditions. The calibration curves from the present study can be used as tentative measuring curves.
Nevertheless, the method is not trouble-free and needs further development and testing in field conditions.
Measurement errors may derive from several sources. Instrument errors associated with the equipment used can be
both systematic and random. Systematic errors caused by the calibration procedure can significantly affect the
differences in sediment concentration estimates. Furthermore, methodological errors caused by the indirect
measurements of temporal variables and properties (e.g. particle size) can result in scattering. According
to the present study, different particle types have different characteristics and effects on calibration. Table IV
summarizes the results and observations gained from this study. Several papers have discussed the
differences between laboratory and field calibrations (e.g. Minella et al., 2007; Chanson et al., 2008). A
common observation is overestimation from using only laboratory calibration curves, which are primarily
derived from the sediment particle size. The laboratory calibrations in the past studies have been performed
with channel bed material where the particles tended to be coarser than when transported in suspension.
However, the present study was conducted with general particle sizes, types and concentrations present in peatland
drainage networks. Therefore, the result can be exploited when assessing measuring sites calibration error and
possibilities.
Copyright # 2009 John Wiley & Sons, Ltd. River Res. Applic. 26: 1019–1035 (2010)
DOI: 10.1002/rra

Table IV. Particle characteristics affecting on turbidity and ADV-velocimetry calibration and importance on calibrationprocedure
Characteristics Particle type Physical effect Effect on calibration Importanceon calibration
Turbidity ADV
Particle size Organic peatparticles
light/sound reflection and absorbance error increase with largerparticle sizes
þþþ þ
Silt light/sound reflection error increase with largerparticle sizes
þþþ þ
Clay light/sound reflection only minor effect oncalibration
þ þ
Particle shape Organic peatparticles
reduced light/sound reflection andincreased absorbance, partial blockage,reduction ofscattering volume
irregular shape causecalibration error
þþþ þþþ
Silt light/sound reflection difference between largerand smaller particles
þþ þ
Clay light/sound reflection no major effects � �Concentration Organic peat
particleslight/sound reflection and absorbance,partial blockage, reduction ofscattering volume
high concentration causemore errors
þþþ þþþ
Silt light/sound reflection and absorbance,partial blockage, reduction ofscattering volume
high concentration causemore errors
þþ þþþ
Clay light/sound reflection and absorbance,partial blockage, reduction ofscattering volume
limiting factor wasinstrument sensitivity
þ þþþ
Flock/aggregate Organic peatparticles
light/sound reflection increase error if samecalibration curve is used
þþþ þþþ
Silt no major effect no major effect � �Clay light/sound reflection no major effect on
calibrationþ þ
þ, degree of importance; �, no effect.
TURBIDITY METER AND ACOUSTIC DOPPLER VELOCIMETRY 1033
CONCLUSIONS
Turbidity and ADV-velocimetry can be used to predict organic particulate peat, clay, and silt SSC with a few
limitations. The calibration depended on particle size, type, shape, concentration and appearance of flocs. The
present study concluded:
(I) K
Copyr
nowledge of the sediment particle size distribution, concentration and composition is important for
calibration and predicting the uncertainty in continuous SSC measurements by turbidity meter and ADV-
velocimetry.
(II) W
hen the turbidity and ADV calibration was performed for different particle size groups, sediment types andconcentrations, the calibration and suspended solids calculation error was reduced.
(III) F
or clay sediments the limiting factor in turbidity calibration was the instrument’s measuring limit of1000 NTU at 1000 mg L�1. The silt was controlled by sediment properties and the maximum limit was
3500 mg L�1 and 200 NTU. The organic peat particles showed properties similar to clay and silt depending on
the concentration present in the fluid. The measuring limit was 2500 mg L�1 at 400 NTU. However, scattering
was obvious after 500 mg L�1, when flocs and particle shape inflict error.
(IV) T
he turbidity instrument showed good calibration and it can be utilized in drained peatland catchments andheadwater areas. The Triton-ADV can be used in fluvial systems with relatively small particle sizes.
ight # 2009 John Wiley & Sons, Ltd. River Res. Applic. 26: 1019–1035 (2010)
DOI: 10.1002/rra

1034 H. MARTTILA ET AL.
The results from the present study enable easy and first step calibration and error assessment for the turbidity
meter and ADV-velocimetry monitoring. These results can be used to further support development of continuous
measurements.
ACKNOWLEDGEMENTS
The study has been funded and written with support from the KIRSU graduate school (Academy of Finland), Maj
and Tor Nessling foundation, Maa- ja Vesitekniikan Tuki ry, Thule-institute at University of Oulu and the Ministry
of Agriculture and Forestry. Authors thank MSc Audrey Ranson from Ecole d’Ingenieurs generalist (EPF) for her
work and the technician of Water Resources and Environmental Engineering Laboratory for their technical
assistance during the study.
REFERENCES
Black KP, Rosenberg MA. 1994. Suspended sand measurements in a turbulent environment: field comparison of optical and pump sampling
techniques. Coastal Engineering Journal 24: 137–150.
Brils J. 2008. Sediment monitoring and the European Water Framework Directive. Ann Ist Super Sanita 44(3): 218–223.
Chanson H, Takeuchi M, Trevethan M. 2008. Using turbidity and acoustic backscatter intensity as surrogate measures of suspended sediment
concentration in a small subtropical estuary. Journal of Environmental Management 88: 1406–1416.
Clifford NJ, Richards KS, Brown RA, Lane SN. 1995. Laboratory and field assessment of an infrared turbidity probe and its response to particle
size and variation in suspended sediment concentration. Hydrological Sciences 40(6): 771–791.
Conner CS, De Visser AM. 1992. A laboratory investigation of particle size effects on an optical backscatterance sensor. Marine Geology 108:
151–159.
Eisma D. 1993. Suspended Matter in the Aquatic Environment. Springer-Verlag: Berlin; 315.
Fugate DC, Friedrichs CT. 2002. Determining concentration and fall velocity of estuarine particle populations using ADV, OBS and LISST.
Continental Shelf Research 22: 1867–1886.
Foster IDL, Millington R, Grew RG. 1992. The impact of particle size controls on stream turbidity measurements; some implications for
suspended sediment yield estimation. In Erosion and Sediment Transport Monitoring Programmes in River Basins, IAHS Publication, 210,
51–62.
Gippel CJ. 1995. Potential of turbidity monitoring for measuring the transport of suspended solids in streams. Hydrological Processes 9: 83–97.
Green MO, Boon JD. 1993. The measurement of constituent concentrations in non-homogeneous sediment suspensions using optical backscatter
sensors. Marine Geology 11: 73–81.
Hill DC, Jones SE, Prandle D. 2003. Derivation of sediment resuspension rates from acoustic backscatter time-series in tidal waters. Continental
Shelf Research 23(1): 19–40.
Holdaway GP, Thorne PD, Flatt D, Jones SE, Prandle D. 1999. Comparison between ADCP and transmissometer measurements of suspended
sediment concentration. Continental Shelf Research 19(3): 421–441.
Joensuu S, Ahti E, Vuollekoski M. 1999. The effects of peatland forest ditch maintenance on suspended solids in runoff. Boreal Environmental
Research 4: 343–355.
Kawanisi K, Yokosi S. 1997. Characteristics of suspended sediment and turbulence in a tidal boundary layer. Estuarine, Coastal and Shelf
Science 38: 447–469.
Kineke GC, Sternberg RW. 1992. Measurements of high concentration suspended sediments using the optical backscatterance sensor. Marine
Geology 108: 253–258.
Knighton D. 1998. Fluvial Forms and Processes, A New Perspective. Hodder: London; 383.
Laine A, Heikkinen K. 2000. Peat mining increasing fine-grained organic matter on the riffle beds of boreal streams. Archiv fur Hydrobiologie
148: 9–924.
Lewis J, Rand E. 2001. Turbidity threshold sampling for suspended sediment load estimation. In Proceedings 7th Federal Interagency
Sedimentation Conference, 25–29 March 2001, Reno, Nevada.
Ludwig KA, Hanes DM. 1990. A laboratory evaluation of optical backscatterance suspended solids sensors exposed to sand-mud mixtures.
Marine Geology 94(1/2): 173–179.
Marttila H, Kløve B. 2008. Erosion and delivery of deposited peat sediment. Water Resource Research 44: W06406.
Malcolm RL. 1985. Geochemistry of stream fulvic and humic substances. In Humic Substances in Soil, Sediment, and Water, Aiken GR,
McKnight DM, Wershaw RI, MacCarthy P (eds). John Wiley and Sons, Inc.: NY; 181–209.
Minella JPG, Merten GH, Reichert JM, Clarke RT. 2008. Estimating suspended sediment concentrations from turbidity measurements and the
calibration problem. Hydrological Processes 22(12): 1819–1830.
Nikora V, Goring D. 2002. Fluctuations of suspended sediment concentration and turbulent sediment fluxes in an open-channel flow. Journal of
Hydraulic Engineering, ASCE 128(2): 214–224.
Copyright # 2009 John Wiley & Sons, Ltd. River Res. Applic. 26: 1019–1035 (2010)
DOI: 10.1002/rra

TURBIDITY METER AND ACOUSTIC DOPPLER VELOCIMETRY 1035
Pfannkuche J, Schmidt A. 2003. Determination of suspended particulate matter concentration from turbidity measurements: particle size effect
and calibration procedures. Hydrological Processes 17: 1951–1963.
Sallantaus T. 1983. Turvetuotannon vesistokuormitus. The load to watercourses from peat mining. University of Helsinki, Department of
Limnology, Series: D:29, Helsinki, Finland; (in Finnish), 122.
Scully ME, Friedrichs CT. 2007. Sediment pumping by tidal asymmetry in a partially-mixed estuary. Journal of Geophysical Research 112:
C07028.
St-Hilaire A, Courtenay SC, Diaz-Delgado C, Pavey B, Ouarda TBMJ, Boghen A, Bobee B. 2006. Suspended sediment concentration
downstream of a harvested peat bog: analysis and preliminary modelling of exceedances using logistic regression. Canadian Water Resources
Journal 31(3): 139–156.
Thevenot MM, Kraus NC. 1993. Comparison of acoustical and optical measurements of suspended material in the Chesapeake estuary. Journal
Marine Environment Engineering 1: 65–79.
Thorne PD, Vincent CE, Hardcastle PJ, Rehman S, Pearson N. 1991. Measuring suspended sediment concentrations using backscatter devices.
Marine Geology 98: 7–16.
Voulgaris G, Meyers ST. 2004. Temporal variability of hydrodynamics, sediment concentration and sediment settling velocity in a tidal creek.
Continental Shelf Research 24: 1659–1683.
Vuori K-M, Joensuu I, Latvala J. 1995. Metsaojituksen vaikutukset veden laatuun, pohja-elaimistoon ja taimenen ravintoon Isojoen vesistossa. In
Metsatalouden vesistovaikutukset ja niiden torjunta, Saukkonen K, Kenttamies K (eds). Suomen ymparisto 2. (in Finnish).
Walling DE, Webb BW. 1981. The reliability of suspended sediment load data. In Erosion and sediment transport measurement. Proceedings of
The Florence Symposium. IAHS Publication. No. 133, International Association of Hydrological Sciences, 177–194.
Copyright # 2009 John Wiley & Sons, Ltd. River Res. Applic. 26: 1019–1035 (2010)
DOI: 10.1002/rra