Carbon exchange of grazed pasture on a drained peat soil
12
Carbon exchange of grazed pasture on a drained peat soil JOOST P. NIEVEEN *, DAVID I. CAMPBELL w , LOUIS A. SCHIPPER * and IAN J. BLAIR w *Landcare Research, Private Bag 3127, Hamilton 2001, New Zealand, wDepartment of Earth Sciences, University of Waikato, Private Bag 3105, Hamilton 2001, New Zealand Abstract Land-use changes have contributed to increased atmospheric CO 2 concentrations. Conversion from natural peatlands to agricultural land has led to widespread subsidence of the peat surface caused by soil compaction and mineralization. To study the net ecosystem exchange of carbon (C) and the contribution of respiration to peat subsidence, eddy covariance measurements were made over pasture on a well- developed, drained peat soil from 22 May 2002 to 21 May 2003. The depth to the water table fluctuated between 0.02 m in winter 2002 to 0.75 m during late summer and early autumn 2003. Peat soil moisture content varied between 0.6 and 0.7 m 3 m 3 until the water table dropped below 0.5 m, when moisture content reached 0.38 m 3 m 3 . Neither depth to water table nor soil moisture was found to have an effect on the rate of night- time respiration (ranging from 0.4–8.0 lmol CO 2 m 2 s 1 in winter and summer, respectively). Most of the variance in night-time respiration was explained by changes in the 0.1 m soil temperature (r 2 5 0.93). The highest values for daytime net ecosystem exchange were measured in September 2002, with a maximum of 17.2 lmol CO 2 m 2 s 1 . Grazing events and soil moisture deficiencies during a short period in summer reduced net CO 2 exchange. To establish an annual C balance for this ecosystem, non-linear regression was used to model missing data. Annually integrated (CO 2 ) C exchange for this peat–pasture ecosystem was 45 500 kg C ha 1 yr 1 . After including other C exchanges (methane emissions from cows and production of milk), the net annual C loss was 1061 500 kg C ha 1 yr 1 . Keywords: carbon, drainage, eddy covariance, methane, pasture, peat Received 3 August 2004; revised version received 22 September 2004 and accepted 28 October 2004 Introduction Worldwide, drainage of organic soils for agricultural or forestry purposes have led to vast subsidence of the peat surface, due to changes in physical conditions and acceleration of microbial decomposition. Land-use changes like this have contributed to increased atmo- spheric CO 2 concentrations (Watson et al., 1996). A significant proportion of the global carbon (C) pool is stored as peat, with high latitude peatlands in the northern hemisphere alone estimated to contain one third of the world’s soil C pool (Gorham, 1991). Widespread drainage of temperate peatland ecosystems for agricultural purposes may have had, and may continue to have, significant impacts on the global C balance. Once drained for agriculture, forestry or fuel production, large amounts of C are lost to the atmo- sphere through mineralization, estimated at 30– 370 Mt C yr 1 globally (Armentano, 1980). Reported rates of peat subsidence vary greatly at different sites. For boreal conditions, Minkkinen (1999) reported average subsidence values for old shallow drained peatlands varied between 10 and 30 cm over 50–60 years (0.2–0.6 cm yr 1 ), and between 0 and 25 cm for 15–25 years (0–1.7 cm yr 1 ) for old drained mires, depending on the site type and predrainage peat thickness. Schothorst (1976, 1977) reported subsidence rates of up to 4 m over 130 years (3.1 cm yr 1 ) for drained peatlands in the Netherlands. Average sub- sidence rates of 2–4 cm yr 1 over the last 100 years were found for English fens (Hutchinson, 1980, French & Pryor, 1993), and 2.5 cm yr 1 over the last 70 years in the Florida Everglades (Stephens et al., 1984). In the Waikato region of New Zealand, Schipper & McLeod (2002) demonstrated an average subsidence rate of 3.4 cm yr 1 during 40 years of dairy farming. Correspondence: David I. Campbell, fax 1 64-7-856 0115, e-mail: [email protected] Global Change Biology (2005) 11, 607–618, doi: 10.1111/j.1365-2486.2005.00929.x r 2005 Blackwell Publishing Ltd 607
-
Upload
independent -
Category
Documents
-
view
0 -
download
0
Transcript of Carbon exchange of grazed pasture on a drained peat soil

Carbon exchange of grazed pasture on a drained peat soil
J OO S T P. N I E V E EN *, DAV I D I . C AMP B E L L w , L OU I S A . S CH I P P E R * and I AN J . B L A I R w*Landcare Research, Private Bag 3127, Hamilton 2001, New Zealand, wDepartment of Earth Sciences, University of Waikato,
Private Bag 3105, Hamilton 2001, New Zealand
Abstract
Land-use changes have contributed to increased atmospheric CO2 concentrations.
Conversion from natural peatlands to agricultural land has led to widespread
subsidence of the peat surface caused by soil compaction and mineralization. To study
the net ecosystem exchange of carbon (C) and the contribution of respiration to peat
subsidence, eddy covariance measurements were made over pasture on a well-
developed, drained peat soil from 22 May 2002 to 21 May 2003. The depth to the water
table fluctuated between 0.02m in winter 2002 to 0.75m during late summer and early
autumn 2003. Peat soil moisture content varied between 0.6 and 0.7m3m�3 until the
water table dropped below 0.5m, when moisture content reached 0.38m3m�3. Neither
depth to water table nor soil moisture was found to have an effect on the rate of night-
time respiration (ranging from 0.4–8.0lmolCO2m�2 s�1 in winter and summer,
respectively). Most of the variance in night-time respiration was explained by changes
in the 0.1m soil temperature (r25 0.93). The highest values for daytime net ecosystem
exchange were measured in September 2002, with a maximum of �17.2 lmol
CO2m�2 s�1. Grazing events and soil moisture deficiencies during a short period in
summer reduced net CO2 exchange. To establish an annual C balance for this ecosystem,
non-linear regression was used to model missing data. Annually integrated (CO2)
C exchange for this peat–pasture ecosystem was 45� 500kgCha�1 yr�1. After including
other C exchanges (methane emissions from cows and production of milk), the net
annual C loss was 1061� 500kgCha�1 yr�1.
Keywords: carbon, drainage, eddy covariance, methane, pasture, peat
Received 3 August 2004; revised version received 22 September 2004 and accepted 28 October 2004
Introduction
Worldwide, drainage of organic soils for agricultural or
forestry purposes have led to vast subsidence of the
peat surface, due to changes in physical conditions and
acceleration of microbial decomposition. Land-use
changes like this have contributed to increased atmo-
spheric CO2 concentrations (Watson et al., 1996). A
significant proportion of the global carbon (C) pool is
stored as peat, with high latitude peatlands in the
northern hemisphere alone estimated to contain one
third of the world’s soil C pool (Gorham, 1991).
Widespread drainage of temperate peatland ecosystems
for agricultural purposes may have had, and may
continue to have, significant impacts on the global C
balance. Once drained for agriculture, forestry or fuel
production, large amounts of C are lost to the atmo-
sphere through mineralization, estimated at 30–
370MtCyr�1 globally (Armentano, 1980).
Reported rates of peat subsidence vary greatly at
different sites. For boreal conditions, Minkkinen (1999)
reported average subsidence values for old shallow
drained peatlands varied between 10 and 30 cm over
50–60 years (0.2–0.6 cmyr�1), and between 0 and 25 cm
for 15–25 years (0–1.7 cmyr�1) for old drained mires,
depending on the site type and predrainage peat
thickness. Schothorst (1976, 1977) reported subsidence
rates of up to 4m over 130 years (3.1 cmyr�1) for
drained peatlands in the Netherlands. Average sub-
sidence rates of 2–4 cmyr�1 over the last 100 years were
found for English fens (Hutchinson, 1980, French &
Pryor, 1993), and 2.5 cm yr�1 over the last 70 years in
the Florida Everglades (Stephens et al., 1984). In the
Waikato region of New Zealand, Schipper & McLeod
(2002) demonstrated an average subsidence rate of
3.4 cmyr�1 during 40 years of dairy farming.Correspondence: David I. Campbell, fax 1 64-7-856 0115,
e-mail: [email protected]
Global Change Biology (2005) 11, 607–618, doi: 10.1111/j.1365-2486.2005.00929.x
r 2005 Blackwell Publishing Ltd 607

It is unclear how much of the subsidence is due to
either microbial respiration or compaction/shrinkage.
Eggelsman (1976) found that as time progressed after
drainage, subsidence was increasingly due to respira-
tion. Stephens & Speir (1969) estimated respiration
accounted for as much as 75% of total subsidence in the
Everglades agricultural area. In New Zealand, Schipper
& McLeod (2002) attributed 37% of the subsidence to
respiration during the first 40 years of development.
Glenn et al. (1993) calculated that only 10% of the
subsidence could be attributed to the respiration of
drained peat soils in Canada. Measurements made by
Dirks et al. (2000), suggested a minor contribution of
respiration to subsidence for intensively managed peat
pastures in the Netherlands. The differences in the
proportion of respiration between these studies might
be due to differences in peat structure, C :N ratio,
drainage depth, climate, and cultivation practice
(Kasimir-Klemedtsson et al., 1997) or chemical proper-
ties of the peat-forming plants (Kuder et al., 1998).
To comply with the Kyoto protocol, an accurate C
balance is of great importance for New Zealand.
Additionally, concerns increase over the subsidence of
farmed organic soils in New Zealand. Systematic
drainage may not only lead to increased greenhouse
gas emissions, but may also increase the risk of surface
flooding, or increase the costs of draining land near to
sea level. Our objectives were to determine the net flux
density of C from these peat soils used for dairy
farming. We report on the year-round measurements of
net ecosystem CO2 exchange using the eddy covariance
(EC) technique, and on the magnitude of daytime and
night-time CO2 flux densities, and identify environ-
mental factors and management practices that regulate
CO2 exchange at paddock and farm scales. Finally, an
annual C balance is established, taking into account
estimates of other important C sinks/sources, such as
methane emissions from cows and the production of
milk, in order to assess the contribution of respiration to
subsidence for this well-developed peatland system.
Materials and methods
Site description
When the Waikato River, on the North Island of New
Zealand, took its final course some 18 000 years ago,
low-lying land was left behind in between old river
courses. In the low areas, impervious fine pumiceous
silt in combination with a high water table favoured
development of swamp vegetation. Over time, exten-
sive peat bogs were formed by the accumulation of
organic matter, primarily of vascular plants such
as wire rush (Empodisma minus) and cane rush
(Sporodanthus ferrugineus). In the early 1900s, around
110 000 ha of peat bog covered the Waikato Region
(Clarkson, 2002). Since then the area has been drained
extensively and much of the peatland has been
converted into pasture.
Measurements for this study were made at the
Rukuhia peatland (6400 ha), southwest of Hamilton in
the Waikato region, New Zealand (latitude 371510S,
longitude 1751140W, elevation 40m), from 22 May 2002
to 21 May 2003. This agricultural area consists mainly of
pasture for dairy farming and was one of the first peat
bogs in the Waikato to be converted to dairying in the
1940s. Pastures were developed on 10–12m deep, rush
and sedge peat. The measurement site was situated on
a dairy farm with drainage ditches (o2m deep)
surrounding clusters of paddocks and shallow drains
(o0.4m) crossing single paddocks (see Fig. 1). The
vegetation at the site was a mixture of perennial
ryegrass (Lolium perenne) and white clover (Trifolium
repens). The paddock, in which the measurements took
place, and the surrounding paddocks were grazed at
irregular intervals, about eight times during the study
period. Footprint analysis (Schuepp et al., 1990)
estimated a fetch distance ranging from 150 to 500m,
in most cases sufficient for multi-paddock measure-
ments (Fig. 1). The dry bulk density of the peat soil at
the site was 336 kgm�3.
Instrumentation
A 4.5m tower was used to accommodate an EC system
at a height of 4.25m. The system consisted of: a 3-D
380 m
60 m
To main drains
Farm road
EC tower
Fig. 1 Farm drainage diagram, showing the 1m deep farm
drains surrounding 380m� 60m paddocks (thick lines) and the
0.3m deep ‘spinner’ drains crossing individual paddocks (thin
lines). Farm drains discharge to the regional drainage system
shown by the arrows. The dashed circle indicates the minimum
flux source area around the eddy covariance tower (radius
150m) from which at least 80% of the measured flux density
originates (Schuepp et al., 1990).
608 J . P. N I E V E EN et al.
r 2005 Blackwell Publishing Ltd, Global Change Biology, 11, 607–618

sonic anemometer (CSAT3, Campbell Scientific Inc.,
Logan, UT, USA) and an air intake tube mounted on the
frame of the CSAT3 and leading down to a closed-path
infrared CO2/H2O gas analyser, IRGA (LI-6262, LI-
COR Inc., Lincoln, NE, USA). At the same height, air
temperature and humidity (HMP 35C,Vaisala, Finland)
were measured, and atmospheric pressure was mea-
sured near the tower base (PTB100, Vaisala, Finland).
The IRGA was housed in a temperature-controlled
part of an insulated aluminium box, which further
contained: two 12V DC suction pumps (TD–4X2N,
Brailsford & Co., Rye, NY, USA) in parallel to sample
the air; power supplies; relays; solenoids; a laptop
computer and a control data logger (CR10X, Campbell
Scientific Inc.). Flow rate through the system was
8Lmin�1, resulting in a delay of about 15 samples
between the CSAT3 and the LI-6262 signals. The
reference cell of the IRGA was kept free of water
vapour and CO2 by a steady flow of nitrogen gas at a
rate of 40 cm3min�1.
To overcome condensation in the sample gas flow
path, the 5.2m intake tube (0.004m i.d., Dekabon type
1300 Olex Cables Inc., Melbourne, Australia) was
encircled with three sets of nichrome heater wire at
different heights along the tube and insulated with
closed cell tubing (Aeroflex International, Samutpra-
kan, Thailand). Heat generated inside the aluminium
box convected up the insulating tubing to 3m height to
warm the sampling tube. In addition, the heater wire
could be controlled by the data logger to maintain the
temperature inside the tube above the dew-point
temperature of the air.
The gas analyser was calibrated every 24 h by
automatic shunting of bottled zero N2 and span
(368.0 � 0.1 ppmv CO2 in air) gases to the intake end
of the sample line, with solenoid valves under the
control of a data logger. A dew-point hygrometer
provided a reference humidity measurement (Dew-10,
General Eastern Instruments, Woburn, MA, USA). Its
accuracy was frequently checked with a dew-point
generator (LI-610, LI-COR Inc.).
Incoming global radiation (LI-200SA, LI-COR Inc.)
and photosynthetic active radiation (LI-190SA, LI-COR
Inc.) were measured at 4.5m height. A separate mast,
close to the main tower, was used to mount a net
radiometer (Q6.7.1, Radiation and Energy Balance
Systems, Seattle, WA, USA), a cup anemometer and a
wind vane (A101M & W200P, Vector Instruments,
Clwyd, UK) all at 1.5m. Soil heat flux was measured
with two soil heat flux plates (2�HFT3, Radiation and
Energy Balance Systems) buried at 0.05m. Soil tem-
peratures were monitored at 0.025, 0.1 and 0.2m
respectively, using one four-junction averaging thermo-
couple (TCAV, Campbell Scientific Inc.) and two
thermistors. The soil volumetric water content was
measured using two water content reflectometers
(CS615, Campbell Scientific Inc.), one installed horizon-
tally at 0.05m depth; the other vertically in the layer
0–0.3m. The water table was monitored using a pres-
sure sensor (SS3, Instrument Services & Developments,
Rangiora, New Zealand).
Data acquisition and processing
A CR10X data logger sampling at 10Hz measured the
signals from the IRGA and ultrasonic anemometer.
These data were downloaded every minute to a laptop
computer and stored on the computer’s hard drive in
half-hourly binary data files using a custom software
program, and backed up weekly on a recordable CD.
All supporting instruments were measured with two
additional CR10X data loggers and stored as 30-min
averages. These averages were downloaded hourly to
the same laptop computer and stored on the hard drive.
Back ups were made via a telemetry system (PCAny-
where 9.2.1, Symantec Corporation, Cupertino, CA,
USA) allowing access to both stored and real-time data.
A Matlab 5.2 (The Mathworks Inc., Natick, MA, USA)
software program was used to post-process the
accumulated EC data files. The raw data were checked
for spikes, either identified by a CSAT3 diagnostic sig-
nal or apparent high values of the vertical wind speed
(4100ms�1), sonic temperature (460 1C), and CO2 or
H2O concentration (1200mmolmol–1 and 50 gm�3 re-
spectively). Following Schmid et al. (2000), large short-
lived departures from the mean (‘soft spikes’) were
identified in an iterative procedure. Both types of spikes
were removed from the dataset. If after filtering less
than 67% of the data remained, the covariances were
treated as missing for a given 30min period.
After filtering, density corrections (Webb et al., 1980),
co-ordinate rotation corrections (McMillen, 1986), sonic
temperature corrections (Schotanus et al., 1983) and
frequency response corrections (Moore, 1986) were
applied to calculate half hourly averaged flux densities.
CO2 storage corrections were calculated (Hollinger
et al., 1995), but were found to be several orders of
magnitude smaller than the measured flux density.
Results and discussion
Meteorological and soil conditions
Figure 2 summarizes the meteorological conditions
during the measuring period. The annual 30-year
normal of the total incoming global radiation (K#) was
4% higher than the measured 5137.9MJm�2 yr�1. The
total of 1281mm precipitation during the measurement
CAR BON EXCHANGE ON A DRA IN ED P EAT SO I L 609
r 2005 Blackwell Publishing Ltd, Global Change Biology, 11, 607–618
5
10
15
20
25
May 02 Jun 02 Jul 02 Aug 02 Sep 02 Oct 02 Nov 02 Dec 02 Jan 03 Feb 03 Mar 03 Apr 03 May 03 Jun 03
Date
Tem
per
atu
re (
°C)
0
0.1
0.2
0.3
0.4
0.5
0.6
0.7
0.8
0.9
Dep
th t
o w
ater
tab
le (
m)
0
10
20
30
40
50
60
70
Pre
cip
itat
ion
(m
m)
0
0.1
0.2
0.3
0.4
0.5
0.6
0.7
Vo
lum
etri
c m
ois
ture
co
nte
nt
(m3
m−3
)
0
5
10
15
20
25
Glo
bal
rad
iati
on
(M
J m
−2 d
ay−1
)2002−2003
Normal
(a)
(b)
(c)
(d)
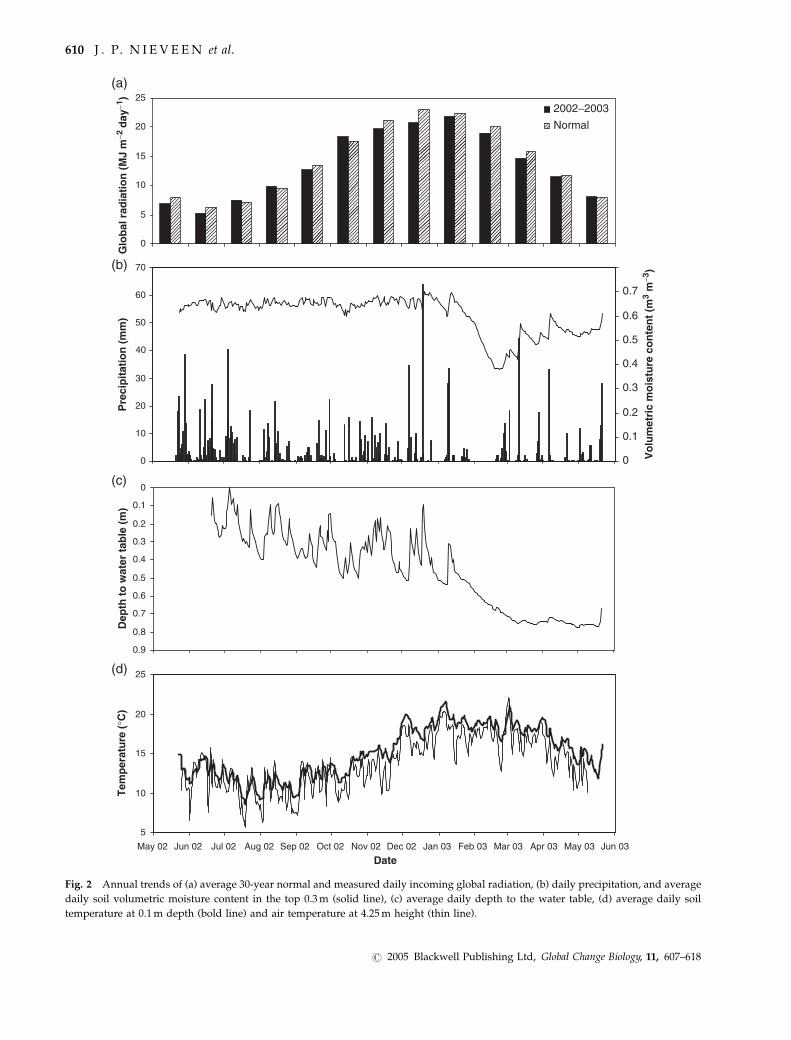
Fig. 2 Annual trends of (a) average 30-year normal and measured daily incoming global radiation, (b) daily precipitation, and average
daily soil volumetric moisture content in the top 0.3m (solid line), (c) average daily depth to the water table, (d) average daily soil
temperature at 0.1m depth (bold line) and air temperature at 4.25m height (thin line).
610 J . P. N I E V E EN et al.
r 2005 Blackwell Publishing Ltd, Global Change Biology, 11, 607–618

period was comparable to the 30-year normal of
1252mm. While May, June, and July 2002 were wetter,
August, September, and October were drier than
normal. February and April 2003 were extremely dry
(Fig. 2b) with average rainfall for these months less
than 50% of the 30-year normal.
The dry period is also clearly visible in the decline in
volumetric soil moisture content (yv) and depth to the
water table (DWT) (Fig. 2b and c). Daily average yvranged between 0.6 and 0.7m3m�3 until the soil dried
out in February 2003. During this month the average yvreached a minimum value of 0.38m3m�3 in the top
0.3m and as low as 0.3m3m�3 at 0.05m depth. In the
subsequent months, the average yv gradually increased
again to 0.62 m3m�3 by the end of May 2003. DWT
ranged from 0.02m briefly in July 2002 to 0.75m in
March, April and May 2003, with an average of 0.46m.
Daily average soil temperature at 0.1m depth (Ts)
ranged from 19.4 1C in January 2003 to 10.9 1C in
August 2002 (Fig. 2d). The average annual soil
temperature was within 1.3 1C of the 30-year normal
temperature at 0.1m, measured at a nearby weather
station. Except for the summer months (December 2002
to March 2003) the monthly average soil temperatures
were higher than the monthly 30-year normal soil
temperatures (by 1.7–4.2 1C). During the summer
months, the 0.1m average soil temperatures were
within 1.1 1C of the normal.
Air temperature (Ta) at 4.25m height showed an
average daily maximum in March 2003 of 22.0 1C and a
minimum of 5.8 1C in August 2002. Although the
annual mean air temperature equalled the 30-year
normal (13.8 1C), the measured monthly average tem-
peratures from October 2002 to April 2003 were lower
(by 0.1–1.4 1C) than the 30-year normal monthly
averages and were higher from May 2002 to September
2002 (by 0.3–2 1C).
In summary, the measurement period was character-
ized by near normal air temperatures, and higher soil
temperatures most of the time, except during summer
and non-limiting soil moisture conditions from May
2002 to early January 2003. A short, relatively dry
period in January and February caused a soil moisture
deficit, but this was restored by rain events during late
February and March 2003.
Night-time net ecosystem exchange
Respiration rates of peat increase with soil temperature,
hence the low CO2 emissions from boreal peat
ecosystems (Glenn et al., 1993; Silvola et al., 1996) and
the higher oxidation rates in the lower latitudes (Tate,
1980). Respiration rates from peat soils are commonly
dependent on DWT since aerobic microbial activity
increases with a decrease in DWT (Andreis, 1976;
Stephens et al., 1984; Hodge, 2002). Figure 2d and c,
respectively, shows the daily averages of soil tempera-
ture and DWT during the field study.
To establish a relationship between total ecosystem
respiration (Re) and soil temperature, measured half
hourly averaged net ecosystem CO2 exchange (NEE)
was used (Fig. 3). Measurements were only included
when average friction velocity (u*) exceeded 0.15m s�1
and K # was zero. We fitted a Lloyd & Taylor (1994,
Eqn (11)) model:
Re ¼ R10 e308:56 1
56:02� 1Ts�227:13ð Þ; ð1Þ
where Ts is in Kelvin, and determined an R10 of
2.32 � 0.02mmol CO2m�2 s�1 (mean � SE; r25 0.51;
n5 1990). This factor is the sum of plant and soil
respiration at 10 1C. Due to the nature of night-time EC
measurements and varying contribution of plant
respiration to Re, there was a considerable amount of
scatter in the data. To overcome this, the data were
averaged in 1 1C bins and plotted, and the R10 value
was recalculated to be 2.44 � 0.06mmol CO2m�2 s�1
(mean � SE; r25 0.93).
Unexpectedly, we did not observe increases in night-
time respiration as DWT increased. Silvola et al. (1996)
previously found an increase in CO2 emissions from
peat soil when DWT increased to depths of 0.3–0.4m.
Here, as the DWT grew the air-filled porosity would
increase and support greater aerobic degradation of
peat. While DWT varied greatly at our field site it was
rarely water logged due to the extensive drainage
system (see Figs 1 and 2). Increasing the DWT had little
impact on yv until DWT fell below about 0.5m during
January 2003 (Figs 2 and 4). Therefore, oxygen avail-
0
2
4
6
8
10
8 10 12 14 16 18 20 220
0.1
0.2
0.3
0.4
NE
E (
µm
ol m
−2 s
−1)
Soil temperature (°C)
NE
E (
mg
m−2
s−1
)
Fig. 3 Measured 30min averages of the night-time net ecosys-
tem CO2 exchange (NEE) vs. 0.1m soil temperature (Ts), where
friction velocity, u*40.15m s�1. Solid curve represents the Lloyd
& Taylor (1994) model fitted to 1 1C binned 30min averages
(r25 0.93).
C A R BON EXCHANGE ON A DRA IN ED P EAT SO I L 611
r 2005 Blackwell Publishing Ltd, Global Change Biology, 11, 607–618

ability in peat would have been fairly constant and with
it the effect on soil respiration. Even when the DWT fell
below about 0.5m and yv declined to a minimum of
0.38m3m�3 in the top 0.3m, we found no evidence that
either DWT or yv reduced respiration rates, in contrast
to the findings of others (Baldocchi, 1997; e.g. Hunt
et al., 2002). This left soil temperature as the major
driving variable for respiration.
The R10 we determined is different from that
measured in other peat studies. Smith (2003) measured
an R10 of 1.6 mmolCO2m�2 s�1 for a nearby peat
bog with soil moisture contents ranging between
0.04–0.27m3m�3. Here, among other reasons the
relatively drier peat might have limited respiration.
Lohila et al. (2003) measured an R10 of 3.1 � 0.34mmol
CO2m�2 s�1 (mean � SE) from the peat soil under
pasture (yv5 0.2–0.55m3m�3). For a waterlogged
Dutch restored peat bog, on the other hand, Nieveen
et al. (1998) observed a total ecosystem R10 of
1.3mmolCO2m�2 s�1, which may indicate anaerobic
conditions.
Between May 2002 and May 2003 nocturnal respira-
tion (soil and plant) averaged 3.19 mmolCO2m�2 s�1
with average night-time soil temperatures at 0.1m
depth ranging between 9.1 1C and 22 1C. Average noc-
turnal respiration rates were lowest (0.4mmolCO2
m�2 s�1) in August 2002 (Ts5 11.3 1C; yv5 0.72m3m�3),
and greatest in summer (9.3mmolCO2m�2 s�1) after a
rain event following a dry period in early March 2003
(Ts5 21.2 1C; yv5 0.43m3m�3).
Lohila et al. (2003) found higher total ecosystem
respiration rates from pasture on peat in southern
Finland with values ranging between 5.2 and 20.5 mmol
CO2m�2 s�1 (Ts (4 cm)5 8–31 1C; yv5 0.2–0.55m3m�3).
Smith (2003) measured average respiration of 1.77mmol
CO2m�2 s�1 and a maximum of 6.0 mmolCO2m
�2 s�1
from a peat bog with restiad vegetation in New Zealand
(Ts (8 cm)5 4–20 1C; yv5 0.04–0.27m3m�3).
Daytime net ecosystem exchange
The climate of the Waikato allows for year-round
growth and grazing of pasture. The highest values for
daytime NEE were found in September 2002, with a
maximum of �17.2mmol CO2m�2 s�1 around noon.
This was higher than observed using chambers for
pasture on peat soil in Finland, where maximum
uptake only reached �9.3mmol CO2m�2 s�1 (Maljanen
et al., 2001). However, respiration rates at Rukuhia were
much higher as a result of higher soil temperature.
Grazing took place at irregular intervals on the
paddocks within the flux footprint. In some cases, the
effect of grazing was clearly visible in the daytime NEE.
In others, the relative source area or footprint of the
measured flux density suppressed this effect. Grazing
time and intensity also decreased during the milking
season, causing the grazing impact to diminish. Figure
5 shows the NEE light response for 2 months. In early
August 2002, paddocks within the flux footprint area
were intensively strip-grazed for 6 consecutive days,
removing most of the above-ground photosynthetic
tissue. This area was not grazed again until October
2002, which resulted in a considerably higher NEE in
September 2002 than August. Following Goudriaan et al.
(1985), data were fitted with an asymptotic exponential
allowing for saturation at higher PPFD, given by
NEE ¼ Re � Am þ Rdð Þ 1e�aPPFDAm þ Rd
� �� �� Rd
� �; ð2Þ
0.4
0.5
0.6
0.7
0 0.1 0.2 0.3 0.4 0.5 0.6 0.7
So
il m
ois
ture
co
nte
nt
(m3
m−3
)
Depth to water table (m)
Fig. 4 Average daily soil volumetric moisture content in the
top 0.3m vs. daily average depth to the water table.
− 20
− 15
− 10
− 5
0
5
100 500 1000 1500 2000
− 0.8
− 0.6
− 0.4
− 0.2
0
0.2
0.4
NE
E (
µm
ol m
−2 s
−1)
NE
E (
mg
m−2
s−1
)
PPFD (µmol m−2 s−1)
Fig. 5 Daytime 30min averages of the net ecosystem CO2
exchange (NEE) as a function of photosynthetic photon flux
density (PPFD) for August 2002 after intensive grazing (solid
circles) and September 2002 with no grazing (open circles). Data
for both months are fitted with an asymptotic exponential
function (August 2002 r25 0.83; September 2002 r25 0.91).
612 J . P. N I E V E EN et al.
r 2005 Blackwell Publishing Ltd, Global Change Biology, 11, 607–618

where Am is the maximum NEE at high photosynthetic
photon flux density (mmolm�2 s�1), PPFD the photo-
synthetic photon flux density (mmolm�2 s�1), and a the
initial light use efficiency for fixing CO2 (mmolCO2mmol�1 PPFD). PPFD was calculated from K# (Varlet-
Grancher et al., 1981), due to a faulty quantum sensor. Rd
is the dark respiration of the plants. As Rd is included in
the measured Re, the Rd parameter in Eqn (2) should be
small compared to Re. For both months, NEE did
not meet its asymptotic value (Am) or light saturation
with a PPFD of 1850mmolm�2 s�1. The initial light
use efficiency was higher in September (0.027
mmolmmol�1) than in August (0.015mmolmmol�1). Simi-
lar a values to September were found for other closed
grassland canopies (Ruimy et al., 1995) and a grass-
dominated restored peat bog in the Netherlands
(Nieveen et al., 1998). In August, a was probably lower
due to a decrease in leaf area index (LAI) and damage to
the canopy from grazing.
During the summer months, yv in the top 0.3m
gradually declined from a maximum of 0.74m3m�3 in
December 2002 to a minimum of 0.36m3m�3 (Fig. 2b).
Past measurements in the same location showed
moisture content around 0.2m3m�3 to be the wilting
point (Joe, 1986). Figure 6 presents the daytime, half-
hourly NEE data plotted against the photosynthetic
photon flux density for December 2002 and February
2003. These data were fitted with an asymptotic
exponential as given in (2). Both fits show light
saturation at PPFD � 1500mmolm�2 s�1, and a similar
initial light use efficiency 0.023 � 0.002 mmol mmol�1
and 0.021 � 0.002mmol mmol�1 (mean � SE) for Decem-
ber and February respectively. However, Am in Febru-
ary 2003 was about 45% lower than Am in December
2002, despite the grass being grazed more frequently in
December. There were similar respiration rates for both
months. This demonstrates the likely response of the
grass to limiting soil moisture conditions during
February 2003 (Fig. 2b).
The hypothesis that soil moisture limited photo-
synthesis (and, therefore, NEE) in February was
supported by a comparison of the measurements, bin-
averaged by time of the day (u*40.15m s�1), in
December 2002 and February 2003. In December 2002
the ensemble average daytime NEE peaked around
noon (Fig. 7e), in phase with the daily trend in PPFD
(Fig. 7a). For February 2003, however, the peak NEE
shifted towards early morning and declined about 2/3
in magnitude. This could be due to the higher D late
morning and afternoon (Fig. 7d), causing lower
stomatal conductances when D is higher than 1 kPa.
However, Fig. 7f shows the diurnal course of NEE and
D for two specific days in December 2002 and February
2003. While D followed the same course and had the
same magnitude for both days, NEE showed the same
trends as the ensemble average NEE for the respective
months (Fig. 7e). This was most likely due to lower
stomatal conductances in February caused by low soil
water status (Fig. 7c). Similar response of the vegeta-
tion to high D was reported for water-stressed
deciduous savannah (Verhoef et al., 1996) and tussock
grassland in New Zealand during a summer drought
(Hunt et al., 2002).
C balance
The primary objective of this study was to determine
net annual flux of C from this peat–pasture system used
for dairying. The EC technique, unfortunately, never
achieves 100% data coverage for a variety of reasons
(e.g. Baldocchi, 2003). To establish the CO2 component
of the annual C balance, gap-filling strategies were
needed. For the year-round measurement period, valid
data were obtained for 45% of the half-hourly periods.
About 30% of the rejected data were measurements
during periods of light wind and low friction velocity
(u*o0.15m s�1).
Non-linear regression methods were used to model
missing and unreliable data (Falge et al., 2001). Night-
time data were gap-filled using Eqn (1) and R105
2.44 mmolCO2m�2 s�1, with soil temperature at 0.1m as
the forcing variable. This relationship was also used to
correct for periods with insufficient turbulent mixing
(u*o0.15m s�1). Missing half-hourly daytime data
were filled by establishing a model for gross ecosystem
CO2 production (GEP) from NEE as a function of PPFD,
− 20
− 15
− 10
− 5
0
5
100 500 1000 1500 25002000
− 0.8
− 0.6
− 0.4
− 0.2
0
0.2
0.4
NE
E (
µm
ol m
−2 s
−1)
NE
E (
mg
m−2
s−1
)
PPFD (µmol m−2 s−1)
Fig. 6 Daytime 30min averages of the net ecosystem CO2
exchange (NEE) as a function photosynthetic photon flux
density (PPFD) for December 2002 with abundant soil moisture
(open circles) and February 2003 with lower soil moisture (solid
circles). Data for both months are fitted with an asymptotic
exponential function (December 2002 r25 0.67; February 2003
r25 0.68).
C A R BON EXCHANGE ON A DRA IN ED P EAT SO I L 613
r 2005 Blackwell Publishing Ltd, Global Change Biology, 11, 607–618

and modelled total ecosystem respiration Re using Eqn
(1) and R105 2.44 mmolCO2m�2 s�1. GEP is given by
(GEP5Re�NEE). NEE was determined as a function of
PPFD for each month, to incorporate the effect of
different environmental factors, such as soil water
deficiencies and grazing cows, on photosynthesis. We
are aware that using monthly-pooled data to develop
light response curves could be too long a period,
because of changing environmental factors and plant
conditions that alter the light response. However, our
ecosystem is constantly changing due to grazing of the
farm paddocks and different growth stages of the
different paddocks. This is in contrast to other slower
growing/changing systems, such as: prairie or tussock
grasslands, and commercial crops. The continuously
varying flux density source area, sometimes by the
hour, will, in our opinion, overshadow any other factor,
justifying the use of monthly pooled data.
Figure 8 shows the averaged NEE for the year from
June 2002 to May 2003. Here, positive values indicate
net loss of CO2 during that month, while negative
values mean net sequestration. During 7 months of the
year, the peat–pasture ecosystem was a net source of
CO2, with March 2003 being the largest source of
0
500
1000
1500
2000
PP
FD
(µ
mo
l m−2
s−1
)
17
18
19
20
Ts
(°C
)
0.3
0.4
0.5
0.6
0.7
0.8
Θv
(m3
m−3
)
− 10
− 5
0
5
10
0 4 8 12 16 20 24
NE
E (
µm
ol m
−2 s
−1)
− 10
− 5
0
5
10
NE
E (
µm
ol m
−2 s
−1)
Time (h)
0 4 8 12 16 20 24
Time (h)
0
0.5
1
1.5
D (
kPa)
0
0.5
1
1.5
2
D (
kPa)
(a)
(c)
(e)
(b)
(d)
(f)
Fig. 7 Diurnal courses, bin-averaged by the time of the day and filtered for friction velocity, u*4 0.15ms�1, for December 2002
(circles, solid line) and February 2003 (diamonds, dashed line) of (a) photosynthetic photon flux density (PPFD), (b) 0.1m soil
temperature (Ts), (c) soil volumetric moisture content in the top 0.3m (yv), (d) saturation vapour pressure deficit (D) and (e) net
ecosystem CO2 exchange (NEE). Also shown, in (f), are daytime net ecosystem CO2 exchange (NEE) and saturation vapour pressure
deficit (D) for 29 December 2002 (circles) and 15 February 2003 (diamonds).
614 J . P. N I E V E EN et al.
r 2005 Blackwell Publishing Ltd, Global Change Biology, 11, 607–618

1.37mmol CO2m�2 s�1 (1.42 gCm�2 day�1), and August
2002 the smallest with 0.05mmolCO2m�2 s�1 (0.05 g
Cm�2 d�1). For 5 months of the year, the peat–
pasture ecosystem acted as a net sink for CO2. The
sink strength ranged from �1.67mmolCO2m�2 s�1
(�1.73 gCm�2 day�1) in September 2002 to �0.33mmol
CO2m�2 s�1 (�0.34 gCm�2 d�1) in December 2002.
Clearly visible is the effect of grazing on the average
CO2 exchange in August 2002 as described previously.
Furthermore, a switch from sink to a source of CO2
corresponds to the drought period in January and
February 2003.
For the entire measurement period (22 May 2002 to 21
May 2003), the annual CO2 balance for this peat-pasture
ecosystem was 164 kg CO2ha�1 yr�1 (45 kgCha�1 yr�1;
i.e. a source of CO2). Due to the instrumental set-up, the
annual CO2 balance might not be representative for the
whole farm. The height of the EC sensors caused the
flux source area to be limited to a maximum 500-m
radius around the tower. This meant that for certain
wind directions flux densities were biased towards
more local conditions. This was especially the case for
the measurements in August 2002, where grazing had a
large impact on NEE (Fig. 5). Here, a prevailing
westerly wind captured much of the grazed paddock
in the flux source area during the whole month. By
modelling the complete month of August 2002 using
the GEP–PPFD relationship for the total data set
and the measured soil temperature to calculate Re, the
areal annual exchange becomes �731 kgCO2ha�1 yr�1
(�199 kgCha�1 yr�1), i.e. a C sink. This shows the
significant effect of a single grazing event.
Quantifying errors in annual C exchange is compli-
cated, in part because of a lack of independent data for
verification. The effects of random errors caused by
sampling inadequacies and regression-based gap-filling
methodologies tend to diminish as the length of data set
increases (Falge et al., 2001). Baldocchi et al. (2001) used
the method of Moncrieff et al. (1996) to estimate an
annual random error contribution of � 530 kgCha�1
yr�1 for closed path EC systems similar to that used in
this study. Similar confidence ranges have been found
for a number of other studies at ideal sites (Baldocchi,
2003) using a variety of methodologies, so we adopt an
indicative ‘confidence range’ for annual summed NEE
of � 500 kgCha�1 yr�1.
Systematic errors in EC flux data are difficult to
detect. However, EC system design and data processing
focus on eliminating these sources of error, for e.g. the
application of spectral and air density corrections, and
rejecting measurements during periods of light winds.
A common check on EC measurements of the con-
vective energy fluxes is energy balance closure. In this
study, we achieved an energy balance closure ratio (the
sum of half-hour latent, lE, and sensible, H, heat fluxes
divided by the available energy, calculated as the
difference between the net radiation, Rn, and soil heat,
G, fluxes) of 80%, suggesting that H and lE were
systematically underestimated by approximately 20%
(ignoring likely errors in Rn and G). If CO2 exchanges
are similarly affected (Goulden et al., 1996; Twine et al.,
2000), our measured exchange of 45 kgCha�1 yr�1 may
be systematically underestimated by about 9 kgCha�1
yr�1. However, Baldocchi (2003) cautions against
adjusting NEE for lack of energy balance closure.
Applying an indicative confidence range (Baldocchi
et al., 2001), our annual C exchange measured by EC is
45 � 500 kgCha�1 yr�1. It is not possible to state cate-
gorically whether the peat-pasture system was a net
source or sink of CO2 for the period June 2002–
May 2003.
There are other C sinks and sources that should be
included in the annual farm C balance. Figure 9 depicts
the major components of the C balance, which are: CO2
exchange through photosynthesis and respiration as
measured; CH4 emissions through the digestion of
grass by cows; the removal of C through the export of
milk from the farm.
In New Zealand, Laubach & Kelliher (2004) recently
measured an average CH4 emission rate of grazing
dairy cows of 330 � 20 g CH4 per cow per day (mean
� 2� SE). At an average 3.1 cowsha�1 for the farm
this means an additional loss of 278 � 17 kgC
ha�1 yr�1. Several authors have reported on the CH4
emissions from drained organic soils (Glenn et al., 1993;
e.g. Nykanen et al., 1995; Van den Pol-van Dasselaar
− 2
− 1.5
− 1
− 0.5
0
0.5
1
1.5
− 2
− 1.5
− 1
− 0.5
0
0.5
1
1.5
Jun
02
Jul 0
2
Aug
02
Sep
02
Oct
02
Nov
02
Dec
02
Jan
03
Feb
03
Mar
03
Apr
03
May
03
Month
NE
E (
µm
ol C
O2
m−2
s−1
)
NE
E (
g C
m−2
day
−1)
Fig. 8 Monthly variation in net ecosystem exchange (NEE)
expressed in mmol CO2m�2 s�1 and gCm�2 d�1 for the period
between June 2002 and May 2003. Negative values indicate
fixation of CO2 or C, while positive values denote a net release of
CO2 or C.
C AR BON EXCHANGE ON A DRA IN ED P EAT SO I L 615
r 2005 Blackwell Publishing Ltd, Global Change Biology, 11, 607–618

et al., 1998). All found that drained organic soils used
for farming were a negligible source or sink of CH4.
In the year June 2002–May 2003, the farm produced
345 000 kg milk solids from 1200 cows grazing 390 ha.
Each kilogram of milk solids is equivalent to 0.834 kg
of C (Wells, 2001). Therefore C export from the farm
as milk was 738 kgCha�1 yr�1. There is negligible error
in this term because of accurate farm production
accounting.
C exported as CH4 and milk is obtained from pasture
(and a small proportion of crops) grown on the farm. A
New Zealand cow requires dry matter containing
approximately 7 kg C (assume � 10%) to produce 1 kg
of milk solids, so that a total of 6192 � 620 kg
Cha�1 yr�1 in dry matter was consumed. No supple-
mentary feed was imported onto the farm.
Dry matter produced by cows in the form of faeces
(6192–738–2785 5176 � 620 kgCha�1 yr�1) is assumed
to decompose and respire completely, and is measured
as part of NEE by the EC system, along with soil, grass
and cow respiration.
Thus, after about 60 years of dairying, total C
exchange was 1061 � 500 kgCha�1 yr�1 (451 7381
278 kgCha�1) for this well-developed peatland system.
This loss is substantially less than that reported by
Schipper & McLeod (2002), who estimated long-term
losses of 3700 kgCha�1 yr�1 (95% confidence interval of
2500–5000 kgCha�1 yr�1) by comparing cores taken
from a peat bog with those from adjacent farmland.
However, this long-term rate included initial drainage
and establishment of pasture when rates were likely to
be much greater.
Summary
Pastures on peat in the Waikato region have been used
for dairy farming for over 60 years. We estimated C loss
of 1061 � 500 kgCha�1 yr�1, significantly less than
average losses of 3700 kgCha�1 yr�1 estimated for the
first 40 years following pasture development at a
nearby farm (Schipper &McLeod, 2002). Taken together
these studies indicate that initially high C losses
following conversion to pasture decline with time.
We determined that only 45 � 500 kgCha�1 yr�1 was
lost through the imbalance in CO2 exchange, measured
by EC. A single severe grazing event near the EC tower
in August 2002 had a dramatic effect on annual CO2
exchange, and we estimated that without this event,
annual CO2 losses would have been reduced by
approximately 244 kgCha�1 yr�1.
Respiration was found to be independent of the soil
moisture content in a range between 0.38 and
0.67m3m�3, but highly dependent on soil temperature.
Fitted with a Lloyd & Taylor-type model an R10 value of
2.44 mmolCO2m�2 s�1 was established. Most of the
variation in daytime CO2 exchange was explained by
either grazing events or by limiting soil moisture
conditions slowing down photosynthesis.
Of the three pathways for C loss from the pasture/
soil system, CH4 was of a similar magnitude
(278 � 17 kgCha�1 yr�1) to CO2, and the C content of
milk solids was significantly larger (738 kgCha�1 yr�1).
While the magnitudes of CH4 and milk production are
likely to remain relatively constant, or increase only
slightly with intensification of farming practices, the net
exchange of CO2 is strongly affected by both climate
and grazing management, so will vary considerably
from year to year.
Acknowledgements
The authors would like to thank the Wallace Corporation for ac-cess to the field site, in particular Nick Rowe and other farm stafffor general logistics, and Terry Truitt for providing farm pro-duction statistics. We would also like to thank Hort Research, inparticular Mark Astill and Philip Prendergast for kindly lendingus their CSAT3, and John Hunt for his useful comments on thismanuscript. We acknowledge that the suggestions of threeanonymous referees have significantly improved this paper.
References
Andreis HJ (1976) A water table study on an Everglades peat
soil: effects on sugarcane and on soil subsidence. Sugar Journal,
39, 8–12.
Fig. 9 Overview of the C flux densities of grazed pasture on
peat with units kgCha�1 yr�1. On the left, C flux density
consists of the net ecosystem CO2 exchange through photo-
synthesis, soil and plant respiration (�13 4861 13 5315 45 kg
Cha�1 yr�1). On the right is the conversion of dry matter from
grass into milk solids (milk, 738 kgCha�1 yr�1) and methane
(CH4, 278 kgCha�1 yr�1). C stored in dry matter produced by
cows (DM, 6192–738–2785 5176 kgCha�1 yr�1) is assumed to
decompose and respire completely, and is measured by the eddy
covariance system.
616 J . P. N I E V E EN et al.
r 2005 Blackwell Publishing Ltd, Global Change Biology, 11, 607–618

Armentano TV (1980) Drainage of organic soils as a factor in the
world carbon cycle. BioScience, 30, 825–830.
Baldocchi DD (1997) Measuring and modeling carbon dioxide
and water vapour exchange over a temperate broad-leaved
forest during the 1995 summer drought. Plant Cell Evironment,
20, 1108–1122.
Baldocchi DD (2003) Assessing the eddy covariance tec-
hnique for evaluating carbon dioxide exchange rates of
ecosystems: past, present and future. Global Change Biology,
9, 479–492.
Baldocchi D, Falge E, Gu L et al. (2001) Fluxnet. A new tool to
study the temporal and spatial variability of ecosystem-scale
carbon dioxide and energy flux densities. Bulletin of the
American Meteorological Society, 82, 2415–2434.
Clarkson B (2002) Swamps, fens and bogs. In: Botany of the
Waikato (eds Clarkson B, Merrett M, Downs T), pp. 49–58.
Waikato Botanical Society Inc, Hamilton, New Zealand.
Dirks BOM, Hensen A, Goudriaan J (2000) Effect of drainage on
CO2 exchange patterns in an intensively managed peat
pasture. Climate Research, 14, 57–63.
Eggelsman R (1976) Peat consumption under influence of
climate, soil condition, and utilization. In: Proceedings of the
5th International Peat Congress, Vol. I, pp. 233–247. Interna-
tional Peat Society, Poznan, Poland.
Falge E, Baldocchi D, Olson R et al. (2001) Gap filling strategies
for defensible annual sums of net ecosystem exchange.
Agricultural and Forest Meteorology, 107, 43–69.
French CAI, Pryor FMM (1993) The southwest fen dyke survey
project, 1982–86. East Anglian Archaeology, 59.
Glenn S, Heyes A, Moore T (1993) Carbon dioxide and methane
emissions from drained peatland soils, southern Quebec.
Global Biogeochemical Cycles, 7, 247–258.
Gorham E (1991) Northern peatlands: Role in the carbon balance
and probable responses to probable responses to climatic
warming. Ecological Applications, 1, 182–195.
Goudriaan J, van Laar HH, van Keulen H et al. (1985)
Photosynthesis, CO2 and plant production. In: Wheat Growth
and Modelling, Vol. 86 (eds Day W, Atkin RK), pp. 107–122.
NATO ASI Series, Series A. Plenum Press, New York.
Goulden ML, Munger JW, Fan S-M et al. (1996) Measurements of
carbon sequestration by long-term eddy covariance: methods
and a critical evaluation of accuracy. Global Change Biology, 2,
169–182.
Hodge PW (2002) Respiration processes in Waikato peat bogs. MSc
thesis University of Waikato, Hamilton, New Zealand.
Hollinger DY, Kelliher FM, Schulze E-D et al. (1995) Initial
assessment of multi-scale measures of CO2 and H2O flux in
Siberian taiga. Journal of Biogeography, 22, 425–431.
Hunt JE, Kelliher FM, McSeveny TM et al. (2002) Evaporation
and carbon dioxide exchange between the atmosphere and a
tussock grassland during a summer drought. Agricultural and
Forest Meteorology, 111, 65–82.
Hutchinson JN (1980) The record of peat wastage in the East
Anglian Fenlands at Holme Post, 1848–1978 A.D. Journal of
Ecology, 68, 229–249.
Joe EN (compiler) (1986) Soil water characterisation studies of 6 soils
in the Waikato District, New Zealand. N.Z. Soil Bureau SWAMP
data sheets 1984: [1–6].
Kasimir-Klemedtsson A, Klemedtsson L, Berglund K et al. (1997)
Greenhouse gas emissions from farmed organic soils: a
review. Soil Use and Management, 13, 245–250.
Kuder T, Kruge MA, Shearer JC et al. (1998) Environmental and
botanical controls on peatification – a comparative study of
two New Zealand restiad bogs using Py-GC/MS, petrography
and fungal analysis. International Journal of Coal Geology, 37,
3–27.
Laubach J, Kelliher FM (2004) Measuring methane emission
rates of a dairy cow herd by two micrometeorological
techniques. Agricultural and Forest Meteorology, 125, 279–303.
Lloyd J, Taylor JA (1994) On the temperature dependence of soil
respiration. Functional Ecology, 8, 315–323.
Lohila A, Aurela M, Regina K et al. (2003) Soil and total
ecosystem respiration in agricultural fields: effect of soil and
crop type. Plant and Soil, 251, 303–317.
Maljanen M, Martikainen PJ, Walden J et al. (2001) CO2 exchange
in an organic field growing barley or grass in eastern Finland.
Global Change Biology, 7, 679–692.
McMillen RT (1986) A BASIC program for eddy correlation in non-
simple terrain. NOAA Technical Memo. ERLARL-147, NOAA,.
Air Resources Laboratory, Oak Ridge, MD.
Minkkinen K (1999) Effect of forestry drainage on the carbon balance
and radiative forcing of peatlands in Finland. PhD Thesis,
University of Helsinki, Finland.
Moncrieff JB, Malhi Y, Leuning R (1996) The propagation of
errors in long-term measurements of land-atmosphere fluxes
of carbon and water. Global Change Biology, 2, 231–240.
Moore CJ (1986) Frequency response corrections for eddy
correlation systems. Boundary Layer Meteorology, 37, 17–35.
Nieveen JP, Jacobs CMJ, Jacobs AFG (1998) Diurnal and seasonal
variation of carbon dioxide exchange from a former true
raised bog. Global Change Biology, 4, 823–834.
Nykanen H, Alm J, Lang K et al. (1995) Emissions of CH4, N2O
and CO2 from a virgin fen and a fen drained for grassland in
Finland. Journal of Biogeography, 22, 351–357.
Ruimy A, Jarvis PG, Baldocchi DD et al. (1995) CO2 fluxes over
plant canopies and solar radiation: a review. Advances in
Ecological Research, 26, 1–69.
Schuepp PH, Leclerc MY, MacPherson JI et al. (1990) Footprint
prediction of scalar fluxes from analytical solutions of the
diffusion equation. Boundary Layer Meteorology, 50, 355–373.
Schipper LA, McLeod M (2002) Subsidence rates and carbon
loss in peat soils following conversion to pasture in the
Waikato region, New Zealand. Soil Use and Management, 18,
91–93.
Schotanus P, Nieuwstadt FTM, De Bruin HAR (1983) Tempera-
ture measurements with a sonic anemometer and its applica-
tion to heat and moisture fluctuations. Boundary Layer
Meteorology, 26, 81–93.
Schothorst CJ (1976) Subsidence of low moor peat soils in the
Western Netherlands. In: Proceedings of the 5th International
Peat Congress, Vol. I, pp. 206–217. International Peat Society,
Poznan, Poland.
Schothorst CJ (1977) Subsidence of low moor peat soils in the
western Netherlands. Geoderma, 17, 265–291.
Schmid HP, Grimmond SB, Cropley F et al. (2000) Measurements
of CO2 and energy fluxes over a mixed hardwood forest in the
CAR BON EXCHANGE ON A DRA IN ED P EAT SO I L 617
r 2005 Blackwell Publishing Ltd, Global Change Biology, 11, 607–618
mid-western United States. Agricultural and Forest Meteorology,
103, 357–374.
Silvola J, Alm J, Ahlholm U et al. (1996) CO2 fluxes from peat in
boreal mires under varying temperature and moisture condi-
tions. Journal of Ecology, 84, 219–228.
Smith J (2003) Fluxes of carbon dioxide and water vapour at a Waikato
peat bog. PhD thesis, University of Waikato, Hamilton, New
Zealand, 156pp.
Stephens JC, Allen LH Jr, Chen E (1984) Organic soil subsidence.
In: Man-induced land subsidence (ed. Holzer TL), Geological
Society of America Reviews in Engineering Geology, Boulder
CO, USA, Vol. 6, pp. 107–122.
Stephens JC, Speir WH (1969) Subsidence of organic soils in the
U.S.A. International Association of Scientific Hydrology (Tokyo),
89, 523–534.
Tate RL III (1980) Microbial oxidation of organic matter of
Histosols. Advances in Microbial Ecology, 4, 169–201.
Twine TE, Kustas WP, Norman JM et al. (2000) Correcting eddy-
covariance flux underestimates over a grassland. Agricultural
and Forest Meteorology, 103, 279–300.
Van den Pol-van Dasselaar A, Corre WJ, Prieme A et al. (1998)
Spatial variability of methane, nitrous oxide, and carbon
dioxide emissions from drained grasslands. Soil Science Society
of America Journal, 62, 810–817.
Varlet-Grancher C, Chartier M, Gosse G et al. (1981) Rayonement
utile pour la photosynthese des vegeteax en conditions
naturelles: caracterisation et variations. Oecologia Plantarium,
2, 189–202.
Verhoef A, Allen SJ, De Bruin HAR et al. (1996) Fluxes of water
vapour and carbon dioxide from Sahelian savannah. Agricul-
tural and Forest Meteorology, 80, 231–248.
Watson RT, Zinyowerea MC, Moss RH (eds) (1996) Climate
Change 1995. Impacts, Adaptations, and Mitigation of Climate
Change. Contributions of Working groups II to the Second
Assessment Report of Intergovernmental-Panel on Climate Change.
Cambridge University Press, Cambridge, UK.
Webb EK, Pearman GI, Leuning R (1980) Corrections of flux
measurements for density effects due to heat and water
vapour transfer. Quarterly Journal of the Royal Meteorological
Society, 106, 85–100.
Wells C (2001) Total energy indicators of agricultural sustainab-
ility: dairy farming case study. MAF Technical Paper 2001/3,
Ministry of Agriculture and Fisheries, Wellington, New
Zealand.
618 J . P. N I E V E EN et al.
r 2005 Blackwell Publishing Ltd, Global Change Biology, 11, 607–618