Patterns in the organization of Cerrado pond biodiversity in Brazilian pasture landscapes
15
THE ROLE OF PONDS Patterns in the organization of Cerrado pond biodiversity in Brazilian pasture landscapes Paulo De Marco Jr. • Denis Silva Nogueira • Caroline Costa Correa • Thiago Bernardi Vieira • Karina Dias Silva • Nelson Silva Pinto • David Bichsel • Andrezza Sayuri Victoriano Hirota • Raı ´sa Rome ˆnia Silva Vieira • Fernanda Melo Carneiro • Arthur A. Bispo de Oliveira • Priscilla Carvalho • Roge ´rio Pereira Bastos • Christiane Ilg • Beat Oertli Received: 1 December 2012 / Accepted: 22 September 2013 / Published online: 18 October 2013 Ó Springer Science+Business Media Dordrecht 2013 Abstract There is a worldwide concern on the loss of pond biodiversity in human dominated landscapes. Nevertheless, agricultural activities appear to increase pond number in the Brazilian Cerrado through dam- ming streams for cattle raising. These man-made ponds may represent important landscape features, but their importance to regional biodiversity has not yet been studied. Here, we evaluated differences in alpha and beta diversity under a multi-taxonomic approach, as well as tested pond size as the main driver of local species richness. We also assessed the importance of environmental heterogeneity through the analysis of the regional species accumulation curves (SAC). The overall result suggests that species turnover was the major component of regional biodiversity for all groups. Major physical and chemical water conditions had no effects on algae, macrophytes, water bugs, and birds species richness. Pond size had a significant effect on Odonata and fish species richness, while water beetles and amphibians were influenced by trophic conditions. Results from regional SAC show variations among different taxonomic groups regard- ing landscape heterogeneity: only algae, fish, and birds do not reached to an asymptote and had higher z- values. Our results highlight the importance of ponds for biodiversity conservation in increasingly agricul- tural landscapes in central Brazil. Keywords Additive partitioning Heterogeneity Metacommunity ecology Species-accumulation curves Species richness Species–area relationship Electronic supplementary material The online version of this article (doi:10.1007/s10750-013-1695-2) contains supple- mentary material, which is available to authorized users. Guest editors: R. Ce ´re ´ghino, D. Boix, H.-M. Cauchie, K. Martens & B. Oertli / Understanding the role of ponds in a changing world P. De Marco Jr. (&) Laborato ´rio de Ecologia Teo ´rica e Sı ´ntese, ICB, Universidade Federal de Goia ´s, Goia ´s, Brazil e-mail: [email protected]; [email protected] D. S. Nogueira C. C. Correa T. B. Vieira K. D. Silva N. S. Pinto A. S. V. Hirota R. R. S. Vieira A. A. B. de Oliveira P. Carvalho R. P. Bastos ICB, Universidade Federal de Goia ´s, Goias, Brazil D. Bichsel C. Ilg B. Oertli University of Applied Sciences of Western Switzerland, Lullier-Geneva, Switzerland F. M. Carneiro Universidade Estadual de Goia ´s, Goias, Brazil 123 Hydrobiologia (2014) 723:87–101 DOI 10.1007/s10750-013-1695-2
Transcript of Patterns in the organization of Cerrado pond biodiversity in Brazilian pasture landscapes
THE ROLE OF PONDS
Patterns in the organization of Cerrado pond biodiversityin Brazilian pasture landscapes
Paulo De Marco Jr. • Denis Silva Nogueira • Caroline Costa Correa •
Thiago Bernardi Vieira • Karina Dias Silva • Nelson Silva Pinto • David Bichsel •
Andrezza Sayuri Victoriano Hirota • Raısa Romenia Silva Vieira •
Fernanda Melo Carneiro • Arthur A. Bispo de Oliveira • Priscilla Carvalho •
Rogerio Pereira Bastos • Christiane Ilg • Beat Oertli
Received: 1 December 2012 / Accepted: 22 September 2013 / Published online: 18 October 2013
� Springer Science+Business Media Dordrecht 2013
Abstract There is a worldwide concern on the loss
of pond biodiversity in human dominated landscapes.
Nevertheless, agricultural activities appear to increase
pond number in the Brazilian Cerrado through dam-
ming streams for cattle raising. These man-made
ponds may represent important landscape features, but
their importance to regional biodiversity has not yet
been studied. Here, we evaluated differences in alpha
and beta diversity under a multi-taxonomic approach,
as well as tested pond size as the main driver of local
species richness. We also assessed the importance of
environmental heterogeneity through the analysis of
the regional species accumulation curves (SAC). The
overall result suggests that species turnover was the
major component of regional biodiversity for all
groups. Major physical and chemical water conditions
had no effects on algae, macrophytes, water bugs, and
birds species richness. Pond size had a significant
effect on Odonata and fish species richness, while
water beetles and amphibians were influenced by
trophic conditions. Results from regional SAC show
variations among different taxonomic groups regard-
ing landscape heterogeneity: only algae, fish, and birds
do not reached to an asymptote and had higher z-
values. Our results highlight the importance of ponds
for biodiversity conservation in increasingly agricul-
tural landscapes in central Brazil.
Keywords Additive partitioning �Heterogeneity � Metacommunity ecology �Species-accumulation curves � Species richness �Species–area relationship
Electronic supplementary material The online version ofthis article (doi:10.1007/s10750-013-1695-2) contains supple-mentary material, which is available to authorized users.
Guest editors: R. Cereghino, D. Boix, H.-M. Cauchie,
K. Martens & B. Oertli / Understanding the role of ponds in a
changing world
P. De Marco Jr. (&)
Laboratorio de Ecologia Teorica e Sıntese, ICB,
Universidade Federal de Goias, Goias, Brazil
e-mail: [email protected]; [email protected]
D. S. Nogueira � C. C. Correa � T. B. Vieira �K. D. Silva � N. S. Pinto � A. S. V. Hirota �R. R. S. Vieira � A. A. B. de Oliveira �P. Carvalho � R. P. Bastos
ICB, Universidade Federal de Goias, Goias, Brazil
D. Bichsel � C. Ilg � B. Oertli
University of Applied Sciences of Western Switzerland,
Lullier-Geneva, Switzerland
F. M. Carneiro
Universidade Estadual de Goias, Goias, Brazil
123
Hydrobiologia (2014) 723:87–101
DOI 10.1007/s10750-013-1695-2
Introduction
There is an increasing concern regarding the loss of
ponds in agricultural landscapes, with the worst
possible consequences for its component biodiversity.
The recognition of this ongoing process supports the
need for a worldwide effort on pond conservation in
human dominated landscapes (Oertli et al., 2005;
Cereghino et al., 2008b). Nevertheless, a first glance at
pasture landscapes in central Brazil suggests that the
number of ponds is actually increasing due to the
stream damming for economic purposes (mostly
related to cattle raising). This may suggest a variable
pond persistence response in different world regions or
dominant land uses. For instance, since the current
economic activities in the Cerrado (e.g., soybean and
sugarcane production, cattle raising) have different
dependencies on water resources, they may also differ
on the economic pressure to increase pond number.
Ponds account for a substantial amount of the
biodiversity of a given landscape in comparison to
streams and rivers (Williams et al., 2004). The
differential response of pond species to environmental
factors may also lead to important differences in
community composition between these two systems
(Bilton et al., 2006; Bagella et al., 2010). Besides, the
lack of knowledge on organization of pond ecological
communities may hinder our ability to predict their
response to possible major threats (e.g., land use
changes, nitrogen uptake, and species invasion). In
order to assess the importance of ponds for pasture
landscape biodiversity, further knowledge on the
species composition and distribution in ponds is
crucial, as well as its contribution to regional biodi-
versity. For instance, information shortage on taxon-
omy and distribution of Neotropical species has been
suggested as a barrier that weakens the efforts for
species conservation (Brito, 2010; Diniz-Filho et al.,
2010).
Regarding agricultural landscapes, it is possible to
devise two main scales that affect biodiversity orga-
nization and may represent important ecological
processes. The pond scale may include short-distance
effects of nearby environmental conditions disturbed
by anthropogenic effects in addition to other common
local effects such as biotic interactions and environ-
mental filtering (Herwig & Schindler, 1996; Pierce &
Hinrichs, 1997; Studinski & Grubbs, 2006). Local
factors may directly determine the maximum number
of species that could be maintained in a given pond.
The landscape/regional scale is related to long-
distance interactions among ponds including dispersal
and constraints generated by the regional species pool.
The relative importance of local and regional pro-
cesses driving species richness are at the heart of
current debates on the importance of neutral or niche
processes shaping ecological communities (Cottenie
et al., 2003; Van de Meutter et al., 2007; Howeth &
Leibold, 2010).
As for local processes, it is expected that pond size
may shape several ecological patterns in aquatic lentic
systems (Oertli et al., 2002; Kadoya et al., 2004;
Bosiacka & Pienkowski, 2011). First, pond size
directly affects the amount of suitable areas available
for pond-dwelling species. Pond size is related to the
length and width of the littoral zone, which displays
the best ecological conditions of oxygen and temper-
ature for several species with a positive effect on their
abundance. Besides, the littoral zone provides favor-
able sites for both attachment and protection for
aquatic organisms. Secondly, small ponds may be
more intensely affected by any surrounding distur-
bance (e.g., nitrogen uptake from nearby human
activities or heavy rains), whereas the size of larger
ponds may confer them a relative environmental
stability by buffering the effects of eutrophication
(Menetrey et al., 2005). A possible relation between
pond size and general physical–chemical water vari-
ables may represent an important axis to understand
the organization of pond communities, such as aquatic
insects and amphibians (Oertli et al., 2002; Kadoya
et al., 2004). However, the species–area relationships
may not be so general when human impacts disrupt
natural ecological processes, namely as in intensively
managed ponds (e.g., fish ponds; cattle raising ponds).
Species are clearly not homogeneously distributed
in a landscape (Chandy et al., 2006; Simmering et al.,
2006). Different groups are expected to respond to
habitat heterogeneity according to their behavior
(Baguette & Van Dyck, 2007), dispersal capabilities
(Campagne et al., 2009), or other bionomic traits
usually related to habitat use (Burel & Baudry, 2005).
A logical consequence is that landscape and habitat
heterogeneity may be an important component to
explain species richness variation among ponds.
Kolasa et al. (2012) recently showed how species
accumulation curves (SAC) may help to understand
how broad-scale heterogeneity is important to
88 Hydrobiologia (2014) 723:87–101
123
determine species richness patterns in the regional
pools. They argue that the slope of these relations
increases with heterogeneity for a given set of species.
We argue further that if we compare different groups
in the same landscape, SAC may provide a useful
insight on how they respond differently to heteroge-
neity. Considering the large variety of body sizes and
ecological requirements of the species visiting and/or
inhabiting ponds (from tiny algal cells to birds), this
approach should be useful to analyze the component
assemblage of these systems.
Here, we provide a broad view of local and regional
patterns of species richness in the Cerrado ponds under
a multi-taxonomic approach. Following the analysis of
broad patterns of environmental conditions variation
among ponds, we explored the differences among
taxonomic groups through an additive partition of the
regional biodiversity into its alpha and beta diversity
components. Then, we tested the hypothesis that pond
size and pond trophic state are the main drivers of
species richness variation in each group. We also
evaluated the importance of the environmental heter-
ogeneity on the spatial organization of these commu-
nities by means of a regional species accumulation
curve analysis.
Materials and methods
Study area and study sites selection
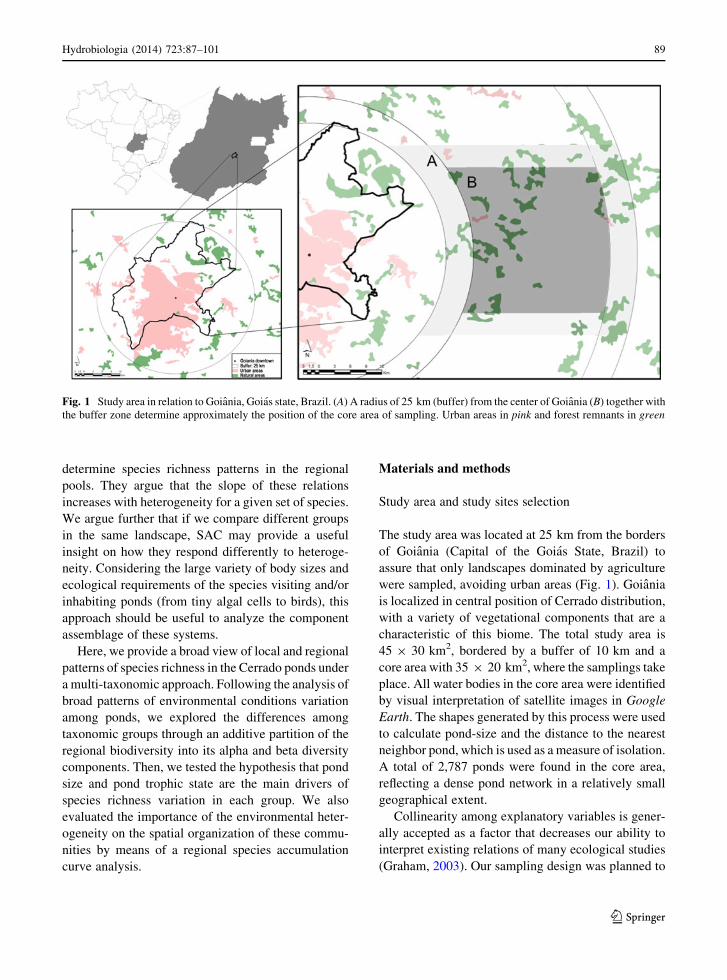
The study area was located at 25 km from the borders
of Goiania (Capital of the Goias State, Brazil) to
assure that only landscapes dominated by agriculture
were sampled, avoiding urban areas (Fig. 1). Goiania
is localized in central position of Cerrado distribution,
with a variety of vegetational components that are a
characteristic of this biome. The total study area is
45 9 30 km2, bordered by a buffer of 10 km and a
core area with 35 9 20 km2, where the samplings take
place. All water bodies in the core area were identified
by visual interpretation of satellite images in Google
Earth. The shapes generated by this process were used
to calculate pond-size and the distance to the nearest
neighbor pond, which is used as a measure of isolation.
A total of 2,787 ponds were found in the core area,
reflecting a dense pond network in a relatively small
geographical extent.
Collinearity among explanatory variables is gener-
ally accepted as a factor that decreases our ability to
interpret existing relations of many ecological studies
(Graham, 2003). Our sampling design was planned to
Fig. 1 Study area in relation to Goiania, Goias state, Brazil. (A) A radius of 25 km (buffer) from the center of Goiania (B) together with
the buffer zone determine approximately the position of the core area of sampling. Urban areas in pink and forest remnants in green
Hydrobiologia (2014) 723:87–101 89
123
control collinearity among other variables such as
pond-size and isolation, which may also affect pond
biodiversity but are beyond of the scope of this study.
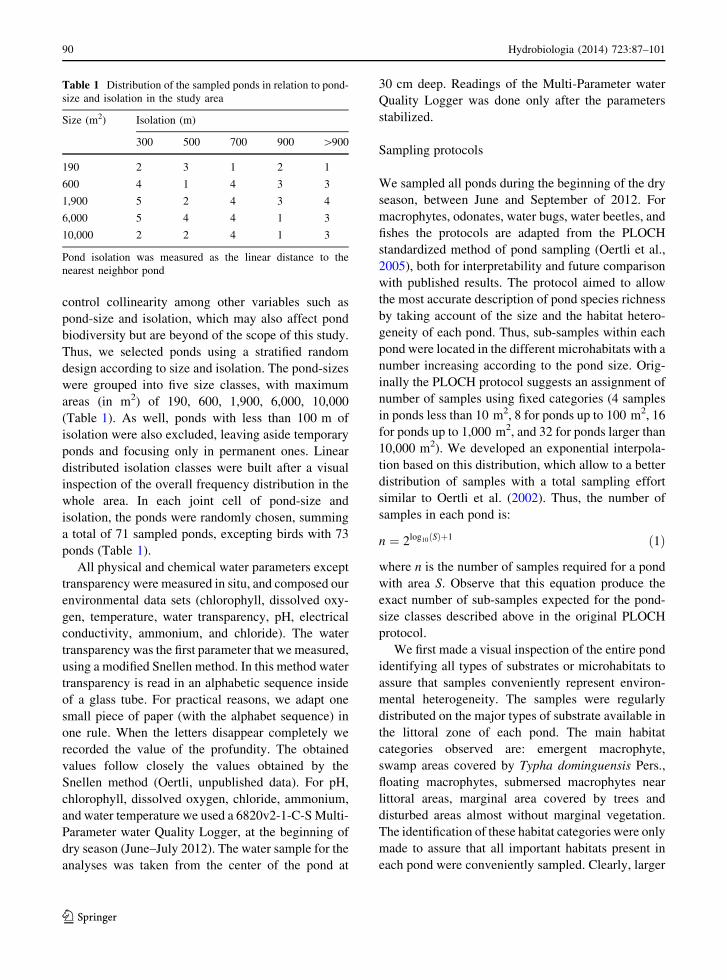
Thus, we selected ponds using a stratified random
design according to size and isolation. The pond-sizes
were grouped into five size classes, with maximum
areas (in m2) of 190, 600, 1,900, 6,000, 10,000
(Table 1). As well, ponds with less than 100 m of
isolation were also excluded, leaving aside temporary
ponds and focusing only in permanent ones. Linear
distributed isolation classes were built after a visual
inspection of the overall frequency distribution in the
whole area. In each joint cell of pond-size and
isolation, the ponds were randomly chosen, summing
a total of 71 sampled ponds, excepting birds with 73
ponds (Table 1).
All physical and chemical water parameters except
transparency were measured in situ, and composed our
environmental data sets (chlorophyll, dissolved oxy-
gen, temperature, water transparency, pH, electrical
conductivity, ammonium, and chloride). The water
transparency was the first parameter that we measured,
using a modified Snellen method. In this method water
transparency is read in an alphabetic sequence inside
of a glass tube. For practical reasons, we adapt one
small piece of paper (with the alphabet sequence) in
one rule. When the letters disappear completely we
recorded the value of the profundity. The obtained
values follow closely the values obtained by the
Snellen method (Oertli, unpublished data). For pH,
chlorophyll, dissolved oxygen, chloride, ammonium,
and water temperature we used a 6820v2-1-C-S Multi-
Parameter water Quality Logger, at the beginning of
dry season (June–July 2012). The water sample for the
analyses was taken from the center of the pond at
30 cm deep. Readings of the Multi-Parameter water
Quality Logger was done only after the parameters
stabilized.
Sampling protocols
We sampled all ponds during the beginning of the dry
season, between June and September of 2012. For
macrophytes, odonates, water bugs, water beetles, and
fishes the protocols are adapted from the PLOCH
standardized method of pond sampling (Oertli et al.,
2005), both for interpretability and future comparison
with published results. The protocol aimed to allow
the most accurate description of pond species richness
by taking account of the size and the habitat hetero-
geneity of each pond. Thus, sub-samples within each
pond were located in the different microhabitats with a
number increasing according to the pond size. Orig-
inally the PLOCH protocol suggests an assignment of
number of samples using fixed categories (4 samples
in ponds less than 10 m2, 8 for ponds up to 100 m2, 16
for ponds up to 1,000 m2, and 32 for ponds larger than
10,000 m2). We developed an exponential interpola-
tion based on this distribution, which allow to a better
distribution of samples with a total sampling effort
similar to Oertli et al. (2002). Thus, the number of
samples in each pond is:
n ¼ 2log10 Sð Þþ1 ð1Þ
where n is the number of samples required for a pond
with area S. Observe that this equation produce the
exact number of sub-samples expected for the pond-
size classes described above in the original PLOCH
protocol.
We first made a visual inspection of the entire pond
identifying all types of substrates or microhabitats to
assure that samples conveniently represent environ-
mental heterogeneity. The samples were regularly
distributed on the major types of substrate available in
the littoral zone of each pond. The main habitat
categories observed are: emergent macrophyte,
swamp areas covered by Typha dominguensis Pers.,
floating macrophytes, submersed macrophytes near
littoral areas, marginal area covered by trees and
disturbed areas almost without marginal vegetation.
The identification of these habitat categories were only
made to assure that all important habitats present in
each pond were conveniently sampled. Clearly, larger
Table 1 Distribution of the sampled ponds in relation to pond-
size and isolation in the study area
Size (m2) Isolation (m)
300 500 700 900 [900
190 2 3 1 2 1
600 4 1 4 3 3
1,900 5 2 4 3 4
6,000 5 4 4 1 3
10,000 2 2 4 1 3
Pond isolation was measured as the linear distance to the
nearest neighbor pond
90 Hydrobiologia (2014) 723:87–101
123
ponds may have a more complete set of habitat
categories but these relations are beyond the objec-
tives of this study.
Phytoplankton
In each pond a sub-surface water sample was collected
with 100 ml amber bottles and fixed with acetic Lugol
(Vollenweider, 1974; Bicudo & Menezes, 2006). We
also made an algal sample using a 20 lm plankton net.
This sample was preserved in Transeau (6 part of
water: 3 parts of alcohol: 1 part of formaline 40%) in
1:1 proportion. The net sample was used for species
identification and the bottle sample to estimate species
density according to Utermohl (1958). The phyto-
plankton was identified to the species level or the
lowest taxonomic level possible according to Van den
Hoek et al. (1995).
Macrophytes
In each pond, the macrophytes were listed and all
species present were recorded. The macrophytes were
classified in 5 ecological groups (emergent, free
submersed, rooted submersed, free floating, and
rooted with floating leaves). The number of banks
sampled also follows the general relation with pond-
size. Samples of macrophyte were taken for identifi-
cation using relevant literature (Pott & Pott, 2000;
Amaral et al., 2008). Quantitative samples were taken
using quadrats of 0.25 m 9 0.25 m in transects 2 m
inside the pond and parallel to pond margin recording
the coverage of each species using the Dromin-Kajima
scale (0 = absent; 1 = 0–20% cover; 2 = 21–40%
cover; 3 = 41–60% cover; 4 = 61–80% cover;
5 = 81–100% cover). The distribution of the number
of samples follows the standardized protocol with
relation to pond size (Table 1).
Aquatic insects
Water bugs and beetles were sampled using a small
rectangular net of 14 9 10 cm2 with 0.5 mesh area as
in Oertli et al. (2002, 2005). Each sample was done in
the 2 m littoral margin of pond during 30 s in each
previous selected habitat. The samples were conserved
in alcohol and separated at lab for further identifica-
tion. The classification of water bugs adults at families
and genera level was done following Nieser & Melo
(1997) and Pereira & Melo (2007). Water beetles
adults were identified at families and genera levels
following Benetti et al. (2003) and Segura et al.
(2011).
Odonata
Odonata adults were sampled only between 10:00 and
15:00 h, always on air temperatures higher than 19�C
(De Marco & Resende, 2002). We use a modified scan
method with fixed areas (De Marco, 1998; Silva et al.,
2010) using 5 m segments distributed within the
previously selected microhabitats. All adults were
visually counted by an experienced collector and all
dubious individuals (especially the small species)
captured. Species determination was done with the
comparison with the material of the Odonate collec-
tion of UFG and relevant literature (Lencioni, 2005,
2006).
Fish
We use a passive sampling method based on a traps,
built using transparent PET bottles of 2 l during 24 h.
The traps were dispersed in the ponds following the
same habitats of the macroinvertebrate samples but
located at 5 m distance one to another, with their
opening being directed to pond margin. We choose
this sampling method because it is easily applicable,
but we acknowledge for the possible inherent bias
associated to this method. An active sampling, like a
net fishing or hand net fish, may also present some bias
or may be difficult to apply to some large ponds
(Table 1). Besides this, a large number of ponds are
fish farming and the owners impose restrictions for
active sampling. Although the abundance and the
richness are underestimated by the passive method, we
rely on the uniformity of this effect over ponds to
provide a comparison among them. However, com-
parisons with other work should be done cautiously.
Classification at order, families, and species follow the
current literature (Vari & Weitzman, 1991; Buckup,
1993).
Amphibians
Adult amphibians were sampled during the rainy
season, from October 2012 to February 2013, always
between 20:00 and 00:00 h. During 50 min, we
Hydrobiologia (2014) 723:87–101 91
123
walked around the pond and registered all individuals
seen or heard according to the methods of visual
encounters surveys and audio strip transects (Zimmer-
man, 1994). Individuals heard in nearby ponds were
not included. Species identification followed Frost
(2013).
Birds
As bird species in ponds are well known, a direct
estimation of the absolute species richness by pond
was possible. All individuals at the shore area, floating
vegetation, or swamp vegetation were recorded visu-
ally (using 10 9 50 binoculars) and by song recogni-
tion during a complete walk around the pond at a
constant velocity.
Analytical methods
The dimension of water quality variables was reduced
using principal component analysis (PCA) according
to Legendre & Legendre (1998). Relations between
pond-size and water quality variables were investi-
gated by a linear regression of this variable and the first
axis of the PCA. Similarly, relations between both
pond-size and water quality (first PCA axis) and the
species richness were tested by linear regression.
Jackknife estimates of species richness was used for
groups having been sub-sampled: macrophytes, water
beetles, water bugs, Odonata adults, and fish; while,
for phytoplankton and birds we used observed species
richness. Jackknifed species richness has the advan-
tage both to corrected bias in observed species
richness and to provide variance estimates allowing
to further inferential tests (Colwell & Coddington,
1994). The analysis of estimated species richness
against our environmental predictors was done by
means of multiple linear regression (Zar, 1999).
Additive and multiplicative partitioning techniques
have been employed to decompose the total diversity
(c diversity) in the alpha and beta diversities from
ecological communities (Crist & Veech, 2006). Nev-
ertheless, diversity partitioning has aroused heated
discussions with a variety of suggested procedures
(Baselga, 2010; Jost, 2010; Veech & Crist, 2010a, b).
In this paper, we apply the additive diversity parti-
tioning developed by Crist et al. (2003), because it
measures the diversity at the different scales taking
into account the total number of species and the local
species richness as well, putting beta diversity in a
similar and comparable scale (see Chao et al., 2012).
Beta diversities for each group were calculated as the
difference among gamma and the average of alpha
using species richness, and were than compared to
random expectation by 999 Monte Carlo simulations
of individuals into any local samples (according to
Hypothesis testing 1 in Crist et al., 2003).
We also follow Kolasa et al. (2012) to use species
accumulation curves as indication of the relation of
species richness and habitat heterogeneity in the
landscape. Kolasa et al. (2012) show that the increase
of the exponent z of the species area relation is
indicative of an increase in heterogeneity at broader
spatial scale. We applied this concept here in a
different way since we try to compare the responses of
different groups to the same landscape and, thus, the
same variation on heterogeneity. We consider that the
increase in z is related to the way each group respond
to the existing heterogeneity gradients and its ability to
disperse in this landscape. Curves are fitted using
nonlinear estimation methods, but using number of
sites instead of cumulative area. All the computations
were performed with packages available in R program
(R Development Core Team, 2013) and the Statistica
7.1 (StatSoft, 2005).
Results
Limnological characterization
Water quality parameters of Cerrado ponds are
consistent with a medium trophic state with a relative
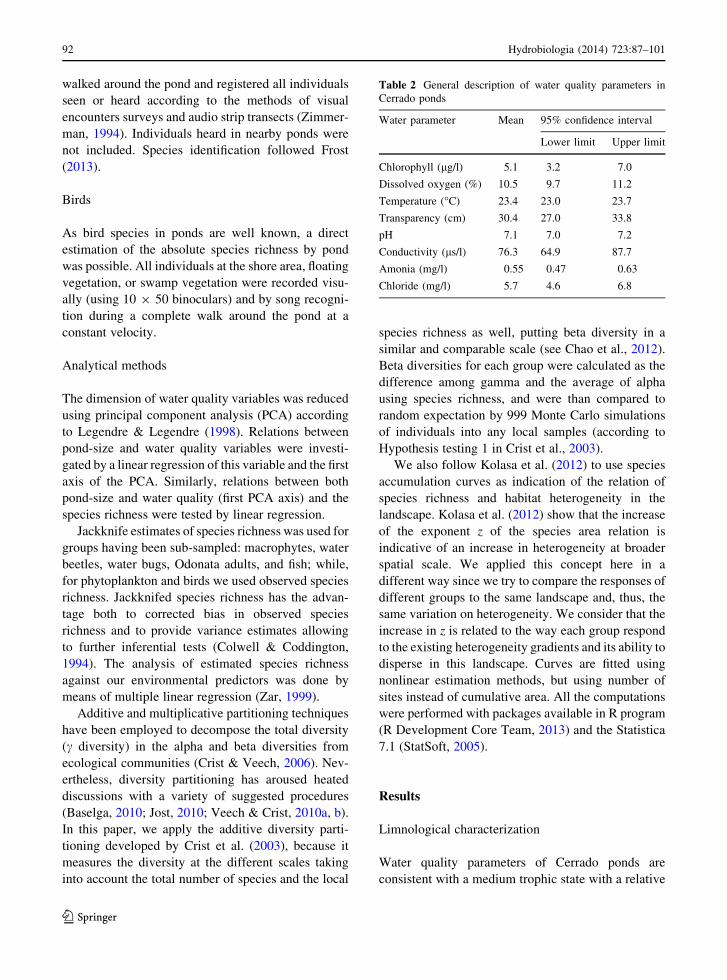
Table 2 General description of water quality parameters in
Cerrado ponds
Water parameter Mean 95% confidence interval
Lower limit Upper limit
Chlorophyll (lg/l) 5.1 3.2 7.0
Dissolved oxygen (%) 10.5 9.7 11.2
Temperature (�C) 23.4 23.0 23.7
Transparency (cm) 30.4 27.0 33.8
pH 7.1 7.0 7.2
Conductivity (ls/l) 76.3 64.9 87.7
Amonia (mg/l) 0.55 0.47 0.63
Chloride (mg/l) 5.7 4.6 6.8
92 Hydrobiologia (2014) 723:87–101
123

low level of oxygen (10.5%), with low variation
among ponds (1.5%). Transparency presents low
values (23.4 cm) and also a small inter-pond variation
(6.8 cm) (Table 2). Conductivity varied widely
among ponds (22.7 ls/l) and the ammonium is the
most stable variable, with only 0.16 mg/l of variation.
Chlorophyll had the third highest variation among
ponds followed by Chloride.
Water parameters collected in Cerrado ponds show
a medium level of collinearity (first three principal
components representing 61% of total variance). First
principal component is positively related to chloro-
phyll (log-transformed), ammonium, pH, and electric
conductivity and negatively related to transparency
(Fig. 2A). Thus, this axis represents mainly the trophic
state of the pond, well related to its littoral depth. No
groups of ponds could be easily identified (Fig. 2B),
except a distinct aggregation of ponds with high
chlorophyll.
Trophic state of the ponds (Factor 1) is negatively
related to pond-size (Fig. 3). This relation account
for a small fraction to total variance in Factor 1
(r2 = 0.124) but it represent a consistent relation
of pond-size with the decrease in chlorophyll-
a (r2 = 0.108; P \ 0.003; both variables log-
transformed).
Fig. 2 Loadings of variables (A) and scores of samples (B) of PCA of the water quality measures of the Cerrado ponds
Fig. 3 Water quality factor
1 as a function of pond-size.
A logarithmic regression
was done after analysis of
linear regression residuals
Hydrobiologia (2014) 723:87–101 93
123

It is important to note that 70.4% of the studied
ponds are the result of damming natural streams.
Ponds created by small dams are larger (3,360.3 m2;
SD = 2,872.9) than those not connected to streams
(634.3 m2; SD = 887.0) (t test for separate vari-
ances = 6.057, df = 65, P \ 0.001). Thus, the effect
of pond-size is not totally independent to the pond
connection to streams.
Regional biodiversity of ponds
We recorded 661 taxa (species and genera) distributed
in the seven studied taxonomic groups (Table 3; see
detailed lists in the supplementary material). Phyto-
plankton was the richer one with more than half of all
recorded taxa (346 species). However, we estimate
that about 234 species (67.6%) can still be found in
studied ponds (jackknife estimator). Macrophytes,
water beetles, water bugs, fish, and amphibians were
better represented in this study, with only about nine
species less than the estimated by jackknife (percent-
ages of possible not sampled species varying from
11.1 to 20.4%) (Table 3). Odonata and birds, present
highest percentages of not sampled species according
to jackknife estimator (28.6 and 53.3%, respectively).
The decomposition of regional pond biodiversity
enables us understanding the relative contribution of
alpha and beta diversity among the studied groups. The
percentage of singleton species varied from 13.9% (for
water beetles) to 68.5% (for phytoplankton). Despite
we were not interested in sampling effects we agree
that sampling biases can take a great amount on the
explication of true alpha and beta diversity in our
approach of regional diversity decomposition. In fact,
the greater number of singletons species for phyto-
plankton suggests that our protocol may highlight the
true potential sampled species diversity for this group.
However, for most of studied taxonomic groups beta
diversity seems less biased by singletons species.
Alpha diversity was higher than expected only for
macrophytes. For all the others, beta diversity was
higher than expected (Table 4). The general pattern
suggests a high turnover of species compositions
among ponds for all the groups. Since sample bias may
affect those patters considering the high percentage of
singleton species, we also perform the analysis
excluding singletons. The general qualitative results
do not change, reinforcing the high beta diversity
among ponds in the area.
Main drivers: size and water quality parameters
We have found contrasting patterns for species
richness according to pond size and two first PCA
axes for water quality variables (Table 5). The species
richness of algae, macrophytes, and birds was not
influenced by our environmental predictors. Never-
theless, water beetles species richness were negatively
related to the first PCA axis (b = -0.32, P \ 0.05),
which described the increase of eutrophic conditions,
while Odonata (b = 0.43, P \ 0.05) and fish
(b = 0.35, P \ 0.05) were the groups witch best fit
for a pond size-species richness relation.
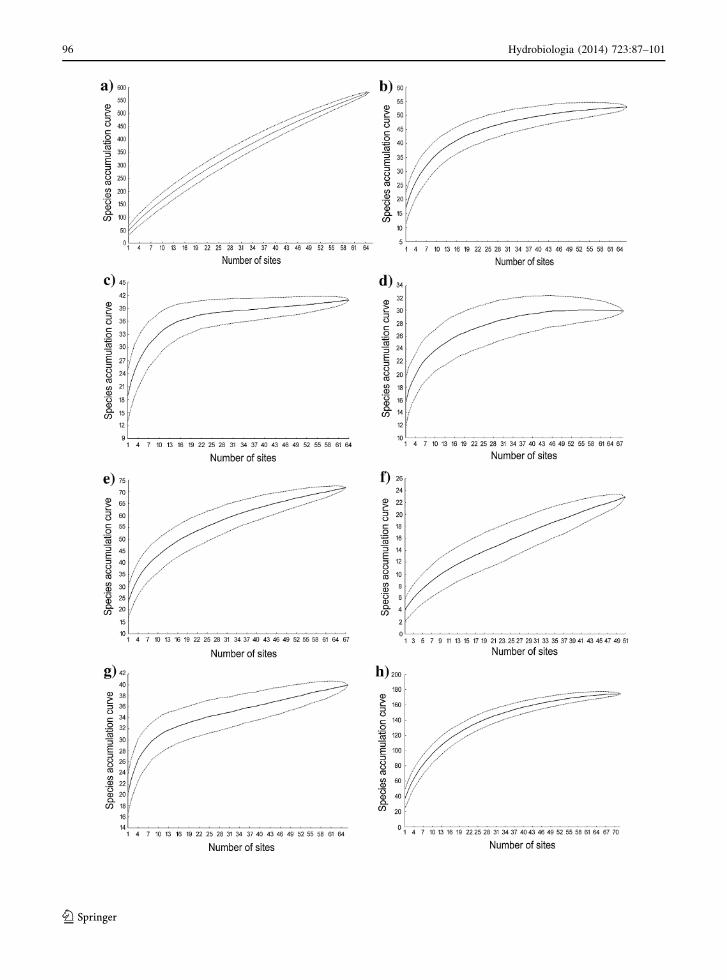
Species accumulation curves
All species accumulation curves showed high levels of
statistical fit to regional species–area relation (always
higher than 91% of total variance explained). The
slope of the curves varied widely among the groups
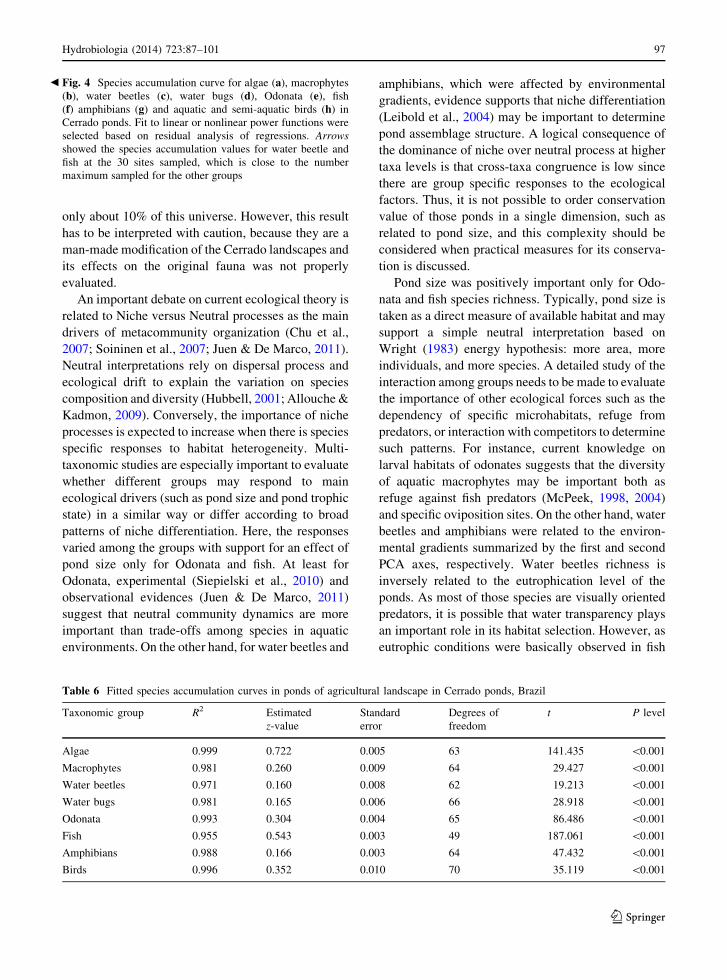
(Fig. 4, Table 6). Algae had the larger z-value (z-
value = 0.722) much higher than the second value
obtained for fishes (0.543). In both cases it is clear that
the sampled species richness do not represent the real
species richness in this landscape. Macrophyte, Odo-
nata, and birds had z-values between 0.260 and 0.352,
and represent an intermediate group. Amphibians,
water bugs, and water beetles showed the lowest z-
values, and reach to the asymptote for accumulation
curve. For these groups the studied ponds hold a
significant portion of the regional diversity, and have
Table 3 Summary of pond biodiversity showing the number
of studied sites, observed and estimated species richness (first
order jackknife) of all studied groups and total diversity
Taxonomic
group
Observed
species
richness
Jackknifed
species
richness
Difference of
observed and
estimated richness
Algae 346 580.46 *234 (67.6%)
Macrophytes 44 52.87 *9 (20.4%)
Water beetles 36 40.92 *5 (13.9%)
Water bugs 27 29.96 *3 (11.1%)
Odonata 56 71.77 *16 (28.6%)
Fish 15 22.85 *8 (53.3%)
Amphibians 33 38.91 *6 (18.2%)
Birds 137 174.49 *37 (27.0%)
The total number of ponds sampled was 71 except for birds,
which was 73
94 Hydrobiologia (2014) 723:87–101
123
the best representativeness, with only a few species
less than the total estimated richness.
Discussion
Since the Cerrado ponds are nearly all man-made, they
reflect the economic forces that surround them. In this
respect, we postulate that pond size is the main driver
of its environmental structure (which may reflect the
needs of the landowners). Large ponds are more stable
mostly because they can buffer the effects of heavy
rains. We showed that size influences the trophic state
of the ponds, with smaller waterbodies having a higher
probability to harbor higher levels of chlorophyll
concentration. Otherwise, the majority of the ponds
(70%) are made by dams on streams which may affect
directly its biotic component by changing the com-
munity composition and diversity. In addition, ponds
probably affect regional biodiversity by favoring
stepping stones dispersal (Cereghino et al., 2008a) or
even acting as ecological traps for species (Horvath
et al., 2007; Harabis & Dolny, 2011).
Regarding its origin, the Cerrado pond biodiversity
is partially composed by exogenous species that
colonize these ecosystems through migration from
nearby rivers and streams or other standing water
environments. Sometimes species are introduced by
man, such as fishes, or they are alien species favoured
by environmental change. Otherwise, as underlined by
new insight on pond ecology and management
(Cereghino et al., 2008a), our findings support the
claim that Cerrado ponds hold a high biodiversity,
despite their small sizes, with proportionally higher
contribution of beta diversity component. This result is
especially important, since we found about three
thousand ponds in an area of 686 km2 and sampled
Table 4 Additive partitioning of regional diversity for all the
studied groups, showing percentages of singletons species for
each group, observed versus expected values for alpha and beta
diversities (in terms of number of species) and percentages of
beta diversity component with and without singletons species
Algae Macrophytes Water
beetles
Water
bugs
Odonata Fish Amphibians Birds
% of singletons species 68.5 20.4 13.9 16.7 29.1 28.6 18.2 27.9
a-diversity with
singletons
10.2 (95.6) 4.5 (4.1) 5.8 (9.5) 5.3 (8.9) 7.4 (13.5) 1.9 (4.5) 6.94 (13.2) 8.9 (13.4)
b-diversity without
singletons
335.8 (250.3) 38.5 (38.9) 30.2 (26.5) 20.7 (17.1) 47.6 (41.5) 12.1 (9.5) 26.1 (19.8) 127.1 (122.6)
a-diversity without
singletons
6.63 (43.17) 4.35 (3.91) 5.73 (9.33) 5.21 (8.75) 7.16 (12.84) 1.83 (4.36) 6.85 (13.04) 8.34 (12.24)
b-diversity without
singletons
102.37 (65.80) 29.65 (30.09) 25.27 (21.67) 17.79 (14.25) 31.84 (26.16) 8.17 (5.64) 20.15 (13.96) 88.66 (84.76)
b-diversity with
singletons (%)
97.1 89.5 83.9 79.6 86.6 86.4 78.9 93.5
b-diversity without
singletons (%)
93.9 87.2 81.5 77.3 81.6 81.7 74.6 91.4
Expected values (between parenthesis) represent the average of 999 Monte Carlo simulations
For all simulations observed values were significant at an a-level of 0.05
Table 5 Multiple regression R2 adjusted and partial coeffi-
cients for multiple community parameters against pond size
and two first principal components
Taxonomic
group
Species richness** R2
adjustedPond
size
PCA1 PCA2
Algae -0.04 0.19 0.05 0.04
Macrophytes 0.26 -0.16 0.10 0.08
Water beetles 0.11 -0.39* -0.09 0.17*
Water bugs 0.28 0.09 0.11 0.01
Odonata 0.43* -0.15 0.10 0.20*
Fish 0.36* 0.22 -0.06 0.09*
Amphibians 0.04 -0.21 -0.34* 0.12*
Birds 0.00 -0.19 0.00 0.04
* Significant at an a-level of 0.05
** Species richness for algae and Birds are represented by
observed number of species, for all the other groups we used
estimated (jackknifed) species richness
Hydrobiologia (2014) 723:87–101 95
123
96 Hydrobiologia (2014) 723:87–101
123
only about 10% of this universe. However, this result
has to be interpreted with caution, because they are a
man-made modification of the Cerrado landscapes and
its effects on the original fauna was not properly
evaluated.
An important debate on current ecological theory is
related to Niche versus Neutral processes as the main
drivers of metacommunity organization (Chu et al.,
2007; Soininen et al., 2007; Juen & De Marco, 2011).
Neutral interpretations rely on dispersal process and
ecological drift to explain the variation on species
composition and diversity (Hubbell, 2001; Allouche &
Kadmon, 2009). Conversely, the importance of niche
processes is expected to increase when there is species
specific responses to habitat heterogeneity. Multi-
taxonomic studies are especially important to evaluate
whether different groups may respond to main
ecological drivers (such as pond size and pond trophic
state) in a similar way or differ according to broad
patterns of niche differentiation. Here, the responses
varied among the groups with support for an effect of
pond size only for Odonata and fish. At least for
Odonata, experimental (Siepielski et al., 2010) and
observational evidences (Juen & De Marco, 2011)
suggest that neutral community dynamics are more
important than trade-offs among species in aquatic
environments. On the other hand, for water beetles and
amphibians, which were affected by environmental
gradients, evidence supports that niche differentiation
(Leibold et al., 2004) may be important to determine
pond assemblage structure. A logical consequence of
the dominance of niche over neutral process at higher
taxa levels is that cross-taxa congruence is low since
there are group specific responses to the ecological
factors. Thus, it is not possible to order conservation
value of those ponds in a single dimension, such as
related to pond size, and this complexity should be
considered when practical measures for its conserva-
tion is discussed.
Pond size was positively important only for Odo-
nata and fish species richness. Typically, pond size is
taken as a direct measure of available habitat and may
support a simple neutral interpretation based on
Wright (1983) energy hypothesis: more area, more
individuals, and more species. A detailed study of the
interaction among groups needs to be made to evaluate
the importance of other ecological forces such as the
dependency of specific microhabitats, refuge from
predators, or interaction with competitors to determine
such patterns. For instance, current knowledge on
larval habitats of odonates suggests that the diversity
of aquatic macrophytes may be important both as
refuge against fish predators (McPeek, 1998, 2004)
and specific oviposition sites. On the other hand, water
beetles and amphibians were related to the environ-
mental gradients summarized by the first and second
PCA axes, respectively. Water beetles richness is
inversely related to the eutrophication level of the
ponds. As most of those species are visually oriented
predators, it is possible that water transparency plays
an important role in its habitat selection. However, as
eutrophic conditions were basically observed in fish
Table 6 Fitted species accumulation curves in ponds of agricultural landscape in Cerrado ponds, Brazil
Taxonomic group R2 Estimated
z-value
Standard
error
Degrees of
freedom
t P level
Algae 0.999 0.722 0.005 63 141.435 \0.001
Macrophytes 0.981 0.260 0.009 64 29.427 \0.001
Water beetles 0.971 0.160 0.008 62 19.213 \0.001
Water bugs 0.981 0.165 0.006 66 28.918 \0.001
Odonata 0.993 0.304 0.004 65 86.486 \0.001
Fish 0.955 0.543 0.003 49 187.061 \0.001
Amphibians 0.988 0.166 0.003 64 47.432 \0.001
Birds 0.996 0.352 0.010 70 35.119 \0.001
Fig. 4 Species accumulation curve for algae (a), macrophytes
(b), water beetles (c), water bugs (d), Odonata (e), fish
(f) amphibians (g) and aquatic and semi-aquatic birds (h) in
Cerrado ponds. Fit to linear or nonlinear power functions were
selected based on residual analysis of regressions. Arrows
showed the species accumulation values for water beetle and
fish at the 30 sites sampled, which is close to the number
maximum sampled for the other groups
b
Hydrobiologia (2014) 723:87–101 97
123
ponds, special characteristic of this system (e.g., the
removal of aquatic macrophytes) provides a more
parsimonious explanation. In addition, studies on
ponds have found that environmental descriptors
reflecting vegetation complexity in farmland ponds
primarily predict the diversity of species in these
habitats (Oertli et al., 2002; Vasconcelos et al., 2009;
Honkanen et al., 2011; Silva et al., 2012). It is
important to note that the major aspects that create
heterogeneity among ponds are related to the marginal
vegetation, inside-pond macrophyte cover, and the
management of nearby landowners. As the entire
landscape is shaped by economic activities, especially
cattle raising, the marginal vegetation may be mostly
related to cattle presence.
A species accumulation curve is another way to
express how species of a given group respond to
environmental heterogeneity among ponds (Kolasa
et al., 2012). The use of this analytical tool showed a
large variation among the groups suggesting that they
respond very differently to the same degree of
heterogeneity in this landscape. For instance, algae
showed the highest z-values and steep regional SAC,
which seems to reflect the effect of their larger species
richness in the regional pool. In fact, algae assem-
blages showed a highly unsaturated behavior. While
birds and Odonata yielded intermediate z-values and
good fit to SAC, fishes had a poor fit despite having the
second highest z-values. Other groups, especially
amphibians, water beetles, and water bugs, reached
to the asymptote. All these results show that those
different groups have distinct regional species–area fit,
which may be related to distinct dispersal abilities. We
have shown that they react differently to our environ-
mental predictors and that the relationships with local
variables and the pond area may reflect the trophic
state of the ponds. Higher z-values describe less
dispersive groups in isolated ponds (e.g., algae and
fish), while groups with intermediate z-values species
are not restricted, but likely to respond to landscape
heterogeneity (e.g., Odonata, birds). Moreover, SAC
fits and the differences found between estimated and
observed regional diversity jointly give us a better
understanding about how many species remain to be
found in this poorly known ecosystem.
The Cerrado biome is now a battle field between the
forces that targets to increase grain production and
those devoted to the preservation of the biodiver-
sity and the natural remnants that can maintain its
ecological functionality. Land use changes may
directly affect the presence and distribution of both
streams and ponds in this system. A recent study
focused on terrestrial fauna proposes that, considering
landscape metrics, the pasture environment in the
Cerrado may maintain better conditions for the
biodiversity (Carvalho et al., 2009). Our study in this
pasture-dominated system suggests that the majority
of ponds result from stream damming, which may
represent a serious (but yet not specifically evaluated)
environmental impact. Impoundments, especially if
they have a large volume, can reduce the water quality
downstream (decreased oxygen content, increased
temperature), and reduce longitudinal connectivity
(e.g., for fishes). Nevertheless, for small-sized dams,
the longitudinal discontinuity seems to have only little
impact on the benthic invertebrate community
(Almeida et al., 2009). Furthermore, small dams are
ponds-like systems, enlarging the network of lentic
habitats, and they are colonized by a diverse flora and
fauna as demonstrated here. This was also evidenced
in other places of the world where small dams, if well-
vegetated and with a relatively constant water level,
are attractive to many dragonfly species (Clark &
Samways, 1996; Samways, 2008). Experimental
introduction of vegetation in ponds also shows the
same pattern of increase species richness (De Marco &
Resende, 2004). The real impact of small dams has
therefore still to be investigated in the streams network
from the Cerrado. Otherwise, the continuous march of
the soy and sugarcane agriculture over pasture areas in
the Cerrado (Fearnside, 2001), may pose a threat to
these ponds. We show that they maintain a large
biodiversity, with possible intricate relations which
need to be better understood in this scenario of land-
use changes.
Acknowledgements The work by P. De Marco has been
continuously supported by CNPq productivity fellowships. We
also thank the Swiss Agency for Development and Cooperation
for its financial support.
References
Allouche, O. & R. Kadmon, 2009. A general framework for
neutral models of community dynamics. Ecology letters
12: 1287–1297.
Almeida, E. F., R. B. Oliveira, R. Mugnai, J. L. Nessimian & D.
F. Baptista, 2009. Effects of Small Dams on the Benthic
Community of Streams in an Atlantic Forest Area of
98 Hydrobiologia (2014) 723:87–101
123
Southeastern Brazil. International Review of Hydrobiol-
ogy 94: 179–193.
Amaral, M. C. E., V. Bittrich, A. D. Faria, L. O. Anderson & L.
Y. S. Aona, 2008. Guia de Campo para Plantas Aquaticas e
Palustres do Estado de Sao Paulo. Editora Holos, Sao
Paulo. 451 pp.
Bagella, S., S. Gascon, M. C. Caria, J. Sala, M. A. Mariani & D.
Boix, 2010. Identifying key environmental factors related
to plant and crustacean assemblages in Mediterranean
temporary ponds. Biodiversity and Conservation 19:
1749–1768.
Baguette, M. & H. Van Dyck, 2007. Landscape connectivity and
animal behavior: functional grain as a key determinant for
dispersal. Landscape Ecology 22(8): 1117–1129.
Baselga, A., 2010. Multiplicative partition of true diversity
yields independent alpha and beta components; additive
partition does not. Ecology 91: 1974–1981.
Benetti, C. J., J. A. R. Cueto & G. L. Fiorentin, 2003. Generos de
Hydradephaga (Coleoptera: Dytiscidae, Gyrinidae, Hali-
plidae, Noteridae) citados para o Brasil, com chaves para
identificacao. Biota Neotropica 3(1): 1–20.
Bicudo, C. E. M. & M. Menezes, 2006. Genero de Algas de
Aguas Continentais do Brasilm Chave para identificacao e
descricao. Editora Rima, Sao Carlos. 502 pp.
Bilton, D. T., L. Mcabendroth, A. Bedford & P. M. Ramsay,
2006. How wide to cast the net? Cross-taxon congruence of
species richness, community similarity and indicator taxa
in ponds. Freshwater Biology 51: 578–590.
Bosiacka, B. & P. Pienkowski, 2011. Do biogeographic
parameters matter? Plant species richness and distribution
of macrophytes in relation to area and isolation of ponds in
NW Polish agricultural landscape. Hydrobiologia 689:
79–90.
Brito, D., 2010. Overcoming the Linnean shortfall: data defi-
ciency and biological survey priorities. Basic and Applied
Ecology 11: 709–713.
Buckup, P. A., 1993. The monophyly of the Characidiinae, a
Neotropical group of characiform fishes (Teleostei, Os-
tariophysi). Zoological Journal of the Linnean Society 108:
225–245.
Burel, F. & J. Baudry, 2005. Habitat quality and connectivity in
agricultural landscapes: the role of land use systems at
various scales in time. Ecological Indicators 5(4):
305–313.
Campagne, P., E. Buisson, G. Varouchas, P. Roche, A. Baumel
& T. Tatoni, 2009. Modeling landscape structure con-
straints on species dispersal with a cellular automaton: are
there convergences with empirical data? Ecological
Complexity 6(2): 183–190.
Carvalho, F. M. V., P. De Marco & L. G. Ferreira, 2009. The
Cerrado into-pieces: habitat fragmentation as a function of
landscape use in the savannas of central Brazil. Biological
Conservation 142(7): 1392–1403.
Cereghino, R., J. Biggs, B. Oertli & S. Declerck, 2008a. The
ecology of European ponds: defining the characteristics of
a neglected freshwater habitat. Hydrobiologia 597: 1–6.
Cereghino, R., A. Ruggiero, P. Marty & S. Angelibert, 2008b.
Biodiversity and distribution patterns of freshwater inver-
tebrates in farm ponds of a south-western French agricul-
tural landscape. Hydrobiologia 597(7): 43–51.
Chandy, S., D. J. Gibson & P. A. Robertson, 2006. Additive
partitioning of diversity across hierarchical spatial scales in
a forested landscape. Journal of Applied Ecology 43(4):
792–801.
Chao, A., C.-H. Chiu & T. C. Hsieh, 2012. Proposing a reso-
lution to debates on diversity partitioning. Ecology 93:
2037–2051.
Chu, C.-J., Y.-S. Wang, G.-Z. Du, F. T. Maestre, Y.-J. Luo & G.
Wang, 2007. On the balance between niche and neutral
processes as drivers of community structure along a suc-
cessional gradient: insights from alpine and sub-alpine
meadow communities. Annals of botany 100: 807–812.
Clark, T. E. & M. J. Samways, 1996. Dragonflies (Odonata) as
indicators of biotope quality in the Kruger National Park.
South Africa. Journal of Applied Ecology 33(5): 1001–1012.
Colwell, R. K. & J. A. Coddington, 1994. Estimating terrestrial
biodiversity through extrapolation. Philosophical Trans-
actions of the Royal Society of London 345: 101–118.
Cottenie, K., E. Michels, N. Nuytten, L. De Meester & K.U. Leuven, 2003. Zoopolakton metacommunity structure:
regional vs. local processes in highly interconnected ponds.
Ecology 84: 991–1000.
Crist, T. O., J. A. Veech, J. C. Gering & K. S. Summerville,
2003. Partitioning species diversity across landscapes and
regions: a hierarchical analysis of a, b, and g diversity. The
American Naturalist 162: 734–743.
Crist, T. O., & J. A. Veech, 2006. Additive partitioning of rar-
efaction curves and species-area relationships: unifying
alpha-, beta- and gamma-diversity with sample size and
habitat area. Ecology letters 9: 923–932.
De Marco, P., 1998. The Amazonian Campina dragonfly
assemblage: patterns in microhabitat use and behavior in a
foraging habitat. Odonatologica 27(2): 239–248.
De Marco, P. & D. C. Resende, 2002. Activity patterns and
thermoregulation in a tropical dragonfly assemblage.
Odonatologica 31(2): 129–138.
De Marco, P. & D. C. Resende, 2004. Cues for territory choice in
two tropical dragonflies. Neotropical Entomology 33(4):
397–401.
Diniz-Filho, J. A. F., P. De Marco Jr & B. A. Hawkins, 2010.
Defying the curse of ignorance: perspectives in insect
macroecology and conservation biogeography. Insect
Conservation and Diversity 3: 172–179.
Fearnside, P. M., 2001. Soybean cultivation as a threat to the
environment in Brazil. Environmental Conservation 28:
23–38.
Frost, D. R., 2013. Amphibian Species of the World: an Online
Reference. Version 5.6 (9 January 2013). American
Museum of Natural History, New York, USA. Electronic
Database accessible at http://research.amnh.org/
herpetology/amphibia/index.html.
Graham, M. H., 2003. Confronting multicollinearity in eco-
logical Multiple regression. Ecology 84(11): 2809–2815.
Harabis, F. & A. Dolny, 2011. Human altered ecosystems:
suitable habitats as well as ecological traps for dragonflies
(Odonata): the matter of scale. Journal of Insect Conser-
vation 16: 121–130.
Herwig, B. R. & D. E. Schindler, 1996. Effects of aquatic insect
predators on zooplankton in fishless ponds. Hydrobiologia
324: 141–147.
Hydrobiologia (2014) 723:87–101 99
123

Honkanen, M., A. M. Sorjanen & M. Monkkonen, 2011. De-
constructing responses of dragonfly species richness to
area, nutrients, water plant diversity and forestry. Oeco-
logia 166: 457–467.
Horvath, G., P. Malik, G. Kriska & H. Wildermuth, 2007.
Ecological traps for dragonflies in a cemetery: the attrac-
tion of Sympetrum species (Odonata : Libellulidae) by
horizontally polarizing black gravestones. Freshwater
Biology 52: 1700–1709.
Howeth, J. G. & M. A. Leibold, 2010. Species dispersal rates
alter diversity and ecosystem stability in pond metacom-
munities. Ecology 91: 2727–2741.
Hubbell, S., 2001. The Unified Neutral Theory of Biodiversity
and Biogeography. Princeton University Press, Princeton,
ix–375 pp.
Jost, L., 2010. Independence of alpha and beta diversities.
Ecology 91: 1969–1974.
Juen, L. & P. De Marco, 2011. Odonate biodiversity in terra-
firme forest streamlets in Central Amazonia: on the relative
effects of neutral and niche drivers at small geographical
extents. Insect Conservation and Diversity 4(4): 265–274.
Kadoya, T., S. Suda & I. Washitani, 2004. Dragonfly species
richness on man-made ponds : effects of pond size and
pond age on newly established assemblages. Ecological
Research 19(5): 461–467.
Kolasa, J., L. L. Manne & S. N. Pandit, 2012. Species–area
relationships arise from interaction of habitat heterogeneity
and species pool. Hydrobiologia 685: 135–144.
Legendre, L. & P. Legendre, 1998. Numerical Ecology. Else-
vier, Amsterdam. 864 pp.
Leibold, M. A., M. Holyoak, N. Mouquet, P. Amarasekare, J.
M. Chase, M. F. Hoopes, R. D. Holt, J. B. Shurin, R. Law,
D. Tilman, M. Loreau & A. Gonzalez, 2004. The meta-
community concept: a framework for multi-scale com-
munity ecology. Ecology Letters 7: 601–613.
Lencioni, F. A. A., 2005. Damselflies of Brazil, an illustrated
identification guide: I - The non-Coenagrionidae families.
All Print Editora, Sao Paulo, Brazil. 324 pp.
Lencioni, F. A. A., 2006. Damselflies of Brazil, an illustrated
indentification guide: II - Coenagrionidae families. All
Print Editora, Sao Paulo, Brazil.
McPeek, M. A., 1998. The consequences of changing the top
predator in a food web: A comparative experimental
approach. Ecological Monographs 68: 1–23.
McPeek, M. A.,2004. The growth/predation risk trade-off:So what
is the mechanism? American Naturalist 163: E88–E111.
Menetrey, N., L. Sager & B. Oertli, 2005. Looking for metrics to
assess the trophic state of ponds. Macroinvertebrates and
amphibians. Aquatic Conservation-Marine and Freshwa-
ter. Ecosystems 15(6): 653–664.
Nieser, N. & A. L. Melo, 1997. Os Heteropteros Aquaticos de
Minas Gerais - Guia Introdutorio com Chave de Identifi-
cacao para as Especies de Nepomorpha e Gerromorpha.
Editora UFMG, Belo Horizonte. 180 pp.
Oertli, B., D. Joye, E. Castella & R. Juge, 2002. Does size
matter? The relationship between pond area and biodi-
versity. Biological Conservation 104: 59–70.
Oertli, B., D. Auderset-Joye, E. Castella, R. Juge, A. Lehmann
& J. B. Lachavanne, 2005. PLOCH: a standardized method
for sampling and assessing the biodiversity in ponds.
Aquatic Conservation-Marine and Freshwater Ecosystems
15: 665–679.
Pereira, D. L. V. & A. L. Melo, 2007. Aquatic and semiaquatic
Heteroptera (Insecta) from Pitinga, Amazonas. Brazil.
Acta Amazonica 37(4): 643–648.
Pierce, C. L. & B. D. Hinrichs, 1997. Response of littoral
invertebrates to reduction of fish density: Simultaneous
experiments in ponds with different fish assemblages.
Freshwater Biology 37(2): 397–408.
Pott, V. J. & A. Pott, 2000. Plantas aquaticas do Pantanal.
EMBRAPA, Brasılia. 404 pp.
R Development Core Team, 2013. R: A Language and Envi-
ronment for Statistical Computing. R Foundation for Sta-
tistical Computing, Vienna, Austria, http://www.r-project.
org.
Samways, M. J., 2008. Dragonflies and Damselflies of South
Africa. Pensoft, Sofia.
Segura, M. O., F. Valente-neto & A. A. Fonseca-Gessner, 2011.
Chave de famılias de Coleoptera aquaticos (Insecta) do
Estado de Sao Paulo. Brasil. Biota Neotropica 11(1):
393–412.
Siepielski, A. M., K.-L. Hung, E. E. B. Bein & M. A. McPeek,
2010. Experimental evidence for neutral community
dynamics governing an insect assemblage. Ecology 91:
847–857.
Silva, D. P., P. De Marco & D. C. Resende, 2010. Adult odonate
abundance and community assemblage measures as indi-cators of stream ecological integrity: A case study. Eco-
logical Indicators 10(3): 744–752.
Silva, F. R., C. P. Candeira & D. Cerqueira Rossa-Feres, 2012.
Dependence of anuran diversity on environmental
descriptors in farmland ponds. Biodiversity and Conser-
vation 21: 1411–1424.
Simmering, D., R. Waldhardt & A. Otte, 2006. Quantifying
determinants contributing to plant species richness in
mosaic landscapes: a single- and multi-patch perspective.
Landscape Ecology 21(8): 1233–1251.
Soininen, J., R. Mcdonald & H. Hillebrand, 2007. The distance
decay of similarity in ecological communities. Ecography
30(1): 3–12.
StatSoft, 2005. STATISTICA (data analysis software system),
version 7.1.
Studinski, J. M. & S. A. Grubbs, 2006 Environmental factors
affecting the distribution of aquatic invertebrates in tem-
porary ponds in Mammoth Cave National Park, Kentucky,
USA. Hydrobiologia 575: 211–220.
Utermohl, H., 1958. Zur Vervollkomrnnung ver quantitativen
Phytoplankton-Methodic. Mitteilungen Internationale Ve-
reinigung fur Theoretische und Angewandte Limnologie 9:
1–38.
Van de Meutter, F., L. De Meester & R. Stoks, 2007. Meta-
community structure of pond macro invertebrates: Effects
of dispersal mode and generation time. Ecology 88:
1687–1695.
Van den Hoek, C., D. G. Mann & H. M. Jahns, 1995. Algae: An
introduction to phycology. Cambridge University Press,
United Kingdom. 640 pp.
Vari, R. P. & S. H. Weitzman, 1991. A review of phylogenetic
biogeography of the freshwater fishes of South America. In
Peters, G., & R. Hutterer (eds), Vertebrates in the Tropics.
100 Hydrobiologia (2014) 723:87–101
123
Museum Alexander Koening Zoological Research Institute
and Zoological Museum, Bonn: 381–393.
Vasconcelos, T. S., T. G. Santos, D. C. Rossa-Feres & C.
F. Haddad, 2009. Influence of the environmental hetero-
geneity of breeding ponds on anuran assemblages from
southeastern Brazil. Canadian Journal of Zoology 87:
699–707.
Veech, J. A. & T. O. Crist, 2010a. Toward a unified view of
diversity partitioning. Ecology 91: 1988–1992.
Veech, J. A. & T. O. Crist, 2010b. Diversity partitioning without
statistical independence of alpha and beta. Ecology 91:
1964–1969.
Vollenweider, R. A., 1974. A manual on methods for measuring
primary production in aquatic environments. Blackwell
Scientific Publications, London. 213 pp.
Williams, P., M. Whitfield, J. Biggs, S. Bray, G. Fox, P. Nicolet
& D. Sear, 2004. Comparative biodiversity of rivers,
streams, ditches and ponds in an agricultural landscape in
Southern England. Biological Conservation 115: 329–341.
Wright, D., 1983. Species-energy theory: an extension of spe-
cies-area theory. Oikos 41: 496–506.
Zar, J. H., 1999. Biostatistical analysis. Prentice-Hall, Engle-
wood Cliffs, N.J.: 1–663.
Zimmerman, B. L., 1994. Audio strip transects. In Heyer, W. R.,
M. A. Donnelly, R. W. McDiarmid, L. A. C. Hayek & M.
S. Foster (eds), Measuring and Monitoring Biological
Diversity: Standard Methods for Amphibians. Smithsonian
Institution Press: 92–96.
Hydrobiologia (2014) 723:87–101 101
123