Widespread changes in protein synthesis induced by microRNAs

Widespread Occurrence of Ranavirus in Pond-BreedingAmphibian Populations
Jason T. Hoverman,1,2 Matthew J. Gray,2 Debra L. Miller,2,3,4 and Nathan A. Haislip2,5
1Department of Ecology and Evolutionary Biology, University of Colorado, Boulder, CO 803092Center for Wildlife Health, Department of Forestry, Wildlife, and Fisheries, University of Tennessee, Knoxville3Veterinary Diagnostic and Investigational Laboratory, College of Veterinary Medicine, University of Georgia, Tifton4Department of Biomedical and Diagnostic Sciences, College of Veterinary Medicine, University of Tennessee, Knoxville, TN5Department of Ectotherms, Fort Worth Zoo, Fort Worth, TX
Abstract: Ranaviruses are an emerging threat for many amphibian populations, yet their distribution in
amphibian communities and the association of infection with possible stressors and species is not fully
understood due to historically sparse surveillance. Agricultural practices that reduce the water quality of
amphibian breeding habitats (e.g., cattle access to wetlands) and environmental stressors (e.g., lower tem-
peratures) may contribute to ranavirus emergence. We tested larval amphibians for ranavirus infection across
four seasons in farm ponds (n = 40) located in Tennessee, USA. Cattle at various densities were allowed access
to half of the sampled ponds. Ranavirus infections were detected in nine species and in 33 of the sampled ponds
(83%), illustrating widespread occurrence of the pathogen. Species within the family Ranidae were the most
frequently infected. In 13 of the ponds containing infected individuals, prevalence exceeded 40% during at least
one season. Infections were detected in multiple seasons in 20 of the sampled ponds containing infections,
suggesting that ranaviruses are relatively persistent in these systems. Cattle had negative effects on water quality
(turbidity and ammonia) and there was a positive association between cattle abundance and ranavirus prev-
alence in the summer. Counter to previous field studies in North America, we found a significant positive
association between water temperature and ranavirus prevalence in the fall sampling events. Despite these
findings, the influences of cattle and temperature on ranavirus prevalence were not consistent across seasons.
As such, the mechanisms driving high ranavirus prevalence across the landscape and over time remain unclear.
Given the widespread occurrence of ranaviruses in wild amphibians, we encourage the implementation of
surveillance programs to help identify potential drivers of emergence. Sites with high ranavirus prevalence
should be monitored annually for outbreaks, and the long-term effects on population size determined.
Keywords: conservation, cattle, emerging infectious disease, frog virus 3, Iridoviridae, stressors, water quality,
host range, amphibian larvae, farm ponds
INTRODUCTION
A group of viruses belonging to the genus Ranavirus
(Family Iridoviridae) is responsible for amphibian mass
mortality events in adults and larvae from the Americas,Correspondence to: Jason T. Hoverman, e-mail: [email protected]
EcoHealthDOI: 10.1007/s10393-011-0731-9
Short Communication
� 2011 International Association for Ecology and Health
Author's personal copy

Europe, and Asia (Miller et al. 2011). These widespread die-
offs have sparked a diversity of research programs
addressing the molecular biology, ecology, and evolution of
ranaviruses. To date, however, the majority of data
regarding the distribution of ranaviruses in wild amphibian
populations has come from sites with disease outbreaks.
For example, over 20 species across five families have been
reported in die-off events in North America (Jancovich
et al. 1997; Bollinger et al. 1999; Green et al. 2002; Carey
et al. 2003; Docherty et al. 2003; Petranka et al. 2003; Greer
et al. 2005; Schock and Bollinger 2005; Harp and Petranka
2006; Petranka et al. 2007; Duffus et al. 2008; Gahl and
Calhoun 2008; Torrence et al. 2010). Unfortunately, these
die-off reports offer little insight into the prevalence of
the pathogen within and among amphibian species in the
absence of epizootics (Greer et al. 2009). Given that
ranaviruses are known to infect a diversity of host species
(Schock et al. 2008; Gray et al. 2009; Hoverman et al. 2011),
there is a great need for field surveillance studies to obtain
unbiased estimates of pathogen prevalence within and
among host species, identify potential drivers of emergence,
and assess their threat to wild amphibian populations.
Based on recent experimental studies, infection preva-
lence is likely to differ among amphibian species from wild
populations (Schock et al. 2008; Hoverman et al. 2010, 2012).
For instance, an experimental exposure study involving 19
amphibian species from seven amphibian families demon-
strated that species within the family Ranidae tended to have
relatively high susceptibility to infection by FV3-like ranavi-
ruses compared with the other families (Hoverman et al.
2011). These findings corroborate field patterns of disease
occurrence; species representing the Ranidae are the most
frequently reported taxa in mortality events (e.g., Green et al.
2002).While themechanismsunderlying species differences in
susceptibility to ranavirus infection remain to be tested, these
studies suggest that ranid species may be the most commonly
infected group in amphibian communities (Hoverman et al.
2011).
The host’s environment can play an important role in
disease emergence. Any environmental change or ecological
interaction that compromises immune function has the
potential to affect susceptibility to pathogens (Lloyd 1995).
It has been shown that anthropogenic stressors reduce
immune function in hosts and increase disease prevalence
(Carey et al. 1999; Daszak et al. 1999, 2001; Bruno et al.
2003; Rohr et al. 2008). For amphibians, cattle grazing near
aquatic habitats has been suspected as a significant
anthropogenic stressor resulting in disease emergence
(Johnson and Lunde 2005; Gray et al. 2007). Recent studies
have documented greater ranavirus prevalence in cattle-
access wetlands compared with non-access wetlands for
green frogs (Lithobates clamitans) and tiger salamanders
(Ambystoma tigrinum) but not American bullfrogs
(L. catesbeianus; Gray et al. 2007; Greer and Collins 2008).
Greater prevalence was associated with elevated levels of
nitrogenous compounds and reduced availability of emer-
gent vegetation, which may stress amphibians and lead to
greater contact rates between individuals, respectively
(Gray et al. 2007; Greer and Collins 2008). Together, these
studies suggest that cattle grazing around wetlands can
influence ranavirus disease dynamics and may be an
important factor in disease emergence in amphibians.
In addition to anthropogenic stressors, natural stressors
have been hypothesized as factors in disease emergence. For
larval amphibians, water temperature may be an important
factor affecting ranavirus prevalence. Rojas et al. (2005)
reported an increase in Ambystoma tigrinum virus (ATV)
virulence at temperatures below 18�C. In another study,
American bullfrog tadpoles were eight times more likely to be
infected with ranavirus in winter than in summer, and green
frog tadpoles were five times more likely to be infected in fall
than in summer (Gray et al. 2007). Although the replication
rate of ranaviruses tends to be slower at lower temperature,
these authors and others have hypothesized that increased
pathogen infectivity at lower temperatures could be related to
a correspondingdecrease in amphibianhost immune function
(Maniero andCarey 1997; Carey et al. 1999; Forbes et al. 2004;
Rojas et al. 2005; Raffel et al. 2006). Thus, seasonal changes in
water temperature may be an important driver in ranavirus
emergence and contribute to temporal variation inprevalence.
To enhance our understanding of the distribution of
ranaviruses, we conducted field surveillance for the path-
ogen in populations of pond-breeding amphibian species
located across four counties of eastern Tennessee, USA
(Fig. 1). Given the diversity of pond-breeding amphibian
species in our study area (Redmond and Scott 1996), our
study represents the most extensive surveillance for
ranaviruses in amphibians to date. To assess the possible
roles of anthropogenic and natural stressors on ranavirus
prevalence within amphibian populations, we conducted
our study across four seasons in farm ponds that had and
did not have cattle access. Based on previous findings, our
hypotheses were that prevalence of ranavirus would be (1)
greater in cattle-access ponds and (2) greatest during the
lower temperature seasons (i.e., fall and winter). We also
hypothesized that infection prevalence would differ among
Jason T. Hoverman et al.
Author's personal copy

sympatric amphibian species with ranids representing the
most frequently infected group.
METHODS
Study Sites
Our study was conducted in the Cumberland Plateau (CP)
(Cumberland and Bledsoe Counties) and the Tennessee River
Ridge and Valley (TRRV) (Knox and Loudon Counties)
physiographic regions of Tennessee, USA, during 2008 and
2009 (Fig. 1). We sampled 40 ponds (20 ponds per year)
equally distributed between the two regions. We chose this
sampling scheme because our main interest was in seasonal
dynamics within a pond rather than yearly dynamics and
because we were not able to logistically sample 40 ponds each
year. Ponds were identified in each region using U.S. Fish
and Wildlife Service National Wetlands Inventory maps
(http://www.fws.gov/wetlands/). For each county, we ran-
domly selected one cardinal quadrant and constructed a list of
potential ponds for the study. Landowners were contacted to
gain access privilege and inquire about pond history. Suitable
ponds for the study were identified based on the following
criteria: (1) the pond did not dry completely during the
summer 2007 drought (National_Climatic_Data_Center
2008), (2) the pond was >5 years old and had emergent
vegetation, (3) there were no streams flowing into the pond
that could contain agricultural point source pollution, (4) the
pond was not adjacent to major roads, and (5) there was no
artificial oxygenation of the pond. We also classified each
pond as cattle access or non-access. For cattle-access ponds,
the number of cattle that had access to ponds was recorded
based on information provided by the landowner. From this
list of ponds, we randomly selected 10 cattle-access and non-
access ponds for each region and year (Table 4 in Appendix).
Pond Sampling
Amphibians (larvae for all species except red-spotted newts)
and fish were sampled in January (winter), April (spring), July
(summer), and October (fall) of 2008 and 2009 using seine
and dip net protocols. We divided each pond into four car-
dinal quadrants. We randomly selected one quadrant and its
opposing quadrant to conduct the seine net sampling. For
each seine haul, we positioned the seine 2 m from the shore
and pulled the seine for 10 m parallel to the shore (Schmutzer
et al. 2008). Dip net sampling occurred for 15 min in each
quadrant. Within each quadrant, we sampled all available
amphibian habitats, which included submersed vegetation,
detritus, and mud extending from the shoreline to 1 m in
water depth. At the conclusion of dip net sampling, we
recorded the total number of sweeps, which we used to esti-
mate catch-per-unit-effort (CPUE) in each pond. For both
the seine and dip net samples, we counted and identified all
captured amphibian larvae and fish to species. We identified
fish because they are an amphibian predator and could affect
densities (Wellborn et al. 1996). Although fish may be a res-
ervoir for ranaviruses (Picco et al. 2010), they were not
sampled for ranavirus infections. There were two cases when
wewere unable to identify the amphibian larvae to species.We
encountered larvae of the plethodontid genus Desmognathus
(n = 2) and small hatchlings of the genus Lithobates (most
likely L. catesbeianus or L. clamitans; n = 11). Thus, we
recorded Desmognathus sp. and Lithobates hatchling, respec-
tively. For each amphibian species collected, we randomly
selected up to five individuals for ranavirus testing. Each
selected individual was rinsed with sterile water and placed
into a glass jar containing 500 ml of sterile water for transport
to the University of Tennessee. In fall 2008, we did not sample
one pond (R31) because it had dried. Thus, we excluded this
pond from the analysis for that sample date.
Fig. 1. Map showing the location of the 40 sampled farm ponds for
ranavirus surveillance in eastern Tennessee. The ponds were divided
equally among four counties in the Cumberland Plateau (Cumber-
land and Bledsoe counties) and Tennessee River Ridge and Valley
(Knox and Loudon counties) physiographic regions. Inset shows the
United States with the state of Tennessee highlighted.
Ranavirus Surveillance in Amphibians
Author's personal copy
We measured water quality at each pond on each
sample date. The water quality variables included dissolved
oxygen (mg l-1), pH, temperature (�C), turbidity (FTU),
and ammonia (ppm), which are known to be impacted by
cattle and potentially cause stress in larval amphibians
(Schmutzer et al. 2008). We used handheld YSI meters
(Yellow Springs Instruments, Yellow Springs, OH, USA) to
measure dissolved oxygen, pH, and temperature in the
field. All measurements were taken 2 m from the south end
of the shoreline in each pond. Given that we sampled
multiple ponds on the same day, we could not account for
diurnal changes in dissolved oxygen and temperature.
Based on our previous work, we anticipated that seasonal
and cattle-access effects would account for the majority of
variation in these two variables (Gray et al. 2007; Sch-
mutzer et al. 2008). We collected a 500-ml water sample
from each pond to measure the remaining water quality
variables using a LaMotte Smart2 colorimeter (LaMotte
Company, Chestertown, MD, USA).
Necropsy and Ranavirus Testing
All collected individuals were transported to the University
of Tennessee Joe Johnson Animal Research and Teaching
Unit where they were euthanized by immersion in benzo-
caine hydrochloride. We removed a section of the liver and
kidney for virus testing and froze the tissues at -80�C. Theliver and kidney samples for each individual were pooled into
a single microcentrifuge tube. We collected the liver and
kidney because these organs are known sites of virus infection
(Tweedell and Granoff 1968; Gantress et al. 2003; Converse
and Green 2005; Miller et al. 2007). Moreover, based on
experimental challenges in the laboratory for 19 amphibian
species, we documented that ranavirus infection can occur in
themajority of the species that we collected from the field and
the liver and kidney are reliable organs for testing ranavirus
infection (Hoverman et al. 2011). New gloves were used
when handling each individual, and all equipment was dis-
infected with 0.75%Nolvasan� (2% chlorhexidine diacetate;
Fort Dodge Animal Health, Fort Dodge, Iowa, USA; Bryan
et al. 2009) after use with each individual.
For ranavirus testing, we extracted DNA from the pooled
liver and kidney sample for each individual using a DNeasy
Blood and Tissue Kit (Qiagen Inc., Valencia, CA, USA). The
extracted DNA was concentrated to 50 ll using a Savant
DNA120 SpeedVac Concentrater (Thermo Fisher Scientific,
Pittsburgh, PA). Conventional PCR targeting an approxi-
mately 450-bp region of themajor capsid protein (MCP) gene
was then used, following the protocol and primer sets
reported by Mao et al. (1996, 1997; primers MCP4 and
MCP5). The PCR products were resolved via electrophoresis
on a 1.0% agarose gel. Two negative controls (water and
gDNA extracted from a ranavirus-negative tadpole) and two
positive controls (cultured ranavirus and gDNA extracted
from an experimentally infected and confirmed ranavirus-
positive tadpole) served as controls for the PCR runs. The
PCR reactions were repeated to confirm results. We further
verified the PCR products as ranavirus DNA by using real-
time quantitative PCR (TaqMan qPCR) following Picco et al.
(2007), and as described by Hoverman et al. (2010). A sample
was declared positive only if both conventional PCR and
qPCR results were positive. In laboratory experiments, we had
considerable success with detecting ranavirus DNA using
TaqMan qPCR with high correlation (R2 = 0.978) between
positive infection and mortality from ranaviral disease across
19 amphibian species (Hoverman et al. 2011). However, we
acknowledge that low-grade infectionsmay not be detected by
PCR (Green et al. 2009), thus our infection prevalence
estimates may be lower than true levels.
Statistical Analyses
The data set consisted of the abiotic and biotic characteristics
of each pond and the infection prevalence of collected
individuals within each pond across seasons. The biotic
response variables were CPUE for fish and amphibians and
amphibian species richness. Our infection data set consisted
of the percent of infected individuals in the sample of
collected amphibians. We pooled all species for analyses to
reduce variation in the response variables due to low species-
specific captures per pond, and because we were interested in
community-level responses to ranavirus. We used repeated-
measures analysis-of-variance (rm-ANOVA) to test the
effects of sample year, cattle access, and physiographic region
on the response variables among seasons. Univariate within-
subjects tests were conducted using theHuynh–Feldt degrees
of freedom correction factor when the assumption of sphe-
ricity was violated. We conducted mean comparisons using
Fisher’s LSD test if a response variable was significant.
Although community-level responses to ranaviruses
were our major interest, we used multiple regression anal-
ysis to examine whether the presence of particular species
that were infected at sites explained significant variation in
ranavirus prevalence. For this analysis, we used only sites
(n = 61) and species (n = 9) for which ranaviruses were
detected. We also used stepwise multiple regression analysis
Jason T. Hoverman et al.
Author's personal copy

to examine the relative importance of pond characteristics
in explaining ranavirus prevalence. Explanatory variables
included pH, dissolved oxygen, temperature, ammonia,
turbidity, cattle abundance, CPUE for fish and amphibians,
and amphibian species richness. Given that each pond was
repeatedly sampled (i.e., seasons were not independent) and
ranavirus was not detected across all seasons for a particular
pond, we conducted a regression analysis separately for each
season. Data were combined across years for each regression
because ponds were different replicates between years.
RESULTS
Ranavirus Infection
We detected ranavirus infections in 83% (n = 33) of the
ponds (Table 5 in Appendix). Prevalence varied from 4 to
90% across seasons within ponds with ranavirus infections.
For ponds with infected individuals, 39% (n = 13) had
�40% ranavirus prevalence and 6% (n = 2) had �85%
ranavirus prevalence during at least one sampling event.
Ranavirus infections were found during multiple seasons in
61% (n = 20) of the ponds containing infected individuals.
In addition, ranavirus was detected in consecutive seasons
in 42% (n = 14) of the ponds. Of the 13 species collected
during our sampling (Table 1), infections were detected in
nine species (69%, Fig. 2a). The percent of infected indi-
viduals varied from 3 to 75% for the nine species in which
infections were detected. Of these nine species, the eastern
tiger salamander had the greatest percent infection (Fisher’s
exact test P � 0.007), although only eight individuals were
tested. Infections were detected in all four ranid species
encountered during our sampling and infection prevalence
averaged 16%. Green frogs had the greatest number of
infected individuals followed by American bullfrogs and
pickerel frogs. At the pond-level, green frogs were the
Table 1. List of amphibian species detected during field sur-
veillance for ranavirus within farm ponds in eastern Tennessee,
USA
Family Scientific name Common name
Ranidae Lithobates
sphenocephalus
Southern leopard frog
Ranidae Lithobates palustris Pickerel frog
Ranidae Lithobates
clamitans
Green frog
Ranidae Lithobates
catesbeianus
American bullfrog
Hylidae Hyla chrysoscelis Cope’s gray tree frog
Hylidae Pseudacris
feriarum
Southeastern chorus
frog
Hylidae Acris crepitans Northern cricket frog
Bufonidae Anaxryus
americanus
American toad
Microhylidae Gastrophryne
carolinensis
Eastern narrow-
mouthed toad
Plethodontidae Desmognathus sp. Lungless salamander
Ambystomatidae Ambystoma
tigrinum
Eastern tiger salamander
Ambystomatidae Ambystoma
talpoideum
Mole salamander
Salamandridae Notophthalmus
viridescens
Red-spotted newt
Fig. 2. Percentage of ranavirus-infected individuals (a; sample size
indicated above bars) and the percentage of ponds in which infected
individuals were detected (b) for species collected during the
surveillance of ponds in eastern Tennessee. Species designations are
ANAM, Anaxyrus americanus; GACA, Gastrophryne carolinensis;
ACCR, Acris crepitans; HYCH, Hyla chrysoscelis; PSFE, Pseudacris
feriarum; LIPA, Litobates palustris; LISP, L. sphenocephala; LICA,
L. catesbeianus; LICL, L. clamitans; Hatchling, Lithobates hatchling;
AMTA, Ambystoma talpoideum; AMTI, A. tigrinum; NOVI, Notoph-
thalmus viridescens; Desmog, Desmognathus sp.
Ranavirus Surveillance in Amphibians
Author's personal copy
mostly commonly infected species followed by American
bullfrogs and pickerel frogs (Fig. 2b). The percentage of
species infected at a given pond within a season averaged
63%. There were no significant effects of season, cattle
access, or region on infection prevalence (Table 2; Fig. 3a).
However, infection prevalence was positively associated
with the presence of infected green frogs and bullfrogs
(F2,58 = 8.6, P = 0.001, adjusted R2 = 0.201, Beta for bull-
frogs = 0.364, Beta for green frogs = 0.359).
Observed Die-Off Event
In October 2008, we encountered mass mortality (>20
individuals) of American bullfrog and green frog tadpoles
during our sampling of one non-access pond located in
Knox County (Pond R68; Table 4 in Appendix). Dead
tadpoles were observed at the surface and while dipnetting.
Both species had classic gross signs of ranaviral disease
including edema (swelling) and erythema (skin reddening
from capillary congestion) of the body and hindlimbs. Of
the sampled larvae, 100 and 80% of American bullfrogs and
green frogs, respectively, tested positive for ranavirus
infections. We revisited the pond 10 days later and
observed additional dead tadpoles (100% of 20 individuals
were ranavirus positive) suggesting that the mortality event
may have lasted several weeks.
Biotic and Abiotic Characteristics
Amphibian species richness was 76% greater in non-access
ponds compared with cattle-access ponds (Table 2). In
addition, species richness was greatest in the spring and
summer, intermediate in the fall, and lowest in the winter
(P � 0.013; Fig. 3b). Species richness did not differ
between the spring and summer (P = 1.0). The CPUE for
amphibians was seven times greater in the TRRV compared
with the CP (Table 2). The CPUE for fish was not affected
by season, cattle access, or region (Table 2).
For ammonia and turbidity, there was a significant effect
of cattle access (Table 3). Ammonia and turbidity were 2.4
times and 3.4 times greater, respectively, in cattle-access
ponds compared with non-access ponds. There were sig-
nificant effects of season on dissolved oxygen and pH
(Table 3; Fig. 4a, b). Dissolved oxygen was greatest in the
winter, intermediate in the spring and fall, and lowest in the
summer. From winter through fall, pond pH tended to
increase. There were significant effects of season and the
season 9 region interaction for pond temperature (Table 3;
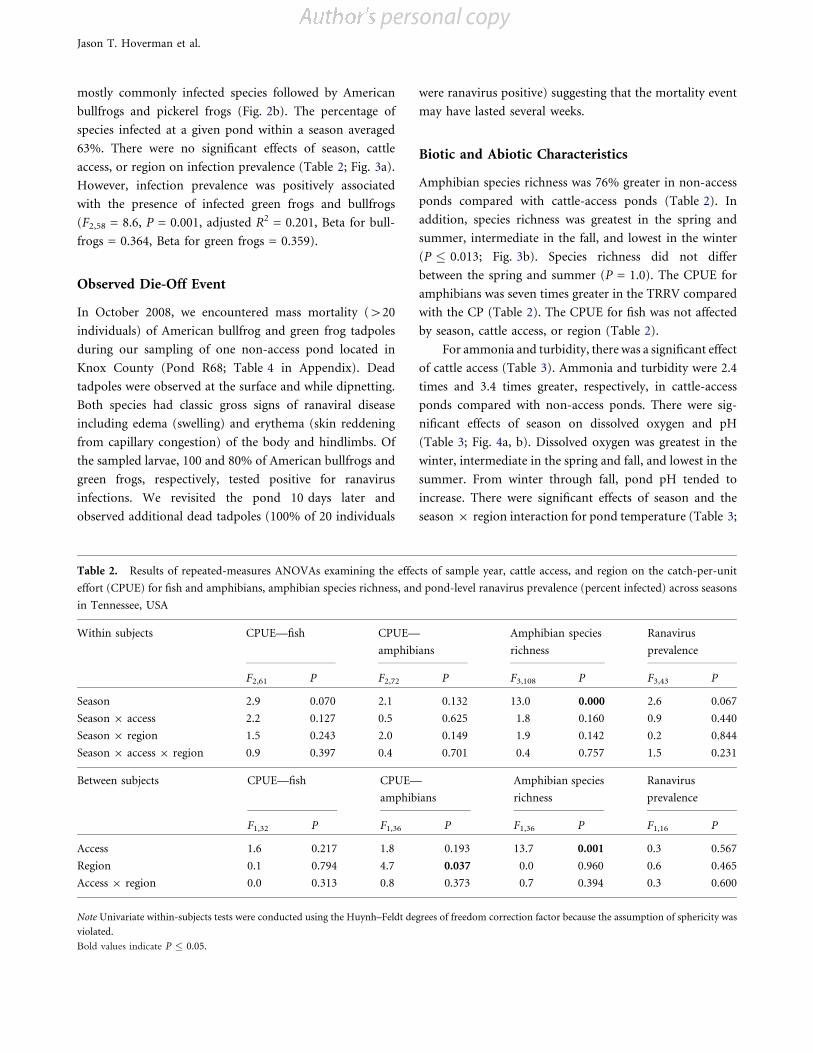
Table 2. Results of repeated-measures ANOVAs examining the effects of sample year, cattle access, and region on the catch-per-unit
effort (CPUE) for fish and amphibians, amphibian species richness, and pond-level ranavirus prevalence (percent infected) across seasons
in Tennessee, USA
Within subjects CPUE—fish CPUE—
amphibians
Amphibian species
richness
Ranavirus
prevalence
F2,61 P F2,72 P F3,108 P F3,43 P
Season 2.9 0.070 2.1 0.132 13.0 0.000 2.6 0.067
Season 9 access 2.2 0.127 0.5 0.625 1.8 0.160 0.9 0.440
Season 9 region 1.5 0.243 2.0 0.149 1.9 0.142 0.2 0.844
Season 9 access 9 region 0.9 0.397 0.4 0.701 0.4 0.757 1.5 0.231
Between subjects CPUE—fish CPUE—
amphibians
Amphibian species
richness
Ranavirus
prevalence
F1,32 P F1,36 P F1,36 P F1,16 P
Access 1.6 0.217 1.8 0.193 13.7 0.001 0.3 0.567
Region 0.1 0.794 4.7 0.037 0.0 0.960 0.6 0.465
Access 9 region 0.0 0.313 0.8 0.373 0.7 0.394 0.3 0.600
Note Univariate within-subjects tests were conducted using the Huynh–Feldt degrees of freedom correction factor because the assumption of sphericity was
violated.
Bold values indicate P � 0.05.
Jason T. Hoverman et al.
personal copy

Fig. 4c). Within both regions, pond temperature was lowest
in the winter, intermediate in the spring and fall, and highest
in the summer (P < 0.001). The season 9 region interac-
tion was driven by higher pond temperature in the TRRV
compared with the CP in the summer and fall (P � 0.016)
but not in the winter and spring (P � 0.051).
Multiple Regression Analysis
In the summer, the most significant predictor of ranavirus
prevalence was the model composed solely of cattle abun-
dance (F1,11 = 5.1, P = 0.048, adjusted R2 = 0.271, Beta =
0.580); greater prevalence was associated with greater cattle
abundance. In the fall, the most significant predictor of
ranavirus prevalence was the model composed solely of
temperature (F1,21 = 5.3, P = 0.032, adjusted R2 = 0.169,
Beta = 0.457); greater prevalence was associated with higher
pond temperatures. There was not a significant predictor of
ranavirus prevalence in the winter or spring.
DISCUSSION
We found that ranavirus infections were widespread in
ponds located in eastern Tennessee; ranavirus infections
were detected in nine species and in 33 of the sampled
ponds (83%). In 13 of ponds containing infected individ-
uals (39%), prevalence exceeded 40%. These findings sug-
gest that ranaviruses may be common in the breeding
habitats of pond-breeding amphibians and that a large
proportion of the amphibian community can be infected at
a site. Also, these results suggest that reliance on mortality
events may greatly underestimate the geographic extent of
ranaviruses in amphibian communities.
We detected ranavirus infections in multiple seasons
within a large fraction (n = 20; 61%) of the ponds, which
suggests that ranaviruses are relatively persistent in perma-
nent aquatic environments. Previous research has shown that
pond drying may inactivate ranaviruses, which would elim-
inate them from temporary habitats each year (Brunner et al.
2007). However, the permanent hydroperiod of our ponds
coupled with the frequent occurrence of hosts such as
American bullfrog and green frog tadpoles and adult eastern
newts throughout the year may provide the opportunity for
long-term persistence of ranaviruses. Indeed, infected
American bullfrogs, green frogs, and eastern newts were
found in 35, 65, and 13% of the sampled ponds, respectively.
Moreover, there was a significant association between the
presence of infected American bullfrogs and green frogs and
infection prevalence in the ponds. Thus, these species may
be important reservoirs that facilitate the transmission of
ranaviruses throughout the year (Gray et al. 2009).
Despite the high prevalence and persistence of rana-
virus in the sampled ponds, there was only one die-off
event observed during our sampling. There is the possibility
that mortality events occurred in the three months between
each of the sampling events. Given that mortality rates
closely track infection rates (Brunner et al. 2007; Cunn-
ingham et al. 2007; Hoverman et al. 2011), additional
mortality events likely occurred during our study but were
undetected. For example, our finding of two ponds with
prevalence levels �85% suggests that die-offs may have
been imminent but missed due to a single visit in that
season. Our results underscore the need for intensive
monitoring over time to assess the impacts of ranaviruses
on amphibian populations.
Of the 13 amphibian species encountered during
sampling, nine of the species collected tested positive for
ranavirus infection. These species represent five amphibian
Fig. 3. Prevalence of ranavirus in collected amphibians (a) and
amphibian species richness (b) in cattle-access (closed circles) and
non-access (open circles) ponds across seasons for ponds sampled in
eastern Tennessee. Data are least-squares means ± 1 SE.
Ranavirus Surveillance in Amphibians
Author's personal copy

families (Ranidae, Bufonidae, Hylidae, Ambystomatidae,
Salamandridae) that are common inhabitants of ponds and
wetlands across North America. While our findings dem-
onstrate that ranaviruses have a broad host range, species
within the family Ranidae, which comprised>70% of our
sampled individuals, were the main contributors to pat-
terns of infection. We detected infections in all four ranid
species that were sampled at our sites and they were the
most commonly infected group. This suggests that ranids
are highly susceptible to ranavirus infections, which is
supported by previous laboratory research (Hoverman
et al. 2011). Additionally, we detected infections in 63% of
the species, on average, at a site suggesting that not all
members of the amphibian community may be simulta-
neously infected. To date, few studies have examined the
role of transmission of ranaviruses within amphibian
communities. For example, Duffus et al. (2008) proposed a
conceptual model of interspecific transmission based on the
observation of FV3-like infections in multiple co-occurring
amphibian species within ponds. A fundamental assump-
tion of this model is that species could be combined into a
single group of susceptible individuals. Although this
assumption adds simplicity to the model, variation in
species susceptibility to infection and disease progression
will likely require a more complex model that includes
species-specific parameters to understand ranavirus trans-
mission. Future experimental studies that quantify within-
and between-species transmission will help inform model
development and advance our understanding of ranavirus
dynamics within amphibian communities.
We documented substantial differences in the water
quality and the amphibian community between cattle-access
and non-access ponds. Cattle-access ponds had higher tur-
bidity and ammonia concentrations than non-access ponds.
Importantly, the mean ammonia concentration exceeded
levels (>0.6 mg l-1) known to have lethal and sublethal
effects on larvae of some amphibian species (Jofre and
Karasov 1999). We captured 76% fewer species in cattle-
access ponds compared with non-access ponds. Importantly,
there were no differences in the abundance of predatory fish
between the two pond types suggesting that fish were not
driving the difference in amphibian richness and abundance.
Schmutzer et al. (2008) reported lower water quality, species
richness, and abundance of amphibian larvae in cattle-access
ponds comparedwith non-access ponds. Burton et al. (2009)
also reported that cattle reduce shoreline vegetation, which
functions as breeding habitat for many amphibian species.
Less shoreline vegetation in cattle-access ponds also may
cause tadpoles to congregate in the remaining cover and
increase ranavirus transmission rates (Greer and Collins
2008). Together, these data suggest that allowing cattle access
in wetlands can negatively impact amphibian populations.
Table 3. Results of repeated-measures ANOVAs examining the effects of sample year, cattle access, and region on the abiotic char-
acteristics (ammonia, turbidity, dissolved oxygen, pH and pond temperature) of the sampled ponds across seasons in Tennessee, USA
Within subjects Ammonia Turbidity DO pH Temperature
F2,83 P F3,89 P F3,105 P F3,100 P F3,105 P
Season 0.3 0.757 1.5 0.229 30.8 0.001 7.7 0.001 606.8 0.001
Season 9 access 1.0 0.382 0.9 0.451 1.6 0.190 2.2 0.095 1.1 0.340
Season 9 region 1.6 0.210 0.7 0.556 0.6 0.642 1.4 0.262 8.2 0.001
Season 9 access 9 region 1.1 0.362 0.6 0.583 0.1 0.963 0.8 0.505 0.7 0.549
Between subjects Ammonia Turbidity DO pH Temperature
F1,35 P F1,35 P F1,35 P F1,35 P F1,35 P
Access 5.3 0.027 11.0 0.002 2.5 0.120 3.6 0.065 1.1 0.309
Region 2.4 0.128 0.2 0.650 0.9 0.362 1.7 0.204 1.9 0.175
Access 9 region 2.1 0.161 0.0 0.923 1.9 0.173 0.1 0.745 0.0 0.951
31.5 0.001
Note Within-subjects tests were conducted using the Huynh–Feldt degrees of freedom correction factor if the assumption of sphericity was violated for a
variable.
Bold values indicate P � 0.05.
Jason T. Hoverman et al.
Author's personal copy

Previous studies have documented increased preva-
lence of ranaviruses in some species inhabiting cattle-access
ponds (Gray et al. 2007; Greer and Collins 2008). We found
a significant positive association between cattle abundance
and ranavirus prevalence in the summer sampling events;
however, there was not an association in the remaining
seasons. This suggests that the negative impact of cattle may
be greatest during the summer when temperature is highest
and dissolved oxygen is lowest across ponds on the land-
scape. As such, cattle access into wetlands may initiate
changes in the abiotic characteristics of ponds that intensify
and peak during the summer. The synergistic effect of
multiple stressors on the landscape may play a significant
role in ranavirus emergence.
There was limited support for other abiotic or biotic
factors contributing to ranavirus prevalence. We only found
a significant association between water temperature and
ranavirus prevalence in the fall sampling events. However,
the relationship was positive such that higher temperatures
were associated with greater ranavirus prevalence. This result
was counter to our expectation that lower temperatures
would have immunosuppressive effects on amphibians and
increase ranavirus prevalence as found in previous studies
(Gray et al. 2007). However, ranavirus replication rates are
greater at higher temperatures (Rojas et al. 2005), whichmay
increase shedding rates into the aquatic environment and
facilitate transmission rates. Given that this trend was not
observed across all seasons, additional research is needed to
assess water temperature as a possible mechanism of rana-
virus emergence. Although there was no evidence that
ranavirus prevalence differed across seasons, there was a
general trend for low prevalence in the summer. Thus,
summer may not be the best season for detecting ranavirus.
We encourage future surveillance studies to sample
amphibian populations during the entire course of the larval
period to more accurately estimate ranavirus prevalence.
The recent emergence of infectious diseases across the
globe has sparked considerable interest in understanding the
spatial and temporal dynamics of diseases (Daszak et al. 2000;
Cleaveland et al. 2001; Dobson and Foufopoulos 2001).
While our study demonstrates that ranaviruses are common
in amphibian communities, we have a limited understanding
of the factors that trigger sudden population-level die-offs
and the consequences of such die-offs on amphibian popu-
lation dynamics (Petranka et al. 2007; Teacher et al. 2010).
There is a great need for long-term monitoring studies that
track local amphibian populations over time to identify
potential factors resulting in disease emergence and quantify
the impacts on amphibian recruitment and population size.
ACKNOWLEDGMENTS
The authors thank the Tennessee Wildlife Resources Agency
(TWRA) and the University of Tennessee Institute of
Agriculture for funding this study. The University of Georgia
Veterinary Diagnostic and Investigational Laboratory in
Tifton, Georgia, performed all the molecular procedures
associated with ranavirus testing. The authors especially thank
Fig. 4. Dissolved oxygen (a), pH (b), and temperature (c) across
seasons in ponds sampled in eastern Tennessee. Data for dissolved
oxygen and pH are averaged across cattle-access categories and
regions. Seasons sharing lowercase letters are not significantly
different based on Fisher’s LSD (P � 0.05). Data for temperature
are averaged across cattle-access categories but divided by physio-
graphic regions (CP Cumberland Plateau and TRRV Tennessee River
Ridge and Valley). Data are least-squares means + 1 SE.
Ranavirus Surveillance in Amphibians
Author's personal copy

L. Whittington and N. Hilzinger for their help. Animal
euthanasia procedures followed an approved University of
Tennessee IACUCprotocol (#1755).Collectionof animalswas
approved by the TWRA (Scientific Collection Permit #1990).
APPENDIX
See Tables 4 and 5.
Table 4. Site information for the 40 ponds sampled in 2008 and 2009 in the CP and TRRV regions, Tennessee, USA
Pond Year Coordinates Region County Cattle access Mean cattle
R23 2008 36�04002.400 83�52029.200 TRRV Knox A 2
R19 2008 36�01049.600 83�45055.100 TRRV Knox A 67.5
R68 2008 36�03005.200 83�41035.800 TRRV Knox NA
R16 2008 36�02059.200 83�45017.400 TRRV Knox NA
R9 2008 36�07023.000 83�43007.900 TRRV Knox NA
R56 2008 35�41019.700 84�29033.700 TRRV Loudon A 23
R51 2008 35�42009.500 83�27058.300 TRRV Loudon A 85
R37 2008 35�39009.200 84�11018.500 TRRV Loudon NA
R44 2008 35�37042.800 84�11028.600 TRRV Loudon NA
R31 2008 35�44055.300 84�14006.400 TRRV Loudon NA
P16 2008 35�57045.900 85�05032.800 CP Cumberland A 44
P44 2008 35�54026.300 85�0209.300 CP Cumberland A 5
P14 2008 35�58024.600 85�09008.700 CP Cumberland NA
P26 2008 35�57004.600 85�06040.500 CP Cumberland NA
P37 2008 35�56053.500 85�05054.900 CP Cumberland NA
P82 2008 35�40024.000 85�17032.300 CP Bledsoe A 65
P58 2008 35�42046.000 85�10058.700 CP Bledsoe A 6
P75 2008 35�40008.800 85�15058.100 CP Bledsoe NA
P89 2008 35�40038.400 85�12007.200 CP Bledsoe NA
P50 2008 35�44013.700 85�10048.800 CP Bledsoe NA
K21 2009 36�01046.600 83�48042.900 TRRV Knox A 6
K10 2009 36�04019.400 83�47032.400 TRRV Knox A 30
K9 2009 36�03059.700 83�4800.800 TRRV Knox A 10
K2 2009 36�01030.300 83�47030.600 TRRV Knox NA
K6 2009 36�0503.900 83�46024.800 TRRV Knox NA
N10 2009 35�38038.600 84�10025.400 TRRV Loudon A 10
N9 2009 35�42034.900 84�11030.300 TRRV Loudon A 35
N3 2009 35�38048.700 84�10025.700 TRRV Loudon NA
N8 2009 35�41043.900 84�10053.500 TRRV Loudon NA
N20 2009 35�40001.900 84�26021.400 TRRV Loudon A 10
C26 2009 35�56003.600 85�06036.400 CP Cumberland A 40
C23 2009 35�58045.000 85�03016.400 CP Cumberland A 375
C25 2009 35�58016.600 85�03046.400 CP Cumberland A 45
C12 2009 35�54039.600 85�03012.600 CP Cumberland NA
C10 2009 35�54034.800 85�04048.300 CP Cumberland NA
B19 2009 35�40049.300 85�07012.600 CP Bledsoe A 8
B4 2009 35�37042.700 85�16024.900 CP Bledsoe A 22.5
B10 2009 35�38003.300 85�13015.500 CP Bledsoe A 37.5
B21 2009 35�37035.800 85�16057.200 CP Bledsoe NA
B12 2009 35�39014.500 85�12046.900 CP Bledsoe NA
A cattle access, NA non-access ponds.
Jason T. Hoverman et al.
Author's personal copy

Table
5.Ranavirusinfectionresultsforpondsthat
weresampledin
easternTennessee,USA
Species
Pond
ID
L.
palustris
L.
sphenocephalus
L.
catesbeianus
L.
clam
itans
Lithobates
hatchling
H.
chrysoscelis
P.
feriarum
A.
crepitans
A.
americanus
G.
carolinensis
Desmognathus
N.
viridescens
A.
talpoidum
A.
tigrinum
B10
2(6)
1(13)
B12
0(6)
5(11)
B19
0(20)
0(5)
0(5)
0(4)
B21
1(3)
0(4)
0(5)
1(5)
C10
0(5)
0(15)
1(14)
C12
2(5)
9(19)
6(18)
C23
2(13)
C26
0(3)
0(7)
K10
2(5)
3(5)
0(5)
0(5)
K2
0(10)
4(10)
0(5)
0(5)
0(5)
0(14)
K21
5(10)
0(1)
4(15)
0(3)
K6
0(1)
1(4)
K9
1(5)
0(6)
1(4)
6(11)
0(5)
0(5)
1(5)
0(5)
0(8)
N10
1(1)
0(1)
1(7)
N20
0(5)
3(6)
0(1)
N3
0(1)
2(6)
0(5)
0(5)
1(5)
0(2)
0(6)
N8
0(5)
1(11)
3(11)
0(5)
4(21)
N9
0(5)
0(5)
0(4)
1(5)
0(4)
0(5)
0(2)
P14
0(5)
3(26)
9(20)
0(8)
0(2)
P16
0(6)
0(3)
0(1)
P26
1(6)
1(1)
0(7)
4(15)
0(5)
1(1)
0(2)
P37
0(6)
1(21)
2(19)
0(4)
0(2)
P44
2(9)
2(9)
P50
0(20)
1(20)
0(15)
P58
3(10)
0(18)
2(18)
0(4)
3(5)
0(2)
P75
0(13)
5(17)
0(5)
0(2)
P82
0(23)
3(14)
P89
0(8)
2(10)
0(1)
0(1)
0(6)
0(8)
R16
0(5)
5(5)
4(11)
0(5)
R23
2(7)
1(24)
R31
1(5)
0(5)
0(4)
0(5)
0(10)
1(2)
Ranavirus Surveillance in Amphibians
personal copy

REFERENCES
Bollinger TK, Mao JH, Schock D, Brigham RM, Chinchar VG(1999) Pathology, isolation, and preliminary molecular char-acterization of a novel iridovirus from tiger salamanders inSaskatchewan. Journal of Wildlife Diseases 35:413–429
Brunner JL, Schock DM, Collins JP (2007) Transmissiondynamics of the amphibian ranavirus Ambystoma tigrinumvirus. Diseases of Aquatic Organisms 77:87–95
Bruno JF, Petes LE, Harvell CD, Hettinger A (2003) Nutrientenrichment can increase the severity of coral diseases. EcologyLetters 6:1056–1061
Bryan L, Baldwin CA, Gray MJ, Miller DL (2009) Efficacy of selectdisinfectants at inactivating Ranavirus. Diseases of AquaticOrganisms 84:89–94
Burton EC, Gray MJ, Schmutzer AC, Miller DL (2009) Differentialresponses of postmetamorphic amphibians to cattle grazing inwetlands. Journal of Wildlife Management 73:269–277
Carey C, Bradford DE, Brunner JL, Collins JP, et al. (2003) Bioticfactors in amphibian declines. In: Amphibian Declines: AnIntegrated Analysis of Multiple Stressor Effects, Linder G, KrestSK, Sparling DW (editors), Pensacola: Society of EnvironmentalToxicology and Chemistry, pp 153–208
Carey C, Cohen N, Rollins-Smith L (1999) Amphibian declines:an immunological perspective. Developmental and ComparativeImmunology 23:459–472
Cleaveland S, Laurenson MK, Taylor LH (2001) Diseases of hu-mans and their domestic mammals: pathogen characteristics,host range and the risk of emergence. Philosophical Transactionsof the Royal Society of London Series B 356:991–999
Converse KA, Green DE (2005) Diseases of tadpoles. In: WildlifeDiseases: Landscape Epidemiology, Spatial Distribution and Uti-lization of Remote Sensing Technology, Majumdar SK, HuffmanJE, Brenner FJ, Panah AI (editors), Easton, PA: The Pennsyl-vania Academy of Science, pp 72–88
Cunningham AA, Hyatt AD, Russell P, Bennett PM (2007)Experimental transmission of a ranavirus disease of commontoads (Bufo bufo) to common frogs (Rana temporaria). Epide-miology and Infection 135:1213–1216
Daszak P, Berger L, Cunningham AA, Hyatt AD, Green DE,Speare R (1999) Emerging infectious diseases and amphibianpopulation declines. Emerging Infectious Diseases 5:735–748
Daszak P, Cunningham AA, Hyatt AD (2000) Wildlife ecology—emerging infectious diseases of wildlife: threats to biodiversityand human health. Science 287:443–449
Daszak P, Cunningham AA, Hyatt AD (2001) Anthropogenicenvironmental change and the emergence of infectious diseasesin wildlife. Acta Tropica 78:103–116
Dobson A, Foufopoulos J (2001) Emerging infectious pathogensof wildlife. Philosophical Transactions of the Royal Society ofLondon Series B 356:1001–1012
Docherty DE, Meteyer CU, Wang J, Mao JH, Case ST, ChincharVG (2003) Diagnostic and molecular evaluation of three iri-dovirus-associated salamander mortality events. Journal ofWildlife Diseases 39:556–566
Duffus ALJ, Pauli BD, Wozney K, Brunetti CR, Berrill M (2008)Frog virus 3-like infections in aquatic amphibian communities.Journal of Wildlife Diseases 44:109–120
Forbes MR, McRuer DL, Rutherford PL (2004) Prevalence ofAeromonas hydrophila in relation to timing and duration ofbreeding in three species of ranid frogs. Ecoscience 11:282–285T
able
5.continued
Species
Pond
ID
L.
palustris
L.
sphenocephalus
L.
catesbeianus
L.
clam
itans
Lithobates
hatchling
H.
chrysoscelis
P.
feriarum
A.
crepitans
A.
americanus
G.
carolinensis
Desmognathus
N.
viridescens
A.
talpoidum
A.
tigrinum
R37
1(10)
0(17)
2(11)
0(2)
R44
0(4)
0(5)
0(2)
0(6)
R51
0(5)
1(5)
0(1)
0(6)
0(5)
5(6)
R56
0(5)
3(11)
1(21)
0(5)
R68
0(7)
6(24)
4(19)
2(26)
R9
2(13)
4(15)
7(19)
0(3)
0(5)
Onlypondscontaininginfectionareshown.Foreach
species,thetotalnumber
ofinfected
individuals(andtotalnumber
ofsampledindividuals)acrossseasonsisshown.See
Table
4fordetailedpondinform
ation.
Jason T. Hoverman et al.
Author's personal copy

Gahl MK, Calhoun AJK (2008) Landscape setting and risk of Rana-virusmortality events. Biological Conservation 141:2679–2689
Gantress J, Maniero GD, Cohen N, Robert J (2003) Developmentand characterization of a model system to study amphibianimmune responses to iridoviruses. Virology 311:254–262
Gray MJ, Miller DL, Hoverman JT (2009) Ecology and pathology ofamphibian ranaviruses. Diseases of Aquatic Organisms 87:243–266
Gray MJ, Miller DL, Schmutzer AC, Baldwin CA (2007) Frog virus3 prevalence in tadpole populations inhabiting cattle-access andnon-access wetlands in Tennessee, USA. Diseases of AquaticOrganisms 77:97–103
Green DE, Converse KA, Schrader AK (2002) Epizootiology ofsixty-four amphibian morbidity and mortality events in theUSA, 1996–2001. Annals of the New York Academy of Sciences969:323–339
Green DE, Gray MJ, Miller DL (2009) Disease monitoring andbiosecurity. In: Amphibian Ecology and Conservation: A Hand-book of Techniques, Dodd CK (editor), Oxford, UK: OxfordUniversity Press, pp 481–505
Greer AL, Berrill M, Wilson PJ (2005) Five amphibian mortalityevents associated with ranavirus infection in south centralOntario, Canada. Diseases of Aquatic Organisms 67:9–14
Greer AL, Brunner JL, Collins JP (2009) Spatial and temporalpatterns of Ambystoma tigrinum virus (ATV) prevalence in tigersalamanders Ambystoma tigrinum nebulosum. Diseases ofAquatic Organisms 85:1–6
GreerAL,Collins JP (2008)Habitat fragmentation as a result of bioticand abiotic factors controls pathogen transmission throughout ahost population. Journal of Animal Ecology 77:364–369
Harp EM, Petranka JW (2006) Ranavirus in wood frogs (Ranasylvatica): potential sources of transmission within and betweenponds. Journal of Wildlife Diseases 42:307–318
Hoverman JT, Gray MJ, Haislip NA, Miller DL (2011). Phylogeny,life history, and ecology contribute to differences in amphibiansusceptibility to ranaviruses. Ecohealth. doi:10.1007/s10393-011-0717-7.
Hoverman JT, Gray MJ, Miller DL (2010) Anuran susceptibilitiesto ranaviruses: role of species identity, exposure route, and anovel virus isolate. Diseases of Aquatic Organisms 89:97–107
Jancovich JK, Davidson EW, Morado JF, Jacobs BL, Collins JP(1997) Isolation of a lethal virus from the endangered tigersalamander Ambystoma tigrinum stebbinsi. Diseases of AquaticOrganisms 31:161–167
Jofre MB, Karasov WH (1999) Direct effect of ammonia on threespecies of North American anuran amphibians. EnvironmentalToxicology and Chemistry 18:1806–1812
Johnson PJ, Lunde KB (2005) Parasite infection and limb mal-formations: a growing problem in amphibian conservation. In:Amphibian Declines: The Conservation Status of United StatesSpecies, Lannoo M (editor), Berkeley, California: University ofCalifornia Press, pp 124–138
Lloyd S (1995) Environmental influences on host immunity. In:Ecology of Infectious Disease in Natural Populations, Grenfell B,Dobson A (editors), New York, NY: University of Cambridge,pp 327–361
Maniero GD, Carey C (1997) Changes in selected aspects of immunefunction in the leopard frog,Rana pipiens, associatedwith exposureto cold. Journal of Comparative Physiology B 167:256–263
Mao J, Tham TN, Gentry GA, Aubertin A, Chinchar VG (1996)Cloning, sequence analysis, and expression of the major capsidprotein of the iridovirus frog virus 3. Virology 216:431–436
Mao JH, Hedrick RP, Chinchar VG (1997) Molecular character-ization, sequence analysis, and taxonomic position of newlyisolated fish iridoviruses. Virology 229:212–220
Miller DL, Gray MJ, Storfer A (2011) Ecopathology of ranavirusesinfecting amphibians. Viruses 3:2351–2373
Miller DL, Rajeev S, Gray MJ, Baldwin CA (2007) Frog virus 3infection, cultured American bullfrogs. Emerging InfectiousDiseases 13:342–343
National_Climatic_Data_Center (2008) State of the climate an-nual review: U.S. drought 2007 http://www.ncdc.noaa.gov/oa/climate/research/2007/ann/drought-summary.html. Accessed 14Dec 2010.
Petranka JW, Harp EM, Holbrook CT, Hamel JA (2007) Long-term persistence of amphibian populations in a restored wet-land complex. Biological Conservation 138:371–380
Petranka JW, Murray SS, Kennedy CA (2003) Responses ofamphibians to restoration of a southern Appalachian wetland:perturbations confound post-restoration assessment. Wetlands23:278–290
Picco A, Karam A, Collins J (2010) Pathogen host switching incommercial trade with management recommendations. Eco-health 7:252–256
Picco AM, Brunner JL, Collins JP (2007) Susceptibility of theendangered California tiger salamander, Ambystoma californiense,to Ranavirus infection. Journal of Wildlife Diseases 43:286–290
Raffel TR, Rohr JR, Kiesecker JM, Hudson PJ (2006) Negativeeffects of changing temperature on amphibian immunity underfield conditions. Functional Ecology 20:819–828
Redmond WH, Scott AF (1996) Atlas of Amphibians in Tennessee,Clarksville, TN: Austin Peay State University
Rohr JR, Schotthoefer AM, Raffel TR, Carrick HJ, Halstead N,Hoverman JT, et al. (2008) Agrochemicals increase trematodeinfections in a declining amphibian species. Nature 455:U1235–U1250
Rojas S, Richards K, Jancovich JK, Davidson EW (2005) Influenceof temperature on Ranavirus infection in larval salamandersAmbystoma tigrinum. Diseases of Aquatic Organisms 63:95–100
Schmutzer AC, Gray MJ, Burton EC, Miller DL (2008) Impacts ofcattle on amphibian larvae and the aquatic environment.Freshwater Biology 53:2613–2625
Schock DM, Bollinger TK (2005) An apparent decline of NorthernLeopard Frogs (Rana pipiens) on the Rafferty Dam MitigationLands near Estevan, Saskatchewan. Blue Jay 63:144–154
Schock DM, Bollinger TK, Chinchar VG, Jancovich JK, Collins JP(2008) Experimental evidence that amphibian ranaviruses aremulti-host pathogens. Copeia 1:133–143
Teacher AGF, Cunningham AA, Garner TWJ (2010) Assessing thelong-term impact of Ranavirus infection in wild common frogpopulations. Animal Conservation 13:514–522
Torrence SM, Green DE, Benson CJ, Ip HS, Smith LM, McMurryST (2010) A new ranavirus isolated from Pseudacris clarkiitadpoles in Playa wetlands in the southern high plains, Texas.Journal of Aquatic Animal Health 22:65–72
Tweedell K, Granoff A (1968) Viruses and renal carcinoma ofRana pipiens. V. Effect of Frog Virus 3 on developing frog em-bryos and larvae. Journal of the National Cancer Institute40:407–410
Wellborn GA, Skelly DK, Werner EE (1996) Mechanisms creatingcommunity structure across a freshwater habitat gradient. An-nual Review of Ecology and Systematics 27:337–363
Ranavirus Surveillance in Amphibians
Author's personal copy
Copyright © 2022 FDOKUMEN